riparian vegetation - home enviro data sa
TRANSCRIPT

Riparian vegetationbenefits to landholders and ecosystems
in the Goolwa to Wellington Local Action Planning region
Eastern Mount Lofty Ranges, South Australia
GOOLWA TO W E W NGTONLOCAL ACTION PLANNING 9OAi01NC.
, r r,1. 1
.yT K !,Government
of South Australia Native Vegetation Council
Sally A Roberts

Funding for this project was provided by Native Vegetation Council Research Grants.Copyright 2008 Government of South Australia.
Author and editor: Sally Roberts (BSc Honours, Cert. Editing Techniques).Graphic design and printing by South Coast Print & Graphics.Key illustration (page 2) by Robin Green, Ecocreative® <www.ecocreative.com.au >.
Citation: Roberts, S 2008, Riparian vegetation: benefits to landholders and ecosystems in the Goolwa toWellington Local Action Planning region, Native Vegetation Council on behalf of the South AustralianGovernment, Adelaide.
Author contact details:Sally Roberts Research, Writing & [email protected]: 0428246123PO Box 1042GOOLWA SA 5214.
Cover photographs: (clockwise from top) permanent pools along the Finniss River (January 2008), ScentedSundew (Drosera whittakeri), Finniss River (September 2008) and cattle in fenced paddock (at Ashbourne).
Disclaimer: Readers should be aware that information contained in this publication is of a general nature andmay not relate to all situations, and that expert advice should be obtained. Therefore, neither the author northe Government of South Australia assume liability resulting from any person's reliance upon the contents ofthis document.
ContentsAcknowledgements ii
1. Introduction 1
1.1. Definition of a riparian zone 1
1.2. Aims of this booklet 1
1.3. Description of the GWLAP region 1
1.4. An invitation to the reader 1
2. Value of the riparian zone 3
2.1. Benefits of riparian vegetation to the landholder 3
2.2. Ecological value of riparian vegetation 3
3. Assessing the health of a riparian zone 7
4. Rehabilitating a riparian area 8
4.1. Protecting riparian zones 8
4.2. Alternative livestock watering 8
4.3. Benefits to landholders of excluding stock from waterways 9
4.4. Weed management 9
4.5. Revegetation 10
5. Case study Cherry Macklin's watercourse rehabilitation 11
6. Useful contacts for assistance 13
7. Glossary of environmental terms 13
8. References 14
Appendix Sample riparian health assessment 15
Figures
Figure 1 Simplified aquatic food web relating to terrestrial input of CPOM into a stream 6
Acknowledgements
I would like to thank Jennie Dale, former program manager for the Goolwa to Wellington Local Action Planning(GWLAP) Association, for her interest in the production of this publication. I would also like to thank TonyRandall (Program Manager) and Belinda Gunn (Coorong and Lower Lakes Project Officer) of the GWLAPAssociation for their support throughout the project.
In addition, I wish to thank the following people for their assistance:
Cherry Macklin, landholder at Ashbourne, for sharing her experience of rehabilitating a riparian zone
Peter Michelmore, Operations Manager, South Australian Murray Darling Basin Natural ResourcesManagement (SAMDBNRM) Board, for information about weed management
Mardi van der Wielen, SAMDBNRM Board, for information about riparian health assessment for ephemeralstreams
Nigel Mallen, general environmentalist, for information about rehabilitation of riparian areas
Peter Copley (Senior Ecologist: Threatened Species), Doug Bickerton (Ecologist: Threatened Flora) and ClaireTreilibs (Ecologist: River and Floodplain Fauna), Department for Environment and Heritage, for informationabout threatened species. _ ,
).11'4.1100..
I would also like to thank the following people for putting aside time to contribute to the peer review of thisbooklet:
Tony Randall, Program Manager, GWLAP Association
Ben Simon, Eastern Mount Lofty Ranges and Plains Project Officer, GWLAP Association
Dr Andrea Wilson, Lecturer in Ecology, Charles Sturt University
Catherine Miles, Senior Environmental Consultant, Rural Solutions SA
Dr Nick Souter, Senior Ecologist, Department of Water, Land and Biodiversity Conservation
Dwayne Godfrey, Authorised Officer, SA Murray Darling Basin Natural Resources Management Board
Ron Ballantyne, Analyst Programmer, Department for Environment and Heritage
Mrs Elizabeth Roberts, member of the local community
Sue Tsigaros, Director, Iris Group and member of general community.
11

1. Introduction
1.1. Definition of a riparian zoneThe riparian zone is any land that adjoins, directlyinfluences or is influenced by a body of fresh water.
Within this definition, a body of water includesstreams (and creeks and rivers) and standingwaterbodies, such as lakes and swamps. Forstreams, the riparian zone includes any relatedfloodplains.
Riparian areas provide a link between aquatic (water)and terrestrial (land) ecosystems. Healthy riparianvegetation plays a critical role in maintaining thehealth of waterbodies and in supporting terrestrialand aquatic biota (flora and fauna).
The focus of this booklet is on riparian zones forstreams. However,. the broad ecological principlesdiscussed will relate to riparian zones for other typesof waterbodies in the Goolwa to Wellington LocalAction Planning (GWLAP) region. For clarification ofissues that relate to specific site characteristics,expert advice should be sought, and Section 6provides a list of useful contacts.
1.2. Aims of this bookletThe purpose of this booklet is to provide informationthat will be useful to those interested in learningabout the fundamental values of riparian vegetation.It provides an explanation of the numerous benefitsto landholders and ecosystems (biological systems ofour natural environment) of conserving riparianareas, and includes discussion of the relatedecological principles.
This booklet is targeted at the many landholders inthe GWLAP region who have decided to rehabilitatetheir watercourses, and those who may want toconsider the benefits to farming systems and theenvironment of such rehabilitation.
Landholders can make a valuable contribution to therestoration of their waterways and, ultimately, totheir catchment area by rehabilitating the riparianareas on their property. To assist in achieving thisimportant goal, strategies for rehabilitation arediscussed, and a case study òf a restoration projectbeing undertaken by a farmer local to the region ispresented. A list of contacts is also provided forinformation about financial and technical assistance.
Part of the planning process for rehabilitationactivities is to gain an understanding of the health ofthe riparian area. Therefore, a rapid healthassessment method for riparian zones has beenincluded. Field data sheets are provided in the backinside - pocket of the booklet and a sampleassessment is presented in the Appendix.
To aid in the understanding of some environmentalterms, a glossary can be found in the endmatter.
1.3. Description of the GWLAP regionThe Goolwa to Wellington Local Action Planningregion is the southern-most section of theMurray - Darling Basin in South Australia, and lieswithin the Eastern Mount Lofty Ranges region. Itscatchments cover the area from Meadows,Kanmantoo and Harrogate in the northern section toPort Elliot and Hindmarsh Island in the south. Themost prominent landscape features of the area arethe hills, plains, lakes and coastline.
The GWLAP area comprises the main catchments ofthe Bremer River, Angas River, Finniss River,Tookayerta Creek and Currency Creek, all of whichdrain into Lake Alexandrina between Goolwa andWellington. The majority of streams in the region areephemeral, and most of the major watercoursesfeature permanent pools during the dry part of theyear.
The species and structure of pre European riparianvegetation for the region would have typically been aeucalypt overstorey (River Red Gums); a BlackwoodWattle sub - canopy; tea tree, melaleuca and bursariashrub layer; and sedges and rushes, as well as nativegrasses, in the groundcover layer. However, variousother vegetation community types also occurred.
Most of the watercourses in the GWLAP region havebecome degraded as a result of human activities,such as vegetation clearance, alterations of flow rateand frequency and some agricultural practices. Ingeneral, they have been affected by a loss of nativeplants on their river banks, erosion of stream banksand streambeds, weed invasion and theconsequential degradation of related ecosystems.
1.4. An invitation to the readerTo gauge the ways in which the reader considers thisbooklet to be useful, as well as an invitation forsuggestions from the reader for any furtherinformation they would find useful about riparianhabitats, a questionnaire is provided in the backinside - pocket of this booklet.
The completed questionnaire should be returned tothe author by 31 March 2009 (please see postaldetails on copyright page). For the respondent'sconvenience, a reply -paid, self - addressed envelope isincluded.
1


2. Value of the riparian zone
2.1. Benefits of riparian vegetation to thelandholder
Protection of livestock, and crops and pasture
The understorey of a healthy riparian area canprovide livestock in nearby paddocks with shelterfrom extreme weather conditions, such as stormsand intense heat, thus reducing heat and cold stress.
Healthy riparian vegetation can also serve as awindbreak for crops and pasture downwind.Semi - permeable windbreaks are recommended,which native vegetation is able to provide. Theprotected area provided by the windbreak usually liesbetween three times the height of the windbreak (H)and 20 times H. Windbreaks also help to reducelevels of evaporation of soil moisture and of surfacewater in nearby waterbodies a significant benefitduring hot, dry periods.
Consequently, healthy native riparian vegetation canprovide conditions conducive to improved stockhealth and an increase in crop and pasture yieldsand, therefore, an increase in productivity.
Pollination of crops and natural pest controlHealthy riparian vegetation not only provides awindbreak for crops, but also provides habitat forcrop pollinators, including birds, bats, smallpossums and, most importantly, pollinating insects.
It also helps to control insect pests that can damagecrops, by providing habitat for insect - eating birdsand insect parasites. Therefore, it provides naturalpest control that helps to achieve on -farm economicand environmental benefits.
Maintenance of good soil structure and stability
Vegetated banks help maintainsoil structure, allow increasedwater infiltration into the soiland reduce bank erosion andtopsoil stripping.
The largely undecomposed plantdebris on the soil surface, called litter, helps protectthe mineral soil against rain and wind erosion, andextreme temperatures. This organic matter also has asignificant water- holding capacity, which means thatwater is then available to plants. Plant litter is thesource of food for most soil organisms that breakdown organic matter, allowing elements to bereturned to the simple forms that are available toplants. These organisms also help to improve soilstructure, which is important for air, water and rootpenetration and also helps prevent erosion.
Roots of riparian vegetation bind the soil and, fineroots in particular, help to prevent stream banksfrom erosion caused by scouring from flowing water.This is particularly important close to the bottom(toe) of the bank and on the outside bends ofmeanders.
Another contribution riparian vegetation makes tobank stability is that it uses water that it has helpedto infiltrate into the soil. This further improves bankstability by preventing soil saturation.
By preventing erosion, valuable soil is not lost fromthe property, and good water quality is maintained inthe stream.
Aesthetic and recreational benefitsVegetation that occursalongside waterways providesan environment whererecreational pursuits, such aspicnicking and bird - watching,can be enjoyed. Being a bufferto noise from, for example,road traffic and nearby properties, riparianvegetation allows appreciation of its intrinsic beautyto be experienced in a relaxing setting.
Increase in property value
Well- managed riparian areas may increase themarket value of a property because of the benefitsalready discussed. The habitats they contain and thebenefits they supply to ecosystems also provide thepotential for environmental education.
2.2. Ecological value of riparian vegetationValuable habitat for plants and animalsRiparian vegetation provides habitat for many plantand animal species, including endangered ones. Inthe Goolwa to Wellington Local Action Planning(GWLAP) region, a healthy riparian zone may providehabitat for threatened plant species such as PaleEverlasting (Helichrysum rutidolepis), Leafy Twig -rush(Cladium procerum) and Thatch Saw -sedge (Gahniaradula). Examples of threatened animals that may befound include the Golden Bell Frog (Litoria raniformis)and Broad shelled tortoise (Chelodina expansa).
It also serves as a protective corridor for themovement of wildlife from one patch of remnantvegetation to another, which is particularly importantin areas that are largely cleared. The width,composition and continuity of riparian vegetationimpact on the provision of suitable habitat for nativewildlife.
Buffering excessive nutrients, sediment andpesticidesRiparian vegetation, particularly that which providesa dense cover at ground level (in other words,grasses, sedges and small shrubs), slows the passageof surface water runoff. As a result, a significantquantity of nutrients, sediments and pollutants aretrapped before they enter the waterway, in a processcalled `biofiltration'.
3

NutrientsNutrients are essential for all life, including primarynutrients such as nitrogen and phosphorus.However, they have become increasingly available (anexample of agricultural inputs being from fertilisersand animal manure) and more mobile due to soilstructure decline and erosion as a result of theclearing of native vegetation for urban andagricultural land use.
Elevated nutrient levels in waterbodies(eutrophication) can lead to excessive algal growth(algal blooms). This is made worse where there is alack of riparian vegetation, because the loss of shadeover the stream creates warm conditions in thesurface water, which favour algal blooms.
Algae clouds the water, thereby reducing lightpenetration, which can threaten the survival ofsubmerged aquatic plants. This causes problems fornative fish species that depend on submerged plantsfor food and shelter, or eat the invertebrates thatinhabit them.
Blooms of cyanobacteria (often referred to asblue -green `algae' and is a photosynthetic bacteria)cause further problems due to the toxins that somespecies produce, which can have detrimental effectson human and animal health. Some of these toxinshave the potential to bioaccumulate up the foodchain. Problems caused by such blooms arecompounded when the cyanobacteria die anddecompose, along with the plants they have killed,because this process uses up dissolved oxygen andcan result in fish kills.
Heavy metals can be found in fertilisers. Forexample, cadmium is often contained insuperphosphate, and comes from the originalphosphate rock. This is of concern if it enterswaterways, as it can bioaccumulate in some aquaticfood chains.
SedimentSedimentation (process of sand, clay, silt, pebblesand organic material. being deposited andaccumulating) is part of the natural process oferosion. Coarse sediment (cobbles and gravels) onriver beds is vital for providing suitable habitat formacroinvertebrates and spawning fish. Nutrients thatare necessary for healthy aquatic ecosystems arecarried on fine sediments (silts and clays), and candissolve to become incorporated into the aquatic foodweb.
However, where there is accelerated erosion, excessquantities of sediment cause many problems forstream ecosystems. In this context, coarse sedimentscan infili pools (which are important for fish aspermanent refuges during dry conditions). Excessivefine sediment can clog river bed interstices, therebydegrading benthic habitat. This will negatively impactupon benthic invertebrates, which are a major foodsource for native fish species. It can also smotherspawning beds, making them unsuitable, or smotherthe eggs themselves.
When carried in suspension, fine sediment can alsointerfere with the ability of some animals to breatheor, in the case of visual feeders, to fmd food.
4
Because suspended sediments increase turbidity,which reduces light penetration, this reduces theability of submerged aquatic plants tophotosynthesise. Algal species, as well ascyanobacteria (or blue -green `algae "), on the otherhand, can move into and spread within the upper,narrow zone of light. Some species of cyanobacteriaare toxic to a variety of organisms including humansand livestock.
Sediments also provide a mechanism for thetransport of toxicants such as pesticides, and heavymetals and nutrients, and a substrate upon whichthey can react.
Pesticides (herbicides, insecticides andfungicides)Pesticides can enterwaterways by aerial drift,surface runoff (either insolution or bound to sedimentparticles) or having leachedinto groundwater thatsupplies baseflow to streams.
Some pesticides can be lethal to non - targetorganisms such as fish. Herbicides can destroynon - target plants, which provide food and habitat foraquatic animals. In addition, pesticides can reducefertility and life expectancy, and increase theincidence of abnormalities, in some aquaticorganisms. Pesticide residues can also bioaccumulateup the food chain.
Although currently not well- understood, certaincombinations of pesticides have been shown to havesynergistic effects. Therefore, it is important toconsider that the potential impacts from individualpesticides could greatly underestimate the overalltoxic effects of a mixture, on aquatic ecosystems.
Riparian vegetation acts as a physical barrier topesticides from aerial drift and runoff, reducing theamount of pesticides entering waterways.
Value of large woody debris
Large woody debris (LWD)consists of fallen limbs orwhole trees that provide habitatfor many terrestrial animals,including reptiles, birds andsmall mammals. Where it fallsinto a stream, to become partly
exposed or submerged, it provides important habitatfor aquatic animals.
Many native invertebrates and fish are found ingreater numbers around LWD, as it provides shelterfrom fast - flowing water and direct sunlight, and agood source of food. LWD also provides fish withshelter from predators and surfaces on which theycan lay their eggs. In addition, it provides birds withsites for preening and feeding vantage points.
LWD is a source of dissolved and solid organiccarbon that becomes incorporated into the aquaticfood web (see Figure 1). The fungal, algal andbacterial biofilms, and invertebrates that slowlydecompose the wood also become food for other
a

aquatic organisms, including other invertebrates andfish.
Misconceptions about LWD include its influence onstream flow and erosion. These only become issueswhere LWD significantly blocks the watercourse, inwhich case, the LWD can be repositioned ifnecessary. In terms of erosion, LWD actually helps tostabilise the streambed.
Regulating in- stream temperaturesShade provided by healthyriparian plants regulates theamount of light and heat thatreaches the water in streams.
Increased sunlight encouragesthe growth of weeds and algae,
which can alter the in- stream ecosystem to one thatdoes not support native fish and other nativeanimals. Excessive growth of in- stream weeds andalgae can result in bed sediment being trapped,which can choke the stream channel, reducing itsability to carry flood waters. In addition, becausethese plants are composed of soft material, theydecompose rapidly, and can deplete the water ofoxygen.
Some animal species are particularly sensitive tohigh temperatures, for example, mayfly nymphs(from the Order: Ephemeroptera) invertebrates thatare an important dietary component for fish.
As temperatures increase, the ability of water toabsorb oxygen decreases. To compound the problem,warmer waters result in an increase in rates ofecosystem respiration, which contributes to areduction in dissolved oxygen. Furthermore, asphotosynthesis does not occur at night, increasedrates of respiration by plants and animals can resultin dissolved oxygen levels approaching anoxia. Thiscreates conditions that are unfavourable to forms ofaquatic life sensitive to oxygen levels, including somespecies of macroinvertebrates and fish.
Healthy riparian vegetation reduces the effects ofextreme seasonal temperature variations and,generally, keeps the water cooler in summer andwarmer in winter, compared with temperatures instreams that lack riparian vegetation. Several fishspecies use seasonal changes in water temperatureas a cue to lay eggs. If those temperatures do notreflect natural changes, then the necessary cues forspawning may not be present, which will have adetrimental effect on their reproduction. Riparianvegetation also helps maintain cool watertemperatures in pools that act as refuges for fishduring dry periods.
Input into aquatic food websAquatic and terrestrial biodiversity holds intrinsicvalue, and forms part of the ecosystems that we areultimately reliant upon for our own survival. Foodwebs form the part of ecosystems that transfersenergy and nutrients from one type of organism toanother, through a number of interrelated foodchains in a biological community.
The provision of organic matter to aquatic food websof streams comes from two sources: from within the
stream (autochthonous) and from terrestrial input(allochthonous). The relative proportions of these twosources of nutrients can vary between streamreaches.
Riparian vegetation supplies allochthonous organicmatter input into streams in the form of leaf litterand other organic debris (for example, bark,branches, fruit, flowers and seeds), and terrestrialinvertebrates (for example, insects) that fall into thewater from the riparian zone. Therefore, the riparianzone makes an important contribution of nutrients toriverine food webs.
It is not possible in this booklet to show the highlevel of complexity of most aquatic food webs.Therefore, a simple example is provided in Figure 1that shows how coarse particulate organic mattercan be incorporated from the riparian zone into anaquatic food web. Of course, a complete food webwould be much more complicated, as it would consistof many other interrelated food chains.
The example provided by Figure 1 shows that inputs,such as leaf litter, fallen logs or roots, fall into thestream as coarse particulate organic matter (CPOM).Nutrients are leached from the debris as dissolvedorganic matter (DOM) and are quickly taken up bywater plants. Fungi, bacteria and micro -algae breakdown the CPOM to form DOM, the major componentof which is dissolved organic carbon (DOC). DOC isutilised mainly by bacteria, and single- celled animals(Protozoa) consume the bacteria that provide a richsource of nutrients.
In turn, the Protozoa become food for small,multicellular animals, that themselves become foodfor larger predators. Bacteria provides the means bywhich DOC can become available to higherconsumers, for example, fish that cannot assimilateDOC themselves. This link between DOC and higherconsumers is referred to as the `Microbial Loop' (the`loop' includes the return of DOC to the food web via,for example, animal excretion, for assimilation againby bacteria a recycling process).
Another series ofinteractions in the aquaticfood web begins . with`shredders' (invertebrates,such as stone -fly larvae)that break down theCPOM into fine particulate organic matter (FPOM).This becomes available to `collectors' (invertebrates,such as riffle beetles) that filter FPOM that is beingtransported downstream or gather it from thesediments. Shredders gain nutrition from the oldplant material as well as from attached periphyton.Collectors also use microbes attached to plantmaterial for nutrition. Shredders and collectors, aswell as grazers that feed directly on periphyton,become food for predators, such as fish.
The transfer of nutrients and energy between plantsand animals within the stream involves a continuouscycling of nutrients that moves slowly downstream,which is referred to as `nutrient spiralling'.Floodplain rivers also gain nutrients from the lateralexchange of nutrients between the floodplain and thechannel.
5

l
predatorse.g. fish
J
iperiphyton
(micro -algae fungi, bacteria)break down CPOM material
1
grazerse.g. snails
predatorse.g. fish,
waterbirds
CPOM(coarse particulate organic matter)
e.g. leaf litter, fallen logs, roots
lDOC
(dissolved organiccarbon)
tbacteria
(mainly benthic)
i 1
i
1
leaching(by water)
J
Protozoa(single celled animals)e.g. ciliates, flagellates
1
l1
DOM(dissolved organic matter)e.g. chemicals that go intosolution when leaves and
branches fall into thewater
inutrients
(e.g. phosphorusand nitrogen)
small invertebrate Metazoans(multi cellular animals)e.g. micro - crustaceans
l
shredders( macroinvertebrátes)break down CPOMe.g. water slaters,
stone -fly larvae
( i
\
FPOM(fine particulate organic
matter)e.g. shredded particles
from CPOM
(collectors
(macroinvertebrates)e.g. net spinning caddis,
shrimps, riffle beetles
predatorse.g. fish
photosynthesisersmacro -algae (e.g. Charophyta spp.)
macrophytes (e.g. Water Milfoil, WaterRibbons)
1
herbivorese.g. waterbirds, fish
Figure 1 Simplified aquatic food web relating to terrestrial, input of CPOM into a stream
Figure 1 provides a simplified example of how coarse particulate organic matter can become incorporated intothe aquatic food web and broken down to become available as food for aquatic organisms. This diagram showsrelated food chains through to the trophic level (functional feeding group) that includes fish and waterbirds. Itis not possible, here, to include other parts of the food web, such as terrestrial insects that have fallen in orlanded on the water that provide food for fish or predators at the higher tropic levels. Suffice to say that healthyriparian vegetation supports healthy stream food webs.
6

3. Assessing the health of a riparian zoneA healthy riparian area has a diverse habitatstructure, a dominance of native plants andobvious signs of their regeneration, abundant leaflitter and fallen limbs, and stable stream banks.This provides the aquatic ecosystem with goodwater quality, filtered light and runoff interception.It also provides diverse and abundant terrestrialand in- stream resources, including food, refuges,and spawning and nursery habitat.
Rapid assessment of riparian healthRapid appraisal of riparian health assesses theecological condition of riparian habitats, usingmeasured characteristics (or indicators) to assistland managers in making decisions aboutmanagement and rehabilitation of those areas. Itallows for a quick turnaround of results, and givesthe assessment scientific validity without the needfor specialist skills (although it may be necessary toobtain expert advice for the identification of nativeplant species (see Section 6)).
It is suitable for repeat assessments and, therefore,can be used in monitoring the effectiveness ofrehabilitation projects. Repeat assessment wouldneed to be done at the same locations to compareresults over time. Rapid assessment field datasheets are provided in the back inside pocket ofthis booklet, and a sample assessment can befound in the Appendix.
1. Very poor condition: shows pugging on rightand lack of regeneration of native vegetation
3. Structurally good, but has lots of weeds: willows,blackberry, thistles, broom and herbaceous weeds
The rapid assessment method presented is suitablefor single - channel watercourses that are no widerthan 25 m, and has been adapted fromJansen et al. (2005) and Costelloe and Sheldon(2008). It presents criteria and scoring for use inthe field, with the opportunity to record informationfor four cross- sections (transects) . of the riparianzone. A final score can then be obtained thatrepresents a measurement of the overall health ofthe riparian area.
Indicators of riparian health are grouped into fivemain categories, as follows:
Habitat Continuity and Extent (longitudinalcontinuity, proximity to the nearest patch ofrelatively intact native vegetation and width ofriparian zone)Debris (leaf litter and fallen logs) andHollow - bearing Trees
Vegetation Cover and Structural Complexity(percentage vegetation cover and number oflayers)
Natives versus Exotic Plants (percentage cover)Regeneration of Natives (seedlings, saplings,native tussock grasses and reeds, and grazingimpact) .
2. Still poor condition lacks understorey andnative groundcover although better
4. Good condition (Cox Scrub Conservation Park):mainly native plants, including Sweet Bursaria, RiverBottlebrush, Pink Gum, Cup Gum and native grasses.

4. Rehabilitating a riparian area4.1. Protecting riparian zonesControlling livestock access is the most importantmanagement strategy for protecting and restoringriparian zones. When stock have access to riparianareas they graze and trample existing vegetation,including native species, and can preventregeneration of those species by grazing theseedlings. Soil compaction that results from stockusing these areas makes water infiltration into thesoil more difficult. This means that less water isavailable to plants in the riparian zone. Destructionof riparian vegetation also leads to a lack of soilstability and eventual soil erosion.
Fencing off watercoursesThe only effective way torestrict or prevent livestockaccess to waterways andassociated riparian zones is byfencing off those areas. Fencesthat are positioned well -backfrom the stream are less prone
to flood damage, and provide more protection forriparian vegetation. For shallow stream valleys,fencing needs to be located to protect any relatedfloodplain, and well -back from the top of the bank fordeep river valleys so that riparian vegetation is ableto stabilise the embankment. By enclosing the widestpossible area of riparian zone and revegetating anybare sections with local native species, `corridors' ofriparian vegetation can be created, that provideprotected pathways for the movement of nativeanimals. (See Section 6 for useful contacts forassistance with fencing.)
ShelterbeltsHaving excluded livestock from the waterway,alternative shelter should be provided in paddocks.The recommended design for an effective shelterbeltis one with several rows of native species, that allowsome airflow (to avoid turbulence on the leewardside) and which has three layers of vegetation,namely trees, shrubs and groundcover species. Thiswill provide protection for stock in harsh weatherconditions and habitat for native flora and fauna.Using native plant species also means lessmanagement of the shelterbelt. For informationabout appropriate plant species, contact the Goolwato Wellington LAP Board (see Section 6).
4.2. Alternative livestock wateringLimited waterway access pointsSome sections of a stream may be suitable for stockaccess, for example, the inside bend of a meanderwhere flow is slower and sediment is deposited (asopposed to the outside of a bend, where water tendsto accelerate and stock access would create asignificant risk of erosion).
8
Access points should be relatively flat and consist ofa suitable ramp surface, such as gravel, that willreduce the risk of erosion and make it easy for stockto reach the water's edge. They should also be fencedto prevent stock from entering the waterway andsurrounding riparian zone.
Although limited access points protect riparianvegetation, they still allow some amount of addednutrients to enter the stream from stock excrement.Also, if not located and constructed properly, theycan cause stream bank erosion.
A permit may be necessary to construct fencedaccess points (see Section 6 for details about who tocontact).
Off - stream watering points
To provide maximumprotection for a waterwayand its associated riparianzone, the preferred option forwatering stock is to installtroughs away from thewatercourse.
One method is to use a different water source, suchas piping water from a reticulated water supply orpumping water from a groundwater bore to troughsin paddocks. Another option is to gravity feed orpump water from the stream to supply troughs inpaddocks. Having excluded stock from the streamwill mean that this source of water is now cleanerthan when stock had direct access to it for drinking.Systems that are worth considering include nosepumps and solar- powered pumps. (See theReferences for useful sources of information).
Note: A permit is necessary for bore constructionand a licence will be necessary to extractgroundwater. (See Section 6 for details about who tocontact). Extraction of surface water for wateringstock does not require a licence.
Stock crossingsWhere it is necessary to move stock across awaterway, for example, when moving them betweenpaddocks, then a carefully constructed stockcrossing should be used. Crossings should be locatedacross a straight section of the stream to avoidproblems of erosion. The location should also be on anaturally higher site within the waterway this willreduce the height of fencing needed and reduceexposure of the fenced crossing to the force of thewater, making it more flood resistantand where thebank is not steep so as to minimise damage fromlivestock.
There should be a firm footing across the bank andthe waterway, for example, gravel, for easy stockmovement. The crossings will need to be fenced sothat stock cannot enter any other part of thewaterway or riparian zone. A permit must beacquired to construct a crossing (see Section 6 fordetails about who to contact).

Strategic grazing
Having established off - stream watering points forstock in paddocks, sustainable grazing methodsshould be devised.
Rotational grazing involves rotating stock betweenpaddocks, thereby allowing pasture time to rest andrecover to ensure that pastures are not destroyedthrough overgrazing. For example, for eightpaddocks, a one -week graze in each paddock and aseven -week rest for each paddock could be used.Rotational grazing often results in increased pastureproduction and healthier livestock, and less need forsupplemental feeding.
Time - managed grazing (including `crash grazing'),which should only be done for fire fuel reduction andto assist in weed management until the nativeriparian vegetation community is well - established(see Section 4.5), may be appropriate. It involvesstock being allowed into the fenced -off riparian zoneoccasionally, for short periods of time, and only whennative plants are mature enough to withstand somedamage. Landholders with considerable skill andexperience in stock management can use thismethod effectively.
For more information about restricting livestockaccess to waterways, including limited water accesspoints, alternative watering points and strategicgrazing, refer to the publication: Stock andwaterways: a manager's guide by Land & WaterAustralia.
4.3. Benefits to landholders of excludingstock from waterways
Easier stock management
Streams can be difficult areaswithin which to manage stock.Mustering can be timeconsuming, and stock can getbogged or drown during floods.Also, strategic grazing throughthe use of paddock
sub - division (discussed in Section 4.2) enables betterpasture management.
Improved water quality and stock health
Livestock effluent increases nutrient levels inwaterways. Stock can also stir up sediments causingturbidity of stream water, which reduces lightpenetration to submerged plants. The consequencesof these impacts are discussed in Section 2.2. Also,some water -borne diseases, that are lethal tolivestock, are spread by stock defecating inwaterbodies. Therefore, excluding stock fromwatercourses will improve water quality in streams.
In cases where water from the stream is used foralternative watering points (discussed in Section 4.2)stock exclusion from the riparian area and waterwayprovides a much cleaner source of water that leads tohealthier stock and improved wool, milk or meatproduction.
Reduction in stream bank erosionStock can create areas of bare soil and pugging asthey form walking tracks to the water's edge, and thiscauses stream bank erosion during rainfall events.The result is the transport of increased levels ofsediment into the stream, the impacts of which arediscussed in Section 2.2. Preventing erosion that iscaused by stock access also retains valuable soil onthe property.
4.4. Weed managementRiparian areas are mostvulnerable to invasion byenvironmental weeds if they aredegraded. Where nativevegetation is relatively intact,weeds find it difficult to becomeestablished. Gradual and consistent removalweeds, working from least degraded to mostdegraded, together with the re- establishment of localnative (indigenous) plant species is important forweed management to be successful.
Blackberry and willows are common weeds alongwatercourses in the region, and are discussed in thefollowing sub - sections. Being two of a number ofdeclared plants under the South Australian NaturalResources Management Act 2004, land managershave a legal obligation to control them.
It can be easy to confuse some native plants withweeds, for example, Native Raspberry (Rubusparvifolius) resembles blackberry, and can often befound growing in similar locations. Therefore, expertadvice about identification of weeds and native plantsis strongly recommended prior to commencement ofweed control.
of
It is recommended that a weed management plan bedeveloped that incorporates identification of plantspecies, a rough sketch of the riparian zone showingthe location of priority weeds, control options, andtime frames and costs for weed control and follow -up.It is also important to measure the success of theplan and to revise aspects of it if appropriate. (SeeSection 6 for useful contacts).
Blackberry (Rubus fruticosus)
Blackberry is a highly invasive weed, and createsproblems of access to land, fire risk from largeamounts of dead material within thickets and adecrease in property value.
Slashing or use of a `groomer' with a hydraulic arm(which can preserve native plants) can help open updense stands for follow -up by other methods ofcontrol, such as herbicide application. It may beworth considering a staged removal of blackberrywhile replacing with native plants, as it can providealternative habitat for wildlife in the meantime.
Willows (Salix spp.)
Willows are also a highly invasive weed. Beingdeciduous, they drop all their leaves in autumn.Aquatic ecosystems in Australia are adapted to theincorporation of leaf litter from native trees, such aseucalypts, consistently throughout the year, that hasa relatively slow rate of decomposition. Willows, on
9

the other hand, provide a flush of organic matter thatdecomposes rapidly, and inputs excessive amounts ofnutrients into the stream. This reduces oxygen levelsthrough heightened microbial activity, and threatensnative aquatic plants and animals.
Willows also create heavy shade on the bank andproduce mat- forming roots, both of which suppressthe regeneration of indigenous understorey plants. Inaddition, willows do not develop hollows that providehabitat for terrestrial animals, or provide in -streamhabitat from large woody debris. This importanthabitat is provided by the River Red Gums thatwillows replace.
Before removal of willows, it is important to plan fortheir replacement with native species, to avoid anyerosion problems. Physical removal (hand-puffing) ofseedlings is the simplest method of removal. Maturetrees should be injected with herbicide using thismethod, trees can be left in situ to graduallydeteriorate. (It is important to remove any straybranches as they may sprout new growth.) If thismethod is not suitable, lopping and stump - paintingcan be carried out. All lopped material should bestacked above flood height and burned 12 monthslater.
Herbicide use near waterwaysIf possible, weed control shouldbe carried out usingnon chemical techniques, suchas slashing, mulching orhand - pulling. However, if usingherbicide, it is important tochoose one that is suitable for
use near waterways. If spraying with herbicide, it isimportant to safeguard native plants from accidentaleradication. Spray drift can be reduced by the use ofa shroud fitted over the spray nozzle.
Another concern is possible harmful effects ofherbicide on non - target organisms such as frogs,invertebrates and fish, where it has entered thestream from spray drift or surface water runoff. Somechemicals accumulate in organisms to harmful levelsover the long term (bioaccumulation) see Section2.2, under Pesticides.
Note: It is important to seek advice from the SouthAustralian Murray - Darling Basin Natural ResourcesManagement Board before the commencement ofweed removal or herbicide application, including anyregulations that might apply to the use of herbicidesin South Australia. Also, the Environment ProtectionAuthority of South Australia can provide informationabout the disposal of unwanted concentratedpesticide. (See Section 6 for contact details).
4.5. RevegetationHaving fenced off the riparianarea, a choice of naturalregeneration, direct seedingand /or planting of tubestockcan be made, depending onsite conditions.
species of native trees, shrubs and groundcoverplants, should be maintained. For streams in theGWLAP region, a suitable width for the riparian zoneis at least 15 m for each side of the waterway, unlessimpractical.
Seed fall and material in the soil seed bank canprovide reproductive material for naturalregeneration of riparian vegetation. The BradleyMethod of natural regeneration,discussed in Joan Bradley'sbook: Bringing back the bush,involves the systematic removalof weeds to allow native(indigenous) plants to establishthemselves. The three 1principles applied by this method are: (1) work fromthe least weed - infested areas to the mostweed - infested, (2) cause minimal disturbance and(3) complete native plant regeneration in the bestareas before progressing the weed removal programto adjacent areas.
If using direct seeding to re- establish nativevegetation, weed removal needs to take placebeforehand. Collection and use of local native seedsfrom the property or adjoining areas will provide aseed supply that is suitable to local habitatconditions. It may be necessary to gain permission tocollect seed from private property, or acquire a permitfor public reserves. (This can be verified with thelocal council.) Alternatively, a commercial seedsupplier can be used, but it is important to ensurethey supply records to show the seed was collectedlocally.
Planting out seedlings can be done as a revegetationstrategy in its own right or in combination with theother strategies discussed above. Tubestock shouldbe propagated from locally- collected seed orcutting - material refer to the case study presented inSection 5 that discusses this approach torevegetation. Planting tubestock is often a moresuccessful revegetation approach along watercoursesthan direct seeding. However, where possible, naturalregeneration is the ideal revegetation strategy.
Native plants, for example, Common Reed(Phragmites australis)1, do not become `weedy' wherea natural balance is reached between canopy andunderstorey native plant species.
For detailed information about revegetationtechniques for the region, refer to the Goolwa toWellington LAP Board's booklet entitled Watercourserestoration guideline for the Goolwa- Wellington LAPRegion, prepared by Catherine Miles.
Riparian vegetation may provide harbour for feralanimals, such as foxes and rabbits. Various methodsof control can be used, including non destructiveones such as fencing and planting unpalatablespecies alongside preferential ones. See Section 6 foruseful contacts.
For a riparian area to perform functions discussed in Phragmites australis is actively growing (green) in summer andSection 2.2, a healthy structure, consisting of various
10
dormant (brown) in winter and, therefore, does not pose a fire risk.

5. Case study Cherry Macklin's watercourse rehabilitation
IntroductionCherry runs a farm in Ashbourne, where shebreeds about 150 head of beef cattle and 30 sheep.Soil type on the property is loam river flats, sandover clay further back from the watercourse andloam over clay on the hills. Average annual rainfallfor Ashbourne is around 600 mm.
Before Cherry took over her property, it was amostly cleared landscape with a few scatteredmature River Red Gums visually predominant. TheFinniss River and Bull Creek (which is a tributaryof the lower reaches of the Finniss River) runthrough this property. Willows, poplars and asheswere the dominant trees along the watercourses,and very little native vegetation was present. Stockhad free access to the waterways and relied onthem as their only source of drinking water. As aresult, water quality was poor and the riparianareas were degraded.
Over the last six years, Cherry has been carryingout revegetation projects on her land, including therehabilitation of her watercourses.
Stock management
Since taking over the property, Cherry has fencedoff 7 km of riparian area along the watercourses tocontrol livestock access, as well as using 1 km offencing to protect a swamp. Stock are only allowedto use a watercourse as a crossing when beingmoved between paddocks, ideally where the riverbed is rocky.
To water stock, a trough has been located in eachof the 15 paddocks, and this was completed beforefencing and rehabilitation of the watercoursesbegan. The troughs are gravity fed from a headertank near the top of a hill, which fills from borewater.
When deciding upon the width of the riparian areato be fenced off, Cherry took factors such asincluding any remnant riparian native vegetationand fencing well - landward of any unstable sectionsinto consideration. As a result, the width of thefenced -off riparian zone varies, depending onlandform, vegetation and land use issues, but shehas aimed for at least 15 m on each side of thewaterway.
Cherry avoids overgrazing by using rotationalgrazing mcthods, which has maintained goodgroundcover on the property. This helps to retainthe topsoil, and means that water running off thehills is clearer, thus preventing excessivesedimentation of the watercourses. Generally, stockare held in the larger paddocks for one week andsmaller paddocks for 3-4 days, although spellsbetween rotations are longer during the growingperiod (in spring) and shorter during dry periods.
Cherry has incorporated other benefits into herrotational grazing program, which include movingstock into suitable microclimates: making use ofnorth- facing paddocks in winter to provide stockwith more warmth and locating stock in shadierpaddocks in hot weather.
For fire control purposes, Cherry allows occasionaltime - managed grazing in the riparian area, wheretwo cows graze for three months at a time. She setsup temporary fencing to prevent the cows accessingthe revegetated areas, and doesn't allow them todrink from the watercourse, but brings ina 300 -litre water trough that she can fill from atank on the back of her utility or the carry-all of thetractor.
RevegetationSince the riparian area has been fenced off, asignificant amount of native vegetation has becomeestablished by itself, particularly in the river bedand along the edge of the watercourse, includingreeds, sedges and wattles.
Permanent waterhole, showing natural regenerationalong edge and in- stream, plantings further back andmature River Red Gums in background.
Swamp that was fenced off. It was not necessary toplant tubestock as revegetation is taking placeentirely from natural regeneration.
11

As can be seen from the photograph of the swamp,natural regeneration has been occurring theresince it was fenced off, and it was consideredunnecessary to plant tubestock. Cherry allowstime - managed grazing in the swamp once every fewyears to remove weeds, particularly Fog Grass(Holcus lanatus).
Cherry has planted over 4000 native plants in theriparian area during the last six years, to enhancethe revegetation resulting from naturalregeneration. The main species that have beenplanted are River Red Gum (Eucalyptuscamaldulensis), Blackwood Wattle (Acaciamelanoxylon), Swamp Wattle (Acacia retinodes) andbottlebrush species (genus: Calistemon).
To carry out revegetation, Cherry collected seedfrom her property, which was propagated throughthe Trees for Life (TFL) Tree Scheme. Also, TFL andthe GWLAP Board collected seed from the local areafor propagation. Of the tubestock she has planted,Cherry has had a good success rate, in terms ofsurvival and growth, of about 80 %. Watering wasonly necessary for the first year after planting!
Cherry has carried out extensive weed control inthe riparian area as a gradual process. Also, beingalong the lower reaches of the Finniss River, herwatercourses are subject to infestation by someweed species from upstream, which means thatcontrol of those weed species is still an ongoingtask. However, she has noticed that as the nativevegetation becomes established, the need for weedmanagement is significantly decreased.
Cherry retains large logs that have fallen into thewatercourse, as they provide habitat for fish andinvertebrates. However, where they will interferewith flow, she moves them towards the edge, whichalso prevents erosion of the banks by ensuring thatwater is not forced to flow around the debris.
Shade for stockSome of the eucalypts in the riparian area arearound 200 -300 years old, and their shade reacheswell - beyond the riparian zone. This provides stockwith protection in hot conditions. As Cherry'srehabilitation efforts bring about furtherestablishment and growth of native vegetation, theamount of shade for stock provided by the riparianzone will increase.
Benefits of rehabilitationThe quality of water in Cherry's watercourses hasimproved from exclusion of stock, as has thecondition of the riparian and aquatic habitats.Rehabilitation efforts of this kind can result inimprovements to the health of livestock when theyno longer drink water of poor quality that wascaused by their unlimited access to a waterway.For Cherry, this means increased survival of stockand, therefore, increased productivity.
12
Revegetation using tubestock in fenced -off riparianzone (take note of erosion) September 2004.
Growth of tubestock and natural regeneration insame location as above August 2008.
A number of native fish, turtles and swamp ratsnow inhabit the area. There has also been asignificant increase in bird life, includingkingfishers that have made a home of thewatercourses. Due to the creation of suitablehabitat, the riparian zone now serves as a corridorfor the protected movement of wildlife to BullockHill Conservation Park.
Cherry is also working on a project to increaseshade available to her stock on the remainder ofthe property, by fencing off selected sections ofpaddocks for 5-6 years to enable revegetationthrough natural regeneration and planting of nativespecies, incorporating significant trees wherepossible.
Cherry's watercourse rehabilitation project has alsoincreased the aesthetic and potential market valueof her property. As the benefits of rehabilitation ofthe watercourses and provision of alternativewatering points for stock continue to be realised, sothe value of her farming property will continue toincrease.

6. Useful contacts for assistanceOrganisation Assistance Phone
Goolwa to Wellington Local Action PlanningBoard
Technical advice about native plant and weed speciesidentification, fencing and revegetation. Financial assistancefor approved priority projects and help with projectimplementation.
8536 4551
South Australian Murray - Darling BasinNatural Resources Management Board
Specialist advice on watercourse management, and pestplant and animal control.
8391 7501
Strathalbyn Natural Resources Centre Practical advice and services in relation to seedlings andfencing, as well as potential financial assistance.
8536 3137
Trees for Life Assistance with seed collection and propagation. 8406 0500Environment Protection Authority SA Information about disposal of unwanted concentrated
pesticide.8204 2004
Department of Water, Land and BiodiversityConservation
Permit to construct a bore, and to build a crossing or erectfencing for limited stock access to a watercourse.
8463 6810
Licence to extract bore water (MLR Program). 8339 9807
Rural Solutions SA Advice on revegetation, weed and feral animal control, andintegrating environmental management into the managementof a rural property.
1300364322
Department of Primary Industries andResources SA
Regulations about use of herbicides in South Australia. 8463 3000
Victorian Department of Primary Industries Information about the Better Fertiliser Decisions Project. 136 186
anastomosing
anoxia
baseflow
benthic
bioaccumulate
biofilm
biota
canopy
carbon
contiguousdissolved oxygen
ecosystem
environmental weed
exotic
7. Glossary of environmentalMulti- branched stream system,forming a network.When water is low in dissolvedoxygen.Portion of stream flow that comesfrom groundwater.Associated with the river bed (e.g.benthic invertebrates).Accumulation of a substance in thebody of living organisms up the foodchain, increasing in concentrationwith each level.A thin layer of microscopicorganisms on the surface ofvegetation, soils and rocks that arekept constantly wet.All living plants and animals of aregion, for example, in a stream.Uppermost level of foliage formed bybranches and leaves.Naturally abundant non - metallicelement that occurs in manyinorganic and in all organiccompounds.Abutting.The oxygen found in microscopicbubbles of oxygen that occurbetween water molecules that isavailable to aquatic organisms.Interdependent biological systeminvolving the interaction betweenliving organisms and theirimmediate physical, chemical andbiological environment.Any plant species that is not locallyindigenous to the area in which it islocated, and which adversely affectsthe regeneration of indigenousplants.Introduced /not native to Australia.
floodplain
food chain
indigenous species
interstices
invertebratemacroinvertebrate
microclimate
overstorey
periphyton
photosynthesis
pugging
respiration
significant trees
spp.sub canopy
synergistic
understorey
termsLand adjacent to streams that isoccasionally inundated.Transfer of food energy from plantsthrough herbivores to carnivores.Organism that is native to a givenregion or ecosystem.Very small spaces between grains inthe substrate.Animal without a backbone.Animal without a backbone that istypically of a size that is visible tothe naked eye.Local atmospheric zone where theclimate differs from the surroundingarea.Uppermost, dominant vegetationlayer (if a grassland, then theoverstorey would be grasses).Biota attached to submergedsurfaces (i.e. algae, fungi, bacteria).Synthesis of organic material byplants from sunlight, carbon dioxideand water, and the aid of a catalystsuch as chlorophyll.Soil compaction caused by stock,from deep footprints.Metabolic processes within livingcells, whereby organisms obtainenergy from organic molecules.Remnant indigenous trees thatprovide important habitat.Several species (plural).Trees forming a vegetation layerbelow the canopy layer and abovethe shrub layer.Where the combined effect is greaterthan the sum of individual effects.Vegetation layer below thecanopy /predominant layer.
13

9 ern8. References ,,y
Boulton, A & Brock, M 1999, Australian freshwaterecology: processes and management, GleneaglesPublishing, Glen Osmond, South Australia.
Bradley, J 2002, Bringing back the bush, NewHolland, NSW.
Buchanan, R 1989, Bush Regeneration: recoveringAustralian landscapes, TAFE, NSW.
Costelloe, J & Sheldon, F 2008, Quantifying thehealth of ephemeral rivers, Land and WaterAustralia, Canberra.
CRC for Australian Weed Management 2003, Weedmanagement. guide: Blackberry (Rubus fruticosusaggregate), Australian Government.
-2003, Weed management guide:spp.), Australian Government.
Davies, P, Cook, B, Rutherford, K & Walshe, T 2004,Managing high in- stream temperatures usingriparian vegetation, Technical Guideline Number 5,Land & Water Australia, Canberra.
Department of Natural Resources and Environment(NRE) 1998, Willows along watercourses:managing, removing and replacing, LandcareNotes, NRE, Victoria.
Department of Primary Industries 2003, Landcarenotes: Shelterbelts for livestock protection, VictorianGovernment, Melbourne.
Environment Protection Authority SA (n.d.), Safe andeffective herbicide use: A handbook for near -waterapplications, South Australian Government,Adelaide.
Land & Water Resources Research DevelopmentCorporation 2000, Riparian corridors: Landholderbenefits and issues for management, viewed May2 008, <http: / /www.nor.com.au/environment/clarencecatchment /vegetation/ booklet. html #Riparian> . ,,
Lovett, S & Price, P 2001, Managing riparian lands inthe sugar industry: A guide to principles andpractices, Sugar Research & DevelopmentCorporation /Land & Water Australia, Brisbane.
Miles, C 2008, Watercourse restoration guideline forthe Goolwa- Wellington LAP Region, Goolwa tWellington Local Action Planning Board,:;Strathalbyn.
Price, P, Lovett, S & Lovett, J 2005, Wool industry Iriver management guide: sheep/ wheat zones, Land1& Water Australia, Canberra.
Safer Solutions 2008, Fertilisers, viewed 16 June2008, <http: / /www.safersolutions.org.au/index. php ?option= com_content &task =view&id= 81 &Itemid >.
Tennessee Valley Authority (n.d.), Benefits of riparianzones, viewed 3 September 2007,'<http://www.tva.gov/river/landandshore/stabilization /benefits.htm >.
Water and Rivers Commission 2000, Identifying theriparian zone, Water notes 11, Government ofWestern Australia, Perth.
2000, Livestock management: fence location andgrazing control, Water notes 18, Government ofWestern Australia, Perth.
2000, Livestock management: watering points andpumps, Water notes 7, Government of WesternAustralia, Perth.
2000, The management and replacement of largewoody debris in waterways, Water notes 13,Government of Western Australia, Perth.
2000, The value of large woody debris (snags),Water notes 9, Government of Western Australia,Perth.
Willow (Salix
Goolwa to Wellington Local Action Planning Board2004, Natural & social aspects, viewed18 February 2007, <http: / /www.rivermurray.sa.gov. au / lapgroups/ goolwa/ natural. html > .
Jansen, A, Robertson, A, Thompson, L & Wilson, A2005, Rapid appraisal of riparian condition, Version2, Technical Guideline Number 4A, Land & WaterAustralia, Canberra.
Land & Water Australia 2003, Managing riparianland to achieve multiple objectives, RipRap Riverand Riparian Lands Management Newsletter,Edition 23, Land & Water Australia, Canberra.
2006, Stock and waterways: a manager's guide,Australian Government, Canberra.
2007, Managing weeds in riparian areas,Australian Government.
2007, River contaminants: salt, nutrient, sedimentand their interactions, RipRap River and RiparianLands Management Newsletter, Edition 32, Land &Water Australia, Canberra.
2000, TITP values of the riparian zone, Waternotes 12, Government of Western Australia, Perth.
Sources of photographsPhotograph: page 12 (September 2004) by Tony
Randall (GWLAP Board).
Photographs: front cover and pages 7, 11, 12 and 17by Sally Roberts.
14

Appendix Sample riparian health assessmentThis assessment method is for single channel ephemeral streams up to 25 m wide. For wider oranastomosing ephemeral streams, refer to Costelloe and Sheldon (2008).
Longitudinal continuityMeasure the length of the vegetated (native and introduced vegetation combined) and not vegetated riparianzone along the watercourse. Ideally, sites to be assessed should be at least 200 m long, with 500 m being theoptimal length, if appropriate. Draw a simple line -map to show these measurements. Calculate thepercentage ( %) vegetated and score.
vegetated (V): woody vegetation greater than 2 m high, where the canopy cover of the dominant (tallest)vegetation occurs along the bank without a break of more than 50 m. For trees, 'vegetated' will also mean acanopy cover of at least 5 m wide.
not vegetated (NV): gap of more than 50 m in length of dominant canopy cover. (It is expected that mostriparian zones for streams in the GWLAP region would have naturally had a dominant tree canopy layer, andsome would have been dominated by tall shrubs. Therefore, a section with a dominant layer of less than 2 mis also considered to be a gap.)
discontinuity: each section that is `not vegetated'<: less than; >: greater than
Line map(vegetated and not vegetated sections, in metres)
not vegetatedvegetated
250vß.100wß.
15014
Calculations
total vegetated (V) = /100 metres
total not vegetated (NV) = 100 metres
total of vegetated and not vegetated (V + NV) = 500 metres
% vegetated = V / (V + NV) = 400 /500 x 100 = 'O %
Scoring Score (a)
<10% 0
410 -25% 1
25 -50% 2
50 -75% 3
>75% 4
Number ofdiscontinuities
(gaps >50 m)
Number of discontinuities /2 (b)
1 1/2
Result a - b 1/2 (Lc)
Longitudinal continuity score (LC) 3.5 (A)
Proximity to the nearest patch of relatively intact native vegetationShortest distance from site being assessed to nearest patch of at least 10 ha of relatively intact nativevegetation. (Nearest intact vegetation can be riparian.)
relatively intact vegetation: should have at least the expected dominant overstorey remaining.(Advice about this can be sought from the GWLAP Board: see Section 6 of the booklet for contact details.)
Criteria Scoring Score
>1 km (to nearest patch of at least 10 ha) 0
i (B)
200 m to 1 km (to nearest patch of at least 10 ha) 1
contiguous (with patch of at least 10 ha) 2
contiguous (with patch >50 ha) 3
15

Transect workEach transect is set up in the riparian zone, perpendicular (i.e. at a 90° angle) to the direction of the streambank, and is used to carry out measurements for vegetation width, cover and structural diversity; nativevegetation regeneration; and other habitat diversity features.
Transect length is determined by channel width -40 m long for channels <10 m wide and four times thechannel width for larger streams. However, if the riparian zone is clearly narrower than 40 m (i.e. relating towidth perpendicular to direction of stream bank), then transect length can be adjusted accordingly. (If anarrow riparian zone is the result of degradation, this will be evident from the results of the overallassessment.) Suggested width of transects is 10 m.
Replication is necessary to make the assessment valid, and it is recommended that several, evenly spacedtransects be used. For example, for a 200 m length of riparian zone, 50 m between transects would beconsidered an acceptable distance, and for a 500 m length: 125 m between.
Calculating average scores: add scores for each transect together and divide by the number of transects.
Width of canopy vegetationwidth of canopy vegetation: distance perpendicular from stream bank to first gap of >10 m
Transect Canopy width (in) Score
1 15 32 12 33 23 44 9 2
Average 3 (C)
Grazing impact
Transect Score
1 1
2 1
3 24 0
Average 1 (D)
Debris and hollow- bearing treesfallen logs: >10 cm diameter
Transect Leaf litter Native leaflitter
Fallen logs Hollow -bearing trees
1 2 2 1. 1
2 2 2 1 1
3 2 2 2 1.
4 1 1 1 0Average 1/5 (E) 1.77 (F) 1.2S (G) 0.75 (H)
16
Width Scoring
<1 m 0
1 -5 m 1
6-10 m 2
11 -20 m 3
>20 m 4
Assessment Scoring
none 2
minor 1
extensive 0
Assessment Scoring
none 0
scattered 1
abundant . 2
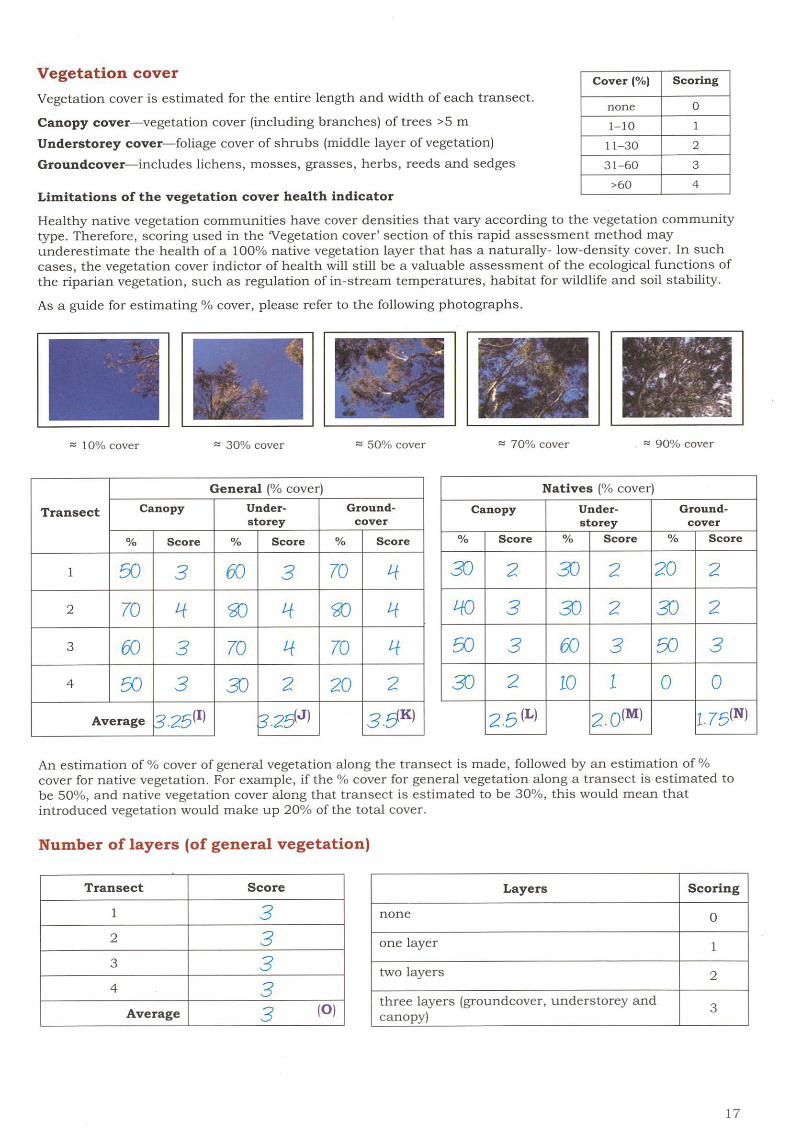
Vegetation coverVegetation cover is estimated for the entire length and width of each transect.
Canopy cover vegetation cover (including branches) of trees >5 mUnderstorey cover foliage cover of shrubs (middle layer of vegetation)Groundcover includes lichens, mosses, grasses, herbs, reeds and sedges
Limitations of the vegetation cover health indicator
Cover ( %) Scoring
none 0
1 -10 1
11 -30 2
31 -60 3
>60 4
Healthy native vegetation communities have cover densities that vary according to the vegetation communitytype. Therefore, scoring used in the `Vegetation cover' section of this rapid assessment method mayunderestimate the health of a 100% native vegetation layer that has a naturally- low- density cover. In suchcases, the vegetation cover indictor of health will still be a valuable assessment of the ecological functions ofthe riparian vegetation, such as regulation of in- stream temperatures, habitat for wildlife and soil stability.
As a guide for estimating % cover, please refer to the following photographs.
10% cover w. 30% cover 50% cover
Transect
General (% cover)Canopy Under-
storeyGround -
cover
% Score % Score % Score
1 50 3 60 3 70 If
2 70 Lf g0 4 14
3 60 3 70 '-f 70 '-f
4 50 3 30 2 20 2
Average 3.25g) 3.25(J) 35JK)
70% cover 90% cover
Natives (% cover)Canopy Under-
storeyGround -
cover% Score % Score % Score
30 2 30 2 20 2
110 3 30 2 30 2
50 3 60 3 50 3
30 2 10 1 0 0
2.5 (L) 2.0(M) 1.75(N)
An estimation of % cover of general vegetation along the transect is made, followed by an estimation of %cover for native vegetation. For example, if the % cover for general vegetation along a transect is estimated tobe 50 %, and native vegetation cover along that transect is estimated to be 30 %, this would mean thatintroduced vegetation would make up 20% of the total cover.
Number of layers (of general vegetation)
Transect Score
1 32 33 34 3
Average 3 (0)
Layers Scoring
none 0
one layer 1
two layers 2
three layers (groundcover, understorey andcanopy)
3
17

Regeneration of nativesFor native shrubs and trees assess regeneration, i.e. seedlings and saplingsFor large native tussock grasses and reeds: assess their occurrence
Seedlings and saplings
Transect Shrubseedlings
Saplings<1 m
Saplings1 -2 m
Saplings>2 m
1 1 2 1 22 1 1 1 1
3 2 2 2 1
4 0 0 0 1
Average 1 (P) 1.255 (Q) 1 (R) 1255 (S)
Large native tussock grasses and reeds
Transect Native tussock grasses Reeds
1 1 1
2 1 23 2 24 0 1
Average 1 (T) 1.550 (U)
Working out the health indicator score
Assessment Scoring
none 0
scattered 1
abundant 2
Assessment Scoring
none 0
scattered 1
abundant 2
Assessment categories Indices CalculationsHabitat Continuity and Extent(longitudinal continuity, proximity and width) A + B + C
Debris (leaf litter and fallen logs) andHollow- bearing Trees
E + F + G + H
Vegetation Cover and Structural Complexity(percentage vegetation cover and number of layers)
I + J + K + o 13.0
Natives versus Exotic Plants (percentage cover) L + M + N 6.25
Regeneration of Natives (seedlings, saplings, nativetussock grasses and reeds, and grazing impact)
D + p + Q + R + S + T + U 8. Q
Total Score 1- (0.255
Results (maximum possible score is 60)
<30 30 -36 37 -42 43-48 >48
very poor poor average good excellent
18

Questionnaire
The following questionnaire is designed to gather responses from the reader to evaluate the ways in whichthey found this booklet useful. It also invites suggestions for any additional topics that would be helpful ingaining an understanding of the value of riparian areas to landholders and ecosystems.
Please tick the appropriate boxes.
My reason for reading this booklet stems from my interest as a:
hobby fanner
large -scale farmer
high - school student
university student
general environmentalist
other (you may use the space on the right toprovide more information)
I found the following sections of the booklet useful (5 = strongly agree, 1 = strongly disagree)
Section name 5 4 3 2 1
IntroductionKey illustrationBenefits of riparian vegetation to the landholderEcological value of riparian vegetationRapid assessment of riparian healthProtecting riparian zonesAlternative livestock wateringBenefits to landholders of excluding stock from waterwaysWeed managementRevegetationCase study: Cherry Macklin's watercourse rehabilitationUseful contacts for assistance
The space below is provided for explanation of the reasons for finding particular sections the mostuseful /interesting and other sections less useful /interesting.
I would have liked more information about the following topics
Thank you for your responses to this questionnaire. The results of this survey will be a valuable means ofassessing the information needs of the target readership in relation to the management of riparian areas inthe Goolwa to Wellington Local Action Planning region.

Rapid riparian health assessment field work data sheetsThis assessment method is for single - channel ephemeral streams up to 25 m wide. For wider oranastomosing ephemeral streams, refer to Costelloe and Sheldon (2008).
Longitudinal continuityMeasure the length of the vegetated (native and introduced vegetation combined) and not vegetated riparianzone along the watercourse. Ideally, sites to be assessed should be at least 200 m long, with 500 m being theoptimal length, if appropriate. Draw a simple line -map to show these measurements. Calculate thepercentage ( %) vegetated and score.
vegetated (V): woody vegetation greater than 2 m high, where the canopy cover of the dominant (tallest)vegetation occurs along the bank without a break of more than 50 m. For trees, 'vegetated' will also mean acanopy cover of at least 5 m wide.
not vegetated (NV): gap of more than 50 m in length of dominant canopy cover. (It is expected that mostriparian zones for streams in the GWLAP region would have naturally had a dominant tree canopy layer, andsome would have been dominated by tall shrubs. Therefore, a section with a dominant layer of less than 2 mis also considered to be a gap.)
discontinuity: each section that is `not vegetated'<: less than; >: greater than
(vegetated and notLine map
vegetated sections, in metres)not vegetatedvegetated
Calculations
total vegetated (V) = metres
total not vegetated (NV) = metres
total of vegetated and not vegetated (V + NV) = metres
% vegetated = V / (V + NV) = x 100 =
Scoring Score (a)
< 10% 0
10-25% 1
25 -50% 2
50-75% 3
> 75% 4
Number ofdiscontinuities(gaps >50 m)
Number of discontinuities /2 (b)
Result a - b (LC)
Longitudinal continuity score (LC) (A)
Proximity to the nearest patch of relatively intact native vegetationShortest distance from site being assessed to nearest patch of at least 10 ha of relatively intact nativevegetation. (Nearest intact vegetation can be riparian.)
relatively intact vegetation: should have at least the expected dominant overstorey remaining.(Advice about this can be sought from the GWLAP Board: see Section 6 of the booklet for contact details.)
Criteria Scoring Score
>1 km (to nearest patch of at least 10 ha) 0
(B)200 m to 1 km (to nearest patch of at least 10 ha) 1
contiguous (with patch of at least 10 ha) 2
contiguous (with patch >50 ha) 3

Transect workEach transect is set up in the riparian zone, perpendicular (i.e. at a 90° angle) to the direction of the streambank, and is used to carry out measurements for vegetation width, cover and structural diversity; nativevegetation regeneration; and other habitat diversity features.
Transect length is determined by channel width -40 m long for channels <10 m wide and four times thechannel width for larger streams. However, if the riparian zone is clearly narrower than 40 m (i.e. relating towidth perpendicular to direction of stream bank), then transect length can be adjusted accordingly. (If anarrow riparian zone is the result of degradation, this will be evident from the results of the overallassessment.) Suggested width of transects is 10 m.
Replication is necessary to make the assessment valid, and it is recommended that several, evenly spacedtransects be used. For example, for a 200 m length of riparian zone, 50 m between transects would beconsidered an acceptable distance, and for a 500 m length: 125 m between.
Calculating average scores: add scores for each transect together and divide by the number of transects.
Width of canopy vegetationwidth of canopy vegetation: distance perpendicular from stream bank to first gap of >10 m
Transect Canopy width (m) Score
1
2
3
4
Average (C)'1
Grazing impact
Transect Score
1
2
3
4
Average (D)
Debris and hollow- bearing treesfallen logs: >10 cm diameter
Transect Leaf litter Native leaflilies
Fallen logs Hollow-bearing trees
1
2
3
4
Average (E) (F) (G) (H)
Width Scoring
<1 m 0
1 -5 m 1
6-10 m 2
11 -20 m 3
>20 m 4
Assessment Scoring
none 2
minor 1
extensive 0
Assessment Scoring
none 0
scattered 1
abundant 2

Vegetation coverVegetation cover is estimated for the entire length and width of each transect.
Canopy cover vegetation cover (including branches) of trees >5 mUnderstorey cover foliage cover of shrubs (middle layer of vegetation)Groundcover includes lichens, mosses, grasses, herbs, reeds and sedges
Limitations of the vegetation cover health indicator
Cover ( %) Scoring
none 0
1 -10 1
11 -30 2
31 -60 3
>60 4
Healthy native vegetation communities have cover densities that vary according to the vegetation communitytype. Therefore, scoring used in the `Vegetation cover' section of this rapid assessment method mayunderestimate the health of a 100% native vegetation layer that has a naturally- low- density cover. In suchcases, the vegetation cover indictor of health will still be a valuable assessment of the ecological functions ofthe riparian vegetation, such as regulation of in- stream temperatures, habitat for wildlife and soil stability.
As a guide for estimating % cover, please refer to the following photographs.
10% cover n 30% cover n 50% cover
TransectGeneral (% cover)
Canopy Under-storey
Groundcover
% Score % Score % Score
1
2
3
4
Average (I) (J) (K)
n 70% cover 90% cover
Natives (% cover)Canopy Under-
storey
Groundcover
% Score % Score % Score
ÌLI (M) IN;
An estimation of % cover of general vegetation along the transect is made, followed by an estimation ofcover for native vegetation. For example, if the % cover for general vegetation along a transect is estimated tobe 50 %, and native vegetation cover along that transect is estimated to be 30 %, this would mean thatintroduced vegetation would make up 20% of the total cover.
Number of layers (of general vegetation)
Transect Score
1
2
3
4
Average (0)
Layers Scoring
none 0
one layer 1
two layers 2
three layers (groundcover, understorey andcanopy) 3
17

Regeneration of nativesFor native shrubs and trees assess regeneration, i e seedlings and saplingsFor large native tussock grasses and reeds: assess their occurrence
Seedlings and saplings
Transect Shrubseedlings
Saplings<1 m
Saplings1 -2 m
Saplings>2 m
1
2
3
4
Average (P) (Q) (R) (S)
Large native tussock grasses and reeds
Transect Native tussock grasses Reeds1
2
3
4
Average (T) (U)
Working out the health indicator score
Assessment Scoring
none 0
scattered 1
abundant 2
Assessment Scoring
none 0
scattered 1
abundant 2
Assessment categories Indices CalculationsHabitat Continuity and Extent(longitudinal continuity, proximity and width) A + B + C
Debris (leaf litter and fallen logs) andHollow - bearing Trees
E + F + G + H
Vegetation Cover and Structural Complexity(percentage vegetation cover and number of layers)
I + J + IC + 0
Natives versus Exotic Plants (percentage cover) L + M + N
Regeneration of Natives (seedlings, saplings, nativetussock grasses and reeds, and grazing impact)
D + p + Q + R + S + T + U
Total Score
Results (maximum possible score is 60)
<30 30-36 37-42 43 -48 >48
very poor poor average good excellent