ringling macarthur reserve - university of south florida...mar 05, 1986 · the purpose of the...
TRANSCRIPT

RINGLING MacARTHUR RESERVE Water Resources Investigation
(Appendices) =? - ' ' - = -
Oames & Moore
Bennet t & Bishop Boyle E n g i n e e r i n g

A P P E N ~ ~ X E
SITE SURFACE .MTER INVESTIGATION

APPENDIX E
SITE SURFACE WATER INVESTIGATION
E . l INTRODUCTION ........................................ E - 1 E.2 SITE PHYSICAL DESCRIPTION ........................... E-2 E.3 FIELD MONITORING NETWORK CHARACTERISTICS ............ E-3
............................. E.3.1 Network Purpose E-4 E.3.2 Network Components .......................... E-4
.......................... E.3.3 Network Maintenance E-7 .......................... E.3.4 Network Performance E-7
E.4 RAINFALL QUANTIFICATION ............................. E-8
............................ E.4.1 Rain Gage Network E-8 E.4.2 R a i n f a l l Data ................................ E-9
................... E . 5 EVAPOTRANSPIRATION QUANTIFICATION E-10
................................. E.5.1 I n t r o d u c t i o n E-10
E.5.1.1 Terminology ......................... E-10 ... E.5.1.2 Evapot ransp i ra t ion Study Purpose E - 1 1
E.5.2 L i t e r a t u r e Review o f Ava i l ab le Methods ....... E-12
............... E.5.2.1 Water Balance Methods E-12 E.5.2.2 Energy Balance Method ............... E-15 ............... E.5.2.3 Mass Transfer Methods E-15 E.5.2.4 P r e d i c t i o n Methods .................. E-15
E.5.3 RMR Evapotranspirometer Approach ............. E-16
E.5.3.1 Evapotranspirometer S i t e Se lec t i on St ra tegy ............................ E-17
E .5. 3.2 Evapotranspirometer Const ruc t ion .... E-17 .... E.5.3.3 Evapotranspirometer I n s t a l l a t i o n E-17 ...... E.5.3.4 Evapotranspirometer P r i n c i p l e s E-19 ...... E.5.3.5 Evapotranspirometer Mon i to r i ng E-20 E.5.3.6 Evapotranspirometer I n s t a l l a t i o n ........................ Def i c ienc ies E-21

APPENDIX E (Continued)
E.5.4 Nat ional Weather Serv ice Class A Pan Evaporat ion .................................. E-24
E.5.4.1 Class A Pan P r i n c i p l e s .............. E-24 E.5.4.2 Class A Pan Moni to r ing .............. E-24 E.5.4.3 Class A Pan Data App l i ca t i on ........ E-24
E.5.5 Lower Myakka Lake Pan Evapot ransp i ra t ion ..... E-25
E.5.5.1 Lower Myakka Lake Pan P r i n c i p a l s .... E-25 E.5.5.2 Lower Myakka Lake Pan Moni to r ing .... E-25 E.5.5.3 Lower Myakka Lake Pan Data .......... E-26
. ............... E 5.6 Evapot ransp i ra t ion Ca lcu la t i on E-26 E.5.7 Evapot ransp i ra t ion Resu l ts ................... E-28
E.5.7.1 Wetland Evapot ransp i ra t ion .......... E-28 E.5.7.2 Dry P r a i r i e Evapot ransp i ra t ion ...... E-29 E.5.7.3 Pine Platwood Evapot ransp i ra t ion .... E-30 E.5.7.4 Lower Myakka Lake Evapot ransp i ra t ion . E-31
E.6 RUNOFF QUANITIFICATION .............................. E-32
E.6.1 Flume Network ................................ E-32 E.6.2 Discharge Data ............................... E-32
E.6.2.1 Deer P r a i r i e Slough DischargeIWater Level Data .......................... E-32 ................. E .6. 2.2 DM-2 Discharge Data E-33 ................. E.6.2.3 DM-3 Discharge Data E-33
E.6.2.4 DM-4 Discharge Data ................. E-34
E.6.3 Runoff Q u a n t i f i c a t i o n Resu l ts ................ E-35 E.6.4 R a i n f a l l I R u n o f f Re la t i onsh ip ................. E-35
E.6.4.1 S o i l Conservation Serv ice Runoff .................... Curve Number. CN E-35 E.6.4.2 Dimensionless U n i t Hydrograph ....... E-36
E.7 MASS BALANCE ANLAYSIS ............................... E-37
E.7.1 General ...................................... E-37 E.7.2 Model Conceptual izat ion ...................... E-37 E.7.3 Data Base Development ........................ E-38 E.7.3 Calibration/Verification ..................... E-44 E.7.4 S i t e Water Budget Model Ana lys is ............. E-46

APPENDIX E
L I S T OF TABLES
MONTHLY R A I N F A L L TOTALS AT DAMES & MOORE STATIONS INCHES OF R A I N F A L L
EVAPOTRANSPIROMETER S O I L PROPERTIES COMPARISON BEFORE AND AFTER INSTALLAT ION
LOWER MYAKKA LAKE EVAPOTRANSPIRATION PAN DATA COMPARISON
DRY P R A I R I E EVAPOTRANSPIROMETER DATA COMPARISON
WETLAND EVAPOTRANSPIROMETER DATA COMPARISON
R A I N F A L L DATA MYAKKA R IVER STATE PARK
MONTHLY R A I N F A L L TOTALS AT DAMES & MOORE STATIONS
ASSESSMENT OF VARIANCE BETWEEN MEASURED AND PREDICTED WATER LEVELS
PREDICTED MONTHLY EVAPOTRANSPIRATION/RUNOFF SURFACE WATER BALANCE MODEL (SWBM)
DEER P R A I R I E SLOUGH SUPPLY I N MGD FOR INDICATED MONTH AT 5 PERCENT OF FLOW
SOUTHWEST DRAINAGE SYSTEMS SUPPLY I N MGD FOR INDICATED MONTH AT 5 PERCENT OF FLOW

APPENDIX E
L I S T OF FIGURES
V I C I N I T Y MAP
DRAINAGE SCHEMATIC
LOCATION MAP OF WATER MONITORING STATIONS
OM1 AUG. 1985 DATA SUMMARY
DM1 SEPT. 1985 DATA SUMMARY
DM1 OCT. 1985 DATA SUMMARY
DM1 NOV. 1985 DATA SUMMARY
DM1 DEC. 1985 DATA SUMMARY
DM2 JUNE 1985 DATA SUMMARY
DM2 JULY 1985 DATA SUMMARY
DM2 AUG. 1985 DATA SUMMARY
DM2 SEPT. 1985 DATA SUMMARY
OM2 OCT. 1985 DATA SUMMARY
DM2 NOV. 1985 DATA SUMMARY
DM2 DEC. I985 DATA SUMMARY
DM3 JUNE 1985 DATA SUMMARY
DM3 JULY 1985 DATA SUMMARY
DM3 AUG. 1985 DATA SUMMARY
DM3 SEPT. 1985 DATA SUMMARY
DM3 OCT. 1985 DATA SUMMARY
DM3 NOV. 1985 DATA SUMMARY
DM3 DEC. 1985 DATA SUMMARY
DM4 A P R I L 1985 DATA SUMMARY

APPENDIX E
L I S T OF FIGURES ( C o n t i n u e d )
F i g u r e s
E . 4 - 2 1
E.4-22
E . 4 - 2 3
E .4 -24
E.4-25
E.4-26
E .4 -27
E.4-28
E.5-1
E.5-2
E .5 -3
E.5-4
E .5 -5
E.5-6
E . 6 - 1
E.6-2
E.7-1
E. 7 - 2
E.7-3
E.7-4
DM4 MAY 1 9 8 5 DATA SUMMARY
DM4 JUNE 1 9 8 5 DATA SUMMARY
DM4 JULY 1 9 8 5 DATA SUMMARY
DM4 AUG. 1 9 8 5 DATA SUMMARY
DM4 SEPT. 1 9 8 5 DATA SUMMARY
DM4 OCT. 1 9 8 5 DATA SUMMARY
DM4 NOV. 1 9 8 5 DATA SUMMARY
DM4 DEC. 1 9 8 5 DATA SUMMARY
DM3 DRY P R A I R I E EVAPDTRANSPIROMETER SCHEMATIC
P I N E FLATWOOD EVAPOTRANSPIROMETER INSTALLAT ION SCHEMATIC
DM2 WETLAND EVAPOTRANSPIROMETER INSTALLAT ION SCHEMATIC
DM5 NATIONAL WEATHER SERVICE CLASS A EVAPORATION PAN RESULTS
ESTIMATION PROCEDURE: EVAPOTRANSPIRATION CALCULATION
EVAPOTRANSPIRATION VERSUS DEPTH RELATIONSHIP DRY-PRAIRIE
DEER P R A I R I E SLOUGH WATER SURFACE ELEVATION DATA SUMMARY
RMR DIMENSIONLESS U N I T HYDROGRAPH
S I T E F A C I L I T I E S MAP
ROMP 1 9 E GROUND WATER HYDROGRAPH
ROMP 19W GROUND WATER HYDROGRAPH
COMPARISON OF WELL ES AND WS WATER LEVELS WITH CALCULATED LEVELS
S I T E WATER BUDGET MODEL CALIBRATION (SWBM)
S I T E WATER BUDGET MODEL VERIF ICAT ION
REPRESENTATIVE WATER LEVEL CHANGES UNDER DIFFERENT PUMPING SCENARIOS

APPENDIX E
SITE SURFACE WATER INVESTIGATION
E . l INTRODUCTION
The purpose o f t h e Ring1 ing-MacArthur Reserve (RMR) s i t e s u r f ace
water i n v e s t i g a t i o n was t h e development o f a hydro log ic data base and
es t imat ion o f RMR sur face water supply c a p a b i l i t i e s . The i n v e s t i g a t i o n
centered on q u a n t i f i c a t i o n o f t h e var ious s i t e hydro log ic regime para-
meters. These parameters are r a i n f a l l , evapotranspi rat ion, evapora-
t i o n , s o i l i n f i l t r a t i o n c a p a b i l i t i e s , recharge and discharge from t h e
S u r f i c i a l Aqui fer , and sur face r u n o f f . Discussion o f t h e reg iona l
long-term waterbudget i s prov ided i n Appendix F.
The i n v e s t i g a t i o n was conducted w i t h f i e l d data c o l l e c t i o n and
o f f i c e studies. F i e l d da ta c o l l e c t i o n , described i n d e t a i l i n Sect ion
E.3.1, was conducted w i t h a network o f discharge and stage gages,
evapotranspirometers, evaporat ion pans, and r a i n f a1 1 monitors. Data
c o l l e c t i o n was i n i t i a t e d i n March 1985. The f i n a l s t a t i o n i n t h e
network was i n s t a l l e d i n Ju l y 1985. This ana lys is incorporates data
c o l l e c t e d up through December 1985. Data c o l l e c t i o n i s con t i nu ing and
w i l l cont inue a t l e a s t through June o f 1986.
O f f i c e analysis, i n i t i a t e d i n t h e F a l l o f 1985, consis ted o f :
' es t ima t ion o f t h e numerical range and probable averages o f each
o f t h e hydro log ic parameters,
assessment o f t h e r e l a t i o n s h i p between t h e hydro log ic
parameters,
development o f p r e d i c t i v e models f o r es t ima t ing t h e long-term
s i t e water balance, and
es t imat ion o f t h e impact t o t h e hyd ro log i c components under
'. var ious withdrawal scenarios.
Revision: 0 Date: 3/5/86

The f o l l o w i n g sect ions inc lude a general phys ica l d e s c r i p t i o n of
t h e s i t e , d e s c r i p t i o n o f t h e f i e l d and o f f i c e ana lys is procedures, a
q u a n t i f i c a t i o n o f t h e hydro log ic s i t e parameters, a d e s c r i p t i o n o f t h e
s i t e water balance modeling procedure, and t h e r e s u l t s o f an ana lys is
o f var ious withdrawal scenarios.
E.2 SITE PHYSICAL DESCRIPTION
The RMR i s an approximately 51 square m i l e t r a c t o f land loca ted
i n eastern Sarasota County, imned ia te ly east o f t h e Myakka River , and
southeast o f Myakka R iver S ta te Park (F igu re E.2-1). Hyd ro log i ca l l y
t h e s i t e i s a t y p i c a l southern Gu l f Coast wet landlupland mosaic w i t h
o v e r a l l basin slopes o f l ess than 1 f o o t per m i l e . The s i t e r i s e s from
a low e leva t i on o f approximately 5 f e e t mean sea l e v e l (msl) i n t h e
southwestern corner near t h e Myakka R iver t o e leva t ions approaching
35 f e e t msl i n t h e n o r t h c e n t r a l and nor theastern po r t i ons o f t h e s i t e .
Land surfaces i n t h e western one - th i rd o f t h e s i t e s lope west t o
southwest towards the Myakka R iver . From t h e c e n t r a l p o r t i o n o f t h e
s i t e t o t h e eastern boundary t h e land sur face i s charac ter ized by a
r e l a t i v e l y l e v e l p la teau w i t h e leva t i ons ranging from 30 t o 35 f e e t
msl. The eastern t h i r d o f t h e p la teau w i t h i n t h e RMR boundaries i s
b isec ted by t h e southwestern t rend ing Deer P r a i r i e Slough.
The drainage area d i v i d e s w i t h i n and adjacent t o t h e s i t e are
shown on F igu re E.2-2. The s i t e i s charac ter ized by f o u r major d ra in -
age systens. Moving across t h e s i t e from t h e northwest t o t h e south-
east t h e f i r s t system i s a se r ies o f interconnected, small, p o o r l y
dra ined wetland sloughs d r a i n i n g west t o northwest from t h e s i t e
towards Myakka R iver S ta te Park and u l t i m a t e l y t h e Myakka R iver and
Lower Myakka Lake. Except f o r a smal l bas in near Highway 72 these
sloughs o r i g i n a t e on t h e RMR and prov ide drainage i n t o Myakka R ive r
S ta te Park. These fea tu res d r a i n a t o t a l o f approximately 9.5 square ... mi les .
The second major drainage system i s a se r ies o f creeks known as
Blackburn Slough, Manace Wallace Slough, and Me11 W i l l i a n s Canal.
Revision: 0 Date: 3/5/86

These t h r e e p a r a l l e l t r i b u t a r i e s d r a i n an area o f approximately
16.2 square m i l e s t o t h e southwest towards t h e Myakka R iver . The
drainage area cons is ts o f p a r a l l e l t e r races which g radua l l y r i s e from
t h e Myakka R ive r f l o o d p l a i n t o t h e p la teau f e a t u r e which charac ter izes
t h e c e n t r a l and eastern p o r t i o n s o f t h e s i t e .
The t h i r d major system i s Deer P r a i r i e Slough which d ra ins t h e
aforementioned plateau. The slough has two major t r i b u t a r i e s , Windy
Sawgrass and High Hammock Canal, i n a d d i t i o n t o t h e main channel as
shown on F igure E.2-2. Major reaches o f Windy Sawgrass and Deer
P r a i r i e Slough have been channelized. Deer P r a i r i e Slough a t t h e
southern p rope r t y boundary d ra ins approximately 31 square mi les .
Approximately 9.5 square m i les o f t h i s area i s o f f - s i t e drainage i n t o
Deer P r a i r i e Slough and approximately 3 square m i l e s i s o f f - s i t e
drainage i n t o High Hammock Canal. The 12.5 square m i l e s o f o f f - s i t e
area d r a i n i n g i n t o t h e Deer P r a i r i e Slough drainage system i s t h e o n l y
s i g n i f i c a n t o f f - s i t e drainage i n t o t h e RMR.
The f o u r t h major drainage f e a t u r e i s R u s t l e r Slough on t h e south-
eastern corner o f t h e s i t e . Th i s slough which d ra ins approximately
3.6 square m i l e s i s t h e o n l y area on t h e s i t e which d ra ins t o t h e east
i n t o Cowpen Slough.
E.3 FIELD MONITORING NETWORK CHARACTERISTICS
The Dames & Moore f i e l d network DM-1 through DM-6, used t o moni tor
t h e sur face water c h a r a c t e r i s t i c s o f t h e Rt@ are shown on F igure E.3-1.
The c r i t e r i a used t o l o c a t e these i n s t a l l a t i o n s were as fo l l ows :
* Each s i t e requ i red a c c e s s i b i l i t y du r ing d r y as w e l l as wet
seasons.
Each s i t e was loca ted i n an area o f hydro log ic i n t e r e s t and
.., d i s t i nc t i veness .
Each s i t e possessed t h e necessary exposure and physiographic
c h a r a c t e r i s t i c s f o r proper inst rumentat ion.
Revision: D Date: 3/5/86

E.3.1 Network Purpose
The measured hydro log ic parameters inc lude: r a i n f a l l , r uno f f ,
s u r f i c i a1 ground water leve ls , so i 1 moisture, evaporation, evapotrans-
p i r a t i o n , wind t o t a l s , water temperatures, and a i r temperatures. Th is
da ta was used t o q u a n t i f y t h e s i t e water balance and t o develop a mass
balance model f o r p r e d i c t i o n o f RMR sur face water supply capab i l -
i t i e s .
E.3.2 Network Components
The f o l l o w i n g i s an o u t l i n e o f the equipment and parameters
measured a t each Dames & Moore sur face water mon i to r ing s t a t i o n .
E.3.2.1 DM-1 1. Leupold and Stevens Type A Model 71 Water Level Recorder
Deer P r a i r i e Slough water l e v e l s a t n o r t h power l ine c ross ing
2. S i x Leupold and Stevens S t a f f Gages - DM-1 (A-F)
Water l e v e l s along Deer P r a i r i e Slough
3. All-Weather Rain Gage
Per iod i c (b i -weekly t o weekly) r a i n f a1 1 t o t a l s
E.3.2.2 DM-2 - 1. MICROSCOUT Microprocessor
2. Sierra-Misco T ipp ing Bucket Rain Gage
Instantaneous r a i n f a l l measurements
3. All-Weather Rain Gage
., . * Pe r iod i c (bi-weekly t o weekly) r a i n f a l l t o t a l s
4. B e l f o r t Po r tab le L i q u i d Level Recorder
Measure water l e v e l s across concrete f lume
Revision: 0 Date: 3/5/86

5. Two Druck Pressure Transducers
' Measure water l e v e l s across concrete f l m e
Measure s u r f i c i a l ground water l e v e l s i n Well BH-2
6. Concrete V-Notch Flune
Flow c o n t r o l f o r discharge measurement
7. S u r f i c i a l Well BH-2
Measure s u r f i c i a l ground water l e v e l s
8. Two Evapotranspirometers
Measure wetland evapot ransp i ra t ion
Measure p ine f l atwood evapot ransp i ra t ion
9. S o i l Mo is tu re Blocks
Measure s o i l moisture i n t h e unsaturated s o i l zone
E.3.2.3 DM-3 - 1. MICROSCOUT Microprocessor
2. Sierra-Misco T ipp ing Bucket Rain Gage
Instantaneous r a i n f a l l measurements
3. All-Weather Rain Gage
* Pe r iod i c (b i -weekly t o weekly) r a i n f a l l t o t a l s
4. B e l f o r t Por tab le L i q u i d Level Recorder
Measure water l e v e l s across Plast i-Fab t rapezo ida l f lwne
5. Druck Pressure Transducer
Measure water l e v e l s across P l ast i -Fab t rapezo ida l f lume
6 Shape Pressure Transducer
Measure s u r f i c i a l ground water l e v e l s i n Well BH-1
7. P l ast i -Fab Trapezoidal Flume
Revision: 0 Date: 3/5/86

Flow c o n t r o l f o r discharge measurement
8. S u r f i c i a l Well BH-1
Measure s u r f i c i a l ground water l e v e l s
9. Evapotranspirometer
Measure d r y p r a i r i e evapot ransp i ra t ion
10. S o i l Mo is tu re Blocks
Measure s o i l mo is tu re i n t h e unsaturated s o i l zone
11. T o t a l i z i n g Anemometer
Measure average wind speed
12. Humidity and Temperature Sensor
Measure r e l a t i v e humid i ty
Measure a i r temperature
E.3.2.4 DM-4 - 1. B e l f o r t Cont inuously Recording Rain Gage
" Instantaneous r a i n f a l l measurements
2. All-Weather Rain Gage
Per iod i c (b i -weekly t o weekly) r a i n f a l l t o t a l s
3. I S C O 1870 Flow Meter
" Measure water l e v e l s across P las t i -Fab t rapezo ida l f lume
4. P l ast i -Fab Trapezoidal Flune
Flow c o n t r o l f o r discharge measurement
'1. Nat iona l Weather Serv ice Class A Evaporat ion Pan
Measure evaporat ion r a t e s from a f r e e water sur face
Revision: 0 Date: 3/5/86

2. T o t a l i z i n g Anemometer
Measure average wind speed
3. All-Weather Rain Gage
'Per iodic (bi-weekly t o weekly) r a i n f a1 1 t o t a l s
4. Submersible Maximum/Minimum Thermometer
Measure maximum, minimum, and present evaporat ion pan water temperatures
E.3.2.6 DM-6 - 1. F l o a t i n g F iberg lass Lake Evaporat ion Pan
' Measure evapot ransp i ra t ion r a t e s i n Lower Myakka Lake
2. All-Weather Rain Gage
Per iod i c (b i -weekly o r weekly) r a i n f a l l t o t a l s
E.3.3 Network Maintenance
A l l o f t h e sur face water mon i to r ing s t a t i o n s were v i s i t e d and
mainta ined a t a minimum o f once per week. Maintenance procedures are
documented i n t h e RMR Surface Water Mon i to r i ng Manual (Dames & Moore,
1985). The manual s t i p u l a t e d data c o l l e c t i o n procedures, da ta t r a n s f e r
con t ro l , mani fest systems, and maintenance procedures.
E.3.4 Network Performance
Data r e t r i e v e d from t h e inst ruments a t each Dames & Moore sur face
water mon i to r i ng s t a t i o n was c r i t i c a l t o t h e successful q u a n t i f i c a t i o n
and understanding o f t h e sur face hydro logy f o r t h e RFa. Consequently,
a continuous record o f da ta f o r each o f t h e parameters s tud ied i s needed. I n most cases a cont inuous reco rd was r e t r i e v e d from t h e
mon i to r i ng s ta t i ons . Occassional l i g h t n i n g s t r i k e s and o the r envi ron-
mental f ea tu res damaged some e l e c t r o n i c equipment. Other l e s s f requent
pr ib lems a f fec ted t h e mechanical instruments. However, i n n e a r l y every
Revision: 0 Date: 3/5/86

case the re were two l e v e l s o f ins t rumenta t ion measuring each parameter.
Th i s was i nva luab le i n main ta in ing a cont inuous data record. Estima-
t i o n procedures based on ac tua l f i e l d da ta were l a t e r used t o f i l l i n
gaps i n t h e data record.
E.4 RAINFbLL QUANTIFICATION
R a i n f a l l i s t h e i n p u t parameter f o r determin ing t h e a v a i l a b l e s i t e
water crop. It represents t h e i n p u t i n t o t h e water budget r e l a t i o n s h i p
whether i t be f o r t h e e n t i r e s i t e , a smal l stream basin, o r an evapo-
t ranspi rometer . The f o l l o w i n g two sub-sections conta in a d e s c r i p t i o n
o f t h e mon i to r ing network and a d iscussion o f t h e data analys is .
E.4.1 Rain Gage Network
One o r more types of r a i n gages were l oca ted a t each o f Dames &
Moore's sur face water mon i to r ing s t a t i o n s shown on F igu re E.3-1. The
gages themselves were post ioned f o r proper exposure a t each s i t e . Most
gages are p laced on wooden stands 10 t o 12 f e e t h igh. A l i s t o f t h e
types o f r a i n gages used a t each mon i to r i ng s t a t i o n i s inc luded i n
Sect ion E.3 o f t h i s appendix.
Three types o f r a i n gages were u t i l i z e d : two S i e r r a Misco t i p p i n g
bucket r a i n gages, one B e l f o r t cont inuous ly reco rd ing r a i n gage, and
s i x All-Weather r a i n gages. The S i e r r a Misco r a i n gages work on t h e
t i p p i n g bucket p r i n c i p l e and each bucket t i p i s recorded e l e c t r o n i c a l l y
on a MICROSCOUT microprocessor. Bucket t i p s are summed toge the r f o r
the e n t i r e sampling p e r i o d o f 1 hour, thus record ing t h e t ime and
amount o f p r e c i p i t a t i o n . Data i s l a t e r r e t r i e v e d f rom t h e micro-
processor.
The B e l f o r t r a i n gage i s a we igh t ing gage and converts weight i n t o
inches o f r a i n f a l l , i n a d d i t i o n t o denot ing t h e t ime o f t h e r a i n f a l l
event. Th is i n fo rma t ion i s recorded on a paper c h a r t which i s l a t e r
i n te rp re ted . The A1 1-Weather r a i n gages measure r a i n f a1 1 t o t a l s o f one
o r more events over t h e i nspec t i on i n t e r v a l . The t i m i n g o f t h e events
Revision: 0 Date: 3/5/86

is not known, only the total rainfall. These All-Weather rain gages
were the primary gages at DM-1, DM-5, and DM-6. At the remaining
stations, they were utilized to provide a check on the Sierra-Misco or
Belfort rain gages.
The rainfall totals found for the All-Weather and Belfort rain
gages for the same time period were in agreement. However, the
rainfall totals for the A1 1-Weather and Sierra-Misco rainfall gages
were inconsistent. As a result, rainfall data reported for DM-2 and
DM-3 are taken from the All-Weather rainfall gages, and represent
the totals of one or more rainfall events. Corrective action for
improving the accuracy of the tipping bucket gages has to date been
insufficient to allow dependence on the rainfall data. Prior to
issuance of this report a major factory, reprogramning of the equipment
was conducted. The results of that effort have not been assessed to
date.
E.4.2 Rainfall Data
Rainfall data collected from the RMR appears in two forms. It
appears as monthly totals in Table E.4-1 for each station. Secondly,
it appears in the form of monthly hyetographs for each station (DM-1 - DM-5) on Figures E.4-1 through E.4-28 and Figure E.5-4. The hyeto-
graphs for stations DM-1, DM-2, DM-3, and DM-5 are periodic totals of
multiple rainfall events and not individual events. The totals are
shown when they were determined. Hyetographs for DM-4 are actual
hourly totals.
The data shows a typical distribution of rainfall corresponding to
the wet and dry seasons of southwest Florida. Significant rainfall
amounts occurred during the months of June to September. Although much
of this rainfall occurred as isolated thunderstorms over different por-
t i h s of the 51-square mile site, the monthly rainfall totals for
individual stations are in general agreement.
An assessment of long-term rainfall patterns is provided in the
mass balance discussion in Section E.7 and Appendix F.
Revision: 0 Date: 3/5/86

E.5 EVAPOTRANSPIRATION QUANTIFICATION
E.5.1 I n t r o d u c t i o n
Evapot ransp i ra t ion (ET) i s t h e most c r i t i c a l p a r m e t e r o the r than
r a i n f a l l governing t h e water supply p o t e n t i a l o f t h e RMR. Unfortunate-
ly, u n l i k e r a i n f a l l , t h e r e i s no s i t e s p e c i f i c long-term ET data and
t h e paraneter i s d i f f i c u l t t o q u a n t i f y (Shih, 1981). Due t o t h e prob-
lems inherent i n t h e assessment o f ET, a d iscussion o f t h e background
l i t e r a t u r e on ET i s provided as a preface t o t h e d e s c r i p t i o n o f Dames &
Moore's q u a n t i f i c a t i o n e f f o r t s .
E.5.1.1 Terminology
As s ta ted by Tanner (1968), t h e term evaporat ion app l ies p r i m a r i l y
t o t h e t ranspor t o f water vapor from t h e source o f vapo r i za t i on t o t h e
atmosphere. However, w i t h i n t h e scope o f data a c q u i s i t i o n and water
management, t h e phys ica l i m p l i c a t i o n s associated w i t h t h e term can
d i f f e r .
The term evaporat ion possesses some anb igu i t y due t o i t s l ack o f
source s p e c i f i c i t y . This anb igu i t y has lead t o some confus ion i n
terminology. For t h e purpose o f t h i s repo r t , t h e f o l l o w i n g d e f i n i t i o n s
s h a l l be observed. The term evaporat ion i t s e l f w i l l be l i m i t e d t o t h e
vapor i za t i on o f water from an open water sur face d i r e c t l y exposed t o
t h e atmosphere, wh i l e t r a n s p i r a t i o n i s used t o designate t h e vaporiza-
t i o n of water from p l a n t surfaces. Where t h e vapor i za t i on and exchange
o f water from a sur face composed o f vegeta t ive cover and bare s o i l i s
described, t h e c o l l e c t i v e term evapot ransp i ra t ion s h a l l be used.
Two bas ic forms o f evapot ransp i ra t ion are c i t e d i n t h e l i t e r a t u r e .
The f i r s t term. " p o t e n t i a l evapot ransp i ra t ion" i s most comnonly def ined
as, " t h e m o u n t o f water t r a n s p i r e d per u n i t o f t i m e f o r optimum water
supp1.y by a short , green p l a n t stand which has uni form he igh t and which
complete ly covers t h e ground" (Penman, 1956). The study o f p o t e n t i a l
evapot ransp i ra t ion i s an attempt t o s i n g l e ou t the c l i m a t i c f a c t o r s
i n f l u e n c i n g evapotranspi rat ion. By p rov id ing a wel l-watered a c t i v e l y
Revision: 0 Date: 3/5/86

growing p l a n t surface, physiographic and b i o l o g i c a l a f f e c t s remain l ess
complex. The s c i e n t i f i c comnunity i s undecided on a re ference p l a n t
sur face and any values f o r p o t e n t i a l evapot ransp i ra t ion must re fe rence
the growing surface. I n add i t ion , according t o t h e Nat iona l Handbook
o f Recommended Methods f o r Water Data A c q u i s i t i o n (1982) "Po ten t i a l
evapot ransp i ra t ion i s de f ined as t h e r a t e o f water l oss from a wet s o i l
o r well-watered. a c t i v e l y growing vegetat ion, o r as t h e r a t e o f
evaporat ion from a water surface." Consequently, p o t e n t i a l
evapot ransp i ra t ion i s a meteorological q u a n t i t y o n l y app l i cab le f o r t h e
s tud ied cond i t ions .
On t h e other hand, "ac tua l evapotranspi rat ion," w i l l depend on
weather, s o i l , and p l a n t f ac to rs . Evapotranspi rat ion, therefore, can-
no t be determined from weather elements o n l y (De Bruin, 1981). Th is
parameter o f actual evapot ransp i ra t ion combines meteorological
va r i ab les w i t h physiographic va r iab les such as s o i l cond i t ions , p l a n t
water requirements, vegeta t ion s p a t i a1 coverage, so i 1 c h a r a c t e r i s t i c s ,
and water a v a i l a b i l i t y . Thus, i t i s a more accurate eva lua t i on o f
consumptive use o r evapot ransp i ra t ion . Unfor tunate ly , e f f e c t i v e
de terminat ion o f t h i s value requ i res tremendous e f f o r t t o understand
and q u a n t i f y t h e complex i n t e r a c t i o n o f t h e var ious components o f t h e
evapot ransp i ra t ion process.
E.5.1.2 Evapotranspi rat ion Study Purpose
A knowledge o f evapot ransp i ra t ion i s essen t i a l i n p lann ing and
i m p l m e n t i n g water management systems. I n t h e case o f t h e RMR,
evapot ransp i ra t ion has a dual impact. F i r s t , evapot ransp i ra t ion
removes water t h a t may be incorporated i n t o t h e water crop. Secondly,
i t represents t h e water requ i red t o main ta in t h e so i l -water balance.
Poor management o f t h i s so i l -water balance cou ld r e s u l t i n de t r imenta l
a l t e r a t i o n s i n t h e landscape. As a r e s u l t , t h e q u a n t i f i c a t i o n and
understanding o f water-shed consumptive use i s important t o t h e
eva lua t i on o f an a v a i l a b l e water crop.
Revision: 0 Date: 3/5/86

E.5.2 L i t e r a t u r e Review o f Ava i l ab le Methods
The l i t e r a t u r e revealed f o u r ca tegor ies o f methods f o r quan t i f y i ng
evapotranspi rat ion. These are:
Water balance methods
" Energy balance
Mass Transfer
" P r e d i c t i o n Methods
Wi th in each category are vary ing techniques, each w i t h i t s l i m i t a -
t i ons , advantages, and disadvantages. A d e s c r i p t i o n o f t h e f o u r
categor ies i s prov ided i n Sect ions E.5.2.1 - E.5.2.4.
E.5.2.1 Water Balance Methods
Evapotranspirometers/Lysimeters
I f p rope r l y constructed, located, and operated, evapotranspi r -
ometers can prov ide t h e most accurate in fo rmat ion on ac tua l o r
p o t e n t i a l evapot ransp i ra t ion and are t h e o n l y means t o c a l i b r a t e o ther
methods o f measuring o r es t imat ing evapot ransp i ra t ion (Gangopadhyaya
and others. 1966; Harrold, 1966; Tanner, 1967; Blad and Rosenberg,
1975).
According t o t h e Nat iona l Handbook o f Recomnended Methods f o r
Water Data A c q u i s i t i o n (1982), an evapotranspirometer i s an instrument
cons i s t i ng o f a b lock o f s o i l , u s u a l l y p lan ted w i t h some vegetat ion,
and enclosed i n a conta iner which i s o l a t e s i t h y d r o l o g i c a l l y frm i t s
surroundings. I f t h e r e i s p r o v i s i o n f o r drainage o f t h e s o i l water,
one speaks o f l ys imeters ( l i t e r a l l y " leach meters"). I n addi t ion, t h e
d i s t i n c t i o n should be made as t o whether t h e evapotranspirometer
conta ins a d i s tu rbed o r undisturbed s o i l p r o f i l e .
Wei.ghable Lysimeters
These i n s t r m e n t s possess t h e bas ic c h a r a c t e r i s t i c s o f a l l lys im-
e ters , however as t h e term impl ies, t h e e n t i r e apparatus i s weighed.
Revision: 0 Date: 3/5/86

By cont inuous ly weighing t h e s o i l column w i t h i n t h e lys imeter , an
accurate eva lua t ion o f t h e water balance can be determined. Water
f l u c t u a t i o n s w i l l be recorded as changes i n weight from which losses
due t o evapot ransp i ra t ion may be determined. Weighable l ys ime te rs can
be used t o f o l l o w d a i l y , hour ly , o r even more f requent changes i n
evapot ransp i ra t ion . However, as a t t r a c t i v e as these inst ruments may
appear, t hey are very expensive and d i f f i c u l t t o i n s t a l l and
mainta in.
Nonweighable Lysimeters
These instruments make use o f l ys imeter p r i n c i p l e s bu t do no t use
changes i n weight t o determine mois ture changes. Mo is tu re f l u c t u a t i o n s
are determined by mon i to r ing t h e water t a b l e i n t h e l ys ime te r and s o i l
moisture changes i n t h e unsaturated zone. Due t o mois tu re hys te res i s
e f f e c t s and moni to r ing l i m i t a t i o n s they are n o t su i t ed f o r shor t - term
measurements.
According t o t h e Nat iona l Handbook o f Recommended Methods f o r
Water Data A c q u i s i t i o n (1982), i ns t runen ts w i thout drainage o u t l e t s
should be used w i t h a degree o f caut ion. This i s p a r t i c u l a r l y impor-
t a n t when t h e water t a b l e i s mainta ined a t a constant l e v e l . Th is
scenario r e s u l t s i n increased s o i l water s a l i n i t y (Wil l iamson, 1963;
van Hylckama, 1966; Robinson, 1970). I n add i t ion , i n s t a l l a t i o n s
w i thout drainage s u f f e r from atmospheric a f f e c t s r e s u l t i n g i n water-
l e v e l f l u c t u a t i o n s which obscure t h e t r u e losses due t o evapotranspira-
t i o n (Stevenson and van Schaik, 1967; van Hylckama, 1968). Apart from
these shortcomings, nonweighable l ys ime te rs are eas ie r t o i n s t a l l and
mainta in than weighable lysimeters, and combined w i th t h e i r low cost, t hey are an a t t r a c t i v e a l t e r n a t i v e .
Large-Area Water Budget Method
Evapot ransp i ra t ion est imates can be made f o r a 1 arge-area us ing
t h e hydrologic-budget method, a l so r e f e r r e d t o as t h e water budget
E-13 Revision: 0 Date: 3/5/86
.- . ., -. .. .. . - . .. ... . . ~~ -.. ~ -

method. The hydro log ic components may i nc lude p r e c i p i t a t i o n , sur face
runof f , ground water movement, sur face and subsurface storage. The
remainder o f t h i s a lgeb ra i c r e l a t i o n s h i p f o r a g iven pe r iod i s an e s t i -
mate o f evapotranspi rat ion. Es t imat ing evapot ransp i ra t ion f r a n na tura l
watersheds i nvo l ves measuring t h e i n f l o w as p r e c i p i t a t i o n and t h e
ou t f l ow as stream f l o w f o r a number o f years i n o rder t o determine t h e
average annual i n f l o w and ou t f l ow rates. The d i f f e r e n c e between
these two r a t e s i s an est imate o f evapot ransp i ra t ion (Hewlet t and
others, 1969).
To use t h e large-area water budget method f o r t h i s p r o j e c t would
r e q u i r e years o f s i t e s p e c i f i c h i s t o r i c a l data on t h e s i t e o r a p r o j e c t
study pe r iod o f several years. Since n e i t h e r o f these requirements can
be met, t h i s method i s not a p l a u s i b l e a l t e rna t i ve . I n add i t i on ,
a l though such parameters as p r e c i p i t a t i o n and s t rean f l o w may be e a s i l y
determined, values f o r ground water f lows and sur face storage are much
more d i f f i c u l t t o obta in. The permeable s u r f i c i a l sands and l imestone
aqu i fe rs under ly ing t h e RMR transcend s u r f i c i a l drainage d i v i d e s and
have t h e p o t e t i a l f o r t ransmi t l a r g e q u a n t i t i e s o f water underground.
These waters may reappear downstrean, bu t t h e areas or po in t s o f r e -
charge o f a l l t h e underground water cannot be determined, nor can a l l
t h e underground f l o w be accounted f o r w i t h c e r t a i n t y . These unknown
hydro log ic c h a r a c t e r i s t i c s p r o h i b i t t h e use o f t h e la rge-area water
budget re1 a t ionship.
So i l -Mo is tu re Dep le t ion Method
According t o t h e Nat iona l Handbook o f Recomnended Methods f o r
Water Data A c q u i s i t i o n (1982). probably t h e o l d e s t and most commonly
used method o f determin ing evapot ransp i ra t ion i s measurement o f the
change i n so i l -mo is tu re content a t rep resen ta t i ve s i t e s over a per iod
of..,a few days t o several weeks. So i l -mo is tu re dep le t i on approximates
evapot ransp i ra t ion under i d e a l cond i t ions , where r a i n f a1 1 i s est imated
from gage data, t h e water t a b l e i s considerably below t h e r o o t zone.
and the re i s no s i g n i f i c a n t drainage f r a n t h e r o o t zone. Attempts t o
Revision: 0 Date: 3/5/86
measure t h e f l u x o f s o i l water upward o r downward below t h e r o o t zone
a t rep resen ta t i ve s i t e s us ing f l u x meters have n o t been successful .
S i m i l a r l y , at tempts t o est imate t h e upward o r downward movement o f s o i l
water by measuring t h e h y d r a u l i c g rad ien t and c a l c u l a t i n g t h e hyd rau l i c
c o n d u c t i v i t y have n o t been very successful . Also, s o i l moisture may
move upward o r downward due t o t h e thermal and s a l t g rad ien ts which can
in t roduce s i g n i f i c a n t e r r o r .
The inherent phys ica l problems associated w i t h t h i s method, t h e
shal low water t ab les and t h e p e r i o d i c i n t e r a q u i f e r f l u x (Appendix C) made t h i s an unacceptable approach f o r es t ima t ing evapot ransp i ra t ion on
t h e RMR.
E.5.2.2 Energy Balance Method
The energy balance method o f determin ing evapot ransp i ra t ion i s
based on t h e conservat ion o f heat energy. This method requ i res complex
i ns t runen ta t i on and i s o f t e n plagued by maintenance problems wh i l e
v o l m i n o u s records o f da ta must be generated and processed. Only a few
s tud ies have been conducted cont inuous ly f o r more than several days.
The requirements and l i m i t a t i o n s o f t h i s method were unsu i tab le f o r t h e
RMR p r o j e c t .
E.5.2.3 Mass Transfer Methods
Mass t r a n s f e r methods u t i l i z e t h e v e r t i c a l vapor f l u x t o de ter -
mine consunptive use. L i k e t h e energy balance method these methods
r e q u i r e complex i ns t runen ta t i on and o ther needs t h a t a re n o t com-
mensurate w i t h t h e l e v e l o f accuracy requ i red f o r t h i s study.
E.5.2.4 P r e d i c t i o n Methods
Empi r ica l Equations .:,
Nunerous emp i r i ca l equat ions have been developed f o r es t imat ing
p o t e n t i a l evapotranspi rat ion. These equat ions u t i l i z e a i r temperature,
s o l a r r a d i a t i o n , hun id i t y , and wind speed. Also inc luded i n these
empi r ica l equat ions i s a c rop c o e f f i c i e n t c m o n l y r e f e r r e d t o as K.
Revision: 0 Date: 3/5/86

This c o e f f i c i e n t i s exper imenta l l y determined, thereby c a l i b r a t i n g the
empi r ica l r e l a t i o n . Empi r ica l equat ions o f t e n make use o f a v a i l a b l e
c l i m a t o l o g i c a l data, bu t t h e exper imenta l l y determined crop c o e f f i c i e n t
and t h e s i t e - s p e c i f i c environment used t o develop t h e r e l a t i o n severe ly
l i m i t the use o f t h e equat ion i n o the r areas.
Pan Evaporat ion
Pan evaporat ion da ta can prov ide very r e l i a b l e est imates o f
p o t e n t i a l evapotranspi rat ion. However, pan evaporat ion appears t o be
more s e n s i t i v e t o wind cond i t i ons than wel l-watered sho r t grass,
e s p e c i a l l y when r a d i a t i o n l e v e l s are lower (Nat iona l Handbook o f
Recomnended Methods f o r Water Data Acqu is i t ion , 1982). Pan evaporat ion
values have c o e f f i c i e n t s app l ied t o them i n order t o p r e d i c t f u t u r e
losses due t o actual evapotranspi rat ion. These c o e f f i c i e n t s are a
means o f c a l i b r a t i n g pan evaporat ion data t o model losses due t o
seasonal evapotranspi rat ion. These c o e f f i c i e n t s must be der ived from
ac tua l evapot ransp i ra t ion i n fo rma t ion i n order f o r t h e i r a p p l i c a t i o n t o
be meaningful .
E.5.3 RMR Evapotranspirometer Approach
The e v a p o t r a n s p i r ~ e t e r was chosen f o r mon i to r i ng and determining
evapot ransp i ra t ion based on t h e prev ious d iscussion o f a v a i l a b l e
methods. The c r i t e r i a f o r t h i s dec i s ion were as fo l l ows :
c r e d i b i l i t y from t h e s c i e n t i f i c community
p r a c t i c a l cons t ruc t i on and i n s t a l l a t i o n requirements
i n s t r u n e n t a t i on
" maintenance
..., * cos t
The u l t i m a t e goal o f t h i s i n v e s t i g a t i o n i s development o f empi r i -
c a l evapot ransp i ra t ion r e l a t i o n s h i p s f o r RMR i n d i v i d u a l macroscale
Revision: 0 Date: 3/5/86

vege ta t i ve c m u n i t i e s based on seasonal evapotranspirometer and
Nat iona l Weather Serv ice Pan Evaporat ion data.
E.5.3.1 Evapotranspirometer S i t e Se lec t ion St ra tegy
Evapotranspirometers were l oca ted i n t h e t h r e e most d i s t i n c t and
c h a r a c t e r i s t i c vegeta t ive h a b i t a t s found on t h e RMR:
* P ine Flatwood
* Wet1 and
Dry P r a i r i e
The purpose o f l o c a t i n g an i n s t a l l a t i o n i n each o f these h a b i t a t s was
t o incorpora te i n t o t h e analyses t h e a f f e c t s o f va ry ing exposures,
vegetat ion, and s o i l p roper t ies .
E.5.3.2 Evapotranspirometer Construct ion
The t h r e e evapotranspirometers are i d e n t i c a l i n cons t ruc t ion .
Each c y l i n d r i c a l tank i s 6 f e e t i n diameter and 7 f e e t t a l l . The tanks
are sealed a t t h e base and were formed from f i b e r g l a s s b y a l o c a l
f i b e r g l a s s f a b r i c a t o r .
E.5.3.3 Evapotranspirometer I n s t a l 1 a t i o n
The p ine f la twood and d r y p r a i r i e i n s t a l l a t i o n s were i n s t a l l e d
us ing i d e n t i c a l procedures (see Figures E.5-1 and E.5-2). F i r s t , a
convenient and rep resen ta t i ve l o c a t i o n was chosen and v e r i f i e d w i t h t h e
p r o j e c t environmental consul tants. The s o i l was removed by smal l
backhoe i n 1- t o 3- foo t l aye rs c l o s e l y corresponding t o v i s i b l e changes
(e.g., co lor , t e x t u r e ) i n t h e s o i l p r o f i l e . The s o i l s were stock p i l e d
separately, and then covered by f i l t e r f a b r i c t o prevent d ry ing and
any degredat ion o f b i o t a t o the degree possib le. P r i o r t o t h e removal
o f each layer , t h e i n s i t u permeabi l i ty , wet and d r y dens i t ies , and
water content were determined (see Table E.5-1). The base o f each
evapotranspirometer i s loca ted 5 t o 6 f e e t below t h e n a t u r a l ground
sur face.
Revision: 0 Date: 3/5/86

Once t h e tank was i n place, a 4 - inch PVC w e l l was i n s t a l l e d i n s i d e
t h e tank t o mon i to r f u t u r e water t a b l e f l u c t u a t i o n s w i t h i n t h e tank.
An add i t i ona l mon i to r ing w e l l was i n s t a l l e d ou ts ide o f t h e tank t o
determine na tu ra l ground water f l u c t u a t i o n s . Next a 1 - foo t l a y e r o f
gravel was spread around t h e base o f each w e l l and covered w i t h f i l t e r
f a b r i c . Th is gravel l a y e r should prevent c logg ing and enhance seepage
from t h e s o i l column t o t h e w e l l so t h a t water l e v e l f l u c t u a t i o n
response t imes may be shortened. I n addi t ion, because t h e s o i l l a y e r
ad jo in ing t h e gravel l a y e r contained s i g n i f i c a n t amounts o f c l a y w i t h
low permeab i l i t y , gravel columns were placed i n t o t h i s l a y e r t o p rov ide
b e t t e r h y d r a u l i c f l o w between t h e gravel l a y e r and t h e remaining upper
s o i l hor izons.
As each s o i l ho r i zon was replaced t o i t s o r i g i n a l depth, i t was
again tes ted f o r permeab i l i t y , wet and d r y dens i t ies , and water con-
t e n t . These values were compared w i t h e a r l i e r i n s i t u measurements
(see Table E.5-1). S o i l moisture b locks were a l so i n s t a l l e d w i t h i n
each s o i l ho r i zon i n o rder t o mon i to r mo is tu re f l u c t u a t i o n s i n t h e
unsaturated zone. A f t e r t h e s o i l column was completed, vegeta t ion
n a t i v e t o t h e surrounding h a b i t a t was t ransp lan ted both i n s i d e and out -
s ide o f t h e i n s t a l l a t i o n i n order t o homogenize t h e environment
adjacent t o t h e evapotranspirometer.
The procedure used t o i n s t a l l t h e wetland evapotranspirometer
d i f f e r e d s l i g h t l y from t h e prev ious i n s t a l l a t i o n s (see F igu re E.5-3).
Due t o t h e poor foundat ion cond i t i ons encountered w i t h i n t h e wetland,
opera t ion o f t h e backhoe was l i m i t e d and hand i n s t a l l a t i o n was r e -
qui red. I n s t a l l a t i o n d i f f i c u l t i e s combined w i t h problems i n t e s t i n g
t h e i n s i t u s o i l column l e d t o a dec i s ion n o t t o cont inue t e s t i n g
i n d i v i d u a l l aye rs o f t h e s o i l column. I t was a l so found du r ing t h e
excavation, t h a t t h e s o i l column was homogeneous t o a depth o f 6 f e e t
and.extensive t e s t i n g was n o t necessary. I n addi t ion, due t o t h e
p o o r l y dra ined nature o f t h e wetland s o i l s , mo is tu re b locks and an
ex te rna l mon i to r i ng w e l l were omi t ted from t h e i n s t a l l a t i o n .
Revision: 0 Date: 3/5/86

E.5.3.4 Evapotranspirometer P r i n c i p l e s
The p r i n c i p l e o f evapotranspirometer opera t ion i s as fo l l ows : a
rep resen ta t i ve soi 1 column w i t h a c t i v e l y growing vegetat ion i s i s01 ated
from t h e surrounding s o i l . A l l f l u x e s o f water e n t e r i n g o r l eav ing the
system are measured except f o r t h e evapot ransp i ra t ion f l u x . I npu ts t o
t h e system are p r e c i p i t a t i o n and water added by t h e f i e l d techn ic ian t o
main ta in c e r t a i n water t a b l e leve ls . Outputs are evapot ransp i ra t ion
and water removed by t h e f i e l d techn ic ian (Bue l l and Bal lard, 1972).
The change i n water storage i s determined b y measuring t h e changes i n
t h e s o i l column water t a b l e l e v e l and m u l t i p l y i n g t h i s change by t h e
s p e c i f i c y i e l d o f t h e system. The spec i f i c y i e l d o f t h e system ( ) i s
def ined as t h e amount o f water t h a t must be added o r removed t o cause
t h e water t a b l e i n t h e evapotranspirometer t o change 1 f o o t .
Changes i n water storage occur i n t h e s o i l bo th above and below
t h e water t a b l e (Bue l l and Ba l la rd , 1972). F luc tua t i ons below t h e
water t a b l e can be monitored b y a w e l l w i t h i n t h e s o i l column. Mois-
t u r e storage measurement i n t h e unsaturated zone i s more problemat ic .
S o i l moisture b locks were i n s t a l l e d t o va ry ing depths w i t h i n t h e s o i l
column t o measure s o i l moisture. I n t h e study done b y Bue l l and
B a l l a r d (1972) water s torage i n t h e unsaturated zone was no t measured
and assumed t o be zero. According t o t h e Bue l l study, t h e long-term
mean o f t h e water s torage i n t h e unsaturated zone i s a term t h a t i s
smal l compared t o t h e t o t a l evapot ransp i ra t ion o f t h e evapotranspiro-
meter. Although i g n o r i n g t h i s storage may reduce t h e accuracy o f
weekly evapot ransp i ra t ion estimates, t h e e r r o r i n es t ima t ing monthly
evapot ransp i ra t ion w i l l be small. The water budget equat ion f o r t h e
evapotranspirometer becomes:
I n p u t - Output = A Storage Eq. E.5-1
. ( P r e c i p i t a t i o n + Add i t ions) - (Evapot ransp i ra t ion + Removals) = " ,,(A Water Table) Eq. E.5-2
Evapot ransp i ra t ion = P r e c i p i t a t i o n + Add i t ions - em ovals - ,, ( A Water Table) Eq. E.5-3
Revision: 0 Date: 3/5/86

The advantage of the evapotranspirometer approach is that hydro-
logic parameters such as runoff, ground water seepage, and ground water
interflow are eliminated from the water budget of the installation. By isolating the soil column fran the surrounding soil, ground water
fluxes have been eliminated. In addition, the evapotranspirometers
used on the RMR extend approximately 1 foot above the natural ground
surface and capture any water that would normally run off this surface.
Consequently, the evapotranspirometer design prevents runoff and ground
water fluxes that would normally be difficult to measure.
In general, within this isolated environment of the evapotrans-
pirometer all water fluxes can be determined except for the evapotrans-
piration flux. This flux is computed by solving the algebraic
expression relating all of the fluxes.
E.5.3.5 Evapotranspirqeter Monitoring
Monitoring of the evapotranspirometers began in July 1985, and has
been ongoing at weekly and occasionally daily intervals along with
other surface water investigation activities. Data necessary to the
calculation of evapotranspiration from these devices includes inches of
rainfall, and depth to the evapotranspirometer water table. The rain-
fall represents an input while the water table level, when compared to
the previously recorded level, represents the change in soil water
storage.
Water table levels within the pine flatwoods and dry prairie
installations were allowed to fluctuate undisturbed unless ponded
water was present. When water ponded on the surface, it was bailed
from a perforated sump bucket. This outflow was measured, recorded,
and entered into the calculation of evapotranspiration. This procedure
was followed except when the natural water table surrounding a monitor
exceeded the ground surface. In such conditions the water table in the
evapotranspirometer was allowed to break the surface in an attempt to mimic natural conditions. As the natural water table subsided, water
was bailed from the evapotranspirometer. Above ground surf ace water
Revision: 0 Date: 3/5/86

l e v e l s were p e r i o d i c a l l y experienced a t t h e p ine f l a twod moni tor bu t
n o t a t t h e d r y p r a i r i e i n s t a l l a t i o n .
I n con t ras t t o t h e two moni tors discussed above, t h e wetland
evapotranspirometer i s loca ted w i t h i n an area o f ponded water. As a
r e s u l t , t h e mon i to r water l e v e l was kept t o a depth n e a r l y equ iva len t
t o na tu ra l wetland pool depth, prov ided t h i s depth d i d no t exceed t h e
volume l i m i t a t i o n s o f t h e evapotranspirometer. Water was removed or
added as needed and recorded f o r use i n c a l c u l a t i n g
evapotranspi rat ion.
E.5.3.6 Evapotranspirometer I n s t a l l a t i o n De f i c i enc ies
Several problems and concerns have r e s u l t e d from t h i s evapotrans-
p i rometer approach and consequent evapot ransp i ra t ion i nves t i ga t i on .
Drainage
L i t e r a t u r e c i t e d e a r l i e r i n t h i s sec t ion discouraged t h e use o f
evapotranspirometers w i thout drainage. Drainage from t h e tank was
considered dur ing t h e i ncep t i on o f t h e evapotranspirometer design.
However, i t was decided n o t t o p rov ide drainage f o r several reasons.
F i r s t , t h e shal low water t a b l e found on the s i t e , combined w i t h low
topographic r e l i e f reduces t h e n a t u r a l subsurface drainage. This l e d
t o t h e conclus ion t h a t drainage from t h e evapotranspirometer may no t be
s i g n i f i c a n t enough t o warrant measurement. Secondly, i f drainage from
t h e tank was permit ted, i t would be necessary t o determine t h e quant i -
t i e s l eav ing t h e system i n o rder t o l i m i t any confounding e f f e c t s t h i s
v a r i a b l e may induce i n t o t h e water budget computation. During t h e
design o f t h e i n s t a l l a t i o n s , i t was decided t h a t t o p rov ide accurate
drainage mon i to r i ng complicated t h e design and requ i red an e f f o r t no t
commensurate w i t h t h e intended use o f t h e evapotranspirometers.
"
The problems o f increased s a l i n i t y and barometeric e f f e c t s a re
c u r r e n t l y being invest igated, and m i t i g a t i v e measures devised.
Poss ib le measures i nc lude es t imat ing barometr ic a f f e c t s on water l e v e l
Revision: 0 Date: 3/5/86

fluctuations and making allowances for such effects in the evapotrans-
piration calculation. In addition, the tank design provides a method
for flushing or purging the tank of excess salinity. Once the affects
are better evaluated and understood, procedures can be implemented to
mitigate their influence.
Disturbed Soil Column
Each evapotranspirometer was backfilled with a representative but
disturbed soil column. This disturbed soil column is suspected of
adversely affecting the evapotranspiration process within the
evapotranspirometer. The other alternative would have been to excavate
around a monolithic soil column and isolate it hydraulically from the
surrounding soils. The level of effort for such an installation was
not c m e n s u r a t e with the possible benefits that may be derived. Table
E.5-1 displays the in situ and replacement soil characteristics. In
most cases, the replacement parameters approximate the in situ values,
and it is expected that the disturbed soil column will have little
affect on evapotranspiration modeling.
Soil Moisture Storage in the Unsaturated Zone
Soil moisture blocks were installed to evaluate the soil moisture
in the unsaturated zone above the water table within the evapotranspi-
rometer soil column. The data derived from these devices was to be
utilized in the calculation of the global water budget for the evapo-
transpirometer. Unfortunately, the actual data derived from the soil
moisture blocks has been inconclusive.
Reasons for the ineffectiveness of the soil moisture blocks is
two-fold. First, during the course of the field study the gypsum media
blocks surrounding the electronic sensors gradually dissolved. The
sll$htly acidic pH found in the surficial ground water is likely
responsible for this dissolution of the gypsum. This phenomenon is the
probable explanation for the variability of the measured resistances.
In addition, lightning strikes and the associated voltagesurge induced
Revision: 0 Date: 3/5/86

i n t o t h e ground water may have damaged these devices. Although t h e
s o i l mo is tu re f l u c t u a t i o n s i n t h e unsaturated zone have no t been
determined, t h e a n a l y t i c a l methods used t o c a l c u l a t e evapot ransp i ra t ion
reduced t h e importance o f t h i s parameter. (See Sect ion E.5.6 f o r t h i s
a n a l y t i c a l procedure. )
Vegetat ive In f luences
Accord,ing t o H. Riekerk (1982). vegeta t ion cover and i t s stage o f
development are major determinants o f water f l u x e s i n t h e hydro log ic
cyc le . Th is statement addresses two more areas o f unce r ta in t y :
vegeta t ion dens i t y surrounding t h e evapotranspirometer and vegeta t ion
development. Both issues were i d e n t i f i e d e a r l y i n the f a l l o f 1985 as
major concerns.
Impacts t o t h e vegeta t ion i n t h e immediate area o f t h e evapo-
t ranspi rometers were t h e r e s u l t o f cons t ruc t i on a c t i v i t i e s , and even
these areas are recover ing. Fur ther , p l a n t species t h a t were p lan ted
w i t h i n each o f t h e evapotranspirometers, except t h e wetland i n s t a l l a -
t i o n , d i d n o t grow w i t h t h e same v i g o r as t h e surrounding vegetat ion.
I n add i t ion , a f i r e a t DM-2 f u r t h e r degraded t h e cond i t i ons o f t rans -
p lan ted vegetat ion. These s i t u a t i o n s undoubtedly a f fec ted i n i t i a1
evapot ransp i ra t ion est imates from t h e i n s t a l l a t i o n s . As cond i t i ons
improve, however, so w i l l p l a n t v igor .
Recornendat i ons
Such growing pa ins are comnonly experienced w i t h these i n s t a l l a -
t i o n s (Fr i tschen, Personal Comnunication. 1972) and t h e f o l l o w i n g are
recomnendations t o t h e d e f i c i e n c i e s described. Inaccuracies induced by
t h e drainage cond i t i ons w i l l be m i t i g a t e d by p e r i o d i c purg ing o f t h e
tanks and i n v e s t i g a t i o n o f t h e impact o f barometr ic pressure on study
r e s u l t s . S o i l tensiometers w i l l be i n s t a l l e d i n t h e unsaturated zone
and monitored weekly. A d d i t i o n a l vegeta t ion w i l l be t ransp lan ted i n t o
and around t h e monitors.
Revision: 0 Date: 3/5/86

E.5.4 Nat iona l Weather Serv ice Class A Pan Evaporat ion
Measurement o f evaporat ion from pans i s considered one o f t h e
eas ies t and most accurate ways o f es t imat ing evaporat ion from a " f r e e
water surface." The Nat ional Weather Serv ice Class A Pan has been t h e
standard i n t h i s count ry f o r many years (Nat iona l Handbook o f
Recmended Methods f o r Water Data Acqu is i t ion . 1982).
E.5.4.1 Class A Pan P r i n c i p l e s
Evaporat ion est imates obta ined from t h e Class A pan represent
evaporat ion occu r r i ng from a t h i n f r e e water sur face having no heat
storage. I n order t o make these est imates meaningful t o an actual l ake
o r r e s e r v o i r , t hey must be adjusted by a pan c o e f f i c i e n t . Pan
c o e f f i c i e n t s f o r t h e Class A pan have been found t o average about 0.7
on an annual basis, b u t w i l l gene ra l l y va ry from 0.8 t o 0.6. I n some
c l imates o r du r ing c e r t a i n seasons, much l a r g e r v a r i a t i o n s can be
expected (Nat iona l Handbook o f Recmended Methods f o r Water Data
Acqu is i t ion , 1982).
E.5.4.2 Class A Pan Mon i to r i nq
The Class A pan i n s t a l l e d on t h e RMR was monitored on a weekly and
sometimes d a i l y schedule. Data obta ined from t h e i n s t a l l a t i o n inc ludes
t o t a l r a i n f a l l , water sur face l eve l s , maximun, minimum, and present
water temperatures, and wind t o t a l s . A summary o f t h e r e s u l t s from
t h i s da ta i s shown i n F igure E.5-4.
E.5.4.3 Class A Pan Data App l i ca t i on
The da ta c o l l e c t e d from t h e Class A pan has a number o f intended
app l ica t ions . The most obvious a p p l i c a t i o n invo lves t h e es t imat ion o f
evaporat ion losses from a r e s e r v o i r . Secondly, comparing da ta from t h e
t h r e e evapotranspirometers w i t h t h e pan evaporat ion da ta helped develop
pan c o e f f i c i e n t s f o r evapot ransp i ra t ion . These values were used i n t h e
water balance f o r t h e e n t i r e RMR.
Revision: 0 Date: 3/5/86

E.5.5 Lower Myakka Lake Pan Evapot ransp i ra t ion
E.5.5.1 .Lower Myakka Lake Pan P r i n c i p l e s
Although t h e Nat iona l Weather Serv ice Class A Evaporat ion Pan
prov ides an approach t o es t ima t ing losses from a l a k e o r rese rvo i r , i t
does no t model t h e poss ib le consumptive use o f f l o a t i n g vegetat ion.
F l o a t i n g aquat ic weeds such as hyacinths and duckweeds are comnon i n
n a t u r a l water bodies such as Lower Myakka Lake. To q u a n t i f y t h i s
var iable, an evapotranspirometer f i l l e d w i t h l ake water and n a t i v e
vegeta t ion was designed t o f l o a t on t h e lake. I n add i t ion , by l o c a t i n g
t h e evapotranspirometer on t h e lake, c l i m a t i c and physiographic
va r iab les e f f e c t i n g evapot ransp i ra t ion may be more accura te ly modeled.
Data f rom t h i s Dames & Moore sur face water mon i to r i ng s ta t ion , DM-6,
should b e t t e r represent t h e evapot ransp i ra t ion experienced by a l ake o r
r e s e r v o i r .
A water budget r e l a t i o n s h i p , s i m i l a r t o o the r evaporation/evapo-
t r a n s p i r a t i o n i n s t a l l a t i o n s , was used t o determine evapot ransp i ra t ion
losses (see Sect ion E.5-6).
E.5.5.2 Lower Myakka Lake Pan M o n i t o r i n q
The Lower Myakka Lake Evapot ransp i ra t ion Pan a t DM-6 was monitored
on a weekly basis . R a i n f a l l amounts were determined f rom an
All-Weather r a i n gage and represented t h e i n p u t t o t h e system.
P e r i o d i c a l l y water l e v e l and vegeta t ion coverage had t o be manual ly
adjusted. These i npu ts and outputs were recorded and fac to red i n t o t h e water budget r e l a t i o n s h i p .
The f l o a t i n g na ture o f t h e pan made water l e v e l de terminat ion
d i f f i c u l t . I n order t o so lve t h e problem o f an uneven and unstable
water surface, f o u r s t a f f gages were i n s t a l l e d w i t h 90 degree spacings
on t h e per imeter o f t h e pan. The average o f these s t a f f gage values
represented t h e water sur face leve l , and f l u c t u a t i o n s i n t h i s l e v e l
represented t h e change i n storage.
Revision: 0 Date: 3/5/86

Per iod ic h igh lake l e v e l s a lso created moni to r ing d i f f i c u l t i e s .
Problems were th ree- fo ld . F i r s t . h igh lake l e v e l s l i m i t e d s t a t i o n
access. Second, p e r i o d i c h i g h l ake l e v e l s inundated t h e r a i n gage and
confounded subsequent measurements. Third, h i g h 1 ake l e v e l s
corresponded w i t h h i g h pan l e v e l s du r ing increased r a i n f a l l periods.
Although t h e pan f l o a t e d on the lake, i t was found t h a t h igh water
l e v e l s i n the pan r e s u l t e d i n water sp i l l age . As a r e s u l t , a water
budget was p e r i o d i c a l l y unobtainable. Data obtained du r ing these
per iods was omit ted f rom study.
E.5.5.3 Lower Myakka Lake Pan Data
A sumnary o f t h e average monthly evapot ransp i ra t ion r a t e s c a l -
cu la ted f o r t h e Lower Myakka Lake Evapotranspirat ion Pan are shown i n
Table E.5-2. These r a t e s are compared w i t h t h e monthly average evapor-
a t i o n r a t e s obtained from t h e Nat iona l Weather Serv ice Class A Evapora-
t i o n Pan. The t a b l e shows t h a t Class A pan evaporat ion i s s l i g h t l y
g reater than lake evapot ransp i ra t ion i n a l l months but August and
September. However, du r ing these 2 months t h e s t a t i o n was d i f f i c u l t t o
ma in ta in and t h e data obtained du r ing these per iods i s quest ionable.
I n general, t h e average monthly lake evapot ransp i ra t ion r a t e s fo l lowed
a s i m i l a r t rend as t h e Class A pan evaporat ion ra tes . The absolute
values approximated 70 t o 81 percent o f Class A pan evaporation.
E.5.6 Evapotranspirat ion Ca lcu la t i on
D i f f e r e n t c a l c u l a t i o n procedures were u t i l i z e d f o r t h e upland and
wetland/ lake evapotranspirometers. The procedures are discussed
separate ly i n t h e f o l l o w i n g subsections.
Up1 and Evappt rmeters
., A unique method was used t o c a l c u l a t e t h e evapot ransp i ra t ion losses from the d r y p r a i r i e and p ine f la twoods evapotranspirometers.
Th is method was developed t o compensate f o r t h e l a c k o f in format ion
regard ing moisture changes i n t h e unsaturated zone.
Revision: 0 Date: 3/5/86

The method i nvo l ved s c r u t i n i z i n g t h e f i e l d da ta and s e l e c t i n g a
pe r iod o f record when t h e evapotranspirometer ground water began a t an
i n i t i a l l eve l , f luc tua ted , and re turned t o t h e i n i t i a l . l eve l . These
per iods range from a few days t o 10 days. By us ing t h i s approach, any
e r r o r i n es t ima t ing t h e change i n s o i l water storage would be minimized
(see F igure E.5-5). Although moisture losses would s t i l l cont inue from
t h e unsaturated zone, t h e magnitude o f these undetermined losses would
be small compared t o t h e t o t a l evapot ransp i ra t ion losses experienced by
t h e system.
As described e a r l i e r . t h e governing equat ion f o r d r y p r a i r i e and
p ine f la twood l ys ime te rs i s as fo l l ows :
I n p u t - Output = A Storage Eq. E.5-1
( P r e c i p i t a t i o n + Add i t ions) - (Evapot ransp i ra t ion + Removals) = ,(Water Level Change) Eq. E.5-2
Consequently, by c a l c u l a t i n g t h e water budget f o r a pe r iod when
i n i t i a l and f i n a l evapotranspirometer ground water l e v e l s were n e a r l y
equivalent , t h e term (water l e v e l change) i s n e a r l y zero and has very
l i t t l e i n f l u e n c e on t h e water budget c a l c u l a t i o n . The governing equa-
t i o n thus reduces t o :
( P r e c i p i t a t i o n + Add i t ions) - (Evapot ransp i ra t ion + Removals) z 0 Eq. E.5-3
Evapot ransp i ra t ion z P r e c i p i t a t i o n + Add i t i ons - Removals Eq. E.5-4
The parameters i n t h i s f i n a l expression can be e a s i l y determined.
Wetland/Lake Evapotranspirometers
The governing expressions f o r t h e wetland and Lower Myakka Lake
pan evapotranspirometers make use o f t h e sane water budget p r i n c i p l e s
w i t h some minor ref inements. The ref inements i n v o l v e c a l c u l a t i n g t h e
change i n storage f o r t h e system. Un l i ke t h e d r y p r a i r i e and p ine
f lp twood evapotranspirometers, changes i n s torage f o r these i n s t a l l a -
t i o n s i nvo l ved a p h r e a t i c sur face w i thout any overburden s o i l s . An
attempt was made t o c a l c u l a t e a water budget f o r t h e wetland evapo-
t ranspi rometer when water l e v e l s f e l l below t h e s o i l surface, bu t
u n l i k e t h e d r y p r a i r i e and p i n e f la twood evapotranspirometers, t h e
Revision: 0 Date: 3/5/86

u n l i k e t h e d r y p r a i r i e and p i n e f la twood evapotranspirometers, t h e
poor1 y dra ined wet1 and s o i 1s prevented rep resen ta t i ve water l e v e l
f l u c t u a t i o n s . Consequently, t h e da ta presented f o r t h e wetland evapo-
t r a n s p i r m e t e r are f o r per iods when t h e water sur face was above t h e
s o i l column. Changes i n storage f o r t h e wetland and Lower Myakka
Lake evapotranspirometers were ca l cu la ted based on t h e d i f f e r e n c e
between successive water l e v e l s .
Because t h e f r e e water sur face o f t h e wetland and Lower Myakka
Lake evapotranspirometers was vo id o f any overburden s o i l s , t he re was
no need t o m u l t i p l y water l e v e l changes by a s p e c i f i c y i e l d . The
r e s u l t i n g equat ion reduces to :
Evapot ransp i ra t ion = P r e c i p i t a t i o n - (water l e v e l ( i ) - water l e v e l ( i - 1 ) ) Eq. E.5-5
The term "water l e v e l ( i ) " represents t h e unadjusted l e v e l i m -
med ia te ly observed when mon i to r i ng t h e s t a t i o n . The term "water l e v e l
( - 1 ) i s t h e f i n a l adjusted l e v e l f rom t h e preceding s i t e v i s i t . - Water l e v e l s had t o be adjusted p e r i o d i c a l l y t o prevent over f lowing o r
des icca t ion . Th is water budget c a l c u l a t i o n i s i d e n t i c a l t o t h e proce-
dures used t o determine Nat iona l Weather Serv ice Class A Pan
Evaporation.
E.5.7 Evapot ransp i ra t ion Resu l ts
The r e s u l t s conta ined i n t h i s sec t i on represent t h e work done by
t h e Dames 81 Moore study o f t h e RMR and those obta ined by s i m i l a r
evapot ransp i ra t ion s tud ies i n t h e c e n t r a l F l o r i d a region.
E.5.7.1 Wetland Evapot ransp i ra t ion
There i s disagreement w i t h i n t h e s c i e n t i f i c comnunity as t o t h e
I n f l u e n c e o f wetland vegeta t ion on evapot ransp i ra t ion f rom wetlands.
L inacre (1976) discussed t h i s problem f u l l y and concluded t h a t wetland
vegeta t ion reduces evaporat ion i n comparison w i t h t h a t from lakes when
t h e surrounding count ry i s dry; when it i s wet, however. t h e
evaporat ion from wetlands i s approximately s i m i l a r t o t h a t f rom lakes.
Revision: 0 Date: 3/5/86

On t h e o ther hand, several authors have repo r ted t h a t t h e ac tua l
evapot ransp i ra t ion from wetlands exceeds t h a t f rom open water. Brown
(1981) found t h a t a Nat iona l Weather Serv ice Class A Pan c o e f f i c i e n t o f
0.95 had t o be appl ied t o standard pan data i n order t o approximate
consumptive use requirements o f a F l o r i d a f l o o d p l a i n f o r e s t . I n
add i t ion , t h e h igh pan r a t i o f o r t h e f l o o d p l a i n f o r e s t was comparable
t o pan r a t i o s f o r a v a r i e t y o f F l o r i d a marshes where t r a n s p i r a t i o n was
equal t o o r g rea ter than pan evaporat ion d u r i n g t h e summer months.
The data der ived from t h e Dames & Moore study r e f l e c t s t h e
d i scove r ies o f Brown (1981). Wetland evapot ransp i ra t ion da ta and
corresponding Class A pan data are sumnarized i n Table E.5-4. I n
n e a r l y a l l o f t h e corresponding months studied, wetland evapotranspira-
t i o n exceeds t y p i c a l l ake evaporat ion r a t e s
E.5.7.2 Dry P r a i r i e Evapot ransp i ra t ion
D a t h d e r i v e d f rom t h e d r y p r a i r i e evapotranspirometer a t Dames &
Moore sur face water mon i to r i ng s t a t i o n DM-3 i s sumnarized i n Table
E.5-3 and F igure E.5-6. Table E.5-3 compares month ly d r y p r a i r i e
evapot ransp i ra t ion r a t e s w i t h monthly Class A pan evaporat ion r a t e s f o r
t h e s i t e . The comparison shows t h a t d r y p r a i r i e evapot ransp i ra t ion
r a t e s approximate 50 t o 70 percent o f pan evaporat ion. However,
F igure E.5-6 revea ls a s t ronger r e l a t i o n s h i p between Class A pan
evaporat ion c o e f f i c i e n t s and t h e depth t o t h e s o i l column water tab le .
The graph shows t h a t d r y p r a i r i e evapot ransp i ra t ion may be approximated
by a l i n e a r f u n c t i o n o f water t a b l e depth i n terms'of percent o f pan
evaporat ion.
Measured da ta was o n l y a v a i l a b l e t o a depth o f 2.5 f e e t . An
es t imate o f t h e o f ET i s unava i lab le f o r g rea ter depths. However,
several assumptions are possib le. F i r s t , c a p i l l a r y r i s e may be as much
as 6 ~ 6 fee t (Cohman, 1972) i n t h e s i l t y m a t e r i a l cha rac te r i z i ng t h e B
Horizon ( 2 t o 5 f e e t i n depth) o f t h e RMR. Second, t h e supply o f water
t o t h e r o o t zone w i l l remain rough ly constant f o r a water t a b l e depth
from t h e r o o t zone t o t h e depth o f c a p i l l a r y r i s e . Third, t h e zone o f
Revision: 0 Date: 3/5/86

"dense" root concentration extends on an average from 3 to 5 feet below
the ground surface.
Based on the above assumptions, ET may be approximated as being
roughly constant for a depth of water table below ground surface of
from three to 11.5 feet. This approximation allowed the employment of
a constant of 25 percent of pan evaporation for water table depths
below 3 feet. The linear expression for the applied pan coefficient
is:
y = 76.0 - 18.72 X Eq. E.5-6
where:
y = evapotranspiration as percent of pan evaporation X = water table depth.
These results are consistent with literature values that indicate
bare soil evapotranspiration exceeds surface water evaporation
(Thornthwaite, 1939).
As has been noted vegetation cover in the dry prairie evapo-
transpirometer may not be representative of macro-scale site condit-
ions. During initial operation, a significant portion of the
evapotranspiration was likely from bare soil. This data must,
therefore, be used only as a guide.
E.5.7.3 Pine Fl atwood Evapotranspiration
Data obtained from the pine flatwood evapotranspirometer at DM-2
is inconclusive. After completing the water budget calculations and
plotting the data following the procedures used for the dry prairie evapotranspirometer. no conclusive trends emerged as were seen at other
installations.
Two sources of difficulty were identified that may have confounded
thi data. First, the water table exceeded the surface periodicaly in
conjunction natural ponding conditions. Ponded water produces
simultaneously two mechanisms. Free surface water losses occur
simultaneous with subsurface evapotranspireation. Account of both
Revision: 0 Date: 3/5/86

above and below ground change i n storage i s an i n t r a c t a b l e problem. As
a r e s u l t , t h e water-budget f o r t h e evapotranspirometer I s
inaccurate,
Secondly, an in tense f i r e burned through t h e DM-2 s t a t i o n and t h e
area imned ia te ly surrounding t h e p ine f la twood evapotranspirometer.
Although t h e f i r e d i d no t damage t h e i n s t a l l a t i o n and o n l y singed t h e
vegeta t ion w i t h i n t h e evapotranspirometer; i t i s l i k e l y t h a t the
i n f l u e n c e o f t h e heat from t h e f i r e and t h e subsequent damage t o t h e
canopy adjacent t o t h e p ine f la twood evapotranspirometer a f fec ted t h e
data.
Data from t h i s evapotranspirometer i s s t i l l be ing c o l l e c t e d and
t h e ana lys is cont inues. The a f f e c t s from t h e f i r e have d imin ished and
water w i l l no longer be al lowed t o pond on t h e surface. These ac t ions
should make t h e r e s u l t s from t h i s i n s t a l l a t i o n more conclusive.
E .5 .7.4 Lower Myakka Lake Evapot ransp i ra t ion
As s ta ted i n Sect ion E.5.5.3, t h e average month ly l ake
evapot ransp i ra t ion r a t e s approximate 70 t o 8 1 percent o f Class A pan
evaporat ion ra tes . These r e s u l t s are n e i t h e r c o n f i n e d o r d isputed by
t h e a v a i l a b l e l i t e r a t u r e . According t o DeBusk and Ryther (1982), t h e
actual ex ten t t o which water hyacinths increase water l oss i s no t
known, and i s l a r g e l y determined by t h e i n t e r a c t i o n o f meteoro logical
parameters (e.g., maximum temperature and wind v e l o c i t y ) w i t h t h e
phys ica l s t r u c t u r e o f t h e p l a n t canopy. I n add i t ion , Brown (1981)
s ta tes t h a t t h e r e appeared t o be no d i f f e r e n c e between t h e evaporat ion
from t h e duckweed sur face and t h e open water surface. Resu l ts from t h e
water losses experienced by t h e Lower Myakka Lake evapotranspirometer
genera l l y show greater evapot ransp i ra t ion r a t e s than t h a t o f an open
water surface. The magnitude o f t h e e f f e c t s o f f l o a t i n g aquat ic weed
i s , y e t t o be conc lus i ve l y quan t i f i ed .
Revision: 0 Date: 3/5/86

E.6 RUNOFF QUANTIFICATION
E.6.1 Flume Network
F o u r stream l o c a t i o n s were chosen i n o rder t o q u a n t i f y t h e runo f f
c h a r a c t e r i s t i c s o f t h e RMR. F l m e s were i n s t a l l e d a t Dames & Moore
sur face water mon i to r ing s t a t i o n s DM-2, DM-3, and DM-4 t o p rov ide a
f l o w c o n t r o l f o r measuring stream discharge. I n addi t ion, s t a f f gages
were i n s t a l l e d along Deer P r a i r i e Slough.
E.6.2 Discharge Data
I n general, r u n o f f from each o f t h e f o u r gaged streams d i d no t
occur u n t i l August. This was a t t r i b u t e d t o t h e drought cond i t i ons and
depressed ground water l e v e l s throughout t h e s i t e . Stream f l o w ended
a t DM-3 and DM-4 i n October w h i l e water was s t i l l present a t DM-1 and
DM-2, bu t f l ows were n o t d i sce rn ib le .
E.6.2.1 Deer P r a i r i e Slough Discharge/Water Level Data
A cont inuous water l e v e l recorder was i n s t a l l e d a t t h e n o r t h power
l i n e c ross ing o f Deer P r a i r i e Slough i n t h e nor theas tern p a r t o f t h e
s i t e . I n addi t ion, s i x s t a f f gages were i n s t a l l e d t o moni tor t h e
slough water l e v e l s a t weekly i n t e r v a l s . The goal o f these measure-
ments was t o determine t h e discharge parameters f o r t h e slough. How-
ever, due t o t h e drought cond i t i ons experienced du r ing t h i s study,
l i m i t e d measurable f l ows occurred a t t h e n o r t h o r south power l i n e
crossing. As a r e s u l t , discharge r e l a t i o n s h i p s could no t be
establ ished.
R a i n f a l l da ta and Deer P r a i r i e Slough water sur face e l e v a t i o n data
are shown on Figures E.4-1 through E.4-5 and E.6-1. As drought
cond i t i ons diminish, more use fu l da ta should be obta ined from these
i n s t a l l a t i o n s . ....
Revision: 0 Date: 3/5/86

E.6.2.2 DM-2 Discharge Data
A concrete f lume was i n s t a l l e d i n Windy Sawgrass T r a i l t o measure
t h e r u n o f f f rom a 2.28 square m i l e basin. The data from t h i s s t a t i o n
cou ld no t be used t o q u a n t i f y t h e r u n o f f f rom t h i s area. Th is r e s u l t e d
f rom t h e extremely low f l ows t h a t emerged from t h i s basin. Two sources
were c i t e d t h a t cou ld have a f fec ted t h e stream f l o w i n t h i s area.
F i r s t , a f t e r t h e f lume was i n s t a l l e d , an ear then we i r was p laced up-
stream o f t h e f lume a t t h e request o f t h e F l o r i d a Department of En-
vironmental Regulat ion i n o rder t o r e s t o r e t h e n a t u r a l hydroperiod of
t h e upstream wetland system. This we i r undoubtedly r e s t r a i n e d much o f
t h e f l o w t h a t was est imated t o cross t h e flume. Secondly, a c o n t r o l
sec t i on f u r t h e r downstream, beyond t h e stream length surveyed. may have
r e s u l t e d i n back water a f f e c t s a t t h e flume. These back water a f f e c t s
would l i m i t t h e upstream f l ows a t t h e flume. F i n a l l y , these a f f e c t s
may have combined t o l i m i t t h e f l ows across t h e flume, causing t h e
stream t o behave more l i k e a pool .
Al though discharge data cou ld n o t be determined f rom t h i s s ta t i on ,
water l e v e l s i n t h e stream were cont inuous ly measured (see F igure
E.4-6 through E.4-12). I n add i t ion , ground water l e v e l f l u c t u a t i o n s
were determined i n a nearby s u r f i c i a l we l l , BH-2, and p l o t t e d adjacent
t o stream water l e v e l s (see F igure E.4-6 through E.4-12). Th is p l o t
revea ls t h a t water d i d no t appear i n t h e stream u n t i l t h e ground water
t a b l e encroached upon t h e e l e v a t i o n o f t h e stream i n v e r t . Fur ther
ana lys is o f t h e s t r e m and ground water l e v e l s show l i t t l e response
between s t r e m f l u c t u a t i o n s and ground water f l u c t u a t i o n s except when
t h e ground water sur face f a l l s w e l l beneath t h e e l e v a t i o n o f t h e stream
i nve r t . E.6.2.3 DM-3 Discharge Data
... A t rapezo ida l f lume was i n s t a l l e d on Danes & Moore Slough which
d r a i n s a 1.58 square m i l e basin. Un l i ke DM-2, cont inuous discharge
data was produced by t h i s s t a t i o n . The data i s presented i n F igures
E.4-13 t o E.4-19 as r u n o f f hydrographs. Also p l o t t e d adjacent t o t h e
Revision: 0 Date: 3/5/86

r u n o f f hydrograph i s t h e ground water f l u c t u a t i o n s i n t h e s u r f i c i a l
we l l . BH-1, loca ted a t t h e sur face water mon i to r i ng s t a t i o n . L i k e
DM-2, stream f l ows d i d n o t occur u n t i l ground water l e v e l s encroached
upon t h e e l e v a t i o n o f t h e stream i n v e r t . I n add i t ion , stream f l ows
ceased when t h e ground water l e v e l s dropped w e l l beneath t h e stream
i n v e r t . The t o t a l monthly r u n o f f f o r t h e bas in du r ing t h e months o f
August, September. and October were 0.39, 2.23. and 0.03 mgd. respec-
t i v e l y . These a lso correspond t o depths o f 0.030, 0.200, and
0.003 inches o f water spread over t h e e n t i r e basin. This i s contrasted
by t h e 7.95. 9.77. and 1.26 inches o f r a i n f a l l t h a t f e l l over t h i s
bas in dur ing t h e study.
E.6.2.4 DM-4 Discharge Data
Continuous discharge data was a lso obta ined a t t h e t rapezo ida l
f lume loca ted on Blackburn Slough which d r a i n s a 3.88 square m i l e
basin. Th is da ta appears as r u n o f f hydrographs on Figures E.4-20
through E.4-28. Sur f i c i a l w e l l da ta from t h e ROMP19 west wel l , p l o t t e d
adjacent t o t h e hydrographs, shows ground water f l u c t u a t i o n s n o r t h o f
t h e f lume s i t e . Although t h i s w e l l i s some d is tance f rom t h e flume, i t
was t h e nearest w e l l w i t h cont inuous data. Furthermore, c lose examina-
t i o n o f t h e r a i n f a l l events measured a t DM-4 and t h e ground water
f l u c t u a t i o n s a t t h e ROMP19 west w e l l i n d i c a t e a p o s i t i v e c o r r e l a t i o n
between r a i n f a l l event and water t a b l e r i s e .
The discharge and ground water e l e v a t i o n da ta from t h e DM-4
f i g u r e s a l so show a s t rong c o r r e l a t i o n between t h e occurrence o f r u n o f f
and ground water depth. L i k e t h e o the r two s t a t i o n s p rev ious l y c i t e d ,
r u n o f f d i d no t occur u n t i l t h e ground water e l e v a t i o n reached t h e
i n v e r t .... o f t h e stream.
The t o t a l month ly r u n o f f f o r t h e bas in du r ing t h e months o f
August, September, and October were 0.77, 1.54. and 0.02 mgd, respec-
t i v e l y . These a l so correspond t o depths o f 0.029. 0.057, and 0.001
Revision: 0 Date: 3/5/86

inches of water spread over the entire basin. This is contrasted by
the 8.02, 5.86, and 2.70 inches of rainfall that fell over this basin
during the study.
E.6.3 Runoff Quantification Results
The results derived from quantifying the runoff from three typical
basins within the .RMR are sumnarized below:
Runoff does not comnence until the local ground water level
approachs the stream invert elevation.
Runoff ceases as the local ground water level recedes below the
stream invert.
Limited mounts of rainfall actually appear as runoff.
These results imply that much of the rainfall that falls onto the
site initially replenishes subsurface storage deficits and fills sur-
face depressions such as wetlands before appearing as runoff.
E.6.4 Rainfall/Runoff Relationship
Rainfall and runoff data obtained from DM-3 and DM-4 were used to
develop hydrologic parameters to aid in understanding the rainfall and
runoff relationships for the site. Once these relationships were
determined, they were used to extrapolate data for those periods when
instrument failure occurred.
E.6.4.1 Soil Conservation Service Runoff Curve Number. CN
. The Soil Conservation Service (SCS) Runoff Curve Number, CN combines the influences of soil characteristics with land use and
treatment to estimate runoff quantities during varying hydrologic
conditions. The soil classifications most frequently found on the site
aC'e the Adamsville fine sand, Delray fine sand, Imnokalee fine sand,
and Pompano fine sand. These SCS soil classifications all fall under
Revision: 0 Date: 3/5/86

t h e A/D s o i l groups. The AID des ignat ion represents t h e r u n o f f
behavior f o r d r a i nedlundrained cond i t ions .
The range o f CN values assigned t o t h e AID s o i l groups i s 45/89
f o r pasture and wooded land treatments. A va lue o f 45 represents low
r u n o f f r a t e s du r ing dra ined cond i t i ons w h i l e 89 represents h igh r u n o f f
r a t e s du r ing undrained cond i t ions . Drained cond i t i ons e x i s t when t h e
ground water t a b l e i s s i g n i f i c a n t l y below t h e ground surface.
Undrained cond i t i ons e x i s t when t h e ground water t a b l e i s a t o r
s l i g h t l y below t h e surface.
The CN values ca l cu la ted from t h e r u n o f f events monitored by t h e
Dames & Moore sur face water mon i to r i ng s t a t i o n s ranged from 65 t o 86.
These values l i e w i t h i n t h e undrained range o f t h e CN values f o r t h e
AID s o i l groups. This i s expla ined by t h e f a c t t h a t r u n o f f d i d n o t
occur u n t i l t h e ground water t a b l e reached t h e ground sur face o r
undrained cond i t i ons ex is ted.
E.6.4.2 Dimensionless U n i t Hydrograph
Another hyd ro log i c concept used i n t h e RMR sur face water hydro logy
approach was t h e dimensionless u n i t hydrograph. The u n i t hydrograph i s
a t y p i c a l basin hydrograph f o r 1 i nch o f d i r e c t r u n o f f from a storm o f
s p e c i f i e d dura t ion . The dimensionless u n i t hydrograph i s computed from
t h e u n i t hydrograph by d i v i d i n g t h e ord ina tes o f t h e u n i t hydrograph by
t h e peak f l o w and t h e t ime t o t h e peak f low. The dimensionless form
e l im ina tes t h e e f f e c t o f bas in s i z e and much o f t h e e f f e c t o f basin
shape (L ins ley , Kohler, and Paulhus, 1958).
The dimensionless u n i t hydrograph used f o r t h e RBR was averaged
from f o u r r u n o f f events t h a t occurred a t DM-4 and i s shown i n F igu re
E.6-2. I n o rder t o f i l l i n t h e occasional gaps i n t h e r u n o f f hydro-
graph data, t h e ord ina tes o f t h e dimensionless u n i t hydrograph were
m u ? t i p l i e d b y t h e t o t a l r u n o f f and a t ime t o peak f l o w o f 7 hours. The
t o t a l r u n o f f was determined by apply ing a value o f CN t o t h e t o t a l
Revision: 0 Date: 3/5/86

r a i n f a l l . Th is s y n t h e t i c r u n o f f hydrograph was then r e t r o f i t t e d i n t o
t h e actual da ta record.
E.7 MASS BALANCE ANALYSIS
E.7.1 General
The mass balance ana lys is cons is ted o f t h e development o f a mass
balance model and t h e u t i l i z a t i o n o f t h a t model f o r t h e assessment o f
mod i f i ca t i ons t o t h e ground water regime w i t h respect t o t ime under
var ious withdrawal scenarios. The steps invo lved i n t h e ana lys is
cons is ted o f t h e fo l l ow ing :
Model Conceptu l i za t ion (Sect ion E.7.2)
" Data Base Development (Sect ion E.7.3)
Model Calibration/Verification (Sec t ion E.7.4)
Analys is o f S i t e Water Balance (Sect ion E.7.5)
" Analys is o f Various Withdrawal Scenarios (Sect ion E.7.6).
E.7.2 Model Conceptual izat ion
The c o n t r o l l i n g equat ions f o r t h e mass balance ana lys i s are:
Q ( i ) = f [ y ( i ) , eta, r ( i ) a ( i ) ] e t a ( i ) = f [ e t ( i ) , e t ( i - I ) ] e t ( i ) = f [ p c ( i ) , y ( i ) l y ( i ) = f[s, y ( i - 1 ) , r ( i ) . e t a ] a ( i ) = f [ y ( i ) , z ( i ) l
Equation 1 Equation 2 Equation 3 Equation 4 Equation 5
where:
Q ( i ) = r u n o f f i n inches f o r month i y( i ) = water t a b l e depth below t h e sur face i n f e e t a t end o f
month i e t ( i ) = evapot ransp i ra t ion r a t e (inches/month) a t end o f month i
e t a ( i ) = average evapot ransp i ra t ion (inches/month) f o r month ( i ) s = s t o r a t i v i t y ( f e e t o f a v a i l a b l e s torage) / (depth i n f e e t )
p c ( i ) = pan evaporat ion i n inches ..' r ( i ) = r a i n f a l l f o r month i i n inches
a ( i ) = water t a b l e aqu i fe r leakage i n inches f o r month i z ( i ) = Secondary Aqu i fe r po ten t i ome t r i c head f o r month i
The independent va r i ab les i n t h e above equat ions are r a i n f a l l , pan
evaporation, and s t o r a t i v i t y . The equat ions as presented cannot be
Revision: 0 Date: 3/5/86

solved as t h e r e are s i x va r i ab les and f i v e r e l a t i o n s h i p s . Equation 5
cannot be p r a c t i c a l l y solved a n a l y t i c a l l y g iven t h e complex i t ies o f the
a q u i f e r water f l uxes . The s o l u t i o n was accomplished by t a k i n g t h e z ( i )
v a r i a b l e as a constant independent parameter der ived f rom t h e var ious
a q u i f e r pumping and non-pumping scenarios.
The data bases a v a i l a b l e f o r c a l i b r a t i o n and v e r i f i c a t i o n o f a
mass balance model and subsequent ana lys is are:
1 ) 40 years o f r a i n f a l l da ta a t Myakka R ive r S ta te Park
(1944-1985),
2) 4 years o f cont inuous water l e v e l measurements a t SWFWMD Wells
ROMP19ES and ROMP19WS.
3) evapot ransp i ra t ion da ta a t t h e Danes & Moore evapotranspiro-
meter,
4 ) pan evaporat ion da ta a t S t a t i o n DM5.
5) 4 months o f cont inuous RMR s i t e r u n o f f da ta a t DM3 and DM4,
6) reg iona l r u n o f f da ta (1936-1985) on t h e Myakka R ive r a t t h e
USGS Highway 72 gage, and
7) s t o r a t i v i t y da ta from Danes & Moore pump t e s t s and t h e
evapotranspirometer.
E.7.3 Data Base Development
Each o f t h e da ta bases l i s t e d above are discussed separa te ly i n
t h e f o l l o w i n g subsections.
R a i n f a l l a t Myakka R i v e r S ta te Park
The month ly t o t a l s o f r a i n f a l l a t Myakka R ive r S ta te Park are
prov ided .... i n Table E.7-1. A comparison o f 5 months o f a v a i l a b l e synop-
t i c r a i n f a l l da ta a t t h e park and a t gaging s t a t i o n s on t h e RMR i s
prov ided i n Table E.7-2. A t a t ime step o f one month t h e synopt ic
da ta i n d i c a t e s r e l a t i v e u n i f o r m i t y o f r a i n f a l l between t h e park and
Revision: 0 Date: 3/5/86

s t a t i o n s w i t h i n t h e RMR. Th is i s t o be expected al though t h e convec-
t i v e thunderstorms occu r r i ng du r ing t h e h igher r u n o f f months produce
very l o c a l i z e d c e l l s o f in tense r a i n f a l l a c t i v i t y . It i s n o t unusual
t o record very in tense r a i n f a l l s i n one l o c a t i o n w h i l e s imul taneously
reco rd ing l i t t l e o r no r a i n f a l l a t nearby gaging s ta t ions . The pa t -
t e rn , however, i s dampened as t h e t ime step i s increased, e s p e c i a l l y up
t o a pe r iod o f 1 month. Months i n which r a i n f a l l i s e i t h e r unusua l ly
h igh o r unusua l ly low between adjacent r a i n f a l l gaging s t a t i o n s do
occur. The da ta i n Table E.7-2 i n d i c a t e s j u s t such an occurrence f o r
the month o f September i n which r a i n f a l l t o t a l s exceeded 9.5 inches a t
t h e s t a t e park bu t were l ess than 6 inches a t DM4.
The Myakka R ive r S ta te Park r a i n f a l l da ta i s considered an appro-
p r i a t e da ta base f o r a long-term i n d i c a t i o n o f probable monthly r a i n -
f a l l t o t a l s over t h e RMR. It i s recognized however, t h a t month ly
t o t a l s a t t h e Sta te Park may p e r i o d i c a l l y be unrepresentat ive o f t h e
r a i n f a l l t h a t occurred over t h e s i t e ,
Water Level Measurements - SWFWMD S u r f i c i a l Wel ls
Water l e v e l s a t S u r f i c i a l . Secondary, and F l o r i d a n w e l l s on t h e
RMR have been monitored cont inuous ly f o r approximately 4 years. The
wel ls , i n s t a l l e d by SWFWMD as documented i n t h e Geraghty and M i l l e r
r e p o r t (1981). are loca ted as shown on t h e s i t e v i c i n i t y map (F igure
E.7-1). The p l o t of t h e approximate end o f month water l e v e l f o r each
month i n t h e s u r f i c i a l w e l l s and t h e secondary and F l o r i d a n w e l l s a t
bo th t h e western and eas tern s i t e s i s prov ided i n F igures E.7-2 and
E.7-3.
As shown i n the f igures and discussed i n Appendix B, the Surficial Aqui fe r o r water t a b l e a q u i f e r are c l o s e l y c o r r e l a t e d t o t h e po ten t i o -
m e t r i c head i n t h e under ly ing Secondary Aqui fer . A t bo th l oca t i ons
tihad d i f f e r e n t i a l s are genera l l y l e s s than 0.5 f e e t and t h e d i r e c t i o n
o f t h e v e r t i c a l g rad ien t changes over t ime. The v e r t i c a l g rad ien t
tends t o be towards t h e Secondary Aqu i fe r du r ing t h e wet season w i t h
g rad ien t reve rsa l du r ing t h e d r y season. As discussed i n Appendix B
Revision: 0 Date: 3/5/86

t h e low head d i f f e r e n t i a l and t h e r e l a t i v e l y t i g h t c o n f i n i n g l a y e r
between t h e aqu i fe rs leads t o t h e conclus ion t h a t t h e r e i s l i m i t e d
cont inuous recharge o f t h e Secondary Aqu i fe r from t h e s u r f i c i a l .
On a long-term bas i s i t i s probable t h a t t h e r e i s l i t t l e ne t water
f l u x between the aqu i fe rs . Exceptions t o t h i s may occur dur ing ex-
tended drought cond i t i ons i n which e i t h e r : 1) t h e po ten t i ome t r i c
surface o f t h e Secondary Aqu i fe r i s depressed s i g n i f i c a n t l y due t o
pumping o r decreased up-gradient recharge, o r 2) t h e s u r f i c i a l aqu i fe r
i s depressed by ET. Under such condi t ions, s u f f i c i e n t h y d r a u l i c
g rad ien ts may develop t o produce s i g n i f i c a n t aqu i fe r water f l u x .
F igu re E.7-4 prov ides a comparison o f t h e depth o f t h e water t a b l e
a t Wel ls ES and WS. There i s s i g n i f i c a n t v a r i a t i o n o f t h e depth on a
monthly bas is between t h e two s i t e s . The general t rends o f t h e water
t a b l e across t h e s i t e however are comparable. The depth d i f f e rences
are l i k e l y due t o t h e shor t term r a i n f a l l v a r i a t i o n s associated w i t h
l o c a l i z e d in tense thunderstorms and t h e water t a b l e response l a g t o a
r a i n f a l l event.
For u t i l i z a t i o n i n c a l i b r a t i o n o f t h e mass balance model t h e two
sets o f data were averaged t o ob ta in an approximate s i te -w ide water
t a b l e depth below ground sur face du r ing t h e pe r iod o f cont inuous
moni tor ing. The r e s u l t s o f t h e averaging are shown on F igu re E.7-5.
The absence o f s i g n i f i c a n t f l u x between t h e s u r f i c i a l and Second-
a ry Aqu i fe rs i s advantageous w i t h respect t o development o f a p red ic -
t i v e mass balance model. The governing equat ions (Equations 1 through
5) are s u f f i c i e n t o n l y i f an a d d i t i o n a l v a r i a b l e o the r than r a i n f a l l ,
pan evaporation, and s t o r a t i v i t y i s independent. Unfor tunate ly t h e r e
i s no long-term record f o r any o f t h e o the r va r i ab les which could be
used as i n p u t t o t h e model. However, f o r normal cond i t ions , t h e
apparent l ack o f water f l u x between aqu i fe rs a l lows e l i m i n a t i n g t h e
recharge v a r i a b l e "aH and t h e Secondary Aqu i fe r v a r i a b l e z ( i ) .
For w e l l f i e l d opera t iona l scenarios i n v o l v i n g Secondary Aqu i fe r
pumping t h e modeling i s s t i l l complicated. Th is complexi ty was avoided
Revision: 0 Date: 3/5/86

f o r t h e conceptual phase by conse rva t i ve l y assuming t h a t a l l o f t h e
water removed from t h e Secondary Aqu i fe r would be recharged from t h e
Sur f i c i a l Aqu i fe r . Fur ther , f o r simp1 i f i c a t i o n t h e area o f recharge
was assumed t o correspond t o t h e area o f 3.0 f e e t o f drawdown i n t h e
Secondary Aqui fer .
Evapot ransp i ra t ion
D e t a i l s o f t h e evapot ransp i ra t ion (ET) ana lys is and conclus ions
are prov ided i n Sect ion E.5. Based on assessment o f t h e h a b i t a t maps
approximately 30 percent o f t h e RMR i s charac ter ized by wetlands. ET
f rom t h i s p o r t i o n o f t h e s i t e i s assumed t o be best approximated by t h e
da ta obta ined from t h e wetland evapotranspirometer a t S t a t i o n DM2.
The remaining 70 percent o f t h e s i t e i s predominant ly d r y p r a i r i e
and p ine f latwoods. ET r a t e s associated w i t h these h a b i t a t types are
represented bes t by t h e d r y p r a i r i e and p ine f la twood evapotranspirom-
e t e r s a t DM2 and DM3, respec t i ve l y . As discussed i n Sect ion E.5, ET
r a t e s est imated w i t h t h e two upland moni tors must be used w i t h some
degree o f caut ion. The two boxes do p rov ide a s i t e - s p e c i f i c approxi-
mation o f t h e h y d r ~ e t e o r o l o g i c a l cond i t i ons associated w i t h vary ing
h a b i t a t s . Although vegeta t ion cond i t i ons w i t h i n t h e boxes cou ld no t be
s t a b i l i z e d w i t h i n t h e study t ime-frane, t h e da ta i s responsive t o
cover meteorological cond i t ions , and macroscale vapor g rad ien ts t h a t
would be found w i t h i n s i m i l a r h a b i t a t s across t h e s i t e .
The d r y p r a i r i e evapotranspirometer a t DM3 provided t h e most
dependable da ta (see F igu re E.5-6). Measurements i n d i c a t e d a s t rong
c o r r e l a t i o n between evapot ransp i ra t ion and water t a b l e depth. The d r y
p r a i r i e ET depth r e l a t i o n s h i p was u t i l i z e d as be ing a reasonable
approximation o f an average ET r e l a t i o n s h i p f o r t h e RMR. On t h e
microscale, t h e ETIdepth r e l a t i o n s h i p developed as shown on F igu re
E.5;6 w i 11 vary s f g n i f i c a n t l y . However, a microscale i n v e s t i g a t i o n o f
ET would be cos t p r o h i b i t i v e and u n l i k e l y t o improve t h e model
p r e d i c t i v e accuracy t o a degree commensurate with da ta c o l l e c t i o n and
ana lys i s cost .
Revision: 0 Date: 3/5/86

The ET r e l a t i o n s h i p used i n t h e model cons i s t s o f a composite
r e l a t i o n s h i p between t h e wetland and upland r e l a t i o n s h i p s . It i s
assumed t h a t below an average depth o f 1 f o o t below t h e ground sur face
average ET over t h e RMR may be p red i c ted as shown by t h e r e l a t i o n s h i p
on F igu re E.5-6. When t h e water t a b l e i s w i t h i n 1 f o o t o f t h e sur face
i t i s assumed t h a t much h igher ET r a t e s assocated w i t h wetlands i s a
f a c t o r . Above a 1 f o o t depth therefore, ET was weighted between t h e
wetland r a t e and t h e r a t e ca l cu la ted from t h e F igure E.5-6 r e l a t i o n -
ship.
Pan Evaporat ion
The pan evaporat ion da ta c o l l e c t e d a t DM5 i s shown i n F igure
E.5-4. Pan evaporat ion data i s assumed to : 1) represent a composite
i n d i c a t o r o f t h e d r i v i n g mechanisms associated w i t h s o i l / v e g e t a t i o n
vapor t r a n s f e r t o t h e atmosphere, and 2) represent t h e l e a s t v a r i a b l e
on a month ly bas is o f t h e hydrometeorological parameters. Absence o f
long-term humid i t y and wind data i n t h e v i c i n i t y o f t h e RMR i n h i b i t s
v e r i f i c a t i o n o f monthly pan evaport ion v a r i a t i o n from year t o year.
The p r o x i m i t y o f t h e ocean and t h e low degree o f v a r i a t i o n o f t h e
long-term temperature data i n d i c a t e s however t h a t humid i ty i s l i k e l y t o
be r e l a t i v e l y cons is ten t f o r a g iven month from year t o year. Although
t h e consis tency o f t h e wind i n a g iven month from year t o year i s l ess
cer ta in , i t i s one o f t h e l e a s t important va r i ab les d r i v i n g pan
evaporat ion.
The assumption o f r e l a t i v e consis tency i n r e l a t i v e humid i t y
allowed t h e use o f t h e t e n s i t e - s p e c i f i c month ly pan evaporat ion values
as an approximation o f t h e long-term month ly pan evaporat ion. Due t o
t h e a v a i l a b i l i t y o f t h i s data, ET from t h e prev ious step was pu t i n
terms o f percent o f pan evaporat ion. Evapot ransp i ra t ion f o r each month
o f t h e pe r iod o f record was t h e r e f o r e ca l cu la ted as a f u n c t i o n o f
ground water depth and pan evaporat ion (see F igure E.5-6).
Revision: 0 Date: 3/5/86

RMR Runoff
Runoff da ta was a v a i l a b l e f o r 3 months a t DM3 and DM4. The shor t
pe r iod o f record renders t h i s da ta base o f l i m i t e d use f o r c a l i b r a t i o n
and v e r i f i c a t i o n o f t h e mass balance model. I t was u t i l i z e d , as d i s -
cussed i n t h e v e r i f i c a t i o n sec t i on t o assess t h e l i k e l y water f l u x
between t h e aqui fers.
Regional Runoff on Myakka R ive r
Runoff da ta f o r t h e Myakka R ive r i s avai 1 able f o r t h e pe r iod 1936
through 1985. A d e t a i l e d d iscussion o f t h e r u n o f f da ta and i t s
v a r i a b i l i t y i s prov ided i n Appendix F. This da ta s e t was u t i l i z e d i n
t h e ana lys is f o r v e r i f i c a t i o n purposes. Myakka R ive r r u n o f f was
converted t o inches o f r u n o f f per month f o r t h e pe r iod o f synopt ic da ta
w i t h Myakka R ive r S ta te Park r a i n f a l l (1944-1984) record. Myakka R ive r
basin u n i t r u n o f f i s assumed t o be a t l e a s t rep resen ta t i ve o f t h e u n i t
RMR r u n o f f . Runoff f o r t h e Myakka R ive r i s most l i k e l y comparable t o
r u n o f f f rom the s i t e on t ime steps o f 3 o r 4 months. On a monthly
bas i s divergence between s i t e r u n o f f and Myakka R ive r r u n o f f cou ld
p e r i o d i c a l l y be q u i t e h igh due t o t h e v a r i a t i o n i n t ime o f concentra-
t i o n between a 229 square m i l e bas in and t h e smal ler basins on t h e RMR.
I n add i t ion , i t i s expected t h a t r u n o f f f rom t h e RMR basins w i l l tend
t o have h igher peaks per u n i t area than peaks on t h e Myakka R iver .
Th is i s associated w i t h t h e l a r g e r volume o f channel storage ava i l ab le
i n t h e Myakka R ive r bo th from t h e Myakka R i v e r f l o o d p l a i n and Upper and
Lower Myakka Lakes.
S t o r a t i v i t r
Soi 1 s t o r a t i v i t y was taken as an average o f values obta ined from bo th t h e pump t e s t (Appendix B and C ) and measurements from t h e evapo-
t ranspi rometers. Pump t e s t da ta i nd i ca ted values o f between 0.01 and
0.10. The evapotranspirometers i nd i ca ted t h e range cou ld be from 0.03
t o 0.12. An average f o r t h e s i t e o f 0.055 was selected.
Revision: 0 Date: 3/5/86

C a l i b r a t i o n
The model was c a l i b r a t e d against t h e average o f measured water
depth da ta from SWFWMD Wells ROMP19ES and ROMP19WS. The r e s u l t s o f t h e
c a l i b r a t i o n are shown i n F igure E.7-5. The p red i c ted water l e v e l s are
i n reasonable agreement w i t h t h e average o f t h e water l e v e l s measured
a t t h e two ROMP we l l s . I n p a r t i c u l a r , as demonstrated w i t h c o r r e l a t i o n
c o e f f i c i e n t s (Table E.7-3), t h e t rends o f water l e v e l v a r i a t i o n are i n
c lose agreement except f o r t h e w i n t e r o f 1982. The p red i c ted and
measured water t a b l e depths are w i t h i n 1 f o o t f o r 70 percent o f t h e
52 months o f measured water l e v e l data. The remaining 30 percent o f
t h e months were w i t h i n 1.5 f e e t except f o r 2 months when t h e d i f f e r e n c e
exceeded 2 fee t . Al though l a r g e variances do occur, t hey are no t
perpetuated from year t o year. As shown f o r 1982 and 1985, l a r g e
v a r i a t i o n s are fac to red ou t du r ing each wet season and reasonable
c o r r e l a t i o n i s recovered.
It i s l i k e l y t h a t t h e pr imary f o r c i n g f u n c t i o n behind t h e va r ia -
t i o n i n p red i c ted and measured water depth i s t h e v a r i a b i l i t y o f
recharge/discharge between t h e S u r f i c i a l and Secondary Aqui fers. Th i s
v a r i a t i o n i s best seen i n t h e drought pe r iod o f 1984-1985 i n which t h e
measured water l e v e l s are considerably lower than t h e p red i c ted water
l eve l s . I t i s poss ib le t h a t t h i s d i f f e r e n c e represents water l o s s from
t h e S u r f i c i a l Aqu i fe r i n t o t h e Secondary Aqu i fe r du r ing t h e l a t e r p a r t
o f t h e 1984 wet season (see F igu re E.7-3). The general c lose agreement
o f t h e model w i t h measured data (except du r ing extreme drought) i n d i -
cates t h a t t h e movement o f water f o r t h i s conceptual phase can be
p red i c ted w i t h f a i r accuracy w i thou t i n c l u s i o n o f recharge/discharge
between t h e aqu i fe rs .
V e r i f i c a t i o n
Fo l lowing c a l i b r a t i o n , t h e model p r e d i c t i v e c a p a b i l i t i y was
v e r i f i e d b y comparison o f p red i c ted RMR s i t e r u n o f f and measured Myakka
Revision: 0 Date: 3/5/86

Rive r bas in u n i t r uno f f . The r e s u l t s o f t h e comparison are shown i n
F igu re E.7-6.
The comparison between p red i c ted and measured values i s genera l l y
good except f o r p e r i o d i c wet season months i n which p red i c ted values
s i g n i f i c a n t l y exceed t h e measured values. The excep t i ona l l y h igh pre-
d i c t e d runo f f , r e l a t i v e t o measured, i s most pronounced i n t h e years
f o l l o w i n g 1964 i n which t h e r e were e i g h t monthly occurrences. The
v a r i a t i o n between t h e p red i c ted and measured data i s lessened consider-
ab ly when t h e comparison i s on a q u a r t e r l y basis. Th i s i s expla ined by
t h e f a c t t h a t peak monthly r a i n f a l l i n t h e Myakka Basin may be measured
as r u n o f f over a pe r iod o f perhaps several months where as monthly
r a i n f a l l peaks on t h e RMR w i l l be r e f l e c t e d as r u n o f f more r a p i d l y .
Overa l l agreement between p red i c ted and measured i s best f o r t h e
f i r s t 20 years o f t h e pe r iod o f record (1945-1965). Fol lowing 1965
several months o f in tense r a i n f a l l produce y e a r l y p red i c ted r u n o f f
t o t a l s t h a t are i n excess by up t o 20 percent o f measured values. For
t h e o v e r a l l pe r i od o f record t h e p red i c ted r u n o f f i s 15.6 inches. Th is
represents a d i f f e r e n c e o f approximately 8 percent over t h e measured
Myakka R ive r r u n o f f o f 14.4 inches. The p red i c ted r u n o f f and evapo-
t r a n s p i r a t i o n i s shown on Table E.7-4.
The d i f f e r e n c e between p red i c ted and measured values may be a
f u n c t i o n o f one o r more o f t h e f o l l o w i n g fac to rs :
1. Aqui fe r recharge which i s n o t accounted f o r i n t h e model.
2. Actual h igher u n i t r u n o f f w i t h i n t h e RMR than i n t h e bas in as
a whole due t o d i f f e rences i n Myakka system storage.
3. Erroneous es t ima t ion o f ET.
4. Unrepresentat ive r a i n f a l l f rom Myakka R ive r S ta te Park.
5. Er ro rs i n s t o r a t i v i t y . .. .
Revision: 0 Date: 3/5/86

E.7.4 S i t e Water Budget Model Analys is
Two assessments were made w i t h t h e S i t e Water Budget Model (SWBM).
One was an assessment o f representa t ive water t a b l e mod i f i ca t i ons under
d i f f e r e n t withdrawal c r i t e r i a . The second was an assessment o f
a v a i l a b l e f reshwater r u n o f f on a monthly bas is f o r t h e pe r iod o f record
f o r t h e var ious drainage systems o f t he RMR.
The r e s u l t s generated from both assessments must be used w i t h
caut ion. The model p r e d i c t i o n s are l i m i t e d i n tha t : 1) t he model
i t s e l f u t i l i z e s a r e l a t i v e l y simple water budget approach t h a t does not
attempt t o def ine t h e micro-scale v a r i a b i l i t y across t h e RMR, 2) t h e
model may overest imate the volume o f r u n o f f f o r very h igh r a i n f a l l
months, espec ia l l y f o l l o w i n g a drought period, 3) t h e model may
underestimate t h e drop i n t h e water t a b l e fob drought periods, 4) t h e
model assumes a constant recharge r a t e from t h e S u r f i c i a l Aqui fer t o
t h e Secondary. ~-
Despi te t h e above model l i m i t a t i o n s i t does prov ide an i n d i c a t i o n
o f t h e long-term water budget t h a t i s more than s u f f i c i e n t f o r
conceptual p lanning purposes.
The assessments o f water t a b l e v a r i a t i o n under d i f f e r e n t aqu i fe r
pumping scenarios and monthly r u n o f f f o r t h e pe r iod o f record are
discussed separate ly i n t h e f o l l o w i n g subsections.
Water Table V a r i a t i o n Assessment
Water t a b l e v a r i a t i o n s were est imated f o r two pumping scenarios:
1. Secondary Aqu i fe r pumping i n Areas I . 11, and 111 a t the
maximum r a t e t h a t may poss ib l y be sustained wi thout v i o l a t i n g SWFUMD drawdown c r i t e r i a i n t h e Secondary Aqui fer .
2. Secondary Aqu i fe r pumping i n Area I as a supplement f o r
.... s u r f ace r e s e r v o i r storage supply (see Sect ion F.5).
For bo th scenarios simp1 i f y i n g assunptions were made t o a l low
i n v e s t i g a t i o n o f t h e l i k e l y water t a b l e va r ia t i ons . The bas ic assump-
Revision: 0 Date: 3/5/86

t i o n was t h a t leakance from t h e S u r f i c i a l t o t h e Secondary Aquf ie r may
occur a t an average r a t e o f 0.02 inches per day over t h e area o f t h e
w e l l f i e l d . Th i s assumption was based on t h e assessment o f aqu i fe r
c h a r a c t e r i s t i c s presented i n Appendices B and C.
The actual leakance w i l l obv ious ly vary s i g n i f i c a n t l y depending on
ac tua l po ten t iomet r ic head d i f f e r e n t i a l s bo th s p a t i a l l y and temporal ly .
As w i t h t h e o the r assumptions i nvo l ved i n t h e modeling e f f o r t t h e
selected values are be l ieved t o p rov ide a reasonable approximation o f
what may occur under ac tua l pumping cond i t ions .
The r e s u l t s o f t h e water t a b l e v a r i a t i o n ana lys is i s shown i n
F igure E.7-7. As i s t o be expected t h e maximum water t a b l e depressions
are associated w i t h t h e h igher r a t e withdrawals. The maximum pumping
scenario r e s u l t s i n hydroperiod reduct ions o f 1 t o 2 months i n almost
every year. For t h e 20-years o f h i s t o r i c a l record examined (1964-1985)
t h e water t a b l e d i d r e t u r n t o t h e ground sur face every year except f o r
a two year per iod.
U t i l i z a t i o n o f t h e Secondary Aqu i fe r f o r supplemental supply t o
sur face storage r e s u l t e d i n s i g n f i c a n t l y l e s s water t a b l e depressions.
Water t a b l e s were depressed below normal du r ing most d r y seasons b u t
re tu rned t o normal l e v e l s w i t h i n 1 month o f t h e onset o f t h e r a i n y
season.
Runoff Assessment
A sumnary o f t h e r u n o f f assessment i s prov ided i n Tables E.7-5 and
E.7-6 f o r two drainage systems, Deer P r a i r i e Slough and t h e se r ies o f
p a r a l l e l sloughs d r a i n i n g t h e southwest p o r t i o n o f t h e s i t e (F igure
E.2-2). It i s assumed t h a t t h e withdrawal o f sur face water w i l l be
constra ined by t h e same c r i t e r i a app l ied t o wi thdrawals from t h e Myakka
R ive r ( 5 percent) . It i s expected t h a t t h e volume o f withdrawals may
be increased depending on r e g u l a t o r y a t t i t u d e s .
Regardless o f t h e percent withdrawal t h a t w i l l u l t i m a t e l y be
al lowed by SWFWMD, both Deer P r a i r i e and t h e Southwest Sloughs expe r i -
Revision: 0 Date: 3/5/86

ence near zero f l o w f o r an average o f 8 months ou t o f every year. Th is
r e s u l t s i n an average requ i red storage o f approximately 750 acre- feet
f o r every 1 mgd o f supply. Further, extreme low f l ows p e r i o d i c a l l y
occur f o r per iods o f up t o 18 months. This would r e s u l t i n a storage
requirement o f up t o 1750 acre- fee t f o r every 1 mgd o f supply.
With an average zero f l o w pe r iod o f 8 months, an average w i t h -
drawal o f 3 mgd f o r each o f t h e f o u r wet season months i s requ i red f o r
each 1 mgd supply.
S p e c i f i c i m p l i c a t i o n s o f t h e sur face water assessment are pre-
sented i n Sect ion 4.3 o f t h e main repo r t .
Revision: 0 Date: 3/5/86
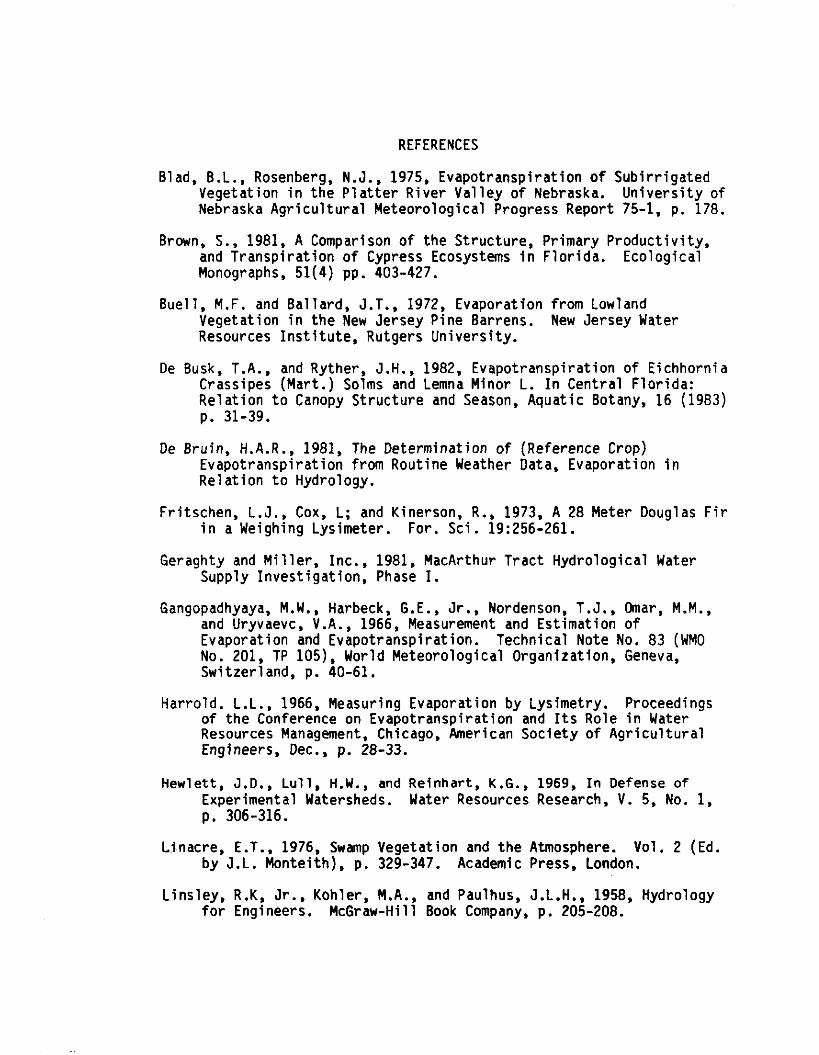
REFERENCES
Blad, B.L., Rosenberg, N.J., 1975, Evapot ransp i ra t ion o f Sub i r r i ga ted Vegetat ion i n t h e P l a t t e r R ive r Va l l ey o f Nebraska. U n i v e r s i t y o f Nebraska A g r i c u l t u r a l Meteoro logical Progress Report 75-1, p. 178.
Brown, S., 1981, A Comparison o f t h e Structure, Primary P r o d u c t i v i t y , and T ransp i ra t i on o f Cypress Ecosystems i n F l o r i d a . Eco log ica l Monographs, 51(4) pp. 403-427.
Buel l , M.F. and Ba l la rd , J.T., 1972, Evaporat ion from Lowland Vegetat ion i n t h e New Jersey P ine Barrens. New Jersey Water Resources I n s t i t u t e , Rutgers Un ive rs i t y .
De Busk, T.A., and Ryther, J.H., 1982, Evapot ransp i ra t ion o f Eichhornia Crassipes (Mart.) Solms and Lemna Minor L. I n Centra l F lo r i da : R e l a t i o n t o Canopy S t ruc tu re and Season, Aquatic Botany, 16 (1983) p. 31-39.
De Bruin, H.A.R.! 1981, The Determinat ion o f (Reference Crop) Evapot ransp i ra t ion from Routine Weather Data. Evaporat ion i n Re la t i on t o Hydrology.
Fr i tschen, L.J., Cox, L; and Kinerson, R., 1973, A 28 Meter Douglas F i r i n a Weighing Lysimeter. For. Sci . 19:256-261.
Geraghty and M i l l e r , Inc., 1981, MacArthur T rac t Hydro log ica l Water Supply Inves t i ga t i on , Phase I.
Gangopadhyaya, M.W., Harbeck, G.E., Jr.. Nordenson, T.J.. (mar, M.M., and Uryvaevc, V.A., 1966, Measurement and Est imat ion o f Evaporat ion and Evapotranspi rat ion. Technical Note No. 83 (WMO No. 201, TP 105), World Meteorological Organizat ion, Geneva, Switzer land, p. 40-61.
Harro ld. L.L., 1966. Measuring Evaporat ion by Lysimetry. Proceedings o f t h e Conference on Evapot ransp i ra t ion and I t s Role i n Water Resources Management, Chicago. American Soc ie t y o f A g r i c u l t u r a l Engineers, Dec., p. 28-33.
Hewlett , J.D., Lull, H.W., and Reinhart , K.G., 1969, I n Defense of Experimental Watersheds. Water Resources Research, V. 5, No. 1. p. 306-316.
L,i.nacre. E.T.. 1976, Swamp Vegetat ion and t h e Atmosphere. Vol. 2 (Ed. b y J.L. Montei th), p . 329-347. Academic Press. London.
L ins ley, R.K, Jr., Kohler, M.A., and Paulhus, J.L.H., 1958, Hydrology f o r Engineers. McGraw-Hi 11 Book Company, p. 205-208.

Lohman, S.W., Ground water hydraul ics, U.S. Geological Survey Prof . Paper 708, 70 pp., 1972.
Nat iona l Handbook o f Recomnended Methods f o r Water Data Acqu is i t ion , 1982.
Penman, H.L., 1956, Est imat ing Evaporation. Tran. h e r . Geophys. Union. Vol. 37, pp. 43-50.
Riekerk, G.H., 1982, Pine Tree Evapotranspi rat ion, F l o r i d a Water Resources Research Center. No. 62.
Robinson, T.W., 1970. Evapot ransp i ra t ion by Woody Phreatophytes i n t h e Humboldt R ive r Va l l ey near Winnemucca, Nevada: U.S.
Shih, S.F.. 1981, Evapot ransp i ra t ion as Related t o C l i m a t i c Fac tors i n South F l o r i d a . F l o r i d a S c i e n t i s t , V. 44, No. 2, p. 109-118.
Stevenson, D.S., and van Schaik, J.C., 1967, Some Re la t i ons Between Changing Barometr ic Pressure and Water Movement i n t o Lysimeters Having Con t ro l l ed Water Tables: Journal o f Hydrology, V. 5, p. 187-196.
Tanner, C.B., 1968, Evaporat ion o f Water From P lan ts and So i l , In : Kozlowski, T.T.. ed., Water Defects and P lan t Growth, V. 1- New York. Academic Press, p. 73-106.
, 1967. Measurement o f Evapotranspi rat ion, I n : Hagan, R.M., Haise, H.R., and Edminster, T.W., eds. I r r i g a t i z o f A g r i c u l t u r a l Lands: No. 11 i n t h e Ser ies on Agronomy, American Soc ie ty o f - . ~
Agronomy, p. 534-574.
Thornthwaite, C.W., and Holman, B., 1939, The Determinat ion o f Evaporat ion from Land and Water Services. Monthly Weather Review.
van Hylekma, T.E.A.. 1966, E f f e c t of S o i l S a l i n i t y on t h e Loss o f Water From Vegetated and Fo l low Soi 1. I n t e r n a t i o n a l Assoc ia t ion o f S c i e n t i f i c Hydrology P u b l i c a t i o n No. 82, Proceedings o f t h e Wageningen Symposium, p. 635-644.
, 1968, Water Level F l u c t u a t i o n i n Evapotranspirometers. Water Resources Research, V. 4, p. 761-766.
.... Visher, F.N. and Hughs, G.H.. 1969. The D i f f e rence Between R a i n f a l l and
P o t e n t i a l Evaporat ion i n F l o r i d a .
Wi l l ianson, R.E.. 1963, The Management of S o i l S a l i n i t y i n Lysimeters. S o i l Science Soc ie ty o f America Proceedings, V. 27, p. 580-583.

TABLE E.4-I
Month - January
February
March
A p r i l
May
June
J u l y
August
September
October
November
December
January
MONTHLY RAINFALL TOTALS AT DAMES & MOORE STATIONS INCHES OF RAINFALL
STATION BELFORT/AW
DM-la - DM-2a DM-3a - - ~ ~ - 4 b - DM-5a OM-6a -
a All-Weather (AM) Rain Gage Measurements: Pe r iod i c t o t a l s o f one o r more r a i n f a l l events. Monthly t o t a l s f o r each inst rument (Bel for t /A l l -Weather) , may not be compared d i r e c t 1 y due t o non-coincident sampling i n t e r v a l s . ND = No da ta ava i lab le .

TABLE E.5-1
EVAPOTRANSPIROMETER SOIL PROPERTIES COMPARISON BEFORE AN0 AFTER INSTALLATION
so i lC S t a t i o n Horizon Measurements: I n Si tu /Repl acement
Wet Water Dry P e r m e a b i l i t y Dens i ty Content Dens i ty
( i n / h r ) ( 1 b / f t 3 ) ( X ) ( l b / f t 3 )
a Beyond measurement range. Not determined. R e f e r t o F i g u r e E.5-1 f o r key t o s o i l hor izons.

TABLE E.5-2
LOWER MYAKKA LAKE EVAPOTRANSPIRATION PAN DATA COMPARISON
National Weather Se r j i ce Class A Pan ( in lday )
August 0.19
September 0.21
October 0.16
November 0.13
December 0.10
January 0.10
February 0.13
bower Myakka Lake Pan
( in lday) a X;b 0.26 136
0.41 195
0.13 81
0.10 7 7
0.08 80
0.07 70
0.10 77
a Evaporation and evapotranspirat ion ra tes i n inches per day. Lake evapotranspirat ion shown as a percent o f pan evaporation

TABLE E.5-3
DRY PRAIRIE EVAPOTRANSPIROMETER DATA COMPARISON
Dry P r a i r i e Evapotranspirometer
Nat iona l Weather S e r i i c e Class A Pan ( i d d a y ) ( i n ~ d a y ) ~
August 0.19 0.12 63
September 0.21
October 0.16
November 0.13 0.09 69
December 0.10 0.06 60
Evaporat ion and evapot ransp i ra t ion r a t e s i n inches per day. Dry P r a i r i e evapot ransp i ra t ion shown as a percent o f pan evaporat ion.

TABLE E.5-4
WETLAND EVAPOTRANSPIROMETER DATA COMPARISON
Wet1 and Evapotranspirometer
Nat iona l Weather Serx ice Class A Pan ( inches) ( inches) a - xb
August 5.95 6.72 113
September 6.53
October 4.60
November 3.67 3.02 82
a Evaporat ion and evapot ransp i ra t ion month ly t o t a l s i n inches. Wetland evapot ransp i ra t ion shown as a percent o f pan evaporat ion.

TABLE E.7-1
R A I N F A L L DATA MYPKKA R I V E R STATE PARK
DATA T O BE P R O V I D E D

February
March A p r i l
May June
Ju ly
August
September
October
November
December
January
TABLE E.7-2
MONTHLY RAINFALL TOTALS AT DAMES & MOORE STATIONS
AW AW AW Belfort lAW AW Myakka DM-1 DM-2 DM-3 - - - DM-4 DM-5 R iver -
* S i g n i f i c a n t (1.10) r a i n f a l l a t end o f month (Hurr icane Elena) **0.47 inches a t end o f month.

TABLE E.7-3
ASSESSMENT OF VARIANCE BETWEEN MEASURED AND PREDICTED WATER LEVELS
Pred ic ted Depth Mean 0.82 1.13 0.88 2.14
Measured Depth Mean 1.58 0.99 0.95 3.47
Standard D e v i a t i o n 0.96 1.30 1 .00 1.77 Pred ic ted Depth
Standard Dev ia t ion 0.92 1 .OO 0.83 1.53 Measured Depth
C o e f f i c i e n t s o f 117.89 115.35 114.20 82.53 Var i a t ion-Predicted Depth
C o e f f i c i e n t s o f 57.94 101.05 87.64 44.08 Var i ation-Measured Depth
Covariance 0.36 1.18 0.63 2.24
C o r r e l a t i o n 0.41 0.90 0.75 0.83 C o e f f i c i e n t
Sum o f Pred ic ted 9.82 13.50 10.53 25.72 Depth
Sum o f Measured 19.00 11.89 11.42 41.60 Depth

TABLE E.7-4
Year - 1944 1945 1946 1947 1948 1949 1950 1951 1952 1953 1954 1955 1956 1957 1958 1959 1960 1961 1962 1963 1964 1965 1966 1967 1968 1969 1970 1971 1972 1913 1974 1975 1976 1977 1978 1979
PREDICTED MONTHLY EVAPOTRANSPIRATION/RUNOfF SURFACE WATER BALANCE MODEL (SWBM)
Page 1 o f 2
R a i n f a l l ( inches)
39.40 50.05 43.72 62.22 46.97 47.20 41.40 56.43 44.28 58.23 60.87 48.96 39.12 72.66 60.91 84.12 64.35 39.60 63.75 49.35 54.63 64.52 47.58 57.30 52.77 61.26 56.46 56.46 49.61 67.26 52.38 53.23 45.83 51.37 55.63 67.76
Evapotranspirat ion ( inches)
36.07 35.44 39.49 40.82 39.24 32.62 36.14 39.89 36.47 45.77 50.70 38.05 31.28 47.94 44.05 53.26 43.93 38.01 37.06 36.69 41.59 40.22 40.83 43.90 33.92 42.72 47.21 32.23 38.68 44.91 35.04 35.97 37.78 38.40 41.35 38.51
Runoff ( inches)
'2.95 14.49
5.05 21.30 8.31
14.36 4.89
15.68 7.81
12.46 10.47 12.34 6.11
24.72 16.86 30.86 21.29 2.60
26.71 13.21 11.91 23.06 6.94
14.73 17.94 17.94 11.43 22.57 10.93 24.57 17.87 14.52 9.56
13.49 14.28 28.75

TABLE E.7-4 (Continued)
Year - R a i n f a l l ( inches)
1980 57.40 1981 66.70 1982 81.07 1983 69.45 1984 61.65 1985 43.26
Evapotransporation ( inches)
41.13 40.68 46.74 43.06 41 -83 33.30
Page 2 o f 2
Runoff ( inches)
16.43 25.55 33.83 26.42 19.60 5.01

TABLE E.7-5
Year - 1944 1945 1946 1947 1948 1949 1950 1951 1952 1953 1954 1955 1956 1957 1958 1959 1960 1961 1962 1963 1964 1965 1966 1967 1968 1969
Nov. - Dec . -
DEER PRAIRIE SLOUGH SUPPLY I N MGD FOR INDICATED MONTH AT 5 PERCENT OF FLOW
Page 1 o f 2
Jan. Feb. Mar. Apr. May - - -

TABLE E.7-5 (Continued) Page 2 o f 2
June July - . Oct. - Year - 1970 1971 1972 1973 1974 1975 1976 1977 1978 1979 1980 1981 1982 1983 1984 1985
Nov. - Jan. - Feb. - Mar. Apr. - 2.11 -- - - - -

TABLE E.7-6
SOUTHWEST DRAINAGE SYSTEMS SUPPLY I N K D FOR INDICATED MONTH AT 5 PERCENT OF FLOW
Page 1 o f 2
Sept. Oct. - - 0.09 0.56 - - 2.63 -- - - 0.56 0.42 - - 1.56 1.35 - - 0.16 1.78 - - 5.39 1.31 - - 0.97 0.31 -- 0.58 0.64 2.84 - - 0.80 2.51
0.73 2.02 0.97 0.25 2.37 -- 0.96 0.05 - - 0.25 2.03 0.59 3.37 3.37 1.09 2.46 - - 1.05 3.54 1.22 1.75 1.00 3.95 -- 0.55 -- - - 3.27 7.92 -- 4.39 0.83 -- 1.59 2.15 - - 4.42 -- 0.53 1.21 -- - - 1.80 2.90 - - - - 0.47 --
1.52 1.62 0.53
Year - 1944 1945 1946 1947 1948 1949 1950 1951 1952 1953 1954 1955 1956 1957 1958 1959 1960 1961 1962 1963 1964 1965 1966 1967 1968 1969
Nov . - Jan. - Feb. Mar. - Apr . - June - 0.52 0.41 1.13 2.50 - -

TABLE E.7-6 (Continued) Page 2 o f 2
Year - 1970 1971 1972 1973 1974 1975 1976 1977 1978 1979 1980 1981 1982 1983 1984 1985
Nov. - Dec . - Jan. - - -
Feb. - Mar. Apr. - 1.10 -- -- -- - - - -
June July & Sept. - -- 0.65 3.40 -- -- 2.24 6.33 1.34
3.69 - - 1.04 - - -- 6.14 1.22 1.15
6.42 1.98 - - - - 0.52 5.33 -- -- 2.52 0.09 0.02 1.87 0.26 1.76 1.86 2.46 1.78 -- 0.91 1.35 -- 0.76 3.81 7.25 -- 0.32 5.10 2.12
3.33 0.83 6.92 0.15 4.32 3.22 3.10 2.98 1.30 2.58 1.07 2.83 - - 4.54 1.01 - - -- 0.92 1.36 0.08
Oct . -

Figure E.2-1. V i c i n i t y Map.

. -
Y C l O i LW
( r u i r n B r U -..r Y *"ti. Y a W I L I1mIYI - -
I,,< -.a,
O.XIIsIF --..-----.
DA*I L YX)I( mcwa rrrwmr 1
(SQUARE MILES) (3.88) DRAINAGE AREA X
D d n ..r - vrr-. - _ - .I_ n -, . -
i
FIGURE E.2-2

Figure E.3-1. Locat ion Map of Water Monitor ing S t a t i o n s

e D A Y S DAMES R MOORE
2.001 SEE NOTE FIGURE E.4-20 R A I N F A L L HYETOGRAPH
lo - - - - GROUNDWATER DEPTH (DATA FROM W E L L ROMP I9 (WEST) NOT AVAILABLE) RUNOFF HYDROGRAPH
STREAM DISCHARGE (NO FLOW)
STATION: DM 4 NO": '85 1
D A Y S FIGURE E.4-27 I

I D A Y S DAMES 8 MOORE 1
1.80 SEE NOTE FIGURE E . 4 - 2 0 R A l N F A L L HYETOGRAPH
2.00 10 - - - - GROUNDWATER DEPTH (DATA FROM W E L L ROMP I9 (WEST) NOT A V A I L A B L E ) RUNOFF HY DROGRAPH
S T R E A M DISCHARGE (NO F L O W )
D A Y S F IGURE E . 4 - 2 8

DAMES €!i MOORE D A Y S -
I 2 3 4 5 6 7 8 9 10 I I 12 13 14 15 16 17 18 19 20 2 1 2 2 2 3 2 4 25 26 27 28 29 3 0 3 1
1-25.64 FEET = STREAM INVERT ELEVATION I
0.00
0 .20 - 2 0.40 -
0.60 U z
0.80
1.00 1
2 1.20 Z - 1.40 a
1.60
1.80
2.00
34.00
- _1 VJ 33.00 2 I
I- U 32.00 W l L d
z 31.00 0 -
DAYS FIGURE E . 4 - 1
STREAM
-- -
- STATION: DM1 AUG'85
35.00 RUNOFF HYDROGRAPH
I I I I I I I I I I I U I
-
-
I I I I
A
U -
-
SEE NOTE FIGURE E . 4 - 6
I I I
2.43" RAINFALL HYETOGRAPH
U
I I I I I I I I I I I

D A Y S DAMES 8 MOORE I
-- STATION: DM1 SEP '85
0.00-
- 0.20
2 0.40 I v 0.60 z z 0.80 = 1.00
2 1.20 z - a 1.40
1.60
1.80
2.00
35.00
34.00
D A Y S FIGURE E . 4 - 2 I
I 2 3 4 5 6 7 8 9 10 I I 12 13 14 15 16 17 18 19 20 2 1 22 2 3 2 4 25 2 6 27 28 29 3 0 I I
! -
-
SEE NOTE f IGURE E . 4 - 6 2.27" RAl NFALL HYETOGRAPH
RUNOFF HYDROGRAPH S T R E A M
- - ~
I I I I I I "
-
I I I I I I I 1 I I I U
i
I I I I I I I I I I
-
-

DAMES 8 MOORE D A Y S
3 5 . 0 0 RUNOFF HY DROGRAPH - STREAM
1.80
- S T A T I O N . DM I OCT. ' 8 5 J cn 33.00 .-
2
--
SEE NOTE FIGURE E . 4 - 6 R A I N F A L L HYETOGRAPH
DAYS FIGURE E . 4 - 3
2.00

- D A Y S
DAMES MOORE
I 2 3 4 5 6 7 8 9 10 I I 12 13 14 15 16 17 18 19 20 2 1 22 2 3 2 4 25 26 27 28 29 3 0 0.00
0.20 - 0.40-
I o 0.60- z = 0.80--
; 1.00- Q LL 1.20- z
-
- - 1.40 Q
1.60-
1.80
2.00
35.00
34 .00
_I cn 33.00 3 I
I- W 32.00 W LL - z 31.00 0 - I-
30.00 W _I W
29.00 W 0 a LL a: 28.00 3 cn
27.00 W I- a 3
26.00
25.00
-- ~ - ~ - ~ - ~ --- ~ - ~ -- . ~~ ~ ~ - ~ ~ ~
~ ~ ~ ~ ~~~~~- ~ ~ ~~ ~ ~ ~~~ . ~ ~- ~ ~ ~ ~ -- --
~~ ~~~p~ ~p~ ~ - - ~~~~~ -- ~~ ~~ ~ ~ ~ ~~ ~ ~
SEE NOTE FIGURE E . 4 - 6 RAl NFALL HYETOGRAPH
- RUNOFF HYDROGRAPH S T R E A M
-. ~- ~-~
S T A T I O N : DM1 NOV. '85 -- - . -. - -~ ~ ~ - - ~~ ~
.- ~~ ~ . --
- - ~ ~~ p- - . .- --- ~ - ~ - ~~-p~~ --
- ~ .~ ~.. .~ ~. ~ -~~ ~ ~ - ~ ~~- -- .~ --
-. ~ ~ ~ ~ ~- - ~ ~. ~- .. -. - -
.- ~ - . ~- - - - . .~ - -- . -- ~ . -- - - /
C --
pp~ .~ ~ ~ -~ ~- -~ -- ~ ~- ~ ~- -- -~ --
I I I I I I I I I I I I I I I I I I I I I I I I I I I I I 2 3 4 5 6 7 8 9 10 I I 12 13 14 15 16 17 18 19 20 2 1 2 2 2 3 24 2 5 2 6 2 7 28 29 30
DAYS
I I I
-~ .~
--
FIGURE E . 4 - 4
. . ~ .~ ~ ~ ~- ~ ~ ~- - ~~ - ~~ ~~-~ ~ ~ ~ - - ~ ~~
.. . ~ --~. .
- ~ ~ ~~ ~~ . ~ ~- . ~ - ~ -~ ~ ~- ~ ~- ~ ~ ~ ~~ - ~ -- ~ ~ ~~ -~ - - . ~ --- ~
..-p -p .~ - ~~ ~ ~~ - ~ - ~ ~ - ~ - ~ ~ - ~ . ~~ ~- ~ ~ ~ ~~~~ ~- . -~ ~
I 1 I I I I I I I I I I I I I I I I u u
--
~- - .. .- .. .. ~ ~ ~- ~ ~ ~ ---- .~
I I I I I 1 I I "
- ~ ~ . ~-

I D A M E S 8 M O O R E
L A Y S I 2 3 4 5 6 7 8 9 10 I I 12 13 14 15 16 17 18 19 20 2 1 2 2 2 3 24 25 26 27 2 8 29 3 0 3 1
0.0 0
0 .20 - - 0.40
-
I " I I I I I I I 1 I 1 I I I I I -- ~~~ ~. ~ . . . -~
~~ ~~~ ~ ~~ ~ - - ~ ~- - ~ ~~ ~ ~ - - -
-~A--~- - . - .. ~ ~~ ~~ ~-~~ -------A------------ ~ ~ ~~ ~~~~ ~-
I I I I I I I I I I I I I U I
~ ~~~ ~ ~ ~~ - - - ~ - . ---- - - ~ ~ ~ ~ ~~~ ~ -- ~- ~ ~ ~- - .~ AP--- ~ .. ~
p-p-P- ~ ~ ~~ . ~
1 0.60 0 7 - = 0.80
1.00 J
2 1.20 Z - 1.40 a
1.60
1.80
2.00
35.00
34 .00 -
- 33.00
z-i I
t- W 32.00 W LL -
3 1 .OO Z 0 - t-
30.00 W -I W
29.00 W U a LI
28.00 3 cn
27.00 W t-
2 26.00
25.00
~~~~ ~ . -- . ---P---- ~ ~~~ ~ ~ - --- ~ . ~. ~ ~ ~ - A ~ - - ~ - ~ - - ~ ~ ~ ~ ~ . ~ ~ ~ ~ - ----- ~~~. ~~ ~~ ~ ~~ ~ - ~- -- ~- ~ ~-~ - - - - - - - - - ~ . ~ -~~
- --- ~ ~~ .. ~ ~ . .~~~~ ~ - ~~ ~~ ~~ - - ~ -- ~~~ ~ ~ ~ ~ ~~ ~~ ~- ~ ~ ~ ~ ~~- ~ ~ ~ ~ ~ - ~ - - ~ A ~ ~~ . ~~~~~~ ~ . . . .. ~ .~ ~ ~ -~
- . . -. .~ --A
~. .. ~ ~~ ~ -~ ~~ ~ ~ .
~ . . - ~ .. ~~ ~~ ~ . . . . . - . .. --- - ~ ~P ~ ~- .. --PA .. .~~
- ~ -~ ~ -...-p-pP--- - ~ - ~ ~ ~ ~ ~ ~ - ~~ ~ .~ ~ - -~ ~ ~ ~ ~ -~A-- ~ ~ ~ ~~ ~ ~~ ~~~ - . ~ -
.- . - .-- -~ .... - . -~ -.----.-A- ~ ~ ~ ~ -~ . ~ ---- ~ ~~ - -~ ~~ ~~~~ -~~~ ~~ ..~ ~
~~ ~ . ~ --- ~ ~.~ - .. -- ~
SEE NOTE F I G U R E E . 4 - 6 R A l NFALL HYETOGRAPH
RUNOFF H Y DROGRAPH - S T R E A M -- - -. ~ -- ~ ~ ~
STATION: DM I DEC. '85
. . -- ~- - ~. ~- -- -p-.p---- ~ ~ ~~
~ ~ -- ~. . P~~--- ~-~ ~ ~~ ~~ ~~~-~
----- . .. .-. . - . - . . -- -.. ~~ ~~~. ~~
.. . . . -- - - .- -. -- -- PA--- ~
.~ - . . . . - ~. ..- -~ -- ~
P- - . . ~~~~~ ~.~ -~ ~~~ ~ .~ . .. -~
- - - . .-. ~ ~- -~ -
I I I I I I I I I I I I I I I I I I I I I I I I I I I I I I
I 2 3 4 5 6 7 8 9 10 I I 12 13 14 15 16 17 18 19 2 0 2 1 2 2 2 3 24 25 26 27 28 29 30 3 1
bAY S F I G U R E E . 4 - 5

D A Y S DAMES R MOORE I
1.80
2.00 NOTE: FOR A L L STATION DM 2 HYETOGRAPHS. R A I N F A L L AMOUNTS ARE PERIODIC TOTALS OF MULTIPLE EVENTS, AND NOT DISCRETE EVENTS. RAINFALL HYETOGRAPH
3 0 . 0 0
STAT ION: DM 2 JUN. '85 -
2'9.00
- J cn 28.00'
- - - GROUNDWATER ELEVATION RUNOFF HYDROGRAPH
S T R E A M W.S. ELEVATION: (NO FLOW)
28.00 FEET = NATURAL GROUND SURFACE ELEVATION
20.0 0 I I I I I I I I I I I I I I I I I I I I I I I I I I I I I I I I 2 3 4 5 6 7 8 9 I 0 I I 12 13 14 15 16 17 18 19 2 0 2 1 2 2 2 3 2 4 2 5 2 6 2 7 28 29 3 0
D A Y S FIGURE E . 4 - 6
z I
L - z 26 .00 O
26.39 FEET = FLUMEISTREAM INVERT ELEVATION I

D A Y S DAMES 8 MOORE I
D A Y S FIGURE E.4-7 I
I 0.00
0.20 - VJ 0.40 W
0.60 0 z
0.80
1.00 1
2 1.20 Z - a 1.40
1.60
1.80
2.00 30.00
29.00
- J V, 28.00 2 I
!- W 27.00 W LL -
2 3 4 5 6 7 8 9 10 I I 12 13 14 15 16 17 18 19 20 2 1 2 2 23 24 25 26 27 2 8 29 3 0 3 1 r I U I U I I I I I I I I
SEE NOTE FIGURE E 4 - 6
1 2.79"
I 4.30" R A l NFALL HYETOGRAPH
--- GROUNDWATER ELEVATION RUNOFF HYDROGRAPH STREAM W.S. ELEVATION
STATION: DM 2 JUL. '85 - -
/----,- - - - - - - - - - - - - - -- - - _ 1 / - - A - - - - - -
---,, - - - - _ / NO FLOW /
h I
4 / / -
I I I I I I I I 1 I I I
1
I I I I I I I I I
U

DAMES 8 MOORE D A Y S
-
2.00 SEE NOTE FIGURE E.4 -6 1 RAINFALL HYETOGRAPH
3 0 . 0 0 - - - GROUNDWATER ELEVATION RUNOFF HYDROGRAPH 1
- I STATION: D M 2 AUG. '85 1 29 .00
20.001 I I I I I I I I I I I I I I I I I I I I I I I I I I I I I I 1 I 2 3 4 5 6 7 8 ' 9 10 I I 12 13 14 15 16 17 18 19 2 0 2 1 2 2 2 3 24 25 26 27 2 8 2 9 3 0 3 1
D A Y S FIGURE E . 4 - 8
STRE AM W.S. ELEVATION I

1.80
2.00 2.22" SEE NOTE FIGURE E.4-6 RAl NFALL HYETOGRAPH
-- - - --
DAYS DAMES & MOORE
0 00 I 2 3 4 5 6 7 8 9 10 I I 12 13 14 15 16 17 18 19 20 2 1 22 23 2 4 25 2 6 27 28 2 9 3 0
30.00 - - - GROUNDWATER ELEVATION RUNOFF HYDROGRAPH
S T R E A M W.S. ELEVATION .-
_ _ - - - - - - _ _ _ _ - - - STAT ION: DM 2 SEP. '85 - - - - - -_ ________ _ - - - - 28.00'- - - -- -- - - - - - - - - - - - - - - - - 27.00
- - _
- 0 20
2 0.40 I o 0 .60 z s 0.80
DAYS
; 1.00
2 1.20 z - a 1.40
1.60
I I I I I
FIGURE E.4-9
I I I
&
I I I I U I I I I I I I I I I I I I I - ,,
I 1 I
-

\ D'AY s DAMES & MOORE
30.00 - - - GROUNDWATER E L E V A T I O N RUNOFF H Y D ROG RAPH - S T R E A M W.S. ELEVAT ION
..- - 7 nn
STATION: D M 2 OCT. '85 1
SEE NOTE F IGURE E.4 -6 R A l N F A L L HYETOGRAPH
20.00 I I I I I I I I I I I I I I I I I I 1 I I I I I I I I I I I I 2 3 4 5 6 7 8 9 10 I I 12 13 14 15 16 17 18 19 20 2 1 22 2 3 24 2 5 26 27 28 2 9 30 3 1
D A Y S F I G U R E E . 4 - I 0

D A Y S t D A M E S 8 MOORE
I 2 3 4 5 6 7 8 9 10 I I 12 13 14 15 16 17 18 19 20 2 1 22 23 2 4 2 5 2 6 27 28 2 9 3 0 O.OO[ n I I I I I I I I I I I I I I I I I I I I I I 11 I I I I I I I I
1.80 SEE NOTE FIGURE E . 4 - 6 R A I N F A L L HYETOGRAPH
2 . 0 0
DAYS
30.00
F I G U R E E.4- l l
2 9 . 0 0
--- GROUNDWATER ELEVATION RUNOFF HYDROGRAPH
S T R E A M W.S. ELEVAT ION
STATION: DM 2 NOV. '85

- - - -- - - -
I D A Y S DAMES & MOORE I
30 .00 --- GROUNDWATER E L E V A T I O N RUNOFF H Y DROG RAPH
1.80
I STREAM W.S. E L E V A T ION 29.00 I
SEE NOTE FIGURE E . 4 - 6 R A l N F A L L HYETOGRAPH
- -- STAT ION: DM 2 DEC. '85 J Cn 28.00 z
2.00
20.00 1 I I I I I I I I I I I I I I I I I I I I I I I I I I I I I I 1 I 2 3 4 5 6 7 8 9 10 I I 12 13 14 15 16 17 18 19 2 0 2 1 2 2 23 24 25 26 27 2 8 29 30 3 1
D A Y S FIGURE E.4- I

D A Y S DAMES 8 MOORE
1.40
1.60- NOTE: FOR A L L STATION DM 3 HYETOGRAPHS. RAINFALL AMOUNTS A R E PERIODIC TOTALS OF M U L T I P L E EVENTS, AND NOT
1.80- D I S C R E T E EVENTS. + 2.22" 2.00 3 . 8 5 " RAl NFALL HYETOGRAPH
- 1 - - - GROUNDWATER DEPTH RUNOFF HYDROGRAPH I S T R E A M DISCHARGE (NO FLOW)
9
STATION: D M 3 JUN. '85 1
f - v,
LL -STREAM INVERT IS 3.5 FEET BELOW NATURAL GROUND SURFACE AT W E L L BH-1
DAYS FIGURE E . 4 - 1 3

D A Y S
- 10 --- GROUNDWATER D E P T H
S T R E A M DISCHARGE (NO FLOW) - 9
1.80
D A M E S & MOORE
SEE NOTE FIGURE E . 4 - 1 3 I -
3 5" R A I N F A L L HYETOGRAPH 2.00 4
RUNOFF HY DROGRAPH
STATION: DM 3 JUL. '85
D A Y S F I G U R E E . 4 - 1 4

D A Y S DAMES & MOORE
- 10 - - - GROUNDWATER DEPTH RUNOFF H Y DROGRAPH
STREAM DISCHARGE
1.80 SEE NOTE FIGURE E.4-13
u- 2.77" R A l NFALL HYETOGRAPH
2.00
2.0 - + L d Ll IL 3.0- - LT Ld
4.0- 4 5 3
5.0- I> 3 LT
'3 6.0- C I-
I I- 7.0- CL W n
8.0
9.0
10.0-
D A Y S FIGURE E.4 -15
- 8
7 - V) L 0 - 6 W w CL: 4 5 I 0 ~3 - 4 n
3
- 2
- I
0
- -
STATION: DM 3 AUG '8 _ _ _ - - - - - - - - - - - - - - - - _ d - - - - -
A / - - - - - - _ _ _ _ _ - - - - - #
\ H - 4 -
I. - - - - - 4 -
\ -,-- ,,,-------- - - - - - - I --
SCS RUNOFF CURVE NUMBER (CN)= 74.6
/ I I I I I I I
I 2 3 4 5 6 7 8 9 10 I I 12 13 14 15 16 17 18 19 2 0 2 1 22 23 24 25 26 27 28 2 9 30 3 1

R'2'>10CFS / --- - .
\ \ RUNOFF HYDROGRAPH
- - - - - S T A T I O N : DM 3 SEP, '85
- -_ - - _ _ _ _ _ _ _ _ _ _ _ _ _ _ _ _ _ _ _ _ - - - - - - - - - - - - - - - - - - - - - - - _ - - - GROUNDWATER DEPTH
- - - - - - - _ _ _ _ STREAM DISCHARGE
DAYS DAMES 8 MOORE
o.oo! 2 3 4 5 6 7 8 9 10 I I 12 13 14 15 16 17 18 19 2 0 2 1 2 2 2 3 2 4 2 5 2 6 27 28 2 9 3 0
\
t 2 ' ~ ~ ~ ~ ~ ~ STAGE HEIGHT EXCEEDS RECORDER RANGE
- 0 . 2 0
2 0.40 I o 0.60 z z 0 . 8 0 . = 1.00
2 1.20 z - a 1.40
1.60-
1.80
2.00
SCS RUNOFF CURVE NUMBER (CN) = 73.5
- I I I I I I I I I I I I I I 1 I I I I I I I I I I I I I I 2 3 4 5 6 7 8 9 10 I I 12 13 14 15 16 17 18 19 2 0 2 1 2 2 2 3 2 4 25 2 6 27 28 29 3 0
DAYS
I I
FIGURE E . 4 - 1 6 I
I
1 I I I I I I I I I U I I I U U
U -
I I I I
4.20" SEE NOTE FIGURE E .4 -13 RAl NFALL HYETOGRAPH
I I I I I I I I I I

D A Y S 9AMES MOORE
1.80
2.00 SEE NOTE FIGURE E . 4 - 1 3 RAl NFALL HYETOGRAPH
10 -- - GROUNDWATER DEPTH RUNOFF HYDROGRAPH
S T R E A M DISCHARGE 9
_ - - - - - - _ STATION: DM 3 OCT '85 - 7 - - 0 - - - - - - _ _ _ - - - - - - - - - - - - / - - -
L L - - - - - - - - - _ _ _ - - - - - - - - - - - _ _ _ _ _ _ - - - - - - - - 0 - 6 - - _ w I
I NO FLOW -
0 I I I 'T I I 1 I I I I I I I I I I I I I I I I I I 1 I b
I 2 3 4 5 6 7 8 9 10 I I 12 13 14 15 16 17 18 19 2 0 2 1 2 2 2 3 2 4 2 5 2 6 27 2 8 2 9 3 0 3 1
D A Y S FIGURE E.4- 17

1 . ~ ~ 1 SEE NOTE FIGURE F 4- 13 3 nn RAINFALL HYETOGRAPH
D A Y S DAMES 8 MOORE I c. SO
2 3 4 5 6 7 8 9 10 I I 12 13 14 15 16 17 18 19 2 0 2 1 2 2 2 3 24 25 2 6 27 28 2 9 3 0
C."", -. . . - J -
10 - - - GROUNDWATER DEPTH RUNOFF HYDROGRAPH
I I S T R E A M DISCHARGE (NO FLOW) I
- 0.20 cn w 0.40 I o 0.60- 2 . z. 0.80-
S T A T ION: D M 3 NOV. ' 8 5 1
- -
I I I
D A Y S FIGURE E.4-18 I
I I I I I I I I I I I U I I I I I I I " " I I I U I I I I I

DAMES & MOORE D A Y S
I 2 3 4 5 6 7 8 9 10 I I 12 13 14 15 16 17 18 19 2 0 2 1 2 2 2 3 2 4 2 5 26 2 7 2 8 2 9 3 0 3 1 O.OO( I U I I I I U I I I I I I I I I I I I I 1 I I I I I I I I I I U I I
1.80 SEE NOTE F IGURE E . 4 - 1 3 R A l NFA LL HY ETOGRAPH
2.00
O.O r 10 - - - GROUNDWATER D E P T H RUNOFF H Y DROGRAPH
STATION: DM 3 DEC. ' 8 5 1 C 1 .o
D A Y S F IGURE E.4- 19 I
S T R E A M DISCHARGE (NO F L O W )

I D A Y S DAMES 8 MOORE
1.80
2.00 N O T E : RA INFALL DATA REPRESENTS DISCRETE E V E N T S MEASURED A T ONE HOUR INCREMENTS R A I N F A L L HYETOGRAPH - - - - - - - - -- - - -
10 - - - GROUNDWATER D E P T H RUNOFF HYDROGRAPH STREAM DISCHARGE (NO FLOW)
1 S T A T I O N : D M 4 APR. '85 I - - S T R E A M INVERT I S 2.6 F E E T BELOW NATURAL GROUND SURFACE A T W E L L ROMP IS (WEST) . - 7 -
m LL
I D A Y S F IGURE E . 4 - 2 0

I DAYS DAMES R MOORE
1.80 SEE NOTE F IGURE E . 4 - 2 0 R A l N F A L L HYETOGRAPH
2.00 10 - - - GROUNDWATER DEPTH RUNOFF HYDROGRAPH
STREAM DISCHARGE (NO FLOW)
STATION; DM 4 MAY '85 I
I D A Y S F I G U R E E.4-21

t
D A Y S DAMES B, MOORE
1.80
2 .00 SEE NOTE FIGURE E . 4 - 2 0 RA l N F A L L HYETOGRAPH
10 --- GROUNDWATER DEPTH RUNOFF HYDROGRAPH STREAM DISCHARGE (NO FLOW)
S T A T ION: DM 4 JUN. ' 8 5 1
D A Y S F IGURE E.4-22 I

D A Y S DAMES & MOORE
'"I - - - GROUNDWATER DEPTH
1.80
7 on
RUNOFF HYDROGRAPH I 'I) RAINFALL AMOUNTS ARE PERIODIC TOTALS OF MULTIPLE EVENTS. BELFORT R A I N GAGE N O T RECORDING DURING T H I S WEEK. SEE NOTE FIGURE E . 4 - 2 0 R A l NFALL HYETOGRAPH
STREAM DISCHARGE (NO FLOW)
9 I STATION: DM 4 JUL. ' 8 5
0 L I I I I I 1 I I I I I I I I I I I I I I I I I I I I I I I 1 1 I 2 3 4 5 6 7 8 9 10 I I 12 13 14 15 16 17 I8 19 2 0 2 1 2 2 23 24 2 5 26 27 28 29 3 0 3 1
D A Y S FIGURE E.4-23

DAYS DAMES 8 MOORE
1.80 SEE NOTE F IGURE E . 4 - 2 0 RA l NFALL HYETOGRAPH
10 - - - GROUNDWATER DEPTH RUNOFF HYDROGRAPH 1
I I STATION: DM 4 AUG. '85 I C 1 .o
DAYS F IGURE E . 4 - 2 4
STREAM DISCHARGE /
/

I - - - -
DAYS FIGURE E.4-25
-.
-
, lO.0- O I I I I I I I 1 2 3
I 4 5
I I I I I I I 6
I 7
I 8 9
2
10 I I I
12 I I I I I I
13 I
14 I
15 I
16 17 I
18 I
19 20 2 1 2 2 2 3 24 25 2 6 27 28 29 30
I 2 3 DAYS DAMES & MOORE
0.00
- 0.20--
2 0.40- I U 0.60- z z 0.80
; 1.00
2 1.20. z - 1.40. a
1.60.
1.80
2.00
4 5 6 7 8 9 10 UI
0.0-
I .0 -
2.0 - W W LL 3.0 - LT W
4 .0 - a 3 n Z 5 . 0 - 3 0 LT 0 6.0- o C , I ' 7 .0 - a W L3
8.0
9.0
i '
10
_ _ _ _ _ _ - - - - - - - - - - _ RUNOFF HYDROGRAPH
9 - - - - _ - - - - - --- GROUNDWATER DEPTH - - - - _ _ _ _ - - - - - - - - - - - - - - - - I - - - - - _
STREAM DISCHARGE - - - _ - - STATION: DM 4 SEP. '85 CN= 73.0 - 8
- - - - - - -- - _ - 7
V) LL 0 - 6
W C3
5
I U
* - 4 n
3 - .
- 2,
I -
I I I
12 I
13 14 15 16 17 18 19 20 2 1 22 2 3 24 2 5 2 6 27 U U' I I I I
28 I J I
29 3 0 I I I I I w I I I I I I I I U t I /
#
- 2 1
SEE NOTE FIGURE E . 4 - 2 0 RAl NFALL HYETOGRAPH

I D A Y S DAMES S MOORE
10- --- GROUNDWATER DEPTH (DATA FROM W E L L ROMP I9 (WEST) NOT AVA ILABLE) RUNOFF H Y D ROG RAPH
STREAM DISCHARGE
1.80
-I - - - - - -
S T A T I O N : DM 4 OCT. '85
8 -
SEE NOTE FIGURE E . 4 - 2 0 R A l N F A L L HYETOGRAPH
9.0 NO FLOW
2.00
I D A Y S F l G U R E E.4-26

Figure E.5-1. DM 3 Dry P r a i r i e Evapotranspirometer Schematic.
t Dames & Moore

D.NS & Moore
I
K E Y :
( 1 ) BLACK-GRAY FINE SAND WITH ORGANICS 0
( 2 ) WHITE FINE SAND
( 3 ) BROWN FINE SAND (SOME S ILT )
( 4 ) MOTTLED GRAY WHITE FINE SAliD (SOME S ILT )
( 5 ) GREEN-GRAY CLAYEY SAND
SOIL MOISTURE BLOCKS BSERVATION WELLS
30.00-
*
28.00
z 2 26.00-
a > W A W
24.00
'.22.00-
-
-
( 1-51 SOIL HORIZONS
7
F i g u r e E.5-2. Pine Flatwood Evapotranspirometer I n s t a l l a t i o n Schematic.
b

r OBSERVATION WELL
HOMOGENOUS
H O R l ZONS
1 CROSS S E C T I O N
21 .w
GROUND
I Figure E.5-3. DM 2 Wetland Evapotranspi rometer I n s t a l l a t i o n Schemati C . I

3 2
3 0
2 8
2 6
2 4
2 2 - 5 2 0 - A I 8
A 16 a L 1 4 Z Q 1.2 IL
10
0.8
0.6
0 4
0 2
0 0
1 .o
0.9
0.8 - 0.7
0 , 5 0 6 - Z 2 0.5 t a g 0.4
a 5 0 3 w Z 0.2 2
0 1
0 0 MAY JUN AUG SEP OCT NOV DEC J A N FEB
100 I ~~ ~ . ~ . . -~ ~~ ~
-~ 1%- t- ~ ~ ~. - ~~ 1 ~- - - ~- s o t - - - o 17 I 1 ! ! k 80: 1 - ..-
0 w I m I IL 10'
1 ti 3 + * I Q 60 ~- ~ -- ~ ~p v
I I = W ' a 50' ---~ I . . . . . . . - . - - - . . - - -- E I c 40-+ . I~~-- ~ ~ ~ - ~ ~ - ~ ~ a ~ 4 - - + + - - ~ . . -. .
+*it ! 3 0 1 : 1 -~ = u n r v r v
~ -~ + W V , " J W I
4 0 ~ -- ~ A - 1 ~ ~ ~ ~
6 ~ 7p~--~-~--~-~ ~~ ~~ ~ ~ ~~ ~~~ ~~~~ ~ ~~ ~ ~ 7~ 7 -- .~ ~- -- I i i !
i ! I i
i ~ - . Z !
! j I .. 0 4 0' . . -
I 19R5 1 9 8 6 I NOTE: ABOVE RESULTS DETERMINED USING DAILY AND WEEKLY MEASUREMENT INTERVALS.
DAMES 8 MOORE
W W LL I V) I
F i g u r e E. 5-4. DM5 N a t i o n a l Weather S e r v i c e Class A E v a p o r a t i o n Pan R e s u l t s .
J . ! i
I ! I
.
D 3 Oi c 1 I $ 2 0 4 IL W z
0 0 1111111111 1
~ i
to------ I
1 1 I I
I
I - -
-
- -
!
i I I L I I -
--
1
- -.
I
I
I I
~
I I !
I

P %
MONITORING WELL
INITIAL CoNDlTloNs n
UNSATURATED
SOlL COLUMN WATER TABLE
INTERMEDIATE INPUTS OUTPUTS-
FINAL CONDITIONS n (A STORAGE
NOTE: 1. I t i s assumed t h a t the unsaturated zone t racks w i t h t h e s o i l column water t ab le .
2. Because the f i n a l c o n d i t i a re equ iva len t t o i n i t i a l cond i t ions t h e change i n s torage i s assumed t o be zero.
= 0 )
Figure E.5-5. Es t imat ion Procedure: Evapot ransp i ra t ion Ca lcu la t ion .
Dames & Moore
v - -
. ,,*.,x,.r\lln
-
- - - - - - - - - - - UNSATURATED
ZONE v .?
SOlL COLUMN WATER TABLE
-
-
.

r
P I m r r
E V A P O T R A N S P I R A T I O N AS PERCENT OF PAN EVAPORATION
0 P - 0
-n 4.
LP C 7 m
m rn I 0,
rn < -
0 w u 0 Ct 7 (U 3 'n
2. 2 2. 0 3 0 c
rn m 0 7 w
-I C
x 'n
0 m
q ;- u rn rt rn a- -I - w !?L (U
rZ 0 s 'n J A.
u w
$ v U 7 0 ?. 2. m
0
- N b,
a 0 0 0 0
I 1 I
. .
-
Z 0 ?I' m . .
m(U 2
I 0 L7 n . m 3 U'O m
- I . ?I'm NTV)
C
I -0 7 o - h m 7 n
I N
w . n V) 67 04
I V) Ct C - h w 3 m
1 u m ** 'n d..
I 0 w 3 <
I . g2.
m - (U
I gz P- I
n m rC -. 0- g !?
8

v
35.00-
3 4 . 0 0 -
3 3 . 0 0 -
3 2 . 0 0 - 0 31.00-
6
30.00- J
29.00- w-I :? Z(1.00-
=t 27.00 z- 26.00-/
W I- 2500-
: 24.00- In
23.00;./' 0
2 2 . 0 0
21 .00- 20.00
- NORT H POWER L I N E CROSSING DPS
--- BELOW CONFLUENCE OF WINDY SAWGRASS TRAIL AND DPS
-.-. SOUTH POWER L I N E CROSSING DPS
(Remaininq dolo not avoilobla) - - - - - - , # -@\ / - - , - \ - - _ - - - - -' - - - - - - - -
1.-. - - - - - - - - - - _---- ,.-.-,,. \.-. -.-. - . - ._.- . -.-.-._.__ -.-. - . - - . - . _ . - . - . - . _ . _ , _ . C . -
I I I
+ AUG - SEP - OCT - NOV DEC JAN d
I 1985 1986
Figure E.6-1. Deer P r a i r i e Slough Water Surface E leva t i on Data Summary.
3
D.nws&lloon

,
. -
RAINFALL EVENT T
k T p 4
0.1 . I
0.0 0 2 4 6 8 10 I2 14 16 18 20
KEY: T / T P ( ~ ) ( I ) T -T IME
Tp=TIME TO PEAK DISCHARGE
(2) Q =DISCHARGE Qp=PEAK DISCHARGE
F igure E.6-2. RMR Dimensionless U n i t Hydrograph.
D.nws&wooN

FIGURE € 7 - 1
ig a I 18 t P : r 8 i I $ ;I ! I i i I! i t !: i i l6 ,
.-a
I I I 5 :, i r :t ! i
-- ~ -- .- . -
r-.% - r . m ~ . - - . -
-~ - . - . -
-- -- .- . --
r . m .- . -
._ - .-
-. . - - . -
._ = ?i. we^-^
- - . - . - I
t i I! I f : I! f I 1. 1. . ! I 1-
i
LEGEND
I E C T O . L L ( W l C l E O
I F C T l h L M I&WII)XI.li
,yllvITcO T Q . N S I or " A C L M -- TO.NIW w I.%i L M . . ~ ~ ~ . ~ ~ ~ ~ ~ ~ ~ ~ ~
I I P m X I I I I I
5 : - 6 ~ A ? I . ! T I E .
smr.cz ..TCF m--& 5.'.,"h ." b 2 hn a*;oaw vr.. r M PE*111'*C I.Y.6
w.- .& b.LL.I.-.. WTU. A W E . C
aurrrr n.: a ..TTR am?,-" I T 1 T D . .
-*.I--- .-..--., - 7 . - - __om
- Y r Y I T M I R RESEWE
SARASOTA COUNTY FLORIDA
DAMES a MOORE m. .% -- --
- - & 1- 1- 1-
SITE FACILITIES MAP
."-- 17-01 -I
- ~ - - - -

Figure E.7-2. ROMP 19E Groundwater Hydrograph.
d k m O S k YO-

Kc:! ; osurf ic ia l Aquifer Water Level Measurement 8Secondary Aquifer Water Level Measurement OFloridan Aquifer Water Level Measurement
Figure E .7 -3 . ROMP 19W Groundwater Hydrograph.
0 D8lnes & Moore

1 1 1 1 1 1 1 1 1 1 1 1 1 1 1 1 1 1 1 1 1 1 l l l l l l l l l l l l l l l l ~ ~ ~ ~ ~ ~ ~ ~ ~ ~ ~ l l J
J A S O N D J F Y A Y J J A S O N D J F Y A Y J J A S O N O J F M A U J J A S O N O J F Y A Y J J A S O
-1981-1982 1983 1 9 8 4 P 1 9 8 S - - - - - r (
Figure E.7-4. Comparison o f Well ES and WS Water Levels w i t h Calculated Levels. I Dums&Yo-

KEY: - CALCULATED WATER LEVEL DEPTH (SWBMI
-- - - AVERAGE W4TER LEVEL DEPTHS ISWFWMO WELLS ES AND WSI
9
.
I I
3 " -a- 0 z a 0 a 0
s 2 - 4 - w 0
Z
'i w 0
-5
-6-
-7
I I - 1 I I I t
I I 'I '4
I L I I I I L I I I i I I I I L L I I I I 1 1 1 1 1 1 1 1 1 1 1 1 1 1 1 ~ ~ ~ ~ ~ ~ ~ ~ ~ ~ ~ 8 ~ 1 1 ~ J A S O N O J F U A U J J A S O N D J F ~ A U J J A S O ~ ~ J F ~ A ~ J J A ~ ~ N D J F ~ A M J J A S D
-1981-1982 1983 1984-1985----4
Figure E.7-5. S i t e Water Budget Model C a l i b r a t i o n (SWBM).
C D.m.8 & Moor.

Page 2 o f 5
- - - - Y E L S Y I E D Y I 1 I I A I I V E I RUNOFF
- S W ~ Y CALCULATED IUWOFF
C l 9 5 9 1960-1961--1962- 1963 d
Figure E. 7-6 (Continued) S i t e Water Budget Model V e r i f i c a t i o n .
1 Dmnos L Yoom J

Page 3 o f
X C " ' .--- Y E & I U I E O YI.lliA R l Y E R RUNOFF
- S W e M C A L C U L l T E O RUNOFF
F igu re E.7-6 (Continued). S i t e Water Budget Model V e r i f i c a t i o n .

Page 4 o f 5 1
I Figure E.7-6 (Continued). S i t e Water Budget Model V e r i f i c a t i o n .

+
Page 5 o f 5
A
Figure E.7-6 (Continued). S i t e Water Budget Model V e r i f i c a t i o n .
4
mmes & Moon
10.0-
9.0
8.0
7.0
LL
$ 6.0- z 3 m rr 5.0- 0 V)
4.0
U t -
3.0
2.0
'L - -- - ;/;:;'::k
-1984-1985-
- -
-
-
-
-
I KEY: - -- - MEASURED MYAKKA RIVER RUNOFF
SWBM CALCULATED RUNOFF

9
Page 1 o f 5
10.- " € 7 '
L O
ao
Y E ~ S U R E D M l A K I 1 I I V E R RUNOFF - - S l B Y C I L C U L I T E D RUNOFF
I L -
I' I,
! I I ,
I ' I \ 1.0 - 1
u 11 u I I 0 .0- Z F ) I 3 C I I
u - - 0
w -
, I I I
F igure E.7-6. S i t e Water Budget Model V e r i f i c a t i o n .
Dames & Moon


1
, i .
I I I , I I
I I
Z I I a a - 1 I I
2 I I W m I1 x I- n W 10- (3
I 2
4
IS
I I I I I I I I I I I - I I
I I
I : I I 1 I I I
- KEY: ! E S T I M A T E D LONG TERM WATER LEVELS ', I
.EPRESENTATIVE WATER LEVEL UNDER SUPPLEMENTAL v
PUMPING SCENARIO 15% AVG/5% M U FROM RIVER 2 of 5 ----- REPRESENT4TIVE WATER LEVEL UNDER CONTINUOUS PUMPING SCENLRIO
::::::::::::::::::::::::::A::: :::::A:::::: :::::::::::::::::! a 1 9 6 9 1970 1971 1972 1973-
F igure E.7-7 (Continued). Representat ive Water Level Changes Under D i f f e r e n t Pumping Scenarios.
, D.WS L m m

I Figure E.7-7 (Continued). Representat ive Water Level Changes Under D i f f e r e n t Pumping Scenarios.
I I I
I 3 . C $ 1 0 1 0 - W I I , I n
I I V
I 2
I
- 1 I I 1 1 1 I 1 L I 1 ; 11
l t t
1 1 I ' , I - l 1 I 1
-ESTIMATED LONG TERM WATER LEVELS I I -. -.- REPRESENTATIVE WATER LEVEL UNDER SUPPLEMENTAL ' I
PUMPING SCENARIO 15% AVG/5% WAX FROM RIVER I
----- 3 Of 5 REPRESENTATIVE WATER LEVEL UNDER CONTINUOUS PUMPING SCENARIO
I B - : : : : : : : ::;::,:::::: : : : : , : : , : : : : : : : : : b : b : : : : : : : : b : , : b : : : : : : : : : b : : 1974 1975 1976 1977 1978 -

- KEI:
-ESTIMATED LONG TERM WATER LEVELS -.----REPRESENTATIVE WATER LEVEL UNDER SUPPLEMENTAL
PUMPING SCENARIO ( 5 % A V G / S % M U FROM RIVER) 40f 5 ------REPRESENTATIVE WATER LEVEL UNDER CONTINUOUS PUMPING SCENARIO
I------ 1979 1980 1 9 8 1 1982 1983 - I Figure E .7 -7 (Continued). Representative Water Level Changes Under D i f fe ren t Pumping Scenarios. J
D8nI.s & Moon

I
0
2
- I- 4 - LL - W 0 u LL a 3 6 - V)
D Z 3 0 a w
8 - 0 J W m I t a W 0 I0
12
14
. I6
r
-
I I
I \
I I \ I \ \
I \I I I
\ I \ I \
\ I
\ \ I ' 4
\ 8 I
\ 1 ' I - \ I ', I
v \ I I I I I I I I I I
- KEY I
I , ESTIMATED LONG TERM WATER LEVEL
' I I I
- REPRESENTATIVE WATER L E V E L I 1 UNDER SUPPLEMENTAL PUMPING I SCENARIO(S% AVG/S% MAX FROM I - RIVER) I ---- REPRESENTATIVE WATER L E V E L 1 I UNDER CONTINUOUS PUMPING SCENARIO
I I I 1 J 5 o f 5
I I 1 l l l I I I I I I I I I I I I I I I J J F Y A M J J A S O N D J F M A M J J A S D
-1984 1985-
r F igu re E.7-7 (Continued). Representat ive Water Level Changes Under
D i f f e ren t P u m p i n g Scenarios.
b

APPENDIX F
MYAKKA RIVER SUPPLY ANALYSIS

APPENDIX F
MYAKKA R I V E R SUPPLY ANALYSIS
F . l INTRODUCTION ..................................... F.2 R I V E R REGIME DESCRIPTION .........................
...................................... F.2.1 General .......... F.2.2 Flow V a r i a t i o n w i t h Respect t o Time
F.3 SYNTHETIC STREAM FLOW SUPPLY/STORAGE ANALYSIS ....... .................................. F.3.1 Methodology ........... F.3.2 Syntheth ic Stream Flow Time Ser ies ....................... F.3.3 Withdrawal Cons t ra in ts
F.3.4 Y i e l d vs . Storage/Maximum Percent R i ve r ................................... Withdrawal
F.4 MASS CURVE ANALYSIS ................................. .................................. F . 4.1 Methodology ....................... F.4.2 Withdrawal Cons t ra in ts
F.4.3 Representat ive S imu la t ion .................... F.5 SUPPLEMENTAL SUPPLY ALTERNATIVES ....................
....................... F.5.1 Assessment Methodology ................ F.5.2 Supplemental Storage Ana lys is F.5.3 S imu la t ions o f Reservoi r Operat ion w i t h ......................... Supplemental Storage

APPENDIX F L I S T OF TABLE
T a b l e - MYAKKA R IVER RUNOFF/RAINFALL S T A T I S T I C A L COMPARISON (YEARLY)
MYAKKA R IVER RUNOFF/RAINFALL S T A T I S T I C A L COMPARISON (JUNE)
MYAKKA R IVER RUNOFF/RAINFALL S T A T I S T I C A L COMPARISON (SEPTEMBER)
LATE SPRING RAINFALL/RUNOFF S T A T I S T I C A L COMPARISON
SUMMER RAINFALL/RUNOFF S T A T I S T I C A L COMPARISON
DEMAND VARIAT ION BY MONTH
MYAKKA R IVER MINIMUM FLOW C R I T E R I A CALCULATION MONTHLY MEAN STREAMFLOW DATA ( c f s )
MONTHLY NET R A I N F A L L
YEARLY STORAGE REQUIREMENTS, 5 PERCENT AVERAGE/ 5 PERCENT MAXIMUM WITHDRAWALS
EXAMPLE OF CARRY-OVER STORAGE
TOTAL REMAINING W I T H I N YEAR REQUIRED STORAGE SUPPLY DEMAND = 8 MGO
YEARLY RESERVOIR STORAGE, 5 PERCENT AVERAGE/ 5 PERCENT MAXIMUM WITHDRAWAL C R I T E R I A WITH SUPLEMENTAL SUPPLY
YEARLY SUMMARY OF R IVER WITHDRAWALS, WITHDRAWAL C R I T E R I A 5 PERCENT AVERAGE/5 PERCENT MAXIMUM ( W I T H SUPPLEMENTAL SUPPLY)
AVERAGE PERCENT WITHDRAWAL BY MONTH 5 PERCENT AVERAGE/ 5 PERCENT MAXIMUM WITHDRAWAL C R I T E R I A
SUPPLEMENTAL PUMPING FROM SECONDARY/FLORIDAN AQUIFERS WITHDRAWAL C R I T E R I A = 5 PERCENT AVERAGE/5 PERCENT MAXIMUM

APPENDIX F L I S T OF TABLE
( C o n t i n u e d )
T a b l e - F .5-6 RESERVOIR STORAGE, 5 PERCENT AVERAGE/15 PERCENT MAXIMUM
WITHDRAWAL CRITERIA (WITH SUPPLEMNTAL SUPPLY)
F .5-7 YEARLY SUMMARY OF RIVER WITHDRAWALS. WITHDRAWAL CRITERIA 5 PERCENT AVERAGE/15 PERCENT MAXIMUM (WITH SUPPLEMENTAL SUPPLY)
F. 5 - 8 AVERAGE PERCENT WITHDRAWAL BY MONTH, 5 PERCENT AVERAGE/ 1 5 PERCENT MAXIMUM WITHORAWAL CRITERIA
F. 5 - 9 SUPPLEMENTAL PUMPING FROM SECONDARY/FLORIDAN AQUIFERS WITHORAWAL CRITERIA - 5 PERCENT AVERAGE/15 PERCENT MAXIMUM

APPENDIX F L I S T OF FIGURES
F i g u r e
F . 2 - 1
F .2 -2
F .2-3
F .2 -4
F . 3 - 1
F.5-1
MYAKKA STATE PARK R A I N F A L L DATA SUMMARY
MYAKKA RIVER DISCHARGE DATA SUMMARY
RAINFALL/RUNOFF VARIATION FROM PERIOD OF RECORD AVERAGE
MYAKKA RIVER/PEACE R IVER DISCHARGE COMPARISON
Y I E L D VERSUS STORAGE AN0 MAXIMUM PERCENT R IVER WITHDRAWAL
W I T H I N YEAR STORAGE SUPPLY: OCT-OCT 5% AVERAGE/ 5% MAXIMUM WITHDRAWAL C R I T E R I A
W I T H I N YEAR STORAGE SUPPLY: NOV-OCT 5% AVERAGE/ 5% MAXIMUM WITHDRAWAL C R I T E R I A
W I T H I N YEAR STORAGE SUPPLY: DEC-OCT 5% AVERAGE/ 5% MAXIMUM WITHDRAWAL C R I T E R I A
W I T H I N YEAR STORAGE SUPPLY: JAN-OCT 5% AVERAGE/ 5% MAXIMUM WITHDRAWAL C R I T E R I A
WITHIN YEAR STORAGE SUPPLY: FEB-OCT 5% AVERAGE/ 5% MAXIMUM WITHDRAWAL C R I T E R I A
W I T H I N YEAR STORAGE SUPPLY: MAR-OCT 5% AVERAGE/ 5% MAXIMUM WITHDRAWAL C R I T E R I A
W I T H I N YEAR STORAGE SUPPLY: APR-OCT 5% AVERAGE/ 5% MAXIMUM WITHDRAWAL C R I T E R I A
WITHIN YEAR STORAGE SUPPLY: MAY-OCT 5% AVERAGE/ 5% MAXIMUM WITHDRAWAL C R T I E R I A
W I T H I N YEAR STORAGE SUPPLY: OCT-OCT 5% AVERAGE/ 15% MAXIMUM WITHDRAWAL C R I T E R I A
W I T H I N YEAR STORAGE SUPPLY: NOV-OCT 5% AVERAGE/ 15% MAXIMUM WITHDRAWAL C R I T E R I A
W I T H I N YEAR STORAGE SUPPLY: DEC-OCT 5% AVERAGE/ 15% MAXIMUM WITHDRAWAL C R I T E R I A

F i g u r e
F . 5 - 1 2
APPENDIX F L I S T OF F IGURES
( C o n t i n u e d )
W I T H I N YEAR STORAGE SUPPLY: JAN-OCT 5% AVERAGE/ 1 5 % MAXIMUM WITHDRAWAL C R I T E R I A
W I T H I N YEAR STORAGE SUPPLY: FEB-OCT 5% AVERAGE/ 1 5 % MAXIMUM WITHDRAWAL C R I T E R I A
W I T H I N YEAR STORAGE SUPPLY: MAR-OCT 5% AVERAGE1 1 5 % MAXIMUM WITHDRAWAL C R I T E R I A
W I T H I N YEAR STORAGE SUPPLY: APR-OCT 5% AVERAGE/ 1 5 % MAXIMUM WITHDRAWAL C R I T E R I A
W I T H I N YEAR STORAGE SUPPLY: MAY-OCT 5% AVERAGE/ 1 5 % MAXIMUM WITHDRAWAL C R I T E R I A
SUPPLY SCHEMATIC
RESERVOIR RULE CURVE 5% AVERAGE/5% MAXIMUM WITHDRAWAL C R I T E R I A
RESERVOIR RULE CURVE 5% AVERAGE/15% MAXIMUM WITHDRAWAL C R I T E R I A

APPENDIX F
MYAKKA RIVER SUPPLY ANALYSIS
F. l INTRODUCTION
The purpose o f t h e Myakka R ive r supply ana lys is was t h e es t imat ion
o f t h e water supply t h a t cou ld be u t i l i z e d from t h e Myakka R iver under
var ious r e g u l a t o r y and environmental c o n s t r a i n t s and t h e associated
storage requ i red f o r drought season supply. The ana lys is cons is ted
o f :
1 ) reg iona l assessment o f t h e long-term r i v e r cyc les and f l o w
regime changes;
2) syn the t i c f l o w s imula t ions f o r development o f a r e l a t i o n s h i p
between dependable supply, drought storage, and withdrawal
c r i t e r i a ;
3 ) assessment o f t h e h i s t o r i c a l record under var ious combinations
o f demand, s torage and withdrawal c r i t e r i a ; and
4 ) assessment o f supplemental supply a l t e r n a t i v e s f o r reduc t i on o f
r e q u i r e d r e s e r v o i r storage.
The f o l l o w i n g sec t ions i nc lude a general d e s c r i p t i o n o f t h e r i v e r
regime, a d e s c r i p t i o n o f t h e syn the t i c and h i s t o r i c a l f l o w demand1
storage s imulat ions, and a d e s c r i p t i o n o f r i v e r d i v e r s i o n / w e l l f i e l d
opera t ion a l t e r n a t i v e s f o r reduc t i on o f w e l l - f i e l d and r i v e r environ-
mental impact and cons t ruc t i on costs.
F.2 RIVER REGIME DESCRIPTION
F.2.1 General
The Myakka R iver basin i s loca ted i n t h e Gu l f Coastal Lowlands
physiographic province. The land sur face i s t y p i f i e d by numerous wet-
1 ands. in te rspersed w i t h p ine palmet to f 1 atwoods, range 1 ands, and
a g r i c u l t u r a l lands. The r i v e r r i s e s i n t h e Polk uplands and d ra ins a
p o r t i o n o f t h e Desoto p l a i n ( F l o r i d a Sta te Un ive rs i t y , 1984). Surface
Revision: 0 Date: 3/5/86

e leva t i ons range from approximately 150 f e e t mean sea l e v e l (msl) t o
sea l e v e l a t Myakka Bay. Except f o r a l i m i t e d p o r t i o n o f t h e bas in
headwaters, t h e land sur face i s q u i t e f l a t .
The r i v e r i t s e l f i s charac ter ized by a wide f l o o d p l a i n o f up t o
and over 1 m i l e i n w id th w i t h two major in-stream sur face water bodies,
Upper and Lower Myakka Lake. The open water bodies w i t h i n t h e r i v e r
bas in i t s e l f exceed 2.5 square mi les .
Continuous discharge data (1937 - 1985) i s a v a i l a b l e f o r t h e
Myakka R iver a t t h e Highway 72 b r i dge downstream o f Upper Myakka Lake.
The records are good f o r normal f lows. Accuracy decreases as f l o w
increases due t o t h e wide f l o o d p l a i n and t h e ex is tence o f pe r iod i c
cross bas in f l o w t r a n s f e r s between t h e Myakka R ive r and Vanderipe
Slough. R a i n f a l l da ta i s a v a i l a b l e f o r t h e basin a t Myakka R iver S ta te
Park near t h e Highway 72 gaging s t a t i o n .
For the pe r iod o f synopt ic r a i n f a l l / r u n o f f data c o l l e c t i o n (1944
through 1985) t h e r a i n f a l l has averaged 56.27 inches and t h e r u n o f f
14.4 inches. R a i n f a l l has ranged from a low o f 39.4 inches t o a h igh
o f 81.07 inches and r u n o f f from a low o f 2.73 inches t o a h igh o f 35.44
inches. A graphic d i s p l a y o f t h e r a i n f a l l and r u n o f f da ta i s prov ided
i n F igures F.2-1 and F.2-2, respec t i ve l y .
F.2.2 Flow V a r i a t i o n With Respect t o Time
General
The Myakka R iver discharge data i n d i c a t e s a gradual decrease i n
average Myakka R ive r f l o w over time, p a r t i c u l a r l y s ince t h e e a r l y
1960's. An assessment was conducted o f t h e r e l a t i o n s h i p between t h e
Myakka R iver r u n o f f and drainage bas in r a i n f a l l . I n addi t ion, t h e
reg iona l na ture o f f l o w v a r i a t i o n s was assessed through a comparison o f
~ y a k k a R ive r and Peace R ive r discharges. The s m a r i z e d r e s u l t s o f t h e
two data s e t comparisons fo l l ow :
Revision: 0 Date: 3/5/86

Myakka RiverIRainfall Comparison
A comparison of Myakka River Basin runoff and r a in fa l l as a
function of percentage of averages fo r each data s e t i s provided in
Figure F.2-3. The trend of the long-term r a in fa l l data does not cor re la te with the trend of the Myakka River average discharge. A
sumnary of the s t a t i s t i c a l trend of the correla t ion assessment of the
two data s e t s a re shown on Table F.2-1. The correla t ion between
r a in fa l l and runoff weakens s ign i f ican t ly towards the l a t t e r part of the record. There i s a posit ive b u t weak correla t ion coeff ic ient fo r
the period of record of 0.52. The middle two 10 year periods of record
(1955 t o 1964; 1965 t o 1974) show a r e l a t i ve ly strong posit ive correla-
t ion with coeff ic ients of 0.86 and 0.84, respectively. By contras t , the f i r s t 10 years of the synoptic period of record (1945 t o 1954) and
the l a t t e r 10 years of synoptic record (1975 t o 1984) are more weakly
posit ively correlated with coeff ic ients of 0.55 and 0.27, respectively.
Both of these time periods experienced severe droughts (1945, 1984)
with the l a t t e r time period drought being l e s s severe than tha t which
occurred in 1945.
Myakka Riveripeace River Comparison
The r e s u l t s of the Myakka RiverIPeace River data comparison i s
shown in Figure F.2-4. The data indicates t ha t the decrease in average
discharge i s comnon to the physiographic region drained by both the Peace and Myakka Rivers. Both r i ve r s demonstrate higher than average
discharges for the 20 year period prior t o 1965. The average discharge
for the 10 year period from 1945 t o 1955 was 10 percent and 28 percent
higher than the long-term (1944 - 1985) period record for the Myakka and Peace Rivers, respectively. For the 1955 through 1965 period, the discharges on both r i ve r s were approximately 20 percent higher than the long-'term average. By comparison, following 1965 both r i ve r s showed a decrease in average discharges. Decreases below the long-term averages were 16 percent and 20 percent fo r the Peace and Myakka r i ve r s , respectively.
Revision: 0 Date: 3/5/86

Runoff V a r i a t i o n Assessment
The comparison o f Myakka R ive r r u n o f f data w i t h t h e o ther reg iona l
da ta se ts ( r a i n f a l l and Peace R ive r f low) does n o t p rov ide an
i n d i c a t i o n o f t h e parameters associated w i t h t h e v a r i a t i o n i n t h e
Myakka R iver discharges. The comparison does i nd i ca te , however, t h a t
decreases i n average r i v e r f l ows are u n l i k e l y t o be a f u n c t i o n o f
r a i n f a l l alone. Both F igu re F.2-3 and and Table F.2-1 suggest a marked
weakening i n t h e c o r r e l a t i o n between r a i n f a l l and r u n o f f i n t h e l a t t e r
10 years of record.
The decreasing c o r r e l a t i o n cou ld be p a r t i a l l y r e l a t e d t o severe
droughts and associated water t a b l e depressions. Depressed water
t ab les could decrease r a i n f a l l / r u n o f f c o r r e l a t i o n by absorbing t h e
r a i n f a l l from several h igh r a i n f a l l months f o l l o w i n g each d r y season.
This would produce h igh r a i n f a l l measurements w i thout concurrent h igh
r u n o f f .
Although drought cond i t i ons a f f e c t t h e c o r r e l a t i o n between r a i n -
f a l l and runo f f , o ther f a c t o r s may be involved. Even though t h e
droughts w i t h i n t h e 1945-1954 pe r iod are more severe than those i n
1975-1984, t h e c o r r e l a t i o n c o e f f i c i e n t i s s i g n i f i c a n t l y higher. Th is
i nd i ca tes t h a t , i f another f a c t o r i s involved, i t may be unique t o t h e
l a t t e r p o r t i o n o f t h e per iod o r record.
The other f a c t o r may be water removal from t h e hydro log ic system
by pumping o f t h e subsurface aqu i fe rs . As discussed i n Appendix C , pumping o f t h e Secondary Aqu i fe r may p e r i o d i c a l l y depress t h e water
t a b l e aqu i fe r i n some areas. The r e s u l t o f such depression cou ld be
pe r iod i c , punping induced r u n o f f decreases wh i l e t h e water t a b l e
aqu i fe r i s being recharged.
The impact o f depressed water t ab les on r u n o f f should be most
ev ident du r ing t h e e a r l y p a r t o f t h e wet season (June and July) .
~ o n v & s e l y , t h e impact should vanish du r ing t h e l a t e wet season (August
and September) when t h e water t a b l e i n e v i t a b l y reaches t h e surface.
I f aqu i fe r punping i s a f a c t o r i n t h e change i n Myakka R ive r f lows, a
Revision: 0 Date: 3/5/86

marked weakening o f t h e c o r r e l a t i o n between June and J u l y r a i n f a l l 1
r u n o f f should have occurred over t h e past 10 t o 20 years. Fur ther , t h e
c o r r e l a t i o n i n September da ta should have remained f a i r l y constant.
As shown on Tables F.2-2 and F.2-3, however, t h e June and September
monthly c o r r e l a t i o n s are inconclus ive.
Even when t h e comparisons are increased t o t h r e e month per iods
(e.g., May, June, J u l y r a i n f a l l w i t h J u l y r u n o f f and July , August,
September r a i n f a l l w i t h September r u n o f f ) t h e r e s u l t s (Tables F.2-4 and
F.2-5) are inconclus ive. The poor c o r r e l a t i o n o f month ly da ta i s
l i k e l y t h e r e s u l t o f t h e l a r g e l a g t ime b u i l t i n t o t h e r a i n f a l l / r u n o f f
r e l a t i o n s h i p f o r a bas in such as t h e Myakka. The l a g r e s u l t s i n a
delayed r u n o f f expression o f r a i n f a l l . Th is comparison i n d i c a t e s t h a t
t h e hypothesis t h a t decreases i n Myakka R iver f l o w over t ime are
associated w i t h decreases i n t h e basin water t a b l e s w i l l r e q u i r e
add i t i ona l considerat ion.
F.3 SYNTHETIC STREAM FLOW SUPPLYISTORAGE ANALYSIS
F.3.1 Methodology
U t i l i z a t i o n o f t h e Myakka R ive r as a supply source imp l i es t h e
p r o v i s i o n o f storage f o r accommodation o f supply dur ing t h e d r y season
and p e r i o d i c extended droughts. The assessment o f Myakka R iver supply
t h e r e f o r e requ i res es t imat ion o f t h e drought o r d r y season storage
requ i red f o r t h e des i red dependable y i e l d . The h i s t o r i c a l record i n d i -
cates t h a t near zero f l o w has occurred i n t h e Myakka R ive r f o r per iods
o f up t o 6 months. Even i n a normal year t h e r i v e r w i l l experience
near zero f l o w f o r approximately 2 months. The impact o f Myakka R iver
low f l ows on a supply system can be brought i n t o perspect ive by t h e
observat ion t h a t a 1 mgd supply over a 6-month pe r iod i s equ iva len t t o
almost 600 acre- feet o f water. This volune o f water i n t u r n i s equi-
v a l e n t t o a l ake 20 f e e t deep over 30 acres.
The general procedure used i n es t ima t ing t h e storage was:
Revision: 0 Date: 3/5/86

1. Compile a s e t o f s t a t i s t i c a l l y v a l i d se r i es o f syn the t i c
stream f l o w data (Sect ion F.3.2).
2. Subject synthesized data t o withdrawal c r i t e r i a
(Sec t ion F.3.3).
3. Develop a y i e l d versus storage/a l lowable percent withdrawal
r e l a t i o n s h i p under g iven r e g u l a t o r y and phys ica l withdrawal
c o n s t r a i n t s (Sect ion F.3.4).
Each o f t h e t h r e e steps are discussed separa te ly i n Sect ions F.3.2
through F.3.4
F.3.2 Synthet ic Stream Flow Time Series
The syn the t i c s t r e m f l o w ana lys is was u t i l i z e d due t o t h e recog-
n i t i o n t h a t t h e h i s t o r i c a l record prov ides a p a t t e r n o f f l o w which i s
u n l i k e l y t o occur du r ing t h e pe r iod i n which t h e proposed system would
be opera t ive . Furthermore, t h e recorded values o f h i g h f low, low f low,
and o ther c h a r a c t e r i s t i c s o f t h e record are u n l i k e l y t o be cons is ten t
du r ing t h e design per iod f o r t h e f a c i l i t i e s . Th is i s p a r t i c u l a r l y t r u e
w i t h respect t o f l o o d s o r droughts. F i n a l l y , t h e h i s t o r i c a l reco rd
alone does no t p rov ide a s u f f i c i e n t measure o f t h e r i s k . For t h i s
p a r t i c u l a r a p p l i c a t i o n t h e h i s t o r i c a l record i n a c t u a l i t y i s s u f f i c i e n t
f o r es t imat ing a 95 percent dependab i l i t y f o r y i e l d under var ious
storage and withdrawal scenarios. However, t h e u t i l i z a t i o n o f syn-
t h e t i c da ta a l lows a reasonable extension o f t h e reco rd which provides
a h igher l e v e l o f conf idence i n t h e opera t iona l parameters associated
w i t h r i v e r withdrawals.
The syn the t i c stream f l o w ana lys is cons is ted o f generat ing a
sequence o f month ly values o f f lows which are s t a t i s t i c a l l y comparable
i n terms o f mean, standard dev ia t ion , and skewness t o t h e h i s t o r i c a l
monthly f l o w values. The generat ion o f t h e f lows assunes t h a t f lows
are t h e r e s u l t o f a random process, a process whose r e s u l t s change w i t h
t ime i n a way t h a t invo lves p r o b a b i l i t y (Moran, 1959). Th is approach
assunes t h a t t h e statement "The p r o b a b i l i t y o r chance t h a t t h e f l o w i n
Revision: 0 Date: 3/5/86

a g iven stream next year w i l l be l e s s than X u n i t s i s P1 " i s taken as
an accurate approximation. The approach does no t assune o r imp ly t h a t
exact f lows can be pred ic ted . Ins tead t h e generat ion process i s based
on p r o b a b i l i s t i c c h a r a c t e r i s t i c s .
I n add i t ion , t h e technique recognizes an important tendency
towards pers is tence i n extreme f lows; low f l ows tend t o be fo l lowed by
o ther low f l ows and h igh f l ows tend t o be fo l lowed by other h igh f lows.
This c h a r a c t e r i s t i c a l lows t h e generat ion o f f lows t h a t r e t a i n t h e
s t a t i s t i c a l c h a r a c t e r i s t i c s o f observed f lows. It i s emphasized t h a t
t h e s t a t i s t i c a l method does no t p rov ide a causal model f o r actual
f lows.
The syn the t i c f lows f o r the Myakka R ive r were generated as a
sequence o f numbers o f values produced by a random process i n t h e suc-
cession o f monthly t ime i n t e r v a l s . I n general, t h e i t h member, X i ,
o f a t ime se r ies i s est imated as t h e sum o f two pa r t s :
X i = D i + E i Eq. F.3-1
I n t h i s bas ic model, D i i s t h e d e t e r m i n i s t i c component deter-
mined by an exact f u n c t i o n a l r u l e from t h e s t a t i s t i c a l parameters and
previous values o f t h e process. The random component i s E i . Th is i s
a random number drawn or sampled from t h e se t o f random numbers w i t h a
c e r t a i n p r o b a b i l i t y d i s t r i b u t i o n a l pa t te rn .
For t h i s ana lys is t h e d e t e r m i n i s t i c p o r t i o n i s based on t h e normal
d i s t r i b u t i o n f u n c t i o n and t h e mean standard d e v i a t i o n l a g one s e r i a l
c o r r e l a t i o n c o e f f i c i e n t and c o e f f i c i e n t o f skewness o f t h e h i s t o r i c a l
f l o w sequence. The j u s t i f i c a t i o n f o r u t i l i z a t i o n o f t h e normal func-
t i o n i s t h e c e n t r a l l i m i t theory. Th is t heo ry s ta tes t h a t a v a r i a b l e
i s d i s t r i b u t e d approximately normal ly i f 1) i t i s t h e sum o f i d e n t i c a l -
l y d i s t r i b u t e d random va r iab les and 2) t h e va r iab les are der ived from
any d i s t r i b u t i o n w i t h a f i n i t e mean and variance. Since t h e f l o w o f a
s t r e & i n a g iven t ime pe r iod i s an accumulation o f d i f f e r e n t a d d i t i v e
fac to rs , t h e f l ows may be considered as suns o f randan var iab les ;
thereby being normal ly d i s t r i b u t e d . F i n a l l y , emperical s tud ies
Revision: 0 Date: 3/5/86

( F i e r i n g and Jackson, 1971) have shown t h a t t h e mean and standard
dev ia t i on are much more important than o ther s t a t i s t i c s i n producing
good r e s u l t s i n bas in s imu la t i on studies. As t h e h i s t o r i c a l mean and
standard d e v i a t i o n are s u f f i c i e n t t o approximately reproduce h i s t o r i c a l
record t h e normal d i s t r i b u t i o n i s adequate.
For tunate ly , t h e mean and standard dev ia t i on can be est imated
t o l e r a b l y w e l l from moderate s ized smp les . Other s t a t i s t i c s , such as
h igher o rder moments ( t h e skewness c o e f f i c i e n t ) and c o r r e l a t i o n coef-
f i c i e n t s f o r l a r g e lags are sub jec t t o more pronounced sampling er rors ;
however, these l e s s s t a b l e s t a t i s t i c s are no t c r u c i a l f o r eva lua t ion o f
a l t e r n a t i v e storage schemes e s p e c i a l l y on t h e one month t ime step.
The d e t e r m i n i s t i c model se lected f o r generat ing t h e syn the t i c
f lows was t h e l a g one o r Markovian f l o w model as presented i n F i e r i n g
(1967). The generat ing equat ion i s : -
Qi+l = Qj+l + b . (Q . -q . ) J 1 J + tiSj+l Jq Eq. F.3-2
where:
Qi and Qi+l = discharges du r ing t h e i t h and ( i + l ) t h month, respec t i ve l y , computed from t h e s t a r t o f t h e synthesized sequence.
?jj and qj+l = mean month ly discharges dur ing t h e j t h and ( j + l ) t h month, respec t i ve l y , w i t h i n a r e p e t i t i v e annual cyc le o f 12 months.
= regress ion c o e f f i c i e n t f o r es t imat ing f l o w i n t h e ( j + l ) t h from t h e j t h month.
t j = random normal dev ia te w i t h zero mean and u n i t var iance.
' j + l = standard d e v i a t i o n o f f lows i n t h e ( j + l ) t h month.
j = c o r r e l a t i o n c o e f f i c i e n t between t h e f l ows o f t h e .... j t h and ( j + l ) t h month.
It should be noted t h a t t h e model assunes t h a t t h e e n t i r e
in f luence o f t h e past on t h e cu r ren t f l o w i s r e f l e c t e d i n t h e prev ious
Revision: 0 Date: 3/5/86

f l o w value. The equat ion charac ter izes a c i r c u l a r random walk, a model
i n which t h e d ischarge i n t h e i + l month i s comprised o f a component
l i n e a r l y r e l a t e d t o t h a t i n t h e i t h month and a random a d d i t i v e
component. The v a r i a t i o n i n s ign and magnitude o f t h e random a d d i t i v e
component makes f o r a continuous, unbounded, and s e r i a l l y c o r r e l a t e d
sequence o f da ta f o r s imu la t i on s tud ies .
I n t h e computations, t h e index j r a n c y c l i c a l l y f rom 1 t o 12, and
t h e index i r a n s e q u e n t i a l l y from 1 t o 240 (240 values o r 20 years o f
12-month f l o w s ) . By t h e same procedure, 100 t races o f f l o w were
computed. Each t r a c e was de f ined as a 20-year record o f month ly
f lows. The dependable y i e l d under var ious withdrawal c o n s t r a i n t s was
ca l cu la ted by superimposing t h e c o n s t r a i n t s on each 20-year s y n t h e t i c
t r a c e and es t ima t i ng t h e dependable y i e l d versus t h e var ious
cond i t ions . The dependable y i e l d f o r each t r a c e was taken as t h a t
y i e l d f o r which t h e r e was a s i n g l e f a i l u r e t o p rov ide s u f f i c i e n t
s torage du r i ng t h e 20-year per iod. Th i s r e s u l t e d i n what amounted t o
100 f a i l u r e s i n 2,000 years o f s y n t h e t i c data. The dependable y i e l d
was determined b y averaging t h e 100 y i e l d s est imated from t h e 100
s y n t h e t i c t races . Consequently, t h i s r e s u l t e d i n 50 f a i l u r e s f o r t h e
2,000 years o f s y n t h e t i c f low. Th is was taken t o approximate a
supply dependab i l i t y i n anyone year o f 97.5 percent .
F.3.3 Withdrawal Cons t ra in ts
The dependable y i e l d i s a f u n c t i o n o f demand v a r i a t i o n , t h e con-
s t r a i n t s o f r i v e r f l o w v a r i a b i l i t y , r e g u l a t o r y minimum f l o w r a t e s i n
t h e r i v e r , maximum a l lowab le percentage o f r i v e r f l o w withdrawal, pump
s ize, s torage capaci ty , and l oss /ga in from n e t r a i n f a l l . It i s assumed
t h a t o n l y t h e maximum a l lowab le percentage o f r i v e r f l o w withdrawal,
punp s i z e and storage capac i t y can be var ied. For s i m p l i f i c a t i o n o f
t h e ana lys is t h i s conceptual stage, pump capac i t y was assuned t o be a ?.
n o n - l i m i t i n g parameter. The o the r c o n s t r a i n t s are taken as g iven
constants.
Revision: 0 Date: 3/5/86

Each of t h e p a r m e t e r s l i s t e d above are discussed i n t h e f o l l o w i n g
sub-sect ions.
Flow V a r i a t i o n
Flow v a r i a t i o n i s accounted f o r w i t h t h e s y n t h e t i c f l o w t ime
se r i es s imu la t ions discussed i n Sec t ion F.3.2.
Demand V a r i a t i o n
Demand v a r i a t i o n by month i s shown on Table F.2-6. The da ta was
obta ined as a rep resen ta t i ve v a r i a t i o n from Sarasota County Water
System Study Phase Supply Report ( J o i n t Venture, 1985).
Regulatory Minimum Flow Rate
Minimum f l o w r a t e s i n t h e Myakka R iver are mandated by standards
promulgated by t h e Southwest F l o r i d a Water Management D i s t r i c t
(SWFWMD). The c r i t e r i a i s as f o l l o w s :
Unless o therw ise deemed appropr ia te by t h e Board, t h e minimum r a t e s o f f l o w a t a g iven p o i n t on a s t r e m o r o the r watercourse s h a l l be es tab l i shed by t h e Board f o r each month, January through December. Minimun r a t e s o f f l o w s h a l l be es tab l i shed as fo l l ows : For each month, t h e f i v e ( 5 ) lowest month ly mean discharges f o r t h e preceding twenty (20) years s h a l l be averaged. Minimum r a t e s o f f l o w s h a l l be es tab l i shed as seventy percent (70%) o f these values f o r t h e f o u r (4 ) we t tes t months and n i n e t y percent (90%) o f these values f o r t h e remain ing e i g h t (8) months. The determina- t i o n s h a l l be based on a v a i l a b l e data, o r i n t h e absence o f such data, i t s h a l l be es tab l i shed by reasonable c a l c u l a t i o n s approved by t h e Board (SWFWMD Standards, Sect ion 40D-8.041, Paragraph ( 2 ) ) .
A summary o f t h e assessment o f minimum f l ows i s prov ided i n Table
F.2-7.
maxi mu^ A1 lowable Percent Withdrawal/Pump Capac i ty
The f o l l o w i n g percent wi thdrawals from t h e Myakka R ive r were
examined: 5, 7.5, 10, 15, and 25 percent . It should be noted t h a t t h e
Revis ion: 0 Date: 3/5/86

r e g u l a t o r y (SWFWMO) standards mandate a maximum withdrawal o f 5 per-
cent. Exceptions t o t h e 5 percent standard a t any t ime are o n l y
acceptable i f i t can be demonstrated t h a t p e r i o d i c shor t - term exceed-
ances can be envi ronmental ly t o le ra ted . Punp c a p a c i t i e s between 100
and 400 c f s were examined. For t h e purposes o f t h i s conceptual study,
t h e h igher pump withdrawals were u t i l i z e d i n t h e f i n a l assessment t o
avoid t h e pump s i z e being t h e c o n t r o l l i n g cons t ra in t .
Storage Capacity
The f o l l o w i n g storage c a p a c i t i e s i n acre- feet were examined i n t h e
s imulat ion: 5,000, 10,000, 12,000, 15,000, 18,000, 20,000, and
25,000.
Net R a i n f a l l
Net r a i n f a l l i s t h e sum o f r a i n f a l l and l ake evaporat ion. For t h e
purposes o f t h i s study, r e s e r v o i r seepage was neglected. Monthly r a i n -
f a l l was est imated as t h e average f o r each month f o r t h e pe r iod o f
record. Evaporat ion was est imated as 70 percent o f each monthly pan
evaporat ion measurement from t h e S t a t i o n OM-5 Class A evaporat ion pan
on t h e RMR. The ne t r a i n f a l l values are summarized i n Table F.2-8.
Computations o f y i e l d were conducted f o r one hundred 20-year
t races. For each t r a c e a t r i a l va lue o f demand was i n i t i a l l y assuned.
The t r i a l va lue o f demand was compared t o t h e a v a i l a b l e water from t h e
Myakka R iver based on t h e withdrawal c r i t e r i a combination. I f t h e
demand was i n excess o f t h e a v a i l a b l e water t h e d i f f e r e n c e was obta ined
from storage; conversely when the re was a surplus, t h e surp lus was
u t i l i z e d t o recharge t h e storage d e f i c i t associated w i t h prev ious
pumpage. I n addi t ion, t h e ne t r a i n f a l l onto t h e r e s e r v o i r as a
funct i ,on o f evaporat ion and r a i n f a l l ga in was incorporated i n t o t h e
analys is . The procedure was app l ied f o r each month o f t h e t r a c e and
t h e r e s e r v o i r storage monitored. I f t h e storage stage dropped below
t h e minimum volune o f supply, t h e t r i a l va lue o f demand was adjusted
downward and t h e procedure repeated. When a successful r u n t o t h e
Revision: 0 Date: 3/5/86

e n t i r e t r a c e was accmpl ished w i t h i n a preset tolerance, t h e t r i a l
va lue o f demand was taken as a y i e l d f o r t h a t t race .
F.3.4 YIELD VS. STORAGE/MAXIMUM PERCENT RIVER WITHDRAWAL
The r e l a t i o n s h i p developed from t h e above s imu la t i on i s provided
on F igure F.3-1. The volume o f s torage associated w i t h a g iven y i e l d
i s h i g h l y dependent on t h e maximum percent o f a l lowable withdrawal.
For example, f o r a dependable y i e l d o f 8 mgd t h e requ i red storage
ranges from over 18,000 acre- feet f o r 5 percent maximum withdrawal t o
l ess than 8,000 acre- feet f o r 25 percent maximum withdrawal. For both
cases t h e average volume o f water withdrawn from t h e r i v e r i s t h e same
a t approximately 5 percent. The p r i n c i p a l d i f f e r e n c e i s t h a t a t t h e
ou tse t o f t h e wet season, f o l l o w i n g an extended drought, withdrawals
are h igher than average u n t i l t h e r e s e r v o i r i s f i l l e d . Higher maximum
withdrawal percentages a l low more r a p i d r e f i l l i n g o f t h e r e s e r v o i r
f o l l o w i n g severe droughts. The more r a p i d l y the r e s e r v o i r can be
r e f i l l e d , t h e l e s s o f t e n carry-over storage occurs from one year t o t h e
nex t . Lower percent withdrawals r e s u l t i n numerous years i n which t h e
r e s e r v o i r i s no t r e f i l l e d du r ing t h e wet season. With t h e requ i red
storage supply being cumulat ive from year t o year, ve ry h igh storage
requirements r e s u l t .
The r e l a t i o n s h i p shown i n F igu re F.3-1 was used as a guide i n
s e l e c t i n g appropr ia te storage requirements t o be used i n t h e assessment
o f system opera t ion under h i s t o r i c a l cond i t i ons (Sect ion F.4).
F.4 MASS CURVE ANALYSIS
F.4.1 Methodology
The mass curve ana lys is u t i l i z e d a bas ic procedure f i r s t
introd,uced by R ipp l (1883). The method evaluates t h e cunu la t i ve
de f i i i i ency between t h e o u t f l o w and i n f l o w and se lec ts t h e maximun
cumulat ive va lue as t h e requ i red storage. The procedure i s comparable
t o t h a t u t i l i z e d f o r t h e y i e l d versus storage assessment ca l cu la ted
Revision: 0 Date: 3/5/86

w i t h the syn the t i c stream f l o w data. The p r i n c i p a l d i f f e r e n c e i s , t h a t
ins tead o f us ing a s y t h e t i c a l l y generated long-term pe r iod o f record,
t h e h i s t o r i c a l pe r iod o f record from 1937 t o 1985 was employed. I n
a d d i t i o n t h e mass curve ana lys is w i t h t h e h i s t o r i c a l da ta u t i l i z e d
actual month ly r a i n f a l l da ta obta ined a t Myakka R ive r S ta te Park i n t h e
c a l c u l a t i o n o f n e t p r e c i p i t a t i o n .
The c o n t r o l l i n g equations f o r t h e mass curve ana lys is are:
s ( i ) = minimum [ ( s ( i - 1 ) + AS), v o l ] E q . F.4-1
AS = minimum [ (np - d r a f t + draw), ( vo l - s ( i - I ) ) ] E q . F.4-2
Draw = minimum [pump, (Q - FMIN), (mp x Q), ( vo l - s ( i - l ) ] E q . F.4-3
where:
s ( i ) = storage i n r e s e r v o i r i n month i AS = change i n storage from month i-1 t o month i v o l m e = maximum r e s e r v o i r volune nP = n e t p r e c i p i t a t i o n d r a f t = month ly demand draw = r i v e r water withdrawal pump = pump capac i t y f o r t r a n s f e r o f water from t h e r i v e r t o t h e
r e s e r v o i r FMIN = minimum f l o w requirement i n t h e Myakka R ive r mP = maximum percent w i thdrawal from the Myakka Q = Myakka R iver f l o w
The mass curve ana lys is was conducted on a month ly basis. I npu t
parameters were Myakka River f low, n e t p r e c i p i t a t i o n as est imated from
h i s t o r i c a l r a i n f a l l and average evaporation, t h e requ i red d r a f t b y
month, t h e s t a r t i n g r e s e r v o i r volune, t h e pump capaci ty , t h e minimum
f l o w requirement, and t h e maximun percent withdrawal. U t i l i z i n g Equa-
t i o n s F.4-1 through F.4-3, a cont inuous s imu la t ion was conducted o f t h e
r e s e r v o i r storage f o r t h e per iod o f reco rd under d i f f e r e n t r a t e s o f
supply demand. The s imu la t ion prov ided a mass balance o f t h e r e s e r v o i r
s torage over t h e pe r iod o f record and an est imate o f t h e maximum
storage requ i red f o r each year o f t h e record under each supply demand
simulated. The withdrawal c o n s t r a i n t s analyzed are discussed i n
Sect ion F.4.2 and a rep resen ta t i ve s imu la t i on i s presented i n Sect ion
F.4-3.
Revision: 0 Date: 3/5/86

F.4.2 Withdrawal Const ra in ts
Mass curve ana lys is was conducted u t i l i z i n g var ious maximum per-
cent withdrawals and s t a r t i n g r e s e r v o i r s izes. The rep resen ta t i ve
supply demand u t i l i z e d was 8 mgd. Th is demand was taken as t h e l i k e l y
average freshwater supply requirement f o r e i t h e r Phase I o r I1 o f t h e
phases o f water supply developnent on t h e RMR. S t a r t i n g r e s e r v o i r
s izes were selected based on t h e r e s e r v o i r s izes est imated from t h e
syn the t i c stream f l o w supply storage ana lys is conducted as described i n
Sect ion F.4.3. Two maximum percent withdrawals were assessed, 5 per-
cent and 15 percent. A l l o ther withdrawal cons t ra in t s were as
discussed i n F.3.3.
F.4.3 Representat ive Simulat ion
The r e s u l t s o f a rep resen ta t i ve mass curve ana lys is s imu la t i on are
shown on Table F.4-1. The t a b l e shows t h e maximun storage requ i red f o r
each year o f record based on an average demand o f 8 mgd as d i s t r i b u t e d
based on t h e d i s t r i b u t i o n i n Table F.2-6 assuming t h e SWFWMD r e g u l a t o r y
c o n s t r a i n t o f 5 percent withdrawal ra te . Table F.4-1 i nd i ca tes t h a t a
demand o f 8 MGD would have r e s u l t e d i n a storage requirement i n excess
o f 18,500 acre- fee t t w i c e dur ing t h e 50-year h i s t o r i c a l per iod o f data.
Th is r e l a t e s t o a dependab i l i t y o f approximately 95 percent f o r a
r e s e r v o i r o f 18,500 acre- feet .
The l a r g e volume o f storage i s t h e r e s u l t o f c a r r y over storage
between years. An e x w p l e o f c a r r y over storage i s prov ided f o r t h e
years 1943 and 1945 as shown on Table F.4-2. At t h e end o f 1944 t h e
r e s e r v o i r was 10,000 acre- feet below f u l l storage. Th is 10,000
acre- feet was then added t o an add i t i ona l 7,500 acre- feet o f storage
u t i l i z e d i n 1945. I f supplemental supply had been a v a i l a b l e t o r e f i l l
t h e r e s e r v o i r and e l i m i n a t e t h e carry-over, requ i red r e s e r v o i r storage
would'have been sharp ly reduced.
Because storage requirements a r e extreme f o r a s o l e dependence on
t h e Myakka R iver f o r a g iven supply, supplemental supply i s a c r i t i c a l
Revision: 0 Date: 3/5/86

concern. A l t e r n a t i v e s f o r t h e u t i l i z a t i o n o f supplemental supply are
discussed i n t h e next sect ion.
F.5 SUPPLEMENTAL SUPPLY ALTERNATIVES
F.5.1 Assessment Methodology
The purpose o f t h e supplemental supply assessment was t o develop a
s e t o f a l t e r n a t i v e s f o r reducing c a r r y over storage and thereby reduce
the s i z e o f sur face storage f a c i l i t i e s . The approach cons i s t s o f t h e
f o l l o w i n g tasks:
Supplylwithdrawal c r i t e r i a
- Se lec t ion o f a t a r g e t y i e l d t o be suppl ied by t h e Myakka R iver
and supplemental supply.
- Se lec t ion o f rep resen ta t i ve withdrawal c r i t e r i a i n terms o f
maximum al lowable percent o f r i v e r f low. A l l o ther withdrawal
c r i t e r i a such as minimum f l o w are assumed as s p e c i f i e d i n
Sect ion F.3.3.
Simulat ion o f monthly supply requ i ranents from storage f o r t h e
per iod o f h i s t o r i c a l f l o w data record us ing t h e mass curve
ana lys is described i n Sect ion F.4.
Ca lcu la t i on o f w i t h i n year supply requ i red from storage
f o l l o w i n g each month o f t h e year f o r a l l 49 years o f record
(water year; November - October).
" Se lec t ion o f a f u n c t i o n t h a t descr ibes t h e frequency d i s t r i b u -
t i o n o f t h e 49 w i t h i n year storage supply volunes associated
w i t h each month o f t h e d r y season. (Note: Supply voltnne
associated w i t h a g iven month i s t h a t volune o f supply t h a t w i l l
be taken from storage from t h e end o f t h e month u n t i l t h e end o f
. t h e d r y season.)
" Select ion, based on t h e frequency d i s t r i b u t i o n s , o f t h e storage
supply associated w i t h each month t h a t has a 2 percent chance
(50-year r e t u r n i n t e r v a l ) o f being requ i red i n any one year.
Revision: 0 Date: 3/5/86

" Es t imat ion o f t h e ava i l ab le supplemental supply s torage based on
phys ica l c o n s t r a i n t s o f aqu i fe r y i e l d and water q u a l i t y from t h e
Secondary and F lo r i dan Aqui fers.
Es t imat ion o f t h e volune o f supplemental supply t h a t can be
prov ided dur ing t h e d r y season between t h e end o f each d r y
season month and t h e end o f t h e d r y season. Th is prov ides an
est imate o f t h e storage t h a t must be suppl ied from a sur face
r e s e r v o i r a f t e r each month o f t h e d r y season. These volume
est imates associated w i t h each month prov ide a " r u l e curve."
The " r u l e curve" i s the guide f o r determin ing how much water
must be i n t h e r e s e r v o i r a t t h e end o f each month t o main ta in a
98 percent l e v e l o f conf idence t h a t demand w i l l be met
throughout t h e d r y season.
Simulat ion o f t h e long-term opera t ion o f t h e r e s e r v o i r us ing
h i s t o r i c a l da ta and t h e " r u l e curve" developed i n t h e prev ious
step.
Each o f t h e above steps are discussed i n d i v i d u a l l y i n t h e
f o l l o w i n g sec t ion .
F.5.2 Supplemental Storage Analys is
Se lec t ion o f Y i e l d
The supplemental storage ana lys is requ i red t h e s e l e c t i o n o f a
rep resen ta t i ve t a r g e t y i e l d . Environmental and p e r m i t t i n g uncer ta in-
t i e s prevent accurate p r e d i c t i o n o f t h e a l lowable q u a n t i t i e s o f y i e l d
from t h e Myakka R iver . I n order t o p rov ide rep resen ta t i ve numbers f o r
use by the County and t h e environmental consu l tan ts i n t h e assessment
o f impacts a probable y i e l d had t o be estimated. For t h i s assessment a
y i e l d o f 8 mgd from t h e Myakka River , which represents 5 percent o f t h e
1ong;'term f l o w average, was u t i l i z e d . The 8 mgd y i e l d w i l l be r e f i n e d
as the s t a t e o f knowledge o f environmental impacts i s improved. How-
ever, f o r t h i s conceptual engineer ing phase t h e 8 mgd i s taken as an
Revision: 0 Date: 3/5/86

appropr ia te rep resen ta t i ve y i e l d from t h e r i v e r as i t f a l l s w i t h i n t h e
SWFWMD general p e r m i t t i n g gu ide l ines .
Se lec t ion o f Withdrawal C r i t e r i a
The withdrawal c r i t e r i a cons i s t s o f those items discussed e a r l i e r
i n Sect ion F.3. The c r i t e r i a cons i s t s o f such t h i n g s as average and
maximum percent withdrawal from t h e r i v e r , p m p capacity, minimum r i v e r
f l o w c r i t e r i a , e tc . Minimum f l o w was taken as t h e SWFWMD c r i t e r i a as
discussed i n Sect ion F.3.3. Pump capac i t y was assumed t o be a non-
c o n t r o l l i n g parameter. The average percent withdrawal o f 8 mgd was
u t i l i z e d as t h e o n l y demand t o be assessed. The monthly v a r i a t i o n i n
demand was taken as t h e d i s t r i b u t i o n presented by Smally and Wel l fo rd
(1985) (Table F.2-6).
The o n l y withdrawal c r i t e r i a va r i ed i n t h e ana lys is was t h e maxi-
mum percent withdrawal allowed on a p e r i o d i c basis . Th is maximum w i th -
drawal percent i s o f pr imary importance when t h e r e s e r v o i r i s low and
r e q u i r e s recharging. As discussed i n Sect ion F.3 t h e h igher t h e
maximum al lowable withdrawal t h e l e s s storage requ i red due t o t h e
greater c a p a b i l i t i e s f o r 1) p rov id ing supply from t h e r i v e r r a t h e r than
storage dur ing lower f l o w cond i t ions . and 2) p revent ing carry-over
s torage dep le t ions .
Two maximum instantaneous withdrawal values were assessed 5 and
15 percent. The 5 percent was selected as a r e f l e c t i o n o f t h e SWFWMD
general withdrawal c r i t e r i a o f 5 percent o f r i v e r f low. The 15 percent
was selected t o p rov ide a comparison o f system opera t iona l mod i f i ca-
t i o n s and f a c i l i t y s izes associated w i t h h igher withdrawal ra tes .
Ca lcu la t i on o f Wi th in Year Storage Supply Requirements
Wi th in year storage supply i s t h a t moun t o f t o t a l y e a r l y demand .. t h a t must be suppl ied from storage. The o b j e c t i v e o f t h e assessment
was t h e es t imat ion o f how much o f t h e supply f o l l o w i n g each month o f
t h e d r y season (October - June) must be prov ided from storage f o r each
Revision: 0 Date: 3/5/86

year o f t h e pe r iod o f record. This assessment was conducted f o r t h e
two maximum al lowable withdrawal r a t e s mentioned e a r l i e r , 5 and 15
percent.
Wi th in Year Supply Frequency D i s t r i b u t i o n
The supply requ i red from storage f o l l o w i n g each month f o r each
year o f reco rd was f i t t e d on a month ly bas i s t o var ious frequency
d i s t r i b u t i o n s . The best f i t f o r t h e data f o r bo th withdrawal c r i t e r i a
and a l l months analyzed was est imated t o be t h e l o g normal d i s t r i b u -
t i o n . The r e s u l t s o f t h e frequency p l o t s f o r each month are prov ided
i n F igures F.5-1 through F.5-16. As can be seen from t h e f igures , t h e
anount o f w i t h i n year supply requ i red from storage f o l l o w i n g each month
decreases as t h e d r y season progresses. Th is i s t h e r e s u l t o f t h e
d im in i sh ing d r y season pe r iod be fore t h e r e t u r n o f s i g n i f i c a n t r a i n f a l l
i n t h e sumner.
Although t h e l o g normal d i s t r i b u t i o n prov ides a good data f i t some
months have a s i g n i f i c a n t o u t l i e r i n t h e 2 percent chance o f occurrence
range. This i s p a r t i c u l a r l y t r u e f o r t h e storage requ i red f o r t h e 5
percent average15 percent maximun d i v e r s i o n scenario (F igures F.5-1
through F.5-8). The o u t l i e r i n t h e 2 percent occurrence range (50 year
r e t u r n i n t e r v a l ) f a l l s we l l ou ts ide o f t h e range o f t h e p red i c ted
va lue from t h e frequency d i s t r i b u t i o n . These o u t l i e r s a re supply
associated w i t h t h e 1944-1945 drought i n which t h e average r i v e r f l o w
was 46 c f s o r l e s s than 20 percent o f t h e long-term average f l o w o f
243 c f s . As a con t ras t t o t h e 1944-1945 drought t h e 1984-1985 drought
(October-September 1985) averaged approximately 95 c f s (es t imate) . The
frequency d i s t r i b u t i o n i nd i ca tes t h a t t h e 1945 drought was much more
severe than a one i n 50-year event and l i k e l y has a recurrence i n t e r v a l
c l ose r t o one i n 200 years o r l a r g e r .
Required Storage Fo l lowing Each Month
A 98 percent supply dependab i l i t y ( 2 percent chance o f f a i l u r e i n
any one year) was selected as t h e appropr ia te design l e v e l f o r t h i s
Revision: 0 Date: 3/5/86

conceptual analys is . The w i th in -year storage supply requ i red f o l l o w i n g
each month i s summarized i n Table F.5-1. As can be seen i n t h e t a b l e
t h e storage associated w i t h each month i s s i g n i f i c a n t l y g rea ter f o r t h e
5 percent average/5 percent (5/5) maximum withdrawal c r i t e r i a than f o r
t h e 5 percent average/l5 percent (5115) maximum. As i nd i ca ted on t h e
t a b l e t h e maximum w i t h i n year storage requ i red f o r t h e 515 a l t e r n a t i v e
i s 10,500 acre- fee t wh i l e t h e 5/15 a l t e r n a t i v e storage i s 7,800
acre- feet .
Ava i l ab le Supplemental Supply
The data discussed i n t h e prev ious subsect ion i n d i c a t e s t h e t o t a l
moun t o f storage requ i red t o meet t h e w i th in -year demand w i t h a
98 percent dependabi 1 i t y . This supplemental storage can be provided
e i t h e r w i t h sur face r e s e r v o i r ( s ) o r a l t e r n a t i v e sources w i t h i n t h e
RMR.
The p r a c t i c a l supplemental sources are t h e Secondary Aqu i fe r and
t h e F lo r i dan Aqu i fe r . As discussed i n Appendix E sur face r u n o f f
sources on t h e s i t e are no t appropr ia te f o r supplemental supply.
Surface r u n o f f cannot p rov ide supply when it i s needed dur ing t h e low
f l o w cond i t i ons on t h e Myakka R iver .
The volume o f supplemental supply t h a t can be obta ined from the
Secondary Aqu i fe r i s constra ined by t h e y i e l d c h a r a c t e r i s t i c s o f t h e
aqu i fe r . As discussed i n Appendix C t h e most p r a c t i c a l area i n terms
o f aqu i fe r y i e l d and economic c o n s t r a i n t s i s t h e Area I we l l f i e l d i n
t h e northwest corner o f t h e s i t e near Myakka R iver S ta te Park. I n
order t o min imize cos t o f access roads and c o l l e c t i o n systems, a
l i m i t e d number o f w e l l s pumped a t r e l a t i v e l y h igh r a t e s i s p re fer red .
The Area 1 w e l l f i e l d i s est imated as being capable o f p rov id ing 3 t o
4 mgd w i t h approximately s i x we l ls . The w e l l f i e l d , however, w i l l l i ke i ; o n l y be capable o f p rov id ing t h i s supply f o r 30 t o 60 days
be fore SWFWMD drawdown c r i t e r i a i s v io la ted . As a conserva t ive
assunption t h e Area I we l l f i e l d was u t i l i z e d as being able t o p rov ide
a 3 mgd supply f o r 30-day per iods. It was f u r t h e r assumed t h a t the
Revision: 0 Date: 3/5/86

aqu i fe r would recover i n t h e same t ime pe r iod as t h e pumping cyc le.
Therefore, t h e aqu i fe r would y i e l d an average o f 1.5 mgd du r ing a
pumping c y c l e o f one month on/one month o f f .
As opposed t o t h e Secondary Aqui fer , u t i l i z a t i o n o f t h e F lo r i dan
Aqu i fe r i s constra ined by the water qua1 i t y . Several assumptions were
requ i red f o r es t imat ing the p o t e n t i a l supply o f F lo r i dan water f o r
b lend ing w i t h freshwater suppl ies. The assunptions were as fo l lows:
The Myakka R iver freshwater supply w i l l undergo convent ional
l ime so f ten ing (L/S) t reatment incapable o f removing su l fa tes .
" Myakka R iver supply w i l l be used i n con junc t ion w i t h F l o r i d a n
water t r e a t e d w i t h reverse osmosis (R/O). The two suppl ies w i l l
be used i n equal pa r t s . Average supply from each source, a t
l e a s t through Phase I 1 o f t h e water system development, w i l l be
8 mgd f o r a t o t a l o f 16 mgd (24 mgd maximum).
Normal opera t ing s u l f a t e concentrat ions f o r t h e ou tput stream
from t h e combined R / O and L/S treatment p l a n t w i l l be 20
m i l l i g r a n s per l i t e r .
Under emergency cond i t i ons t h e s u l f a t e concentrat ions can be
increased t o t h e r e g u l a t o r y l i m i t o f 250 m i l l i g r a m s per l i t e r .
A f l o w c h a r t o f t h e b lending o f S u r f i c i a l , Secondary, and F lo r i dan
water i s shown i n F igure F.5-17. Based on t h e assumptions as t o water
q u a l i t y from each o f t h e t reatment streams, t h e F lo r i dan Aqu i fe r can
prov ide up t o 3.7 mgd f o r b lending purposes dur ing emergency low f l o w
cond i t ions . Th is supply i s considered a l a s t r e s o r t supplement and
would o n l y be brought on l i n e once i t was obvious t h a t t h e sur face
r e s e r v o i r and Secondary Aqu i fe rs cou ld n o t p rov ide a s u f f i c i e n t l e v e l
o f assurance t h a t t h e demand w i l l be met through t h e d r y season.
The est imated supply o f 1.5 mgd from t h e Secondary Aqu i fe r and
3.7 mgd from t h e F lo r i dan Aqu i fe r was converted i n t o volunes o f
a v a i l a b l e supply t h a t cou ld be punped from each aqu i fe r du r ing t h e d r y
season f o l l o w i n g each month o f t h e d r y season. Th is volune o f water
Revision: 0 Date: 3/5/86

then was subtracted from t h e t o t a l volune o f s torage supply as
determined from t h e frequency d i s t r i b u t i o n s . The remaining storage
supply above t h a t which can be prov ided by t h e aqu i fe rs i s t h a t volume
o f water which must be prov ided by a sur face r e s e r v o i r . The volumes
thus determined prov ide a " r u l e curve" which i n d i c a t e s t h e volume o f
water which must be i n t h e r e s e r v o i r a t t h e end o f each month i n order
t o main ta in a 98 percent dependab i l i t y t h a t t h e r e s e r v o i r w i l l n o t be
exhausted p r i o r t o t h e end o f t h e d r y season. A sumnary o f t h e r u l e
curves i s shown i n F igures F.5-18 and F.5-19.
F.5.3 Simulat ions o f Reservoir Operat ion w i t h Supplemental Storage
5 Percent Average/5 Percent Maximum Withdrawal C r i t e r i a
The e f f e c t o f u t i l i z i n g supplemental supply on storage can be
observed from Tables F.4-1 and F.5-2. The p r i n c i p l e e f f e c t i s t h a t t h e
requ i red storage f o r t h e 5 percent average/5 percent maximum (5/5)
withdrawal c r i t e r i a i s reduced from 18,500 acre- feet t o 10,000 acre-
f e e t . The 10,000 acre- foot r e s e r v o i r which inc ludes an 8,000 acre-
feet, 20- foot deep supply pool, and a 2,000 acre-feet, 5 - foo t deep
permanent pool would have prov ided s u f f i c i e n t storage f o r t h e e n t i r e
49 years o f record. The supply pool o f 8.000 acre- foot would have been
s u f f i c i e n t f o r a l l bu t one year o f t h e record. The d e f i c i e n c y would
have occurred i n the 1943-1944 drought i n which t h e permanent pool
would have been u t i l i z e d ex tens ive ly . The supply pool would have been
comple t ly exhausted i n one o ther year, t h e 1955 drought. Both t h e 1945
drought and t h e 1955 drought were more severe than t h e drought
experienced i n 198411985.
The supplemental storage produced an average withdrawal over t h e
pe r iod o f record from t h e r i v e r o f l ess than 5 percent (Table F.5-3).
The average withdrawal by month i s s m a r i z e d i n Table F.5-4. The
withd$awals would have averaged 5 percent o n l y f o r t h e months o f May
and June when t h e r e s e r v o i r would t y p i c a l l y be a t i t s lowest p o i n t i n
every year. From J u l y through October t h e percent withdrawal f o r t h e
per iod o f record i s reduced down t o t h e range o f 3 t o 4 percent. This
Revision: 0 Date: 3/5/86

i s due t o t h e s imu la t i on o f many years o f a f u l l r e s e r v o i r du r ing t h e
sumner and l ess water being requ i red from t h e r i v e r f o r r e s e r v o i r
recharge.
The frequency o f pumping o f t h e Secondary and F lo r i dan Aqu i fe rs i s
shown i n Table F.5-5. As can be seen i n the t a b l e t h e Secondary
Aqu i fe r pumps are u t i l i z e d on t h e average o f once every o ther year f o r
a per iod o f 3 t o 4 months. The F lo r i dan Aqu i fe r i s u t i l i z e d approx-
ima te l y t h e same except dur ing t h e l a t e r p o r t i o n o f t h e d r y season when
i t i s somewhat l e s s o f t e n u t i l i z e d .
5 Percent Average/l5 Percent Maximum Withdrawal C r i t e r i a
The e f f e c t o f u t i l i z i n g supplemental supply and increas ing t h e
maximum al lowable withdrawal can be observed from Tables F.5-2 and
F.5-6. The p r i n c i p l e e f f e c t i s t h a t t h e requ i red storage f o r t h e
5 percent average/ l5 percent maximum (5115) withdrawal c r i t e r i a i s
reduced t o l ess than 6,500 acre- feet . The 6,250 acre- foot r e s e r v o i r
which inc ludes a 5,000 acre-feet, 20- foot deep supply pool, and a
1,250 acre-feet, 5 - foo t deep permanent pool would have prov ided suf-
f i c i e n t s torage f o r t h e e n t i r e 49 years o f record. The supply pool o f
5,000 acre- foot would have been s u f f i c i e n t f o r a l l b u t t h r e e years o f
t h e record. The d e f i c i e n c y would have occurred i n t h e 1943-1944
drought i n which t h e permanent pool would have been u t i l i z e d exten-
s i v e l y . Both t h e 1945 drought and t h e 1955 drought were more severe
than the drought experienced i n 1984-1985.
The supplemental s torage produced an average withdrawal over the
pe r iod o f record from t h e r i v e r o f l ess than 5 percent (Table F.5-7).
The average withdrawal by month i s sumnarized i n Table F.5-8. The
withdrawals would have averaged up t o 13 percent f o r t h e months o f
A p r i l through June when t h e r e s e r v o i r would t y p i c a l l y be a t i t s lowest
p o i n t i n every year. From J u l y through October t h e percent withdrawal
f o r t h e per iod o f record i s reduced down t o t h e range o f 1.5 t o 5 per-
cent. This i s due t o t h e p r o b a b i l i t y i n many years o f t h e r e s e r v o i r
Revision: 0 Date: 3/5/86

being f u l l dur ing t h e summer and l ess water being requ i red from t h e
r i v e r f o r recharge r e s e r v o i r . As w i t h t h e 515 withdrawal c r i t e r i a , t h e
maximum al lowable d i ve rs ion capac i t y from t h e Myakka R ive r was
300 c f s .
The frequency o f pumping o f t h e Secondary and F l o r i d a n Aqu i fe rs i s
shown i n Table F.5-9. As can be seen i n t h e t a b l e t h e Secondary
Aqu i fe r punps are u t i l i z e d on t h e average o f once every f i v e years f o r
a pe r iod o f 1 t o 2 months. The F l o r i d a n Aqu i fe r i s u t i l i z e d approxi-
mate ly t h e same except du r ing the l a t e r p o r t i o n o f t h e d r y season when
i t i s u t i l i z e d somewhat l ess o f ten .
Revision: 0 Date: 3/5/86

REFERENCES
F ie r i ng , M.B., 1967, Streamf low Synthesis. Harvard U n i v e r s i t y Press, Cambridge, Massachusetts, p. 139
F ie r i ng , M. and Jackson, B., 1971, Synthe t ic Streamflows, Water Resource Monography # I , American Geophysical Union, Washington, DC.
F l o r i d a Sta te Un ive rs i t y , 1984, Water Resources A t l a s o f F l o r i d a .
J o i n t Venture, 1985, Sarasota County Water System Study Phase Supply Report.
Moran, P.A.P., 1959, The Theory o f Storage. Methuen, London, p. 111.
Ripp l , W., 1883, The Capaci ty o f Storage Reservoi rs f o r Water Supply. Proc. I n s t . C i v i l Engineers (London), Vol. 71, p. 270.

TABLE F.2-1
MYAKKA RIVER RUNOFFIRAINFALL STATISTICAL COMPARISON (YEARLY)
Time Per iod 45-84 - 45-54 55-64 65-74 75-84 - -
R a i n f a l l Mean 56.49 49.96 58.88 55.57 61.56 ( inches)
Runof f Mean 243.50 267.60 285.50 230.50 190.40 ( c f s )
Standard Dev ia t i on 11.46 8.44 14.48 7.98 11.86 Ra in f a1 1 ( inches)
Standard Dev ia t i on 135.17 163.08 179.53 96.85 70.97 Runof f ( c f s )
C o e f f i c i e n t s o f 20.28 16.90 24.60 14.36 19.27 V a r i a t i o n - R a i n f a l l
C o e f f i c i e n t s o f 55.51 60.94 62.88 42.02 37.28 Var i a t ion-Runof f
Covariance 812.50 762.24 2,224.48 652.04 231.54
C o r r e l a t i o n 0.52 0.55 0.86 0.84 0.27 C o e f f i c i e n t
Notes: Year ly t o t a l r u n o f f taken from USGS Highway 72 gage. Year ly t o t a l r a i n f a l l f rom Myakka R ive r S ta te Park gage.

TABLE F.2-2
MYAKKA RIVER RUNOFFIRAINFALL STATISTICAL COMPARISON (JUNE)
Time Per iod 45-86 - 45-54 55-64 65-74 - - - 75-84 -
R a i n f a l l Mean 8.52 8.66 6.58 9.10 9.55 ( inches)
Runoff Mean 166.97 119.12 118.04 281.39 152.28 ( c f s )
Standard Dev ia t i on 4.22 3.17 2.72 4.13 5.76 R a i n f a l l ( inches)
Standard Dev ia t i on 245.34 184.55 144.83 206.56 357.81 Runoff ( c f s )
C o e f f i c i e n t s o f 49.49 36.67 41.29 45.41 60.31 V a r i a t i o n - R a i n f a l l
C o e f f i c i e n t s o f 146.94 154.92 122.70 73.41 234.96 Var i at ion-Runoff
Covariance -140.21 -363.07 -143.09 -139.81 -118.01
C o r r e l a t i o n -0.14 -0.62 -0.36 -0.16 -0.06 C o e f f i c i e n t
Notes: June r u n o f f taken from USGS Highway 72 gage. June r a i n f a l l taken from Myakka R iver S ta te Park gage.

TABLE F.2-3
MYAKKA RIVER RUNOFFIRAINFALL STATISTICAL COMPARISON (SEPTEMBER)
Time Per iod 45-86 45-54 55-64 65-74 - - 7 5 -84
R a i n f a l l Mean 8.56 7.52 9.87 7.16 9.52 ( inches)
Runof f Mean ( c f s )
Standard Dev ia t i on 4.05 1.50 5.70 2.9 4.51 R a i n f a l l ( inches)
Standard Dev ia t i on 580.00 720.08 789.48 244.93 351.90 Runoff ( c f s )
C o e f f i c i e n t s o f 47.27 19.96 57.82 40.56 47.39 Var i a t i o n - R a i n f a l l
C o e f f i c i e n t s o f 78.88 103.93 71.14 41.75 65.28 Var ia t ion-Runof f
Covariance -296.92 342.42 -1471.63 -307.29 -296.58
C o r r e l a t i o n -0.11 0.32 -0.33 -0.43 -0.19 C o e f f i c i e n t
Notes: September r u n o f f taken from USGS Highway 72 gage. September r a i n f a l l taken from Myakka R iver S ta te Park gage.

TABLE F.2-4
LATE SPRING RAINFALL/RUNOFF STATIST1 CAL COMPARISON
Time Per iod 45-86 45-54 55-64 - 65-74 75-84
R a i n f a l l Mean ( inches)
Runoff Mean ( c f s )
Standard Dev ia t i on R a i n f a l l ( inches)
Standard Dev ia t i on Runoff ( c f s )
C o e f f i c i e n t s o f Var i a t i o n - R a i n f a l l
C o e f f i c i e n t s o f Var i at ion-Runoff
Covariance
C o r r e l a t i o n C o e f f i c i e n t

TABLE F.2-5
SUMMER RAINFALL/RUNOFF STATISTICAL COMPARISON
Time Pe r i od 45-86 45-54 55-64 65-74 - - 75-84 -
R a i n f a l l Mean 26.44 23.78 26.57 26.29 29.11 ( inches)
Runof f Mean 750.50 845.60 1021.37 563.10 571.92 ( c f s )
Standard D e v i a t i o n 7.17 5.70 7.14 8.01 7.69 R a i n f a l l ( i nches )
Standard D e v i a t i o n 586.94 678.72 810.21 274.31 366.70 Runof f ( c f s )
C o e f f i c i e n t s o f 27.10 23.97 26.86 30.48 26.40 V a r i a t i o n - R a i n f a l l
C o e f f i c i e n t s o f 78.21 80.26 79.33 48.71 64.12 Va r i at ion-Runoff
Covariance -1510.47 -1296.18 -3241.79 -670.76 -597.76
Co r re l a t i o n -0.36 -0.33 -0.56 -0.31 -0.21 C o e f f i c i e n t

TABLE F.2-6
Month - January
February
March
Apri 1
May
June
Ju ly
August
September
October
November
December
DEMAND VARIATION BY MONTH ( J o i n t Venture, 1985)
Percent o f Average
96
9 1
113
112
114
101
96
92
89
98
97
100

TABLE F.4-1 (Continued)
Year - Maximum Reservoi r
Storage (ac re - fee t )
Page 2 o f 2

TABLE F.4-2
EXAMPLE OF CARRY-OVER STORAGE
Year -
1943 1943 1944 1944 1944 1944 1944 1944 1944 1944 1944 1944 1944 1944 1945 1945 1945 1945 1945 1945 1945 1945 1945 1945
Month
November December January February March A p r i l
May June Ju l y August September October. November December January February March A p r i l
May June J u l y August September October
Flow (c fs ) - 21.20 3.11 3.10 1.47 0.36 0.01 0.00 0.00
67.90 221 .oo 146 .OO 75.60 20.30 2.97
11 .oo 3.38 0.07 0.00 0.00
207 .OO 1,618.00 1,288.00
680 .OO 240 .OO
Draw (cfs) - 1.06 0.00 0.00 0.00 0.00 0.00 0.00 0.00 3.40
11.05 0.00 3.78 1.01 0.00 0.55 0.00 0.00 0.00 0.00
10.35 80.90 64.40 34 .OO 12.00
Total Storage i n Reservoir
(acre- feet)
19,630.33 18,556.11 17,579.36 16,503.90 15,670.84 14,352.97 13,406.21 12,870.53 12,550.60 12,622.42 12,174.20 11,687.25 10,719.67 9,667.94 8,762.65 7,703.43 6,612.98 5,360.08 3.941.01 4,559.69 9,795.93
13,718.05 15,089.17 15,117.55

TABLE F.5-1
Month - October
November
December
January
February
March
Ap r i 1
May
TOTAL REMAINING WITHIN YEAR REQUIRED STORAGE SUPPLY DEMAND = 8 MGD
Withdrawal C r i t e r i a 5% Aver age/5% Maximum 5% Average/ l5% Maximum
(ac re - f ee t ) ( ac re - f ee t )
10,500 7,800

TABLE F.5-2 Page 1 o f 2
YEARLY RESERVOIR STORAGE 5 PERCENT AVERAGE/5 PERCENT MAXIMUM
WITHDRAWAL CRITERIA WITH SUPPLEMENTAL SUPPLY
Maximum R e s e r v o i r
Year - Storage
( a c r e - f e e t )
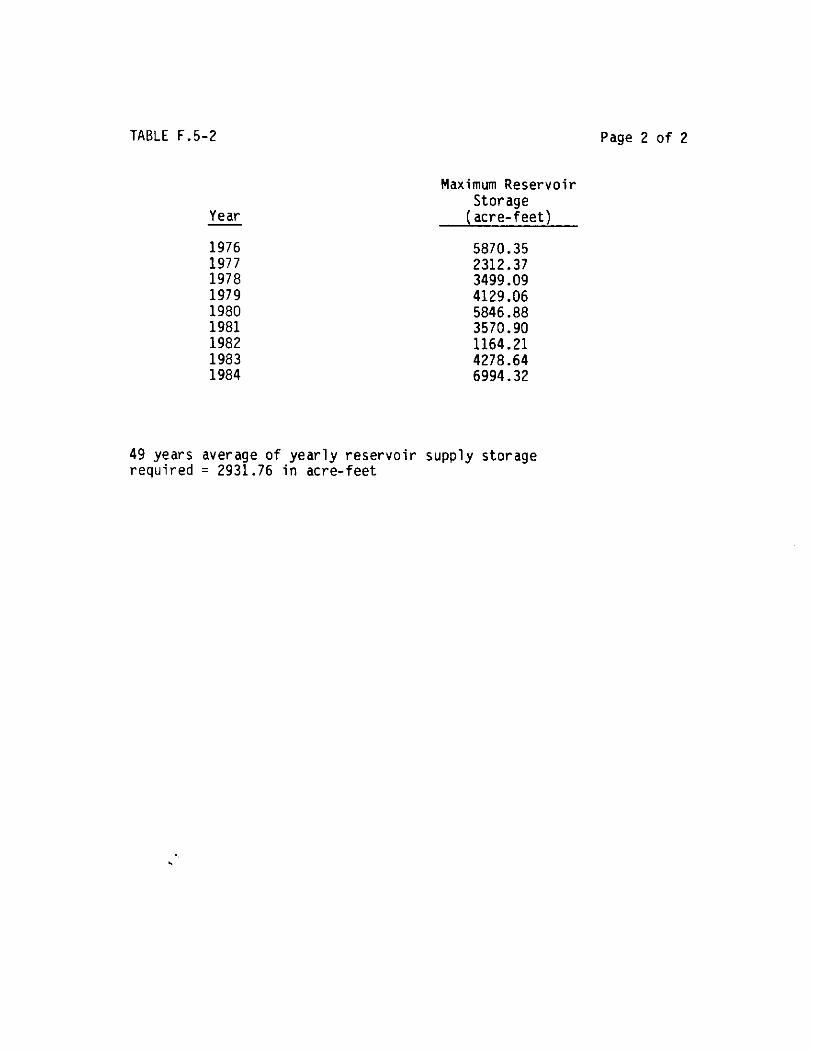
TABLE F.5-2 Page 2 of 2
Year -
Maximum Reservoir Storage (acre-feet)
49 years average of yearly reservoir supply storage required = 2931.76 in acre-feet

TABLE F.5-3
YEARLY SUMMARY OF RIVER WITHDRAWALS ~ -
WITHDRAWAL CRITERIA 5 PERCENT AVERAGE15 PERCENT KAXIMUM (WITH SUPPLEMENTAL SUPPLY)
YEAR - FLOW - ALLOWABLE WITHDRAWAL
ACTUAL WITWRAWAL
% OF FLOW -
1 * 3 7 AVC5 1 9 3 6 AVC5. 1 9 5 9 AVCS 1 9 4 0 AVGS 1 9 4 1 AVCS 1 9 4 2 AVCS 1 9 4 3 AVCS. 1 9 5 4 AVCS 19.15 AVCS 1 9 4 6 AVCS 1 9 4 7 AVOS 1 9 4 8 AVGG. 1 9 4 9 AVCS 1 9 5 0 AVCS. 1 9 5 1 AVCS 1 9 5 2 AVCS.
' 1 9 5 3 AVCS 1 9 5 4 AVCS. 1 9 5 5 AVOS 1 9 5 6 AVCS - - - .- 1 9 5 7 AVCS 1 9 5 8 AVCS 1 9 5 9 AVCS 1 9 6 0 AVCS 1 9 6 1 AVCS -. -- 1 9 6 2 AVCS 1 9 6 3 AVCS 1 9 6 4 AVOS. 1 9 6 5 AVCG. 1 9 6 6 AVCS. 1 9 6 7 AVCS 1 9 6 8 AVOS. 1 9 6 9 AVCS. 1 9 7 0 AVOS. 1 9 7 1 AVCS. 1 9 7 2 AVCS 1 9 7 3 AVCS 1 9 7 4 AVCS 1 9 7 5 AVCS. 1 9 7 6 AVCS. 1 9 7 7 AVCS. 1 9 7 8 AVCS. 1 9 7 9 AVCO. 1 9 0 0 AVCS. 1 9 0 1 AVCS. 1902 AVCO. 1 9 0 3 AVCS. 1 9 0 4 AVCS. 1905 AVOS.
See Tab le F.5-5 f o r s m a r y o f supplemental storage opera t ion .
- , .. - ~ - ~ -~ ~~ ~

TABLE F.5-4
AVERAGE PERCENT WITHDRAWAL BY MONTH 5 PERCENT AVERAGE/5 PERCENT MAXIMUM WITHDRAWAL CRITERIA
Average Average Average Percent
Flow Draw o f Month - ( c f s ) ( c f s ) Flow
November
December
January
February
March
Ap r i 1
May June
J u l y
August
September
October
49 Year Average Draw 9.62 49 Year Average Flow 246.80 49 Year Average Percent 3.90

TABLE F . 5 - 5
Y e a r -
SUPPLEMENTAL PUMPING FROM SECONDARYIFLORIDAN AQUIFERS WITHDRAWAL C R I T E R I A = 5 PERCENT AVERAGE15 PERCENT MAXIMUM
P a g e 1 o f 2
Nov D e c Jan F e b Mar - - - - - Jun - - - - - 192 - - - - -- 2 2 2
1,2 2 --
192 2 2 2 - -
- - -- 2 2 --
- - - - --
2 -- - - 2 --
192 1.2 - - - - 1 - - - -
1.2 2 -- 2 - -
-- - - 2 - -

TABLE F.5-5 (Continued) Page 2 o f 2
Year - - - - - - Nov Dec Jan Feb Mar & - Jun - J u l fi - Sep - Oct
Number o f Months o f Pumping
Secondary 25 3 37 4 24 2 15 7 0 0 0 0
F l o r i d a n 25 22 21 14 11 8 10 20 0 0 0 0
Note: 1 = Secondary Aqu i fe r punping 3.0 mgd. 2 = F l o r i d a n Aqu i fe r pumping 3.7 mgd.

TABLE F.5-6
RESERVOIR STORAGE 5 PERCENT AVERAGE/15 PERCENT MAXIMUM WITHDRAWAL CRITERIA
(WITH SUPPLEMENTAL SUPPLY) P a g e 1 o f 2
Y e a r - 1 9 3 6
Maximum R e s e r v o i r S t o r a g e
( a c r e - f e e t )

TABLE F.5-6 (Continued)
Year -
Page 2 o f 2
Maximum Reservoir Storage
( a c r e - f e e t )
49 years average o f y e a r l y storage r e q u i r e d = 2931.76 i n acre - fee t

TABLE F.5-7
YEARLY SUMMARY OF RIVER WITHDRAWALS WITHDRAWAL CRITERIA 5 PERCENT AVERAGE115 PERCENT MAXIMUM
(WITH SUPPLEMENTAL SUPPLY)
YEAR - FLOW - ALLOWABLE WITHDRAWAL
ACTUAL YI TtQRAWAL
X Of FLOW -
1937 AVG5 1938 AVL5 1939 A V G j 1940 AL'G3 IS41 A V C i IT47 AVGi . 1943 AVGS 1944 A V G i 1945 AVGS. 1946 AVCS. 1947 AVGS 1948 AVGS. 1949 AVCS 1950 AVGS 1951 AVGi . 1952 AVGS. 1953 A V C i 1954 AVGS 1955 AVGi . 1956 AVCS. 1957 AVCS. 1958 AVOS 1959 AVOS. 1960 AVCS 1961 AVCS. 1962 AVCS. 1963 AVCS. 1964 AVCS. 1965 AVCS. 1966 AVOS. 1967 AVCS. 1968 AVOS. 1969 AVCS. 1970 AVCS. 1971 AVCS. 1972 AVCS. 1973 AVCS. 1974 AVCS. 1975 AVCS. 1976 AVOS. 1977 AVOS. 1978 AVOS. 1979 AVOS. tsao AVOS. 19al AVOS. ivaz A v o s . 1933 AVCS. 19a4 AVCS. 1985 AVOS.
See Tab le F.5-9 f o r slnnnary o f supplemental storage opera t ion .

TABLE F .5-8
AVERAGE PERCENT WITHDRAWAL BY MONTH 5 PERCENT AVERAGE115 PERCENT MAXIMUM WITHDRAWAL CRITERIA
Month - November
December
January
February
March
Ap r i 1
May June
J u l y
August
September
October
Aver age Flow ( c f s )
8.16
5.88
7.20
8.76
8.16
8.16
3.84
16.56
23.52
22.44
11.40
12.84
49 Year Average Draw 49 Year Average Flow 49 Year Average Percent
Aver age Draw ( c f s )
83.28
68.88
107.52
120.72
154.56
82.80
27.60
175.92
429.12
637.80
691.68
381.60
Percent o f
F low
9.78
8.56
6.65
7.25
5.31
9.78
13.84
9.41
5.47
3.52
1.64
3.86

TABLE F.5-9
Year - 1937 1938 1939 1940 1941 1942 1943 1944 1945 1946 1947 1948 1949 1950 1951 1952 1953 1954 1955 1956 1957 1958 1959 1960 1961 1962 1963 1964
SUPPLEMENTAL WITHDRAWAL C R I
PUMPING FROM SECONDARY/FLORIDAN AQUIFERS :TERIA = 5 PERCENT AVERAGE/15 PERCENT MAXIMUM
Page
Nov Dec Jan Feb Mar 9 & Jul Aug 2 - - - - - Oct -

TABLE F.5-9 (Continued) Page 2 o f 2
Year - - - - - - Nov Dec Jan Feb Mar @ - Jun - J u l & 9 - Oct
Number o f Months o f Pumping
Secondary 2 2 2 10 2 7 4 11 0 0 0 0
F l o r i d a n 2 2 4 2 1 3 8 14 0 0 0 0
Note: 1 = Secondary Aqu i fe r pumping 3.0 mgd. 2 = F l o r i d a n Aqu i fe r pumping 3.7 mgd.

MYAKKA RIVER MINIWM FLOW CRITERIA CALCULATION ClONTHLY MEAN STREAWLOW DATA ( c fs )
(USGS S ta t ion a t Highway 72)
Water , Yeer - act
1963 333.00 1964 292.OOa 1965 54.60 1966 409.00 1967 404.00 1968 413.00 1969 123.00 1970 564.00 1971 150.00 1972 518.00' 1973 80.40 1974 291 .OOa 1975 7.09 1976 453.00 1977 115.00 1978 256.00 1979 109.00' 1980 732.00 1981 225.OOa 1982 110.00
Average 72.0 Lowest Flow
Percent 0.70 I h l t i p l i e r
M i n i m u 50.50 Flow
a F ive loneat Flows.
Nov - 49.70
125.OOa 3.24
47.50 69.20 23.10
181 .OO 193.OOa 11.40
220.00 48.60' 14.70' 0.66
181 .OO
88.20 52 .60a 18.40 86.10 29.20 41.80
9.67
Mar - 252.00 181 .oo 79.40
110.00 14.70' 11 .608
543.00 600 .OOa
5.21 29.50
158 .OOa 15.60 3 .30~
21.90 37.40
379.00 187.00 192.00
37.10 104.00
10.1
Jun - Jul - 79.20 191.00 2.65' 26.60'
305.00 1027.00 321.00 369.00 398.00 319.00 608 .OO 1258.00 343.00 225.00 522.OOa 165.OOa
0.00 61 .loa 235.OOa 96.80
3.69 99.70 171.OOa 1221.00
0.00 472.00 28.40 184.00
5.95 122.00 31.50 503.00 49.30 127.00 98.20a 63.20:
5.17 16.80 1277.00 775.00
2.30 52.9

Month - January
February
March
A p r i l
May
June
J u l y
August
September
October
November
TABLE F.2-8
MONTHLY NET RAINFALL
Aver age Net R a i n f a l l
( incheslmonth)
-0.50
December

TABLE F.4-1
Year - 1936
YEARLY STORAGE REQUIREMENTS 5 PERCENT AVERAGE15 PERCENT MAXIMUM
WITHDRAWALS Page 1 o f 2
Maximum Reservo i r Storage
( ac re - fee t )

,
- . w r
70
x w - R 2 W
5 I- n = =- W 2 = 3 : 40- s J -1
k z 2 =- b n W I 0 I ro-
10-
0
-
_ _ _ ---
YEbRLY TOTAL --------- PERIOD OF RECORD AVERAOE
P E A K YOMTULY I A I M r A L L I
b , , /--\,
A \ A , , .-1 r
'- 1 , \
1 1 1 1 1 1 1 1 1 1 1 1 1 1 1 1 1 1 1 1 1 1 1 1 ~ 1 1 ~ 1 1 ~ 1 1 1 1 1 1 1 1 1 1 1 u 4s 4, u 49 w 31 st 53 Y M J. 51 w 50 LO st sz S, .4 65 M ST M 69 70 71 IZ 73 14 75 T S TI II 79 an *I n 13 M n
YEAR
Figure F.2-1. Myakka State Park Rainfall Data Sumnary.
D.rms&Moom

KEY:
- YEARLY AVERAGE FLOW - --- - PERIOD OF RECORD AVERAGE aan -
00-
.
0 l l l l l l L 1 1 1 1 1 1 1 1 1 1 1 1 1 1 1 1 1 1 1 1 1 1 1 I I I I I I I ~ ~ I
45 u ,, ,,, 31 $9 Y s s 51 w 3, 61 a 63 64 '3 66 67 w 69 10 11 72 73 74 13 m rr m 1s no ma mz 83 w
YEAR

J
b
-
,,, 1.5- w 4
ti 2 D a 1.0- E w a LL 0
n 0 - 0 .5 - a W 0.
Y 0
s
I r------ / K%ikLR? STATE PARK ------ I MYAKKA RIVER
,,,,--A /a HWY 72
I I I
$5 I
55 65 75 85
YEARS
F igu re ~ . 2 - 3 . Rainfal l /Runoff V a r i a t i o n from Per iod of Record Average.
A QmnsLY-

,,, 1.5- (3 a a W
4) n g I.0- 0 W a IL 0
0 0 - 0 . 5 - a W a k 0
8
- - - - - - - - - . . I
PEACE RIVER AT ARCAOlA
L - - - - - - - - --- - ----- MYAKKA R I V E R AT HWY. 72
85 I I I I 55 65 75 85
YEARS
Figure F.2-4. Myakka River/Peace R ive r Discharge Comparison.
2 DNW0.a Lkorr

r 16
14
I t 0 2
W
10- d: * - 0 Z W a z I-
6
4
2
0 2
I I -
-
-
-
-
-
-
I 1 1 I I 1 I I I I 4 6 8 I 0 12 I4 I6 I0 20 22
STORAGE (AC-FT X 100)
Figure F.3-1. Yield Versus Storage and Maximum % River Withdrawal. i h

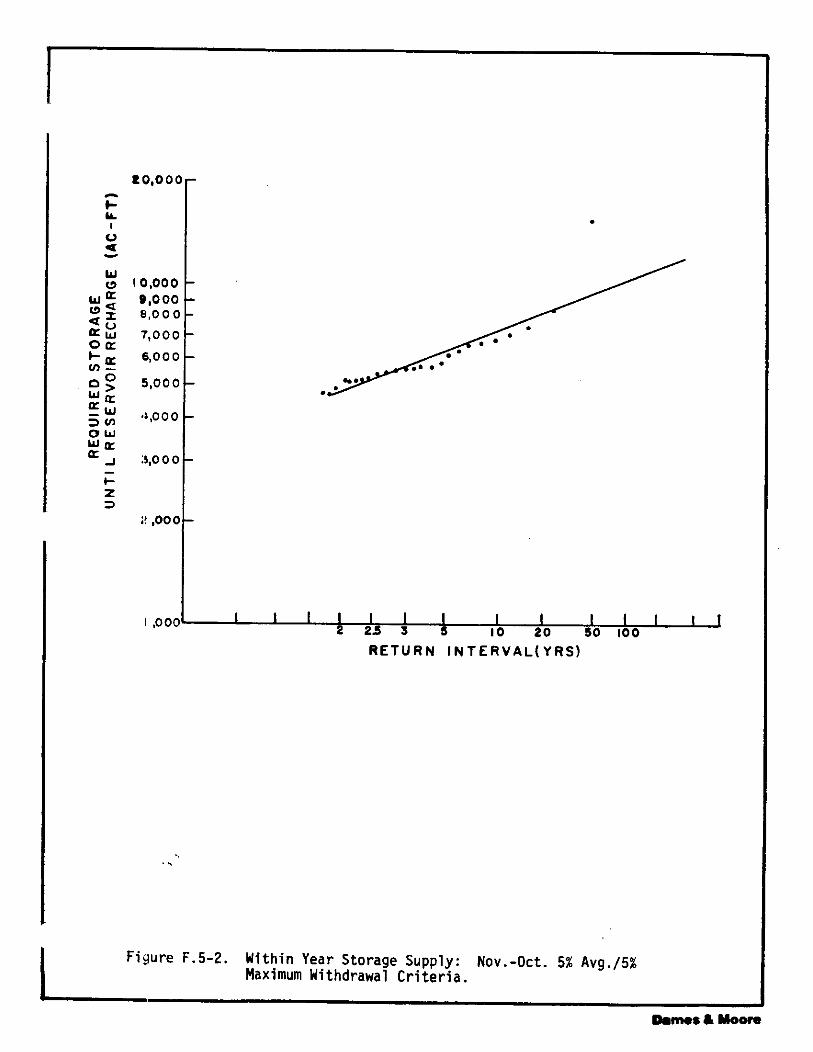
L0,000- - e LL
I v a - W 0 10,000
w a 9 ,000- w ",,ooo
7,000 0 a
a 6,000 U J - n 5,000 W a
=) 'L y) w 't,OOO 0 W
E a J .5,000 - I- z 2
;' ,000
1,000
- - - - -
- -
-
I I I 2 2 3 5 I I I 5 I 10 I 20 I 50 I 100 I I I [ RETURN I N T E R V A L ( Y R S )
. Figure F.5-2. Within Year Storage Supply: Nov.-Oct. 5% Avg./5%
Maximum Withdrawal Cr i ter ia .
- D.m.8 L M o o m


t0,ooo
0 a - W 0 IQOOO-
*ooo- w a 8,000
K W 7,000- 0 = b 6,000- V) -
0 0 > s*ooo- w a
4,000- 3 w Z K
3,000 K - + z a
2,000
1,000
-
-
-
-
- I I I I I 1 I I I I I I I 1 2 2 3 3 s 1 0 20 so 100
R E T U R N I N T E R V A L ( Y R S )
Figure F.5-4. Within Year Storage Supply: Jan.-Oct. 5% Avg./5% Maximum Withdrawal C r i t e r i a .
I.

-me. & Moore
P
F igure F.5-5. Within Year Storage Supply: Feb.-Oct. 5% Avg./5% Maximum Withdrawal C r i t e r i a .
DATA TO BE PRDVIDIED
Figure F.5-6. Within Year Storage Supply: Mar.-Oct. 5% Avg./5% Maximum Withdrawal C r i t e r i a .


Dames Moo-
10,000 9,000 8,000
7,000
6,000
- 5.000 C- + 4.000- 0 a - w 3,000- c 3 a
g: ; 2,000-
o a t- Y) a
' 0 0 W > a a - W 3 fn 1,000 O W 900- E a -r 800- -
700- Z = 600-
500-
400-
300
LOO
100-
r - - - - -
-
-
I I I I I I I I I I I I 1 1 2 2.5 3 S 10 20 50 100
R E T U R N I N T E R V A L ( Y R S )
I Figure F.5-8. Within Year Storage Supply: May-Oct. 5% Avg./5%
Maximum Withdrawal Cr i ter ia .
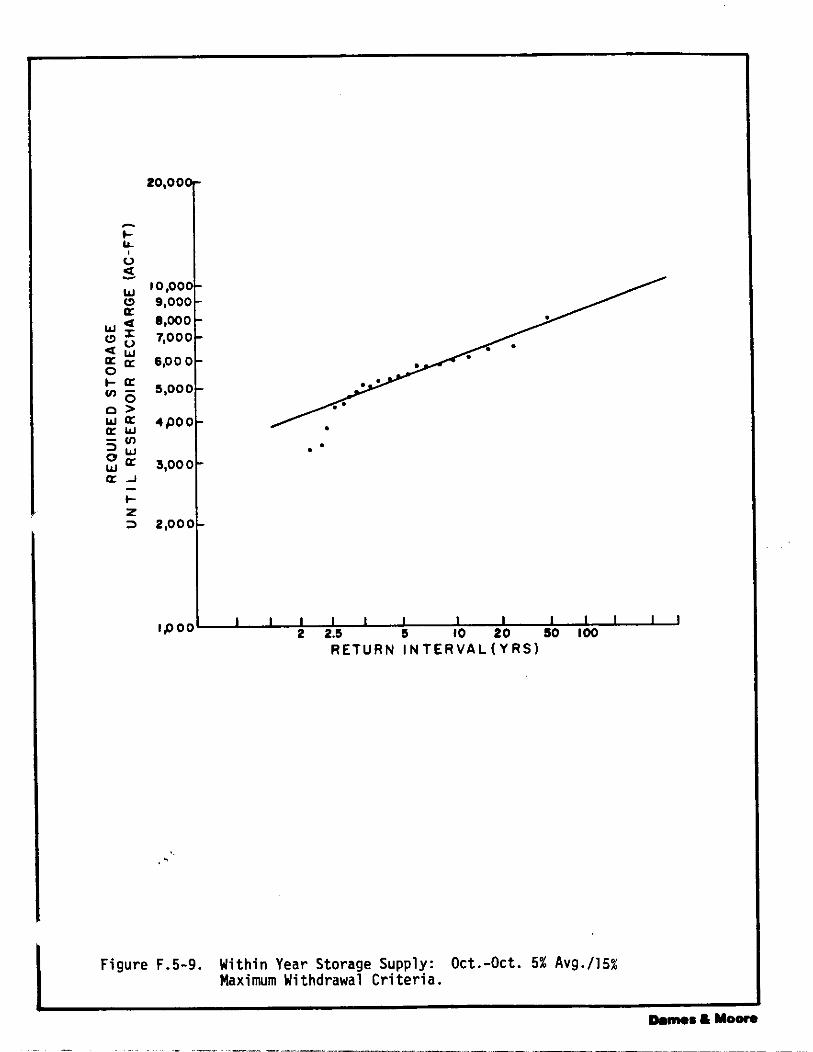
R E T U R N I N T E R V A L ( Y R S )

I I I I I I I I,OO 0.
I I I I I I 2 U 5 10 2 0 so 1 0 0
R E T U R N INTERVAL( YRS)


20,000-
- t LL
0 4 - w 10,000- (3 9,000- K a 8,000-
a 5 7,000- a 6 ,000- 0
I- K * - 5,000- 0
0 > 5 4 ,000-
5 * 0 w a 5,000 - a J -
+- Z = 2 ,000- . . .
I I I I I I I 1,000 I I I 1 I I
2 2 5 5 10 20 SO 100 R E T U R N I N T E R V A L ( Y R S )

Dames & Moore
I
*
20,000-
- t LL
U a - W 10,000- w 9,000- a a anow-
7,000-
~ 0 0 - 0 a I- a - spoo-
0 0 > W a 4,000 a w - 2: w a 3m0 a J -
k Z 3 2poo-
1,000
. -
-
. . . .
- I I I I I I I I I I I I 1 e u s to 20 w 100
R E T U R N I N T E R V A L ( Y R S )
Figure F.5-13. Within Year Storage Supply: Feb.-Oct. 5% Avg./15% Maximum Withdrawal C r i t e r i a .


D a m s & M o o r e
Figure F.5-16. Within Year Storage Supply: May-Oct. 5% Avg./l5% Maximum Withdrawal Cr i te r ia .
I
3,000-
- t 28000-
0 a - W a a u
W 1 1,000- w 900- a [r 100- a 0 K 700- - rn O 600- > : a a w 500 - V)
400- W a -
I- 300- z 3
200
100
-
-
I I I I I I I I I I I I J 2 25 S 10 20 SO 100
R E T U R N I N T E R V A L ( Y R S )

tlYAKKA
SO4 NORMAL = 20 mg/l RIVER
SO4 WITH SUPPLEMENT 1 = 35 mg/l
, I, SURFACE
SO, = 20 mg/l STORAGE
CONVENTIONAL TREATMENT
SO4 NORMAL = 20 mg/l SO4 = 100 mg/l (SUPPLEMENT 1) SECONDARY SO4 WITH SUPPLEMENT 1&2 = 250 mg/l
- AQUIFER
SO, = 1000 mg/l
so, = iooo mg/l (SUPPLEMENT a )
- -
SO, = 20 &
AQUIFER
F igure F.5-17. Supply Schematic.
> ..-I-
R/O TREATMENT
SO4 = 1000 mg/l FLORIDA14

t
8 0 0 0 - I- LL I
U a - 1 6 0 0 0 - I- z 0 I LL 0 w z - 4000- Z z - w W m + a 2000- W w a a 0 I- U)
0
SUPPLY POOL FULL = BOO0 AC-FT PERMANENT POOL = 2 0 0 0 A C - F T
SUPPLEMENT I
I I 1 I I I I 1 NW DEC JAN FEE MAR A PR YAY JUN
Figure F.5-18. Reservior Rule Curve 5% Avg./5% Max. Withdrawal Cr i te r ia . > - -.---

5 0 0 0 SUPPLY P O O L : 5 0 0 0 AC-FT (PERMANENT POOL = 1250 A C - F T )
0 I I I I I I I I NOV DEC JAN FEE MAR APR Y A Y JUN
APPENDIX G
CONCEPTUAL DESIGN REPORT
by BOYLE ENGINEERING CORPORATION

CONCEPTUAL DESIGN REPORT RIVER DIVERSION/TRANSMISSION SYSTEM
SARASOTA COUNTY RINGLING MACARTHUR RESERVE
WATER SUPPLY PROJECT OR-D28-103-30
PREPARED FOR DAMES AND MOORE FEBRUARY 1986
BOYLE ENGINEERING CORPORATION
Principal in charge: H.W. Haeseker, PE
Project Manager: H. William Persons, PE
Project Engineers: David L. Farabee, PE John T. Shugert, PE Steven M. Lockington

TABLE OF CONTENTS
Section
I INTRODUCTION
A . River Diversion System . . . . . . . . . . . . . 1 . . . . . . . . . . . . . . . B Transmission System 1
I I RIVER DIVERSION SYSTEM
. . . . . . A . Design Criteria and General Concepts 2
1 . Design Criteria . . . . . . . . . . . . . . 2 2 . Operational Concept . . . . . . . . . . . . 4
. . . . . . . . . . . . B . River Diversion Channel 5
. . . . . . . . . . . . . . . . . . . 1 Location 5 2 . Preliminary Hydraulic Analysis an3 Channel
Sizing . . . . . . . . . . . . . . . . . . 6 3 . Diversion Channel Costs . . . . . . . . . . 8
C . River Pump Station . . . . . . . . . . . . . . . 9
General . . . . . . . . . . . . . . . . . . 9 Site Facilities . . . . . . . . . . . . . . 9 Pumping Units . . . . . . . . . . . . . . . 11 Pump Station Sump . . . . . . . . . . . . . 15 Channel Divergence . . . . . . . . . . . . . 16 Pump Station Building . . . . . . . . . . . 17 Fuel Storage Tank . . . . . . . . . . . . . 18 Instrumentation. Controls. and Switchgear . 19 Pump Station Estimated Construction Costs . 19
D . Reservoir Influent Pipe . . . . . . . . . . . . 21
1 . Preliminary Hydraulic Analysis and Pipe Sizing . . . . . . . . . . . . . . . . . . 21
2 . Pipe Materials . . . . . . . . . . . . . . . 22 3 . Reservoir Pipeline Estimated Construction
Costs . . . . . . . . . . . . . . . . . . 23
'E . Summary . . . . . . . . . . . . . . . . . . . . 23
I I I TRANSMISSION SYSTEM
A . Design Criteria and General Concepts . . . . . . 24
1 . Design Flow Rate . . . . . . . . . . . . . . 24 2 . Operational Concept . . . . . . . . . . . . 2 5

TABLE OF CONTENTS (Con't)
Section
B . Transmission Pipeline . . . . . . . . . . . . . . . . . . . . . . . . . . . . . . . . 1 Routing . . . . . . . . . . . . 2 Myakka River Crossing
3 . Preliminary Hydraulic Analysis and Pipe1 ine Sizing . . . . . . . . . . . . . . . . . .
4 . Pipeline Materials . . . . . . . . . . . . . 5 . Pipeline Unit Construction Costs . . . . . . 6 . Estimated Costs of Alternative Routes and
Pipeline Sizes . . . . . . . . . . . . . . 7 . Selection of Transmission Pipeline
A1 ignment . . . . . . . . . . . . . . . . 8 . Life Cycle Cost Analysis . . . . . . . . . . . . . . . . . . . . . . . . . 9 Pipeline Surges
C . Transmission Pump Station . . . . . . . . . . . . . . . . . . . . . . . . . . . . . . 1 General
2 . Site Facilities . . . . . . . . . . . . . . . . . . . . . . . . . . . . . . 3 Pumping Units 4 . Instrumentation. Controls and Switchgear . . 5 . Pump Station Construction Costs . . . . . .
D . Summary . . . . . . . . . . . . . . . . . . . . 1 . Selected Preliminary Facilities . . . . . .

LIST OF TABLES
Table NO.
Streamflow Data . . . . . . . . . . . . . . . . 6
Diversion Channel Characteristics . . . . . . . 7
. . . . . . . Estimated Diversion Chanpel Costs 8
150 CFS Pump Station Typical Pump Operating Characteristics . . . . . . . . . . . . . . . 13
300 CFS Pump Station Typical Pump Operating Characteristics . . . . . . . . . . . . . . . 14
500 CFS Pump Station Typical Pump Operating Characteristics . . . . . . . . . . . . . . . 15
Typical Pump Station Sump Characteristics . . . 16
. . . . . Pump Station Building Plan Dimensions 18
Estimated Pump Station Construction Costs . . . 20
Reservoir Influent Pipe Sizes . . . . . . . . . 2 2
Reservoir Pipeline Estimated Construct Cost . . 23
Estimated Construction Cost for River Diversion System . . . . . . . . . . . . . . . . . . . . 2 4
Flow Projections . . . . . . . . . . . . . . . . 2 5
Pipeline Unit Construction Cost Estimates . . . 34
Comparison of Alternative Pipeline Cost Estimates . . . . . . . . . . . . . . . . . . 36
Typical Pump Operating Conditions . . . . . . . 4 3
Estimated Construction Cost for Transmission . . . . . . . . . . . . . . . . . . . . System 4 8

LIST OF EXHIBITS
Exhibit NO.
River Diversion Location Plan
System Schematic
Pump Station Section
System Head and Pump Curves 150 CFS Station
System Head and Pump Curves 300 CFS Station
System Head and Pump Curves 500 CFS Station
Typical Channel Section and Pump Station Plan
Transmission Pipeline Routes
Hydraulic Schematic Transmission System Single 48-inch Pipe
Hydraulic Schematic Transmission System Single 36-inch Pipe
Hydraulic Schematic Transmission System Double 36-inch Pipes
Transmission System Head and Pump Curves, 48-inch Pipeline
Transmission System Head and Pump Curves, 36-inch Pipe1 ines

COUCEPTOAL DESIGN REPORT
RIVER DIVERSION/TR&NSUISSION SYSTEM
I. IUTRODUCTIOU
A . RIVER DIVERSION SYSTEM
The River Diversion System consists of facilities necessary
to transport water from the Myakka River east to a proposed
surface water reservoir on the RMR tract. The River
Diversion System includes a canal approximately 0.75 miles in
length, a River Pump Station, and discharge piping to the
reservoir. This report is intended to identify an
appropriate design concept and to provide conceptual cost
estimates which may be used in conjunction with cost estimates
for other project components to determine the appropriate
design capacity for the river diversion system components
prior to preliminary design.
B. TRANSMISSION SYSTEM
.The Transmission System for this project consists of
facilities necessary to transport untreated water from the
RMR tract, east of the Myakka River, to a proposed water
treatment plant to be located just west of Cow Pen Slough in

Section 21, Township 38 South, Range 19 East, Sarasota County.
The raw water source for this project, as discussed elsewhere
in this report, will consist of a combination of pumped
groundwater, collected surface water and diverted Myakka
River water.
The proposed Transmission System will include a pumping
station (with pumps, forebay tank and motor control center)
and about 4 miles of pipeline(s) with river crossing and other
appurtenant facilities.
11. RIVER DIVERSIOU SYSTEM
A. DESIGN CRITERIA AND GENERAL CONCEPTS
1. Design Criteria
The allowable withdrawal rate from the Myakka River is
currently unknown. It is assumed that the diversion rate
will initially be limited to 5 percent of the
instantaneous flow in the river. Because of the
possibility that the allowable diversion rate may be
increased, the conceptual design presented in this report
has been based on a maximum allowable diversion rate of
25%.

Three different pump station sizes were investigated.
The maximum pumping rates were 150, 300, and 500 cfs
(96.9, 193.9, and 323.1 MGD).
It is recognized that, due to the extreme seasonal flow
variations in the Myakka River, the use of the river pump
station will be intermittent, with the largest pumps used
infrequently. For this reason, it was assumed that the
pumps would be diesel engine driven. This should result
in substantial savings by avoiding the demand charge for
electrical service to large electric motors. During
preliminary design a comparison of diesel engine driven
versus electrical driven pumps should be made.
To meet the wide range of flows anticipated without having
numerous pumps, the pumps would need to operate at
variable speeds. This can be accomplished by varying the
engine speed.
Diesel engines can generally operate at speeds ranging
from 1200 to 2400 rpm. This makes it possible to utilize
a combination of several engine-driven pumps to obtain a
wide range of pumping rates to match the allowable
diversion rates under differing river flow conditions.

2. Operational Concept
Development of the conceptual design included considera-
tion of the operational conditions anticipated. The
following paragraphs describe some of these conditions
and their accommodation in the conceptual design.
Raw water will be diverted from the Myakka River through a
diversion channel extending from the river to a pump
station located adjacent to the reservoir. The pump
station will pump water from the channel into the storage
reservoir.
In order to optimize water withdrawals from the river
without exceeding regulatory constraints, it is expected
that close control over the withdrawal rate will be
desirable. Normally, this can be done by adjusting the
speed of a carefully selected assortment of pumps.
However, at very low flow rates, the use of continually-
operated engine-driven pumps becomes impractical.
Diversion at these low flow rates would be better
accomplished through the use of small electric motor-
driven pumps or by intermittent pumping coupled with a
low-flow control structure between the river and the
diversion channel. This intermittent pumping arrange-
ment would involve storage in the diversion channel or in
an off-channel basin.

For this reason, storage of the water in the pump station
sump, diversion channel, or off channel should be
investigated during preliminary design. Storage would
be sized to limit pump cycling at low diversion rates and
to utilize pumps within an efficient operating range.
This option should be compared to the alternative of
providing several small pumps to pump these flows. For
flows less than some minimum rate, the cost of pumping is
expected to exceed the benefit of pumping; this minimum
cost-effective diversion rate should be estimated during
preliminary design.
B. RIVER DIVERSION CHANNEL
1. Location
The diversion channel was preliminarily located in the
northern part of the site as shown on Exhibit 1. This
location was selected because it entails higher stream
channel elevations along the river. The higher stream
channel elevation is desirable to minimize the effects of
high tides in the Gulf of Mexico and possible migration of
salt water upstream, especially during low or no flow.
The river channel bottom in the area selected is near
elevation 2.0 feet MSL. For comparison, the elevation of
the stream bed just downstream of Rocky Ford
(approximately one mile south of the selected area) is 0.3

feet MSL. (These stream bed elevations are based on
survey information supplied by Bennett and Bishop.)
2. Conceptual Hydraulic Analysis and Channel Sizing
The channel was sized for the condition of a 25 percent
diversion rate. This is a conservative assumption
because, for a given diversion flow rate, the water
surface elevation in the Myakka River is lower for a 25
percent diversion than for a 5 percent diversion. Table
1 compares the streamflow required for 150, 300, and 500
cfs diversion rates at 5 and 25 percent withdrawal.
TABLE 1
STREAMFLOW DATA
Diversion Rate Streamf low Rate Streamf low Rate 5% Withdrawal 25% Withdrawal
(cfs) (cfs) (cfs)
A river section near the diversion point was analyzed to
determine the approximate water surface elevation in the
Myakka River for these 25 percent streamflow rates.
Manning's equation was used to estimate the stream
depths. The effects of backwater conditions from
downstream channel restrictions were neglected. The
diversion channel was then sized to limit headloss in the

channel to 1 foot. The anticipated channel length is
approximately 3,200 feet. It was assumed that the
diversion channel invert will be level at an elevation of
2.0 feet MSL. This arrangement was developed to limit
excavation for the channel and keep velocities low. This
arrangement also results in more favorable pump station
geometry than would be possible if a deeper channel were
used.
The diversion channel was assumed to be trapezoidal in
shape with side slopes of 4 horizontal to 1 vertical.
Table 2 lists the preliminary channel characteristics.
TABLE 2
DIVERSION CHANNEL CHARACTERISTICS
Water Surface Water Surface Diversion Elevation at Elevation at Bottom Velocity at
Rate Myakka River Pump Station Width Pump Station (cfs) ( f t) (ft) (ft) (fPS)
The bottom of the channel appears to be in very poor rock.
It has been assumed that excavated material below 5.0 feet
MSL will be rock which may present construction
difficulties. This assumption should be checked in more
detail by soil borings during preliminary design.

Specific channel locations and channel cross sections
should also be investigated in more detail during
preliminary design.
3. Diversion Channel Costs
Unit costs for construction of the diversion channel were
obtained by review of recent bid tabulations for similar
large excavation projects. These unit costs were used to
estimate the total probable construction costs which are
intended to include only clearing, excavation, and
grassing of the channel. They do not reflect transition
of the channel dimensions to match into the pump station;
those costs are included in the pump station costs. It is
assumed that the excavated material can be either
disposed of locally or used for construction of the
reservoir embankment. The estimated probable construc-
tion costs for diversion channels sized for a 25% minimum
diversion rate are shown in Table 3.
TABLE 3
ESTIMATED DIVERSION CHANNEL COSTS Diversion Channel Estimated Probable Flow Rate Bottom Width Construction Cost
(cis) (ft)
NOTE: Based on ENR = 4 2 0 0

C. RIVER PUMP STATION
1. General
The River Pump Station will lift water from the river
diversion channel to a surface water storage reservoir.
Pumping is required to overcome the static difference in
water levels between the channel and the reservoir and to
overcome friction losses in the piping.
2. Site Facilities
Tentative site location of the pump station is shown on
Exhibit 1. It is anticipated that the pump station will
be adjacent to the reservoir's west embankment.
The location was selected to meet the requirements
discussed previously for the river diversion channel and
to locate the pump station outside the 100 year flood
plain. The limits of the 100 year flood plain are
published by the Federal Emergency Management Agency
(FEMA) . Based on these location constraints, the
conceptual design conclusion is that the pump station
should be located in Section 18, Township 38 South, Range
20 East.
The configuration of the pump station facility is shown
schematically in Exhibit 2. The actual number of pumping

units will depend on the maximum pumping capacity of the
station. The pumps would discharge into a common
manifold which would connect to a short pipe discharging
to the reservoir. A typical pump station section is
shown in Exhibit 3.
A pumping unit to provide redundancy for the largest
pumping unit is included. It is recognized that the
small pumping units will operate most of the time during
both high and normal flow conditions. For this reason,
two small pumps should be provided to reduce wear on a
single unit.
The river diversion channel will include a transition
section to match into the pump station sump. Maximum
channel divergence should be 5 degrees to provide a
smooth transition of flow, minimize headloss, and reduce
velocities entering the sump.
The fuel storage tanks shown on the pump station schematic
will provide fuel to the pump engine drives. The fuel
tanks may be below ground with a small electric driven
pump to deliver fuel to the engine drive units or above
ground to allow for gravity flow to the engines. For
buried tanks, groundwater monitoring wells will be
required. For above ground tanks, an enclosing berm will

be required. It is assumed that a minimum of two tanks
will be required.
3. Pumping Units
The pumping units contemplated for this installation
would be variable speed vertical type mixed flow pumps
with engine drivers. Mixed flow pumps provide high
operating efficiency for the relatively high flows and
low heads associated with this facility.
System head curves were developed to reflect the
potentially varying conditions to evaluate pumping
requirements. The system curve was developed for a
single pipe entering the reservoir beneath the low water
level. The sizing of the pipe will be discussed in a
subsequent section. System head curves were based on
headloss calculations using the Darcy-Weisbach formula
with a headloss coefficient of 0.013. The suction
elevation for the pumps was assumed to vary between
elevation 2 to elevation 10 and the reservoir variation
was assumed to vary from elevation 15 to 25 feet. The
static conditions are reflected in the system curves in
terms of a minimum of 9.5 feet and maximum of 23.0 feet.
From the system curve it is possible to evaluate the
performance of individual and multiple pumping units.

For selection of pumping units, it was assumed that the
reservoir was full and each pumping unit was operating at
full speed. The pumping units were sized based on the
principle that each pumping unit would have twice the
pumping capacity of the next smaller unit at the design
point. By slowing down or speeding up the engine drives,
the units can be varied to meet other conditions on the
system curve. All tables will reflect the design point
conditions. Pump curves have been adjusted to reflect
losses in the suction and discharge piping, valves and
fittings. During preliminary design,after selection of
a pump station capacity and reservoir operating
elevations, the pump selection should be refined by
identifying the reasonable operating range for each pump
and each combination of pumps. This refinement may
result in a reduction of the total number of pumps
required.
For purposes of conceptual design, it has been assumed
that a building will be provided to house the pumping
units, engine drives, controls and instrumentation.

a. 150 CFS Pump Station:
For the 150 cfs pumping station, it is anticipated
that there would be 6 main pumping units and that
lower flows would be handled by additional smaller
pumping units.
The typical pump operating conditions for the pumping
units are shown in Table 4. These points are
adjusted to reflect suction and discharge losses.
The characteristics of the pumping units are shown in
Exhibit 4 based on performance curves published by a
recognized pump manufacturer.
TABLE 4
150 CFS PUMP STATION TYPICAL PUMP OPERATING CHARACTERISTICS
Design Cumulative Design Pumping Flow Flow TDH Efficiency H.P. unit (cf s) (cfs) ( f t) ( % )
1 9.38 9.38 28.3 7 5 4 0
2 9.38 18.75 28.3 7 5 4 0
3 18.75 37.50 30.3 8 5 7 6
4 37 .SO 75.00 28.1 80 149
5 37.50 112.50 28.1 8 0 149
6 37.50 150.00 28.1 8 0 149

b. 300 CFS Pump Station:
For the 300 cfs pump station it is anticipated that
there would be 7 main pumps.
The typical operating conditions for the pumping
units are shown in Table 5. Pump characteristics are
shown in Exhibit 5 based on performance curves
published by a recognized manufacturer.
TABLE 5
300 CFS PUMP STATION TYPICAL PUMP OPERATING CHARACTERISTICS
Design Cumulative Design Pumping Flow Flow TDH Efficiency H.P. Unit (cfs) (cfs) ( f t) ( % )
c. 500 CFS Pump Station:
It is anticipated that there would be 8 main pumping
units for the 500 cfs pump station because of the
larger range of flow. Table 6 lists the typical

operating characteristics for the 500 cfs pump
station units. The characteristics of the pumping
units are shown in Exhibit 6 based on actual
performance curves published by a recognized pump
manufacturer.
TABLE 6
500 CFS PUMP STATION TYPICAL PUMP OPERATING CHARACTERISTICS
Design Cumulative Design Pumping Flow Flow TDH Efficiency H.P. unit (cf s) (cfs) ( f t) ( $ 1
1 7.81 7.81 25.6 81 2 8
2 7.81 15.63 25.6 8 1 28
3 15.63 31.25 26.9 78 6 1
4 31.25 62.50 25.4 86 105
5 62.50 125 28.8 8 4 243
6 125 250 29.0 89 462
7 125 375 29.0 8 9 462
8 125 50 0 29.0 89 462
4. Pump Station Sump
Sizing of the sump for the pump units was based on the
guidelines of the Hydraulic Standards Institute, pump
manufacturer guidelines, and reasonable clearance
requirements for pump driver units. The sump sizing
allows for divider walls between the pumps. Sump floor

elevations were based on the pump submergence and floor
clearances required for each pump size. The pump station
operating floor was assumed to be at elevation 18.5 ft MSL
which is estimated to be 2 feet above the 100 year flood
elevation. Table 7 lists the basic sump characteristics
for each pump station configuration described previously.
TABLE 7
TYPICAL PUMP STATION SUMP CHARACTERISTICS
Pump Width Length Sump Floor Station Elevation Capacity ( f t) (ft) (it, MSL)
150 3 6 7 5 -5.0
300 3 6 92 -5.5
A trash rack should be provided over the entrance of the
sump to prevent large debris from entering the sump. The
pump station section shown previously in Exhibit 3 shows
some of the features of the sump.
5. Channel Divergence
To allow for smooth transition from the diversion channel
to the pump station a slowly diverging section should be
used. The maximum amount of divergence should be 5
degrees.

A plan view of the pump station in Exhibit 7 depicts some
of the basic features of the divergence and its connection
to the pump station.
Due to the close juxtaposition of the pumping station and
reservoir and the presence of piping between them, access
through this area may be restricted. For this reason, it
is likely that a road crossing the diversion channel will
be desirable immediately upstream of the divergence area.
Such a road crossing could utilize several large concrete
culverts to carry the diversion flow, providing
additional protection from floating debris. This
possibility should be explored in more detail during
preliminary design after the diversion pump station size
has been selected.
6. Pump Station Building
The pumps and engines should be housed in a building to
alleviate environmental concerns over engine noise and to
provide for convenient engine maintenance. The building
should be concrete block and steel construction with a
ceiling height of approximately 30 feet. Since the
diversion channel and discharge piping will limit access
by an outside crane, a bridge mounted crane should be
provided in the building for removal of engines, pumps,
and valves. The building plan dimensions are shown in

Table 8. This building can be flanked by berms on the
north and south to reduce noise.
TABLE 8
PUMP STATION BUILDING PLAN DIMENSIONS
pump Station Width Length Capacity (ftl (ft)
7. Fuel Storage Tank
The actual size of the fuel storage tanks should be
considered in more detail in preliminary design. This
will entail an analysis of streamflows, possible time
before tanker trucks can access the site after major
flooding events, and owner/operator requirements. For
conceptual design, it has been assumed the tanks will be
20,000, 30,000 and 40,000 gallons for for the 150, 300
and 500 cfs pump stations respectively.
An all-weather road will be required to allow tanker
trucks to deliver fuel. The location and size of this
road has not been included in the conceptual design. The
road should be integrated with access to other portions of
the site and other site facilities beyond the scope of
this conceptual design.

8. ~nstrumentation, Controls, and Switchgear
The sequencing and operation of the pumps can be either
manual or automatic based on the requirements of the Owner
and southwest Florida Water Management District (SWFWMD) .
Instrumentation of streamflows, sump water levels, flows
pumped to the reservoir, and reservoir levels will be
required to set pump speeds and decide which pumps will
operate. The requirements of SWFWMD will also dictate
what other information will be required and may greatly
inf luence whether the station can be operated manually or
will require more sophisticated automatic operation.
For this conceptual design, basic manual engine drive
controls have been considered. Remote automatic control
of these pumps should be integrated with other project
instrumentation during preliminary and final design.
9. Pump Station Estimated Construction Costs
The probable construction costs for the pump station
facilities were estimated using bid tabulations from
similar facilities. The costs include the following:
* Site work, including piping and valves.
Basic controls for engine drives.
Channel divergence.
* Building and sump.

* Fuel tanks.
* Basic pumping units.
The estimated probable construction costs are outlined in
Table 9.
TABLE 9
ESTIMATED PUMP STATION CONSTRUCTION COSTS
pump Probable Station Construction Capacity I tem Cost ( $ 1
Pump, Drivers & Piping 874,000 Sump & Channel Divergence 407,000 Buildinq 159.000 Fuel ~ a n k TOTAL
Pump, Drivers & Piping 1,392,000 Sump & Channel Divergence 556,000 Building 169,000 Fuel ~ a n k TOTAL
Pump, Drivers & Piping 1,900,000 Sump & Channel Divergence 627,000 Building 176 ,000 Fuel ~ a n k TOTAL
NOTE: Based on ENR = 4200

D. RESERVOIR INFLUENT PIPE
1. P r e l i m i n a r y H y d r a u l i c A n a l y s i s and P i p e S i z i n g
S i z i n g of t h e r e s e r v o i r i n f l u e n t p i p e must t a k e i n t o
a c c o u n t s e v e r a l f a c t o r s . These f a c t o r s i n c l u d e ve lo -
c i t i e s and a s s o c i a t e d h e a d l o s s e s , e s t i m a t e d amount o f
t i m e t h e f l o w s w i l l b e pumped (which w i l l r e l a t e t o e n e r g y
c o s t s ) , and s t a n d a r d p i p e s i z e s .
The maximum f low r a t e s f o r t h e p i p e l i n e a r e t h e same a s
t h e pump s t a t i o n f lows . Peak r a t e s may o c c u r o n l y
s e a s o n a l l y , b u t t h e amount of time t h e s e f lows may o c c u r
c a n have a s i g n i f i c a n t e f f e c t on t h e o p e r a t i n g c o s t s .
T h i s e f f e c t (and t h e s t r e a m f low a n a l y s i s n e c e s s a r y t o
e s t i m a t e i t ) s h o u l d be i n v e s t i g a t e d d u r i n g p r e l i m i n a r y
d e s i g n .
For c o n c e p t u a l d e s i g n p u r p o s e s , t h e s i z e of t h e p i p e l i n e
was e s t i m a t e d based on r e a s o n a b l e v e l o c i t y and h e a d l o s s
c o n s t r a i n t s . The p i p e was assumed t o be 250 f e e t l o n g .
The p i p e s i z e s s e l e c t e d f o r c o n c e p t u a l d e s i g n a r e a s
f o l l o w s i n T a b l e 10.

TABLE 10
RESERVOIR INFLUENT PIPE SIZES
Design Max Flow Pipe Diameter
(cfs) (in)
A life cycle cost analysis should be performed during
preliminary design to select an economical pipe size for
the design conditions. This analysis should also include
a consideration of the cost and desirability of the use of
multiple influent pipes.
The outlet of the influent pipe in the reservoir would be
a gradually diverging fabricated section designed to
reduce exit velocity and subsequent headloss, and to
dissipate energy, thereby preventing scouring in the
reservoir. The design of this structure was not
considered during conceptual design.
Pipe Materials
For pipes in the size ranges anticipated, the most
appropriate material options are ductile iron and steel.
The 54-inch diameter is the upper limit of the ductile
iron pipe range. The use of multiple pipes would provide

the option of using ductile iron pipe and could provide
improved reliability.
3. Reservoir Pipeline Estimated Construction Costs
The costs for the reservoir pipeline were estimated from
recent bid tabulations for similar sizes and types of
pipe. The costs include pipe material, transportation,
excavation and backfill, seepage collars, reservoir inlet
structure, cathodic protection and contractor overhead
and profit. The probable construction costs are shown in
Table 11.
TABLE 11
RESERVOIR PIPELINE ESTIMATED CONSTRUCTION COST
Design Pipe Probable Max Flow Size Construction (cfs) (in) Cost($)
NOTE: Based on ENR = 4200
E. SUMMARY
Based on the data available at this time and the extent of
evaluation currently possible, it is not appropriate to

select one size of facilities over another. The conceptual
design and costs provided here should be analyzed in
comparison with other project components to arrive at a design
concept for the project as a whole.
The total estimated construction costs for the facilities
mentioned previously are shown in Table 12.
TABLE 12
ESTIMATED CONSTRUCTION COST FOR RIVER DIVERSION SYSTEM
Pump Probable Station Construction Capacity Cost ( $ )
NOTE: Based on ENR = 4200
111. TRAUSI(1SSIOU SYSTEM
A . DESIGN CRITERIA AND GENERAL CONCEPTS
1. Design Flow Rate
The preliminary sizing of the transmission facilities has
been based on the following flow projections provided by
Joint venture:

TABLE 13
FLOW PROJECTIONS
Year Maximum Daily Flow Average Flow
12 MGD 24 MGD 36 MGD 52 MGD
8.6 MGD 17.1 MGD 25.7 MGD 37.1 MGD
The above flow rates reflect the projected demands of the
proposed water treatment plant and are irrespective of
the individual or combined quantities of the three supply
sources. Variations between source supply and demand
will be provided by major storage facilities which are
discussed elsewhere in Appendix - .
2. Operational Concept
Raw water, from the three sources, which are the Myakka
River, Secondary Aquifer and Surface runoff, will be
collected and stored in a reservoir to regulate
variations between supply and demand. The reservoir
will be located east of the Myakka River and will supply a
positive suction for the Transmission Pump Station, also
to be located east of the River. The required flows will
then be pumped through the Transmission Pipeline to a
storage tank at the proposed treatment plant. Exhibit 2
schematically illustrates this concept.
The main storage reservoir will regulate the variations
between the seasonal supply (Myakka River, surface runoff
and Secondary aquifer) and the demand by the treatment
plant. The water surface elevation for this reservoir is
anticipated to range between 15 and 25 feet above mean sea
level (MSL) . These reservoir facilities are discussed in
Appendix - .
A ground storage tank will serve as a terminal control
reservoir for the well collection system and as a forebay
for the Transmission Pump Station. This tank has been
preliminarily sized at 1.5 million gallons. This forebay
tank would provide the following operational functions :
* Start/stop control of well field pumps.
* Allow interim and/or periodic separation of groundwater source from other raw water sources to control water quality.
Act as forebay for the Transmission Pump Station and provide regulated positive suction head for pumps.
* Act as an intermediate flow regulating structure between river intake pumps and transmission pumps during emergency bypass of the main reservoir.
The water surface elevation at the headwater of the
treatment plant will be determined by a raw water
regulating tank to be incorporated into the facilities at
that site. Based on preliminary data, this reservoir was
assumed to have an operating water level range between

elevations 34 and 62 feet with a typical operating level
assumed at elevation 55 feet (all MSL). The Transmission
Pump Station would be primarily controlled by the changes
in the level at this raw water tank.
B. TRANSMISSION PIPELINE
1. Routinq
The Transmission Pipeline is the most costly element of
the Transmission System. These construction costs are
influenced by pipeline length, diameter, material
(strength) and existing field conditions along the
pipeline route.
Two alternative pipeline routes have been considered and
are shown on Exhibit 8. These alternatives were selected
for study as a result of field investigations and a review
of aerial photographs, topographic maps and ownership
plats. Major factors contributing to these alternative
alignments are as follows:
* Location of proposed treatment plant.
Land ownership configurations and location of property lines.
* Location of proposed ~ransmission Pump Station.

The most viable alternative will probably depend on the
ultimate siting of the Transmission Pump Station which in
turn will be influenced by the positioning of the main
storage reservoir. Due to the open terrain along each of
the alignments, construction of the pipeline should be
relatively straightforward utilizing standard methods of
dewatering and open trench installation. Special con-
siderations will be required to cross the Myakka River,
however.
2. Myakka River Crossing
A crossing of the Myakka River is required for either
alternative pipeline alignment. Two methods of crossing
this river were considered; bridging overhead (suspended
or supported) and burial beneath the river bottom.
The primary advantage of an overhead crossing is avoiding
the need to dewater the river. In some instances, this
could result in reduced construction costs. If a vehicle
access bridge or similar type of overhead facility were
necessitated for other reasons, it would probably be more
cost effective to incorporate the pipeline crossing in
the design of the bridge. However, this project does not
contemplate any such facility. Disadvantages of a
suspended crossing would include exposure to potential

vandalism, adverse impacts aesthetically and risk of
damage during high stage flooding of the river.
A buried crossing would not be subject to the
disadvantages of an overhead crossing. However, higher
construction cost could be a significant disadvantage of
a buried crossing.
Crossing of the Myakka River for this project, at either
of two locations is proposed to be by the burial method.
It is anticipated that the low flows which occur during
the drier season of the year could be diverted around a
portion of the crossing and thereby permit complete
dewatering of a segment of the pipeline trench. The two
alternative proposed crossing sites lend themselves to
this approach as a result of existing topographic
features.
As a basis for conceptual design, construction of the
buried crossing was assumed to include restrained joints
and concrete encasement around the pipe. During
preliminary design, geotechnical data should be gathered
to permit a comparison of this technique with other
possibilities, such as jack-and-bore crossing or the use
of ball-and-socket pipe under water.

3. Preliminary Hydraulic Analysis and Pipeline Sizing
Sizing of the Transmission Pipeline must take into
account several factors. Primary factors include the
velocities and head losses (due to friction) resulting
from the quantity of flows which are to be transmitted
throughout the useful life of the facilities. These
factors have a direct impact on the selection of efficient
pumping equipment and must be weighed against the initial
capital cost of the facilities. Selection of pipe sizes
must of course take into consideration the standard
nominal sizes which are available with locally used and
produced pipe products. An additional factor that needs
to be taken into consideration is the potential for
hydraulic surges which result from changes in velocity
caused by pump sequencing and/or valve closing.
The peak quantities of water to be transmitted are the
projected maximum daily flow rates shown in Table 1.
While these peak rates may occur only during the seasonal
high demand periods, the facilities must be sized to
handle them with adequate concern of the foregoing
factors. Consideration of annual operating costs should
of course take into account the projected average flows as
well as the peak flows.

Based on applications similar to this project with
comparable flow rates, experience has shown that pipeline
velocities in the range of 5 to 6 feet per second during
peak flows result in the most cost effective pipe sizes
while meeting the above considerations. Based on this, a
single pipeline to handle the 52 MGD flow projected for
the year 2010 is selected at a standard nominal size of
48-inch. During the preliminary design stage of this
project, a more detailed life-cycle cost analysis of
alternative pipe sizes should be conducted to compare 42,
48 and 54-inch pipelines.
As an alternative to installing a single pipeline to
handle flows which will not occur until future years, a
smaller pipeline could be installed initially. Then a
second pipeline could be installed in the future when
needed. Advantages of two pipelines would include the
following :
Reduce initial capital costs.
* Permits evaluation of the size of the second pipe in later years to reflect updated flow projections.
* System reliability will be increased after installation of the second pipeline because of the ability to keep one pipe in service if the other is down for repairs or maintenance.
Segregate different water quality supplies or sources.

For this alternative, two 36-inch diameter pipelines were
selected. Each pipe would have one-half the capacity of
a 48-inch pipe while keeping velocities and headlosses
about the same. Unless factors in the future were to
dictate otherwise, both pipelines should probably be
constructed within the same rights-of-way. In addition,
it is recommended that both pipes be initially installed
under the Myakka River to facilitate future construction
of the second pipeline without disruption of the river
crossing.
Based on the two alternative pipeline configurations
(single 48-inch pipe and dual 36-inch pipes), hydraulic
schematics were prepared to show the hydraulic grade
lines, during pumping at various flow conditions. These
are shown on Exhibits 9 (Single 48-inch pipe), 10 (Initial
36-inch pipe), and 11 (Dual 36-inch pipes). Head loss
due to pipeline friction was computed using the Hazen-
Williams formula and a roughness coefficient of 140. The
typical static head condition is 33 feet.
The total dynamic head (TDH) at the transmission pump
station ranges from approximately 40 feet to 88 feet based
on typical operating levels in the two tanks. The
potential ranges in pumping head shown on Exhibits 9, 10,
and 11 will be even greater when extreme variations in

water surface levels occur in the two reservoirs. This
necessitates careful analysis and proper pump selection
to design an efficient system. This will be discussed
further in the section on the Transmission Pump Station.
4. Pipeline Materials
For the pipeline size and pressure requirements of this
project, two pipe products are widely used and locally
available, ductile iron pipe and prestressed concrete
pipe. The final design of the pipeline for this project
could be based on either or both of these products.
Preliminary design should include a review of the
corrosivity of soils along the route to aid in the
selection of appropriate pipe materials.
5. Pipeline Unit Construction Costs
Preliminary "base level" unit construction costs have
been prepared for 30-inch through 54-inch diameter pipes.
Costs are intended to include pipe material, taxes,
transportation, normal installation, an allowance for
typical pipeline appurtenances and contractor's overhead
and profit. Pipe material costs have been based on
ductile iron pipe with cement mortar lining. It has been
tentatively assumed that cathodic protection for
corrosion protection will not be required. Costs for

prestressed concrete pipe may be competitive, parti-
cularly in the larger sizes.
Base level installation costs assume medium dense soils
with 1 to 1 trench side slopes, 4 feet of cover over the
pipe, no major utility interference and routine clearing
and grubbing requirements. Preliminary base level unit
construction cost estimates are shown in Table 14.
Conceptual costs have been developed based on an
Engineering News Record (ENR) cost index of 4200 which is
reflective of 1985 construction costs. Appropriate
adjustments may be necessary if the ENR Cost Index varies.
TABLE 14
PIPELINE UNIT CONSTRUCTION COST ESTIMATES (ENR = 4200)
Pipe Diameter (Inches)
Probable Construction Cost ($/LF)
NOTE: Base level unit construction costs are based on Class 50 ductile iron pipe with cement mortar lining and include taxes, transportation, normal installation, typical appurtenances and contrac- tor's overhead and profit.

6. E s t i m a t e d C o s t s of A l t e r n a t i v e Rou tes and P i p e l i n e
S i z e s
A s d i s c u s s e d p r e v i o u s l y , a s i n g l e 48- inch p i p e l i n e , o r a
phased c o n s t r u c t i o n of two 36-inch p i p e l i n e s , h a s been
p r e l i m i n a r i l y s e l e c t e d f o r t h i s p r o j e c t . Two a l t e r n a -
t i v e r o u t e s have a l s o been s e l e c t e d a s shown on E x h i b i t 8.
Es t ima ted c o s t s h a v e been a p p l i e d t o each of t h e s e
a l t e r n a t i v e s , based on ENR c o s t index o f 4200r t o p roduce
t o t a l e s t i m a t e d c o s t s f o r t h e T r a n s m i s s i o n P i p e l i n e .
Each a l t e r n a t i v e i n c l u d e s t h e e s t i m a t e d c o s t o f c r o s s i n g
t h e Myakka R i v e r . These c o s t s a r e based on a b u r i e d ,
c o n c r e t e encased p i p e i n s t a l l e d under t h e r i v e r bo t tom
w i t h a minimum c o v e r of 4 t o 5 f e e t . Also inc luded a r e
t h e e s t i m a t e d c o s t s t o a c q u i r e r igh ts -of -way f o r t h e
p i p e l i n e ( s ) . The w i d t h s o f permanent easemen t s t o be
a c q u i r e d were e s t i m a t e d a t 3 0 - f e e t f o r a s i n g l e p i p e and
5 0 - f e e t f o r a d o u b l e p i p e a r r angemen t . C o s t s of
ea semen t s a r e based on an assumed l a n d v a l u e of $5 r000 p e r
a c r e .
The e s t i m a t e d c o n s t r u c t e d and r igh t -of -way c o s t s f o r t h e
v a r i o u s a l t e r n a t i v e s a r e shown i n T a b l e 15.

TABLE 15
COMPARISON OF ALTERNTIVE PIPELINE COST ESTIMATES
Quantity Unit Description
Route "A" with Single 48-inch Pipe
20,000 L.F. 48-inch Pipe 460 L.F. River Crossing
12,000 L.F. 30 ft. Wide R/W
Route "A" with Double 36-inch Pipe
20,000 L.F. 36-inch Pipe (Initial) 460 L.F. River Crossing
12,000 L.F. 50 ft. Wide R/W
20,000 L.F. 36-inch Pipe (Future)
Routeg'B" with Single 48-inch Pipe
22,000 L.F. 48-inch Pipe 440 L.F. River Crossing
16,000 L.F. 30 ft. Wide R/W
Route "B" with Double 36-inch Pipe
22,000 L.F. 36-inch Pipe (Initial) 440 L.F. River Crossing
16,000 L.F. 50 ft. Wide R/W
22,000 L.F. 36-inch Pipe (Future)
Probable Unit Construction
cost $ cost $
$140.00 $2,800,000 300.00 138,000
3.50 42,000
Total $2,980,000
$ 80.00 $lr600,000 350.00 161,000
5.75 69,000
Subtotal $1,830,000
$ 80.00 1,600,000
Total $3,430,000
$140.00 $3,080,000 300.00 132,000
3.50 56,000
Total $3,268,000
Subtotal $2,006,000
Total $3,766,000
NOTE: Based on ENR = 4200

7. Selection of Transmission Pipeline Alignment
The final selection of Route "A" versus Route "B" will, in
all probability, be determined by the final siting of the
main storage reservoir and the location of the outlet
works. If the final location of the outlet works cannot
be located near the north or south lines of Section 19
(T38S-R19E) then additional pipeline length will have to
be added to the quantities for each of the alternatives.
If the outlet works end up near the middle of Section 19,
consideration should be given to a third, and possible
shorter alignment extending through the center portions
of the sectional ownerships between the Myakka River and
the treatment plant.
Based on the most likely positioning of the main storage
reservoir and outlet works, Route "B" is preliminarily
selected. Also, the dual 36-inch pipe is recommended on
the basis of the advantages discussed previously.
8. Life Cycle Cost Analyses
As presented earlier, preliminary evaluations indicate a
48-inch pipe or two 36-inch pipes to be the most
economical sizes for the Transmission Pipeline. It is
recommended, however, that a life cycle cost analysis be
made during preliminary design of this project when other

factors have been more clearly defined, to confirm these
initial determinations.
9. Pipeline Surges
Pipeline surge analyses were not made for the
Transmission Pipeline at this conceptual stage. Because
of the low operating pressures, flat topography,
relatively short length of pipeline and other hydraulic
considerations, it is not anticipated that pipeline
surges will be of major consequence. Special surge
control devices may not be required. However, during the
preliminary design and after the final operating
conditions are known a surge analysis to confirm these
initial assumptions should be conducted.
C. TRANSMISSION PUMP STATION
1. General
The Transmission Pump Station will boost water from a
reservoir and/or well field supply system east of the
Myakka River, through a pipeline to a receiving tank at
the proposed treatment plant which is located about 2
miles west of the Myakka River. Pumping is required to
overcome a static difference in water level of
approximately 10 and 50 feet and also to overcome the

friction losses generated within the pipeline and pump
station facilities.
2. Site Facilities
Siting of the Transmission Pump Station will depend on the
location of the main storage reservoir, the reservoir
outlet works, the transmission pipeline route, and the
well piping arrangement. It is anticipated that the pump
station will be adjacent to the reservoir enbankment
about one mile east of the Myakka River. This setback
from the river is outside the 100 year flood plain limits
as published by the Federal hnergency Management Agency
(FEMA). The north-south position of the pump station is
anticipated to be in, or near, Section 19. For purposes
of this conceptual design, it has been assumed that the
pump station will be located along the north or south line
of Section 19. This is the basis for the pipeline
alignments and quantities as previously presented.
The configuration of the pump station facilities is shown
schematically on Exhibit 2. Initially, two equally sized
pumping units are proposed, one of which would be a stand-
by unit. One full duty pump would deliver about 17 MGD
which would meet the projected maximum day requirement
for a few years. Additional pump unit of the same size
would be added as needed to meet the increasing demands.

A check valved by-pass between the suction and the
discharge of the pumps is also shown. This is to minimize
the possibility of water column separation in the event of
a sudden shut-down of the pumps such as would occur with a
power failure.
The 1.5 million gallon tank would serve primarily as a
receiving vessel and pump station forebay for a
groundwater supply system. As such, both reservoirs
could float together hydraulically, thus blending the
stored water with the groundwater. On the other hand, if
it were deemed desirable to pump and treat only one of the
source waters, either could be isolated without
significantly changing the suction conditions for the
pumps.
Another element of this pump station facility is a
metering facility to measure the total flow rate and total
flow of raw water being pumped to the treatment plant.
Also shown on Exhibit 2 is a by-pass pipeline from the
River Intake Pump Station. This by-pass could serve two
functions. It would permit isolation of the main
reservoir, if needed, and pump into the suction manifold
and forebay tank. Of course, this would necessitate
fairly close matching of the outputs of each pump station.

A second possible function would permit the use of the
main reservoir outlet pipe as a common inlet-outlet if the
reservoir inlet facilities at the River Diversion Pump
Station needed to be taken out of service.
3. Pumping Units
The pumping facilities contemplated for this installation
would consist of constant speed vertical type mixed flow
pumps with electric drivers. They would either be
installed within a building to provide weather protection
and sound control or be weather protected for outdoor use.
All electrical equipment and controls would be installed
in an air-conditioned building. As mentioned previous-
ly, one redundant stand-by pumping unit would be
provided.
To evaluate the pumping requirements, system head curves
were developed to reflect the potentially varying
conditions. For this purpose, Route "B" as shown on
Exhibit 8 was selected since it has the greatest pipe
length and would result in a system curve with the
greatest amount of variation. For this selected route,
curves were developed reflecting both a single 48-inch
pipe and double 36-inch pipes. For the latter, a system
curve was developed for the initial single pipe to reflect
initial pump performance. All of these system curves

were based on headloss calculations utilizing the Hazen-
Williams formula and a roughness coefficient of 140. The
static conditions which affect the pumping requirements
are also reflected in these system head curves in terms of
the extremes (maximum and minimum) and an assumed average
or typical condition.
From these system curves, it is possible to evaluate the
performance of individual and multiple pumping units with
respect to efficiencies and horsepower requirements.
Exhibits 12 and 13 show the characteristics of actual
pumping units based on performance curves published by a
recognized pump manufacturer. Based on the pumping units
represented on these curves, a total of four 250-
horsepower pumps would be required to meet the future
maximum flow of 52 MGD. Intermediate levels of pumping
capability can be directly taken from these curves. In
the case of the dual pipe system (Exhibit 13), potential
pumping capacities are shown for the initial pipe as well
as the dual arrangement. A summary of the resulting
pumping conditions for the two alternative pipe
configurations under typical operating conditions is
shown in Table 16.

TABLE 16
TYPICAL PUMP OPERATING CONDITIONS
No. Pumps Flow-MGD TDH-Ft Ef f .-% HP/Pump
Single 48-inch Pipe
Single 36-inch Pipe
1 17 63 86 218 2 26 8 8 80 250
Two 36-inch Pipes
Since the sole source of water for the proposed treatment
plant is supplied by the Transmission Pump Station, it is
critical that its operation not be interrupted for any
extended period of time beyond a few hours. With the
potential for losing electrical power during and
following major storms, it would be prudent to provide
some sort of back-up power source on site. This could be
accomplished by either providing a diesel fueled engine-
generator set to generate sufficient electricity to drive
some of the electric motors, or by providing diesel engine
drives with automatic, quick coup1 ing devices to drive
the pumps directly when the motors fail. It would

probably be sufficient to provide such capability for
about one half of the number of pumping units required to
meet the maximum demands. A more detailed analysis of
this back-up feature should be made during preliminary or
final design.
4. Instrumentation, Controls and Switchgear
The sequencing of pumps at this facility will be
controlled by the water level in the tank at the proposed
treatment plant. At any given time, if the flow through
the plant exceeds the amount being pumped into the tank,
the level will drop. At a predetermined drop in level, a
signal transmitted to the pump station would start up the
next pump. This sequence would reverse when the flow
into the tank exceeds the amount being treated. Other
controls would be provided to protect such things as loss
of suction, downstream reservoir overflow, high (or low)
discharge pressure, etc.
Level-initiated control will be provided in the forebay
tank for such things as controlling the well pumps and/or
river intake pumps and protecting the pump station.
Automatic start-up and transfer to diesel generator
equipment could be provided in the event of power failure.

As mentioned previously, all instrumentation, controls
and switchgear equipment would be housed in a building for
protection against weather and vandalism.
5 . Pump Station Construction Costs
Preliminary estimates of construction costs were
determined for the proposed Transmission Pump Station as
a "base" facility cost plus or minus other selected
features. The "base" pump station facility would provide
for the total maximum pumping capability of 52 MGD and
would include the following :
* Site work including piping, valving, paving, drainage, etc.
Five 2 5 0 HP vertical pumping units installed outdoors.
On-site electrical service facilities, switchgear and motor controls.
* Instrumentation and controls.
* Motor Control Center Building.
Standby Generator
Reservoir Outlet Structure
The preliminary cost of this "base" pump station facility
was determined from an empirical formula developed
previously for other pump station projects with the same
type of facilities. Adjustments were made to reflect an
ENR cost index of 4 2 0 0 . As determined by this method, the

estimated preliminary construction cost for this base
facility is $1,730,000.
Other features which could be added (or deducted) from the
base facility were separately estimated and are shown
below.
* Building to enclose pumps and motors (Additive) $120,000
250 HP pump unit with switchgear (Deductive) $ 80,000
500 KW stand-by engine-generator (Additive)
1.5 million gallon forebay tank (Additive) $420,000
The estimated cost of a complete facility, based on
selected elements can be obtained by combining the above
amounts with the base facility cost.
D. SUMMARY
1. Selected Preliminary Facilities
Based on the data that is available at this time and the
extent of evaluation currently warranted, a recommended
Transmission System has been selected. This selection is
for purposes of arriving at preliminary costs to be
incorporated into the budget for the overall project.

The selected pipeline facilities would consist of a dual
36-inch pipe1 ine along Route "B". Initially, only the
first "barrel" of this pipeline would be installed,
except at the Myakka River crossing. Here, it is
recommended that two 36-inch pipes be buried and encased
in concrete under the river bottom.
The selected pump station facility would consist of the
"base" facility, less three of the 250 hp pumping units
(and associated switchgear) which would be installed in
the future. The pumps would be installed outdoors.
The 500 KW stand-by engine generator and the 1.5 million
gallon forebay tank would be included with the
recommended facility.
The estimated construction cost of the transmission
facilities described in this report is shown in Table 17.

TABLE 17
ESTIMATED CONSTRUCTION COST FOR TRANSMISSION SYSTEM
Probable Construction Facility Cost
22,000 L.F. 36-inch Pipeline $1,760,000
440 L.F. Dual 36-inch Pipe ~ i v e r Crossing 154,000
16,000 L.F. 50 ft. Wide R/W 92,000
Transmission Pump Station (with initial 2 pumps) 1,290,ooo
500 KW Stand-by Engine Generator 160,000
1.5 Million Gallon Forebay Tank 420,000
Total Preliminary Estimated Construction Cost of Transmission Facilities $3,876,000

. . . - - - DIVERSION CHANNEL
RESERVOIR PIPELINE - - RESERVOIR EMBANKMENT - PROPERTY LINE

RIVER DIVERSION PUMP STATION
_C
P t P
P _C DIVERSION CHANNEL -
P t INLET
P i
RESERVOIR 4 P
DRAIN LlNE t -
gzkf NC 4 1
FUEL TANKS I SURFACE WATER - RESERVOIR
TRANSMISSION 4 PUMP STATION
DRAIN LINE - - +;= 111 1 , OUTLET - 11-1
+ t e b *NC 5 N C
-+fw@+tc
L
LEGEND
+tt+@+tk 41- * - FLOW DIRECTION - NC - FROM
11 BUTTERFLY VALVE WELLFIELD N CHECK VALVE @ PUMP
@ FLOW METER SYSTEM NC NORMALLY CLOSED, ALL OTHERS NORMALLY OPEN SCHEMATIC

ENGINE DRIVE
PUMP DISCHARGE HEAD
CHECK VALVE
DIVERSION CHANNEL
SUMP W/DIVIDER WALLS BETWEEN PUMPS
I I EXH. I
PUMP STATION SECTION

PUMPED FLOW (CFS)
EXH.
SYSTEM HEAD AND 4 PUMP CURVES
150 CFS STATION

PUMPED FLOW (CFS)

4 - 7 * 0
0 Y *:
0'- :; g ? a R
0 - z W k V) * V)
Z
+PI MP 3 MAX STAT IC Z J
a 4 a3 Fl- \P Z W
DESIGN POINT
K W
PUMPED FLOW (CFS) E

TYPICAL CHANNEL EXH.
SECTION AND I
7 PUMP STATION
PLAN i

LEGEND SECTION LlNE -...- 100 YEAR FLOOD PLAIN - - DIVERSION CHANNEL TRANSMISSION PUMP
STATION RESERVOIR PIPELINE - - RESERVOIR EMBANKMENT - PROPERTY LlNE
TRANSMISSION PIPELINE ROUTES
EXH.
8

NOTES:
QZAVERAGE ANNUAL FLOW RATE IN MILLION GALLONS PER DAY. (0 ULTIMATE=37.5 MGD) PROFILE BASED ON PROPOSED TRANSMISSION PIPELINE ALIGNMENT-ROUTE B
HYDRAULIC SCHEMATIC TRANSMISSION SYSTEM
SINGLE 48-INCH PIPE '

110' WlTH FOREBAY ELEV=15 (23.5 MGD) =22 (26 MOD)
103' WlTH FOREBAY ELEVz25 (29.5 MGD)
-STORAGE RESERVOIR
- 2 2 TYP
STATIONING (FEET)
NOTES:
Q=AVERAGE ANNUAL FLOW RATE IN MILLION GALLONS PER DAY. (0 ULTIMATEZ37.5 MGD) PROFILE BASED ON PROPOSED TRANSMISSION PIPELINE ALIGNMENT-ROUTE B
HYDRAULIC SCHEMATIC TRANSMISSION SYSTEM SINGLE 36-INCH PIPE
EXH.
10

110' WlTH FOREBAY ELEV =15 (47 MGD) =22 (52 MGD)
103' WlTH FOREBAY ELEV=25 (59 MGDI1
STORAGE
2 2 TYP
RESERVOIR
STATIONING (FEET)
NOTES:
QZAVERAGE ANNUAL FLOW RATE IN MILLION GALLONS PER DAY. (Q ULTIMATEZ37.5 MOD) PROFILE BASED ON PROPOSED TRANSMISSION PIPELINE ALIGNMENT-ROUTE B
HYDRAULIC SCHEMATIC TRANSMISSION SYSTEM DOUBLE 36-INCH PIPES

48 - INCH PIPELINE
TRANSMISSION SYSTEM HEAD
AND PUMP CURVES
EXH.
12

36 - INCH PIPELINES
0 5 10 15 20 2 5 30 35 40 45 50 55 60 65 PUMPED FLOW (MGD)
TRANSMISSION SYSTEM HEAD
AND PUMP CURVES