rights / license: research collection in copyright - non ...48324/... · abstract iii abstract this...
TRANSCRIPT

Research Collection
Master Thesis
Concept and Preliminary Design of a Composite Monocoque foran Electric City-Bus
Author(s): Testoni, Oleg
Publication Date: 2015
Permanent Link: https://doi.org/10.3929/ethz-a-010559727
Rights / License: In Copyright - Non-Commercial Use Permitted
This page was generated automatically upon download from the ETH Zurich Research Collection. For moreinformation please consult the Terms of use.
ETH Library

Master Thesis: 15-046
Concept and Preliminary Design of a Composite
Monocoque for an Electric City-Bus
Oleg Testoni
Advisor: Dr. Markus Zogg
IDMF – Laboratory of Composite Materials and Adaptive Structures
Prof. Dr. Paolo Ermanni
ETH Zürich

ETH Zürich IDMF - Laboratory of Composite Materials and Adaptive Structures LEE O 203 Leonhardstrasse 21 8092 Zürich Telefon: +41 (0)44 633 63 02 www.structures.ethz.ch

Abstract iii
Abstract
This thesis develops a concept and a preliminary design of a composite monocoque for a middle-sized
electric city-bus. Preliminary information was gained by means of two literature researches. The first one
was focused on previous attempts of building a bus with a composite monocoque, while the second one
concerned electric buses. Furthermore, current regulations set by the European Union were considered in
detail.
Various bus sub-systems were analysed and their optimal integration within the monocoque studied. In
order to calculate the forces acting on the structure, the weight distribution of the entire bus model was
calculated by means of the available data and of the information gathered during the visits to the bus
workshop of the public transport society of the city of St. Gallen and to the EvoBus plant in Mannheim.
The behaviour of the structure under the most critical load cases was considered. The geometry of the
monocoque and the fibre layup were consequentially adapted, in order to contain the maximum strain
under the desired threshold and to reduce the weight as much as possible.
The feasibility of a new manufacturing approach was studied and a model of the monocoque in scale 1:18
was manufactured according to this. Benefits, drawbacks and problems observed while manufacturing were
reported.
Finally, the production cost of the monocoque was assessed. The influence of different materials was
investigated and a comparison in terms of weight and manufacturing costs of five different monocoque
solutions made of carbon, glass, natural fibre and their combinations was established.

iv Zusammenfassung
Zusammenfassung
In dieser Arbeit wurden ein Fertigungs- und Strukturkonzept, inklusive Grobauslegung, eines Composite
Monocoques für einen elektrisch eingetriebenen Stadtbus entwickelt. Die Grundlagen wurden mit zwei
Literaturrecherchen erarbeiten. Die erste Recherche betrachtet bisherige Projekte, einen Bus aus
Faserverbundwerkstoffen zu bauen, während sich die zweite elektrisch ngetriebenen Bussen beschäftigt.
Außerdem wurden die derzeitigen Normen der Europäischen Union ausführlich betrachtet.
Verschiedene Subsysteme wurden ausgewählt und ihre optimale Integration innerhalb des Monocoques
untersucht. Die Gewichtverteilung des gesamten Busses wurde dank der vorhandenen Informationen über
die wichtigsten Bauteile berechnet, um die auf der Struktur wirkenden, Kräfte zu bekommen. Dafür waren
die Besichtigungen der Verkehrsbetriebe St. Gallen und der Daimler-Evobus Werkes in Mannheim sehr
nützlich.
Kritische Lastfälle wurden identifiziert und simuliert. Die Geometrie des Monocoques und das Fasernlayup
wurden angepasst, um die maximalen Dehnungen unter den vorgegebenen Grenzwerten zu halten.
Gewichtsreduktion wurde besonders beachtet.
Ein neues Fertigungskonzept mit integrierten Innenverkleidung wurde untersucht. Zur Visualisierung des
Fertigungskonzepts wurde auch ein verkleinertes Modell des Monocoques neugestellt und die Vor- und
Nachteile des Konzeptes aufgezeigt.
Die Herstellkosten des Monocoques aus Kohlefaser wurden abgeschätzt und mit denen eines Monocoques
aus Glass- oder Naturfasern vergleichen. Abschliessend wurde die kombinierte Auslegung mit Glass- und
Kohlefasern untersucht, um einen Kompromiss zwischen Kosten und Gewicht zu finden.

Acknowledgements v
Acknowledgements
First of all, I would like to thank Prof. Dr. Paolo Ermanni for the opportunity to work on this project and to
write my thesis in his chair. Secondly, I would like to express my thanks to Dr. Markus Zogg for having
selected me for this work and for supporting me throughout these months. In addition, I show my
appreciation to Claudia Thurnherr and Oscar Chesa Llaquet for the tips they gave me about the CAD
software and about the construction of the bus model.

vi Task assignment
Task assignment

Task assignment vii

viii Task assignment

Task assignment ix

x Declaration of originality
Declaration of originality

Table of contents xi
Table of contents
Abstract ............................................................................................................................................................... iii
Zusammenfassung ............................................................................................................................................... iv
Acknowledgements .............................................................................................................................................. v
Task assignment .................................................................................................................................................. vi
Declaration of originality ...................................................................................................................................... x
Table of contents ................................................................................................................................................. xi
List of figures ..................................................................................................................................................... xiv
List of graphs ..................................................................................................................................................... xvi
List of tables ...................................................................................................................................................... xvii
Abbreviations .................................................................................................................................................. xviii
List of symbols ................................................................................................................................................... xix
1 Introduction ................................................................................................................................................. 1
1.1 General problem .................................................................................................................................. 1
1.2 Thesis objectives .................................................................................................................................. 2
1.3 Premise ................................................................................................................................................ 2
2 Related literature and theoretical focus ..................................................................................................... 4
2.1 Composite monocoque design ............................................................................................................ 4
2.1.1 Neoplan Metroliner im Carbondesign (MIC) ............................................................................... 4
2.1.2 NABI Metro 45C LFW ................................................................................................................... 5
2.1.3 Proterra EcoRide BE35 ................................................................................................................. 6
2.2 Electric buses ....................................................................................................................................... 7
2.2.1 BredaMenarinibus e-Vivacity ...................................................................................................... 8
2.2.2 BYD ebus-12 ................................................................................................................................. 8
2.2.3 Gépébus Oréos 4x........................................................................................................................ 9
2.2.4 Iveco Ellisup ............................................................................................................................... 10
2.2.5 Rampini Alè-EL ........................................................................................................................... 10
2.2.6 Solaris Urbino 120electric.......................................................................................................... 11
2.2.7 VDL Citea SLF-120 Electric ......................................................................................................... 11
2.3 Norms ................................................................................................................................................ 12
2.3.1 Directive 2007/46/EC of the European Parliament and of the Council .................................... 12
2.3.2 Regulation (EC) No 661/2009 of the European Parliament and of the Council ........................ 12
2.3.3 Commission Regulation (EU) No 1230/2012 ............................................................................. 12

xii Table of contents
2.3.4 UNECE Regulation No. 107 ........................................................................................................ 13
2.3.5 UNECE Regulation No. 66 .......................................................................................................... 13
3 Bus concept ............................................................................................................................................... 15
3.1 Battery ............................................................................................................................................... 15
3.2 Axles................................................................................................................................................... 16
3.2.1 Front axle ................................................................................................................................... 17
3.2.2 Rear axle .................................................................................................................................... 17
3.3 HVAC (Heating, Ventilation and Air Conditioning) ............................................................................ 18
3.4 Other systems .................................................................................................................................... 19
3.5 Concept development ....................................................................................................................... 19
3.6 Mass evaluation ................................................................................................................................. 24
4 Structural requirements ............................................................................................................................ 26
4.1 Parking ............................................................................................................................................... 26
4.2 Torsion ............................................................................................................................................... 27
4.3 Lateral limit ........................................................................................................................................ 28
4.4 Longitudinal limit ............................................................................................................................... 29
4.5 Pothole .............................................................................................................................................. 30
4.6 Crash .................................................................................................................................................. 31
4.7 Rollover .............................................................................................................................................. 32
5 FEM analysis and monocoque development process ............................................................................... 33
5.1 FEM setup .......................................................................................................................................... 33
5.2 Material characterisation .................................................................................................................. 34
5.3 Load cases boundary conditions ....................................................................................................... 35
5.4 Optimisation process and results ...................................................................................................... 37
6 Manufacturing process .............................................................................................................................. 44
6.1 Selection of the productive method.................................................................................................. 44
6.2 Method description ........................................................................................................................... 44
7 Demonstrator ............................................................................................................................................ 47
7.1 Moulds ............................................................................................................................................... 47
7.2 Demonstrator’s manufacturing ......................................................................................................... 48
7.3 Evaluation of the manufacturing process ......................................................................................... 49
8 Cost assessment ........................................................................................................................................ 50
8.1 Assumptions ...................................................................................................................................... 50
8.1.1 General assumptions ................................................................................................................. 50

Table of contents xiii
8.1.2 Machinery and premises ........................................................................................................... 51
8.1.3 Tools .......................................................................................................................................... 52
8.1.4 Energy and personnel ................................................................................................................ 53
8.1.5 Material ..................................................................................................................................... 54
8.2 Cost calculation and analysis ............................................................................................................. 55
9 Variant comparison ................................................................................................................................... 57
9.1 Glass and natural fibre ...................................................................................................................... 57
9.2 Glass and carbon fibre trade off ........................................................................................................ 58
10 Conclusions and outlook ....................................................................................................................... 60
10.1 Conclusions ........................................................................................................................................ 60
10.2 Outlook .............................................................................................................................................. 61
11 Bibliography ........................................................................................................................................... 62
12 Appendix ................................................................................................................................................ 65
12.1 Mechanical Properties of Carbon Fibre Composite Material ............................................................ 65
12.2 Rohacell WF Datasheet ..................................................................................................................... 67

xiv List of figures
List of figures
Figure 1-1: City-Bus Framework. Image from: timesnorth.org. .......................................................................... 1
Figure 2-1: Neoplan MIC. Image from: www.omnibusarchiv.de. ........................................................................ 4
Figure 2-2: Monocoque of the MIC. Image from: www.omnibusarchiv.de. ....................................................... 5
Figure 2-3: NABI Metro 45C LFW. Image from: www.flickr.com. ....................................................................... 5
Figure 2-4: Monocoque of the Metro 45C LFW. Image from [2]. ....................................................................... 6
Figure 2-5: Detail of the connection between the two halves of the monocoque. Image from [2]. .................. 6
Figure 2-6: Proterra EcoRide BE35. Image from [6]. ........................................................................................... 6
Figure 2-7: Monocoque of the EcoRide BE35. Image from [2]. ........................................................................... 7
Figure 2-8: BredaMenarinibus e-Vivacity. Image from: forum.midimobilites.fr. ................................................ 8
Figure 2-9: BYD ebus-12.Image from [10]. .......................................................................................................... 8
Figure 2-10: BYD ebus battery disposition. Image from: www.bydeurope.com. ............................................... 9
Figure 2-11: Gépébus Oréos 4x. Image from [12]. .............................................................................................. 9
Figure 2-12: Iveco Ellisup. Image from: www.autobusweb.com. ...................................................................... 10
Figure 2-13: Rampini Alè-El. Image from: www.veicolielettricinews.it. ............................................................ 10
Figure 2-14: Solaris Urbino 120electric. Image from [19] ................................................................................. 11
Figure 2-15: VDL Citea SLF-120 Electric. Image from [21]. ................................................................................ 11
Figure 2-16: Specification of residual space according to UNECE No. 66, paragraph 5.2. ................................ 13
Figure 2-17: Specification of residual space according to UNECE No. 66, paragraph 5.2. ................................ 14
Figure 3-1: Tesla Model S battery-pack. Image from: www.greencarreports.com. ......................................... 16
Figure 3-2: Independent front suspension RL 82 EC by ZF. Image from: www.zf.com. .................................... 17
Figure 3-3: Electric portal axle AVE 130 by ZF. Image from: www.zf.com. ....................................................... 17
Figure 3-4: HVAC system Aerosphere Midi by Spheros. Image from [31]. ....................................................... 18
Figure 3-5: Spatial disposition of axles and batteries (marked with yellow). ................................................... 19
Figure 3-6: Bus floor configuration. ................................................................................................................... 20
Figure 3-7: Bus internal architecture. ................................................................................................................ 21
Figure 3-8: Complete bus model with highlighted emergency exits. ................................................................ 21
Figure 3-9: Bus upper part section. ................................................................................................................... 22
Figure 3-10: Roof transversal section. ............................................................................................................... 22
Figure 3-11: Section of the panel separating passenger and driver's compartment and its connection with the
roof structure. ................................................................................................................................................... 23
Figure 3-12: View of the final concept. ............................................................................................................. 23
Figure 3-13: Assumed spatial location of bus main components. .................................................................... 25
Figure 4-1: Forces acting on the bus while parking. .......................................................................................... 26
Figure 4-2: Parking with a wheel on a curb. ...................................................................................................... 27
Figure 4-3: Sketch of the forces acting on a generic axle the maximum moment that it can balance. ............ 27
Figure 4-4: Forces acting on the bus while cornering at rollover limit condition. ............................................ 29
Figure 4-5: Forces acting on the bus while braking at tyres' adhesion limit. .................................................... 30
Figure 4-6: Load application to the superstructure. Image from [27]. ............................................................. 32
Figure 5-1: Mesh orientation in the different regions. ..................................................................................... 33
Figure 5-2: View of axle and wheel attachments. ............................................................................................. 34
Figure 5-3: Impact with obstacle boundary conditions. .................................................................................... 35
Figure 5-4: Crash boundary conditions. ............................................................................................................ 36

List of figures xv
Figure 5-5: Rollover boundary conditions. ........................................................................................................ 36
Figure 5-6: Model 1. .......................................................................................................................................... 37
Figure 5-7: Roll bar structure. ............................................................................................................................ 38
Figure 5-8: Model 2. .......................................................................................................................................... 38
Figure 5-9: Strain during rollover. ..................................................................................................................... 39
Figure 5-10: Strain during crash. ....................................................................................................................... 39
Figure 5-11: Strain during impact of the front left wheel against an obstacle. ................................................ 40
Figure 5-12: Model 2 laminate setup. ............................................................................................................... 40
Figure 5-13: Model 3, strain during rollover. .................................................................................................... 41
Figure 5-14: Model 4. ........................................................................................................................................ 42
Figure 5-15: Different type of laminates employed in the final layup configuration of Model 4. .................... 43
Figure 6-1: Mould of the upper inner-part. ....................................................................................................... 45
Figure 6-2: Mould of the lower inner-part. ....................................................................................................... 45
Figure 6-3: Monocoque inner shell. .................................................................................................................. 45
Figure 6-4: Front lower shell. ............................................................................................................................ 45
Figure 6-5: Central lower shell. ......................................................................................................................... 45
Figure 6-6: Rear lower shell. .............................................................................................................................. 45
Figure 6-7: Assembly of the inner shells with stiffeners (highlighted in red) laminated on top. ...................... 46
Figure 6-8: Finished monocoque ....................................................................................................................... 46
Figure 9-1: Trade-off 1 (GF roll bars). ................................................................................................................ 58
Figure 9-2: Trade-off 2 (CF roll bars). ................................................................................................................ 58

xvi List of graphs
List of graphs
Graph 9-1: Bus variant comparison. .................................................................................................................. 57
Graph 9-2: Trade off mass and cost comparison. ............................................................................................. 59
List of tables xvii
List of tables
Table 3-1: Electric bus property comparison. ................................................................................................... 15
Table 3-2: Electric-car battery-property comparison. ....................................................................................... 16
Table 8-1: General process assumptions. .......................................................................................................... 51
Table 8-2: Machinery and premises rental cost ................................................................................................ 52
Table 8-3: Tool costs. ......................................................................................................................................... 53
Table 8-4: Material costs. .................................................................................................................................. 54
Table 8-5: Auxiliary material costs. ................................................................................................................... 55
Table 8-6: Cost summary. .................................................................................................................................. 56

xviii Abbreviations
Abbreviations
CAD Computer-Aided Design
FEM Finite Element Method
MIC Metroliner im Carbondesign
AC Alternating Current
ADEME Agence De l’Environnement et de la Maîtrise de l’Énergie
EC European Commission
EU European Union
UNECE United Nations Economic Commission for Europe
VLCP Vertical Longitudinal Central Plane
VBSG Verkehrsbetriebe St. Gallen
HVAC Heating, Ventilation and Air Conditioning
CG Centre of Gravity of the fully loaded bus
Euro NCAP European New Car Assessment Programme
NHTSA National Highway Traffic Safety Administration
CF Carbon Fibre
UDCF Unidirectional Carbon Fibre
RTM Resin Transfer Moulding
VARI Vacuum Assisted Resin Infusion
MDF Medium Density Fibreboard
R&D Research and Development
CNC Computer Numerical Control
GF Glass Fibre
NF Natural Fibre

List of symbols xix
List of symbols
sr Seat reference-point [-]
Fz Force acting in z-direction [N]
Fzf Force acting on the front axle in z-direction [N]
Fzr Force acting on the rear axle in z-direction [N]
mtot Mass of the fully loaded bus [kg]
g Acceleration of gravity [m/s2]
My CG Momentum around the y-axis calculated in CG [Nm]
Lf Distance between CG and the centrelines of the front wheels [m]
Lr Distance between CG and the centrelines of the rear wheels [m]
L Wheelbase [m]
hc Height of the curb [m]
t Track [m]
tf Front track [m]
tr Rear track [m]
Mt max Maximum moment that a generic axle can balance [Nm]
Mf max Maximum moment that the front axle can balance [Nm]
Mr max Maximum moment that the rear axle can balance [Nm]
H Height of the CG [m]
μl max Maximum lateral adhesion coefficient of the whole vehicle [-]
Fy Force acting in y-direction [N]
Fyf Force acting on the front axle in y-direction [N]
Fyr Force acting on the rear axle in y-direction [N]
ac Lateral acceleration [m/s2]
Mx CG Momentum around the x-axis calculated in CG [Nm]
Mz CG Momentum around the z-axis calculated in CG [Nm]

xx List of symbols
μl Lateral adhesion coefficient of the whole vehicle [-]
μb Longitudinal adhesion coefficient of the whole vehicle [-]
Fx Force acting in x-direction [N]
Fxf Force acting on the front axle in x-direction [N]
Fxr Force acting on the rear axle in x-direction [N]
ab Braking deceleration [m/s2]
Fz max Maximum vertical force experienced by the structure [N]
Ekin car Kinetic energy of the car impacting the bus [J]
mcar Mass of the car impacting the bus [kg]
vcar Speed of the car impacting the bus [m/s]
Fcrash Force acting on the bus during crash [N]
lCZ Combined length of the crumple zones of the two vehicles [m]
acrash Acceleration acting on the bus during crash [m/s2]
αrollover Anglo of introduction of the force during rollover [°]
Hc Height of the cant-rail of the bus [m]

Introduction 1
1 Introduction
1.1 General problem
Over the past decades, there has been a substantial increase in public awareness of sustainability and
environmental protection. This led to the introduction of the so-called green technologies in many fields.
One of the most discussed areas of development is public and private transport. In fact, since the early
1990s, many institutions, with the European Union at the forefront, have begun to address issues related to
vehicle emissions of CO2 and pollutants and to encourage the development of more environmentally friendly
transport systems.
Two of the most promising technologies in this field are hybrid and electric vehicles. The enormous
improvements in battery energy-density and recharging-time achieved in recent years have helped close the
gap between this kind of vehicles and standard vehicles with internal combustion engines in terms of
performance and usability. Despite the high price of batteries, the increasing autonomy together with very
low maintenance costs make this technology suitable for high-intensive applications, where the running
costs of standard vehicles are sizeable. These reasons have recently prompt many companies to develop
electric city-buses, since the low operating-speed and the possibility to employ energy-recovering systems
during the frequent brakes make these vehicles very energy-efficient.
Despite the stunning improvements in energy density reported in recent years, electric buses still require
voluminous and heavy battery-packs in order have enough cruising range to cover their daily mileage.
Batteries are usually fixed on available spaces on top of the roof or in compartments obtained under the
floor through the removal of the thermal engine and other components. Indeed, one of the main advantages
of the electrical traction is that the engine can be directly connected to the driving wheels without any kind
of transmission. Unfortunately, the reduction in weight coming from the absence of these parts is nullified
by the batteries, which are a very heavy component – up to a couple of tonnes – and which have a high
impact on the manoeuvrability and on the energy consumption of the bus. As a consequence, weight
reduction is crucial in order to build safe and energy efficient vehicles.
One of the heaviest bus components is the
chassis, which has the central function of
supporting all other systems and sustaining the
loads, to which the vehicle is subjected. In the
great majority of buses, the chassis consists of a
steel or aluminium framework, on which the
bodywork and all the other components are
fixed. Chassis are usually quite heavy and have a
mass of several tonnes. In the last decades,
composite materials and especially fibre
reinforced polymers have allowed for the
introduction of new structural concepts and
innovative technical solutions that have opened
the doors to the possibility of an enormous
weight saving in structural components. Indeed, Figure 1-1: City-Bus Framework. Image from: timesnorth.org.

2 Introduction
carbon and glass fibre not only have high specific properties but are also suitable for the construction of
complex highly-integrated structures. This fact allows not only for a further reduction of the weight of the
vehicle but also of the total number of components to be assembled and, as a consequence, of the
manufacturing costs. According to the evaluation carried out in [1], a glass fibre monocoque would allow for
44% weight reduction compared with a standard steel bus-structure. Furthermore, always according to [1],
the structural weight would sink another 20% with the employment of carbon fibre instead of glass fibre and
an overall 64% weight reduction would be possible.
Similar estimates have recently led a few companies to invest in the development of new products deploying
this kind of materials. Since the first attempt, done in 1988 by the German bus manufacturer Neoplan, many
other enterprises have tried to take advantage of composite materials to build their buses. Yet, all of them
opted for glass fibre and did not employ materials with higher specific properties, such as carbon fibre,
which is more expensive, but which would enable a further, significant weight reduction.
1.2 Thesis objectives
As written in the task assignment, this work aims to develop the concept of a composite monocoque for a
middle-sized electric city-bus and to explore the possibility to employ carbon fibre in designing a lightweight
and fully integrated structure.
After this short introduction, chapter 2 collects the preliminary information required to develop this topic. A
first literature research focuses on previous attempts of building a composite monocoque for a city-bus,
whilst a second one reports some examples of electric buses. In addition, the last part of the chapter
summarises the most important regulations in force within the European Union.
Chapter 3 presents different bus sub-systems and analyses their integration within the bus structure, before
introducing the preliminary concept of the monocoque. Chapter 4 describes the most critical load cases, to
which a bus may be subject during its life. Set-up and boundary conditions of the FEM (Finite Element
Method) analysis are defined in chapter 5, which explains also how the structural simulations were
performed and the monocoque established.
In chapter 6, a new manufacturing approach is introduced and described step by step. Afterwards, the
feasibility of the process is validated in chapter 7 through the construction of a demonstrator in scale 1:18.
Chapter 8 presents the cost evaluation of the monocoque and explains the assumptions behind the
calculation. Chapter 9 investigates the influence of alternative materials on cost and weight, reporting a
comparison among different variants of the monocoque.
Finally, conclusions are drawn in chapter 10.
1.3 Premise
The composite monocoque presented in this thesis was conceived starting from the basic guidelines for the
bus (ca. 10 m long, max. 2.55 m wide, max. 3.3 m high, electric traction, 2 doors, low entry), which Mario
Schädler from City-E-Bus gave us and which allowed us to develop a monocoque concept with realistic
dimensions.
Introduction 3
Part of the information regarding masses and sizes of bus components as well as other interesting details of
bus systems were collected thanks to Ersa Ege, Daimler Evobus, who made it possible to have a guided tour
in the Daimler Evobus plant in Mannheim, and to Philipp Suter from Verkehrsbetriebe St. Gallen, who took
the time to show us today's bus technology and requirements and to answer first questions from the bus
operator's view.
Markus Zogg from Inspire, the tutor of this thesis, proposed to have a basic packaging with the batteries
between the axles and big doors in front of the front axle and behind the rear axle as well as to adapt the
manufacturing concept developed by Christoph Becker in his semester thesis for a railroad car body.
Based on this input as well as on his literature research Oleg Testoni defined the other bus-components
relevant for his task (to be fixed on the monocoque), established the detailed requirements for the bus
monocoque (detailed packaging, loads, accessibility) and developed and analysed the detailed packaging,
structural and manufacturing concept for several variants of the bus monocoque.

4 Related literature and theoretical focus
2 Related literature and theoretical focus
2.1 Composite monocoque design
The French word monocoque describes a particular type of structure composed of a single shell.
Monocoques are extensively employed in lightweight design, as they allow for the fusion of chassis and body
in a single component. They normally have a sandwich structure, characterized by a thin outer skin and a
much thicker but extremely light core, which enables an outstanding weight reduction, if compared with
traditional metal frame structures. Whilst the first uses of monocoques were quite limited and confined to
an inner circle of products, like race cars or aerospace applications, in recent years more reliable and
efficient production techniques allowed for their spread in many diverse fields.
Nowadays, the industry tends increasingly to replace traditional metal parts with new components made of
composites. The automotive industry and more in general the entire transport sector are typical examples:
the will to produce lighter and more efficient vehicles is pushing for the adoption of technologies coming
directly from the competitions or from the aerospace sector. Bus segment is no exception: different
companies have already developed and launched on the market few models with a glass fibre monocoque.
The following sections report some examples.
2.1.1 Neoplan Metroliner im Carbondesign (MIC)
Figure 2-1: Neoplan MIC. Image from: www.omnibusarchiv.de.
The German bus manufacturer Neoplan was the first company to extensively employ composite materials in
bus construction. In 1988 they presented the “Metroliner im Carbondesign” (MIC), the first bus with an
integral monocoque construction made of glass and carbon fibre. It was more than 50% lighter than other
buses of that time; consequently, it had reduced emissions and maintenance costs that were 30% lower than
those of competitors [2]. The monocoque was built in wet-lamination technique and was composed by a
right and a left part. Both were laminated in female forms and glued together in a second step. Glass fibre
was employed extensively for the construction of the monocoque, while carbon fibre was applied only in
high-loaded regions. A honeycomb structure was used as core material [2].

Related literature and theoretical focus 5
Figure 2-2: Monocoque of the MIC. Image from: www.omnibusarchiv.de.
The bus was built in three variants with different lengths (6.990, 8.020 and 10.600 m) and different engine
types [3]. The 10.6 m version was the first presented and had enough space for 80 passengers [4]. It was
2.560 m high and 2.5 m wide. The height of the floor from the ground was 320 mm, ensuring in this way an
easy accessibility. The reduction in weight coming from the composite monocoque allowed for the use of
smaller axles and for the decrease of the wheel number from six to four. In addition, the lower power
required allowed the engineers to install a small and light engine of 2.5 litres with 160 Hp [2]. As a result the
bus had an unladen weight of only 6.29 tonnes: one third lighter than the competitors of that time. For this
reason the MIC had much lower fuel consumption and smaller maintenance costs [4]. Despite having passed
the entire prototype phase without showing major issues, recurring technical problems led unfortunately to
the failure of the MIC project and showed the limitations of the technology of that time.
2.1.2 NABI Metro 45C LFW
Figure 2-3: NABI Metro 45C LFW. Image from: www.flickr.com.

6 Related literature and theoretical focus
Fifteen years later, in 2003, the company NABI decided to embark upon the same path followed by Neoplan
with the MIC and launched the Metro 45C LFW. The bus was made of a combination of fibreglass and vinyl-
ester resin laminates and was powered by a diesel engine [5]. Despite being 45 ft (13.716 m) long [5], the
light structure made its weight comparable of that of a 40 ft (12.192 m) bus, allowing for the use of only two
axles. However, NABI was unable to streamline the manufacturing process and to reduce, consequently, the
high production costs, which were responsible for the failure of the project [5]. In fact, because of the high
sale price, only twenty buses were sold; thereafter, the production was ceased [5].
Figure 2-4: Monocoque of the Metro 45C LFW. Image from [2]. Figure 2-5: Detail of the connection between the two halves of the monocoque. Image from [2].
Nevertheless, it is interesting to consider the adopted manufacturing technique. Figures 2-4 and 2-5 show
how the monocoque was made up of an upper and a lower half. These were probably laminated and cured
separately and then joined in a later stage. From the two pictures it is possible to evince that the two halves
were glued together in specific areas at the base of the frames dividing the windows, where the laminates
were thinner than in the rest of the structure, enabling in this way the overlapping of the two parts.
2.1.3 Proterra EcoRide BE35
Figure 2-6: Proterra EcoRide BE35. Image from [6].

Related literature and theoretical focus 7
Much more successful was the EcoRide BE35. This bus, presented by Proterra in 2012, combines a fibreglass
monocoque with a full-electric propulsion system and is characterized by very low maintenance costs. The
bus is 35 ft (10.668 m) long and has a 72 kW-h lithium-ion battery pack, which provides it with three hours of
running time or a range of 30 miles (48km) and which can be charged within 10 minutes at the inductive
fast-charging stations installed along the route [6].
The effectiveness of this solution is evident in the notable success that the company has achieved and in its
will to produce a new 40 ft (12.192 m) version [6]. However, it has a very high price in comparison with
traditional buses: $850’000 against $300’000, respectively [7]. Nevertheless, Mr. Popple, CEO of Proterra,
claims that his buses can save about $50’000 of fuel per year by covering with the cost of one gallon (3.785 l)
diesel more than 20 miles (32.1 km), while standard buses reach 4 miles (6.4 km) with the same amount of
fuel. However, it has to be mentioned that the success of the EcoRide BE35 comes not only from the very
low maintenance costs claimed by its manufacturer, but also from the introduction in 2012 of the Zero
Emission Bus regulation by the California Air Resources Board, which requires buses with zero tailpipe
emissions to make up at least 15% of large California agencies’ annual bus orders *6].
Figure 2-7: Monocoque of the EcoRide BE35. Image from [2].
As far as the production of the monocoque is concerned, the little information available comes from figure
2-7. The monocoque seems to be composed by an upper and a lower half. Moreover, as clearly visible in the
picture, the rear part of the bus is missing. In fact, Proterra has developed a particular solution with an
extractable undercarriage including engine, transmission, rear wheels and part of the batteries [8].
2.2 Electric buses
Even if traditional buses are much more sustainable than other means of transport, like cars, in the last years
a great effort has been made to reduce their emissions and to further increase their efficiency. Hybrid
engines and engines deploying alternative fuels, like LPG and methane were introduced; yet, none of them
has the distinguishing feature of all-electric buses: namely zero emissions.

8 Related literature and theoretical focus
Nevertheless, electric buses have a series of important limitations: battery size and weight limit their range
and make them apt just to operate in the city. In addition, the pretty high cost of the batteries increases
considerably the purchase price. However, aware of their environmental sustainability, many government
agencies and institutions are pushing for their introduction or have already allocated specific funds to
facilitate their diffusion. Thanks to this positive attitude, many bus manufacturers started to develop new all-
electric buses or to convert their old models. In the following subsection some examples of all-electric buses
are shown and their main characteristics presented.
2.2.1 BredaMenarinibus e-Vivacity
Figure 2-8: BredaMenarinibus e-Vivacity. Image from: forum.midimobilites.fr.
The Italian bus manufacturer BredaMenarinibus produces an 8 m long, all-electric city-bus named e-Vivacity.
It has a weight in running order of 9’050 kg and is powered by an AC electric engine with a maximum
nominal power of 80 kW and a maximum torque of 800 Nm [9]. Its lithium-polymer batteries, located
together with the engine in the rear part of the bus, have a total capacity of 202.5 kWh and ensure a range
of approximately 200 Km on a single charge, which takes four hours [9]. In order to attain better
performance and to avoid installing other source of energy, the company opted for all-electrical auxiliary-
systems, including includes air conditioning, air compressor and power steering system.
2.2.2 BYD ebus-12
Figure 2-9: BYD ebus-12.Image from [10].

Related literature and theoretical focus 9
The Chinese automaker BYD presented the ebus in 2010. With a length of 12 meters and a curb weight of 14
tonnes, this bus is propelled by two AC synchronous motors, available in two versions: one with a maximum
power of 90 kW and a maximum torque of 700 Nm, the other with 180 kW and 1’500 Nm. The iron-based
batteries, self-developed by the company, have a capacity of 324 kWh and are placed in different zones of
the bus, as shown in figure 2-10. Charging time amounts to three hours. Purchase price is about $395’000-
592’600 depending on the desired configuration [10].
Figure 2-10: BYD ebus battery disposition. Image from: www.bydeurope.com.
2.2.3 Gépébus Oréos 4x
Figure 2-11: Gépébus Oréos 4x. Image from [12].
The Oréos 4x is an all-electric middle-sized bus produced by the French company Gépébus. It is 9.312 m long
and has a curb weight of 9’100 kg *11+. Its asynchronous engine has 103 kW and is powered by lithium-ion
batteries with a capacity of 170 kWh. The declared range extension is 160 km [12].

10 Related literature and theoretical focus
2.2.4 Iveco Ellisup
Figure 2-12: Iveco Ellisup. Image from: www.autobusweb.com.
In 2013, Iveco presented its vision of future public transport at the Busworld Kortrijk, the biggest business to
business bus and coach exhibition in the world [13]. The prototype, called Ellisup and 12 m long, was
developed within a program of the ADEME (Agence De l’Environnement et de la Maîtrise de l’Énergie), the
French environment and energy management agency [14]. The objective of the project was the
development of a new electric bus concept. This was supposed to operate in full-electric mode along an
entire service line and to rapidly recharge the batteries at the terminus. Michelin developed a small electric
engine to be placed in four of the eight wheels and to be powered by a combination of batteries and super-
capacitors. The design of the bus is centred on its eight wheels, whose small size allow for a new interior
architecture, which facilitates the flow of passengers while boarding and exiting [15]. Up to now, no more
detail was available and Iveco has not yet decided whether to make it a series model.
2.2.5 Rampini Alè-EL
Figure 2-13: Rampini Alè-El. Image from: www.veicolielettricinews.it.
The Italian bus manufacturer Rampini introduced an electric variant of its Bus Alè in 2012. This vehicle is 7.7
m long and has gross weight of 11.8 tonnes [16]. It is moved by a synchronous three-phase engine
developed by Siemens, which has a maximum power of 85 kW [16]. The lithium-ferrite batteries have a
capacity of 180 kWh and can be recharged in two hours. The declared range extension is about 130/150 km
in town [17]. Purchase price is about €440’000 *17+.

Related literature and theoretical focus 11
2.2.6 Solaris Urbino 120electric
Figure 2-14: Solaris Urbino 120electric. Image from [19]
The Urbino 120electric is a 12 m long, all-electric bus manufactured by the Polish company Solaris [18]. The
asynchronous motor, with a nominal power of 160 kW, is powered by lithium-ion batteries, which also feed
all the auxiliary systems, including air-conditioning, heating, steering pump and the electrically-powered
doors. Different battery configurations with different capacities can be chosen depending on the route [19].
Purchase price is about €700’000 [18].
2.2.7 VDL Citea SLF-120 Electric
Figure 2-15: VDL Citea SLF-120 Electric. Image from [21].
The Citea SLF-120 Electric is a full-electric, low-floor bus produced by VDL. It has a length of 12 metres and
an unladen weight of 11’355 kg [20]. The bus is powered by two 85 kWh lithium iron magnesium phosphate
battery packs, which enable it to cover a distance of 100/150 km on a single charge [21]. Depending on its
configuration, the purchase price varies between €450’000-500’000 [21].

12 Related literature and theoretical focus
2.3 Norms
The bus concept was developed within the guidelines traced by the current regulations of the European
Union. Existing norms were analysed in detail and the required specifications identified and taken into
account. The following subsections summarize the most important norms considered.
2.3.1 Directive 2007/46/EC of the European Parliament and of the Council
AS specified in the directive itself: “The Directive 2007/46/EC of the European Parliament and of the Council
establishes a framework for the approval of motor vehicles and their trailers, and of systems, components
and separate technical units intended for such vehicles” [22]. Among its 21 annexes, containing regulations
regarding all the aspects of a vehicle approval, annex II and annex IV were particularly interesting for us.
Annex II establishes general definitions and criteria for the categorisation of a vehicle. Considering the
paragraph 1.1.3 of part A, we could verify the belonging of middle-sized city-buses to the category M3,
which groups vehicles with more than eight seating positions in addition to the driver’s one and with a
maximum mass exceeding five tonnes.
On the other side, annex IV contains the requirements for the type-approval of vehicles by the European
Community. Part I summarises in a table the regulatory acts for the EC type-approval of vehicles produced in
unlimited series. Among the 70 voices, the numbers 48 and 52 address issues particularly important for the
aim of this thesis. The first one concerns masses and dimensions and refers to the Regulation (EC) No
661/2009 and to the Regulation (EU) No 1230/2012. The second deals with general regulations for M2 and
M3 vehicles and with the strength of the superstructure of large passenger vehicles, referring to Regulation
(EC) No 661/2009 and to the UNECE Regulations No 107 and 66. The latter two are guidelines enacted by the
United Nations Economic Commission for Europe (UNECE) [23]. This is a regional commission of the United
Nations, whose aim is the promotion of the economic integration within Europe. For this reason, its
Transport Division provides norms and procedures for the harmonization of vehicle regulations, the majority
of which are adopted by the European Union and also by Switzerland.
2.3.2 Regulation (EC) No 661/2009 of the European Parliament and of the Council
“This regulation establishes the type-approval requirements for the general safety of motor vehicles, their
trailers and systems, components and separate technical units intended therefor” [24]. Article 3 in chapter I
extends the definitions laid down in the Directive 2007/46/EC by introducing new subcategories. More
specifically, middle-sized buses fall into the subcategory class I M3 vehicles, as specified in paragraph 2 of
article 3: “‘class I M2 or M3 vehicle’ means an M2 or M3 vehicle with a capacity exceeding 22 passengers in
addition to the driver constructed with areas for standing passengers to allow frequent passenger
movement”. As specified in chapter II, article 6, paragraph 4, vehicles of class I shall be accessible for people
with reduced mobility, including wheelchair users.
In addition, the Regulation (EC) No 661/2009 lists in the annex IV the UNECE regulations that have to be
applied on a compulsory basis for the EC type-approval, integrating the table of annex IV of the Directive
2007/46/EC.
2.3.3 Commission Regulation (EU) No 1230/2012
The Commission Regulation (EU) No 1230/2012 amends the Directive 2007/46/EC and implements the
Regulation (EC) No 661/2009 with regard to type-approval requirements for masses and dimensions of
motor vehicles and their trailers [25]. Part B of annex I specifies the technical requirements for vehicles of

Related literature and theoretical focus 13
category M2 and M3. In paragraph 1.1.1 the maximum authorized length of a vehicle with two axes and one
section is set to 13.50 m; whilst paragraph 1.1.2 and 1.1.3 limit the width and the height to 2.55 m and to
4.00 m, respectively.
2.3.4 UNECE Regulation No. 107
The UNECE Regulation No. 107 gives provisions concerning the approval of category M2 or M3 vehicles with
regard to their general construction [26]. As far as the goals of this thesis are concerned, annex 3 and annex
8 are of particular interest. The first contains the general requirements that have to be met by all vehicles,
while the second specific instructions regarding accommodation and accessibility for passengers with
reduced mobility.
Annex 3 includes many paragraphs setting specific regulations for all the aspects of M2 and M3 vehicles. For
example, it specifies the required minimum number of doors, their minimum size and where they shall be
located; the same for windows and emergency exits. It establishes the maximum slope of the floor, the
minimum width of the gangways and the minimum depth of steps. In addition, it decrees the allowed sized
of seats, the space for seated passengers, the disposition of handrails and handholds, as well as which
requirements the interior lighting have to meet and which ones the driver's compartment.
On the other side, Annex 8 contains provisions to permit an easy access to the vehicle for persons with
reduced mobility and wheelchair users. It introduces further requirements regarding steps, priority seats and
space for passengers with reduced mobility. Moreover, it provides rules for the accommodation of unfolded
prams and pushchairs and specifies guidelines for kneeling systems and access ramps.
2.3.5 UNECE Regulation No. 66
The UNECE Regulation No. 66 sets the requirements of the superstructure of the vehicles, which must have
sufficient strength to ensure enough residual space in case of rollover [27]. Figures 2-16 and 2-17 illustrate
the required minimum residual space.
Figure 2-16: Specification of residual space according to UNECE No. 66, paragraph 5.21.
1 The Vertical longitudinal central plane (VLCP) is the vertical plane which passes through the mid-points of the front axle track and
the rear axle track [27]. All the measures are expressed in millimeters.

14 Related literature and theoretical focus
Figure 2-17: Specification of residual space according to UNECE No. 66, paragraph 5.22.
Furthermore, this regulation sets the conditions, under which the rollover test has to be carried out, and
elucidates the basic approval method. It also contains a series of alternative procedures to ascertain the
structural strength of the bus without undergoing destructive tests.
2 The seat reference-point (SR) is located on the seat-back of each outer forward or rearward facing seat, 500 mm above the floor
under the seat, 150 mm from the inside surface of the side wall [27]. All the measures are expressed in millimeters.

Bus concept 15
3 Bus concept
After the analysis of some electric buses available on the market and the examination of the current
European legislative framework, the information collected was combined and a first bus-concept outlined.
As the use of composite materials fosters system integration, the main bus-subsystems were examined in
detail and their integration into the monocoque studied. In the following paragraphs the results of this
investigation are summarized and suggestions about the kinds of subsystems to implement in a possible
prototype presented.
3.1 Battery
As this thesis deals with the concept of a composite monocoque for an electric bus, the selection of the
batteries and their integration into the structure is a central issue. The low energy-density and specific-
energy of the cells available on the market make battery-packs heavy and voluminous, strongly affecting the
location of the centre of mass and, consequentially, the manoeuvrability of the entire vehicle. As a result the
monocoque has to be designed with particular attention, in order not only to properly support and protect
the batteries, but also to ensure an optimal weight distribution.
A good solution would be to place the batteries as close to the ground as possible, in order to lower the
centre of gravity and to increase the stability of the vehicle. In the same way, it would be preferable to avoid
their arrangement on top of the roof, as not only it would negatively influence the stability, but also a more
resistant and, therefore, heavier structure would be required to sustain the additional weight. Moreover,
batteries should be easily accessible; consequently, their placement on top of the roof is not advisable, as
suggested by Mr. Sutter (VBSG). For these reasons, we decided to locate the battery-packs under the floor.
However, it was first essential to estimate size and weight of the batteries, in order to verify the feasibility of
this solution, ensuring a sufficient space for other components and an easy accessibility, as prescribed by the
norms.
Bus model Length
[m]
Gross weight
[kg]
Battery capacity
[kWh]
BredaMenarinibus
e-Vivacity 8.00 17’500 202
BYD
ebus-12 12.27 18’500 324
Rampini
Alè Elettrico 7.72 11’800 180
Table 3-1: Electric buses’ property comparison.
By taking into account the available data about other electric buses, summarized in table 3-1, a total capacity
of 300 kWh was judged proper for our purpose. After a quick investigation into the batteries available on the
market and, particularly, into those adopted by electric cars (see table 3-2), it stood out that Tesla Model S
batteries have far better specific properties than those of its competitors. We chose, therefore, them as a
reference and assessed mass and size of the batteries of our bus, confident that the other battery
manufacturers will have closed the gap with Tesla and reached similar values within the time required to
further develop this project up to the prototype phase.

16 Bus concept
Car model Battery capacity
[kWh]
Battery mass
[kg]
Specific energy
[kWh/kg]
Nissan Leaf 24 171 0.140
BMW i3 22 230 0.095
Tesla Model S 85 540 0.157
Table 3-2: Electric-cars' battery-property comparison.
More specifically, Tesla batteries have a mass of 540 kg [28] and a volume of around 400 l [29]. With a total
capacity of 85 kWh [28] they reach a specific energy of 0.157 kWh/kg and an energy density of 0.2 kWh/l.
Dividing the assumed total capacity of 300 kWh by these values, we calculated for the batteries of the bus a
hypothetical mass of 2’000 kg and a presumed volume of 1’500 l.
Figure 3-1: Tesla Model S battery-pack. Image from: www.greencarreports.com.
3.2 Axles
The analysis of the bus axles goes beyond the aim of this thesis; nevertheless, it was essential to select
possible front and rear axles and to study their geometrical integration into the structure. In fact, the
monocoque had to be designed in a way to ensure sufficient space for the safe operation of axles, wheels,
steering mechanism and etc. and to withstand the loads introduced by these components.
After a quick research on the web pages of the most famous bus manufacturer and after the visits at the
workshop of the public transport company in St. Gallen and at the EvoBus plant in Mannheim, we observed
that many bus manufacturers employ ZF axles. For this reason, front and rear axle were selected among the
product of this company, which best suited our requirements.

Bus concept 17
3.2.1 Front axle
Figure 3-2: Independent front suspension RL 82 EC by ZF. Image from: www.zf.com.
The front axle RL 82 EC was chosen. This product has been developed for low-floor and low-entry busses and
has independent suspensions, which guarantee high steering angles. It is also apt for bus wider than 2.3 m
and can bear loads up to 8’200 kg. Finally, its mass is about 482 kg, depending on customer specifications,
and its wheels have dimensions 22.5" x 7.5".
3.2.2 Rear axle
Figure 3-3: Electric portal axle AVE 130 by ZF. Image from: www.zf.com.
The company ZF has developed a very interesting and smart solution for the rear axle of hybrid, electric or
trolley bus: the AVE 130. This is an electric portal axle that has integrated two compact, liquid-cooled
asynchronous motors. This solution was chosen, because it fits perfectly with the goal of this thesis to save

18 Bus concept
weight and space by mean of function integration. In fact, the incorporation of the engines on the axle keeps
the weight of the overall assembly low and further reduces the amount of space required, as there is no
need for both separate engine and prop-shaft. Moreover, the gained space could be employed for a more
powerful battery or to transport more passengers rearranging the bus-interior.
As far as technical specifications are concerned, the AVE 130 has a mass of 1’100 kg, a max load of 13’000 kg
and requires four wheels of size 22.5" x 8.25". The two engines have a nominal power of 120 kW and a
maximum torque of 10’500 Nm, each. Following the indication of [25], annex I, part B, paragraph 6.1,
specifying a least engine power of 5 kW per tonne of the technically permissible maximum laden mass of the
vehicle, it is easy to verify that the combined power of the two engine is sufficient to move vehicles with
mass up to 48 tonnes, more than twice the mass of a standard 12 meter bus.
3.3 HVAC (Heating, Ventilation and Air Conditioning)
Nowadays passengers’ comfort has become a central issue in transport sector, so that busses, trains and
even the majority of the cars sold are equipped with air conditioning system. As far as buses are concerned,
until recently heating systems, mainly composed of resistors placed under the seats, were the only one
supplied by the bus manufacturer: air conditioning systems were much rarer and usually installed at a later
date. On the other hand, today’s standard busses deploy single systems including heating, ventilation and air
conditioning, called HVAC systems. Their ability to produce both warm and fresh air makes them very
versatile and, moreover, it allows for space and weight saving, as only a single element has to be installed.
Unfortunately, both heating and particularly air conditioning are very energy-consuming processes and their
energy requirement may easily amount to a relevant fraction of the power produced by the engine. For this
reason, many electrical buses take advantage of independent sources of energy, like small thermal engines,
to produce the energy required to run the HVAC system. In this way, they manage avoid subtracting precious
energy from the battery, but add additional weight and adopt a solution, which, despite being very efficient,
in not emission-free.
Figure 3-4: HVAC system Aerosphere Midi by Spheros. Image from [31].

Bus concept 19
Considering what mentioned above and underling our will of building a full-electric bus, we opted for an all-
electric HVAC system. We considered many companies and addressed our search to products specific for
middle-sized buses. Taking also into account the fact that a monocoque, being made of composite material,
has a much better thermal insulation than standard metal-structures and that, as a consequence, smaller
HVAC systems can be applied, we chose for the systems AC 520 by Eberspächer and Aerosphere Midi by
Spheros as possible solutions. Both products were developed for midi-buses; they have similar sizes, about
(2’300 x 1’800 x 200) mm3, similar masses about 130 kg as well as similar heating outputs (30 kW) and
refrigerating capacities (30 kW) [30] [31].
3.4 Other systems
Beside the main systems mentioned above, buses contain many other components, e.g. pneumatic system,
hydraulic system, electric system, as well as windows, doors, wheelchair ramps and many more. These are
made mostly of standard elements, which are the same in all type of buses, included electric ones. It was,
therefore, decided to omit their broad description and to remark just some details further into the text, in
case it was judge relevant for the explanation of the bus concept.
3.5 Concept development
The typical reference system used in the automotive sector was adopted for all the models presented in this
thesis. This is characterized by the x-axis pointing in the direction of travel and contained in the symmetry
plane of the vehicle. The y-axis lies in the horizontal plane and is oriented to the left of the bus; finally, the z-
axis is contained in the symmetry plane of the vehicle and is oriented in vertical direction.
The basic concept of the bus was developed around the position of the batteries. Aware of the advantages
that low-floor buses have in the urban context, we imagined a continuous floor with no steps and low
entrances but with sufficient space under it to lodge the batteries. In order to deploy as much space as
possible in transversal direction, the width of the bus was set to 2.5 meter, whilst the one of the batteries to
2.3 m, leaving 10 cm on both sides for the structure and the battery supports. In order not to lift up
excessively the floor level, the thickness of the batteries was fixed to 200 mm. Finally, as a least volume of
1’500 l was required, a length of 3.3 m was selected.
Figure 3-5: Spatial disposition of axles and batteries (marked with yellow).

20 Bus concept
To better visualize the concept and to properly study the spatial disposition of the components, a 3D model
was created with the CAD program NX 8.5 by Siemens. At first, only axles and batteries were modelled
(figure 3-5). This allowed us to visualize the volumes required by these components and to outline an
appropriate shape for the floor. By assuming a floor thickness of 50 mm, we had to face with the
impossibility to place a door between the two wheels, since the entrance-step would have been too high to
meet the requirements set by the law. In fact, the UNECE Regulation No. 107 [26], annex 8, paragraph 3.1,
states that the minimum height of the entrance step has to be lower or equal to 250 mm. We opted,
therefore, for a particular bus-architecture with two entrances, one at the front and one at the rear of the
bus. The height of their steps was lowered to a value compliant with the legal standards by subdividing the
floor in two levels connected by ramps. This configuration presents a first, upper level in the middle of the
bus above the batteries and a second, lower level at the front and the rear of the bus, near the entrances.
Two ramps connecting the two levels were placed between the wheel housings, while other two shorter
ramps oriented in transversal direction were positioned in front of the entrances, in order to enable the
entrance steps to reach the value specified by the legislation (see figure 3-6). Unfortunately, the norms
contained in [26], annex 3, paragraphs 7.7.6.1.1 and 7.7.6.2 limit the slope of the gangways to 8% in
longitudinal direction and to 5% in transversal direction, respectively. Consequently, front and rear wheel
housing were extended to 1’910 mm, in order to contain the slope of the ramps within the limits. The overall
length of the bus was set to 10.5 m.
Figure 3-6: Bus floor configuration.
The next step regarded the internal disposition of passenger and driver’s seats. According to the
specifications written in [26], annex 3, paragraph 7.7.8, concerning passenger seats and space for seated
passengers, we conceived the seat arrangement represented in figure 3-7. Moreover, as specified in [26],
annex 3, paragraph 7.7.8.5.3, seats for passengers with reduced mobility were placed near the front
entrance and the vertical distance between the floor of these seating areas and the adjacent gangway was
lowered to 250 mm, conforming to [26], annex 8, paragraph 3.2.6. Finally, an area of (1’300 x 750) mm2 on
the rear part the bus directly in front of the doorway (highlighted in red in figure 3-7) was reserved to
wheelchair users, according to [26] annex 8, paragraph 3.6.1, and two wheelchair ramps installed at the
entrances.

Bus concept 21
Figure 3-7: Bus internal architecture.
Once the optimal seat configuration was determined, our main focus moved on the disposition of the
windows and on the geometry of the upper part of the bus. As far as it regards the windows, the directives
contained in [26], annex 3, paragraph 7.6 were followed and the arrangement depicted in figure 3-8
selected. In particular, the four windows located at the centre of the bus (highlighted in yellow in figure 3-8)
were designated as emergency exits. The vertical distance between their lower edges and the level of the
floor immediately below them was, therefore, set to 600 mm, which lies within the range specified by the
norm mentioned above. Finally, in order to obtain a harmonious design, the upper edges of the windows
were aligned to the ones of the doors, which were based on the plug sliding door system by Ventura
Systems, which was taken as a reference [32]. Front and rear door are, consequently, identical and have a
width of 1350 mm and a height of 1900 mm.
Figure 3-8: Complete bus model with highlighted emergency exits.
The upper part was designed with particular attention to system integration. A double deck structure was
imagined with outer and inner deck. According to this concept the outer deck plays a structural role and
embeds a series of roll bar to protect the occupants in case of rollover; it also sustains the HVAC system and
other components attached to the roof. On the other side, the inner deck is much thinner and hosts
channels and cavities for the convection of fresh air and the placement of the different systems required.
Figure 3-9 shows a section of the entire upper part.

22 Bus concept
Figure 3-9: Bus upper part section.
By considering the roof section depicted in figure 3-10, it is possible to better visualize the suggested channel
structure. The central part of the roof hosts three ventilation ducts, which are directly connected to the
HVAC system by means of three opening in the outer deck. In our concept the central duct should collect the
stale air coming from the passenger compartment and channel it into the intake manifold of the HVAC
system; whilst the other two channels are designed to diffuse fresh air along the bus.
In addition to these three channels, the roof structure includes two other cavities located under the roof
sides. Their shape was design to house the actuators of the doors and to ensure enough space for other
components, e.g. accumulators of pneumatic and hydraulic system, light cables, cameras and the support of
the information panels. As many of these systems must be periodically checked, these two compartments
were imagined with a series of small doors, in order to ensure an easy accessibility. Moreover, they present
a direct connection with another compartment placed in the front part of the bus, which was conceived
sufficiently ample to host the electronic display of the head sign and further components.
Figure 3-10: Roof transversal section.
In order to bring cables and fresh air from the under-roof partitions to the driver’s compartment, we
conceived a special hollow panel separating passengers and driver. Figure 3-11 depicts a section of this panel
and allow for the visualisation of its connection with the rest of the roof. The panel contains two channels:

Bus concept 23
the smaller one, placed on the right, conveys fresh air to the driver compartment, while the other, on the
left, is wider and has enough space for cable and pipes. Thanks to this strategy, the latter can easily reach
the compartments situated under the driver’s partition, where are normally located the hydraulic pump and
the power steering.
Figure 3-11: Section of the panel separating passenger and driver's compartment and its connection with the roof structure.
In this way, the bus concept was concluded and the model shown in figure 3-12 obtained. As final remarks, it
is important to mention that we appositely avoided including in the concept the front bumper, whose shape
marks the bus and, therefore, will be chosen by the possible manufacturer.
Figure 3-12: View of the final concept.

24 Bus concept
3.6 Mass evaluation
In order to correctly estimate the loads acting on the structure, a proper mass evaluation is crucial. In fact,
only knowing mass and position of every component, we can calculate the coordinates of the centre of mass
of the entire bus and, consequentially, the forces acting on the bus under the considered load cases. In order
to simplify the calculation, every component was assumed to have a uniform mass distribution, while
plausible assumptions were made, if the details of some system were not known.
The mass of the monocoque was set to a target value of 3’000 kg. As far as it concerns the axles, their
masses, 480 kg for the front axle and 1’110 kg for the rear one, were distributed into their components
proportionally to the volume of those. The mass of the wheels was rounded to 90 kg per wheel, as indicated
in [33], for a total mass of 540 kg. As already mentioned above in this chapter, the assumed mass of the
battery was 2’000 kg, while the one of the HVAC system was rounded to 150 kg. Based on the information
collected during the visit in the workshop in St. Gallen, we placed the pneumatic system into the two lateral
compartments of the roof, highlighted in yellow in figure 3-13, and selected a mass of 50 kg. The visit was
really useful to gain several interesting details about many components and allowed us to attribute to the
electric and to the hydraulic system a mass of 100 and 50 kg, respectively.
As far as windows are concerned, their mass was calculated by assuming a double-glass structure. The
automotive sector usually implies single-glasses with a thickness of 4 mm [34] for lateral and rear windows.
With the target to increase the thermal isolation of the bus, we opted for double-glass windows, each of
them made of two plates 4 mm thick. By taking a glass density of 2’600 kg/m3 [35], the mass of each window
was calculated by multiplying the glass density by the area and by their overall thickness of 8 mm. The
obtained values were then summed up and other 80 kg were added to account for the mass of the
windscreen, as suggested by Philipp Sutter in St. Gallen. The result gave an overall mass of 470 kg, which was
rounded to 500 kg in order to take also into account window frames.
Regarding the doors, their mass was obtained from the datasheet of the plug sliding door system by Ventura
Systems [32] and it amounted to 90 kg per door. In the same way, the mass of the two wheelchair ramps, 45
kg each, were taken from the website of the company Hidralgobel [36]. On the other side, the estimation of
the mass of the instruments placed in the driver’s compartment and that of other small components, like
lights, handles and wheelchair fastening system was made possible once again tanks to our visit in St. Gallen.
For these, a value of 300 kg and 100 kg was respectively chosen, as indicated by Mr. Sutter (VBSG).
Finally, as the mass of the fully loaded vehicle is required for the calculation of the limit load cases, the mass
of the seats and the passengers was considered. The seat model Centra by the company McConnelSeats was
set as a reference and an overall mass of 304 kg calculated [37]. On the other hand, the number and the
overall mass of the passengers were obtained following the rules specified in [25], annex I, part B, paragraph
2.2.3.8 describing how to calculate the technically permissible maximum mass of a vehicle. The reported
masses of a passenger, of a member of the crew and of a wheelchair and its user are 68, 75 and 250 kg,
respectively. Considering that the area occupied by a single standing passenger according to the legislation
amounts to 0.125 m2 and that the total available surface of the bus for standing passengers, excluding the
wheelchair area, is 9.56 m2, a total capacity of 76 standing passengers was calculated. In addition to them,
other 30 seated passengers, a wheelchair as well as the driver had to be taken into account in calculation,
which returned a value of 7’533 kg, rounded to 7’500 kg. Moreover, in order to properly evaluate the
position of the centre of gravity of the fully loaded bus, the mass of the passengers had to be distributed

Bus concept 25
inside the vehicle. The mass of the seated passengers was, therefore, added in the CAD model to the mass of
the seats; whilst the mass of the standing passengers was assigned to a solid body occupying the available
space for standing passengers and having a height of two meters. In a similar way, the mass of the
wheelchair and of its user was distributed over the wheelchair area. Figure 3-13 depicts the location of the
subsystems of the bus taken into account in the calculation of the centre of mass. More in detail the
translucent yellow and red solid represent respectively the standing passengers and the wheelchairs and its
user.
Figure 3-13: Assumed spatial location of bus main components.

26 Structural requirements
4 Structural requirements
During its live a bus is subject to various kinds of stresses. Manoeuvres and discontinuities of the road
surface introduce many different forces into the structure, which has to be therefore design in order to
withstand a multitude of possible load cases and to assure a safe-operation throughout the entire life of the
vehicle. Moreover, even extreme cases, i.e. crash and rollover, have to be taken into account in order to
guarantee a sufficient protection of the occupants in case they should arise.
Even if dynamic conditions cannot be excluded while designing vehicle structures, during the first
development phase the specific characteristics of the vehicle and of its subsystems are not jet well-defined
and, therefore, a study of their dynamic iterations would be extremely imprecise. Nevertheless, the
evaluation of the loads acting on the structure and of their effects cannot be ignored, even in a preliminary
design. A first evaluation was consequently carried out assuming quasi-static conditions. In order to cover a
range of situations as wide as possible, we considered the expected extreme service-conditions and chose
the following load cases.
4.1 Parking
Despite the fact that a vehicle parked at maximum payload on a flat road cannot be considered as an
extreme condition, this case is however interesting because the other load cases can be treated as variants
of this simple one. Knowing the location of the centre of mass of the entire bus and the distances between
this and the axles, it is possible to calculate the weight partition on the two axles simply by solving the
following system of equations:
(1)
(2)
Where Fzf and Fzr represent the forces oriented in vertical direction acting respectively on the front and on
the rear axle and Lf and Lr the horizontal distance between the centre of mass of the fully loaded bus and the
centrelines of the front and rear wheels.
Figure 4-1: Forces acting on the bus while parking.

Structural requirements 27
Moreover, assuming on first approximation that the centre of mass lies within the plane of symmetry of the
bus, which is the x-z plane, the force acting on each single wheel can be easily calculated by dividing Fzf and
Fzr by the number of wheels of the respective axle.
4.2 Torsion
Figure 4-2: Parking with a wheel on a curb.
We consider the case when the bus is parked at its maximum payload on a flat road but with a front wheel
on a curb high enough to cause one of the other three wheels to lift off the ground. Assuming the height of
the curb negligible with respect to the wheelbase, we can state that the weight partition on rear and front
axle is the same as by parking. In order to understand which wheel leaves the ground, we have to consider
the maximum torque that can be balanced by the two axles [38].
Figure 4-3: Sketch of the forces acting on a generic axle the maximum moment that it can balance.
Considering a generic axle, this can balance a torque up to the point when a wheel becomes completely
unloaded and leaves the ground. Looking at the sketch in figure 4-3, the corresponding moment can be
calculated as:
(3)
Where Fz corresponds to the load acting on the axle in vertical direction and t denotes the axle’s track.

28 Structural requirements
Coming back to figure 4-2, the front axle applies a moment to the rear one and, for the third principle of
dynamic, the rear axle applies a moment with the same modulus but opposite direction to the front axle.
The transmitted moment reaches its maximum value when a wheel leaves the ground: this wheel will belong
to the axle that can balance the lower moment. Based on our preliminary mass distribution assumptions, it is
possible to calculate the maximum moments that front and rear axle can balance by using (3):
92’235 Nm (4)
67’309 Nm (5)
Where Fzf and Fzr represent the forces oriented in vertical direction acting respectively on the front and on
the rear axle and tf and tr the track of the front and rear axle.
The rear axle can balance a lower moment: therefore, under the conditions of figure 4-2, the wheel leaving
the ground is the rear-right. Moreover, it is important to precise for the aim of this thesis that also the
chassis is subject to the same maximum moment, being front and rear axle connected exactly by this
element. Finally, it is worth to mention that the calculations done in this paragraph are just a rough
approximation. In fact, we have considered the axle as fixed elements and we have not taken into account
their geometry. Indeed, the aim of this reasoning was just to obtain the order of magnitude of the maximum
moment acting on the structure, in order enable us to perform later a first sizing. A detailed investigation of
the behaviour of the axles and of the structure in this specific case goes beyond the goals of this thesis.
4.3 Lateral limit
This load case describes cornering at limit condition. This occurs either when the tyres loose grip or when
the vehicle overturns. The first case takes place when the centrifugal acceleration acting on the vehicle goes
beyond the maximum centripetal acceleration allowed by the friction coefficient between tyres and ground.
On the other side, capsizing occurs when the resultant of the mass forces generates a moment that cancels
the ground reaction force acting on the wheels inside the corner, making it lift. Considering a road with good
grip conditions, the lateral adhesion coefficient of the whole vehicle can reach values up to μl max = 0.9 [38].
Depending on the ratio between the height (h) of the centre of gravity and the semi-track (t/2), the limit of
the lateral force is given by tires adhesion or by incipient rollover. The latter is particularly interesting for us,
because it is the standard limiting condition for busses. Considering figure 4-4, we can calculate the
maximum lateral force at to the incipient rollover by solving the following system of equation:
(6)
(7)
( )
(8)
(9)
(10)

Structural requirements 29
Figure 4-4: Forces acting on the bus while cornering at rollover limit condition.
In this way we obtain the forces acting on the wheels and the lateral acceleration:
88’901 N (11)
72’965 N (12)
( ) 79’878 N (13)
( ) 65’558 N (14)
8.81 m/s2 (15)
In order to verify whether rollover is the actual limit condition, we have to check that the corresponding
friction coefficient has an admissible value.
0.89 (16)
The value obtained is very close to the maximum theoretical value (μl max) of lateral coefficient, but it is
lower: this confirms that overturn is the limiting condition.
4.4 Longitudinal limit
While accelerating and decelerating, mass forces are generated. They transfer respectively weight from the
front of the vehicle to its back and vice versa, affecting its behaviour and its manoeuvrability. Therefore, the
influence of these forces had to be taken into account during the design phase. As this thesis focuses on a
bus, whose maximum acceleration is normally very low, in order not to cause injuries to the passengers, only
the case of emergency brake was treated. Hence, we considered the bus while braking to the limit of tyres
adhesion. The limit value of the longitudinal adhesion coefficient of the whole vehicle was set to μb=1.05
according to [39]. Considering the forces acting on the bus, depicted in figure 4-5, the sum of forces and
moments along the three main axes give the following equations:

30 Structural requirements
(17)
(18)
( )
(19)
(20)
(21)
Figure 4-5: Forces acting on the bus while braking at tyres' adhesion limit.
The solved system gave us the loads acting in z- and x-direction on the front and rear axle as well as the
value of the deceleration at tyres’ adhesion limit:
( ) 124’756 N (22)
( ) 37’109 N (23)
( ) 130’994 N (24)
( ) 38’965 N (25)
10.30 m/s2 (26)
4.5 Pothole
Roads are not always smooth and flat, but often have potholes or small obstacles on their way. It is,
therefore, of primary importance that the structure is designed to withstand the shocks generated by this
kind of impact. As reported in [38], in this case “the vertical acceleration measured on the suspensions struts
towers can reach values up to three times the acceleration of gravity. *…+ As a consequence of such a high

Structural requirements 31
acceleration, the suspension ends its travel so that the sprung and unsprung masses become integral”. The
results is that the structure experiences vertical forces up to three time higher than those acting on the front
or on the rear axle under smooth-road conditions:
(27) Besides vertical loads, also horizontal forces are generated, which depend on the angle of introduction of the
force. In our case, we assumed as first approximation that the force was introduced into the structure with
an angle of 45° with respect to the z-axis. Nevertheless, it has to be mentioned that the real forces acting on
the structure have an impulsive nature and are strongly dependant on the geometry of the suspension, on
the speed of the vehicle, and on the wheel- and body-mass [40]. As a consequence, the quasi-static
approach, which we used, is a rough approximation and can just provide imprecise values of the force
distribution. For this reason, like in chapter 4.2, the values obtained gave us just the order of magnitude of
forces really acting on the structure and are useful only to perform a preliminary sizing. A more exhaustive
approach would take also into account dynamic effects, but this is not part of the aim of this thesis.
4.6 Crash
Despite the absence of a specific bus security assessment program - in fact the safety parameters
established by the EuroNCAP3 and the NHTSA4 NCAP do not consider vehicles with mass higher than 2’500 kg
- it was crucial to at least roughly assess the crash behaviour of the bus structure and to identify the areas
with a high stress concentration. Taking into account the city environment, where this kind of bus is
supposed to operate, it was decided to simulate the case of a car crashing against the front part of the bus,
which was assumed to be stationary at a stop. In order to calculate the acceleration acting on the bus, it was
first necessary to know the kinetic energy of the car. This could be easily calculated with the following
formula by knowing the mass of the car and its speed:
(28)
Assuming that all the impact energy was dissipated within the deformation of the crumple zone of the two
vehicles, it was possible to obtain the force acting on the bus:
(29)
Finally, under the assumption of constant acceleration, the acceleration, to which the bus is subject, was
estimated by dividing the above-calculated force by the mass of the bus:
(30)
Imagining a car with a mass of 2’000kg impacting the bus at 50 km/h (≈ 13.88 m/s) and supposing the overall
crumple zone of the two vehicles to be 0.3 m, the calculated acceleration acting on the bus is about 4.2 m/s2.
3 The European New Car Assessment Programme (Euro NCAP) is a European car safety performance assessment programme tasked
with evaluating new automobile designs for performance against various safety threats [41]; 4 The National Highway Traffic Safety Administration (NHTSA) is an agency belonging to the Department of Transportation of the U.S.
government with the aim to save lives, prevent injuries and reduce vehicle-related crashes [42].
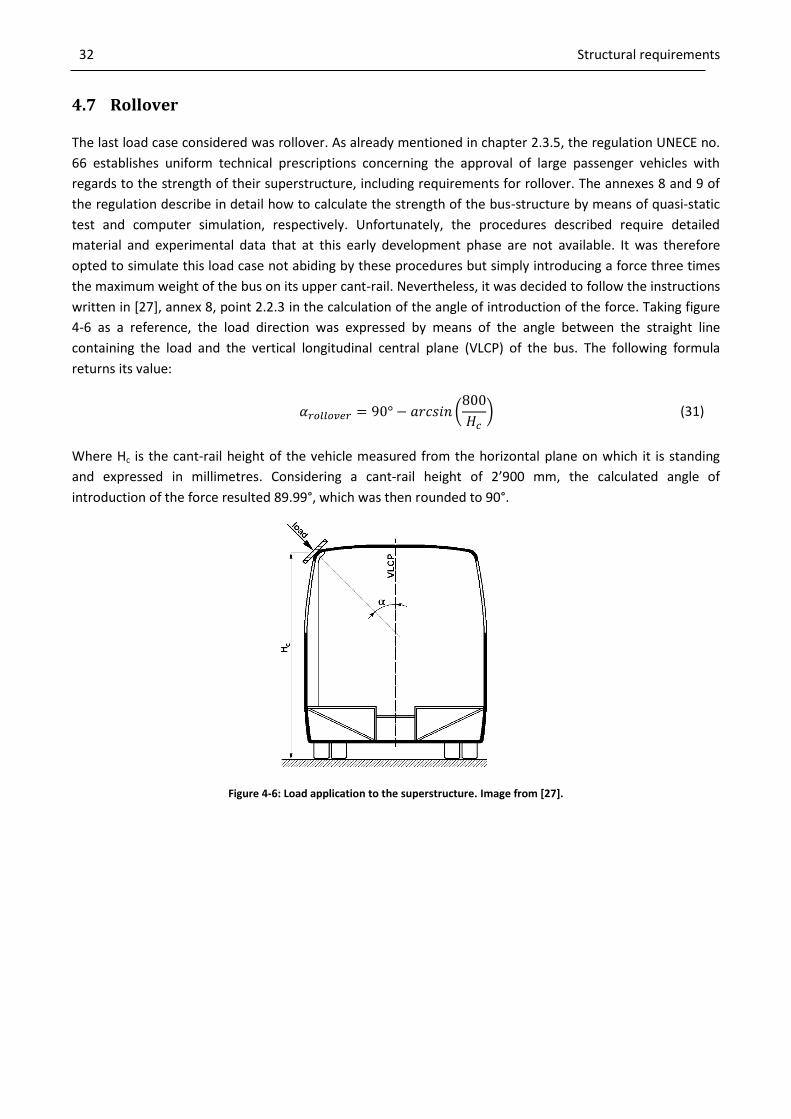
32 Structural requirements
4.7 Rollover
The last load case considered was rollover. As already mentioned in chapter 2.3.5, the regulation UNECE no.
66 establishes uniform technical prescriptions concerning the approval of large passenger vehicles with
regards to the strength of their superstructure, including requirements for rollover. The annexes 8 and 9 of
the regulation describe in detail how to calculate the strength of the bus-structure by means of quasi-static
test and computer simulation, respectively. Unfortunately, the procedures described require detailed
material and experimental data that at this early development phase are not available. It was therefore
opted to simulate this load case not abiding by these procedures but simply introducing a force three times
the maximum weight of the bus on its upper cant-rail. Nevertheless, it was decided to follow the instructions
written in [27], annex 8, point 2.2.3 in the calculation of the angle of introduction of the force. Taking figure
4-6 as a reference, the load direction was expressed by means of the angle between the straight line
containing the load and the vertical longitudinal central plane (VLCP) of the bus. The following formula
returns its value:
(
) (31)
Where Hc is the cant-rail height of the vehicle measured from the horizontal plane on which it is standing
and expressed in millimetres. Considering a cant-rail height of 2’900 mm, the calculated angle of
introduction of the force resulted 89.99°, which was then rounded to 90°.
Figure 4-6: Load application to the superstructure. Image from [27].

FEM analysis and monocoque development process 33
5 FEM analysis and monocoque development process
The development process of the monocoque went through a series of models characterized by different
materials, different fibre layups as well as slight changes in the geometry, before obtaining a structure able
to satisfy all the requirements. Starting from the model conceived in chapter 3 as basis, a series of
simulations with different fibre layups were performed for all the previously specified load cases. This
allowed for the identifications of the most stressed regions under each load case, as well as for an evaluation
of the level of criticality of the different load cases, enabling the exclusion from the rest of the analysis, of
the non-critical ones, saving in this way precious time.
In order to ensure a safety margin taking into account fatigue effects, we set a safety factor of two.
Consequently, a maximum admissible strain of 0.4% was established as failure criteria, considering the
ultimate strain of carbon fibre to be approximately 0.8% both in tension and in compression [43]. However,
since the aim of this thesis is not to design a bus monocoque deep into details, but on a global scale, this
threshold was not considered as strictly restrictive. Indeed, small regions, where the maximum strain
exceeded the above-mentioned limit, were tolerated. This was justified by the fact that our focus was the
streamlining of the overall structure and the optimization of the global laminate layup. Small regions with a
high level of stress and strain might be adjusted with local reinforcements in a second development phase;
Otherwise, the containment of the strain below the established threshold in the entire model during this
phase could lead to an over sizing of the structure. In summary, the aim of the simulations was to verify the
acceptability of the strains on a global scale and to identify the weak spots of the structure.
5.1 FEM setup
Figure 5-1: Mesh orientation in the different regions.
As we are working with laminates, whose thickness is at least two orders of magnitude smaller than the
other dimensions, the assumption of thin shell could be applied and a 2D model employed. The latter was
built by means of the CAD program NX 8.5 by Siemens on the basis of the model presented in chapter 3. The
same program was also used to perform the structural simulations reported in this thesis. The element type

34 FEM analysis and monocoque development process
CQAD4 was chosen and its size set to 50 mm in all bus regions. As composite materials have a strongly
anisotropic behaviour, the bus was modelled assigning an orientation to each meshed region and specifying
accordingly the material properties. Figure 5-1 illustrates the different orientations adopted in the final
model: the colours yellow, red and blue mark regions, whose elements are oriented in x-, y- and z-direction,
respectively.
Bus components were not simulated in detail, but their influence was taken into account by adding non-
structural mass to the laminates located in their proximity. For example, the mass of the standing passengers
was added to that of the floor, the mass of the windows was included in that of the bus sides and the mass
of the batteries in that of the lower part of the bus. Only axles and wheels were modelled in a different way,
in order to better replicate load introduction. Indeed, the mass of the assembly composed by front axle and
its wheels was concentrated in two points corresponding to the centres of the front wheels. These points
were then connected through the rigid beam elements RBE2 to the wheel housings, as shown in figure 5-2.
The same measure was followed for the rear axle, with the only difference that the two points were
connected together with a rigid beam element, in order to simulate the interaction between the wheels. It
has to be precised that this step was not performed for the front axle, as the selected model, the RL 82 EC by
ZF, has independent wheels.
Figure 5-2: View of axle and wheel attachments.
5.2 Material characterisation
The materials used were standard woven and standard unidirectional carbon fibre (CF) fabrics, whose
properties were taken from the table in the appendix. As from cost-related reasons, described in detail in
chapter 6, the most suitable manufacturing technique seemed to be wet-lamination, a fibre volume content
of 50% for all the fabrics was chosen according to [44]. As in the available datasheet the reported values for
unidirectional carbon fibre (UDCF) referred to samples with 60% fibre volume content, their Young modulus,
shear modulus and maximum allowable stresses and strains were reduced by 20% according to [45], in order
to compensate for the decrease in fibre volume content. The other properties were left unchanged. As far as
the thickness of the fabric is concerned, a standard value of 0.4 mm was chosen for all plies in the following

FEM analysis and monocoque development process 35
simulations, based on data obtained from the catalogue of the company Swiss-Composite [46]. Regarding
the core, we opted for the foam 110 WF by Rohacell [47], whose properties are listed in the appendix.
5.3 Load cases boundary conditions
The load cases described in chapter 4 were simulated. Parking was replicated by fixing the bus at the four
point representing the wheels and applying gravity.
Considering the case of maximum torsion, treated in chapter 4.2, the front right wheel was assumed to be
on a curb, therefore, according to what demonstrated above, the rear right wheel is lifted. The weight of the
bus was consequently distributed on the other three wheels, while the rear right part of the bus was free to
bend downwards. Assuming the height of the curl to be very small, this condition was simulated by applying
a fixed boundary condition to the two front wheels and a simply supported one to the rear left. In this way,
the latter wheels cannot move in z-direction, but preserves the other degrees of freedom, included the
rotational ones. As a result, the rotation of the rear part of the bus was not hindered and the lift of the rear
left wheel could be simulated. Finally, the acceleration of gravity was applied.
As far as lateral and longitudinal limit are concerned, the implemented boundary conditions were the same
as those of parking. The only difference was the addition of the corresponding centrifugal or braking
acceleration. While the latter is always oriented in x-direction, centrifugal acceleration can be both in y-
and -y-direction, depending on the direction of the curve. Therefore, two different sub-cases were
investigated, in order to study the influence of vehicle’s asymmetry introduced by the doors.
A similar situation occurred when considering the impact with a pothole on the road. Because of the
asymmetry of the bus, four simulations had to be carried out, one for each wheel. The impact was simulated
by introducing a force on the wheel impacting the object. The components of the force were calculated with
eq. (27) and both had a value of 135’000 N. The concerned wheel was assumed as free to move, whilst the
other wheel belonging to the same axle was modelled as simply supported, in order to keep the contact with
the ground, but to allow for the rotation of the axle. Finally, the other wheels not involved in the impact
were assumed as fixed and gravity was applied.
Figure 5-3: Impact with obstacle boundary conditions.
Crash was simulated by fixing the bus in correspondence of the bumper attachments and by applying a
simply supported boundary condition to all the wheels. In this way the contact with the ground was assured,

36 FEM analysis and monocoque development process
but the movement of the structure in x- and y-direction allowed. To conclude, the acceleration of 4.2 m/s2 in
x-direction, calculated in chapter 4.6, was applied combined with gravity.
Figure 5-4: Crash boundary conditions.
Finally, as far as rollover is concerned, a fixed boundary condition was chosen for the entire bus floor and a
force of 486’000 N, equal to three times the estimated weight of the bus, was introduced on the upper cant-
rail, as shown in figure 5-5. Even in this case the asymmetry of the bus was considered and two different
simulations performed: in the first one with the force was introduced on right cant-rail, while the other one
on the left cant-rail.
Figure 5-5: Rollover boundary conditions.

FEM analysis and monocoque development process 37
5.4 Optimisation process and results
Figure 5-6: Model 1.
The first series of simulations was based on a model called Model 1 and depicted in figure 5-6. This was
characterized by windows of size 1.680 x 1.100 m2, with a corner radius of 10 cm and separated by 10 cm
wide pillars. In order to get a first idea of the stress distribution, we started specifying a unique, simple
laminate layup for the entire structure. This layup consisted of a 5 cm thick sandwich panel, with an outer
layer composed by 12 plies of woven carbon fibre on each side and a 40.4 mm thick foam core.
The results showed elevated stress concentrations at the window edges, which reached the highest values in
case of impact against a pothole and rollover. It also emerged that the strains arisen in the structure under
parking, torsion, lateral and longitudinal limit conditions were much smaller than those of the other loading
cases. In addition, the effects of the bus asymmetry, determined by the presence of the door openings on
the right side, arose in the different strain levels reached in the impact against a pothole depending on the
wheel involved. More specifically, it was observed that higher strain levels were reached when the forces
were applied on the wheels on the left side of the bus. All these facts were confirmed by other simulations
with different fabric type, number of plies and fibre orientation.
The excessive strain values obtained during the first series of simulation, above all in case of impact against a
pothole and rollover, suggested to increase the torsion stiffness of the bus and to strengthen the regions
between the windows. We thickened, therefore, the outer layer of the laminates in correspondence of the
pillars enclosing doors and windows by adding additional plies of unidirectional carbon fibre. These were
inserted below the previous external layer, reducing the local thickness of the foam core, and oriented in
transversal direction, in a way to form arch stiffeners. These structures play the role of roll bars and
guarantee the protection of the passengers in case of rollover (see figure 5-7).

38 FEM analysis and monocoque development process
Figure 5-7: Roll bar structure.
Deploying this new configuration, many combinations of different layup and stiffeners thickness were tried
out, but none of them led to the desired results. In particular, the strain levels reached at the window
corners were still beyond the admissible threshold in most of the load cases and the maximum deformation
by rollover was far too high.
Having acknowledged the limitations of Model 1, little changes in geometry were brought about and Model
2 was created. The modifications regarded exclusively the windows (including windscreen and rear
windows). More specifically, the radius of the corner angles was changed from 10 to 20 cm and the width of
the lateral windows reduced, in order to enhance the width the stiffeners up to 20 cm. The aim was to limit
the strain level at the window corners and to reduce the deformation during rollover.
Figure 5-8: Model 2.

FEM analysis and monocoque development process 39
In the same way as previously done with Model 1, different layups, fibre orientations and stiffener
thicknesses were examined. The improvements in comparison with model 1 were neat, but, unfortunately,
not yet sufficient to meet all the requirements. Nevertheless, the results were useful, because they outlined
the same recurring schema seen before and confirmed crash, rollover and pothole as the most critical cases.
Moreover, the last case reconfirmed the higher criticality of an impact involving the wheels on the left side
of the bus than a one involving the wheels on the right side. Based on these remarks, we decided from then
on, not to simulate all the load cases, but just to focus on pothole, crash and rollover. In particular, the latter
was the most critical and responsible of very high strain levels around the rear window, as it is possible to
evince in figure 5-9.
Figure 5-9: Strain during rollover.
On the other hand, the stresses generated in case of crash were spotted in the proximity of the bumper
attachments, but we could not consider their values to be very precise, as the local geometry of this region
was not jet well defined. We shifted, therefore, our focus on the front aisle and on the floor of the driver’s
compartment.
Figure 5-10: Strain during crash.

40 FEM analysis and monocoque development process
Figure 5-11: Strain during impact of the front left wheel against an obstacle.
Finally, taking into account the strain generated by the impact against a pothole, the simulations showed
how the highest values reached involved the front left wheel and how they tended to confine themselves in
the areas below the second and the fourth window counting from the head of the bus, as shown in figure 5-
11.
Having pinpointed the most critical areas, the monocoque was modified by assigning different laminate
layups to different regions and by orienting the fibres along the stress direction. A 60 mm thick sandwich
structure was chosen as basic setup for the entire monocoque. It was characterised by an external layer
made of 12 plies of woven carbon fibre oriented at 45° with respect to its reference direction. In the pillars
between the windows the stiffeners were then
created by adding to this basic configuration other
9.6 mm of UDCF fabric for each side of the laminate,
while in central part of the bus, in correspondence of
the second, third and fourth window, 12 further
layer of woven CF were added to the laminate of the
external shell of the monocoque, in order to increase
the torsion stiffness. For the sake of clarity figure 5-
12 represents the described layup: the stiffeners are
depicted in red, the foam in yellow and the black
zones correspond to the woven CF.
Considering the good drapability of woven fabrics and the particular geometry of the wheel housing, we
decided to build the inner part of the bus with a 50 mm thick laminate with an external layer made of a 12
plies of woven CF oriented in x-direction. The only exception was the front aisle and the floor of the driver’s
compartment. Here, a 100 mm thick laminate with an external layer 7.2 mm thick made of UDCF with fibres
aligned in x-direction was chosen in order to better withstand the high stresses generated in case of crash.
As expected, the higher thickness of the overall laminate led to a significant improvement if compared with
the previous arrangement. The results improved particularly in the pothole case, where the maximum strain
was reduced by more than 20%. Anyhow, analysing the strain arisen by crash, we noticed elevated values in
Figure 5-12: Model 2 laminate setup.

FEM analysis and monocoque development process 41
y-direction in the floor of the front part of the bus. Indeed, in this region only UD CF oriented in direction of
travel were employed. This fact suggested orienting part of the fibres in y- direction or at 45°, in order to
contain the strain in transversal direction. Finally, taking rollover into account, we observed that even with
this new laminate arrangement the strain around the rear window was still far too high (more than one
order of magnitude) to be acceptable. We opted, therefore, for another change in geometry.
With the aim to reduce the deformation around the rear window and the windscreen, we built a new model,
called Model 3, with a smaller rear window, which now is 1.800 x 1.100 m2, and extended front stiffeners,
which were prolonged downwards to the bus platform. From the results of the rollover simulation it
emerged that this new model had a much stiffer rear part, able to reduce the strain level around the rear
window by about 50% with respect to Model 2. On the other side, this increase in stiffness takes place
almost exclusively on the rear part of the monocoque, leading to a torsion of the structure while rollover due
to the lower stiffness of the front part. As a consequence, high strain level, not detected in the previous
simulations, arose around the corners of the side windows, as shown in figure 5-13. This unexpected effect
persuaded us to come back on our steps and to abandon the idea of a smaller rear window.
Figure 5-13: Model 3, strain during rollover.
The problem was tackled starting again from Model 2, but increasing this time the stiffness of the front part
of the monocoque. Precisely the width of the four central windows was reduced to 1.530 m and the one of
the stiffener between the front door and the front wheels (highlighted in yellow in figure 5-14) was brought
to 30 cm. In addition, the front part of the monocoque was extended to the floor level in the same way of
Model 3, in order to further increase the stiffness of this region. The new model was named Model 4.
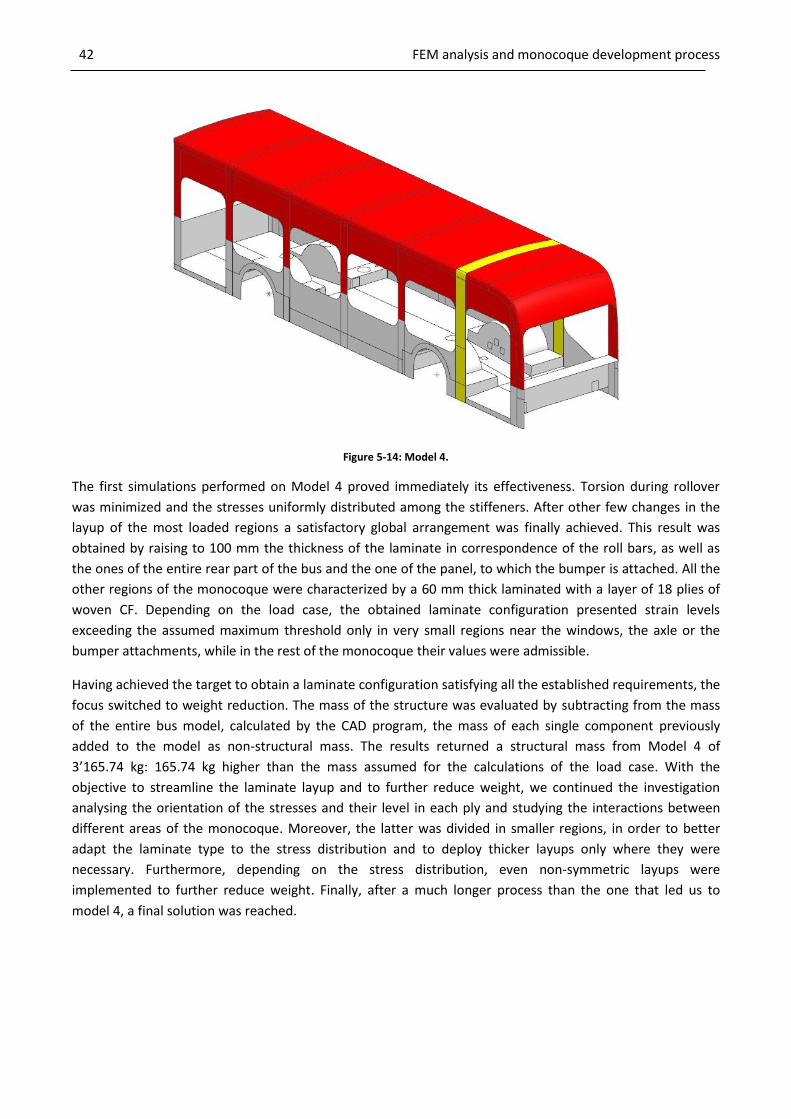
42 FEM analysis and monocoque development process
Figure 5-14: Model 4.
The first simulations performed on Model 4 proved immediately its effectiveness. Torsion during rollover
was minimized and the stresses uniformly distributed among the stiffeners. After other few changes in the
layup of the most loaded regions a satisfactory global arrangement was finally achieved. This result was
obtained by raising to 100 mm the thickness of the laminate in correspondence of the roll bars, as well as
the ones of the entire rear part of the bus and the one of the panel, to which the bumper is attached. All the
other regions of the monocoque were characterized by a 60 mm thick laminated with a layer of 18 plies of
woven CF. Depending on the load case, the obtained laminate configuration presented strain levels
exceeding the assumed maximum threshold only in very small regions near the windows, the axle or the
bumper attachments, while in the rest of the monocoque their values were admissible.
Having achieved the target to obtain a laminate configuration satisfying all the established requirements, the
focus switched to weight reduction. The mass of the structure was evaluated by subtracting from the mass
of the entire bus model, calculated by the CAD program, the mass of each single component previously
added to the model as non-structural mass. The results returned a structural mass from Model 4 of
3’165.74 kg: 165.74 kg higher than the mass assumed for the calculations of the load case. With the
objective to streamline the laminate layup and to further reduce weight, we continued the investigation
analysing the orientation of the stresses and their level in each ply and studying the interactions between
different areas of the monocoque. Moreover, the latter was divided in smaller regions, in order to better
adapt the laminate type to the stress distribution and to deploy thicker layups only where they were
necessary. Furthermore, depending on the stress distribution, even non-symmetric layups were
implemented to further reduce weight. Finally, after a much longer process than the one that led us to
model 4, a final solution was reached.

FEM analysis and monocoque development process 43
Figure 5-15: Different type of laminates employed in the final layup configuration of Model 4.
This configuration employs nine different layups, as shown in figure 5-15. The light blue region, forming the
majority of the inner part of the bus, was characterized by a 50 mm thick laminate with an external layer
made of 12 plies of woven CF. The same layup, but with an overall thickness of 60 mm, was used for the
olive green areas, building part of the wheel coverage and part of the bus sides. Unfortunately, this layup
was not sufficiently strong to be employed in the entire bus side; therefore, a configuration with 18 plies of
woven CF was attributed to the region of the bus side around the front wheels, remarked in figure 5-15 with
red. An even more robust laminate with 24 plies of woven CF was used in the grey regions below and above
the two central windows; the same laminate was used for the entire front part of the bus and for the panel
hosting the bumper attachments. Moreover, in order to withstand the high stresses introduced in case of
crash, a 50 mm thick sandwich panel was implemented in floor behind this panel, marked with yellow. This
laminate was characterized by an outer layer composed by 12 plies of woven CF placed on top of other 12
plies of UDCF. On the other side, the strain level reached its lowest values in the roof, allowing us to
designate for this region a 60 mm thick laminate, highlighted in purple, with an outer layer made only of six
plies of woven CF. As far as stiffeners are concerned, a 100 mm thick laminate composed by 24 plies of UDCF
was selected in order to satisfy the strict requirements coming from rollover. As already explained previously
in this chapter, the stiffeners were integrated directly below the outer layer of the laminate of the
corresponding regions: this means that on the bus side they were covered by other 12 plies of woven CF,
whilst on the roof the additional plies were just six. These two layups correspond to the orange and green
regions of figure 5-15. As explained later in chapter 6, this disposition facilitates the manufacturing process,
because the stiffeners can be directly laminated on the internal shell of the monocoque and then covered
with the external layer in one single step. Finally, as the thickness of the stiffeners generates some
protrusions in the internal part of the bus, it was chosen to apply a 100 mm thick laminate to the rear part of
the bus in order to avoid a complex geometry, which could lead to problems related to the drapability of the
fibres. For the rest, the basic configuration with an outer layer made of 12 plies of woven CF was chosen. As
final remark, it has to be precised that all the woven fabrics mentioned above were oriented at 45° with
respect to the main direction of their laminate (see figure 5-1), whilst the all the UD fabrics were align to it.
The simulation performed with this final layup configuration returned slightly lower values of the maximum
strain if compared with the results achieved by Model 4. In addition, the weight of the monocoque is now
more than the 20% lighter than before: in fact, its mass is only 2’324.27 kg. Satisfied of this result, we
decided to interrupt the optimisation process and to proceed with the other tasks of this thesis.

44 Manufacturing process
6 Manufacturing process
How it is possible to infer from the concept presented in chapter 2.1, both the Neoplan MIC and the NABI
Metro 45C LFW were manufactured by hand lamination employing female forms. These replicated the
external shape of the two buses and could be opened once the monocoques were cured in order to facilitate
the demoulding. This technique gives the outer part of the bus a smooth and nice surface, but leaves the
inner part coarse and rough, which is normally covered by a cladding or a non-slip coating in the case of the
floor. Considering the dimensions of the bus, it is no surprise that the weight of the internal trim is
significant. Therefore, in order to save weight avoiding any kind of internal coating, we decided to undergo a
different approach investigating a new manufacturing concept.
6.1 Selection of the productive method
There are many manufacturing methods employing composite materials, but just few of them are suitable
for our case. Considering the size of the bus and the low volume production typical of this industrial sector,
it appeared clear that the implementation of resin transfer moulding (RTM) processes would have implied
too high tool and machine costs: it was, therefore, discarded. The same considerations were done about
autoclave processes: the cost of an autoclave able to contain the entire bus would have been simply too high
to depreciate the investment in a reasonable time. Also because of cost related reasons, the use of out-of-
autoclave prepregs was rejected. The last two possible methods were vacuum assisted resin infusion (VARI)
and wet lamination. Both methods are theoretically possible, but flame-resistant resins, required by the
norms, are easier to process in wet lamination. In fact, these kinds of resins generally have a big amount of
fillers inside and, consequentially, a high viscosity, which makes them more difficult to be processed by VARI.
Moreover, due to the difficulties to foresee the resin flow within the complicated shape of the monocoque,
there was a high risk that, producing the part in VARI, a series of attempts would have been required before
obtaining a part with a good quality. Considering the price of the material and the time required to assembly
the VARI setup, the risk was judged too high and, consequently, wet lamination was preferred.
It is worth to mention that, even if wet lamination is well-suited for large parts and complex geometries and
has the advantages of requiring a small investment if compared to the other methods, the quality of the final
part strongly depends on the skills of the technicians. In addition, as far as it concerns the cycle time, even if
wet lamination is a time consuming process, this is not a major issue considered the small production
volume expected. The main problematic may be related to the assembly of the semi-finished components or
to the fabrication of the moulds. In fact, being the expected size of the bus bigger than 10 meters, moulds of
glass or carbon fibres supported by a wood or metal framework seem to be the only reasonable solution for
components of such size.
6.2 Method description
Focusing on weight reduction, the conceived new method employs positive forms. In this way, it is possible
to avoid the interior trim in the monocoque, which does not require any further treatment after the
demoulding. Even the non-slip floor may be realized in one single step, by deploying the same technique
used to give small-boat decks a non-slip feature. This technique consists in the use of special resins with sand
inside and in the application on the mould of a corrugated panel, which gives the corresponding region of
the finished part a wavy surface, ensuring in this way the desired grip. A possible drawback of this method

Manufacturing process 45
may be the poor quality of the outer surface of the monocoque. Fortunately, in contrast to the automotive
sector, this is not a central issue in public transportation. Moreover, as the bus will have to be in any case
covered by some layers of varnish, slightly thicker layers may be applied in order to improve the surface
quality and reduce the height of the ripples.
Figure 6-1: Mould of the upper inner-part.
Figure 6-2: Mould of the lower inner-part.
The conceived manufacturing process involves the assembly of five main shells and their covering with foam
and with an outer layer of fibre. Considering in detail these five shells, the upper inner-part and the lower
inner-part of the monocoque are supposed to be formed my mean of the two big positive moulds depicted
in figures 6-1 and 6.2. After the placement of the fibres and their impregnation, they undergo a debulking
with vacuum and a cure process, before being demoulded. The obtained two shells are then glued together
to form the inner part of the monocoque, shown in figure 6.3.
Figure 6-3: Monocoque inner shell.
With same process, other three smaller positive forms are employed to manufacture the remaining three
shells, depicted in figures 6-4, 6-5 and 6-6. They shape the lower part of the bus and host axle and battery.
Figure 6-4: Front lower shell.
Figure 6-5: Central lower shell.
Figure 6-6: Rear lower shell.

46 Manufacturing process
For this reason, positive forms are used to obtain a good surface in correspondence to the battery support
and to the axle attachments, which could even be directly integrated in the shells. These are then supposed
to be glued to the inner shell of the monocoque obtained before, looking after to interpose the required
foam. At this point the roll-bars can be laminated directly on the structure and the foam placed in position.
An assembly similar to the one in figure 6-7 is then obtained.
Figure 6-7: Assembly of the inner shells with stiffeners (highlighted in red) laminated on top.
The last steps consist of the direct lamination of the external shell on the assembly. The external part of the
monocoque can then be debulked and cured. A view of the finished structure is given in figure 6-8.
Figure 6-8: Finished monocoque

Demonstrator 47
7 Demonstrator
A model of the monocoque in scale 1:18 was built to enable a better visualisation of the concept and to
validate the manufacturing process. Even if carbon fibre was assumed as constitutive material of the CAD
model, for cost-related reasons the demonstrator was manufactured in fibreglass. Moreover, some
simplifications were made in order to facilitate its construction: i.e. the thickness of the monocoque was
assumed to be constant along the entire model and the size of both the front and rear wheel-housing to be
the same. In addition, the grade of front and rear entry was not modelled and no internal detail added.
Nevertheless, the demonstrator was built in wet lamination technique following the same process outlined
in chapter 6. The following sections contain a summary of the main steps undertaken.
7.1 Moulds
The first step consisted in the construction of the moulds. For time related reason it was chosen to
manufacture only three moulds: these corresponded to the upper and to the lower inner shell, and to the
shell hosting the batteries. As the axle supports were not modelled in the demonstrator, an elevated quality
of the laminate in correspondence of the front and of the rear wheel-housing was no longer required.
Consequentially, it was decided not to build the corresponding forms.
Figure 7-1: Mould of the shell hosting the batteries.
Figure 7-2: Mould of the upper inner part of the monocoque.
Figure 7-3: Mould of the lower inner part of the monocoque. uuu

48 Demonstrator
All the moulds were built in MDF. Whilst the form of the shell hosting the batteries was made of a single
MDF plate (see figure 7-1), for the realisation of the other two moulds, figures 7-2 and 7-3, many plates had
to be cut and bonded together with epoxy resin, before being milled manually. Particularly demanding was
the construction of the mould of the lower inner shell: in order to model the particular geometry of the
wheel housing with accuracy, we preferred to cut the corresponding regions out of the form and to insert in
the so-created empty spaces four small blocks of MDF reproducing the curved geometry of the wheel-house.
These were manufactured by means of a laser cutter, which enable us to cut small MDF sections with the
desired accuracy. The so-obtained MDF elements were then glued together to shape the wheel houses and
placed in the appositely created spaces inside the mould. Concluded the modelling of the three moulds,
their edges rounded and a draft angle of 4° was provided in order to facilitate the demoulding. Finally, the
forms were sanded and covered with four coats of resin, in order to fill the pores on the surface and to
prevent a possible loss of vacuum in the following steps.
7.2 Demonstrator’s manufacturing
Completed the moulds, the following step was the lamination and the construction of the corresponding
three shells. In order to further simplify this process, it was decided not to replicate the exact layup of the
optimized model but just to use three layer of woven glass fibre in all the regions of the three shells. After
laying the fibre and impregnating them with epoxy resin, vacuum was applied to remove the excess of resin
and to foster the compaction of the fibres on the edges, particularly in correspondence of the wheel
housings.
Figure 7-4: Inner shell assembly.
The shells were then demoulded and the two inner parts of the monocoque bonded together. As it is
possible to notice in figure 7-4, it was decided not to leave the openings for windows and doors during the
lamination if the demonstrator. In fact, considering the size of the model, an exact reproduction of such
small parts would have been too difficult. Hence, we opted not to replicate doors’ and windows’ shape but
to cut them out once the monocoque was finished. Of course, in a full size model doors and windows would
not be cut out but the dedicated openings would be integrated in the moulds.
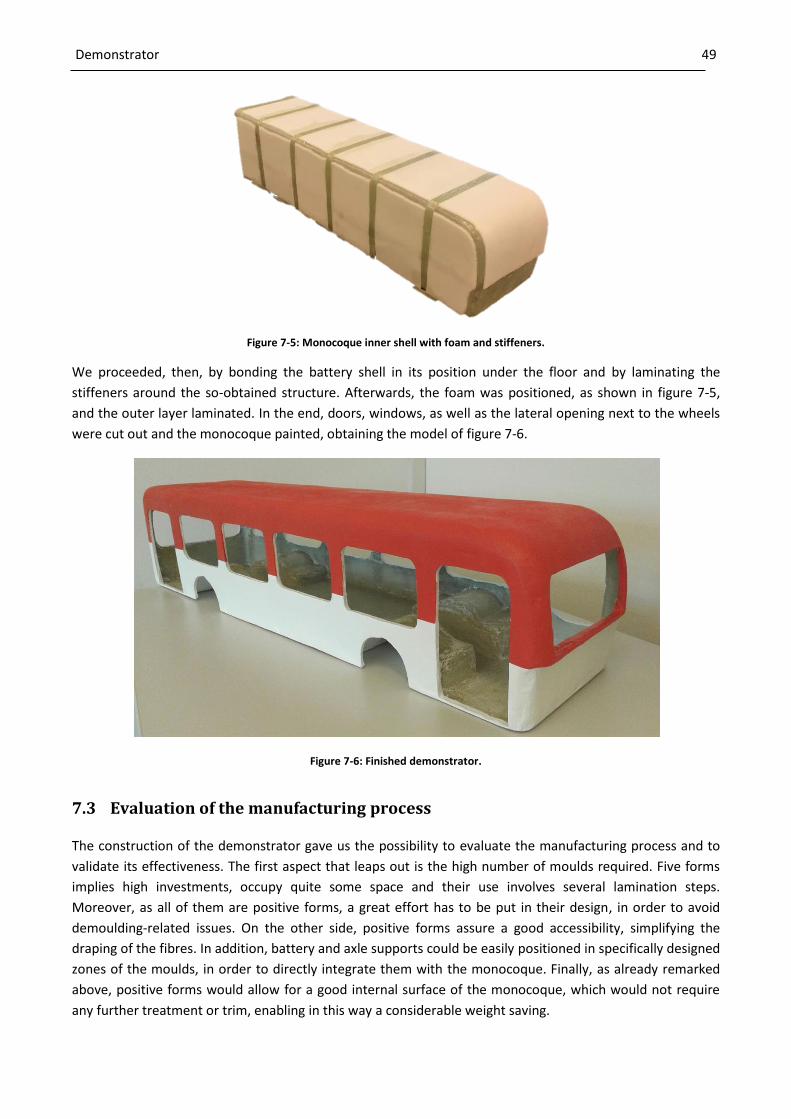
Demonstrator 49
Figure 7-5: Monocoque inner shell with foam and stiffeners.
We proceeded, then, by bonding the battery shell in its position under the floor and by laminating the
stiffeners around the so-obtained structure. Afterwards, the foam was positioned, as shown in figure 7-5,
and the outer layer laminated. In the end, doors, windows, as well as the lateral opening next to the wheels
were cut out and the monocoque painted, obtaining the model of figure 7-6.
Figure 7-6: Finished demonstrator.
7.3 Evaluation of the manufacturing process
The construction of the demonstrator gave us the possibility to evaluate the manufacturing process and to
validate its effectiveness. The first aspect that leaps out is the high number of moulds required. Five forms
implies high investments, occupy quite some space and their use involves several lamination steps.
Moreover, as all of them are positive forms, a great effort has to be put in their design, in order to avoid
demoulding-related issues. On the other side, positive forms assure a good accessibility, simplifying the
draping of the fibres. In addition, battery and axle supports could be easily positioned in specifically designed
zones of the moulds, in order to directly integrate them with the monocoque. Finally, as already remarked
above, positive forms would allow for a good internal surface of the monocoque, which would not require
any further treatment or trim, enabling in this way a considerable weight saving.

50 Cost assessment
8 Cost assessment
8.1 Assumptions
The assessment of the costs associated with the production of the monocoque was based on the last version
of the model developed in chapter 5. The algorithm developed by Dr. Markus Zogg was employed in order to
obtain an appraisal as precise as possible. The costs were split into four main issues, related to the main
phases of the manufacturing process: cutting, laminating, curing and finishing.
8.1.1 General assumptions
The calculation was carried out based on the following general assumptions:
one-shift operation with few but versatile workers;
central store and central production-line;
manufacturing country: Switzerland;
possible outsourcing of cost-intensive processes (e.g. milling, paintwork).
As we assumed a small-series product, only 20 monocoques per year were expected to be built. Assuming a
production active 230 days a year for 7.3 h a day, a reject rate of 10% and 85% efficiency of the process,
justified by the low process-efficiency of single-shift operation, it was calculated that it takes 71.35 hours to
manufacture a complete monocoque. However, it has to be precised that this calculation did not take into
account the time required to assemble the forms, which in this case may be considerable.
As far as it refers to the overheads, they were set to 15% of the net cost, based on the experience of Dr.
Markus Zogg. He also suggested assuming R&D costs to be 20% of the net cost, while both operating costs
and sale expenses were supposed to cover 10% each. Finally, a 15% profit margin was chosen, in order not
to overestimate possible revenues.
General Process Parameters
Cycle time 256’887 s
Number of components per cycle 1 component/cycle
Working days per year 230.0 days/year
Shifts per working day 1.0 shift/day
Working hours per shift 7.3 h/shift
Process efficiency 85.00 %
Reject rate 10.00 %
Overall produced parts 20 parts/year
Rejected parts 2 parts/year
Saleable parts 18 parts/year
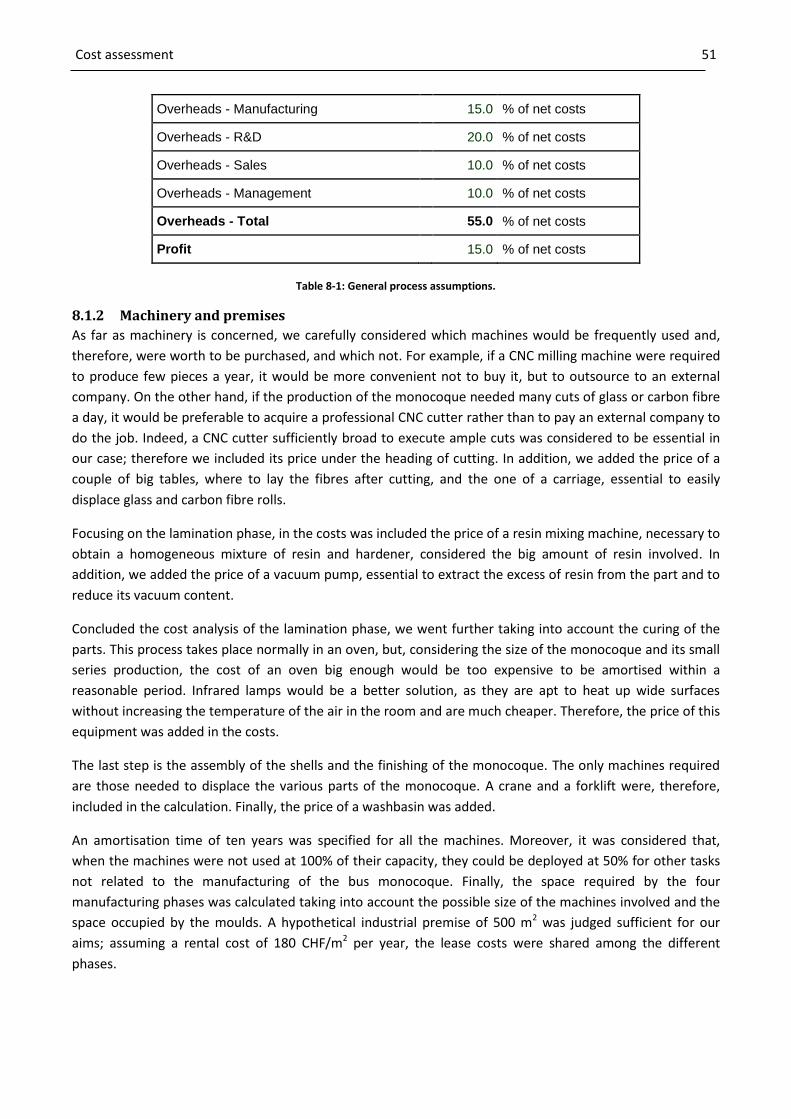
Cost assessment 51
Overheads - Manufacturing 15.0 % of net costs
Overheads - R&D 20.0 % of net costs
Overheads - Sales 10.0 % of net costs
Overheads - Management 10.0 % of net costs
Overheads - Total 55.0 % of net costs
Profit 15.0 % of net costs
Table 8-1: General process assumptions.
8.1.2 Machinery and premises
As far as machinery is concerned, we carefully considered which machines would be frequently used and,
therefore, were worth to be purchased, and which not. For example, if a CNC milling machine were required
to produce few pieces a year, it would be more convenient not to buy it, but to outsource to an external
company. On the other hand, if the production of the monocoque needed many cuts of glass or carbon fibre
a day, it would be preferable to acquire a professional CNC cutter rather than to pay an external company to
do the job. Indeed, a CNC cutter sufficiently broad to execute ample cuts was considered to be essential in
our case; therefore we included its price under the heading of cutting. In addition, we added the price of a
couple of big tables, where to lay the fibres after cutting, and the one of a carriage, essential to easily
displace glass and carbon fibre rolls.
Focusing on the lamination phase, in the costs was included the price of a resin mixing machine, necessary to
obtain a homogeneous mixture of resin and hardener, considered the big amount of resin involved. In
addition, we added the price of a vacuum pump, essential to extract the excess of resin from the part and to
reduce its vacuum content.
Concluded the cost analysis of the lamination phase, we went further taking into account the curing of the
parts. This process takes place normally in an oven, but, considering the size of the monocoque and its small
series production, the cost of an oven big enough would be too expensive to be amortised within a
reasonable period. Infrared lamps would be a better solution, as they are apt to heat up wide surfaces
without increasing the temperature of the air in the room and are much cheaper. Therefore, the price of this
equipment was added in the costs.
The last step is the assembly of the shells and the finishing of the monocoque. The only machines required
are those needed to displace the various parts of the monocoque. A crane and a forklift were, therefore,
included in the calculation. Finally, the price of a washbasin was added.
An amortisation time of ten years was specified for all the machines. Moreover, it was considered that,
when the machines were not used at 100% of their capacity, they could be deployed at 50% for other tasks
not related to the manufacturing of the bus monocoque. Finally, the space required by the four
manufacturing phases was calculated taking into account the possible size of the machines involved and the
space occupied by the moulds. A hypothetical industrial premise of 500 m2 was judged sufficient for our
aims; assuming a rental cost of 180 CHF/m2 per year, the lease costs were shared among the different
phases.

52 Cost assessment
Machines Premises
Process step
Investm
en
t
Am
ort
isation t
ime
Main
ten
ance c
osts
(per
2'0
00 w
orki
ng h
ours
)
Capacity w
he
n n
ot
fully
used
Am
ort
isati
on
co
sts
per
sale
ab
le p
art
(at
100%
cap
acit
y)
Main
ten
an
ce c
osts
per
sale
ab
le p
art
Tot. m
achin
e c
osts
per
sale
ab
le p
art
(at 1
00%
cap
acity
)
Requ
ired s
pace
Renta
l costs
per
ye
ar
Ren
tal co
sts
per
sale
ab
le p
art
(at
100
% c
apac
ity)
[CHF] [year] [CHF] [%] [CHF/part] [CHF/part] [CHF/part] [m^2] [CHF/m^2] [CHF/part]
Cutting 200’000 10 10’000 50.0 1’111 321 1’432 140 180.00 1’400
Laminating 100’000 10 5’000 50.0 556 161 716 120 180.00 1’200
Curing 50’000 10 2’500 50.0 278 80 358 120 180.00 1’200
Finishing 100’000 10 5’000 50.0 556 161 716 120 180.00 1’200
Total 450’000 22’500 2’500 722 3’222 500 5’000
Table 8-2: Machinery and premises rental cost
8.1.3 Tools
Being particularly cost-intensive and time-consuming to manufacture, the five moulds represent the main
expense items of this section. In order to keep the costs as low as possible, the three forms corresponding to
the lower part of the bus, where axle and battery attachments are positioned, were assumed to be made of
milled MDF-blocks. On the other side, we supposed the two remaining forms, corresponding to the internal
part of the monocoque, to be composed by a structure in composite material sustained by a wood or metal
framework. In order to avoid the purchase an expensive CNC milling machine, we chose to let the first three
moulds be manufactured externally, while we opted for the internal production of the other two. Based on a
previous evaluation carried out by Dr. Markus Zogg in [48], the overall cost of the forms was appraised at
about € 500’000 and their amortisation was distributed over 100 monocoques: this means a five years
amortisation time with the previously mentioned production of 20 monocoques per year.
Regarding the manufacturing phases, scissors, cutters, saws and other tools used to cut fibres were put
under the heading cutting. Similarly, buckets, paint-brushes and paint-rollers were included in the costs of
the lamination phase; whilst no tool is required for the curing process. As well as it concerns the finishing of
the monocoque, the cost of planers, sandpaper and polishers was added to the calculation. Furthermore,
the cost of an airgun and of a vacuum cleaner, for keeping the workplace clean and for removing dust and
dirt from the parts, were distributed among the manufacturing phases. Finally, a general amortisation period
of three year was chosen, based on the experience of Dr. Markus Zogg.

Cost assessment 53
Tools
Process step In
vestm
en
t
Am
ort
isation t
ime
Main
ten
ance c
osts
(per
2'0
00 w
orki
ng h
ours
)
Capacity w
he
n n
ot
fully
used
Am
ort
isati
on
co
sts
per
sale
ab
le p
art
(at
100%
cap
acit
y)
Main
ten
an
ce c
osts
per
sale
ab
le p
art
Tot. to
ol costs
per
sale
ab
le p
art
(at 1
00%
cap
acity
)
[CHF] [year] [CHF] [%] [CHF/part] [CHF/part] [CHF/part]
Forms 500’000 5 25’000 0.0 5’556 803 6’358
Cutting 3.000 3 150 0.0 56 5 60
Laminating 10.000 3 500 0.0 185 16 201
Curing 0 3 0 0.0 0 0 0
Finishing 5.000 3 250 0.0 93 8 101
Total 518’000 25’900 5’889 832 6’721
Table 8-3: Tool costs.
8.1.4 Energy and personnel
Energy costs were assessed by summing the energy consumption of every machine and by multiplying it by
the number of the hours, during which the machine was employed. An energy cost of 0.20 CHF/kWh was
assumed in the calculation. On the other side, personnel costs were calculated based on the man hours
required to accomplish an entire productive cycle. A direct personnel cost of 50 CHF/h and an efficiency of
85% were supposed.
Energy
Direct personnel
Process step
Energ
y r
equ
irem
ent
"Un
it"
Energ
y c
osts
En
erg
y c
osts
per
sale
ab
le p
art
Manp
ow
er
requ
irem
ent
Direct pers
onne
l costs
Pers
onn
el eff
icie
ncy
Pers
on
nel co
sts
per
sale
ab
le p
art
["Unit"/h] [CHF/"Unit"] [CHF/part] [Personnel] [CHF/h] [%] [CHF/part]
Cutting 2.0 kWh 0.20 32 1.00 50.00 85.0 4’664
Laminating 0.5 kWh 0.20 8 1.60 50.00 85.0 7’462
Curing 50.0 kWh 0.20 793 0.00 50.00 85.0 0

54 Cost assessment
Finishing 0.8 kWh 0.20 13 1.00 50.00 85.0 4’664
Total 845 3.60 16’790
8.1.5 Material
The cost of material required for the construction of the monocoque was evaluated on the basis of the last
model described in chapter 5. Knowing the mass of the monocoque and its layup, the amount of carbon
fibre, resin and foam was calculated within each “bus region” and then summed up. The values obtained for
carbon fibre and resin were then expressed in kg to ease the calculation of the costs, which were based on
verbal information provided by the company Tissa [49]. For all the materials a scrap rate of 5% was chosen
and a waste disposal costs of non-processed material set to 300 CHF/tonne.
Materials
Material
Quantity
(Mate
rial fo
r 1 p
art
)
"Un
it"
Am
ount
of m
ate
rial
per
"unit"
Mate
rial costs
per
"un
it"
(incl
. Pac
kagi
ng)
Mate
rial eff
icie
ncy
("pr
oces
sed
/ bou
ght"
)
Utilis
ation o
f n
on
-
pro
cessed m
ate
rial
Waste
dis
posal costs
for
non
-pro
cessed m
ate
ria
l
Am
ount
of m
ate
rial per
part
Mate
rial co
sts
per
sale
ab
le p
art
Am
ount
of n
on-
pro
cessed m
ate
rial
Waste
dis
posal costs
for
non
-pro
cessed m
ate
ria
l
per
sale
ab
le p
art
["Unit"] [g/"Unit"] [CHF/"Unit"] [%] [CHF/t] [g/part] [CHF/part] [g/part] [CHF/part]
Carbon fibre 1’100.00 kg 1’000 38.20 95 general
trash 300.00 1’100’000 49’146 57’895 19
Resin 680.00 kg 1’000 12.50 95 general
trash 300.00 680’000 9’942 35’789 12
Foam 5.240 m3 110’000 850 95 general
trash 300.00 576’400 5’209 30’337 10
Total 2’356’400 64’297 124’021 41
Table 8-4: Material costs.
Next to fibres, resin and foam, there are other additional materials (e.g. release agent, hardener, release
film, bleeder, breather, sealant and vacuum-bag, as well as pipes, joins and specific cleaning agents), which
are employed during the manufacturing process. These are called auxiliary material, because they do not
become part of the final product, but are essential for its production. The cost of these materials was
calculated based on the experience of Dr. Zogg and is summarized in the following table.

Cost assessment 55
Auxiliary materials
Auxiliary material
Quantity
(Mate
rial fo
r 1 p
art
)
"Un
it"
Am
ount
of m
ate
rial
per
"unit"
Mate
rial costs
per
"un
it"
(incl
. pac
kagi
ng)
Mate
rial eff
icie
ncy
("pr
oces
sed
/ bou
ght"
)
Utilis
ation o
f n
on
-
pro
cessed m
ate
rial
Waste
dis
posal costs
for
non
-pro
cessed m
ate
ria
l
Am
ount
of m
ate
rial per
part
Mate
rial co
sts
per
sale
ab
le p
art
Am
ount
of n
on
-
pro
cessed m
ate
rial
Waste
dis
posal costs
for
non
-pro
cessed m
ate
ria
l
per
sale
ab
le p
art
["Unit"] [g/"Unit"] [CHF/"Unit"] [%] [CHF/t] [g/part] [CHF/part] [g/part] [CHF/part]
PE foil for cutter 500.00 m2
90 2.00 95 general
trash 300.00 45’000 1’170 2’368 1
Tube vacuum 100.00 m 40 3.20 95 general
trash 300.00 4’000 374 211 0
Seal 250.00 m 60 0.50 95 general
trash 300.00 15’000 146 789 0
Vacuum bag 600.00 m2 90 1.00 95
general trash
300.00 54’000 702 2’842 1
Perforate release film
200.00 m2 40 1.00 95
general trash
300.00 8’000 234 421 0
Bleeder 300.00 m2 200 2.00 95
general trash
300.00 60’000 702 3’158 1
Gluing utensils 30.00 disposable
set 1’200 30.00 95
general trash
300.00 36’000 1’053 1’895 1
Release wax 10.00 l 800 36.00 95 general
trash 300.00 8’000 421 421 0
Cleaning material 30.00 disposable
set 750 10.00 95
general trash
300.00 22’500 351 1’184 0
Total 252’500 5’152 13’289 4
Table 8-5: Auxiliary material costs.
8.2 Cost calculation and analysis
By summing all the expenditure issues listed in the previous section, we obtained an estimation of the net
cost of the monocoque. As it is clear to see in table 8-6 more than 60% of the net cost is attributable to the
material. Personnel are only the second expenditure issue with 16.4% of the net cost, which amounts to
CHF 102’251. The expected sale price would be CHF 186’457: quite high if considered that the sale price of a
normal city-bus is about CHF 250’000, as we learned during our visit to the public transport company of St.
Gallen. Nevertheless, the information collected during the literature researched shows that electric buses
tend to have much higher sale prices, which vary from the $395’000 of the BYD ebus to the $850’000 of the
Proterra EcoRide BE35. If compared with these prices, the cost of the monocoque has a much lower impact
on the final price of the bus but, even so, cost containment is a central issue that has to be tackled in order
to obtain a competitive product.

56 Cost assessment
Cost subdivision per saleable part
Net Costs
[CHF] [%]
Material 64’297 62.9
Auxiliary material 5’152 5.0
Waste disposal 223 0.2
Personnel 16’790 16.4
Energy 845 0.8
Machine amortisation 2’500 2.4
Machine maintenance 722 0.7
Tool amortisation 5’889 5.8
Tool maintenance 832 0.8
Premises 5’000 4.9
Net cost 102’251
Overheads 56’238
Cost of goods sold 158’489
Profit 27’969
Sale price 186’457
Table 8-6: Cost summary.

Variant comparison 57
9 Variant comparison
As already mention above, cost containment is a central issue for the competitiveness of a product. For this
reason we considered also other materials and established a comparison in terms of weight and prices, in
order to find a possible cheaper alternative to carbon fibre.
9.1 Glass and natural fibre
In particular, a monocoque in glass fibre (GF) and another in natural fibre (NF) were investigated. Selecting
the same manufacturing process of the model in carbon fibre, we assumed a fibre volume content of 50% in
both cases. While the material properties of glass fibre were taken from [43], those of natural fibre refer to
[50]. Selecting a safe factor of 2, like in the previous case, the maximum allowed strain was set to 0.35% for
glass fibre and to 0.8% for natural fibre. Afterward, the fibre layups of the two monocoques were optimized
following the same process explained in chapter 5. The masses of the two optimised structures turned out to
be 3’019 kg in case of glass fibre and 3’197 kg in case of natural fibre. By comparing these values to the 2’324
kg of the carbon fibre monocoque, we assessed a respective mass increase of 29.9% and of 37.6%.
Graph 9-1: Bus variant comparison.
Switching our focus on manufacturing costs, we chose to keep most of the parameters assumed during the
cost calculation of the previous model. The only two differences regarded the cost of the materials and the
required man hours. As far as material costs are concerned, the purchase price of glass fibre was set to 3.35
CHF/kg, according to [49], whilst, without any reliable value for a big amount, 17.95 CHF/m2 was selected for
the natural fibre, based on the information contained in [50]. Regarding the man hours, we decided to
increase the manpower required during the lamination phase by 25%, considering the bigger amount of
material involved and the resulting higher number of layers. From the calculations it resulted that the net
,0
,20
,40
,60
,80
,100
,120
,140
,160
,180
,200
0 500 1000 1500 2000 2500 3000 3500
Co
st [
CH
F]
Tho
usa
nd
s
Mass [kg]
Bus Variants
CF
GF
NF

58 Variant comparison
costs of the monocoques in glass and natural fibre were CHF 63’081 and CHF 182’203, respectively, while
their sale price amounted to CHF 115’029 and CHF 332’253. While the cost of the monocoque in natural
fibre was affected by the huge amount of material required – in some region with a high stress
concentration the sandwich structure had to be substituted by a solid panel in order to withstand the forces
– and a probably non-reliable cost of the material, glass fibre appeared to be a suitable substitute of carbon
fibre, being 38.3% cheaper.
Table 9-1 helps visualise the relation between cost and weight of the three models. As it is clear to see, the
difference between carbon and glass fibre is quite evident both in terms of costs and mass. Therefore,
considering the remarkable cost saving of glass fibre and the significant weight reduction of the carbon fibre,
we decided to investigate a trade off between the two materials.
9.2 Glass and carbon fibre trade off
The aim to obtain a structure light and at the same time not too expensive prompted us to consider a trade
off between carbon and glass fibre. In particular two models were investigated. The first, called trade-off 1,
was obtaining from the model in glass fibre by substituting this material with carbon fibre in high stressed
regions were a thick and therefore heavy; laminate was required. The second, named trade-off 2, was based
on the model in carbon fibre described in chapter 5, to which, in the opposite way as what done above, the
expensive carbon fibre laminates of the less stressed regions were replaced by cheaper glass fibre
sandwiches. The so-obtained models were then optimised always following the procedures described in
chapter 5 until the configurations depicted in figures 9-1 and 9-2 were reached. These two images highlight
with black the areas of the monocoques made of carbon and with white those made of glass fibre.
Deploying 1’158 kg of glass fibre and 220 kg of carbon fibre the first model had an overall mass of 2’592 kg,
11.5% heavier than the model in carbon fibre but 14% lighter than that in glass fibre. On the other side, the
second model, marked by carbon fibre roll bars, was characterised by 960 kg of glass fibre and 354 kg of
carbon fibre and had an overall mass of 2’522 kg. This resulted in a mass reduction of 70 kg with respect to
the first model and a reduction of 16.5% if compared with the glass fibre model.
Figure 9-1: Trade-off 1 (GF roll bars).
Figure 9-2: Trade-off 2 (CF roll bars).
As far as it concerns the costs, the manpower required for the lamination phase was calculated by
considering the ration between carbon and glass fibre and by doing a proportion with the manpower
required by the model in carbon fibre and that in glass fibre. Otherwise, all the other assumptions and the

Variant comparison 59
material price mentioned above rested valid. The results gave a net cost of CHF 69’373 for the first model
and of CHF 74’611 for the second. As it is clear to notice, both models allow for a significant cost reduction if
compared to the carbon fibre monocoque. Nevertheless, choosing the glass fibre monocoque as a reference,
it emerged that the first model enable a weight reduction of 14% in the face of a cost increase of 10%, whilst
the second model brings a 16.5% weight reduction with a 18% cost increase. In table 9-2 it is easy to see how
both solutions are a good compromise between a pure carbon fibre monocoque and a pure glass fibre
solution, as they enable to obtain a significant weight reduction with a small cost increase. Nevertheless,
trade-off 1 was judged better, because it allows for the bigger weight reduction in relation to the cost
increase.
Graph 9-2: Trade off mass and cost comparison.
,0
,20
,40
,60
,80
,100
,120
,140
,160
,180
,200
0 500 1000 1500 2000 2500 3000 3500
Co
st [
CH
F]
Tho
usa
nd
Mass [kg]
Trade off comparison
CF
GF
NF
Trade-off 1
Trade-off 2

60 Conclusions and outlook
10 Conclusions and outlook
10.1 Conclusions
Weight reduction is a central issue for the sustainability of a vehicle and the reduction of its maintenance
costs. Less mass means less energy required to displace the vehicle, resulting in a smaller ecological footprint
and lower costs. The introduction of composite materials in the transport sector has the potential to strongly
decrease the weight of vehicles, not only because of the lower density of these materials if compared to
metals, but also because of a series of other advantages.
First of all, the employment of composite materials allows for the replacement of traditional framework
structures with a monocoque. The latter takes up both the functions of chassis and of body, enabling a first
weight saving. In addition, it has the advantage to be well suited for system integration: that is the inclusion
of part of the bus system inside the Monocoque itself. In this way we can spare weight and manufacturing
cost at the same time, as these components would be manufactured together with the monocoque and
would not be installed in a later stage.
Moreover, a composite monocoque allows for a further, indirect weight reduction. In fact, the employment
of light composite structure would reduce the loads acting on the axles, which could be substituted by
smaller and lighter models, and on the wheel, whose number could in this way sink from six to four.
Furthermore, these measures have additional, important effects on maintenance costs, as tyre and brake
wear is reduced.
With the aim to investigate the feasibility of this solution, this work introduced a new concept of a
composite monocoque for a middle sized electric city bus. The monocoque was designed to meet the
specifications required by the different systems of the bus, in primis the batteries, and to be in line with the
current European regulations. Selecting carbon fibre as constitutive material, the geometry of the
monocoque was arranged and its laminate layup optimized, in order to obtain a structure as light as possible
able to withstand the critical load cases defined in chapter 4. The mass of the structure was evaluated and
turned out to be 2’324 kg.
A new manufacturing method deploying positive forms was subsequently conceived. Despite the attention
required in the design of the mould, in order to avoid issues related to the demoulding, the employment of
positive forms has the advantage of bestowing on the inner walls of the monocoque a surface with a good
quality. This does require neither further treatments nor an inner trim, meeting the aim of weight reduction.
Based on the characteristics of the manufacturing process and on the assumption of a small production
series of 20 monocoques per year, an estimation of the fabrication costs of the monocoques was carried out
by means of the algorithm developed by Dr. Zogg. A net cost of CHF 102’251 and an expected sale price of
CHF 186’457 were obtained. If compared to the sale price of a standard city bus, this value appears to be
quite high, considering that it referrers only to the bus structure; but, taking into account the prices of other
electric buses, it has a much lower influence on the expected final price of the entire bus.
Nevertheless, cost reduction was considered crucial for the success of the product and, as material cost
amounted to more than 60% of the monocoque net cost, it was decided to tackle the problem considering
other materials, alternative to carbon fibre. Consequently, two new models, made of glass and natural fibre,

Conclusions and outlook 61
were built and their layups optimized like in the previous case. The results indicated the glass fibre model as
the cheapest alternative, having a net cost more than 38% lower than that of the previous model.
Nonetheless, this solution was almost 700 kg heavier than that in carbon fibre. For this reason, an
investigation of a possible trade off between carbon and glass fibre was carried out with the aim to obtain
light but at the same time not too expensive structure. The results showed that is possible to achieve a mass
reduction of 427 kg with a cost increase of CHF 6’292, by substituting in the glass fibre model the thickest
and heaviest laminates with thinner and lighter carbon fibre sandwich panels. Thanks to this operation, we
obtained a monocoque with a mass of 2’592 kg and a net cost of CHF 69’373.
Finally, taking into account the mass evaluation reported in chapter 3, it is possible to substitute the
previously assumed monocoque mass with the values calculated above, in order to assess the weight of the
unladen bus. The results showed an unladen mass of 8’304 kg for the CF model and of 9’000 kg for the GF
model, while the unladen mass per meter were 791 kg/m and 857 kg/m, respectively. On the other side, the
model combining both materials and called trade off 1 had an unladen weight of 8’572 kg and an unladen
mass per meter of 816 kg/m.
10.2 Outlook
As the aim of this thesis was not to design in detail a composite monocoque for an electric city bus, but to
establish a concept and a preliminary design, all the information contained in this work has to be intended as
a basis for more detailed, further developments. Possible future works may focus on different details of the
monocoque or on other aspects of the bus not treated here.
A satisfactory monocoque design was achieved, but further improvements are still possible with much more
detailed work. Moreover, bus systems and their integration within the structure were not considered in
detail and the local layup of the laminates were not defined and optimized, carrying out fatigue analysis and
dynamic simulations.
In addition, as the results of chapter 4 showed that the front axle is slightly more loaded than the rear one, a
rear axle with only two wheels may be employed. Therefore, the choice of the axle has to be reconsidered in
order to further reduce weight of the bus and also their attachments have to be designed. Ultimately, the
battery has to be considered in detail and its support designed.

62 Bibliography
11 Bibliography
[1] D. Pöltinger: Konzeptanalyse Composite Bus; interner Bericht ICS-2014-003, Inspire ICS, Zürich, 2014;
[2] Otto-Peter A. Bühler: Neoplan Metroliner im Carbon-Design; Das Buskonzept der Zukunft - Die erste
freitragende Omnibuszelle aus Faserverbundstoffen; Herausgeber: Gottlob Auwärter GmbH & Co.,
Stuttgart-Möhringen, Germany; Neoplan-Buch 004121989, 1989;
[3] https://de.wikipedia.org/wiki/Neoplan_MIC;
[4] http://www.omnibusarchiv.de/include.php?path=content&mode=print&contentid=249;
[5] http://cptdb.ca/wiki/index.php?title=North_American_Bus_Industries_Metro_45C;
[6] http://www.gizmag.com/proterra-ecoride-be35-bus/16195/;
[7] http://www.businessinsider.com/proterra-electric-buses-spur-more-teslas-2014-6#ixzz3gckZyBIT;
[8] http://www.proterra.com/;
[9] http://www.bredamenarinibus.it;
[10] https://en.wikipedia.org/wiki/BYD_electric_bus;
[11] https://fr.wikipedia.org/wiki/G%C3%A9p%C3%A9bus_Or%C3%A9os_4X;
[12] http://www.avem.fr;
[13] http://kortrijk.busworld.org/;
[14] https://fr.wikipedia.org/wiki/Iveco_Ellisup;
[15] http://www.iveco.com;
[16] www.rampini.it;
[17] http://www.bustocoach.com/it/content/rampini-al%C3%A8-el-77-metri-elettrico-classe-i-3-porte;
[18] https://de.wikipedia.org/wiki/Solaris_Urbino_12_electric;
[19] http://www.solarisbus.com;
[20] http://www.vdlbuscoach.com;
[21] http://www.busandcoachbuyer.com/vdl-euro6/;
[22] Directive 2007/46/EC of the European Parliament and of the Council;
[23] http://www.unece.org;

Bibliography 63
[24] Regulation (EC) No 661/2009 of the European Parliament and of the Council;
[25] Commission Regulation (EU) No 1230/2012;
[26] UNECE Regulation No. 107;
[27] UNECE Regulation No 66;
[28] https://en.wikipedia.org/wiki/Tesla_Model_S;
[29] http://www.cnet.com/news/tesla-model-s-the-battery-pack/;
[30] http://www.eberspaecher.com/produkte/air-conditioning/bus-
klimaloesungen/produkte/midibusse/ac-520.html;
[31] http://www.spheros.de/Produkte/Klimaanlagen/Midibus/Aerosphere-Midi.html;
[32] http://www.venturasystems.com/products/ventura-systems-plug-sliding-door-system;
[33] http://www.otsi.nsw.gov.au/bus/Investigation-Report-Wheel-Off-Westbus-Bossley-Park-Final.pdf;
[34] http://www.just-auto.com/analysis/automotive-glass-a-window-of-opportunity_id86825.aspx;
[35] www.assovetro.it;
[36] http://www.hidralgobel.com/;
[37] http://www.mcconnellseats.com.au/products/centra;
[38] L. Morello, L. Rosti Rossi, G. Pia, A. Tonoli: The Automotive Body, Volume II: System Design; Springer
Netherlands, 2011;
[39] J. Wiedemann, N. Widdecke: Vorlesungsskript KFZ II; Institut für Verbrennungsmotoren und
Kraftfahrwesen Universität Stuttgart, 2010;
[40] Automotive chassis-design; http://www.slideshare.net/aanonline/3-automotive-chassisdesignv2;
[41] https://en.wikipedia.org/wiki/Euro_NCAP;
[42] https://en.wikipedia.org/wiki/National_Highway_Traffic_Safety_Administration;
[43] https://www.acpsales.com/upload/Mechanical-Properties-of-Carbon-Fiber-Composite-Materials.pdf;
[44] P. Ermanni: Composites Technologien; Skript zur ETH-Vorlesung 151-0307-00L, Zürich, 2007;
[45] R. Diethelm: Bachelorarbeit Auslegung der Fahrzeugheckstruktur aus faserverstärkten Kunststoffe für
den SunCar; Fakultät Maschinenbau und Verfahrenstechnik ETH Zürich, 2011;
[46] http://www.swiss-composite.ch/;

64 Bibliography
[47] http://www.rohacell.com/product/rohacell/en/products-services/rohacell-wf/pages/default.aspx;
[48] Kostenabschätzung Composite-Monocoque, Dr. Markus Zogg, Zürich, 16-Juni-2014;
[49] http://www.tissa.ch/Landingpage.aspx;
[50] D. Kläusler, D. Wahlen: Auslegung eines Stossstangenträgers; Strukturlabor TECHi-2014-064, ETH
Zürich, 2014;

Appendix 65
12 Appendix
12.1 Mechanical Properties of Carbon Fibre Composite Material

66 Appendix

Appendix 67
12.2 Rohacell WF Datasheet

68 Appendix