rights / license: research collection in copyright - non ...29028/... · biomechanical assessment...
TRANSCRIPT

Research Collection
Doctoral Thesis
Biomechanical assessment of native and tissue engineeredarticular cartilage
Author(s): Knecht, Sven
Publication Date: 2006
Permanent Link: https://doi.org/10.3929/ethz-a-005271897
Rights / License: In Copyright - Non-Commercial Use Permitted
This page was generated automatically upon download from the ETH Zurich Research Collection. For moreinformation please consult the Terms of use.
ETH Library

Diss. ETH No. 16804
Biomechanical Assessment of Native and Tissue Engineered Articular Cartilage
A dissertation submitted to the
ETH ZURICH for the degree of
Doctor of Sciences
presented by
SVEN KNECHT Dipl. Ing., University Stuttgart
born 13.07.1975 Citizen of Germany
Accepted on the recommendation of
Accepted on the recommendation of
Prof. Dr. Edgar Stüssi, examiner Prof. Dr. Edoardo Mazza, co-examiner
Prof. Dr. Klaas Prüssmann, co-examiner
2006


Für meine Eltern

Table of Content Summary......................................................................................................................................vii Zusammenfassung........................................................................................................................ix Abbreviations and Notations.......................................................................................................xi Chapter 1 Introduction.................................................................................................................1 Chapter 2 Articular Cartilage......................................................................................................5
2.1 Composition and Structure of Articular Cartilage................................................................7 2.2 Plasticity of Articular Cartilage ............................................................................................9 2.3 Osteoarthritis ......................................................................................................................10 2.4 Tissue Engineering .............................................................................................................16 2.5 Assessment of Articular Cartilage ......................................................................................18 2.6 Mechanical Quality of Articular Cartilage .........................................................................21
2.6.1 Theoretical Models ......................................................................................................21 2.6.2 Mechanical Measurement Techniques ........................................................................23
2.7 Finite Element Modelling and Inverse Techniques ............................................................26 2.7.1 Finite Element Modelling in Biomechanics ................................................................26 2.7.2 Inverse Technique .......................................................................................................27
Chapter 3 Aims of the Present Study ........................................................................................29 Chapter 4 Assessment of Native Cartilage................................................................................33
4.1 Materials and Methods .......................................................................................................35 4.1.1 Patellofemoral in vitro Compression...........................................................................35 4.1.2 Biochemical Assessment .............................................................................................37 4.1.3 Conventional Mechanical Assessment ........................................................................38 4.1.4 Quantitative Magnetic Resonance Imaging.................................................................41 4.1.5 Inverse FE Approach ...................................................................................................45 4.1.6 Statistical Analysis ......................................................................................................51
4.2 Results ................................................................................................................................53 4.2.1 Biochemical Assessment .............................................................................................53 4.2.2 Conventional Mechanical Assessment ........................................................................53 4.2.3 Quantitative Magnetic Resonance Imaging.................................................................55 4.2.4 Inverse FE Approach ...................................................................................................58
4.3 Discussion...........................................................................................................................67 4.3.1 Patellofemoral in vitro Compression...........................................................................67 4.3.2 Biochemical and Conventional Mechanical Assessment ............................................68 4.3.3 Quantitative Magnetic Resonance Imaging.................................................................69 4.3.4 Inverse FE Approach ...................................................................................................71 4.3.5 Mechanical Assessment using the Inverse FE Approach ............................................72 4.3.6 Problems and Limitations............................................................................................74
Chapter 5 Assessment of Tissue Engineered Cartilage ...........................................................75 5.1 Mechanical Characterization of Tissue Engineered Articular Cartilage from Mesenchymal Stem Cells.................................................................................................................................77
5.1.1 Introduction .................................................................................................................77
v

5.1.2 Mechanical Testing and Analysis................................................................................ 78 5.1.3 Results ......................................................................................................................... 78 5.1.4 Discussion ................................................................................................................... 79
5.2 Mechanical Testing of Fixation Techniques for Scaffold-based Tissue Engineering Grafts.................................................................................................................................................. 79
5.2.1 Introduction ................................................................................................................. 79 5.2.2 Material and Methods.................................................................................................. 81 5.2.3 Results ......................................................................................................................... 83 5.2.4 Discussion ................................................................................................................... 86
Chapter 6 Conclusion and Outlook........................................................................................... 89 References.................................................................................................................................... 93 Acknowledgment....................................................................................................................... 103 Curriculum Vitae ...................................................................................................................... 107
vi
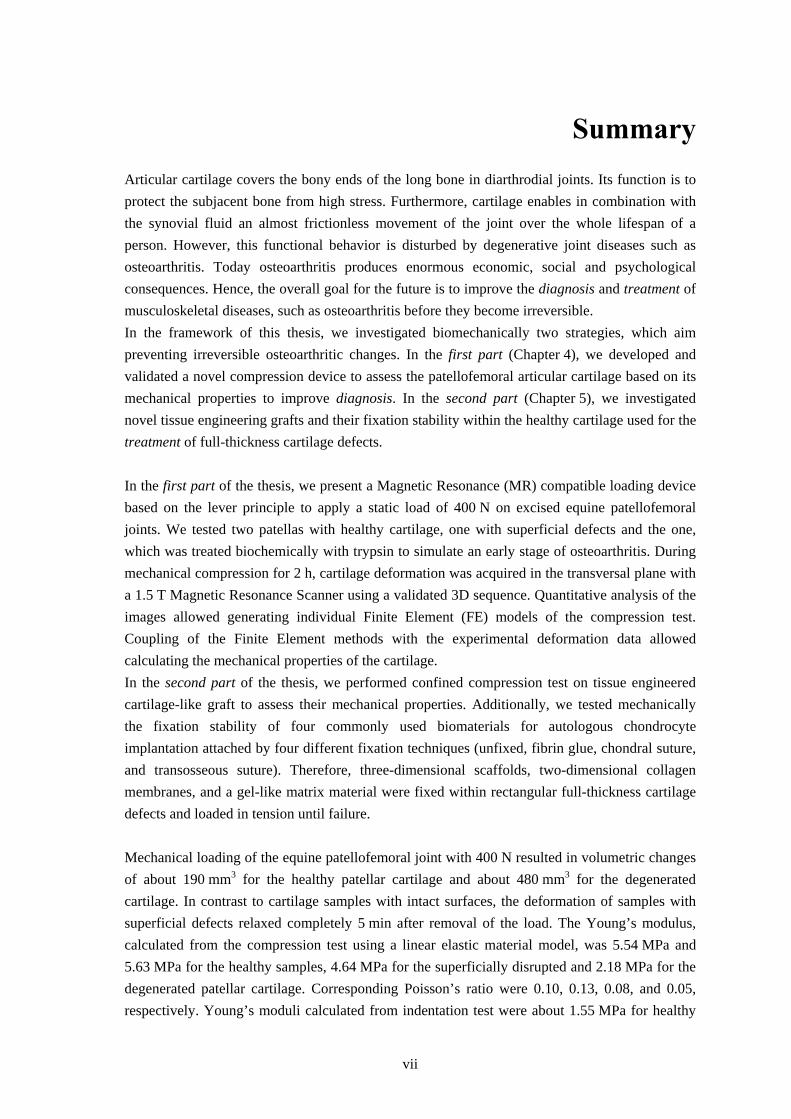
Summary Articular cartilage covers the bony ends of the long bone in diarthrodial joints. Its function is to protect the subjacent bone from high stress. Furthermore, cartilage enables in combination with the synovial fluid an almost frictionless movement of the joint over the whole lifespan of a person. However, this functional behavior is disturbed by degenerative joint diseases such as osteoarthritis. Today osteoarthritis produces enormous economic, social and psychological consequences. Hence, the overall goal for the future is to improve the diagnosis and treatment of musculoskeletal diseases, such as osteoarthritis before they become irreversible. In the framework of this thesis, we investigated biomechanically two strategies, which aim preventing irreversible osteoarthritic changes. In the first part (Chapter 4), we developed and validated a novel compression device to assess the patellofemoral articular cartilage based on its mechanical properties to improve diagnosis. In the second part (Chapter 5), we investigated novel tissue engineering grafts and their fixation stability within the healthy cartilage used for the treatment of full-thickness cartilage defects. In the first part of the thesis, we present a Magnetic Resonance (MR) compatible loading device based on the lever principle to apply a static load of 400 N on excised equine patellofemoral joints. We tested two patellas with healthy cartilage, one with superficial defects and the one, which was treated biochemically with trypsin to simulate an early stage of osteoarthritis. During mechanical compression for 2 h, cartilage deformation was acquired in the transversal plane with a 1.5 T Magnetic Resonance Scanner using a validated 3D sequence. Quantitative analysis of the images allowed generating individual Finite Element (FE) models of the compression test. Coupling of the Finite Element methods with the experimental deformation data allowed calculating the mechanical properties of the cartilage. In the second part of the thesis, we performed confined compression test on tissue engineered cartilage-like graft to assess their mechanical properties. Additionally, we tested mechanically the fixation stability of four commonly used biomaterials for autologous chondrocyte implantation attached by four different fixation techniques (unfixed, fibrin glue, chondral suture, and transosseous suture). Therefore, three-dimensional scaffolds, two-dimensional collagen membranes, and a gel-like matrix material were fixed within rectangular full-thickness cartilage defects and loaded in tension until failure. Mechanical loading of the equine patellofemoral joint with 400 N resulted in volumetric changes of about 190 mm3 for the healthy patellar cartilage and about 480 mm3 for the degenerated cartilage. In contrast to cartilage samples with intact surfaces, the deformation of samples with superficial defects relaxed completely 5 min after removal of the load. The Young’s modulus, calculated from the compression test using a linear elastic material model, was 5.54 MPa and 5.63 MPa for the healthy samples, 4.64 MPa for the superficially disrupted and 2.18 MPa for the degenerated patellar cartilage. Corresponding Poisson’s ratio were 0.10, 0.13, 0.08, and 0.05, respectively. Young’s moduli calculated from indentation test were about 1.55 MPa for healthy
vii
cartilage and 0.40 MPa for degenerated cartilage. By trypsin degeneration the Young’s modulus from indentation test decreased by 74% and from the inverse FE calculation by about 59%. The aggregate modulus of the tissue-engineered cartilage using silk scaffolds was 0.04 MPa after 21 days of culture. Analysis of the load-to-failure tension test of the fixed samples showed a maximal load of 2.18 ± 0.47 N for the fibrin glue fixation, 26.29 ± 1.55 N for the chondral sutured, and 38.18 ± 9.53 N for the transosseous fixed scaffolds. In this thesis, we have shown the applicability of the MR-controlled patellofemoral compression to detect minor mechanical changes in situ. Difference between the Young’s moduli calculated from indentation and inverse FE test arise from the tension-compression nonlinearity of the (collagen) fibril reinforced cartilage. The accuracy of this approach allows to distinguish between patellar cartilage with differences in the Young’s moduli between 20 and 30% and consequently to distinguish between healthy and moderately degenerated articular cartilage in the early stage of the osteoarthritis process. Furthermore, considering solely the morphological properties, statements about the intactness of the superficial zone and about a rough estimate of the modulus of the material might be possible. The adaptation of this method for the in vivo application will provide a novel approach to determine functional changes of articular cartilage for the first time non-invasively and quantitatively. The aggregate modulus of the tissue-engineered graft was approximately ten-fold lower than native cartilage. Nevertheless, these samples are suited for the application in vivo. The findings from fixation test serve as basis for selecting the most suitable fixation technique for scaffold-based tissue engineering grafts according to the expected in vivo loads.
viii

Zusammenfassung Der Gelenkknorpel bedeckt die artikulierenden Knochenflächen in den Gelenken. Seine Aufgabe ist es zum einen, den Knochens vor hohen Spannungen zu schützen und zum anderen, zusammen mit der Synovialflüssigkeit, eine annähernd reibungslose Bewegung des Gelenks während des gesamten Lebens einer Person zu ermöglichen. Diese Funktion wird jedoch durch degenerative Gelenkserkrankungen, wie der Arthrose, gestört. Heutzutage verursacht die Gelenksarthrose enorme wirtschaftliche, soziale und psychologische Belastungen. Deshalb ist ein wichtiges Ziel, die Diagnose und die Behandlungsformen von solchen muskuloskeletalen Erkrankungen zu verbessern, bevor es zu irreversibelen Veränderungen kommt. Im Rahmen dieser Arbeit wurden zwei Strategien zur Verhinderung irrversibeler arthrotischer Veränderungen im Gelenkksknorpel biomechanisch Untersucht. Zur Verbesserung der Diagnose entwickelten und validierten wir im ersten Teil (Kapitel 4) einen neuartigen Kompressionsapparat zur Beurteilung des patellofemoralen Gelenkknorpels anhand seiner mechanischen Eigenschaften. Im zweiten Teil (Kapitel 5) untersuchten wir neuartigen Implantate, die zur Behandlung von tiefen Knorpeldefekten beim „Tissue Engineering“ verwendet werden und deren Fixation in dem gesunden Knorpel. Im ersten Teil der Arbeit präsentieren wir ein Gerät, mit welchem im Magnetresonanztomographen (MRT) eine statische Last von 400 N nach dem Hebelprinzip auf frei präparierte patellofemorale Gelenke aufgebracht werden kann. Wir untersuchten zwei Kniescheiben mit gesundem Knorpel, eine mit oberflächigen Defekten und eine, die biochemisch mit Trypsin degeneriert wurde, um ein frühes Stadium der Arthrose zu simulieren. Während des zweistündigen mechanischen Tests wurde die Deformation des Knorpels in der transversalen Ebene mit einem 1.5 T Kernspinnresonanztomographen und einer validierten dreidimensionalen Sequenz aufgezeichnet. Die quantitative Auswertung der Bilder erlaubte es, individuelle Finit Element (FE) Modelle der Kompressionsversuche zu erstellen. Die Kopplung der Finit Element Methode mit den experimentellen Deformationsdaten ermöglichte die Berechnung der mechanischen Eigenschaften des Knorpels. Im zweiten Teil der Arbeit führten wir mechanische Tests an künstlich gezüchteten, knorpelähnlichen Implantaten durch, um deren mechanischen Eigenschaften zu bestimmen. Zusätzlich testeten wir mechanische Fixierung von vier, häufig bei der autologen Chondrozytenimplatation verwendeten Biomaterialien, die mit vier unterschiedlichen Fixationstechniken befestigt wurden (unfixiert, mit Fibrin-Kleber, mit Knorpelnaht und mit transossärer Naht). Hierbei wurden dreidimensionale Materialien, eine zweidimensionale Kollagen-Membran und ein gelartiges Matrixmaterial in rechteckigen Knorpledefekten fixiert und unter Zug belastet bis zum Versagen. Mechanische Belastungen des patellofemoralen Gelenks führten zu Volumenänderungen von rund 190 mm3 für gesunden Knorpel und von rund 480 mm3 für degenerierten Knorpel. Im Gegensatz zum Knorpel mit intakter Oberfläche relaxierte die Verformung der Probe mit den
ix
Oberflächendefekten vollständig schon 5 min nach Entlastung. Der aus den Kompressionstest berechnete E-Modul betrug 5.54 MPa und 5.63 MPa für die gesunden Proben, 4.64 MPa für den oberflächig zerstörten und 2.18 MPa für den degenerierten patellaren Knorpel. Die zugehörigen Poisson’s Zahlen waren 0.10, 0.13, 0.08, und 0.05. Die aus den Indentations-Versuchen berechneten E-Moduli betrugen rund 1.55 MPa für den gesunden und 0.40 MPa für den degenerierten Knorpel. Der Aggregat-Modul der künstlich gezüchteten Knorpelproben betrug 0.04 MPa. Die Auswertung der Zugversuche an den fixierten Proben ergaben eine maximal Zuglast von 2.18 ± 0.47 N für die mit Fibrin-Kleber fixierten Proben, 26.29 ± 1.55 N für die chondral fixierten und 38.18 ± 9.53 N für die transossär fixierten Implantate. In dieser Arbeit zeigten wir in situ die Anwendbarkeit des MRT-kontrollierten patellofemoralen Kompressionsversuches zur Detektierung von geringen mechanischen Veränderung des Knorpels. Unterschiede zwischen den E-Moduli aus den Indentationsversuche und dem inversen FE Ansatzes können auf die Zug-Druck Nichtlinearität des (Kollagen-) Faserverstärkten Knorpelmaterials zurückgeführt werden. Die Genauigkeit dieses Ansatzes ermöglicht es, zwischen Proben mit einem um 20 bis 30% unterschiedlichem E-Modul und folglich zwischen gesundem und mässig degeneriertem Knorpel im frühen Stadium der Arthrose zu unterscheiden. Durch die Betrachtung der morphologischen Eigenschaften können Aussagen über die Unversehrtheit der Knorpeloberfläche und eine grobe Abschätzung des E-Moduls gemacht werden. Die Anpassung dieser Methode für die Anwendung in vivo kann es erstmalig ermöglichen, die funktionellen Veränderungen des Gelenkknorpels nicht-invasiv und quantitativ zu erfassen. Der Aggregat-Modul der künstlichen Knorpelimplantate noch zehnmal kleiner als nativer Knorpel. Trotzdem sind diese Proben für die Anwendung in vivo geeignet. Die Resultate der Fixationsversuche dienen als Grundlage, um die geeignete Fixationstechnik für die auf Trägermaterialien basierende Knorpelproben entsprechend den zu erwartenden in vivo Belastungen auszuwählen.
x

Abbreviations and Notations AC articular cartilage ACI autologous chondrocyte implantation BCI bone-cartilage interface CT computertomograpy DMMB dimethyl-methylene-blue ECM extracellular matrix FCD fixed charge density FE Finite Element Gd-DTPA gadolinium-diethylene triamine pentaacetic acid GAG glycosaminoglycan ICP iterative closest point MACI matrix-assisted autologous chondrocyte implantation MRI magnetic resonance imaging NSA number of scans per acquisition OA osteoarthritis PBS phosphate buffered saline PG proteoglycan PGA polyglycolic acid PGLA co-polymer of polyglactin and polydioxanon SNR signal-to-noise ratio TE echo time TR repetition time TT translation matrix TR rotation matrix 3D three-dimensional B Finger tensor E Young’s modulus Edyn dynamic Young’s modulus E2s two-second creep modulus F deformation tensor G shear modulus |G*| complex shear modulus Geq equilibrium shear modulus Gu unrelaxed shear modulus GR relaxed shear modulus HA aggregate modulus ID instantaneous deformation J determinant of deformation tensor F J(t) shear compliance K bulk modulus k permeability L(τ) retardation-time spectrum P load ε strain
xi

φ objective function κ scaling factor λ, γ Lamé constant ν Poisson’s ratio σ stress Ψ strain energy function
xii

Chapter 1 Introduction


Articular cartilage (AC) is a complex tissue, which covers the ends of long bones in diarthrodial joints. It protects the subjacent bone from high stresses by deformation, which increases contact area and consequently improves the local joint congruence. In combination with the synovial fluid, articular cartilage enables furthermore a nearly frictionless movement of the joint over the whole lifespan of a person. A constant remodelling process of the cartilage extracellular matrix (ECM) maintains these functional features by stimulation and inhibition of the ECM synthesis and degradation. However, this delicate equilibrium can be disturbed by several factors such as age, occupational physical activities, malalignement of the joint, obesity, or previous damage or injury. The interference of the ECM equilibrium commonly results in the deterioration of the composition and structure and consequently of the mechanical properties. As AC has only a limited capacity for self-repair, this process, once started, can hardly be reversed. This fact keeps the medical and scientific community busy since several hundred years. In 1743, the surgeon and scientist Sir W. Hunter remarked: “If we consult the standard chirurgical writers from Hippocrates down to the present age, we shall find, that an ulcerated cartilage is universally allowed to be a very troublesome disease; that it admits of a cure with more difficulty than a carious bone; and that, when destroyed, it is never recovered” (Hunter, 1743). Nowadays, this statement is still valid and even more relevant than in former times since degenerative cartilage processes, initiated for example by obesity, sports-related injury, and aging are a widespread disease. Osteoarthritis (OA), one of the most common of these joint diseases, produces enormous economic, social and psychological consequences. These days, OA accounts for half of all chronic conditions in persons aged over 651. As the population for the future gets older and the number of elderly people increases due to demographic shift, the impacts of OA will even increase in the next decades. Consequently, the overall goal for the future must be to improve the diagnosis and treatment of musculoskeletal disorders, such as OA.
The early diagnosis of OA is one possibility to prevent or reduce long-term disability. The early detection of minor functional changes would allow an appropriate medical treatment to prevent irreversible cartilage degenerations, the consecutive loss of the functional behaviour and finally a joint replacement surgery. As the functional behavior of AC is determined by the cartilage morphology and the mechanical properties, both parameters are in principle appropriate to assess cartilage tissue. Magnetic Resonance Imaging (MRI) combined with state-of-the-art post-processing methods has shown its applicability to obtain accurate and highly reproducible quantitative data of the morphology in healthy (Eckstein et al., 1996) and progressed osteoarthritic cartilage (Burgkart et al., 2001) even from restricted areas of interest (Vanwanseele et al., 2003). However, neither OA in an early stage of its progression nor the adaptive process due to changed loading regimes (Eckstein et al., 2002) do result inevitably in detectable morphological changes. It is generally accepted that the biomechanical properties of articular cartilage depend on the biochemical composition, the ultrastructural organisation, and the interaction of the matrix molecules. Thus, biomechanical properties seem to be more sensitive to pathological changes of the tissue since alterations of the structural and biochemical properties are one of the first events in articular cartilage degeneration (Buckwalter et al., 1998) and
1 http://www.boneandjointdecade.org, accessed May 2006
3

adaptation (Brommer et al., 2005). Today however, the reliable in vivo assessment of early degenerative cartilage changes fails due to the lack of an appropriate measurement technique. The commonly used methods for the mechanical assessment of articular cartilage demand the excision of a well defined cartilage sample or at least the invasive testing in situ using an indenter. Only a few methods have been presented, which enable at least a clinical application due to their minimal invasive approach (Lyrra et al., 1995, Duda et al., 2004). However, they are still invasive and consequently demand a surgery with all its drawbacks. Treatment of cartilage lesions can decelerate or stop the already started degenerative process or prevent its initiation. Especially for young and active patients with sports related injuries of the articular cartilage, cartilage restorations based on tissue engineering has become a clinically successful method. Cartilage tissue engineering seeks to regenerate and restore the joint function by the implantation of autologous tissue graft grown outside the body. For this purpose, the graft must posses an adequate mechanical stability before a stable implantation can be performed. Whereas the mechanical property of the cartilage graft is often assessed, their fixation while surgery is still neglected in cartilage research. Thus, the aims of this work are a) to develop a mechanical testing method, which can be used in future to assess articular cartilage in vivo and non-invasively to detect changes in cartilage properties b) to examine tissue engineered grafts and the commonly used fixations techniques for scaffold-based tissue engineering grafts mechanically to improve the clinical outcome of this promising technique. After a short introduction into articular cartilage, we describe in Chapter 2 its variations with osteoarthritis, its plasticity, and present the state-of the art assessment methods as well as some basics of the novel approach. In Chapter 4, we present and discuss the results of the novel approach for the assessment of native patellofemoral. In Chapter 5, we present the mechanical assessment of a novel tissue engineered articular cartilage graft of the Drug Formulation & Delivery Group of the ETH Zurich. In the second part of this chapter, we present the results of the investigations of the various fixation technique of engineered cartilage, which has been performed in collaboration with the University of Freiburg and the Charité in Berlin. The thesis finishes with and overall conclusion of an outlook on the work which has to be done in future.
4

Chapter 2 Articular Cartilage
'The fabric of the joints in the human body is a subject so much more entertaining, as it must strike everyone that considers it attentively with an idea of fine mechanical composition.'

William Hunter, Of the Structure and Diseases of Articulating Cartilages, Philosophical Transactions, Vol 42 (1742-1743), 514-21.
2.1 Composition and Structure of Articular Cartilage
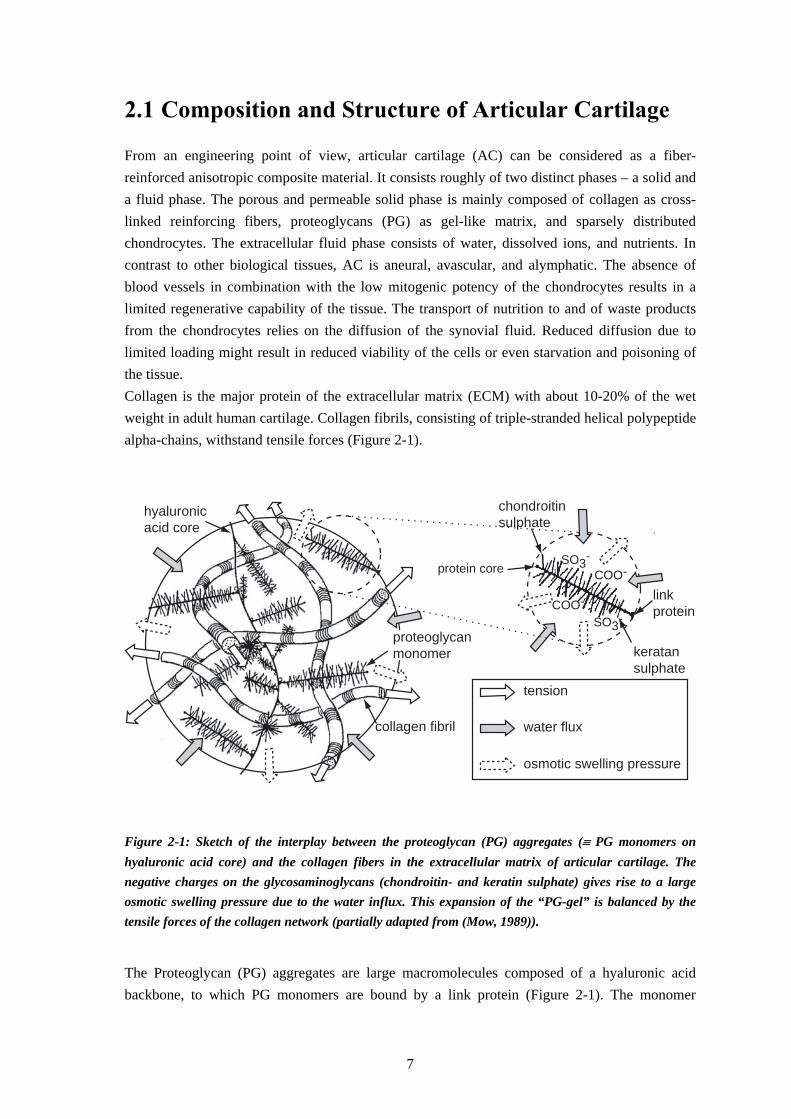
From an engineering point of view, articular cartilage (AC) can be considered as a fiber-reinforced anisotropic composite material. It consists roughly of two distinct phases – a solid and a fluid phase. The porous and permeable solid phase is mainly composed of collagen as cross-linked reinforcing fibers, proteoglycans (PG) as gel-like matrix, and sparsely distributed chondrocytes. The extracellular fluid phase consists of water, dissolved ions, and nutrients. In contrast to other biological tissues, AC is aneural, avascular, and alymphatic. The absence of blood vessels in combination with the low mitogenic potency of the chondrocytes results in a limited regenerative capability of the tissue. The transport of nutrition to and of waste products from the chondrocytes relies on the diffusion of the synovial fluid. Reduced diffusion due to limited loading might result in reduced viability of the cells or even starvation and poisoning of the tissue. Collagen is the major protein of the extracellular matrix (ECM) with about 10-20% of the wet weight in adult human cartilage. Collagen fibrils, consisting of triple-stranded helical polypeptide alpha-chains, withstand tensile forces (Figure 2-1).
chondroitinsulphate
keratansulphate
hyaluronicacid core
protein coreSO3-
COO-
tension
water flux
osmotic swelling pressure
linkprotein
proteoglycanmonomer
collagen fibril
SO3-COO-
Figure 2-1: Sketch of the interplay between the proteoglycan (PG) aggregates (≡ PG monomers on hyaluronic acid core) and the collagen fibers in the extracellular matrix of articular cartilage. The negative charges on the glycosaminoglycans (chondroitin- and keratin sulphate) gives rise to a large osmotic swelling pressure due to the water influx. This expansion of the “PG-gel” is balanced by the tensile forces of the collagen network (partially adapted from (Mow, 1989)). The Proteoglycan (PG) aggregates are large macromolecules composed of a hyaluronic acid backbone, to which PG monomers are bound by a link protein (Figure 2-1). The monomer
7
consists of numerous repeating units of glycosaminoglycans (GAG), mainly chondroitin sulphate and keratin sulphate, which are bond covalently to a protein core. Due to the sulphate (SO3
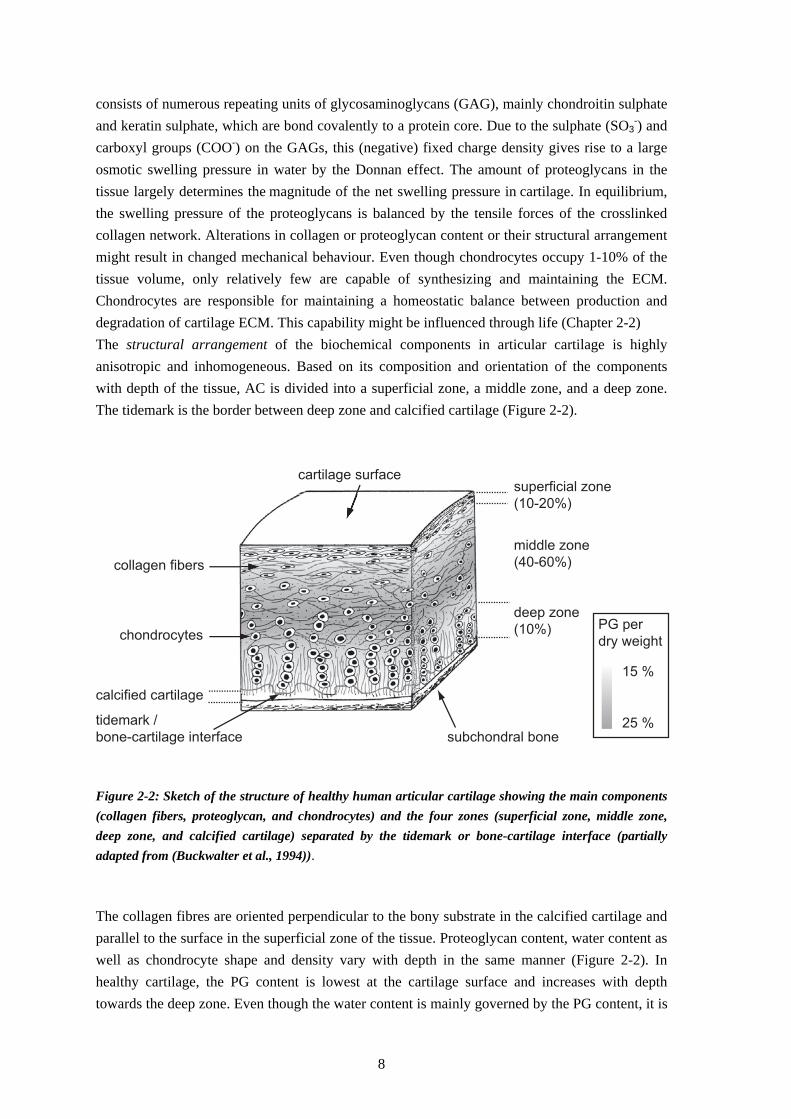
-) and carboxyl groups (COO-) on the GAGs, this (negative) fixed charge density gives rise to a large osmotic swelling pressure in water by the Donnan effect. The amount of proteoglycans in the tissue largely determines the magnitude of the net swelling pressure in cartilage. In equilibrium, the swelling pressure of the proteoglycans is balanced by the tensile forces of the crosslinked collagen network. Alterations in collagen or proteoglycan content or their structural arrangement might result in changed mechanical behaviour. Even though chondrocytes occupy 1-10% of the tissue volume, only relatively few are capable of synthesizing and maintaining the ECM. Chondrocytes are responsible for maintaining a homeostatic balance between production and degradation of cartilage ECM. This capability might be influenced through life (Chapter 2-2) The structural arrangement of the biochemical components in articular cartilage is highly anisotropic and inhomogeneous. Based on its composition and orientation of the components with depth of the tissue, AC is divided into a superficial zone, a middle zone, and a deep zone. The tidemark is the border between deep zone and calcified cartilage (Figure 2-2).
superficial zone
(10-20%)
middle zone
(40-60%)
deep zone
(10%)
calcified cartilage
tidemark /
bone-cartilage interface subchondral bone
cartilage surface
collagen fibers
chondrocytes
15 %
25 %
PG per
dry weight
Figure 2-2: Sketch of the structure of healthy human articular cartilage showing the main components (collagen fibers, proteoglycan, and chondrocytes) and the four zones (superficial zone, middle zone, deep zone, and calcified cartilage) separated by the tidemark or bone-cartilage interface (partially adapted from (Buckwalter et al., 1994)). The collagen fibres are oriented perpendicular to the bony substrate in the calcified cartilage and parallel to the surface in the superficial zone of the tissue. Proteoglycan content, water content as well as chondrocyte shape and density vary with depth in the same manner (Figure 2-2). In healthy cartilage, the PG content is lowest at the cartilage surface and increases with depth towards the deep zone. Even though the water content is mainly governed by the PG content, it is
8

highest in the superficial zone and decreases with depth due to the organization and the resulting forces of the collagen network.
2.2 Plasticity of Articular Cartilage
The maintenance of AC requires a balance between synthesis and degradation of the extracellular matrix. This balance can be disturbed by the inhibition and stimulation of the constructive anabolic and the destructive catabolic processes. It is well known that on one hand, a fixed genetic program regulates this instable equilibrium process. On the other hand, mechanical stimuli on the environment of the cartilage cells can influence this equilibrium independently of the genotype of the cell. Ultimately, the physical appearance and constitution (phenotype) of a tissue or an organ is determined by the combination of the genetic endowment and the environmental factors. However at present, it is still a challenging question to what extent the equilibrium stage and thus the tissue behaviour can be influenced postnatal by mechanical stimuli. Whereas the plasticity of bone has been thoroughly investigated in the past, e.g. (Pauwels, 1976), it is still an open question if and in which way the constant remodelling process of articular cartilage can be influenced in well-controllable manner. The adaptation of articular cartilage on changed mechanical loading is mainly investigated in animals, as they allow for quantitative assessment of the cartilage using invasive and destructive methods. The common methods to simulate non-physiological loading are meniscectomy (surgical removal of the knee meniscus) and transection of the anterior cruciate ligament (ACLT), which both result in a true instability of the joint and mimic traumatic injury (Roos et al., 1995). Alteration of the joint load by tibial osteotomy (Panula et al., 1997), by immobilisation (Leroux et al., 2001) or by replacement of the femoral trochlea with a hemiarthroplasty implant (LaBerge et al., 1993) have also been used as animal models. All these interventions consistently led to a pre-osteoarthritic stage resulting in mechanical cartilage degeneration (Knecht et al., 2006). However, studies on the effect of physiological loads showed inconsistent results. Stress due to moderate running exercise (4 km/day) in mature dogs resulted in an increased cartilage thickness and PG content, whereas collagen content remained unaltered (Kiviranta et al., 1985). Running dogs showed a significantly increased stiffness on the patellar surface of the femur and on the tibial cartilage (Kiviranta et al., 1985). However, strenuous running up to 40 km/day for 15 weeks resulted in disorganization and reorientation of the collagen network in the superficial zone in articular cartilage (Arokoski et al., 1996) and reduced stiffness (Arokoski et al., 1994). Brommer et al. (2005) observed articular cartilage of equine cartilage from birth to maturity. They concluded that physiological, moderate stress during maturation resulted in distinct heterogeneity in functional characteristics. Cartilage thickness decreased whereas Young’s modulus slightly increased with growth and aging. They concluded that, functional adaptation of biomechanical properties takes place in early life. Depending on the type of loading the site-independent homogeneous cartilage of foetuses adapts during development and maturity to a functionally heterogenic tissue. Furthermore, they assumed that joint loading at young age might be the best prevention for joint injury in later life. Otterness et al. even concluded from their study with hamsters that daily exercise prevents early cartilage
9
degeneration and maintains normal cartilage (Otterness et al., 1998). In another study with knockout mice, the lifelong physical training reduced the prevalence of OA (Lapvetelainen et al., 2001) whereas a more recent study showed an increase of osteoarthritis in transgenetic mice housing a deletion mutation in type II collagen gene (Lapvetelainen et al., 2002). In summary, the results suggest that loading-induced alterations in animals might depend on the predisposition of the tissue and particularly on the magnitude and duration of the load. Due to the lack of applicable, non-invasive measurement techniques, human studies on the functional adaptation of AC are rare. Considering only morphological cartilage parameters, Eckstein et al. (2002) could not observe significant differences between active triathletes and physically inactive volunteers. In contrast to animal studies, frequent, moderate, and dynamic impact loads result in only slightly increased joint surface area, but not in cartilage thickness or volume. They concluded that, in contrast to bone and muscle, articular cartilage thickness is not modulated postnatal by an increased mechanical stimulation. However, it is not known whether the loading regime on the cartilage in triathletes results in too high or too low stimuli on the cells, which would influence the adaptive process as reviewed above. Negative effects of variable loading conditions have also been reported. A reduced loading for 7 weeks after surgery resulted in significant decrease in the cartilage thickness in all compartments of the knee joint in human (Hinterwimmer et al., 2004). Cartilage of spinal cord injured patients showed decreased morphological parameters. Twelve months after injury the mean thickness of knee joint cartilage decreased significantly between 9% in the patella and 13% in the lateral tibial cartilage (Vanwanseele et al., 2003). This rate of morphological thickness change is higher than observed in OA. As the testing methods have so far been destructive and invasive, it could not be investigated whether the mechanical stimulation of AC in human caused by exercise results in structural, biochemical and thus biomechanical changes.
2.3 Osteoarthritis
Osteoarthritis (OA) is a disease with many complex etiologies, affecting all adjacent tissues in diarthrodial joints. It is defined clinically by joint pain, tenderness, limitation of movement, crepitus, occasional effusion, and variable degree of local inflammation, but without systemic effects (Keuttner, 1995). Osteoarthritis remains one of the most common forms of musculoskeletal diseases and is recognized as a major cause of pain and physical disability especially in elderly people (Felson, 2003). It was estimated that 9.6% of males and 18.0% of females aged 60 years and over have symptomatic OA, which results in enormous social impacts and economic costs. Rheumatic disease, such as osteoarthritis, back pain, osteoporosis and rheumatoid arthritis, cause up to now 10% of all costs for the healthcare in Switzerland (about 4 billion Swiss Francs by adding all direct and indirect costs)2. As the number of individuals over the age of 65 will double and reach a share of 25% of the population by 2010, OA will even become a heavier medical, social, and economical burden.
2 http://www.bag.admin.ch/forschung/konzepte/strategien/d/konzept_xufo-d.pdf. Accessed September 2002.
10

OA is a result of both mechanical and biological events that destabilize the ECM equilibrium. The ultimate morphological, biochemical, structural, and biomechanical changes of the extracellular matrix (ECM) and the cells lead to the irreversible degeneration of the articular cartilage (AC) with softening, fibrillation, ulceration, and finally to cartilage loss. OA can be separated according to its initiation into a primary (idiopathic) and secondary form with identifiable risk factors or causes. In general, secondary OA arises from abnormal stress on normal cartilage or from normal stress on abnormal cartilage. Systemic risk factors for abnormal cartilage are heredity, age, gender, and nutrition, whereas abnormal loads on the cartilage may result from previous injury, malalignement of the joint, muscle weakness, obesity or occupational physical activities. The progression of osteoarthritis can be divided into three broad stages: (i) the proteolytic breakdown of the cartilage matrix, (ii) the fibrillation and erosion of the cartilage surface, and (iii) the beginning of the synovial inflammation (Martel-Pelletier, 2004). The destruction of the ECM can be further divided. One of the first morphologically recognizable changes of articular cartilage is the edema of the ECM (Venn et al., 1977), which results in a stretching and thinning of the fibrous cartilage meshwork of the superficial zone (Hwang et al., 1992). This results in softened articular cartilage, which is more susceptible to mechanical overloading and thus to irreversible injury of the chondrocytes. Physical forces on the weakened cartilage surface can result in matrix fibrillation and delamination of matrix fragments and thus in loss of cartilage thickness. The influence on OA on the mechanical properties of AC is commonly investigated using in vitro OA models, in vivo animal models with synthetically induced OA changes, or samples of spontaneous occurring OA-like cartilage in vivo. The latter studies are summarized more in detail in the following part as an excerpt of a peer-reviewed paper, accepted for the publication in ‘Clinical Biomechanics’ 3. For spontaneously occurring OA-like cartilage it is common practice to examine the surface visually for classification of the sample as neither the stimulus nor the duration of degeneration, nor the degenerative environment are known. A few groups (Brocklehurst et al., 1984; van Valburg et al., 1997) found a good correlation between the findings from histology and visual appearance in autopsy specimens. However, several other authors showed that visual surface properties are not reliable to distinguish between healthy and degraded tissue (LaBerge et al., 1993; Orford et al., 1983; Panula et al., 1997; Stockwell et al., 1983; Vignon et al., 1981). India ink staining of the articular surface in vitro could indeed improve the expressiveness, since the ink particles are entrapped in surface irregularities and adhere to fibrillated cartilage (Collins et al., 1960). But an intact non-stained cartilage surface can cover heavily fissure lamellae, whereas the surface of structural healthy cartilage can show a slightly rough surface (Clark et al., 1997). Neither the absence of visual surface disruption nor the “on bone cartilage compliance” or thickness measurements necessarily constitute sensitive indicators of the biomechanical health of cartilage (Broom et al., 2003). However, due to the lack of more suitable and more reliable
3 Excerpt from: S. Knecht, B. Vanwanseele, E. Stussi. A review on the mechanical quality of articular cartilage - implications for the diagnosis of osteoarthritis. Clinical Biomechancis, in press.
11
methods the (arthroscopic) cartilage classification in vivo and the pre-classification in the following in vitro sections of OA-like cartilage are commonly performed visually. Armstrong et al. (1982) were the first ones who extensively investigated the spontaneous variations of the mechanical properties with age and OA of human autopsy patellae. Histological-histochemical grading according to Mankin et al. (1971) revealed a broad variance of this score between 1 and 12. The thickness of 103 samples in the age between 16 and 85 years was diversified between 1.69 and 5.17 mm, whereas water content varied from 72.8 to 88.4%. Biomechanical analysis displayed a mean aggregate modulus of 0.79 MPa and a mean permeability of 4.7*10-15 m4/(Ns). A linear relationship between the inverse of permeability, the so-called frictional drag, and the water content was shown (r = -0.50). The strongest correlation was the linear decrease of aggregate modulus with increasing water content (r = -0.73). Since no correlation between biomechanical parameters and the visual or any of the histological appearances could be detected, Mankin and co-workers (1971) concluded that these properties might be a poor indication for the functional characterisation of the material in the intact joint. Cartilage samples from osteoarthritic human thumb carpometacarpal joints revealed significant differences in water content, sGAG content, aggregate modulus, and permeability (Rivers et al., 2000) compared to healthy samples. Whereas collagen content stayed constant, the proteoglycan content decreased by 24%, and the water content increased by 2.3% in OA samples. Biomechanical analysis demonstrated reduction of the aggregate modulus in OA cartilage by 36%. In contrast to other studies, an increased permeability of 28% was observed. The competing effect of the increase of κ with extracellular matrix loss and the decrease of matrix compaction during indentation may explain these findings. Correlation between aggregate modulus HA and the biochemical parameters water, and sGAG content were observed for OA joints but not for non-OA joints (Table 2-1). All correlations between the biochemical composition and the biomechanical parameters were found to be stronger in OA than in healthy joints. Bae et al. (2003) measured the functional indentation stiffness on anterior regions of cadaveric human lateral and medial femoral condyles by means of a handheld indentation device. This stiffness parameter varied markedly between the normal group without OA-typical macroscopic surface appearance and the degenerated sample groups. India ink staining and histopathology scoring displayed identical results. Only little variations between the normal samples from different age groups were observed. Averaged cartilage thickness did reveal only negligible effects between normal aging and degeneration. Correlation between indentation stiffness and reflectance score from India ink stained surfaces (R2 = 0.35), histopathology overall score (ρ2 = -0.44), and histopathology surface irregularity score (ρ2 = -0.34) were observed. Human autopsy samples of OA femoral cartilage displayed a lower thickness compared to normal (Roberts et al., 1986). Furthermore, the PG content, the mechanical compressive and tensile properties were lower in the OA samples. However, no correlation between the mechanical property and the PG content was found.
12

Table 2-1: Properties of articular cartilage during spontaneous occurring osteoarthritis.
Author Sample Parameters Correlations
Armstrong et al. (1984)
Human autopsy Lateral facet of patella
HA
0.13 to 1.91
mean
0.79 (0.36)
k
0.5 to 19.5
mean 4.7 (3.6)
Water
72.8 to 88.4
mean 78.63 (3.86)
Mankin
1 to 12
mean 6.33 (2.58)
HA – Water r = - 0.73***
1/κ – Water
r = - 0.50***
HA* – Mankin r= -0.25*
Nieminen et al. (2004a)
Bovine patellar intact mod. adv.
Es
0.32 (0.15) 0.26 (0.13) 0.08 (0.08)
Edyn
7.06 (4.83) 2.12 (1.58) 0.54 (0.36)
Uronic
10.2 (3.5) 6.7 (1.5) 4.1 (1.2)
Water
79.9 (2.4) 81.6 (1.2) 84.1 (2.6)
Eeq – US speed rs
= 0.790**
Edyn– US speed rs
= - 0.898**
Nissi et al. (2004)
Bovine patellar intact mod. adv.
Es
0.40 (0.11) 0.24 (0.12) 0.06 (0.03)
Edyn
9.74 (2.83) 1.63 (0.48) 0.44 (0.20)
Uronic
12.17 (2.01) 6.24 (0.79) 3.95 (1.19)
T1,Gd
405 (47) 376 (25) 316 (64)
Eeq – T1,Gd
r = 0.625*
T1,Gd – Uronic r = 0.624*
Eeq – Bulk[Gd] r = - 0.609*
Rivers et al. (2000)
Human CMC non-OA (OA)
HA
0.82 (0.20) 0.52 (0.22)
k
4.04 (2.91) 2.92 (1.00)
sGAGwet
21.5 (4.4) 16.4 (6.5)
Water
72.5 (3.7) 74.8 (3.8)
OA: HA –sGAG r = 0.803*
HA – Water r = - 0.426*
Saarakkala et al. (2003)
Bovine patellar intact discol. superfic. deep defects
E
0.28 (0.12) 0.23 (0.11) 0.27 (0.12) 0.06 (0.04)
Edyn
7.5 (5.6) 1.5 (0.6) 1.2 (0.6) 0.5 (0.3)
Edyn_ultra
9.2 (5.8) 2.4 (0.3) 2.1 (1.0) 1.5 (0.3)
Water
80.3 (2.0) 82.0 (1.3) 83.6 (3.0) 83.5 (2.0)
Edyn – Mankin
r = - 0.777*
Edyn – Water
r = - 0.686*
Edyn – Uronic
r = 0.876*
E – Mankin
r = - 0.674*
E – Water
r = - 0.586*
E – Uronic
r = 0.717*
Mean (SD), * P < 0.05,** P < 0.01, *** P < 0.001
adv. = advanced, CMC = carpometacarpal, discol. = slightly discoloured surface, Mankin = Mankin score, mod. = moderate, superfic. = superficial defects
13

Bulk [Gd] = GD-DTPA content, Edyn = dynamic Young’s modulus [MPa], Edyn_ultra = equilibrium Young’s modulus form ultrasound indentation device [MPa], E = equilibrium Young’s modulus [MPa], HA = aggregate modulus [MPa], k = hydraulic permeability [*10-15m4/Ns], sGAG = sulphated glycosaminoglycan content [mg/g], T1,Gd = T1 relaxation in presence of Gd-DTPA, Uronic = uronic acid content [μg/ml]
Bank et al. performed instantaneous deformation (ID) tests on samples from femoral heads and condyles of OA patients of total joint replacement surgery and from normal cadaveric joints (Bank et al., 2000).. The percentage of instantaneous deformation (%ID), parallel and perpendicular, showed a linear positive correlation with the percentage of degraded collagen (r = 0.81 and r = 0.87, respectively) but not with fixed charge density. They confirmed that the decreased ID stiffness is strongly related to the amount of degraded collagen network. Ding et al. classified the early-stage OA samples as macroscopically degenerated and fibrillated cartilage and confirmed this histologically (Ding et al., 1998). Medial proximal tibial cartilage showed a mean Mankin score of 4.9 (3-7) and was denoted as osteoarthritic. They found a distinct difference in the stiffness of the cartilage and of the subchondral bone of OA compared to healthy samples. Cartilage with slight fissures on its superficial zone showed a reduced stiffness by 29% compared to age-matched samples. Mean thickness of OA cartilage was 2.3 mm, which was thinner than lateral comparison and age-matched samples. The stiffness of osteoarthritic cartilage did correlate neither with bone the stiffness or cartilage mean thickness. However, a correlation between cartilage and bone was shown in the normal age matched and lateral comparison groups. Apparently healthy tibial cartilage from patients with diagnosed unicompartimental OA and from cadavers was on average 22% thinner and 71% softer than control cartilage from normal knees (Obeid et al., 1994). In addition to the commonly used biochemical, biomechanical or histological methods, ultrasound and MR properties were investigated to assess articular cartilage (Nieminen et al., 2004a). They classified the cartilage samples with early OA changes according to Mankin score into 3 groups. Equilibrium Es and dynamic Young’s moduli Edyn was respectively 18 and 70% lower in moderate and 87.5 and 90%, respectively, in advanced degenerated cartilage compared to healthy samples. Cartilage thickness increased by approximately 20% with OA progression. A decrease of 60% in uronic acid content and of 40% in hydroxyproline content was shown, whereas the water content increased from 79.9 to 84.1% with OA progression. Linear correlation between Mankin score and ultrasound speed (rs= -0.755), ultrasound attenuation (rs= -0.567), uronic acid (rs= -0.817) and hydroxyproline content (rs= -0.644) was demonstrated (Table 2-1). Ultrasound speed, integrated- and amplitude attenuation was related to all biochemical and biomechanical parameters (Table 3). Saarakala et al. (2003) assessed the cartilage quality using an ultrasound indentation instrument and unconfined compression tests. Dynamic modulus Edyn of samples with superficial defects decreased by 85%, whereas static Young’s modulus remained unchanged. The mechanical properties were impaired by concurrent increase of tissue water content and decrease of uronic acid content (Table 3). Cartilage dynamic and equilibrium modulus were positively correlated with tissue uronic acid content (r = 0.876, r = 0.717) and
14

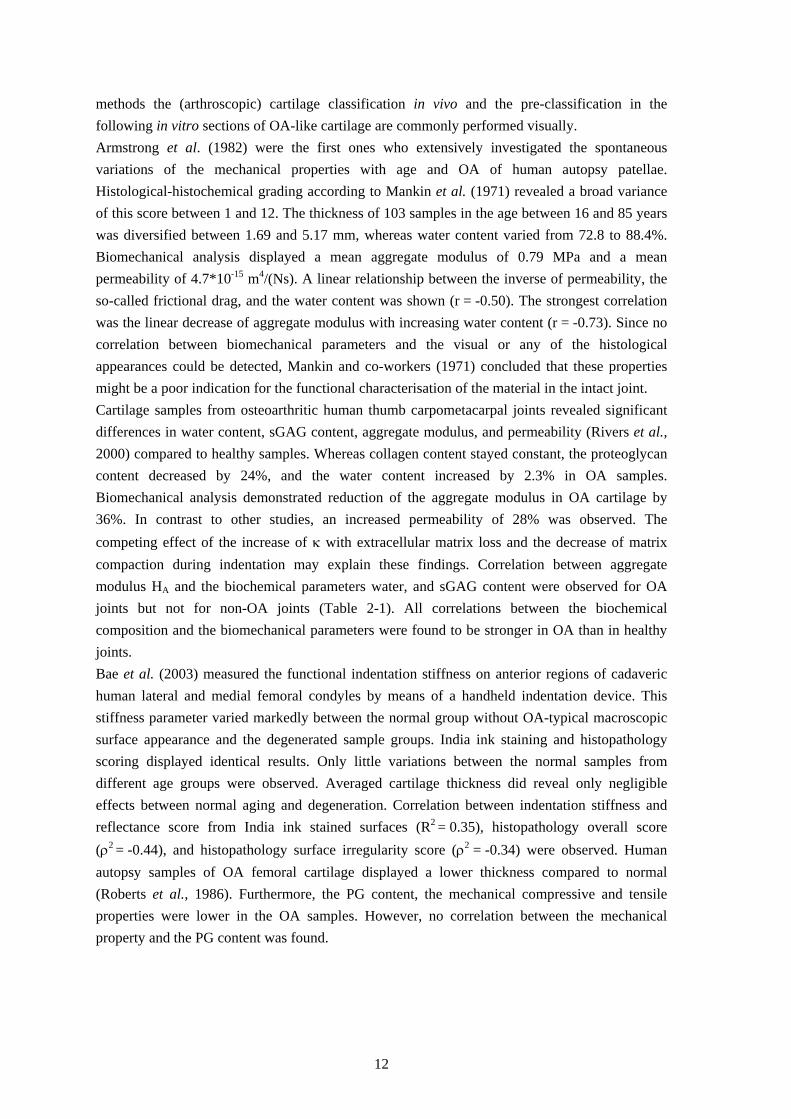
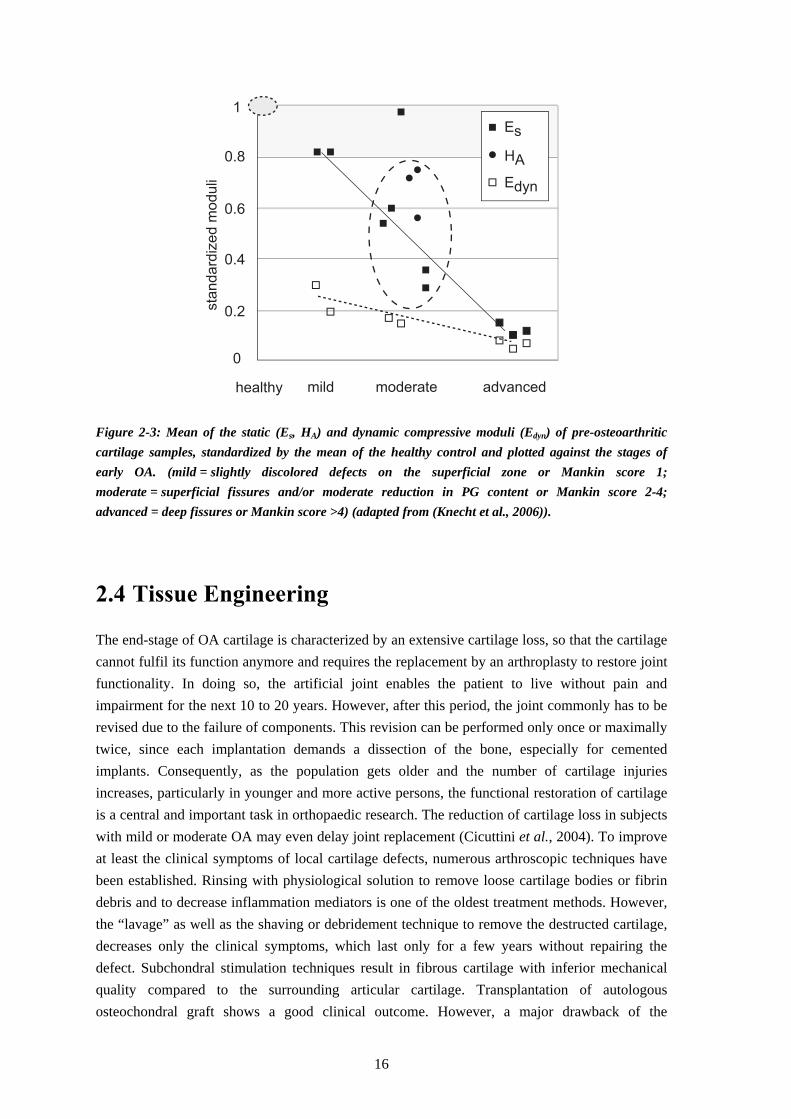
negatively with tissue water content (r = -0.686. r = -0.586) and Mankin score (r = -0.777, r = -0.674) (Table 3). Severeal studies demonstrated the potential of gadolinium-diethylene triamine pentaacetic acid (Gd-DTPA)–enhanced T1 and T2 imaging techniques for the assessment of biomechanical properties of healthy (Kurkijarvi et al., 2004; Nieminen et al., 2004b) and spontaneous degenerated bovine cartilage (Nissi et al., 2004). Bulk T1 relaxation time in the presence of Gd-DTPA as well as Gd-DTPA content showed a linear correlation with Young’s modulus (E) in a high magnetic field strength MRI machine in healthy samples (Nieminen et al., 2004b). As T2 relaxation time is highly related to the three-dimensional collagen architecture, the combination of these parameters can lead to useful information on mechanical, biochemical and structural parameters on healthy and spontaneously degenerated articular cartilage. Nissi et al. (2004) presented similar parameters on normal, early and advanced degenerated bovine patellar cartilage samples. It was assumed that the advanced degenerated group corresponded most probably to the initial stage of cartilage degeneration. Young’s modulus and dynamic modulus decreased by 85 and 95%, respectively, PG content lowered by 67% and collagen content per wet weight by 50% in advanced OA samples. This resulted in increased superficial T2 and in decreased superficial and bulk T1 parameters in the presence of Gd-DTPA with OA progression (Table 3). Samples were also slightly thicker than normal samples. The results from spontaneous osteoarthritic changes in vivo were comparable to animal models in terms of decrease in mechanical properties and GAG content, and increase in water content. However, structural and morphological differences were reported more frequently. Particularly human cadaveric samples displayed a reduction in cartilage thickness compared to the reported increased thickness of the bovine samples. This is probably due to the more advanced OA progression of the human cadaveric samples. Furthermore, a significant reduction in total collagen content of up to 50% (Nissi et al., 2004) and in the amount of degraded collagen was reported (Bank et al., 2000). Mechanical parameters were correlated with biochemical properties as well as with the Mankin score (Armstrong et al., 1982; Saarakkala et al., 2003), ultrasonic parameters (Nieminen et al., 2004a), and MR parameters (Nissi et al., 2004). In summary, the values of the mechanical compressive parameters (E, HA, Edyn) of articular cartilage in the early pre-osteoarthritic stage are reduced between 20 and 80% (Figure 2) compared to healthy tissue. These early changes (mild, moderate and advanced) might remain undetected using common clinical methods such as plain radiographs or arthroscopy due to the lack of cartilage loss and the marginal superficial changes (Nissi et al., 2004). Several studies showed that the Young’s modulus is already 20% lower in early OA samples compared to the healthy samples. The decrease of the dynamic Young’s modulus Edyn is even more pronounced in the early degenerative stage, which enables to detect mild pre-osteoarthritic cartilage changes. However, the little differences in the mechanical properties of mild, moderate, and advanced degenerated cartilage might not allow for discrimination between these early OA-like changes. Consequently, early pre-osteoarthritic changes might be detected and distinguished between the three stages using the cartilage static moduli (HA, Es).
15
healthy mild moderate advanced
Es
HA
Edyn
1
0.8
0.6
0.4
0.2
0
sta
nd
ard
ize
d m
od
uli
Figure 2-3: Mean of the static (Es, HA) and dynamic compressive moduli (Edyn) of pre-osteoarthritic cartilage samples, standardized by the mean of the healthy control and plotted against the stages of early OA. (mild = slightly discolored defects on the superficial zone or Mankin score 1; moderate = superficial fissures and/or moderate reduction in PG content or Mankin score 2-4; advanced = deep fissures or Mankin score >4) (adapted from (Knecht et al., 2006)).
2.4 Tissue Engineering
The end-stage of OA cartilage is characterized by an extensive cartilage loss, so that the cartilage cannot fulfil its function anymore and requires the replacement by an arthroplasty to restore joint functionality. In doing so, the artificial joint enables the patient to live without pain and impairment for the next 10 to 20 years. However, after this period, the joint commonly has to be revised due to the failure of components. This revision can be performed only once or maximally twice, since each implantation demands a dissection of the bone, especially for cemented implants. Consequently, as the population gets older and the number of cartilage injuries increases, particularly in younger and more active persons, the functional restoration of cartilage is a central and important task in orthopaedic research. The reduction of cartilage loss in subjects with mild or moderate OA may even delay joint replacement (Cicuttini et al., 2004). To improve at least the clinical symptoms of local cartilage defects, numerous arthroscopic techniques have been established. Rinsing with physiological solution to remove loose cartilage bodies or fibrin debris and to decrease inflammation mediators is one of the oldest treatment methods. However, the “lavage” as well as the shaving or debridement technique to remove the destructed cartilage, decreases only the clinical symptoms, which last only for a few years without repairing the defect. Subchondral stimulation techniques result in fibrous cartilage with inferior mechanical quality compared to the surrounding articular cartilage. Transplantation of autologous osteochondral graft shows a good clinical outcome. However, a major drawback of the
16

transplantation techniques is the created defect in the healthy cartilage at the “non-load bearing” donor side. As cartilage is only prevalent in weight-bearing regions within the joint, the harvesting of the osteochondral plugs results in a disturbed functionality. The more tissue is harvested from the “relatively non-weight bearing regions” the more increases the risk of donor site morbidity (Alford et al., 2005). For a comprehensive review on the cartilage repair methods, the reader is referred to Redman et al. (Redman et al., 2005). A trend-setting and fast growing alternative to the above-mentioned methods is the engineering of tissue from few isolated cells from biopsy. The aim of tissue engineering “is the regeneration of biological tissue through the use of cells, with aid of supporting structures and/or biomolecules”4. Autologous chondrocyte implantation (ACI) is the common method to generate tissue engineered constructs for full-thickness cartilage defects down to the subchondral bone (Figure 2-4). In contrast to the mosaic-like osteochondral grafting technique, this method requires only a very small cartilage sample (200-300 mg) from non weight-bearing regions of the joint. From this samples, the chondrocytes are isolated and proliferated in vitro within 3-6 weeks. This cell suspension can be transplanted into the cartilage defect using three approaches. For ACI of the first generation, the surgeon injects the chondrocyte suspension beneath a periosteal flap which was sutured onto the defect and sealed with fibrin-glued (Brittberg et al., 1994). Since the first application in 1994, thousand of ACIs have been performed with good-to-excellent results from clinical studies. For the so-called second generation of ACI the periost flap was replaced by absorbable biomaterials, such as collagen sheets. A more advanced TE approach is the matrix-assisted autologous chondrocyte implantation (MACI). Herein, 3D cell carrier were applied, to provide a adhesive cell substrate, which distributes and guides the cells spatially, stimulates the tissue maturation, protects the cells and the shape of the tissue and enables the easy handling of the cells and the implantation into the defect (Sittinger et al., 2004).
tissue
extraction
cell isolation &
culture
3 to 6 weeks
injection of
autologous cell
suspension
Figure 2-4: Diagram of in vitro cartilage tissue engineering for autologous chondrocyte implantation.
4 Definition by the “Scientific Committee on Medicinal Products and Medical Devices” of the European Commission. http://ec.europa.eu/health/ph_risk/committees/scmp/documents/out37_en.pdf, Accessed Juli 2006
17
For a successful restoration of the defect, the cell population has to meet the metabolic demands for restoring functional extracellular matrix. This can be done by using fully differentiated chondrocytes, mesenchymal stem cells, or gene transduced cells. Furthermore, the scaffold biomaterial has to act as adhesive substrate, to guide and distribute the cells, to stimulate the tissue maturation, to protect the cells, and to enable the handling and delivery of the cells into the patient. A further crucial step for successful cell-based therapy is the surgical fixation of the implants in vivo. However, the fixation stability of the implants has been rarely investigated and discussed in literature so far.
2.5 Assessment of Articular Cartilage
The objective of all methods to assess articular cartilage is to detect changes in the functional behaviour of the tissue. This behaviour is determined by the functional stiffness of a material, which in turn is determined by the intrinsic material properties and morphological parameters. It is generally accepted that the biomechanical properties depend on the biochemical composition, the ultrastructural organisation, and the interaction of the ECM molecules. Thus, suitable parameters for the assessment of AC are gained either by means of non-destructive clinical methods or by biochemical, structural, and biomechanical analysis. In clinical practice, the assessment of articular cartilage focuses largely on pain, limited functional performance and stiffness, which are mainly caused by a chronic degeneration of cartilage and alterations in joint shape and deformities. Functional impairment includes loss of mobility, difficulties in activities of daily living, social isolation, and loss of work opportunities (O'Reilly et al., 2003). Since pain is a very individual sensation, it can only be assessed by subjective methods, mainly by self-evaluation via various types of scoring techniques or questionnaires (Theiler et al., 1994). However, qualitative and objective methods are preferred for reproducible and comparable assessment as subjective symptoms may vary between persons or even over time. Additionally, subjective symptoms correlate only little with the extent of detectable changes of cartilage structure (Felson, 2003). Established semi-objective assessment methods are the WOMAC osteoarthritis index (Bellamy et al., 1986) assessing the severity of OA, or the “Health Assessment Questionnaire” and the “Arthritis Impact Measurement Scale”. For a comprehensive summary the reader is referred to Theiler et al. (1994). Radiography, arthroscopy, Magnetic Resonance Imaging (MRI) and sonography are used to measure macroscopical changes of the joint. Plain radiographs, or colloquial “x-ray images”, are commonly used as diagnostic tools for the assessment of the severity of morphological changes in all structures of the joint because it is a readily available and cost effective method. Joint radiography, together with arthroscopy, is the conventional method and still often denoted as “gold standard”, despite numerous drawbacks. Morphological cartilage loss can only be detected indirectly by “joint space narrowing” and consequently can be attributed neither to a specific tissue nor to specific locations in the joint. The 2D-images are commonly analyzed using scoring technique to quantify tissue changes. A review of these methods can be found in van der Heijde
18

(van der Heijde, 2000). Since experienced observers are needed, some of these scoring techniques are relatively difficult to use. The radiation exposure of the patients is a further drawback of this method. Moreover, a low reproducibility in patient positioning for the image acquisition (Mazzuca et al., 2003) and the susceptibility of the detected “joint space narrowing” to knee pain (Mazzuca et al., 2002) reduces sensitivity to detect cartilage changes over time. Using arthroscopy, cartilage and some of the soft-tissue structures of the knee joint can be directly visualized and magnified. It allows the surgeon to treat the tissue in the same step, for instance by removing the degenerated or worn fragments of articular cartilage or by flushing the joint free from particulate debris and inflammatory enzymes. Both mild cartilage lesions and deep and severe cartilage erosions can be detected, which would probably remain undetected on radiographs (Fife et al., 1991; Ayral et al., 1996). Limitations are the required specialized skills and facilities. Furthermore, this invasive method is limited to the superficial cartilage and no information of the bulk tissue can be gained. External diagnostic ultrasound provides only limited information about articular cartilage due to anatomical limitations (Myers, 2003). However, latest work suggests that in the future high-frequency ultrasound (Spriet et al., 2005) or coupling of arthroscopy and ultrasonic imaging (Saarakkala et al., 2003) can serve as useful means for the investigation of cartilage changes. Biochemical markers are constituents of the tissue or catabolic or anabolic messengers that are released into synovial fluids, blood and urine, generated by the alteration and destruction of cartilage, synovial tissue and bone. Some of these degradation products vary in concentration with OA progression and can therefore be used to distinguish different phases of joint disease. Synovial fluid shows increased concentrations in keratan-sulphate, chondroitin-sulfate epitopes, cartilage matrix proteins or type II collagen peptide which might be used as specific markers for alteration processes of human articular cartilage (Ettrich et al., 1998). Despite their potential, a lot of work still has to be done on the relationship of the marker concentration with progression of the disease or the assessment of the functional behavior. Magnetic resonance imaging is often denoted as one of the most promising techniques for the in vivo assessment of AC. This non-invasive method uses a strong electromagnetic field rather than ionizing radiation. Thereby, no negative effects on health could be shown so far. Pathological variations in cartilage, synovial tissue, subchondral bone, ligaments and menisci can be selectively and directly highlighted. By choosing different types of pulse sequences or by changing specific parameters (Gold et al., 2001; Waldschmidt et al., 1999) alterations can be displayed with a higher sensitivity than in radiography and Computer Tomography (CT) (Chan et al., 1991). In combination with state-of-the-art post-processing methods, accurate and highly reproducible quantitative data of the morphology in healthy (Eckstein et al., 1996) and osteoarthritic cartilage (Burgkart et al., 2001) are accessible. Not only averaged morphological parameters over the complete tissue, but also systematic parameters from restricted areas of interest can be obtained (Vanwanseele et al., 2002). In cartilage research, biochemical, structural, and biomechanical analyses are commonly used. They are very sensitive and meaningful for the assessment of AC, since remodelling of the ECM due to any changes of environmental conditions (loading, biochemistry,..) is manifested in the
19

biochemistry and structure and consequently in the mechanical properties. However, up to now these methods have been destructive and thus cannot be applied for in vivo tests. For biochemical analysis, the water content of excised samples can easily be calculated by dividing the weight difference between freeze-dried and equilibrated samples with the equilibrated wet weight of the sample. For biochemical quantification of the solid matrix components, the sample is dissolved by exhaustive proteolytic digestion, and the solution is quantitatively analyzed by colorimetric or fluorometric assays. The proteoglycan content can be determined by measuring either the hexosamine content (Gatt et al., 1966) or the amount of sulphated GAG (sGAG) by a dimethyl-methylene-blue assay (Farndale et al., 1986). The collagen content can be determined by a hydroxyproline assay (Woessner, 1961). Proteoglycan content can be assessed additionally by means of the fixed charge density (FCD) using the semi-quantitative tracer cation method by Maroudas and Thomas (1970) or by the selective safranin-O staining method (Kiraly et al., 1996). Spatial information on PG concentration can be obtained by digital densitometry of sliced samples. By means of a cationic dye such as safranin-O, which binds stoichiometrically to negatively charged groups of proteoglycans, their relative distribution in the sample can be visualised and quantified as area integrated optical density (Panula et al., 1998). Since cartilage is an inhomogeneous material, differences in the results may arise from the collected sample (full-thickness vs. surface biopsy sample). Furthermore, the precision of the analytical method can comprise differences in the analytical method and the variable conversion factors to calculate the cartilage component from the measured sub-unit (e.g. the factor to convert the detected hydroxyproline content to collagen content) (Hoemann, 2004). These limitations explain the large variations in the biochemical results in literature. To date, the sole non-invasive methods for the biochemical assessment of AC are the ultrastructural Magnetic Resonance imaging techniques, which allow for specific measurement of the cartilage biochemical state (Van Breuseghem, 2004). With proton-density mapping the water content can be measured directly whereas charge-based methods, either delayed gadolinium enhanced MRI of cartilage or sodium MRI, or T1q-weighted MR imaging (Wheaton et al., 2005) provide measures for the GAG distribution. Structural analysis is mainly performed by means of light microscopic methods such as the differential interference contrast technique. Using this technique, the aggregated fibrillar organisation of collageneous components in the matrix of resected samples can be selectively visualised (Broom, 1984; Broom et al., 2003). High-resolving transmission electron microscopy (Broom et al., 1983; Montella et al., 1992) or scanning electron microscopy (Kaab et al., 2000; Maniwa et al., 2001) enable ultra-structural observation of osteoarthritic cartilage. Polarized light microscopy (PLM) is used as a quantitative technique to analyse the structural organisation and the amount of collagen fibrils in AC (Arokoski et al., 1996). In PLM, the birefringence effect of polarized light of the anisotropic collagen fibrils in articular cartilage is utilised. A mean “area-adjusted integrated retardation” value of the birefringent structures is calculated, which quantitatively reflects the collagen fibrillar organisation and density. Since collagen fibre orientation varies between the superficial, intermediate, and deep zone, this technique is also used to divide articular cartilage into three characteristic zones. For a more comprehensive review, the author refers to Gardener et al. (1997). Diffusion-weighted MR imaging is a further
20

promising technique to assess the AC matrix by the variations of water self-diffusion due to its steric hindrance (Miller et al., 2004). Histopathathological scoring techniques combine (qualitatively) assessed observations of cartilage structure and composition on histological slices to grade the severity of OA. The most commonly used histological / histochemical grading system (HHGS) for osteoarthritic cartilage was proposed by Mankin et al. (Mankin et al., 1971). The system uses a 14 point score by combining the grades of structure (0-6 points), of cellular abnormalities (0-3 points), of matrix staining (0-4 points), and of tidemark integrity (0 or 1 point). This so-called Mankin (or HHGS)-score grades normal cartilage with 0 and severely degenerated with 14. Cartilage with a Mankin score from 1 to 5 is commonly assumed to represent a mild or moderate stage of OA. Recently, an improved grading system for early disease evaluation was published (Pritzker et al., 2006). However, it is still restricted to cadaveric studies.
2.6 Mechanical Quality of Articular Cartilage
Mechanical properties of AC can be measured over a variety of length scales. These range from bulk properties of intact joints by indentation test (Rieppo et al., 2003), over excised full-thickness samples and zones from varying depths (Li et al., 2002) down to cellular (Alexopoulos et al., 2005) and molecular levels (Stolz et al., 2004). The mainly determined bulk properties of AC vary between species and anatomical locations (Athanasiou et al., 1991; Jurvelin et al., 2000). Due to the anisotropic and inhomogeneous arrangement of the constituents, the mechanical parameters may also depend on the measurement direction and vary between the cartilage zones. Furthermore, the tissue shows a time dependent deformation to an applied step load. Such a creep and stress relaxation behavior and the hysteresis during cyclic loading are typical phenomena of viscoelastic materials. Additionally, the effective stiffness of the material is dependent on the rate of load application and on the overall strain.
2.6.1 Theoretical Models
The constitutive laws to analyze the experimental data of articular cartilage range from single-phasic to bi- and multiphasic models. Despite their viscous, time-dependent behaviour, single-phasic elastic models are valid if the fluid flow can be neglected. This assumption is acceptable when analyzing the instantaneous response on an applied load or deformation and the equilibrium response with ceased fluid flow. For single-phasic elastic isotropic models the shear modulus G, also called the first Lamé constant μ, can be derived from elasticity theory and is given in terms of the Poisson’s ratio ν and the Young’s modulus E as
)1(2 ν+=
EG equation 2-1
21

It is a measure of resistance to distortion. The bulk modulus K, a measure of the change in volume of a solid substance with changed pressure, is given under isotropic stress by
)21(3 ν−=
EK equation 2-2
and with equation 2-1 by
)21(3)1(2
νν
−+
= GK equation 2-3
For small displacements of the cartilage and other soft tissue, a linear stress-strain relationship can be observed. Herein, the Young’s modulus E can be determined by the slope of the axial stress-strain curve according to the Hooke’s law by:
εσ
=E equation 2-4
However, articular cartilage shows a non-linear stress-strain relationship for finite deformations. Experiments on biological materials have shown that the stress increases much faster than the strain for “large” deformations. This stiffening of the material becomes apparent for the articular cartilage in the talocrural joint. The body weight of 700 N of an upright standing person results in local stresses of about 1 to 2 MPa in each joint. With a Young’s modulus obtained from the linear elastic theory of 1 MPa, this load would result in deformations of about 100%. To account for this non-linear behavior, Fung (1979) proposed an exponential function for the elasticity property. Hyperelastic constitutive laws allow to account for mechanical as well as for geometrical non-linearities. This is valid for materials that exhibit instantaneous elastic response up to large strains and is often used in biomechanics for brain (Meaney, 2003), breast tissue (Samani et al., 2004), and articular cartilage (Wilson et al., 2006). The stress-strain relation is expressed by a strain-energy function Ψ by which the stress can be derived from each point in the material. The reader is referred to Holzapfel (2000) for more detailed information on hyperelastic materials and the stress-strain relationship. For isotropic, homogeneous and compressible hyperelastic material, the stress response can be derived from numerous specific forms of the strain energy function. The Neo-Hookean model is used to describe the solid phase of biphasic visco-hyperelastic models (Wilson et al., 2006) and the Mooney-Rivlin model for articular cartilage in Finite Element joint models (Anderson et al., 2005). For the Neo-Hookean material the relation between Cauchy stress σ and the deformation tensor F is
)()1( 3/2 IBΙ JJGJK −−=σ equation 2-5
22

with the bulk modulus K, the determinant J of the deformation tensor F, the initial shear modulus G, and the Finger tensor B, which is defined as F*FT. To include the time-dependent material behaviour into the single phasic material law viscoelastic single-phase models based on springs and dashpots such as the well-known generalized Kelvin model are used. Another possibility to incorporate the time-dependent behavior is realized by modelling the interaction between the solid and the fluid components in the bi- and multiphasic models. Since cartilage tissue consists of a porous extracellular matrix filled with a fluid, two continuum models based on a poroelastic and the (biphasic) mixture formulation to describe the mechanics of soft tissues exist. The poroelastic theory is based on the theory of porous media for the analysis of wet soils first introduced by Biot (1941) and later applied to model soft tissue behavior (Simon et al., 1996). In the poroelastic model the material is considered as being a porous elastic solid that is saturated by a pore fluid that flows relative to the deforming solid. Based on the mixture formulation by Bowen (1976), two other theories were independently developed to model soft tissue behavior: the theory of porous media (Ehlers et al., 2001) and the linear biphasic model of Mow et al. (1980). Both continuum approximations are equivalent and have equivalent basic equations and incorporate the same material properties, namely the lame constants λ and γ, and the hydraulic permeability k. Herein, material is considered to be an immiscible mixture of a deformable solid phase and a fluid phase. It is assumed for the poroelastic and both models based on the mixture formulation, that the solid and fluid phase are incompressible. Both approaches are equivalent when applied to biomechanical studies (Simon, 1992). Over the years, the linear biphasic model was expanded to include the strain-dependent permeability (Lai et al., 1981), the intrinsic viscoelasticity of the solid matrix in the biphasic poroviscoelastic theory (Mak, 1986) or to account for large strains (Kwan et al., 1990). Additionally, multiphasic models consider the charged nature of the tissue to describe the physiochemical and/or electrochemical behavior. The electromechancial theory combines the laws for linear electrokinetic transduction in ionized media with the biphasic theory (Frank et al., 1987). It accounts for electrophoretic and electroosmotic effects and yields additionally the electrokinetic (coupling) coefficient and the streaming potential as mechanical parameters. The triphasic theory incorporates the ion phase in addition to the solid and fluid phase of the biphasic theory (Lai et al., 1991). However, because of their complexity, the multiphasic models are rarely used to analyse experimental data.
2.6.2 Mechanical Measurement Techniques
Dependent on the problem being addressed, either well-established mechanical testing methods such as shear, tension and compression tests or the cartilage specific osmotic loading method can be performed to characterise AC biomechanically. Whereas tension and compression tests only allow investigating the equilibrium properties of the solid matrix, shear tests under infinitesimal strain enable to acquire the intrinsic viscoelastic, flow-independent properties of the collagen-PG solid matrix. Therewith, the magnitude of the complex shear modulus G* as intrinsic stiffness at a specific frequency and the phase angle δ as ratio of viscous to elastic effects can be determined
23

from dynamic shear experiments (Setton et al., 1995), whereas an equilibrium shear modulus Geq can be calculated from stress-relaxation experiments. However, the most frequently used methods for mechanical characterisation of articular cartilage are unconfined compression, confined compression and indentation tests. Indentation measurements (Figure 2-5 C), in combination with single-phase linear elastic models, yield (Hayes et al., 1972)
),/(4)1(
νκϖν
haaPG −
= equation 2-6
where G is the initial shear modulus, P the indenter load, a is the indenter radius, ω is the deformation, h is the initial thickness of the cartilage layer, ν is the Poisson’s ratio and κ is a scale factor which depends on both the aspect ratio a/h and ν. Young’s modulus E can be calculated from the initial shear modulus from (equation 2-6) as
)1(2 ν+= GE equation 2-7 Based on the theory of Hayes, the dynamic modulus Edyn from measurements with an ultrasound indentation instrument (Laasanen et al., 2002; Saarakkala et al., 2003) can be calculated from
κϖν
aPE2
)1( 2−= equation 2-8
However, the assumptions of a frictionless indenter as well as an incorrect determination or assumption of the Poisson’s ratio in equilibrium might result in relatively large errors in the calculated modulus. Furthermore, a transversely isotropic material model should be used instead of the purely isotropic model since the superficial collagen fibrils are exposed to tension more effectively in indentation tests than in the other test methods (Korhonen et al., 2002). Kempson et al. (1971) and Roberts et al. (1986) calculated an instantaneous “two-second creep modulus” E2s from indentation tests at 2 s after load application. To account for the time-dependent viscous behaviour of AC, the viscoelastic spring-dashpot model was used (Parsons et al., 1977). The creep response was analysed to yield the shear compliance J(t), which is the inverse of the apparent modulus. Thus, the unrelaxed shear modulus Gu, the relaxed shear modulus GR, and the retardation-time spectrum L(τ) can be calculated. Basically, L(τ) is a measure of the rate and duration of the creep process, Gu the apparent modulus of the sample in response to rapid loading and GR reflects the extent of the creep process. Using the biphasic theory of Mow et al. (1980), the compressive modulus E, the hydraulic permeability k, and the Poisson’s ratio ν can be calculated. In unconfined compression (Figure 2-5 A), static Young’s modulus Es and Poisson’s ratio ν are calculated directly from the stress-strain ratio at equilibrium if the lateral displacement is measured. A dynamic modulus Edyn is calculated as the ratio of stress and strain amplitudes from
24

the last cycle of a sinusoidal loading (Toyras et al., 2003) or from stress-strain data obtained instantaneously after the application of a strain step (Saarakkala et al., 2003). From confined compression tests (Figure 2-5 B), the aggregate modulus HA is calculated from the slope of the best linear fit of the equilibrium stress plotted against the applied strain. The permeability k can be estimated afterwards by means of a best-fit regression of the theoretical surface displacement and the experimental data.
ALoad
Impermeable
plate
B
Cartilage
sample
Permeable
piston
Load
Confining
chamber
C
Indenter
Load
Subchondral
bone
Cartilage
Figure 2-5: Commonly used mechanical testing configurations: unconfined compression (A), confined compression (B), and indentation (C). An alternative to compressive and tensile mechanical testing is the osmotic loading method, especially in small animals where the preparation of the sample is more demanding (Flahiff et al., 2004). The calculated uniaxial modulus reflects the balance between interstitial swelling pressure and mechanical stiffness of the cartilage matrix and compares well to the moduli obtained from uniaxial tensile tests (Narmoneva et al., 2001). Collagen network stiffness can also be determined by instantaneous deformation (ID) measurements (Bank et al., 2000). ID is expressed as percentage of superficial diameter change of the sample in unconfined compression tests parallel and perpendicular to the collagen fibre orientation. As the percentage of instantaneous deformation (%ID) is mainly determined by the collagen fibre network, and not by the proteoglycans (Mizrahi et al., 1986), the measure can be related to the tensile and shear properties of the collagen network. Few in vivo measurements of cartilage material properties have been done by using handheld arthroscopic indentation devices to measure the resisting force to an applied deformation on the cartilage surface (Niederauer et al., 2004). Without knowledge of the cartilage thickness, only functional stiffness properties can be obtained. The promising combination of ultrasonic
25

thickness measurements with arthroscopic indentation enables to determine mechanical properties.
2.7 Finite Element Modelling and Inverse Techniques
2.7.1 Finite Element Modelling in Biomechanics
The first application of the finite element method in biomechanics was published by Brekelmans in 1972 (Brekelmans et al., 1972). Since then, finite element models have been widely used to design and analyse prostheses, to obtain fundamental information about biological structures, and to investigate and simulate adaptive processes in tissue (Prendergast, 1997). Whereas the first FE-models in the past had to be very simplified, the vast improvement in computational power in recent years made it possible to simulate complex tissue behavior. Nowadays, subject specific finite element models to investigate and answer individual clinical relevant questions are possible (e.g. (Taddei et al., 2005)). The chronological improvement of modelling articular cartilage in joint mechanics will be summarized exemplary for the fast development in musculoskeletal finite element modelling. One of the first full joint Finite Element Models was an axisymmetric finite element code to predict stresses and displacements in human proximal tibia. Therein, cartilage was assumed to be linear elastic with a Young’s modulus of 14 MPa and a Poisson’s ratio of 0.5. In the following, joint models were two-dimensional contact models of the hip (Brown et al., 1984) and three-dimensional models of the tibia with linear elastic, isotropic materials (Little et al., 1986). Later on three-dimensional tibio-femoral FE-model generated from MR images including linear modelled cartilage, ligaments and menisci (Li et al., 1999) or with ligaments modelled as hyperelastic and transversely isotropic were published (Pena et al., 2005). In addition to numerous in-house FE solvers, commercially available FE solvers have shown their applicability to model cartilage as linear elastic or even as biphasic tissue (Wu et al., 1998). A requirement to obtain accurate and reliable data from the finite element models is the validation of the used physical model that establishes the basis of the numerical model (Viceconti et al., 2005). Furthermore, the accuracy of the numerical solution of the theoretical model has to be assessed (model and code verification) and the correct (material) parameters and boundary conditions have to be chosen. (Viceconti et al., 2004). Further mandatory requirements are the geometrical accuracy of the finite element mesh and the prevention of ill-conditioning of the mesh. If all these requirements are met, a consecutive sensitivity analysis should show the influence of measurement uncertainties on the results. The inter-subject variability should be considered as well, especially for subject-specific models. Using an accurate FE-model in combination with an optimization routine, the numerically calculated displacements of the modelled tissue can be used to determine the mechanical properties by an inverse Finite Element approach.
26

2.7.2 Inverse Technique
Inverse techniques, also called numerical-experimental methods or more specialized the inverse or iterative Finite Element approach, have become a powerful tool for mechanical characterization of materials. They complement the standard testing methods for biological and synthetic material as they enable a non-destructive measurement of the material parameters. For the mechanical testing methods, a specimen of the tested material has to be prepared with a well-specified shape. Furthermore, the sample has to be loaded in a simple, pre-defined manner. The defined shape and boundary conditions generate a (more or less) homogeneous stress and strain field within the material. This permits to calculate the mechanical properties based on the boundary condition. Typical examples of this traditional method are tensile tests as well as the above mentioned conventionally conducted confined compression, unconfined compression and indentation tests for articular cartilage. A limitation of this standard approach, especially for complex inhomogeneous anisotropic biological materials is that the sample has to be excised form the surrounding tissue. This resection disturbs the molecular structure and thus the mechanical properties of the tissue. The general procedure of solving an inverse problem is separated in seven steps (Liu, 2003). Firstly, the problem with a minimum number of unknowns is defined. Then, the (forward) Finite Element model is created based on the above mentioned requirements. A sensitivity analysis using the FE-model should be made prior to the design of the experiment. By minimization of the measurement noise, a stable solution is obtainable. Then, the objective function and the most applicable optimization technique should be determined.
Parameter
update
Initial
guess
Experiment
Finite Element
Model
Optimization
loop
+-
Figure 2-6: Sketch of the Inverse Finite Element method.
The verification of the solution as final step should be done to ensure that the solutions are physically meaningful. A simplified sketch of the interplay between experiment, the FE model,
27

and the optimization routine is shown in Figure 2-6. The inverse FE approach for the material parameters determination of biological tissue was recently applied successfully for heel pads (Delalleau et al., 2005), uterine cervix (Mazza et al., 2006), as well as livers and kidney (Nava et al., 2004).
28

Chapter 3 Aims of the Present Study


The diagnosis of irreversible cartilage changes in an early degenerative stage is increasingly important to prevent or reduce incidence of long-term disability. However, the early diagnosis lacks of an appropriate technique to measure quantitative properties easily and reproducibly. Up to now, methods from clinical practice such as MRI, do not detect minor functional changes of articular cartilage. Early alteration of the cartilage extracellular matrix as a result of disease progression or adaptation can be assessed based on biochemical, on structural, and on therefrom determined biomechanical properties. However, such investigations have been confined to post-mortem species up to now. A method for the non-invasive assessment of the biomechanical behaviour of AC would enable to perform longitudinal in vivo studies to observe quantitative changes of the tissue that either come along with diseases and adaptive processes on changed loading conditions or due to therapeutic interventions. The aim of the first part (Chapter 4) of the present study is
• to develop and test an MR-compatible loading device for the in vitro static compression of the patellofemoral joint in situ on cadaveric equine knee joints (4.1.1),
• to establish a procedure for the generation of accurate Finite Element Models based on individual MR-images (4.1.4),
• to establish and validate an inverse FE approach for the determination of the elastic equilibrium properties from experimental in situ tests on (equine) patellofemoral joints by coupling an optimization routine with a commercially available FE software (4.1.5.)
• to test the accuracy, reproducibility and sensitivity of this approaches (4.2.4), • to discuss the applicability of this novel method for the quantitative in vivo analysis of
articular cartilage of human (4.3). If early assessment of osteoarthritic or injured articular cartilage fails and the tissue has to be restored, the emerging discipline of tissue engineering has shown its potential for the functional treatment of minor cartilage defects. Crucial for a successful therapy are the mechanical properties of these engineered implants to withstand handling while implantation as well as their fixation stability to enable adhesion within the defect. Both properties will be assessed for novel scaffold materials in the second part of the thesis (Chapter 5).
31


Chapter 4 Assessment of Native Cartilage
Give me a place to stand and I will move the earth

Original: greek.: Δοσ Μοι Που Στω και Κινω την Γεν engl.: Give me where [to] stand on and [I will] move the earth A remark of Archimedes quoted by Pappus of Alexandria in his "Collection" (Synagoge, Book VIII, c. AD 340 [ed. Hultsch, Berlin 1878, p. 1060]). Image is an Engraving from Mechanics Magazine London, 1824
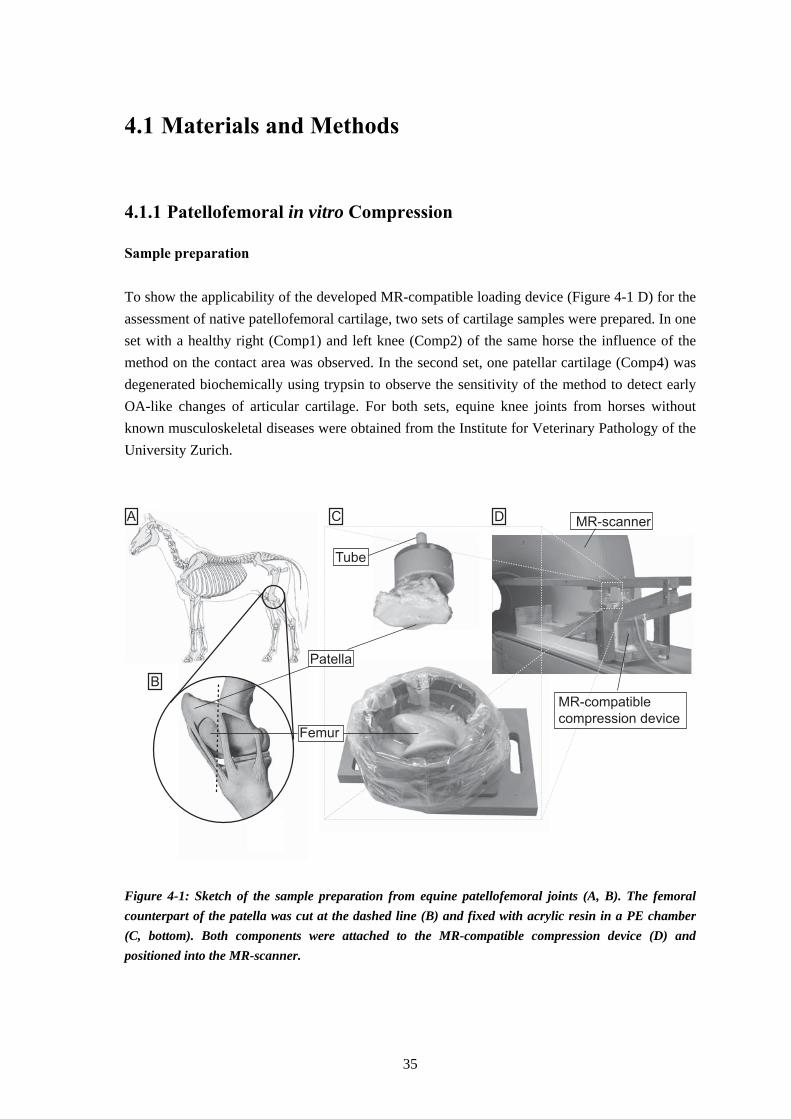
4.1 Materials and Methods
4.1.1 Patellofemoral in vitro Compression
Sample preparation To show the applicability of the developed MR-compatible loading device (Figure 4-1 D) for the assessment of native patellofemoral cartilage, two sets of cartilage samples were prepared. In one set with a healthy right (Comp1) and left knee (Comp2) of the same horse the influence of the method on the contact area was observed. In the second set, one patellar cartilage (Comp4) was degenerated biochemically using trypsin to observe the sensitivity of the method to detect early OA-like changes of articular cartilage. For both sets, equine knee joints from horses without known musculoskeletal diseases were obtained from the Institute for Veterinary Pathology of the University Zurich. A
B
DC MR-scanner
MR-compatible
compression deviceFemur
Patella
Tube
Figure 4-1: Sketch of the sample preparation from equine patellofemoral joints (A, B). The femoral counterpart of the patella was cut at the dashed line (B) and fixed with acrylic resin in a PE chamber (C, bottom). Both components were attached to the MR-compatible compression device (D) and positioned into the MR-scanner.
35

The joint was frozen and stored under -20°C within 8 h after death. The joints were thawed over night, disarticulated and the connective tissue was dissected. While the following procedure, the cartilage tissue was moistened with tissues soaked with 0.1 M phosphate buffered saline (Sigma-Aldrich, Buchs, Switzerland). The femoral counterpart of the patella was cut off using a band saw (Figure 4-1, B) and fixed with acrylic resin (Beracryl, Suter-Swiss composite Group, Fulenbach, Switzerland) in a MR-compatible PE chamber (Figure 4-1, C). After curing of the polymer, the patella was arranged on the femoral groove. To control the direction of the applied load while MRI acquisition, a water filled tube was fixed in a vertically drilled hole in the adjusted patella. The patella was fixed with acyclic resin in a PE-chamber with embedded PE-screws (Figure 3-2, C) Which allows for firm mounting of the wooden lever to the compression device (Figure 3-2, D). For test 2 the entire patellar cartilage of the left knee was treated with a diluted solution of 1 mg/ml trypsin and 0.152 mg/ml EDTA•4Na in Hanks’ balanced salt (Gibco, Invitrogen, Basel, Switzerland) solution for 20 min at 37°C to induce degeneration. All samples were stored subsequently for 1 h in 0.1 M PBS to allow the equilibration until the patellofemoral compression tests were performed. Calibration The application of the static load is carried out based on the mechanical principle of the lever. A dead weight of 132.5 N is applied at the end of the wooden lever of the custom-built and MR compatible loading device (Figure 4-1 D).
y = -7.66 * x + 810.2R2 = 0.999
49 50 51 545352 55
distance [cm]
load [N
]
390
395
400
405
410
415
420
425
430
435
Figure 4-2: Calibration curve of the compression device. The data are shown as mean and standard deviation.
36
The calibration of the system was performed using a 50 N load cell (A.S.T. Angewandte System-Technik GmbH, Dresden, Germany) and a material testing software (testXpert, Zwick, Ulm, Germany). The position of the load cell on the lever was increased in 5 mm steps and the resulting loads were measured three times. The mean and standard deviations of the three measured loads load were plotted as a function of the position of the patellofemoral joint on the lever (Figure 4-2).
4.1.2 Biochemical Assessment
Three small patellar cartilage samples of approximately 5 mg were excised from the mechanically characterized regions using a scalpel. Since we did detect no differences in the GAG content between lateral and medial facet of the patella in a previous study (data not shown), we analyzed subsequently only samples from lateral facet. To determine the wet weight, the samples were dried with tissue towels and weighed on an analytical balance (Mettler Toledo, Germany). After freezing and lyophilization, the dry weights of the specimens were determined. The water content was calculated by dividing the difference between lyophilized and wet weight by the wet weight of the sample multiplied with 100%. Sulphated glycosaminoglycan (sGAG) content was determined based on the chondroitin-sulfate content by using a colorimetric dimethyl-methylene-blue (DMMB). Three freeze-dried samples of 1 to 2 mg dry weight from each tested patella were enzymatically digested with a freshly prepared papain solution according to the protocol of the Drug Formulation & Delivery Research Unit of the Institute of Pharmaceutical Sciences (ETH Zurich) to break down the extracellular matrix of the cartilage. For this purpose 2.5 mg papain (type III, 19 U/mg, Worthington P3126) was added to 20 ml of a sterile PBE buffer (0.1 M Na2HPO4, 0.01M Na2EDTA) with pH 6.5 and activated by 0.035 g cystein. The samples were transferred into Eppendorf tubes and treated with 1 ml of the papain digestion buffer for 16 h at 60°C. The colorimetric reaction was performed by adding 1.2 ml of a DMMB solution (40.5 mM Glycine, 40 mM NaCl, 16 μg/ml (~38μM) 1,9 DMMB (Aldrich), pH=3) to 50 μl of the dissolved protein solution. For the calibration curve (Figure 4-3), 1.2 ml of the DMMB solution was added to 50 μl of the bovine Chondroitin sulphate standard (70% pure, C8529, Sigma) solution with concentrations ranging from 0.4 μg/ml to 4 μg/ml. The absorbance (optical density, OD) at 525 nm was determined immediately after mixing using a UV-Vis spectrophotometer (Cary 300, Varian Inc., Ca, USA) three times for all digested samples of each patella. The mean of the calculated GAG content was normalized with the dry weight.
37

0 0.05 0.1 0.15
0
1
2
3
4
y = 28.2 * x - 0.179
R2 = 0.995
CS
co
nc.
[mg
/ml]
OD525
Figure 4-3: Calibration curve for the colorimetric dimethyl-methylene-blue (DMMB) assay. The data are shown as mean and standard deviation.
4.1.3 Conventional Mechanical Assessment
Recovery experiment of Herberhold et al. (1999) showed that patellar cartilage exhibited almost full recovery (98%) 4 h after a static loading test with 150% body weight for 3.5 h. Thus, the femoral and patellar samples were equilibrated after 2 h of patellofemoral compression test for more than 2 h in a 0.1 M phosphate buffered saline solution without loading to enable the full recovery of the deformation. Subsequent indentation stress-relaxation tests were performed in three positions within the observed contact area on the medial and lateral facet of the patella (Figure 4-4).
lateral medial
Comp2 Comp3
lateral medial
Comp1
lateralmedial
Comp4
lateralmedial
Figure 4-4: View from posterior on the four patellar cartilage samples. Measurement sites for indentation and confined compression (circles) and corresponding sections obtained by MR imaging (dotted lines) were shown.
38

The fixed patellar bone from the patellofemoral compression test was attached to a mechanical testing system (EnduraTec ELF 3200, Bose Corporation, Minnetonka, MN, USA) with a 22 N low force cell (Model 31, Honeywell Sensotec, Columbus, Ohio, USA) and visually aligned perpendicularly to the plane-ended rigid circular indenter (a = 0.99 mm in diameter). To ensure full contact between cartilage and indenter a preload of 0.015 N was applied for 60 s. Five consecutive indentation displacements of 50 μm with a velocity of 5 μm/s were conducted and the resulting force was recorded (Figure 4-5 A). Each indentation site was tagged with a marker on the cartilage surface and at the mounting device to ensure the same specimen position and orientation for the subsequent thickness measurement. After a recovery period of at least 1200 s cartilage thickness was determined at the marked test site using a needle probe technique (Jurvelin et al., 1995).
0
0.05
0.1
0.15
0.2
0.25
0.3
0 1000 2000 3000 4000
0
0.2
0.4
0.6
0.8
1
1.2
load [N
]
dis
pla
cem
ent [m
m]
0 0.05 0.1
0
0.2
0.4
0.6
strain [-]
str
ess [M
Pa]
0.15
time [s]
E=1.88 MPa
A B
Figure 4-5: Typical resulting load series (black) from six consecutive displacement steps of 50 μm (grey) (A). The indentation stiffness was determined from the linear region between 5 and 15% strain using function 4-1 (B). Therefore, a blunted needle with a diameter of 0.5 mm (Braun, Melsungen, Germany) was attached to the load cell and penetrated close to the marked positions with a constant velocity of 0.5 mm/s into the tissue until a load of 5 N was reached. Displacement and force were acquired with 120 Hz. The cartilage thickness was defined as difference between the needle position with zero force and its position with a sudden rise in force indicating the contact with the deep calcified layer (Figure 4-6).
39
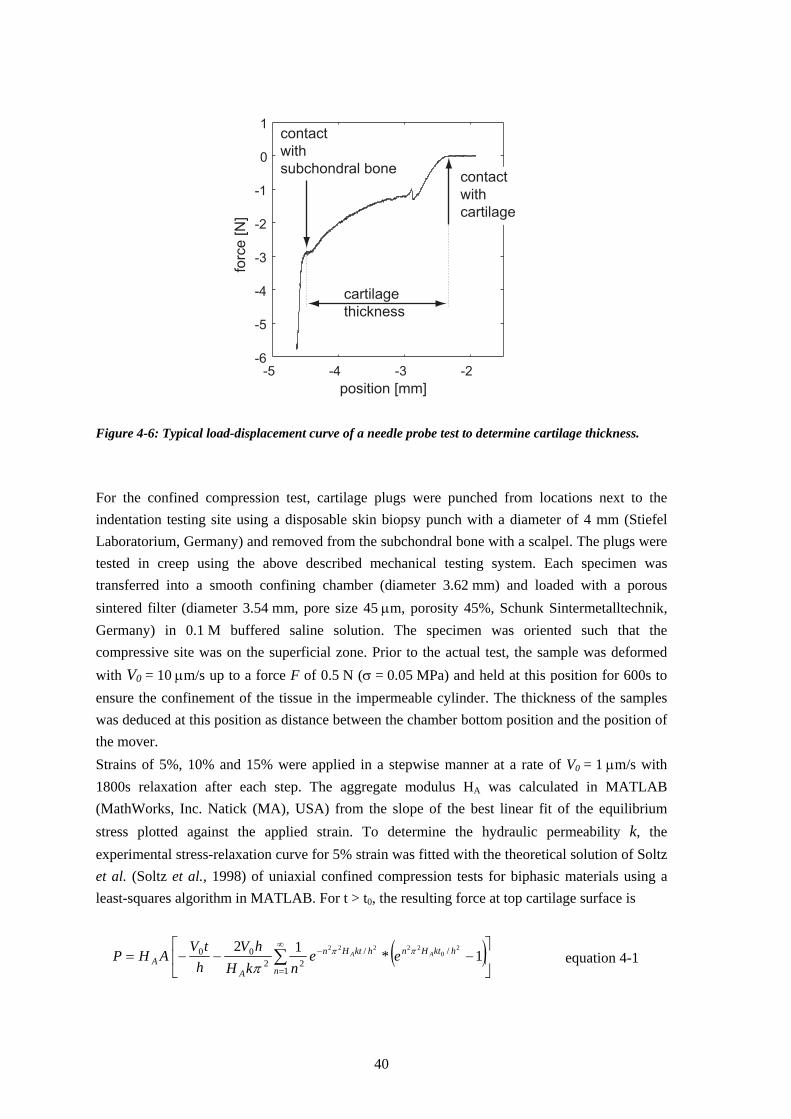
-5 -4 -3 -2-6
-5
-4
-3
-2
-1
0
1
position [mm]
forc
e [
N]
contact
with
subchondral bonecontact
with
cartilage
cartilage
thickness
Figure 4-6: Typical load-displacement curve of a needle probe test to determine cartilage thickness. For the confined compression test, cartilage plugs were punched from locations next to the indentation testing site using a disposable skin biopsy punch with a diameter of 4 mm (Stiefel Laboratorium, Germany) and removed from the subchondral bone with a scalpel. The plugs were tested in creep using the above described mechanical testing system. Each specimen was transferred into a smooth confining chamber (diameter 3.62 mm) and loaded with a porous sintered filter (diameter 3.54 mm, pore size 45 μm, porosity 45%, Schunk Sintermetalltechnik, Germany) in 0.1 M buffered saline solution. The specimen was oriented such that the compressive site was on the superficial zone. Prior to the actual test, the sample was deformed with V0 = 10 μm/s up to a force F of 0.5 N (σ = 0.05 MPa) and held at this position for 600s to ensure the confinement of the tissue in the impermeable cylinder. The thickness of the samples was deduced at this position as distance between the chamber bottom position and the position of the mover. Strains of 5%, 10% and 15% were applied in a stepwise manner at a rate of V0 = 1 μm/s with 1800s relaxation after each step. The aggregate modulus HA was calculated in MATLAB (MathWorks, Inc. Natick (MA), USA) from the slope of the best linear fit of the equilibrium stress plotted against the applied strain. To determine the hydraulic permeability k, the experimental stress-relaxation curve for 5% strain was fitted with the theoretical solution of Soltz et al. (Soltz et al., 1998) of uniaxial confined compression tests for biphasic materials using a least-squares algorithm in MATLAB. For t > t0, the resulting force at top cartilage surface is
( )⎥⎦
⎤⎢⎣
⎡−−−= ∑
∞
=
−
1
//22
00 1*12 20
22222
n
hktHnhktHn
AA
AA eenkH
hVh
tVAHP ππ
π equation 4-1
40
with the cross-sectional area A of the confining chamber, the ramp velocity V0, the cartilage thickness h, and the time t0 when the relaxation process starts. The Young’s modulus E was determined from the equilibrium stress-strain curve of the indentation test (Figure 4-5 B) (Toyras et al., 1999). Based on the theoretical model of indentation for linear elastic materials (equation 2-8) (Hayes et al., 1972) the Young’s modulus E was derived from
( )212
νκ
π−⎟
⎠⎞
⎜⎝⎛=
haEE measured equation 4-2
where Emeasured is the measured Young’s modulus from the linear region of the stress-strain curve (Figure 4-5 B), h the cartilage thickness, a the indenter diameter, and κ the scaling factor which itself depends on both the aspect ratio a/h and the Poissons ratio ν. The scaling factor was determined for each aspect ratio for an assumed a Poisson’s ratio of 0.1 according to the results from Jurvelin (1991) (Table 4-1). Table 4-1: Values of scaling factors κ for different area-aspect ratios (a/h) for Poissons ratio of 0.1 from (Jurvelin, 1991).
Area aspect ratio (a/h) 0.20 0.30 0.40 0.6 κ 1.183 1.413 1.677 1.677
4.1.4 Quantitative Magnetic Resonance Imaging
4.1.4.1 Magnetic Resonance Imaging of Articular Cartilage
The prepared equine patellofemoral joints were measured in PBS in the transversal plane with a 1.5 T MR scanner (Gyroscan Intera, Philips). A surface microscopy coil with a diameter of 47 mm was positioned around the cylindrical PE-chamber with the patellar cartilage. The maximal distance between the microscopy coil and the cartilage surfaces was smaller than the coil diameter to ensure good image quality. MR-images were acquired with a spoiled 3D gradient echo sequence with water selective excitation (TR: 30 ms, TE: 7.4 ms, Flip angle: 20°, number of scans per acquisitions (NSA): 2) which has been reported to be accurate and reliable even for osteoarthritic articular cartilage (Burgkart et al., 2001). The 320x320 scan resolution with a field of view of 80 mm and a slice thickness of 1.4 mm results in a scan time of 7 min 42 s for 2 (NSA=2) averaged acquisitions.
41

The transversal images were aligned to be in direction of the water-filled tube, which defines the loading directions for the FE model. To improve the geometrical accuracy of the patellar and femoral cartilage model, images were acquired before load application and thus before contact between the patellar and femoral cartilage was established (_pre). After load application, (_00) subsequent image sets were acquired every 8 min within the first 30 min (Table 4-2). Table 4-2: MR-protocol from the data acquisition. Time is the start of the acquisition with defined MR-parameters. Images were acquired before loading without contact, while loading, and after loading without contact.
Time [min]
Test conditions MR-parameter Duration [min]
Name
-8 without contact TR=23 ms, TE=7.4, FA=20°, NSA=2 7:42 _pre 0 loaded TR=23 ms, TE=7.4, FA=20°, NSA=2 7:42 _00 8 .. TR=23 ms, TE=7.4, FA=20°, NSA=2 7:42 _08
16 .. TR=23 ms, TE=7.4, FA=20°, NSA=2 7:42 _16 …
32 .. TR=23 ms, TE=7.4, FA=20°, NSA=4 15:10 _32 55 .. TR=23 ms, TE=7.4, FA=20°, NSA=8 30:17 _55 87 .. TR=23 ms, TE=7.4, FA=20°, NSA=8 30:17 _87
… ~120 loaded TR=23 ms, TE=7.4, FA=20°, NSA=2 7:42 _end +8 without contact TR=23 ms, TE=7.4, FA=20°, NSA=2 7:42 _post
Since displacement and thus movement artefacts of the cartilage surface mainly take place within the first 30 min (Herberhold et al., 1999) image sets were acquired subsequently with NSA=4 and NSA=8 after 60 min to improve SNR. At the end of the patellofemoral compression test (_end) and immediately after load removal, images were reconstructed of two averaged acquisitions.
4.1.4.2 Post-Processing
Segmentation To obtain the geometrical information of anatomical structure from a pre-defined number of MR images, their edges were marked by segmentation of the structure of interest. This was performed semi-automatically in a slice-by-slice manner by means of a custom written software (Pirnog, 2005) that is based on 2D B-spline curves. Herein, the boundary of the object was delineated by a medial-representation (M-REP) based segmentation technique, where a structure is represented by a set of medial atoms (Figure 4-7, A & D). At the end of the segmentation process, the resulting medial representation was transferred to a triangular surface mesh of the entire object as
42

described by Pirnog (Figure 4-7, C & F). The number of opposing boundary points in the M-REP model determines the number of vertices of the triangulated mesh. As a result, the triangulated surface of the patellar cartilage commonly consists of 15174 vertices and 30344 triangles. Registration To eliminate modelling errors caused by subtle translation and rotation of the femur and patella during compression, the cartilage structures after compression have to be registered to the geometry obtained before load application to detect deformational changes. This can be done either by registration of the entire MR image set before the segmentation or by fitting of the geometrical objects after segmentation and reconstruction. Entire medical image registration were performed using the Mean Square Error (MSE) between the scans as registration criterion, as implemented in the ACS software by Pirnog (Pirnog, 2005). Herein the MSE between the reference and the floating data, which was transformed according to the transformation parameters TT (translation matrix) and TR (rotations matrix) was computed as the sum of the squared differences in the intensity of voxels with the same spatial position. The MSE minimization was performed by a Powel/Brent optimization method. For more information on this method, the reader is referred to (Pirnog, 2005). The registration was performed based on a limited volume around BCI since the bone-cartilage-interface (BCI) is assumed to be rigid and does not deform while compression. After the registration of the floating images on the reference images, the segmented patellar and femoral M-REP cartilage model from the reference image set can be applied directly to the floating image set.
A B
D
C
E F
Figure 4-7: Transversal images with segmented patellar (A) and femoral (D) articular cartilage. Bone is black, cartilage white, and phosphate buffered saline grey. Same slices with reconstructed triangulated surface geometries (B & E) and geometry after export (C & F).
43

For high quality images with a high contrast-to-noise ratio (CNR) for the BCI, the boundaries of the cartilage model have to be adjusted to the deformed cartilage surface. However, this registration method results in blurred floating images because the voxels have to be interpolated during positioning and re-orientation according to the transformation matrix. Thus, image registration was only used to obtain information about translation and rotation of the patellar and femoral bone before and while testing to include this into the FE-model. The registration of the segmented 3D shapes of the patellar cartilage was performed based on the widely used iterative closest point (ICP) algorithm. ICP starts with a rigid body transformation of one point clouds to the other followed by an iterative refinement method that minimizes the sum of errors between pairs of corresponding (closest) points of the data (Besl et al., 1992). This algorithm and the transformation of the floating data was realized in Matlab (MathWorks, Inc. Natick (MA), USA). Quantitative Data The contact area of the patellofemoral joint was determined by measuring the length of the contact in the joint within the ACS software. Contact was defined when the gap between patellar and femoral surface was smaller than the in plane resolution of the MR image. Multiplication of the length with the slice thickness and summation of these values over all slices results in the total contact area (mm2) (Brechter et al., 2002). The results are comparable to the pressure sensitive film technique (Heino Brechter et al., 2003). Global morphological data such as mean thickness and maximal thickness of the geometry were calculated from 3D cartilage thickness data. Volume was determined while pre-processing the cartilage geometry in Geomagic Studio (Geomagic Inc., Research Triangle Park, NC, USA). Simplistic assumption that the volumetric deformation ΔV only occurs at the contact area A, divided by the mean thickness hmean results in a mean strain εmean
meanmean hA
V*Δ
=ε equation 4-3
In combination with equation 2-4, this allows for calculation of a mean compressive modulus Emean from the global morphological data by
VhP
E meanmean Δ
=*
equation 4-4
with the applied load P.
44
4.1.4.3 Reproducibility of the Segmentation
The reproducibility of the segmentation process was assessed from the global morphological data (mean and max. thickness, volume) and by 3D-comparison of the geometries with an averaged geometry as reference. MR-images of an equine patella in PBS were acquired according to the above-described parameters. The data were segmented three times over a defined number of images with at least one week between the procedures. The coefficient of variation (CV%), defined as 100 times the standard deviation divided by the average value, was calculated for the mean thickness, maximal thickness and volume of the patellar cartilage. For the local analysis of the segmentation, an average model of the three segmentation processes was calculated from their point cloud data. After triangulation, the average model was compared with the three sets using Geomagic Qualify (Geomagic Inc, Research Triangle Park, NC, USA) and the deviations were displayed color-coded.
4.1.5 Inverse FE Approach
4.1.5.1 Finite Element Modelling
Accurate geometries for FE-Modelling were generated by segmenting the patellar and femoral cartilage from the MR images without contact between the two structures (_pre) using the ACS software (Figure 4-8, 1). The segmented patellar and femoral geometry were used as drafts for the segmentation of the cartilage after compression (_post). Latter geometries were the used as estimates to segment the patellar cartilage at the end of the compression test (_end) (Figure 4-8; 3 & 4). The point cloud of the patellar surface nodes (Figure 4-8, 5) was registered to the 3D reconstructed patellar cartilage model (Figure 4-8, 2) to transform both into the same coordinate system for subsequent optimization. To determine the translation and rotation of the geometries while establishing contact (_pre - _00) and during compression test (_00 - _end), the MR images were registered based on the MSE approach of Pirnog et al (Figure 4-8, 6 & 7). This experimentally observed translation of the patellar and femoral cartilage was implemented into the Finite Element model to obtain precise models of the contact conditions at the beginning and the end of the compression test. The triangulated surface geometries were imported into a commercial software package (Raindrop Geomagic, Geomagic Inc, Research Triangle Park, NC, USA) to fit nonuniform rational B-splines (NURBS) to the cartilage surface and the bone-cartilage interface. The NURBS surfaces of the 3D geometries were imported into a commercial pre-processor (Patran 2005, MSC software corporation, Santa Ana, CA, USA) and meshed with linear three-dimensional continuum elements. The mesh for patellar and femoral cartilage each consists of 2339 nodes, 224 linear triangular prism elements (C3D6) and 1368 linear hexahedral elements (C3D8) with a mean size of approximately 1.4 x 1.6 x 1.0 mm (Figure 4-8, 8). 3
45
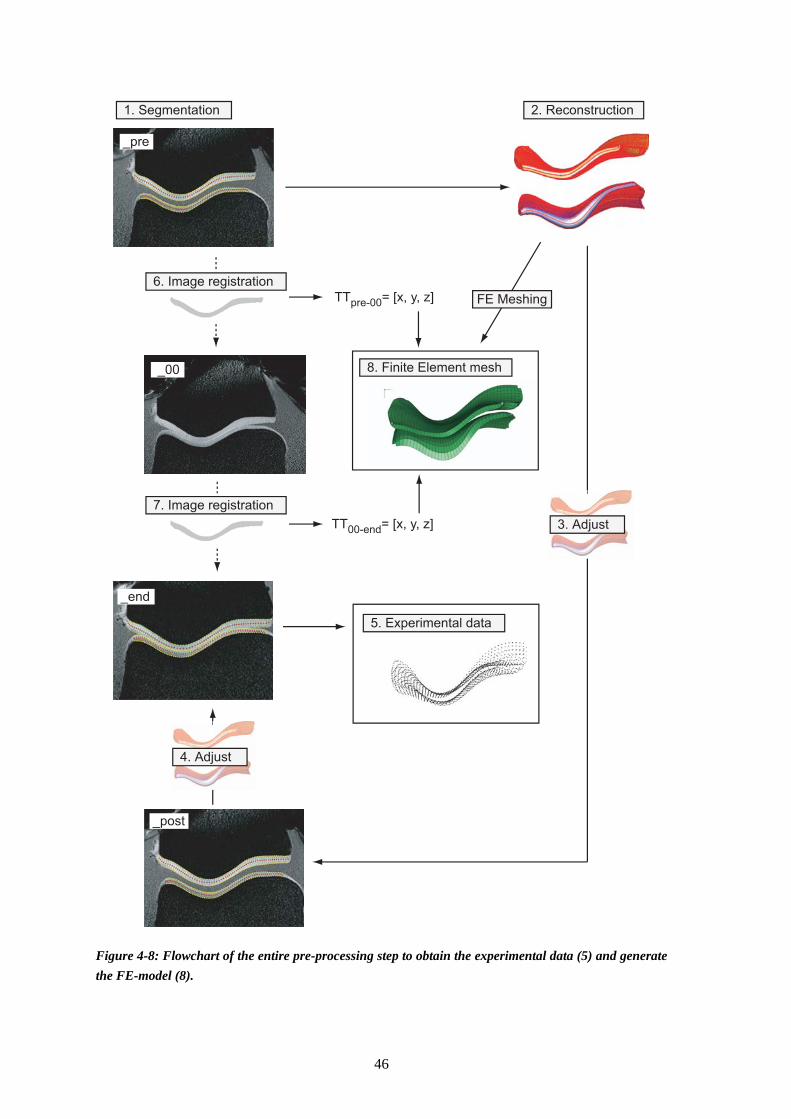
_pre
_00
_end
_post
TTpre-00= [x, y, z]
TT00-end= [x, y, z]
1. Segmentation 2. Reconstruction
3. Adjust
4. Adjust
5. Experimental data
8. Finite Element mesh
6. Image registration
7. Image registration
FE Meshing
Figure 4-8: Flowchart of the entire pre-processing step to obtain the experimental data (5) and generate the FE-model (8).
46
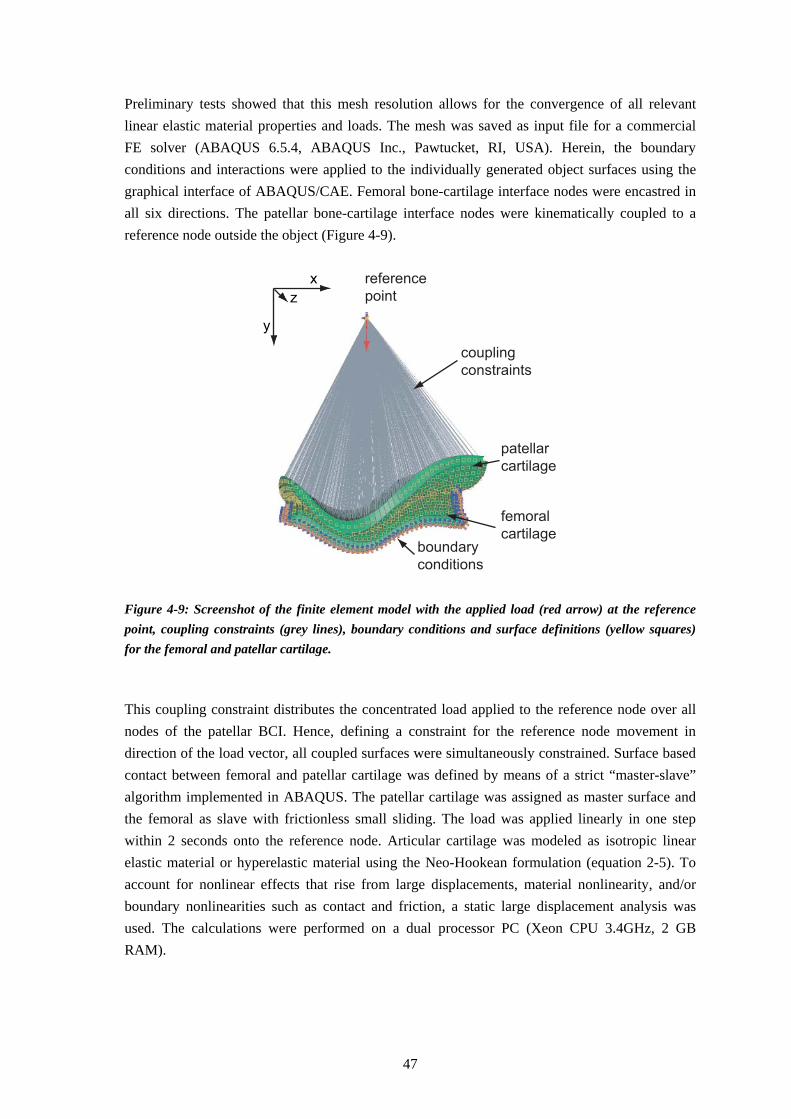
Preliminary tests showed that this mesh resolution allows for the convergence of all relevant linear elastic material properties and loads. The mesh was saved as input file for a commercial FE solver (ABAQUS 6.5.4, ABAQUS Inc., Pawtucket, RI, USA). Herein, the boundary conditions and interactions were applied to the individually generated object surfaces using the graphical interface of ABAQUS/CAE. Femoral bone-cartilage interface nodes were encastred in all six directions. The patellar bone-cartilage interface nodes were kinematically coupled to a reference node outside the object (Figure 4-9).
x
y
z
reference
point
patellar
cartilage
femoral
cartilage
coupling
constraints
boundary
conditions Figure 4-9: Screenshot of the finite element model with the applied load (red arrow) at the reference point, coupling constraints (grey lines), boundary conditions and surface definitions (yellow squares) for the femoral and patellar cartilage. This coupling constraint distributes the concentrated load applied to the reference node over all nodes of the patellar BCI. Hence, defining a constraint for the reference node movement in direction of the load vector, all coupled surfaces were simultaneously constrained. Surface based contact between femoral and patellar cartilage was defined by means of a strict “master-slave” algorithm implemented in ABAQUS. The patellar cartilage was assigned as master surface and the femoral as slave with frictionless small sliding. The load was applied linearly in one step within 2 seconds onto the reference node. Articular cartilage was modeled as isotropic linear elastic material or hyperelastic material using the Neo-Hookean formulation (equation 2-5). To account for nonlinear effects that rise from large displacements, material nonlinearity, and/or boundary nonlinearities such as contact and friction, a static large displacement analysis was used. The calculations were performed on a dual processor PC (Xeon CPU 3.4GHz, 2 GB RAM).
47

4.1.5.2 Optimization
The objective function φ to calculate the material parameters x based on the nodal surface coordinates of the FE model and the measured nodal surface coordinates from experiment for all previously defined surface nodes n is given as:
)(1)(1
xdiffn
xnodesn
inodes =∑=φ equation 4-5
Herein, ||•|| is the Euclidean norm of the nodal difference between experimental and theoretical data (diff(x)). The unknown parameters x were found by minimizing φ(x) with respect to x:
)(min xx Px φ∈= equation 4-6 with the parameter space P using an nonlinear least squares optimization routine (lsqnonlin, Optimization Toolbox, MATLAB R14, MathWorks, Inc. Natick (MA), USA). The surface area of the patellar cartilage, for which the optimization was being performed, was manually defined in the FE pre-processing step. Thus, the nodal coordinates of the entire surface (Figure 4-10, B) or solely of a reduced number of surface nodes with expected deformation (Figure 4-10, C) were extracted and saved automatically after each FE-calculation as text file.
y
zx
A
B D
C E
Figure 4-10: Isometric view on the patellar cartilage finite element mesh with all surface nodes (red spheres (A)). All surface nodes (red spheres (B)) or a reduced number of surface nodes (red cross (C)) from the exported data file are shown superposed with the registered experimental surface nodes (black points, D & E) to calculate the differences for optimization. As the experimental point cloud data of the patellar cartilage from the end of compression (_end) was previously registered to the initial non-deformed geometry (_pre), and thus to the finite
48
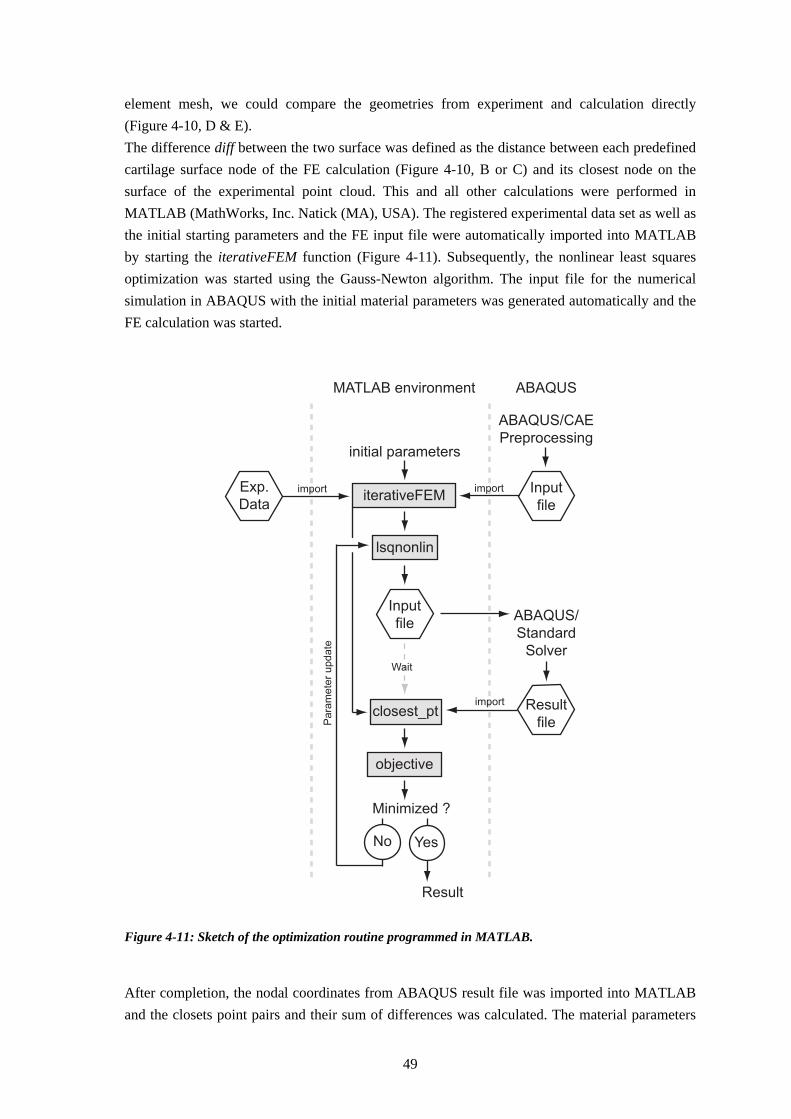
element mesh, we could compare the geometries from experiment and calculation directly (Figure 4-10, D & E). The difference diff between the two surface was defined as the distance between each predefined cartilage surface node of the FE calculation (Figure 4-10, B or C) and its closest node on the surface of the experimental point cloud. This and all other calculations were performed in MATLAB (MathWorks, Inc. Natick (MA), USA). The registered experimental data set as well as the initial starting parameters and the FE input file were automatically imported into MATLAB by starting the iterativeFEM function (Figure 4-11). Subsequently, the nonlinear least squares optimization was started using the Gauss-Newton algorithm. The input file for the numerical simulation in ABAQUS with the initial material parameters was generated automatically and the FE calculation was started.
MATLAB environment
iterativeFEM
Wait
objective
Pa
ram
ete
r u
pd
ate
Result
Input
file
Exp.
Data
lsqnonlin
initial parameters
closest_pt
import
Minimized ?
import
import
ABAQUS/CAE
Preprocessing
ABAQUS
ABAQUS/
Standard
Solver
Result
file
Input
file
No Yes
Figure 4-11: Sketch of the optimization routine programmed in MATLAB. After completion, the nodal coordinates from ABAQUS result file was imported into MATLAB and the closets point pairs and their sum of differences was calculated. The material parameters
49

were updated until the minimum of the objective function was reached. The Optimization was restrained by lower boundaries of 0.5 MPa and 0.05 and by upper boundaries of 10 MPa and 0.5 for the Young’s modulus and the Poisson’s ratio of the cartilage modelled as linear elastic material. For the nonlinear cartilage modelling using the neo-hookean hyperelastic model the lower boundaries were restricted to 0.1 MPa and 0.08 MPa and the upper boundaries to 4 MPa and 2.5 MPa for the initial shear modulus G and bulk modulus K, respectively. The optimization algorithm was chosen on the basis of its robustness and accuracy. This test and the sensitivity analysis was performed with a synthetically generated data set with known material parameters obtained from a forward FE calculation. The nodal surface deformation for a load of 400 N was calculated for patellar cartilage modelled as linear elastic material with four times the number of elements used for subsequent iterative FE calculation. As we do not know the accurate material parameters in advance, we generated the experimental data for “soft” cartilage with a Young’s modulus of 2 MPa and for “hard” cartilage with 5 MPa with a Poisson’s ratio of 0.1 for both. The robustness and the accuracy of two commonly used optimization algorithms (Gauss-Newton, Levenberg-Marquard) were determined for six randomly generated initial starting conditions and three variations of step size for finite differencing. The robustness of the algorithm was assessed based on the convergence and the coefficient of variation of the result. The accuracy was assessed based on the relative error. The minimal change in variables in finite difference derivatives (DiffMinChange in MATLAB) was chosen to be coarse (0.1), moderate (0.01) and fine (0.001). Furthermore, a combination of the coarse and moderate minimum change was evaluated for robustness and accuracy. The tolerance of the parameter and the function value to terminate optimization was chosen to be 10-6. The sensitivity analysis were performed using the geometry from one exemplary compression test for six randomly generated material parameters. The influence of the loading error, of the segmentation error as well as of the registration error on the calculated linear elastic material properties were quantified based on the relative error of the mean result for the six starting values. To assess the sensitivity of the loading error on the material paramaters, “experimental” loading data were calculated in a forward approach with ±1%, ±2%, and ±5% deviation of the accurate load of 400 N. The influence of the segmentation process was assessed for three synthetically generated data sets. Therefore, the nodal difference between each point of the average cartilage model and its closest point on the three segmented geometries were added to the corresponding points of the FE model surface. The registration of the MR-images before contact (_pre) with the images immediately after contact (_00) (Figure 4) might be inaccurate in the sub-voxel range (~0.1 mm) (Pirnog et al). Thus, the influence of the registration process on the material parameters was assessed by translation of the patellar cartilage relative to the femoral counterpart by ±0.1 mm, ±0.2 mm, and ±0.5 mm in x- and z-direction. As we do not know the accuracy of the deformed surface data exactly, we assessed the needs of the data acquisition for pre-defined accuracies of the in of the inverse FE approach. We calculated the displacement of the cartilage surface in a forward approach with an error-polluted Young’s modulus of ±10% and ±15% of the previously calculated “accurate” moduli. The patellar geometries, calculated with over- and underestimated Young’s moduli, were compared
50
for each test using Geomagic Qualify (Geomagic Inc, Research Triangle Park, NC, USA) to determine their 3D deviation and thus define the requirement on the MRI accuracy
4.1.6 Statistical Analysis
Values of the quantitative data were displayed as mean ± standard deviation (sd) unless stated otherwise. For statistical analysis, nonparametric tests were preferred due to small number of samples. The Wilcoxon rank sum test was used for the statistical comparison of the groups of the healthy and degenerated cartilage for the mechanical and the biochemical parameters (Matlab, MathWorks, Inc. Natick (MA), USA). The mechanical properties from conventional mechanical testing were analyzed statistically using a (two-way) ANOVA in Systat (Systat Software, Inc., Point Richmond, USA). A significance level of p = 0.05 was chosen unless stated otherwise.
51


4.2 Results
In the following chapter, the cartilage from test Comp1 to Comp3 is assumed to be healthy, whereas the trypsin-treated sample Comp4 is specified as degenerated sample.
4.2.1 Biochemical Assessment
The water content in the cartilage samples from the lateral facet of the patella varied between 75.45 ± 1.76 for Comp1 joint and 76.35 ± 0.23 for Comp3 joint but they were not significantly different among each other (Table 4-3). The sulphated glycosaminoglycan (sGAG) content per dry weight was 13.01 ± 0.59 μg/mg, 8.71 ± 1.08 μg/mg, 13.27 ± 2.30 μg/mg, and 8.16 ± 1.63 μg/mg for Comp1 to Comp4, respectively. The mean sGAG content of all healthy cartilage samples was 10.788 ± 2.794 which was not significantly different from the degenerated cartilage of Comp4 (p = 0.1). Table 4-3: Results from biochemical analysis of the water content and the sulphated glycosaminoglycan content( sGAG) based on the colorimetric DMMB method.
Position Water content [%] sGAG dry weight
[μg/mg]
Comp1 lateral 75.45±1.76 13.01±0.59
Comp2 lateral 76.27±1.27 8.71±1.08
Comp3 lateral 76.35±0.23 13.27±2.30
Comp4 lateral 75.95±1.12 8.16±1.63
4.2.2 Conventional Mechanical Assessment
Indentation tests were performed for all joints, whereas confined compression tests were performed for all but Comp1. For healthy patellar cartilage the mean equilibrium Young’s Modulus over the entire cartilage surface was 1.669 ± 0.496 MPa, 1.374 ± 0.305 MPa, and 1.604 ± 0.199 MPa and mean aggregate modulus was 0.568 ± 0.130 MPa and 0.522 ± 0.199 MPa (Table 4-4).
53

Table 4-4: Mechancial properties of the patellar articular cartilage from indentation and confined compression testing. Eequ is obtained from the slope of the equilibrium stress-strain curve between 5 and 15% strain. All parameters were calculated with ν=0.1 according to Jurvelin et al.(1991). Data are given as mean and standard deviation. n.d.a. indicates no data available. * p < 0.05 versus mean of all healthy cartilage (Wilcoxon rank sum test).
Sample Position Eequ
[MPa]
HA
[MPa]
κ
[*10-12 m2/(Ns)]
Comp1 lateral 1.879±0.664 n.d.a n.d.a medial 1.458±0.202 n.d.a. n.d.a entire 1.669±0.496 n.d.a n.d.a
Comp2 medial 1.523±0.347 0.489±0.052 lateral 1.223±0.215 0.620±0.148 entire 1.374±0.305 0.568±0.130 0.038±0.022
Comp3 medial 1.435±0.068 0.495±0.237 lateral 1.772±0.094 0.549±0.202 entire 1.604±0.199 0.522±0.199 0.024±0.014
Comp4 medial 0.443±0.023 0.267±0.122 lateral 0.358±0.032 0.190±0.051 entire 0.400±0.053 * 0.228±0.094 * 0.044±0.040
The Young’s moduli (0.400 ± 0.053 MPa) and the aggregate moduli (0.228±0.094 MPa) of the degenerated cartilage were significantly different from the healthy cartilage (p <0.05) (Figure 4-12). The hydraulic permeability between healthy and degenerated cartilage in test Comp4 was not significantly different from healthy cartilage. The values of the Young’s Moduli and the aggregate moduli were independent of the sample for healthy cartilage and independent of the side (medial/lateral) for healthy and degenerated cartilage (Comp4).
54
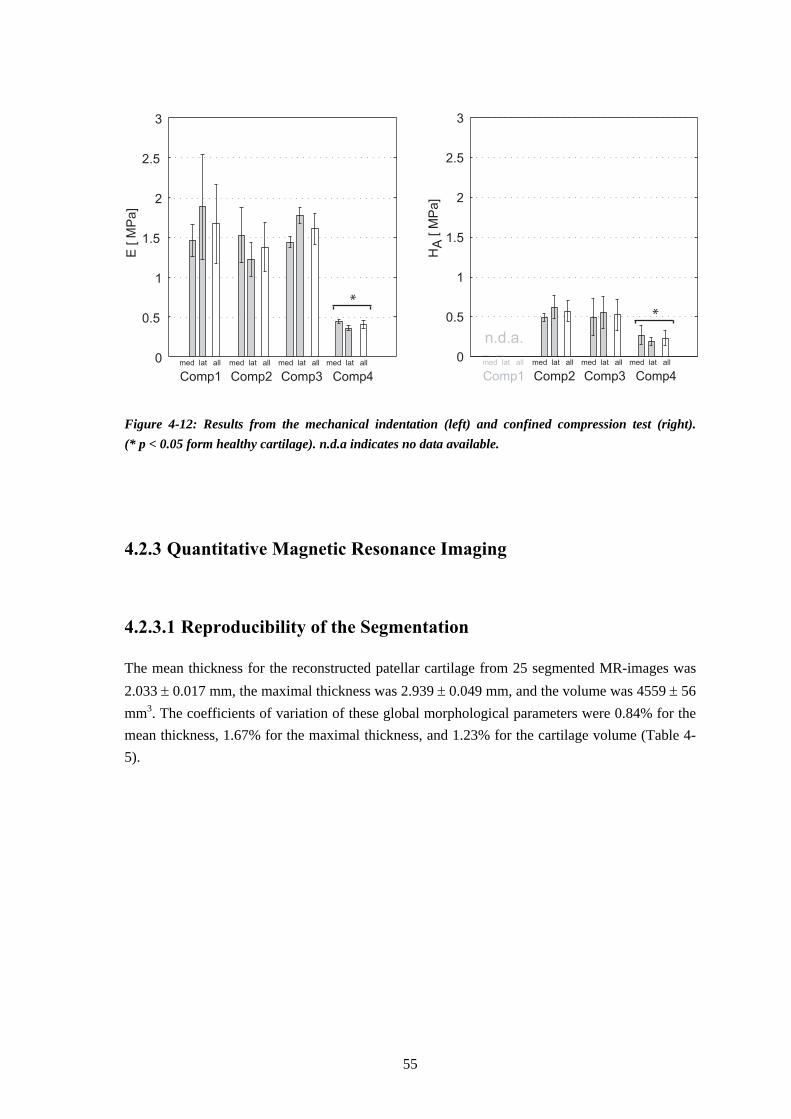
0
0.5
1
1.5
2
2.5
3
0
0.5
1
1.5
2
2.5
3E
[ M
Pa]
HA
[ M
Pa]
Comp1 Comp2 Comp3 Comp4
med lat all med lat all med lat all med lat all
Comp1 Comp2 Comp3 Comp4
med lat all med lat all med lat all med lat all
n.d.a.
**
Figure 4-12: Results from the mechanical indentation (left) and confined compression test (right). (* p < 0.05 form healthy cartilage). n.d.a indicates no data available.
4.2.3 Quantitative Magnetic Resonance Imaging
4.2.3.1 Reproducibility of the Segmentation
The mean thickness for the reconstructed patellar cartilage from 25 segmented MR-images was 2.033 ± 0.017 mm, the maximal thickness was 2.939 ± 0.049 mm, and the volume was 4559 ± 56 mm3. The coefficients of variation of these global morphological parameters were 0.84% for the mean thickness, 1.67% for the maximal thickness, and 1.23% for the cartilage volume (Table 4-5).
55
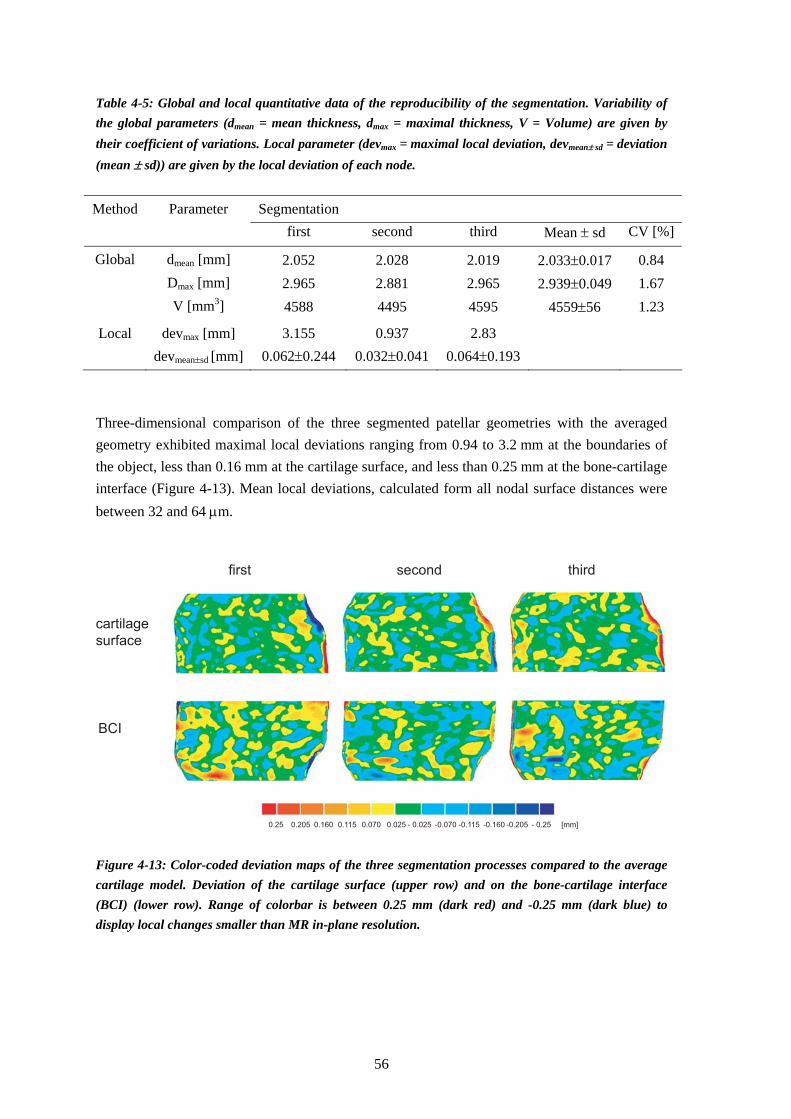
Table 4-5: Global and local quantitative data of the reproducibility of the segmentation. Variability of the global parameters (dmean = mean thickness, dmax = maximal thickness, V = Volume) are given by their coefficient of variations. Local parameter (devmax = maximal local deviation, devmean± sd = deviation (mean ± sd)) are given by the local deviation of each node.
Method Parameter Segmentation
first second third Mean ± sd CV [%]
Global dmean [mm] 2.052 2.028 2.019 2.033±0.017 0.84 Dmax [mm] 2.965 2.881 2.965 2.939±0.049 1.67 V [mm3] 4588 4495 4595 4559±56 1.23
Local devmax [mm] 3.155 0.937 2.83 devmean±sd [mm] 0.062±0.244 0.032±0.041 0.064±0.193
Three-dimensional comparison of the three segmented patellar geometries with the averaged geometry exhibited maximal local deviations ranging from 0.94 to 3.2 mm at the boundaries of the object, less than 0.16 mm at the cartilage surface, and less than 0.25 mm at the bone-cartilage interface (Figure 4-13). Mean local deviations, calculated form all nodal surface distances were between 32 and 64 μm.
cartilage
surface
BCI
first second third
0.25 - 0.25 [mm] 0.025 - 0.0250.205 -0.2050.160 0.115 0.070 -0.070 -0.115 -0.160 Figure 4-13: Color-coded deviation maps of the three segmentation processes compared to the average cartilage model. Deviation of the cartilage surface (upper row) and on the bone-cartilage interface (BCI) (lower row). Range of colorbar is between 0.25 mm (dark red) and -0.25 mm (dark blue) to display local changes smaller than MR in-plane resolution.
56
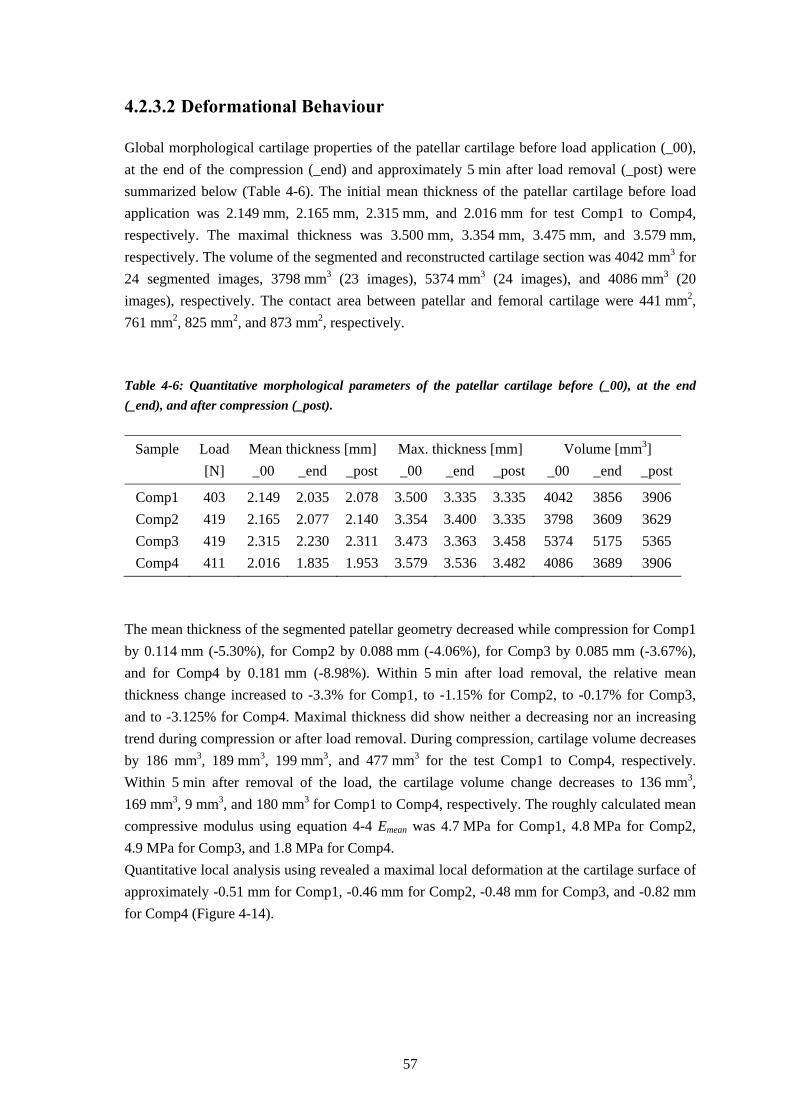
4.2.3.2 Deformational Behaviour
Global morphological cartilage properties of the patellar cartilage before load application (_00), at the end of the compression (_end) and approximately 5 min after load removal (_post) were summarized below (Table 4-6). The initial mean thickness of the patellar cartilage before load application was 2.149 mm, 2.165 mm, 2.315 mm, and 2.016 mm for test Comp1 to Comp4, respectively. The maximal thickness was 3.500 mm, 3.354 mm, 3.475 mm, and 3.579 mm, respectively. The volume of the segmented and reconstructed cartilage section was 4042 mm3 for 24 segmented images, 3798 mm3 (23 images), 5374 mm3 (24 images), and 4086 mm3 (20 images), respectively. The contact area between patellar and femoral cartilage were 441 mm2, 761 mm2, 825 mm2, and 873 mm2, respectively. Table 4-6: Quantitative morphological parameters of the patellar cartilage before (_00), at the end (_end), and after compression (_post).
Sample Load Mean thickness [mm] Max. thickness [mm] Volume [mm3]
[N] _00 _end _post _00 _end _post _00 _end _post
Comp1 403 2.149 2.035 2.078 3.500 3.335 3.335 4042 3856 3906 Comp2 419 2.165 2.077 2.140 3.354 3.400 3.335 3798 3609 3629 Comp3 419 2.315 2.230 2.311 3.473 3.363 3.458 5374 5175 5365 Comp4 411 2.016 1.835 1.953 3.579 3.536 3.482 4086 3689 3906
The mean thickness of the segmented patellar geometry decreased while compression for Comp1 by 0.114 mm (-5.30%), for Comp2 by 0.088 mm (-4.06%), for Comp3 by 0.085 mm (-3.67%), and for Comp4 by 0.181 mm (-8.98%). Within 5 min after load removal, the relative mean thickness change increased to -3.3% for Comp1, to -1.15% for Comp2, to -0.17% for Comp3, and to -3.125% for Comp4. Maximal thickness did show neither a decreasing nor an increasing trend during compression or after load removal. During compression, cartilage volume decreases by 186 mm3, 189 mm3, 199 mm3, and 477 mm3 for the test Comp1 to Comp4, respectively. Within 5 min after removal of the load, the cartilage volume change decreases to 136 mm3, 169 mm3, 9 mm3, and 180 mm3 for Comp1 to Comp4, respectively. The roughly calculated mean compressive modulus using equation 4-4 Emean was 4.7 MPa for Comp1, 4.8 MPa for Comp2, 4.9 MPa for Comp3, and 1.8 MPa for Comp4. Quantitative local analysis using revealed a maximal local deformation at the cartilage surface of approximately -0.51 mm for Comp1, -0.46 mm for Comp2, -0.48 mm for Comp3, and -0.82 mm for Comp4 (Figure 4-14).
57

Comp1
Comp3
Comp4
Cartilage surface Bone-cartilage interface
1.00 -1.00 [mm] 0.1 -0.10.82 -0.820.64 0.46 0.28 -0.28 -0.46 -0.64
Comp2
Figure 4-14: 3D comparison of the cartilage geometries before and after compression (images from Geomagic Qualify). Range of colorbar is between 1.0 mm (dark red) and -1.0 mm (dark blue).
4.2.4 Inverse FE Approach
Analyses for the robustness, accuracy, and sensitivity were performed for six randomly generated starting values for a linear elastic material [(E,ν) = (4.84, 0.38); (0.68, 0.11); (8.30, 0.25); (4.72, 0.2); (6.35, 0.36); (8.02, 0.31)]. Each forward FE calculation in ABAQUS lasts about 100 s using a dual-processor PC (CPU 3.4 GHz, 2 GB RAM). The overall CPU time for the inverse calculation is mainly occupied by the Finite Element calculation and only little by MATLAB
58

data generation of about 10 s for each function call. The entire calculation lasts approximately 160 min for a mean number of 60 function calls.
4.2.4.1 Robustness and Accuracy
Results for both optimization algorithms (Gauss-Newton and Levenberg-Marquard) with variations in the differencing step width are summarized in Table 4-7 for the soft cartilage and in Table 4-8 for the hard cartilage. The Gauss-Newton algorithm (GN (1-step)) converged for all starting values independent of the finite differencing step width for both material parameters. The Levenberg-Marquard optimization algorithm (LM (1-step)) converged only for a step width of 0.1 and 0.001 for the cartilage with a Young’s modulus E = 5 MPa. However, for these cases, the resulting Poisson’s ratios were negative and thus meaningless. Table 4-7: Results of the robustness and accuracy check for the six randomly generated starting values for the soft cartilage with E = 2.00 MPa and ν = 0.10. Data are presented as mean±standard deviation; GN=Gauss-Newton, LM=Levenberg-Marquardt; DiffMin=step width for finite differencing in MATLAB. Data are given as mean and standard deviation. Results shown as n.d.a. (no data available) indicate either lack of convergence or meaningless, negative results at least for one starting value.
Esoll = 2.00 MPa νsoll = 0.100
Algorithm Option DiffMin
Function calls
E [MPa]
CV [%]
ν CV [%]
GN (1-step) 0.1 52±9 2.058±0.086 4.2 0.079±0.017 21.5 0.01 68±33 2.022±0.003 0.2 0.096±0.002 2.1 0.001 45±4 5.362±2.191 40.9 0.095±0.024 25.3
LM (1-step) 0.1 - n.d.a. - n.d.a. - 0.01 - n.d.a. - n.d.a. - 0.001 - n.d.a. - n.d.a. -
GN (2-step) (0.1, 0.01) 57±11 2.035±0.045 2.2 0.100±0.009 9.3 LM (2-step) (0.1, 0.01) - n.d.a. - n.d.a. -
The most accurate and robust results were obtained for “soft” cartilage (E = 2 MPa, ν = 0.1) using the Gauss-Newton algorithm with a step width of 0.01 and for the hard cartilage with a step width of 0.1. For the soft cartilage, the relative error was 1.1% for the Young’s modulus and 4.0% for the Poisson’s ratio with a low coefficient of variation of 0.15% and 2.08%, respectively. For the “hard” cartilage, the accuracy (relative error) was 0.9% for the Young’s modulus and 2% for the Poisson’s ratio with a low variation of 0.8% and 5%, respectively. The combination of both step widths within the “2-step” Gauss-Newton algorithm with a step width of 0.1 for the first 15 function calls and a width of 0.01 for the consecutive optimization
59

resulted in the most robust and accurate results for both materials without a detectable increase in computing time. Using this algorithm, the relative error of the mean parameter of the six starting combinations was 1.75% and 1.5% for the Young’s modulus and 0.1% and 7% for the Poisson’s ratio of the soft and hard material, respectively. Coefficient of variation for the Young’s modulus was 2.2% and 0.1% and for the Poisson’s ratio 9.3% and 6.5% for the soft and hard material, respectively. For the following calculations, this “2-step” Gauss-Newton algorithm was used. Table 4-8: Results of the robustness and accuracy check for the six randomly generated starting values for the hard cartilage with E = 5.00 MPa and ν = 0.10. Data are presented as mean±standard deviation; GN=Gauss-Newton, LM=Levenberg-Marquardt; DiffMin=step width for finite differencing in MATLAB. Data are given as mean and standard deviation. Results shown as n.d.a. (no data available) indicate either lack of convergence or meaningless, negative results at least for one starting value.
Esoll =5.00 MPa νsoll = 0.100 Algorithm Option
DiffMin Function
calls E
[MPa] CV [%]
ν CV [%]
GN (1-step) 0.1 51±5 5.045±0.040 0.8 0.098±0.005 5.0 0.01 68±33 5.665±1.094 19.3 0.083±0.018 21.6 0.001 51±24 5.529±2.254 40.8 0.087±0.046 53.0
LM (1-step) 0.1 49±10 6.238±1.072 17.19 n.d.a. - 0.01 - n.d.a. - n.d.a. - 0.001 44±7 5.556±2.370 42.7 n.d.a. -
GN (2-step) (0.1, 0.01) 54±6 5.077±0.007 0.1 0.093±0.006 6.5 LM (2-step) (0.1, 0.01) 56±1 6.468±0.795 12.3 n.d.a. -
4.2.4.2 Sensitivity to Load Error
Results of the sensitivity analysis for an experimental load error of ±1%, ±2%, and ±5% are summarized for the soft (E = 2.00 MPa) and hard material (E = 5.00 MPa) in Table 4-9. If the experimental load was 5% (-20 N) lower than the load for numerical simulation, the error for the Young’s modulus was about 6.4 % and 6.7 % for the soft and hard material, respectively (Figure 4-15). A positive load error of 5% results in an underestimation of the Young’s modulus of 3.9% and 3.4% for the soft and hard cartilage, respectively. Poisson’s ratios were independent on the load error. Poisson’s ratios were underestimated by approximately -5% and -8% for the soft material, respectively.
60

Table 4-9: Results of the sensitivity analysis of the load error for the soft (E = 2 MPa, ν = 0.1) and the hard cartilage (E = 5 MPa, ν = 0.1). Data presented as mean ± standard deviation of the six randomly generated starting values.
Esoll =2.00 MPa νsoll = 0.100 Esoll =5.00 MPa νsoll = 0.100 error[%]
E [MPa]
error[%]
ν [-]
error[%]
E [MPa]
error[%]
ν [-]
error[%]
1 2.014±0.005 0.7 0.096±0.003 -4.0 5.020±0.004 0.4 0.092±0.002 -8.0 -1 2.042±0.003 2.1 0.095±0.002 -5.0 5.128±0.011 2.6 0.092±0.002 -8.0 2 1.981±0.004 -1.0 0.094±0.003 -6.0 4.965±0.012 -0.7 0.094±0.004 -6.0 -2 2.060±0.002 3.0 0.095±0.002 -5.0 5.184±0.010 3.7 0.092±0.002 -8.0 5 1.923±0.003 -3.9 0.095±0.02 -5.0 4.831±0.013 -3.4 0.090±0.004 -10 -5 2.127±0.002 6.4 0.094±0.002 -6.0 5.335±0.026 6.7 0.093±0.004 -7.5
A maximal experimental load error of 1.6 N, obtained from the calibration of the compression device (Figure 4-2) at a load of 435 N (load error less than 0.4%), results in material parameter errors below 2.6% for the Young’s modulus and below 8% for the Poisson’s ratio (Figure 4-15).
-5 -2 -1 +1 +2 +5-4
-2
0
2
4
6
8
load error [%]
Yo
un
g’s
mo
du
lus e
rro
r [%
]
loading
device
Figure 4-15: Interrelation between the loading error and the calculated Young’s modulus for the soft (bright) and hard (dark) cartilage. The maximal error of the loading device of ± 0.8 % results a maximal error of the calculated Young’s modulus between 0.4% and 2.6%.
61

4.2.4.3 Sensitivity to Segmentation Error
The analysis of the three segmentations, error-polluted with the six different starting values used above, resulted in a Young’s modulus of 2.024 ± 0.059 MPa, 2.035 ± 0.023 MPa, and 2.0152 ± 0.027 MPa and a Poisson’s ratio of 0.095 ± 0.003, 0.097 ± 0.001, and 0.094 ± 0.003 for the soft cartilage. For the hard material the calculated Young’s moduli were 5.155 ± 0.029 MPa, 5.073 ± 0.072 MPa, and 4.979 ± 0.083 MPa and the Poisson’s ratios were 0.087 ± 0.006, 0.099 ± 0.005, and 0.090 ± 0.007. Consequently, the Young’s modulus of the hard material might be incorrect between -0.4% and +3.1% and the soft material between +0.8% and +1.7% due to the reduced reproducibility of the segmentation process. The Poisson’s ratio might be incorrect between -13% and -1.5% for the hard cartilage and between -7% and -3% for the soft cartilage.
4.2.4.4 Sensitivity to Registration Error
Results of the sensitivity analysis of the registration error of the patellar cartilage by ±0.1 mm, ±0.2 mm, and ±0.5 mm both, in image plane (x-direction) and out of plane (z-direction) are summarized for the soft and hard material in Table 4-10. Table 4-10: Results of the sensitivity analysis of the registration error for the soft (E = 2 MPa, ν = 0.1) and the hard cartilage (E = 5 MPa, ν = 0.1). Data presented as mean and standard deviation of the six randomly generated starting values.
Esoll =2.00 MPa νsoll = 0.100 Esoll =5.00 MPa νsoll = 0.100 error E
[MPa] error[%]
ν [-]
error[%]
E
[MPa] error[%]
ν [-]
error[%]
x+0.1 2.024±0.009 1.2 0.096±0.001 -4 5.086±0.055 1.7 0.097±0.003 -3 x-0.1 2.025±0.004 1.3 0.092±0.004 -8 5.043±0.047 0.9 0.089±0.004 -11 x+0.2 2.022±0.010 1.1 0.101±0.002 1 5.137±0.056 2.7 0.102±0.068 2 x-0.2 2.031±0.006 1.6 0.089±0.002 -11 5.032±0.045 0.6 0.088±0.003 -12 x+0.5 2.048±0.033 2.4 0.109±0.002 9 5.298±0.189 6.0 0.116±0.007 16 x-0.5 2.067±0.008 3.4 0.096±0.002 -4 5.058±0.189 1.2 0.093±0.007 -7
z+0.1 2.006±0.002 0.3 0.094±0.001 -5 5.047±0.027 0.9 0.092±0.004 -8 z-0.1 2.036±0.002 1.8 0.095±0.002 -7 5.095±0.012 1.9 0.093±0.002 -7 z+0.2 1.988±0.002 -0.6 0.093±0.001 -4 5.056±0.037 1.1 0.091±0.001 -9 z-0.2 2.053±0.005 2.7 0.096±0.001 -4 5.097±0.189 1.9 0.099±0.003 -1 z+0.5 1.961±0.016 -2.0 0.096±0.001 -4 5.065±0.047 1.3 0.092±0.003 -8 z-0.5 2.116±0.013 5.8 0.100±0.003 ±0 5.174±0.052 3.5 0.098±0.004 -2
62
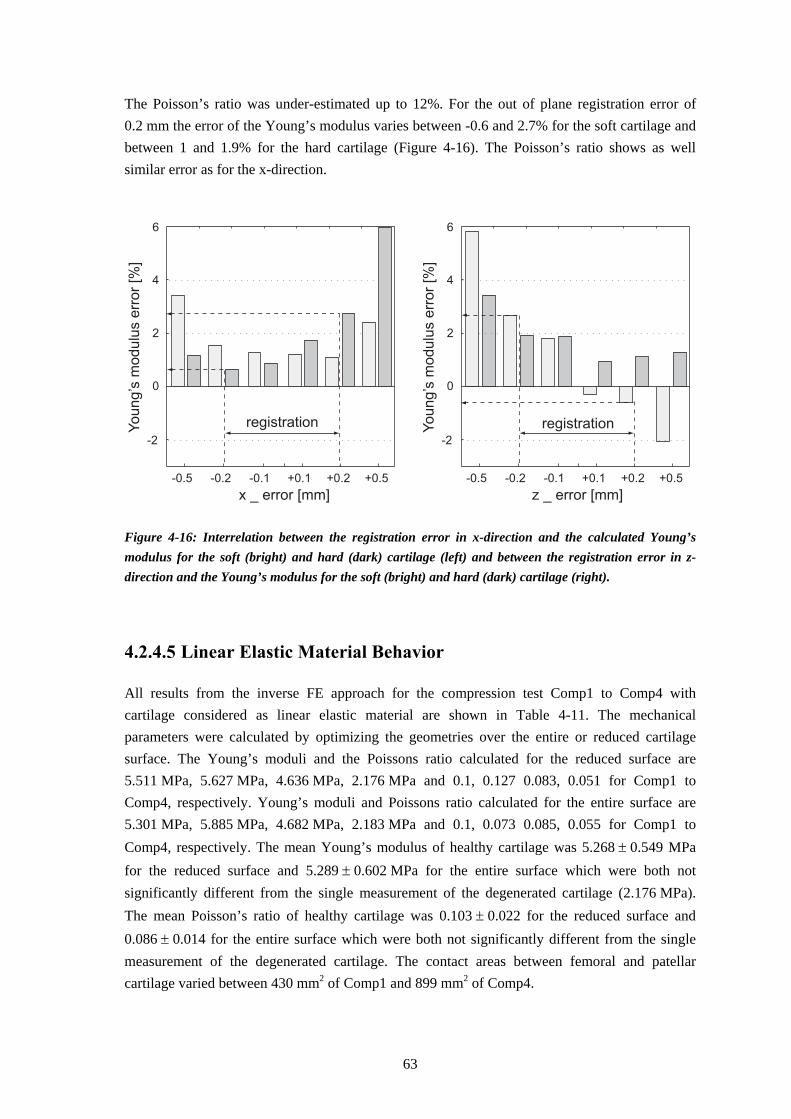
The Poisson’s ratio was under-estimated up to 12%. For the out of plane registration error of 0.2 mm the error of the Young’s modulus varies between -0.6 and 2.7% for the soft cartilage and between 1 and 1.9% for the hard cartilage (Figure 4-16). The Poisson’s ratio shows as well similar error as for the x-direction.
-0.5 -0.2 -0.1 +0.1 +0.2 +0.5
-2
0
2
4
6
x _ error [mm]
Yo
un
g’s
mo
du
lus e
rro
r [%
]
registration
-0.5 -0.2 -0.1 +0.1 +0.2 +0.5
-2
0
2
4
6
z _ error [mm]
Yo
un
g’s
mo
du
lus e
rro
r [%
]registration
Figure 4-16: Interrelation between the registration error in x-direction and the calculated Young’s modulus for the soft (bright) and hard (dark) cartilage (left) and between the registration error in z-direction and the Young’s modulus for the soft (bright) and hard (dark) cartilage (right).
4.2.4.5 Linear Elastic Material Behavior
All results from the inverse FE approach for the compression test Comp1 to Comp4 with cartilage considered as linear elastic material are shown in Table 4-11. The mechanical parameters were calculated by optimizing the geometries over the entire or reduced cartilage surface. The Young’s moduli and the Poissons ratio calculated for the reduced surface are 5.511 MPa, 5.627 MPa, 4.636 MPa, 2.176 MPa and 0.1, 0.127 0.083, 0.051 for Comp1 to Comp4, respectively. Young’s moduli and Poissons ratio calculated for the entire surface are 5.301 MPa, 5.885 MPa, 4.682 MPa, 2.183 MPa and 0.1, 0.073 0.085, 0.055 for Comp1 to Comp4, respectively. The mean Young’s modulus of healthy cartilage was 5.268 ± 0.549 MPa for the reduced surface and 5.289 ± 0.602 MPa for the entire surface which were both not significantly different from the single measurement of the degenerated cartilage (2.176 MPa). The mean Poisson’s ratio of healthy cartilage was 0.103 ± 0.022 for the reduced surface and 0.086 ± 0.014 for the entire surface which were both not significantly different from the single measurement of the degenerated cartilage. The contact areas between femoral and patellar cartilage varied between 430 mm2 of Comp1 and 899 mm2 of Comp4.
63

Table 4-11: Results from iterative FE analysis of the compression tests using the linear elastic material law for all four samples. Optimization was performed over the reduced cartilage and the entire surface.
Sample
Surface
E
[MPa]
ν
[-]
Acontact [mm2]
Comp1 reduced 5.541 0.100 430 entire 5.301 0.100 452
Comp2 reduced 5.627 0.127 792 entire 5.885 0.073 786
Comp3 reduced 4.636 0.083 699 entire 4.682 0.085 691
Comp4 reduced 2.176 0.051 899 entire 2.183 0.055 899
4.2.4.6 Nonlinear Elastic Material Behavior
All results from the inverse FE approach for the compression test Comp1 to Comp4 with cartilage analyzed as neo-Hookean hyperelastic material are shown in Table 4-12. The mechanical parameters were calculated by optimizing the geometries over the reduced surface. Table 4-12: Results from iterative FE analysis of the compression tests using the hyperelastic material law for all four samples. Optimization was performed over the reduced cartilage. Young’s moduli were calculated using equation 2-1 with ν = 0.1. Results shown as n.d.a. (no data available) indicate inaccurate results dependent on the starting value. Sample
G
[MPa]
Ecalc
[MPa]
K0
[MPa]
Comp1 3.514 7.731 n.d.a. Comp2 3.016 6.625 n.d.a. Comp3 2.628 5.782 n.d.a. Comp4 1.082 2.380 n.d.a.
The shear modulus is slightly dependent on the starting value of the optimization, whereas the bulk modulus is strongly dependent on the starting value. Consequently, the results for the bulk moduli were not shown. For a starting value of G0 = 3.30 MPa, the initial shear moduli are 3.51 MPa for Comp1, 3.016 MPa for Comp2, 2.628 MPA for Comp3, and 1.082 MPa for Comp4. The Young’s moduli, calculated from equation 2-1 with an assumed Poisson’s ratio of 0.1, is 7.731 MPa for Comp1, 6.625 MPa for Comp2, 5.782 MPA for Comp3, and 2.380 MPa for Comp4.
64

4.2.4.7 Error Estimation
Geometrical deviations of the patellar cartilage surface calculated with a difference in Young’s modulus by ± 10% and ± 15% are shown in Figure 4-17.
E+/-10%
Comp1
Comp4
Comp2
Comp3
0.250 0.150 0.125 0.100 0.075 0.050 0.0250.1750.2000.225 -0.015
E+/-15%
Figure 4-17: 3D comparison of the patellar surface displacement for all four patellofemoral compression tests. Deviation of the patellar surface between the error-polluted Young’s moduli with ±10%, and ±15% is shown color-coded.
65

The deviation between the surfaces calculated with over- and underestimated Young’s moduli were locally between 50 μm and 75 μm in the contact areas for all tests and error pollution (yellow). For healthy cartilage with a patellofemoral contact area below 700 mm2 (Comp1 and Comp3) and for the degenerated cartilage (Comp4) the local surface deviations were between 75 μm and 100 μm between the 10% over- and underestimated Young’s moduli. For these tests, local surface deviations between the 15% over- and underestimated Young’s moduli were between 100 μm and 125 μm and over small areas even greater than 125 μm.
66

4.3 Discussion
4.3.1 Patellofemoral in vitro Compression
In this study, we developed and tested an MR-compatible loading device for the static compression of the patellofemoral joint. In a preliminary study in the framework of a PhD thesis (Vanwanseele, 2003), we have already shown the applicability of this method for in vivo load application on the patellofemoral joint in humans. Vanwanseele showed that the mean thickness of the patellar cartilage was reduced by 5% of the initial thickness after 80 min of static compression with a moderate load of 400 N. This reduction in mean thickness is in the same range as our result for healthy equine patellar cartilage. Together with the work of Herberhold et al. (1999) these were the sole systematic studies on deformational behavior of human articular cartilage in situ on intact joints. In the past, Armstrong et al. (1979) used the roentgenographic technique for measuring cartilage deformation in intact joint specimens. However, this 2D method does not allow for the detection of the deformation over the entire joint. Deformation can only be detected in one plane where the image joint surface is perpendicular to the projected image plane whereas other regions remain blurred and cannot be analyzed quantitatively. Andresen et al. (1993) performed MR-controlled patellofemoral compression tests in vivo for specific staging of chondromalacia patellae based on cartilage thickness decreases and signal intensity. Using a custom-build compression device they applied loads of up to 35 N for maximal 12 min. Dependent on the degenerative stage of the articular cartilage, they detected cartilage thickness changes up to 2.5 mm. It was concluded that clinically diagnosed chondromalacia patellae could be detected using this method, whereas it remained undetectable using arthroscopy. However, thickness changes were only detected locally from a 2D image, which might be error-prone if the translation and rotation of the patella relative to this plane was not restricted during compression. Herberhold and co-workers (1999) performed static patellofemoral compression tests using intact human cadaveric joint and analyzed the 2D slices as well as the reconstructed 3D morphology of the cartilage. However, they applied loads of about 1.5 times the body weight of the donors, which prevents clinical application. With applied loads between 825 and 1260 N for more than 3.5 h on the patellofemoral joint, they observed a maximal local deformation of up to 84% of the initial thickness and volume changes of about 30%. Such high strains over a long time period possibly results in cell death at the superficial zone (Lucchinetti et al., 2002). Thus, load applications over a long period > 2 h might not allow for the assessment of the deformational behaviour in vivo. We investigated the sensitivity of the in situ patellofemoral compression approach to detect cartilage deformation and calculate mechanical properties for more physiological loading conditions (load 400 N; duration ~2 h). We used cadaveric equine patellofemoral joints which display similar cartilage thickness to those from human. To analyze the experimental data, we generated individual Finite Element Models of each test and coupled the experimental data and
67

the numerical simulation of the test by an inverse FE approach. In contrast to traditional ways for the mechanical testing, this “numerical-experimental” technique does not require the excision of samples with a well-defined shape, which is complicated especially for biological materials. For instance, confined compression testing of articular cartilage requires a cylindrical cartilage plug that fits accurately into an impermeable cylindrical chamber. Therefore, the material has to be punched out from the surrounding tissue, resulting in disruptions of the structural arrangement and consequently in changes of the mechanical behavior. A further disadvantage of the conventional mechanical testing methods is that only local information on the mechanical behaviour can be gained. This is not adequate to assess the overall functional behavior of the entire tissue.
4.3.2 Biochemical and Conventional Mechanical Assessment
Trypsin digestion results mainly in a degeneration of the proteoglycans with minor simultaneous effect on the collagen network (Harris et al., 1972). In other studies, digestion was performed up to 24 h to simulate the degenerative stages of OA, which resulted in a complete loss of the PG. In this work however, we have degenerated the cartilage for only 20 min to simulate the early stage of OA degeneration. Biochemical analysis revealed that the water content of the patellar cartilage from lateral facets was in the range of the reported values for healthy human patellar cartilage, whereas the herein determined proteoglycan concentration was slightly lower than the values reported for human patellar cartilage (27 μg/mg dry weight) (Treppo et al., 2000). Results from equine patellar cartilages for comparison have not been published so far. In contrast to other studies of in situ degeneration of articular cartilage using trypsin (DiSilvestro et al., 2002), we did not detect differences between the two groups. This lack of difference may arise from errors during sample preparation and from the low number of samples. Proteoglycan degeneration of entire cartilage joints is very inhomogeneous over the cartilage thickness as it depends on the diffusion of trypsin into the cartilage from the surface to the bone cartilage interface. Thus, the cartilage superficial zone shows a reduction in proteoglycan content after 10 min of degeneration whereas the middle and deep zone remain unaffected (Niederauer et al., 2004). Analyzing a cartilage sample from the superficial zone results in lowered PG concentrations compared to samples through entire cartilage depth. Furthermore, the PG content is per se not homogeneously distributed over the cartilage thickness. In our study, excision of the cartilage samples with a reduced deep zone and lower PG content (Figure 2-2) results in falsified results compared to entire cartilage plugs. Despite the lack of differences in biochemical properties, both equilibrium mechanical parameters decreased significantly by the trypsin treatment. The Young’s modulus decreased from about 1.55 MPa for healthy cartilage samples to 0.40 MPa for the trypsin degenerated ones. The equilibrium aggregate modulus decreased from 0.54 MPa to 0.23 MPa. The values of the Young’s moduli and the aggregate moduli of the healthy patellar cartilage are comparable to other results for ponies (Uthamanthil et al., 2006). The depletion of the Young’s modulus (-74%) was more profound than that of the aggregate modulus (-58%) at this specific positions. As a
68

result, the biochemical assessment of AC is less robust to measurement errors than the biomechanical assessment. Especially, indentation testing has shown its applicability to distinguish between healthy and degenerated cartilage. A limitation of this method is that it reflects only the local material parameters in the range of the indenter diameter.
4.3.3 Quantitative Magnetic Resonance Imaging
The presented static patellofemoral compression test on excised joints resulted in obvious deformation of the cartilage surface (Figure 4-15, left column) with maximal local deformation between 0.5 mm and 0.82 mm with physiological loads. The local maximal principal strain component in loading direction, calculated in ABAQUS for linear elastic material properties from Table 4-10, were 35% for Comp1, 16% for Comp2, 26% for Comp3, and 33% for Comp4 and consequently only half of the maximal 2D deformation reported by Herberhold et al. (1999). However, especially the two tests Comp2 and Comp4 displayed a geometric deviation at the beginning of the compression (_00) and at the end (_end) not only at the cartilage surface but also at the bone-cartilage-interface. This deviation is supposed to be an artefact from anisotropic voxel size and not an actual deformation. In MRI, the intensity of each pixel in each 2D slice is the average intensity throughout the actual acquired volume (voxel). If the patellar cartilage does not vary within the image plane, the partial volume averaging does not influence the contour of the object in the 2D image even for anisotropic voxels used in this study (0.25x0.25x1.4 mm3). However, if the contour of the object changed throughout the image thickness of 1.4 mm, the object contour would be blurred in the 2D image. The regions at the upper left corner of Comp2 and Comp3 (Figure 4-15) represent such specific areas with smaller radius of curvature in the imaging direction and consequently a blurred contour. Thus, the pixels at the surface edge will appear much lighter than the surrounding tissue, which results in a systematic overestimation of the cartilage thickness (Cohen et al., 1999). This might result in segmentation errors of the geometry. The patellar geometries of test Comp1 and Comp4 does not display such small curvatures within the acquired image stacks, and thus results in less deviation at the non-contacting areas of the patellar surface. Therefore, further MR-acquisition should be performed using less anisotropic voxels with the same in-plane resolution even though this would result in an increased acquisition time. Morphological cartilage properties, such as volume and mean thickness, clearly dependent on the number of segmented MR-images and their location within the tissue. However, we segmented the same number of MR-slices and detected only negligible out-of-plane translations of the patella (<0.3 mm with slice thickness 1.4 mm) before and at the end of the compression for each test. Consequently, the determined volume changes are accurate and comparable parameters, reflecting the deformational behavior of the tissue and not the volume loss due to shifting of the object. Hence, the comparison of the changes in mean thickness and particularly in the volume before compression (_00), at the end of compression (_end), and after load removal (_post) might enable to draw conclusions about the functional behavior of articular cartilage. We observed that, in contrast to the patellar cartilage samples with intact surfaces, the patellar
69

cartilage of test Comp3 with defects on the cartilage surface (Figure 4-18) regained its initial geometry already 5 minutes after the removal of the load. The two cuts on the superficial zone of this sample were generated accidentally during preparation of the sample, whereas the third anomaly was diagnosed as healed defect.
Figure 4-18: Image of the cartilage surface from test Comp3. The superficial defects are marked with white arrows and the healed defect with a grey arrow. Setton et al. (1993) have shown the importance of the superficial zone for the compressive behavior. They reported that defects in the surface result in a higher permeability of the tissue. The increased permeability prevents the restriction of the fluid exudation and the increase in interstitial fluid pressurization, which was detected as dominant mechanism of load support in intact specimen. Thus, these surface defects have a noticeable influence on the creep behavior of the tissue. Articular cartilage with superficial defects, as investigated in this study, might be detected based on the relaxation of the deformed surface after removal of the load. We observed that cartilage with two synthetically generated defects similar to fibrillated surfaces result in a fast and complete recovery of the mean thickness and volume to the values before compression. The mean compressive moduli calculated from equation 4-2 varied around 4.8 MPA for the healthy and 1.8 MPa for the degenerated cartilage. Analysis of the morphological data from Herberhold et al. (1999) showed that the mean compressive moduli varied between 1.6 and 3.0 MPa with a mean of 2.3 MPa for the six tested intact human cadaveric knee joints. The Young’s modulus of human patellar cartilage from conventional mechanical tests are reported to be ~0.56 MPa, calculated from unconfined compression tests (Korhonen et al., 2002; Kurkijarvi et al., 2004) and 0.83±0.21 MPa from indentation test (Korhonen et al., 2002). Consequently, the mean compressive moduli are about three times the local moduli from indentation test for both the equine and the human patellofemoral compression (1.6 MPa to 4.8 MPa and 0.8 MPa to 2.3 MPa, respectively). It seems that the roughly estimated compressive modulus, which is in the
70

range of the results from the inverse FE approach (shown below), might be applicable to assess the Young’s moduli from volumetric changes during compression. In summary, the analysis of the deformational data might serve as useful mean to assess the intactness of the superficial zone and to calculate a rough estimation of the compressive cartilage stiffness. However, further investigation has to validate this preliminary observation.
4.3.4 Inverse FE Approach
For the linear elastic material the chosen 2-step Gauss-Newton optimization resulted in highly accurate material properties independent of starting properties in the range of 0.68 and 8.30 MPa for the Young’s modulus and 0.11 to 0.41 for the Poisson’s ratio. The Young’s modulus was slightly overestimated by about 1.5% for the soft and the hard cartilage, and the Poisson’s ratio was slightly underestimated by about 7% for the hard cartilage. Thus, for the linear elastic material model, the Young’s modulus can be calculated with a high accuracy, whereas the estimation of Poisson’s ratio might be considerably inaccurate. The sensitivity analysis for the linear elastic material model revealed that the Young’s modulus is only slightly sensitive to the three input parameters, the applied load, the segmentation and the registration process. For the tested load error between ±5% of the applied 400 N, the calculated Young’s modulus displays errors within this range, with a slight shift to higher values. A 5% overestimation of the effective load on the patellofemoral joint results in a Young’s moduli being 4% smaller than the exact value (Figure 4-15), whereas an underestimation of the applied load results in an overestimated E-Moduli by 6%. For a load error of less than ±1% originating from the compression device the error of the Young’s modulus varies between +0.4 and +2.6% (including the inaccuracy of the optimization algorithm of about 1.5%). The Poisson’s ratio is insensitive to the loading error, but has a slightly higher error for the hard (~8%) than for the soft cartilage (~5%). The error in the Young’s modulus due to limited reproducibility of the segmentation is in the range of the optimization inaccuracy for the soft material (~1.5%), whereas the hard material is slightly more sensitive to segmentation errors (up to 3%). This arises from the lower deformation of the stiffer material. The higher the deformation of the material is, the more accurate is the result. The Poisson’s ratio shows similar errors than the loading error and the segmentation inaccuracy of about -7%. In general, the Poisson’s ratio can be determined less accurately than the Young’s modulus. The error due to inaccurate registration is dependent on the geometry of the patellar and femoral cartilage. For investigated geometry studied here, the maximal error of the Young’s modulus was about +5.8%, with a registration error of 0.5 mm in the z-direction (image depth). A theoretical worst case scenario, combining the “worst” segmentation with a load error of -0.5 N and a translation of the patella by 0.2 mm in plane, results in a slight overestimation of the Young’s modulus of ~3% for the soft and the hard cartilage. In summary, the inverse FE approach is able to calculate the Young’s Modulus and the Poisson’s ratio from the patellofemoral compression experiments within an error of about +3% and -10%.
71
The error mainly arises from inaccuracies of the geometry of the cartilage model (segmentation error), from the inaccurate modelling of the contact between patella and femur (registration error) and only minor from the loading error. The moderate sensitivity of the Young’s modulus to the applied load and the calculated Young’s moduli allows the use of this method for an in vivo application with a more vague loading condition than in an idealized in vitro setup. In the preliminary in vivo study we observed that the patellar bone cannot be fixed and restrained in vivo as defined as done in this study. We detected a patellar drift in proximal or distal direction, depending on the relative movement of the subject to the compression apparatus. This patellar translation resulted in variable loading of the patellar ligament and consequently in a reduction of the effective load for patellar cartilage compression. However, if we allowed for an error reduction of the applied load due to the undefined elongation of the patellar ligament and the joint capsule we would still be able to calculate a Young’s modulus with an error of 5%.
4.3.5 Mechanical Assessment using the Inverse FE Approach
The cartilage surface area, which was used for optimization (reduced versus whole, Table 4-11), does not have a major influence on the calculated result for the linear elastic material. Segmentation errors, mainly appearing at the boundaries of the cartilage, do only have an effect on the mechanical properties of less than 5%. This is slightly higher than the above calculated theoretical sensitivity ranging from 1.7% for the soft material to 3.4% of the hard material. The exclusion of the error-prone geometries at the cartilage borders increases the accuracy of the Young’s modulus, but not of the Poisson’s ratio. For the nonlinear elastic material the initial bulk modulus K showed a clear influence on the starting value. The optimization algorithm, which was designed for the linear elastic material model, is not robust for the bulk modulus of the hyperelastic model and gives inaccurate results of the Poisson’s ratio for the linear elastic material. This result is not surprising since both parameters reflect the “compressibility” of the material: the Poisons’ ratio is a measure of the lateral expansion during compression whereas the bulk modulus is a measure of the compressibility of the material. Since the positive bulging for a compressible material is very low (<<0.1 mm, calculated numerically with ν = 0.1) this deformation cannot be detected using MRI. The same conclusion holds for the bulk modulus. However, with a reported accuracy of 150 μm of the patellar cartilage surface measurements using MRI (Cohen et al., 1999) we are able to distinguish between Young’s moduli with a difference of 30% (4.2.4.7). This accuracy was determined for a voxel size of 0.47 x 0.47 x 1 mm3. Reduction of the voxel size results in a higher (topographical) accuracy of the method because the accuracy of a measurement system is dependent on the resolution. According to Kauffmann et al. (Kauffmann et al., 2003) the position of a cartilage boundary can be located approximately within ½ pixel size. Thus, the herein used pixel size of 0.25x0.25 mm enables an accuracy of about 100 μm in detecting the cartilage surface. This allows to distinguish between Young’s moduli with 20% difference and consequently to distinguish between healthy and moderately degenerated articular cartilage in the early stage of the osteoarthritis process (Knecht et al., 2006). A further improvement of the voxel size and the signal intensity may even allow
72
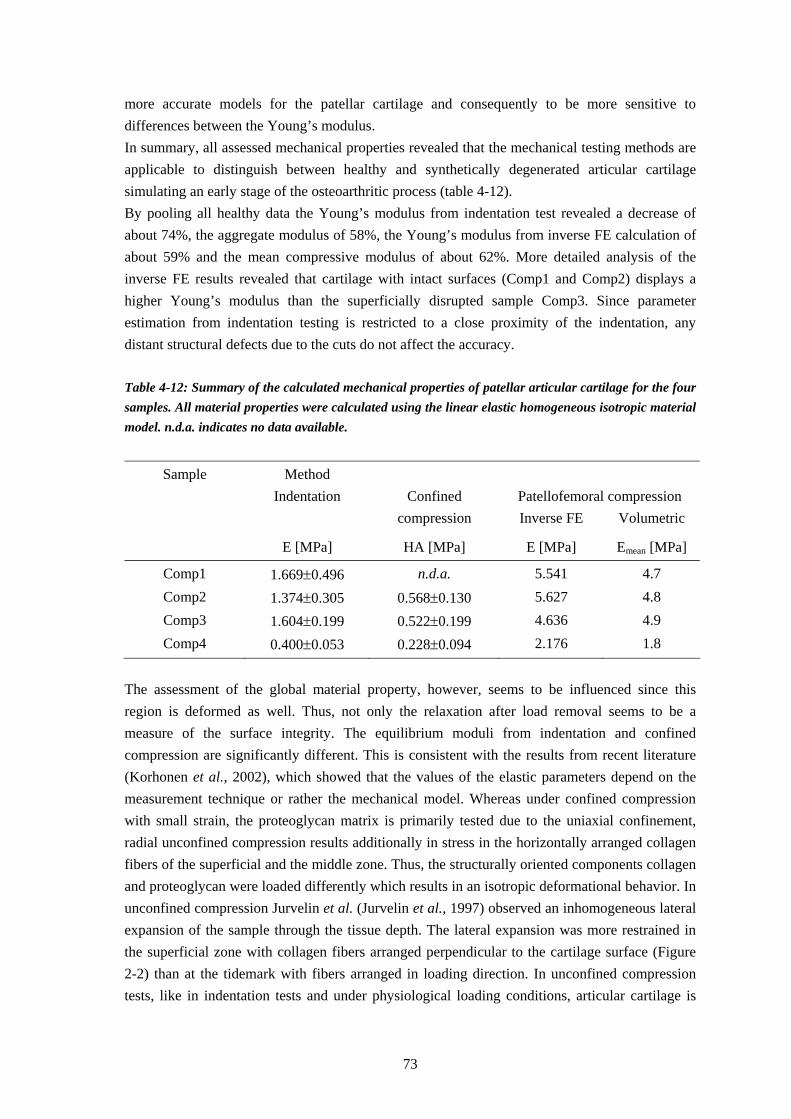
more accurate models for the patellar cartilage and consequently to be more sensitive to differences between the Young’s modulus. In summary, all assessed mechanical properties revealed that the mechanical testing methods are applicable to distinguish between healthy and synthetically degenerated articular cartilage simulating an early stage of the osteoarthritic process (table 4-12). By pooling all healthy data the Young’s modulus from indentation test revealed a decrease of about 74%, the aggregate modulus of 58%, the Young’s modulus from inverse FE calculation of about 59% and the mean compressive modulus of about 62%. More detailed analysis of the inverse FE results revealed that cartilage with intact surfaces (Comp1 and Comp2) displays a higher Young’s modulus than the superficially disrupted sample Comp3. Since parameter estimation from indentation testing is restricted to a close proximity of the indentation, any distant structural defects due to the cuts do not affect the accuracy. Table 4-12: Summary of the calculated mechanical properties of patellar articular cartilage for the four samples. All material properties were calculated using the linear elastic homogeneous isotropic material model. n.d.a. indicates no data available.
Sample Method Indentation Confined Patellofemoral compression compression Inverse FE Volumetric
E [MPa] HA [MPa] E [MPa] Emean [MPa]
Comp1 1.669±0.496 n.d.a. 5.541 4.7 Comp2 1.374±0.305 0.568±0.130 5.627 4.8 Comp3 1.604±0.199 0.522±0.199 4.636 4.9 Comp4 0.400±0.053 0.228±0.094 2.176 1.8
The assessment of the global material property, however, seems to be influenced since this region is deformed as well. Thus, not only the relaxation after load removal seems to be a measure of the surface integrity. The equilibrium moduli from indentation and confined compression are significantly different. This is consistent with the results from recent literature (Korhonen et al., 2002), which showed that the values of the elastic parameters depend on the measurement technique or rather the mechanical model. Whereas under confined compression with small strain, the proteoglycan matrix is primarily tested due to the uniaxial confinement, radial unconfined compression results additionally in stress in the horizontally arranged collagen fibers of the superficial and the middle zone. Thus, the structurally oriented components collagen and proteoglycan were loaded differently which results in an isotropic deformational behavior. In unconfined compression Jurvelin et al. (Jurvelin et al., 1997) observed an inhomogeneous lateral expansion of the sample through the tissue depth. The lateral expansion was more restrained in the superficial zone with collagen fibers arranged perpendicular to the cartilage surface (Figure 2-2) than at the tidemark with fibers arranged in loading direction. In unconfined compression tests, like in indentation tests and under physiological loading conditions, articular cartilage is
73

subjected to both compressive strains normal to the articular surface and tensile strains tangential to the articular surface. Whereas the compressive loads are predominantly supported by the proteoglycans, the collagen fibrils carry mainly the tensile strains. Since these components are anisotropically distributed and arranged the structure-function relationship can be modelled more accurately using transversal anisotropic models (Cohen et al., 1993; Cohen et al., 1998), fibril reinforced models (Li et al., 2000), or microstructural models which account for the complex interplay between the components in articular cartilage (Quinn et al., 2006). Especially the model of Quinn and colleagues allows for investigating cartilage structure-function relationships from measurable quantities at the microscale. Nevertheless, even the simple linear elastic model enables to detect differences between healthy and degenerated cartilage.
4.3.6 Problems and Limitations
Differentiation between the two contacting areas was not always clearly detectable during compression. In contrast to the MR-images of Herberhold and co-workers (Herberhold et al., 1999), in which a clearly visible boundary between femoral and patellar cartilage was recognizable, we could not differentiate the two tissues in all regions. However, a brighter area was visible at the cartilage contact areas, which was assumed to be the separating border of the tissue. Adaptation of the MR-sequence of Herberhold may probably overcome this. Neither the Poisson’s ratio from linear elastic models nor the bulk modulus from hyperlastic models can be calculated by means of this approach. In contrast to the Young’s modulus, these two parameters were not reported to be sensitive on degenerative processes and consequently not appropriate for the assessment. However, due to the (expected) large individual differences in Young’s modulus between subjects, this method might only allow longitudinal studies to detect time-dependent degenerative or adaptive processes. This has to be investigated in further studies. Moreover, the method is restricted to subjects without clinically detected and progressed OA to prevent excessive strain and consequently possible further destruction of the cartilage. This method might be applicable especially for the detection of (positive) adaptive processes that would come with physiotherapeutic treatments or changes in the loading regime. Therefore, the greatest challenge for the in vivo application is the improvement of the loading apparatus that would allow a more comfortable loading of the patellofemoral joint for at least 1 h.
74

Chapter 5 Assessment of Tissue Engineered
Cartilage


From a biomechanical point of view on cartilage tissue engineering, there exist numerous interesting research fields in this interdisciplinary field of biology, medicine, pharmacy, material science, and engineering. One challenging tasks of biomechanics is to understand and improve the mechanotransduction, the way cells convert mechanical stimuli into biochemical signals to generate an environment for the chondrocytes to differentiate and proliferate as in vivo. This can be realized by appropriate loading while growth in vitro and by well-designed scaffold materials. Furthermore, the engineered grafts have to be characterized mechanically to ensure that they withstand the loads in vivo and the handling while surgery. Another so far neglected research is the stable and enduring fixation of the tissue engineered implants in the defect to enable the adherence into the surrounding tissue. Both, the mechanical characterization of a novel implant and the primary fixation stability will be presented in this chapter.
5.1 Mechanical Characterization of Tissue Engineered Articular Cartilage from Mesenchymal Stem Cells
Excerpt from: S. Hofmann, S. Knecht, G. Vunjak-Novakovic, R. Langer, E. Stussi, D. L. Kaplan, HP. Merkle, L. Meinel. Cartilage-like Tissue Engineering Using Silk Scaffolds and Mesenchymal Stem Cells. Tissue Engineering, accepted.
5.1.1 Introduction
Silk fibroin scaffolds were studied as a new biomaterial option for tissue engineered cartilage like tissue. Human bone marrow derived mesenchymal stem cells (MSC) were seeded on silk, collagen, and cross-linked collagen scaffolds and cultured for 21 days in serum free chondrogenic medium. Cells proliferated more rapidly on the silk fibroin scaffolds when compared to the collagen matrices. Biochemical analysis showed that the total content of glycosaminoglycan (GAG) deposition was three times higher on silk as compared to collagen scaffolds. GAG deposition coincided with overexpression of type II collagen and aggrecan genes. Furthermore, histological observation revealed that cartilage-like tissue was homogeneously distributed throughout the entire silk scaffolds, while on the collagen and cross-linked collagen systems tissue formation was restricted to the outer rim leaving a doughnut appearance. Round or angular-shaped cells resided in deep lacunae in the silk systems and stained positively for type II collagen.
77

5.1.2 Mechanical Testing and Analysis
Specimens for mechanical testing were punched from the central regions of the engineered cartilage tissue on silk scaffolds and on silk scaffolds cultured under the same conditions but without cells using a biopsy punch (Stiefel Laboratorium, Germany). The cylindrical plugs were tested in confined compression using a mechanical testing system (EnduraTec ELF 3200, Bose Corporation, Minnetonka, MN) with a 22 N low force cell (Model 31, Honeywell Sensotec, Columbus, OH). Each specimen was transferred into a smooth confining chamber (diameter 3.62 mm) and loaded with a porous sintered filter (diameter 3.54 mm, pore size 45 μm, porosity 45%, Schunk Sintermetalltechnik, Germany) in PBS. The indentation site was the top layer of the engineered cartilage specimen. Thickness of the samples was measured after equilibration under a tare load of 0.02 N. Strains of 5%, 10% and 15% were applied in a stepwise manner at a rate of V = 1 m/s with 1800 s relaxation after each step. The aggregate modulus HA was calculated from the slope of the best linear fit of the equilibrium stress plotted against the applied strain.
5.1.3 Results
The elastic modulus increased from 0.02 MPa for the unseeded silk scaffolds after 21 days of incubation in culture medium to 0.04 MPa for the tissue engineered cartilage on silk scaffolds after 21 days of culture (p<0.05; Figure 5-1). The mechanical properties of collagens scaffolds were not assessed due to advanced biodegradation which resulted in shrinkage and disintegration. Constructs based on cross-linked collagen scaffolds were assessed but demonstrated large within-group variability; excluding conclusions in terms of mechanical properties for this material (data not shown).
Figure 5-1: Thickness (left) and aggregate modulus (right) of unseeded silk scaffolds and tissue-engineered cartilage-like tissue after 21 days in culture medium. (p<0.05)
78

5.1.4 Discussion
The biomechanical, histological immunohistochemical and biochemical data of this study suggest that the nature of the substrate is important in terms of interactions with media components, and this interaction can significantly impact tissue-related outcomes. In the present study, the combination of silk fibroin scaffolds with serum free medium was superior to the collagen based materials in terms of cartilage-related outcomes. In principle, such differences could stem from variations in surface area between silk and collagen based scaffolds. Tissue engineered implants for cartilage repair must have adequate mechanical integrity to withstand implantation procedures including handling, as well as the mechanical forces typically experienced at joint surfaces. Typically, aggregate moduli of native hyaline cartilage are reported to range from 0.53–1.82 MPa as a function of harvest location and species (Athanasiou et al., 1991). The aggregate modulus of the tissue engineered cartilage reported here is one order of magnitude lower. Future studies are aimed at closing this gap through the use of rotating bioreactors to facilitate nutrient, gas, and metabolite exchange to increase the levels of new ECM production, as well as the use of mechanical stimuli during culture with more advanced bioreactors.
5.2 Mechanical Testing of Fixation Techniques for Scaffold-based Tissue Engineering Grafts
Reprinted from: S. Knecht, C. Erggelet, M. Endres, M.Sittinger, C. Kaps, E. Stüssi. Mechanical testing of fixation techniques for scaffold-based tissue-engineering grafts. Submitted to: Journal of Biomedical Material Research, Part B: Applied Biomaterials.
5.2.1 Introduction
Autologous Chondrocyte Implantation (ACI) is a promising technique to restore the functional property of articular cartilage (AC) in full-thickness defects. First clinical experiences with a suspension of cultured autologous chondrocytes beneath a sealed periosteal flap were published in 1994 (Brittberg et al., 1994). Since then, thousands of ACI were applied (Browne et al., 2005) and chondrocyte fixation was improved by the replacement of the periostal flap with biodegradable materials like collagen sheets. Alternatively to this 2-dimensional approach, one aims at mimicking the natural in vivo environment of the chondrocytes with bioresorbable 3-dimensional matrices for scaffold-based tissue engineering. Such scaffolds provide a better initial mechanical stability, homogeneous cell distribution and improved tissue differentiation compared to 2D systems (Sittinger et al., 2004). Various natural (Dorotka et al., 2005; Meinel et al., 2004) and synthetic (Barnewitz et al., 2006) biomaterials have been shown to be suitable for
79

scaffold-based cartilage tissue engineering and to promote repairing and resurfacing of articular cartilage defects. Their biochemical, histological, chondrogenic, immunohistochemical, and structural properties in vitro have been thoroughly investigated and optimized. However, for successful clinical application the tissue-engineered implants have to possess additionally an adequate stability to withstand handling during implantation as well as loading in vivo and to enable a secure primary fixation as well as a stable and permanent integration into the surrounding tissues. At present, the mechanical properties of tissue-engineered cartilage implants are about one order of magnitude lower than native articular cartilage (Grad et al., 2003). However, these properties enable the surgical handling while implantation. Furthermore, a significant gain in mechanical quality can be observed in vivo (Duda et al., 2000). The integration of the implant to the surrounding cartilage is dependent on the adjacent tissue architecture, its composition and transport properties (Tognana et al., 2005) and might be influenced by enzymatic treatment (van de Breevaart Bravenboer et al., 2004) and the developmental stage of the cartilage (DiMicco et al., 2002). Furthermore, without a stable and enduring fixation of the implant, its integration into the surrounding tissue might not be achieved. If the fixation of the sample fails in vivo and the scaffold gets detached partially or even completely the loose body in the joint might accelerate the degenerative process. Cartilage transplants are fixed in open procedures or arthroscopically (Erggelet et al., 2003) into carefully debrided defects by press-fitting, suturing, gluing or pinning. Osteo-chondral transplants enable the direct integration into the bone by press fitting of the samples similar to the mosaic arthroplasty technique (Hangody et al., 2003). In ACI, Driesang and Hunziker reported the delamination of the periosteal flaps in an animal study even after an immobilization time for 2-6 weeks (Driesang et al., 2000). Without immobilization, all flaps were detached. In a clinical study of matrix-induced autologous chondrocyte implantation, two of 16 patients showed a partial or complete detachment of the graft fixed with fibrin glue in an early postoperative stage (Marlovits et al., 2005). The importance of the (primary) fixation of the tissue engineered articular cartilage is well known (Sittinger et al., 1999), but to date, only few studies exist that deal with fixation techniques and their mechanical properties. Recently, Drobnic and colleagues (Drobnic et al., 2006) reported the first systematic analysis of the stability of primary fixation for cartilage tissue engineering grafts. They investigated different fixation techniques for collagen fleeces in a cadaveric study by continuous passive motion (CPM) of the tibiofemoral joint with and without load to simulate the initial postoperative period. However, they focused on clinically relevant parameters such as incision length, operative time, and cost of the fixation material. The collagen scaffold fixation was only assessed qualitatively based on the integrity of the scaffold, the area coverage and the manually tested fixation strength of the sample after CPM. The aim of the present study was to quantify and compare the primary fixation stability of commonly used biomaterials for autologous chondrocyte implantation attached by different fixation techniques in vitro. We tested two different synthetic 3-dimensional scaffolds, a collagen-membrane and a gel-like matrix material which represent the numerous biomaterials used in cartilage tissue engineering and clinically applied in cartilage repair.
80

5.2.2 Material and Methods
Sample Preparation Bovine patellas were obtained from the Institute of Veterinary Pathology at the University of Zurich and from the local abattoir and stored frozen at -20°C until the day of testing. After optical assessment of the articular cartilage, the surrounding tissue was removed and the patellas were embedded in acrylic resin (Beracryl, Suter-Swiss composite Group, Fulenbach, Switzerland) to ensure rigid fixation during the test. To moisten the tissue during preparation the cartilage surface was covered with tissue paper soaked in phosphate buffered saline (PBS). Rectangular (15x10 mm2) full-thickness cartilage defects down to the subchondral bone were cut using a scalpel on the lateral facet of the proximal patella. The thickness of the surrounding cartilage rim varied between 1.6 and 3.9 mm. Preparation and Fixation of the Scaffolds Since we aimed at analyzing the mechanical properties of the fixation technique and not of the cartilage grafts, all tests were performed without cultured chondrocytes. Besides, the materials were treated according to the instructions of the manufacturer. A co-polymer fleece of polyglactin and polydioxanon (PGLA, Ethicon, Johnson&Johnson, Germany) with a thickness of 2.2 mm was soaked in fibrinogen-solution [33% (v/v) (Tissucol, Baxter, Heidelberg, Deutschland) in Ham’s F12 medium (Biochrom, Germany) containing 10% human serum]. Fibrinogen was polymerized by adding thrombin (1:10 in PBS, Tissucol, Baxter, Germany) and stored in PBS for 2 days after fabrication. The polyglycolic acid fleece (PGA, alphaResearch Switzerland GmbH, Germany) with a thickness of 1.1 mm was conditioned in phosphate buffered saline (PBS) (Sigma Aldrich, Buchs, Switzerland) for 5 min prior to fixation. The collagen membrane (BioGide, Geistlich Biomaterials, Baden-Baden, Germany) was sutured dry and soaked in PBS for 5 min prior to testing according to clinical practice. The BD Matrigel™
Basement Membrane Matrix, a representative of the gel-like matrices, was thawed and transferred into the defect with a spatula. An overview of the scaffolds and the fixation techniques used in this study is given in table 5-1. Table 5-1: Summary of the tested combinations of scaffolds with the fixation techniques.
Scaffold material Type of fixation Unfixed
(UF)
Fibrin glue (FG)
Transosseous suture (OS)
Chondral suture (CS)
PGLA-scaffold X X X X PGA-scaffold X X X X Collagen Membrane X X c.n.a. X BD Matrigel™ Matrix X c.n.a. c.n.a. c.n.a.
c.n.a. - clinically not applied
81

For the unfixed testing (UF) the scaffold was placed directly onto the subchondral bone without additional material. For the fixation with fibrin (FG), the fleece and the membrane were fixed into the clamping mechanism prior to testing. We applied 0.2 ml of the two-component fibrin sealant (Tissucol Duo, Baxter, Heidelberg, Deutschland) onto the subchondral bone and the surrounding cartilage rim of the cartilage defect. The clamped samples were pressed into the defect for 4 min and fixed to the testing machine. Cartilage-suture fixation (CS) was performed according to clinical practice(Brittberg et al., 1994; Erggelet et al., 2000). The scaffold was placed into the defect and sutured to the cartilage rim with eight interrupted stitches (PDS 6-0, Ethicon, Johnson&Johnson, Germany) at a distance of approximately 4 mm from each other. Transosseous suture (OS) fixation was performed in all four corners of the cartilage defect as described previously by Erggelet and colleagues(Erggelet et al., 2003). However, we had to drill the holes using a conventional drill bit (1.5 mm in diameter) before using the Kirschner-wires (1.7 mm in diameter) to expand the holes since the acrylic resin was too strong and ductile for the wires. The scaffolds were armed on their corners by means of a resorbable thread (Vicryl 2-0, Ethicon, Johnson&Johnson, Germany) with a three-fold knot to secure the sling and an additional sling to pull the scaffold into the defect. Mechanical Testing To assure reproducible fixation of the scaffolds the samples were clamped between two defined rough surfaces (Figure 5-2 C).
C
Sample
Top
Bottom
AClamping
mechanism
Moving load cell Fixed patella
Crosshead speed
50 mm/min
B
Figure 5-2: Image of the mechanical testing setup with the moving crosshead, the fixed patellar and the clamping mechanism to attach the sample to the load cell (A). Enlarged section (B) and exploded view (C) of the clamping mechanism with the sample between bottom and top holder.
82

Preliminary tests showed that this method enables a form-locking fixation of the porous scaffold material (PGA- and PGLA fleece) and improves the friction-locked fixation of the collagen membrane without impairment of the sample up to an expected load of 40 N. Using a spacer between the bottom and top holder the PGA- and PGLA scaffolds were clamped with approximately 20% strain. Uniaxial tensile tests until failure of the fixed scaffolds were performed parallel to the subchondral bone using a Zwick Material testing machine (Zwick Z2.5, Zwick, Ulm, Germany) with a 50 N load cell (KAP-S, Angewandte System Technik AST, Wolnzach, Germany). The patellar samples were transferred to the mechanical testing machine and the subchondral bone surface was aligned to the direction of the machine axis. The fixed samples were loaded with a crosshead speed of 50 mm/min (Figure 5-2 A, B). To characterize the fixation stability of the scaffolds, the ultimate tensile load and the type of failure were assessed. Statistical Analysis Maximal load is displayed as mean ± standard deviation for five samples per group unless otherwise noted. Data were analyzed statistically using a (two-way) ANOVA followed by a post-hoc assessment applying the Tukey's HSD method in Systat (Systat Software, Inc., Point Richmond, USA). Differences were considered significant at p < 0.05.
5.2.3 Results
The maximal load of the unfixed samples was determined by the frictional force between the bottom holder of the clamping mechanism and the subchondral bone (0.10 ± 0.05 N). The bottom holder glued to the bone withstood the crosshead movement up to 0.18 ± 0.08 N (n=3). The clamping mechanism was capable of fixing the synthetic PGA and PGLA scaffolds up to a load of 28.55 ± 10.11 N and for the collagen membrane to a load of 5.35 ± 1.85 N. To test the failure behavior of the collagen membrane fixed by chondral suture (Figure 5-3 C) and the transosseous fixed PGA scaffold (Figure 5-3 I) with higher failure loads, the above mentioned clamping mechanism was improved by a surgery clamp (Figure 5-3 D and J). Analysis of the influence of the material on the fixation stability revealed that the PGA-scaffold could be loaded highest until failure for all fixation techniques compared to the PGLA-scaffold and collagen membrane. Regarding the failure of the fixation technique independent of the scaffold material, fibrin glued fixations withstood a load up to 2.18 ± 0.47 N and chondral sutures withstood significantly higher load of 26.29 ± 1.55 N (Figure 5-4) at which sutures were torn out from the surrounding articular cartilage (Figure 5-3 H). The knots of the transosseous fixation were torn out from the subchondral bone (Figure 5-3 J) at significantly higher load of 38.18 ± 9.53 N. Performing the analysis of variance for all maximal loads but the (error-polluted) transosseous fixed scaffold results in significant difference between fibrin glued samples and unfixed samples (Figure 5-4).
83
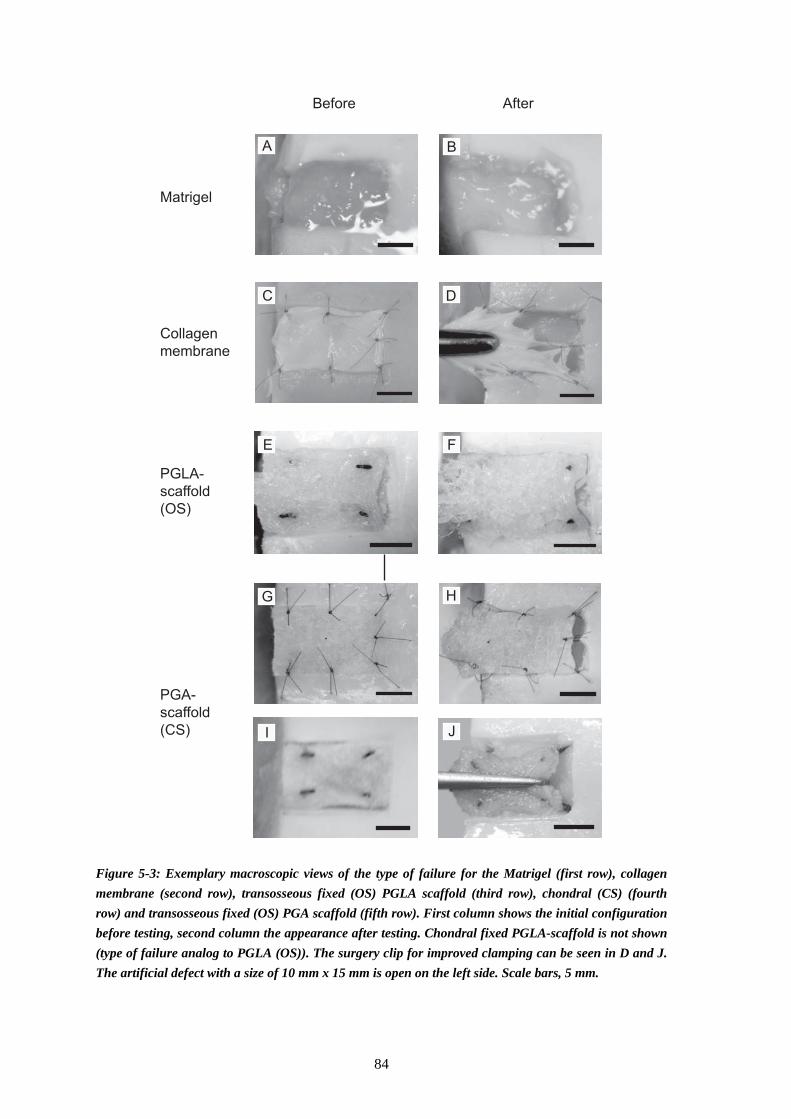
Before After
Matrigel
Collagen
membrane
PGLA-
scaffold
(OS)
PGA-
scaffold
(CS)
A B
F
G
DC
E
H
I J
Figure 5-3: Exemplary macroscopic views of the type of failure for the Matrigel (first row), collagen membrane (second row), transosseous fixed (OS) PGLA scaffold (third row), chondral (CS) (fourth row) and transosseous fixed (OS) PGA scaffold (fifth row). First column shows the initial configuration before testing, second column the appearance after testing. Chondral fixed PGLA-scaffold is not shown (type of failure analog to PGLA (OS)). The surgery clip for improved clamping can be seen in D and J. The artificial defect with a size of 10 mm x 15 mm is open on the left side. Scale bars, 5 mm.
84
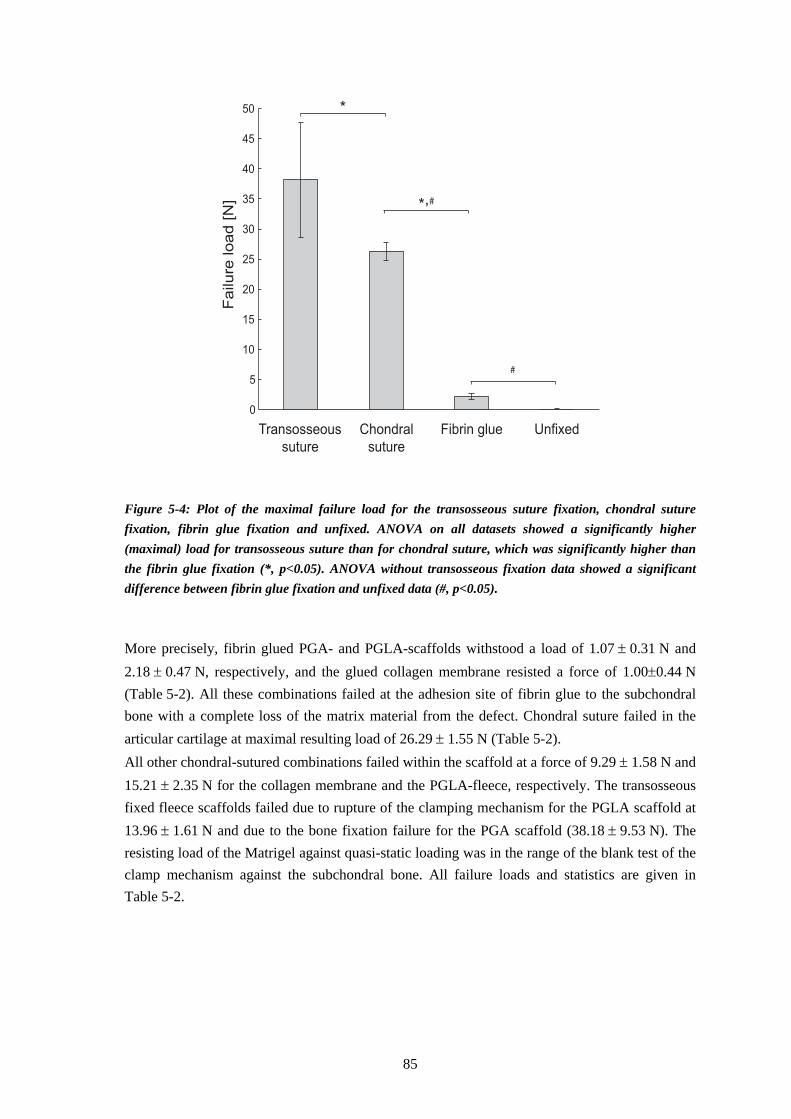
0
5
10
15
20
25
30
35
40
45
50
Failure
load [N
]
Transosseous
suture
Chondral
suture
Fibrin glue Unfixed
*
*,#
#
Figure 5-4: Plot of the maximal failure load for the transosseous suture fixation, chondral suture fixation, fibrin glue fixation and unfixed. ANOVA on all datasets showed a significantly higher (maximal) load for transosseous suture than for chondral suture, which was significantly higher than the fibrin glue fixation (*, p<0.05). ANOVA without transosseous fixation data showed a significant difference between fibrin glue fixation and unfixed data (#, p<0.05).
More precisely, fibrin glued PGA- and PGLA-scaffolds withstood a load of 1.07 ± 0.31 N and 2.18 ± 0.47 N, respectively, and the glued collagen membrane resisted a force of 1.00±0.44 N (Table 5-2). All these combinations failed at the adhesion site of fibrin glue to the subchondral bone with a complete loss of the matrix material from the defect. Chondral suture failed in the articular cartilage at maximal resulting load of 26.29 ± 1.55 N (Table 5-2). All other chondral-sutured combinations failed within the scaffold at a force of 9.29 ± 1.58 N and 15.21 ± 2.35 N for the collagen membrane and the PGLA-fleece, respectively. The transosseous fixed fleece scaffolds failed due to rupture of the clamping mechanism for the PGLA scaffold at 13.96 ± 1.61 N and due to the bone fixation failure for the PGA scaffold (38.18 ± 9.53 N). The resisting load of the Matrigel against quasi-static loading was in the range of the blank test of the clamp mechanism against the subchondral bone. All failure loads and statistics are given in Table 5-2.
85
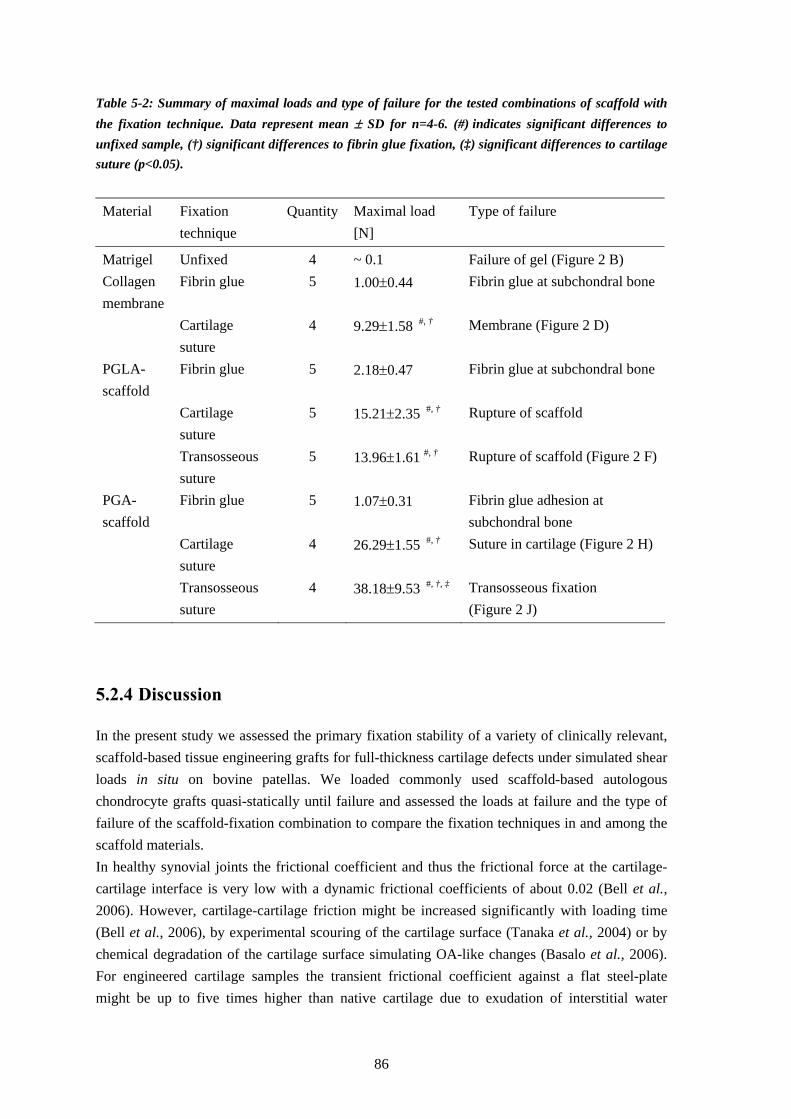
Table 5-2: Summary of maximal loads and type of failure for the tested combinations of scaffold with the fixation technique. Data represent mean ± SD for n=4-6. (#) indicates significant differences to unfixed sample, (†) significant differences to fibrin glue fixation, (‡) significant differences to cartilage suture (p<0.05).
Material Fixation technique
Quantity Maximal load [N]
Type of failure
Matrigel Unfixed 4 ~ 0.1 Failure of gel (Figure 2 B) Collagen membrane
Fibrin glue 5 1.00±0.44 Fibrin glue at subchondral bone
Cartilage suture
4 9.29±1.58 #, † Membrane (Figure 2 D)
PGLA-scaffold
Fibrin glue 5 2.18±0.47 Fibrin glue at subchondral bone
Cartilage suture
5 15.21±2.35 #, † Rupture of scaffold
Transosseous suture
5 13.96±1.61 #, † Rupture of scaffold (Figure 2 F)
PGA-scaffold
Fibrin glue 5 1.07±0.31 Fibrin glue adhesion at subchondral bone
Cartilage suture
4 26.29±1.55 #, † Suture in cartilage (Figure 2 H)
Transosseous suture
4 38.18±9.53 #, †, ‡ Transosseous fixation (Figure 2 J)
5.2.4 Discussion
In the present study we assessed the primary fixation stability of a variety of clinically relevant, scaffold-based tissue engineering grafts for full-thickness cartilage defects under simulated shear loads in situ on bovine patellas. We loaded commonly used scaffold-based autologous chondrocyte grafts quasi-statically until failure and assessed the loads at failure and the type of failure of the scaffold-fixation combination to compare the fixation techniques in and among the scaffold materials. In healthy synovial joints the frictional coefficient and thus the frictional force at the cartilage-cartilage interface is very low with a dynamic frictional coefficients of about 0.02 (Bell et al., 2006). However, cartilage-cartilage friction might be increased significantly with loading time (Bell et al., 2006), by experimental scouring of the cartilage surface (Tanaka et al., 2004) or by chemical degradation of the cartilage surface simulating OA-like changes (Basalo et al., 2006). For engineered cartilage samples the transient frictional coefficient against a flat steel-plate might be up to five times higher than native cartilage due to exudation of interstitial water
86

(Morita et al., 2006) and thus due to the reduction of lubrication. Reaction force of about 560 N might occur within a patellofemoral joint of a subject of 75 kg during free walking (Heino Brechter et al., 2002) or of about 2200 N during stair descent (Brechter et al., 2002). With a low frictional coefficient of about 0.02, this might result in shear loads of 11 N while free walking or of 44 N while stair descent. These superficial in vivo shear loads are in the range of the failure loads shown in this study for polymer-based (PGA and PGLA) and collagen scaffolds fixed by osseous or chondral sutures. However, a roughened subchondral bone might fix the sample additionally in vivo due to frictional forces and form locking between scaffold and bone. The presently used test-design excludes this additional fixation of the scaffold to the bone. Thus, the stability of the fixation techniques can be assessed and compared independent of the hardly controllable surface roughness. As a result, the fixation strength in vivo may be enhanced compared to these standardized conditions. Considering the fixation technique as only parameter of the maximal tolerated load, the 2-way ANOVA revealed higher load for the transosseous fixation (30.16 N) compared to the chondral suture (16.85 N) and fibrin glue fixation (1.69 N). Unfixed samples resist a load up to 0.1 N. However, this fixation technique without any anchorage of the sample is dependent on the press fitting of the sample into the defect and the roughness of the subchondral bone. In this study, the patellar subchondral bone was less rough than subchondral bone of the tibia or femur observed in clinical practice, which might have reduced the load to failure. Furthermore, the defect has an open side (Figure 5-3), which reduces the press fitting compared to the in vivo conditions. However, compared to clinical observations, the defect was very well defined and surrounded by healthy AC, which might improve press fitting. Nevertheless, Drobnic et al. (2006) also observed a least stable fixation of press-fitted scaffold in their in situ cadaveric study. Therein, the press-fitted scaffolds were detached prior to 60 cycles of unloaded continuous passive motion. The fibrin glue fixation techniques withstood loads between 1 to 2.18 N, which presumably corresponds to the detachment “with minor pull” in the study of Drobnic et al. (2006). Nevertheless, fibrin glue fixation improves the maximal tolerable load until failure by a factor of 10 to 20 compared to non-fixed scaffolds. Loading the knee with 100 N and 200 N and performing passive motion resulted in detachment of the glued scaffolds. With an assumed frictional coefficient of 0.02 between femoral cartilage and scaffold, a load of 100 N and 200 N results in frictional shear forces of approximately 2 and 4 N on the surface of the scaffold, respectively. Standardization of these loads with the glued defect area of 250 mm2 results in a maximal shear stress at the scaffold-bone interface which is comparable to our results for the fibrin-soaked PGLA fleeces of 13 kPa (area=150 mm2). A more precise analysis of the maximal adhesive shear stress by considering the cartilage-cartilage interface at the surrounding cartilage rim allows the comparison of the fixation strength with other studies. For the collagen membrane the maximal shear stress over the glued area of 150 mm2 is about 6.7 kPa, for the PGA fleece with a thickness of 1.1 mm and thus a glued area of 190 mm2 about 5.9 kPa, and 9.2 kPa for the PGLA fleece with a thickness of 2.2 mm (area=238 mm2). This strength between fibrin adhesive and patellar subchondral bone is lower than the adhesive strength of a glued cartilage-cartilage interface of approximately 20 kPa after 5 min of incubation (Jurgensen et al., 1997). We observed that the fibrin glue for the PGA scaffold and the collagen membrane covered the
87
surrounding cartilage rim over the same height of about 1 mm. Thus, maximal loads and shear stresses are similar despite the different thickness of the sample. The difference between the maximal load of the PGLA- and the PGA-scaffold of approximately 1 N can be explained by the additional shear strength of the fibrin glue-cartilage interface at the cartilage rim (area=40 mm2) of 25 kPa, which is comparable to the literature. Cartilage suture fixation withstood the loads of 26.29 ± 1.55 N when the suture cut through the healthy cartilage tissue (Figure 5-3 H). One might expect this maximal load to be reduced in vivo due to degenerative disruption of the circumjacent tissue. However, with the herein applied force transmission, the collagen membrane and the PGLA scaffold failed prior to the suture. Transosseous fixation was the most stable fixation method for the 3D fleece materials in this test. The failure load was the highest for all techniques with 38 N, even for the aggravated test procedure using the surgery clip. Considering the dependence of the fixation stability on the material, the statistical analysis revealed that PGA might resist higher loads (21.8 N) compared to the collagen membrane (16.1 N) and the PGLA scaffold (10.4 N). The PBS-soaked collagen membranes display a very low friction. This complicated the fixation within the clamping mechanism for testing, but makes it even more suitable for in vivo application due to resulting lower shear stress, which are likely to be responsible for the detachment of the scaffold. Furthermore, collagen membranes and other scaffolds, which are thinner than the surrounding tissue, are shielded from superficial shear loads by the surrounding cartilage. This might increase the failure load in vivo. Limitation of this study is the “open” side of the defect (Figure 5-3) which results in decreased scaffold press fitting and reduced surrounding cartilage area for fixation. However, this simplification is adequate since the defects in clinical practice are as well not perfectly defined and the remaining articular cartilage is reduced in thickness dependent on the progression of the osteoarthritic degeneration. For the mechanical testing we reduced the in vivo stress conditions acting on biomaterials in articulating joints to mere shear stress and consequently to tension load acting on the scaffold. Furthermore, we neglected the frictional- and form locking of the scaffold occurring in vivo, which is likely to increase the failure load especially for the porous 3D-scaffolds. However, these simplifications enabled us to test commonly used biomaterials for autologous chondrocyte implantation reproducibly and to obtain and compare quantitative data of the primary-fixation stability for the first time. The data complete the clinical specifications for the implantation, such as defect size, location of the defect, or the degenerative stage of the remaining tissue and allows choosing a stable fixation technique according to the scaffold for expected in vivo loads. In the current study, we have assessed the fixation stability of four commonly used biomaterials for autologous chondrocyte implantation attached by four different fixation techniques. We showed that the transosseous fixation withstood significantly higher load than the chondral suture, the fibrin glue fixation and the unfixed positioning for all tested materials. Our findings of the quantitative comparison of the fixed scaffolds serve as a basis for selecting the most suitable fixation technique according to the expected in vivo shear loads on the implant.
88

Chapter 6 Conclusion and Outlook


Within the framework of this thesis, we investigated two approaches to prevent irreversible degenerations of articular cartilage that come along with the progression of osteoarthritis. In the first part of the thesis (chapter 4), we showed the applicability of a MR-compatible patellofemoral compression device to generated detectable deformation of the patellar cartilage with physiological loading conditions. The test was performed using equine knee joint, which are slightly reduced in thickness and slightly stiffer than human cartilage. Consequently, patellofemoral compression test with a physiologically applicable load of half of the body weight on human knee joints should result in deformation within this range, or even higher. The magnitude of the load can probably even be reduced, which would improve the comfort during in vivo application. Using this experimental data in combination with an individual FE model, we calculated the mechanical properties using an isotropic linear elastic and hyperelastic material model. In doing so, we are able to detect difference of the Young’s modulus of >30%. With an improved accuracy of the MR acquisition, we can even distinguish between patellar cartilage with differences in the Young’s moduli of >20%. This accuracy allows for the detection of early OA changes (Knecht et al., 2006). Furthermore, we observed that the morphological parameter changes, especially the overall cartilage volume, while and after compression reflects on one hand the intactness of the superficial cartilage zone and on the other hand the mechanical property of the material. However, to validate both observations, we will have to perform further tests on the patellofemoral cartilage i) with diverse synthetically generated superficial defects, mimicking cartilage fibrillation, and ii) with different degenerative stage of OA. These tests can be performed on bovine patellofemoral joints, which display spontaneous osteoarthritic degenerations (2.3). Analysis of the already acquired data during compression would make it possible to obtain additional information on the time-dependent deformational behavior of AC. However, no obvious relationship between the hydraulic permeability as time-dependent parameter and the stage of OA progression has been reported in the literature. Thus, the analysis of the femoral deformation with a sophisticated fibril reinforced or microstructural material model would result in more relevant information, for instance about the pathomechanic behavior of the patellofemoral joint. Beside the improvement for the detection of degenerative changes in the patellofemoral joint, the usability of this method for the in vivo application should be improved. The main task herein might be to improve the bracing of the leg under a pre-defined flexion angle of about 30° for more than 1 h. Since patellar cartilage is less stiff than the opposing femoral-trochlear cartilage (Froimson et al., 1997), this variability is assumed to be one reason for the earlier and more severe fibrillation and further degenerative changes of the patellar than the opposing femoral cartilage. This increased prevalence of degenerative changes was the motivation to apply the MR-controlled compression test on the patellofemoral joint. However, as the tibiofemoral joint also displays degenerative and adaptive changes, the adjustment of this method on the tibiofemoral joint might be a further improvement. Other joints might not be applicable due to the lower thickness and consequently undetectable deformation using this MR-method. Beside the diagnosis of osteoarthritic changes, the in vivo application of this method will allow investigating the hypothesis of the functional adaptation of articular cartilage based on changed loading conditions for the first time in human quantitatively and non-invasively.
91

In the second part of this work, we investigated a novel tissue engineered cartilage graft based on silk scaffolds and human mesenchymal stem cells. The mechanical testing revealed that samples display a tenfold lower aggregate modulus than native articular cartilage after 21 days of in vitro culture. However, this mechanical property still enables the handling of the sample for implantation. Dependent on the location in the joint, the low stiffness might result in excessive strain within the sample, which can result in chondrocyte death and matrix disruption. A whole-joint FE analysis of the implant within the surrounding tissue would allow the calculation of the stresses and strains and determining the requirement for tissue engineered implants. Simulating a whole gait cycle, such a 3D FE model would furthermore enable simulating the frictional forces acting onto cartilage implants in vivo. Beside the herein performed quasi-static load-to-failure test of the fixed scaffolds, a dynamical loading of the implants would give additional insights into the fatigue behavior of the scaffolds and their fixation. Furthermore, performing more physiological mechanical test with entire intact joints would allow to determine recommendation of the joint loading in the postoperative period while remobilisation of the patient.
92

References Alexopoulos LG, Williams GM, Upton ML, Setton LA, Guilak F, (2005). Osteoarthritic changes
in the biphasic mechanical properties of the chondrocyte pericellular matrix in articular cartilage. J Biomech 38, 509-17.
Anderson AE, Peters CL, Tuttle BD, Weiss JA, (2005). Subject-specific finite element model of the pelvis: development, validation and sensitivity studies. J Biomech Eng 127, 364-73.
Andresen R, Radmer S, Konig H, Wolf KJ, (1993). [MRT-specific staging of chondromalacia patellae with the aid of a special knee compressor: a comparison with the arthroscopic findings]. Rofo 159, 541-7.
Armstrong CG, Bahrani AS, Gardner DL, (1979). In vitro measurement of articular cartilage deformations in the intact human hip joint under load. J Bone Joint Surg Am 61, 744-55.
Armstrong CG, Mow VC, (1982). Variations in the intrinsic mechanical properties of human articular cartilage with age, degeneration, and water content. J Bone Joint Surg Am 64, 88-94.
Arokoski J, Jurvelin J, Kiviranta I, Tammi M, Helminen HJ, (1994). Softening of the lateral condyle articular cartilage in the canine knee joint after long distance (up to 40 km/day) running training lasting one year. Int J Sports Med 15, 254-60.
Arokoski JP, Hyttinen MM, Lapvetelainen T, Takacs P, Kosztaczky B, Modis L et al., (1996). Decreased birefringence of the superficial zone collagen network in the canine knee (stifle) articular cartilage after long distance running training, detected by quantitative polarised light microscopy. Ann Rheum Dis 55, 253-64.
Athanasiou KA, Rosenwasser MP, Buckwalter JA, Malinin TI, Mow VC, (1991). Interspecies comparisons of in situ intrinsic mechanical properties of distal femoral cartilage. J Orthop Res 9, 330-40.
Ayral X, Dougados M, Listrat V, Bonvarlet JP, Simonnet J, Amor B, (1996). Arthroscopic evaluation of chondropathy in osteoarthritis of the knee. J Rheumatol 23, 698-706.
Bank RA, Soudry M, Maroudas A, Mizrahi J, TeKoppele JM, (2000). The increased swelling and instantaneous deformation of osteoarthritic cartilage is highly correlated with collagen degradation. Arthritis Rheum 43, 2202-10.
Barnewitz D, Endres M, Kruger I, Becker A, Zimmermann J, Wilke I et al., (2006). Treatment of articular cartilage defects in horses with polymer-based cartilage tissue engineering grafts. Biomaterials 27, 2882-9.
Basalo IM, Chen FH, Hung CT, Ateshian GA, (2006). Frictional response of bovine articular cartilage under creep loading following proteoglycan digestion with chondroitinase ABC. J Biomech Eng 128, 131-4.
Bell CJ, Ingham E, Fisher J, (2006). Influence of hyaluronic acid on the time-dependent friction response of articular cartilage under different conditions. Proc Inst Mech Eng [H] 220, 23-31.
Bellamy N, Buchanan WW, (1986). A preliminary evaluation of the dimensionality and clinical importance of pain and disability in osteoarthritis of the hip and knee. Clin Rheumatol 5, 231-41.
Besl PJ, McKay ND, (1992). A method for registration of 3d shapes. IEEE Transactions on Pattern Analysis and Machine Intelligence 14, 239-56.
Biot MA, (1941). General theory of thre-dimensinal consolidation. J Appl Phys 12, 155-64. Bowen RM. Theory of Mixtures. In: Continuum Physics. Eringen AC. New York, Academic
Press (1976). 1-127. Brechter JH, Powers CM, (2002). Patellofemoral joint stress during stair ascent and descent in
persons with and without patellofemoral pain. Gait Posture 16, 115-23. Brekelmans WA, Poort HW, Slooff TJ, (1972). A new method to analyse the mechanical
behaviour of skeletal parts. Acta Orthop Scand 43, 301-17.
93
Brittberg M, Lindahl A, Nilsson A, Ohlsson C, Isaksson O, Peterson L, (1994). Treatment of deep cartilage defects in the knee with autologous chondrocyte transplantation. N Engl J Med 331, 889-95.
Brocklehurst R, Bayliss MT, Maroudas A, Coysh HL, Freeman MA, Revell PA et al., (1984). The composition of normal and osteoarthritic articular cartilage from human knee joints. With special reference to unicompartmental replacement and osteotomy of the knee. J Bone Joint Surg Am 66, 95-106.
Brommer H, Brama PA, Laasanen MS, Helminen HJ, van Weeren PR, Jurvelin JS, (2005). Functional adaptation of articular cartilage from birth to maturity under the influence of loading: a biomechanical analysis. Equine Vet J 37, 148-54.
Broom ND, (1984). The altered biomechanical state of human femoral head osteoarthritic articular cartilage. Arthritis Rheum 27, 1028-39.
Broom ND, Flachsmann R, (2003). Physical indicators of cartilage health: the relevance of compliance, thickness, swelling and fibrillar texture. J Anat 202, 481-94.
Broom ND, Poole CA, (1983). Articular cartilage collagen and proteoglycans. Their functional interdependency. Arthritis Rheum 26, 1111-9.
Brown TD, DiGioia AM, 3rd, (1984). A contact-coupled finite element analysis of the natural adult hip. J Biomech 17, 437-48.
Browne JE, Anderson AF, Arciero R, Mandelbaum B, Moseley JB, Jr., Micheli LJ et al., (2005). Clinical outcome of autologous chondrocyte implantation at 5 years in US subjects. Clin Orthop Relat Res, 237-45.
Buckwalter JA, Mankin HJ, (1998). Articular cartilage: degeneration and osteoarthritis, repair, regeneration, and transplantation. Instr Course Lect 47, 487-504.
Buckwalter JA, Mow VC, Ratcliffe A, (1994). Restoration of Injured or Degenerated Articular Cartilage. J Am Acad Orthop Surg 2, 192-201.
Burgkart R, Glaser C, Hyhlik-Durr A, Englmeier KH, Reiser M, Eckstein F, (2001). Magnetic resonance imaging-based assessment of cartilage loss in severe osteoarthritis: accuracy, precision, and diagnostic value. Arthritis Rheum 44, 2072-7.
Chan WP, Lang P, Stevens MP, Sack K, Majumdar S, Stoller DW et al., (1991). Osteoarthritis of the knee: comparison of radiography, CT, and MR imaging to assess extent and severity. AJR Am J Roentgenol 157, 799-806.
Cicuttini FM, Jones G, Forbes A, Wluka AE, (2004). Rate of cartilage loss at two years predicts subsequent total knee arthroplasty: a prospective study. Ann Rheum Dis 63, 1124-7.
Clark JM, Simonian PT, (1997). Scanning electron microscopy of "fibrillated" and "malacic" human articular cartilage: technical considerations. Microsc Res Tech 37, 299-313.
Cohen B, Gardner TR, Ateshian GA, (1993). The Influence of Transverse Isotropy on Cartilage Indentation Behavior—A Study of the Human Humeral Head. Trans Ann Meet Orthop Res Soc 18, 185.
Cohen B, Lai WM, Mow VC, (1998). A transversely isotropic biphasic model for unconfined compression of growth plate and chondroepiphysis. J Biomech Eng 120, 491-6.
Cohen ZA, McCarthy DM, Kwak SD, Legrand P, Fogarasi F, Ciaccio EJ et al., (1999). Knee cartilage topography, thickness, and contact areas from MRI: in-vitro calibration and in-vivo measurements. Osteoarthritis Cartilage 7, 95-109.
Collins DH, Mc ET, (1960). Sulphate (35SO4) uptake by chondrocytes in relation to histological changes in osteoarthritic human articular cartilage. Ann Rheum Dis 19, 318-30.
Delalleau A, Josse G, Lagarde JM, Zahouani H, Bergheau JM, (2005). Characterization of the mechanical properties of skin by inverse analysis combined with the indentation test. J Biomech,
DiMicco MA, Waters SN, Akeson WH, Sah RL, (2002). Integrative articular cartilage repair: dependence on developmental stage and collagen metabolism. Osteoarthritis Cartilage 10, 218-25.
Ding M, Dalstra M, Linde F, Hvid I, (1998). Changes in the stiffness of the human tibial cartilage-bone complex in early-stage osteoarthrosis. Acta Orthop Scand 69, 358-62.
DiSilvestro MR, Suh JK, (2002). Biphasic poroviscoelastic characteristics of proteoglycan-depleted articular cartilage: simulation of degeneration. Ann Biomed Eng 30, 792-800.
94
Dorotka R, Toma CD, Bindreiter U, Zehetmayer S, Nehrer S, (2005). Characteristics of ovine articular chondrocytes in a three-dimensional matrix consisting of different crosslinked collagen. J Biomed Mater Res B Appl Biomater 72, 27-36.
Driesang IM, Hunziker EB, (2000). Delamination rates of tissue flaps used in articular cartilage repair. J Orthop Res 18, 909-11.
Drobnic M, Radosavljevic D, Ravnik D, Pavlovcic V, Hribernik M, (2006). Comparison of four techniques for the fixation of a collagen scaffold in the human cadaveric knee. Osteoarthritis Cartilage,
Duda GN, Haisch A, Endres M, Gebert C, Schroeder D, Hoffmann JE et al., (2000). Mechanical quality of tissue engineered cartilage: results after 6 and 12 weeks in vivo. J Biomed Mater Res 53, 673-7.
Eckstein F, Faber S, Muhlbauer R, Hohe J, Englmeier KH, Reiser M et al., (2002). Functional adaptation of human joints to mechanical stimuli. Osteoarthritis Cartilage 10, 44-50.
Eckstein F, Gavazzeni A, Sittek H, Haubner M, Losch A, Milz S et al., (1996). Determination of knee joint cartilage thickness using three-dimensional magnetic resonance chondro-crassometry (3D MR-CCM). Magn Reson Med 36, 256-65.
Ehlers W, Markert B, (2001). A linear viscoelastic biphasic model for soft tissues based on the Theory of Porous Media. J Biomech Eng 123, 418-24.
Erggelet C, Sittinger M, Lahm A, (2003). The arthroscopic implantation of autologous chondrocytes for the treatment of full-thickness cartilage defects of the knee joint. Arthroscopy 19, 108-10.
Erggelet C, Steinwachs MR, Reichelt A, (2000). The operative treatment of full thickness cartilage defects in the knee joint with autologous chondrocyte transplantation. Saudi Med J 21, 715-21.
Ettrich U, Fengler H, Dressler F, Schulze KJ, (1998). [Overview of the current status of measurable parameters of cartilage metabolism in various body fluids]. Z Rheumatol 57, 375-91.
Farndale RW, Buttle DJ, Barrett AJ, (1986). Improved quantitation and discrimination of sulphated glycosaminoglycans by use of dimethylmethylene blue. Biochim Biophys Acta 883, 173-7.
Felson D. Epidemiology of osteoarthritis. In: Osteoarthritis. Brandt K, Doherty, M., Lohmander, S. New York, Oxford University Press (2003). 13-22.
Fife RS, Brandt KD, Braunstein EM, Katz BP, Shelbourne KD, Kalasinski LA et al., (1991). Relationship between arthroscopic evidence of cartilage damage and radiographic evidence of joint space narrowing in early osteoarthritis of the knee. Arthritis Rheum 34, 377-82.
Flahiff CM, Kraus VB, Huebner JL, Setton LA, (2004). Cartilage mechanics in the guinea pig model of osteoarthritis studied with an osmotic loading method. Osteoarthritis Cartilage 12, 383-8.
Frank EH, Grodzinsky AJ, (1987). Cartilage electromechanics--II. A continuum model of cartilage electrokinetics and correlation with experiments. J Biomech 20, 629-39.
Fung YC, (1979). Inversion of a class of nonlinear stress-strain Relationships of biological soft tissues. J Biomech Eng 101, 23-27.
Gardner DL, Salter DM, Oates K, (1997). Advances in the microscopy of osteoarthritis. Microsc Res Tech 37, 245-70.
Gatt R, Berman ER, (1966). A rapid procedure for the estimation of amino sugars on a micro scale. Anal Biochem 15, 167-71.
Gold GE, Beaulieu CF, (2001). Future of MR imaging of articular cartilage. Semin Musculoskelet Radiol 5, 313-27.
Grad S, Kupcsik L, Gorna K, Gogolewski S, Alini M, (2003). The use of biodegradable polyurethane scaffolds for cartilage tissue engineering: potential and limitations. Biomaterials 24, 5163-71.
Hangody L, Fules P, (2003). Autologous osteochondral mosaicplasty for the treatment of full-thickness defects of weight-bearing joints: ten years of experimental and clinical experience. J Bone Joint Surg Am 85-A Suppl 2, 25-32.
95

Harris ED, Jr., Parker HG, Radin EL, Krane SM, (1972). Effects of proteolytic enzymes on structural and mechanical properties of cartilage. Arthritis Rheum 15, 497-503.
Hayes WC, Keer LM, Herrmann G, Mockros LF, (1972). A mathematical analysis for indentation tests of articular cartilage. J Biomech 5, 541-51.
Heino Brechter J, Powers CM, (2002). Patellofemoral stress during walking in persons with and without patellofemoral pain. Med Sci Sports Exerc 34, 1582-93.
Heino Brechter J, Powers CM, Terk MR, Ward SR, Lee TQ, (2003). Quantification of patellofemoral joint contact area using magnetic resonance imaging. Magn Reson Imaging 21, 955-9.
Herberhold C, Faber S, Stammberger T, Steinlechner M, Putz R, Englmeier KH et al., (1999). In situ measurement of articular cartilage deformation in intact femoropatellar joints under static loading. J Biomech 32, 1287-95.
Hinterwimmer S, Krammer M, Krotz M, Glaser C, Baumgart R, Reiser M et al., (2004). Cartilage atrophy in the knees of patients after seven weeks of partial load bearing. Arthritis Rheum 50, 2516-20.
Hoemann C. Molecular and biochemical assays of cartilage components. In: Methods in Molecular Medicine, Vol. 101: Cartilage and Osteoarthritis, Volume 2: Structure and in vivo analysis. De Ceuninck F, Sabatini, M, Pastoureau, P. Totowa, New Jersey, Humana Press Inc. (2004). 127-56.
Holzapfel GA. Nonlinear solid mechanics. A continuum approach for engineering. 1st edition ed. Chichester: John Wiley& Sons Ltd, 2000
Hunter W, (1743). Of the structure and diseases of articulating cartilages. Philosophical Transactions 42, 514-21.
Hwang WS, Li B, Jin LH, Ngo K, Schachar NS, Hughes GN, (1992). Collagen fibril structure of normal, aging, and osteoarthritic cartilage. J Pathol 167, 425-33.
Jurgensen K, Aeschlimann D, Cavin V, Genge M, Hunziker EB, (1997). A new biological glue for cartilage-cartilage interfaces: tissue transglutaminase. J Bone Joint Surg Am 79, 185-93.
Jurvelin J. Biomechanical properties of the knee articular cartilage under various loading conditions. Department of Anatomy and Department of Applied Physics. Kuopio: University of Kuopio, 1991:75.
Jurvelin JS, Arokoski JP, Hunziker EB, Helminen HJ, (2000). Topographical variation of the elastic properties of articular cartilage in the canine knee. J Biomech 33, 669-75.
Jurvelin JS, Buschmann MD, Hunziker EB, (1997). Optical and mechanical determination of Poisson's ratio of adult bovine humeral articular cartilage. J Biomech 30, 235-41.
Jurvelin JS, Rasanen T, Kolmonen P, Lyyra T, (1995). Comparison of optical, needle probe and ultrasonic techniques for the measurement of articular cartilage thickness. J Biomech 28, 231-5.
Kaab MJ, Ito K, Clark JM, Notzli HP, (2000). The acute structural changes of loaded articular cartilage following meniscectomy or ACL-transection. Osteoarthritis Cartilage 8, 464-73.
Kauffmann C, Gravel P, Godbout B, Gravel A, Beaudoin G, Raynauld JP et al., (2003). Computer-aided method for quantification of cartilage thickness and volume changes using MRI: validation study using a synthetic model. IEEE Trans Biomed Eng 50, 978-88.
Kempson GE, Spivey CJ, Swanson SA, Freeman MA, (1971). Patterns of cartilage stiffness on normal and degenerate human femoral heads. J Biomech 4, 597-609.
Keuttner K, Goldberg, V.M. Osteoarthritic Disorders. Rosemont: American Academy of Orthopaedic Surgeons, 1995:xxi-v.
Kiraly K, Lapvetelainen T, Arokoski J, Torronen K, Modis L, Kiviranta I et al., (1996). Application of selected cationic dyes for the semiquantitative estimation of glycosaminoglycans in histological sections of articular cartilage by microspectrophotometry. Histochem J 28, 577-90.
96

Kiviranta I, Jurvelin J, Tammi M, Saamanen AM, Helminen HJ, (1985). Microspectrophotometric quantitation of glycosaminoglycans in articular cartilage sections stained with Safranin O. Histochemistry 82, 249-55.
Knecht S, Vanwanseele, B., Stuessi, E., (2006). A review on the mechancial quality of articular cartilage - implications for the diagnosis of osteoarthritis. Clin Biomech (Bristol, Avon) accepted,
Korhonen RK, Laasanen MS, Toyras J, Rieppo J, Hirvonen J, Helminen HJ et al., (2002). Comparison of the equilibrium response of articular cartilage in unconfined compression, confined compression and indentation. Journal of Biomechanics 35, 903-09.
Kurkijarvi JE, Nissi MJ, Kiviranta I, Jurvelin JS, Nieminen MT, (2004). Delayed gadolinium-enhanced MRI of cartilage (dGEMRIC) and T2 characteristics of human knee articular cartilage: topographical variation and relationships to mechanical properties. Magn Reson Med 52, 41-6.
Kwan MK, Lai WM, Mow VC, (1990). A finite deformation theory for cartilage and other soft hydrated connective tissues--I. Equilibrium results. J Biomech 23, 145-55.
Laasanen MS, Toyras J, Hirvonen J, Saarakkala S, Korhonen RK, Nieminen MT et al., (2002). Novel mechano-acoustic technique and instrument for diagnosis of cartilage degeneration. Physiol Meas 23, 491-503.
LaBerge M, Audet J, Drouin G, Rivard CH, (1993). Structural and in vivo mechanical characterization of canine patellar cartilage: a closed chondromalacia patellae model. J Invest Surg 6, 105-16.
Lai WM, Hou JS, Mow VC, (1991). A triphasic theory for the swelling and deformation behaviors of articular cartilage. J Biomech Eng 113, 245-58.
Lai WM, Mow VC, Roth V, (1981). Effects of nonlinear strain-dependent permeability and rate of compression on the stress behavior of articular cartilage. J Biomech Eng 103, 61-6.
Lapvetelainen T, Hyttinen M, Lindblom J, Langsjo TK, Sironen R, Li SW et al., (2001). More knee joint osteoarthritis (OA) in mice after inactivation of one allele of type II procollagen gene but less OA after lifelong voluntary wheel running exercise. Osteoarthritis Cartilage 9, 152-60.
Lapvetelainen T, Hyttinen MM, Saamanen AM, Langsjo T, Sahlman J, Felszeghy S et al., (2002). Lifelong voluntary joint loading increases osteoarthritis in mice housing a deletion mutation in type II procollagen gene, and slightly also in non-transgenic mice. Ann Rheum Dis 61, 810-7.
Leroux MA, Cheung HS, Bau JL, Wang JY, Howell DS, Setton LA, (2001). Altered mechanics and histomorphometry of canine tibial cartilage following joint immobilization. Osteoarthritis Cartilage 9, 633-40.
Li G, Gil J, Kanamori A, Woo SL, (1999). A validated three-dimensional computational model of a human knee joint. J Biomech Eng 121, 657-62.
Li LP, Buschmann MD, Shirazi-Adl A, (2000). A fibril reinforced nonhomogeneous poroelastic model for articular cartilage: inhomogeneous response in unconfined compression. J Biomech 33, 1533-41.
Li LP, Shirazi-Adl A, Buschmann MD, (2002). Alterations in mechanical behaviour of articular cartilage due to changes in depth varying material properties--a nonhomogeneous poroelastic model study. Comput Methods Biomech Biomed Engin 5, 45-52.
Little RB, Wevers HW, Siu D, Cooke TD, (1986). A three-dimensional finite element analysis of the upper tibia. J Biomech Eng 108, 111-9.
Liu GR. Computational inverse techniques in nondestructive evaluation. Boca Raton, London, New York, Washington D.C.: CRC Press, 2003
Lucchinetti E, Adams CS, Horton WE, Jr., Torzilli PA, (2002). Cartilage viability after repetitive loading: a preliminary report. Osteoarthritis Cartilage 10, 71-81.
Mak AF, (1986). The apparent viscoelastic behavior of articular cartilage--the contributions from the intrinsic matrix viscoelasticity and interstitial fluid flows. J Biomech Eng 108, 123-30.
97

Maniwa S, Nishikori T, Furukawa S, Kajitani K, Ochi M, (2001). Alteration of collagen network and negative charge of articular cartilage surface in the early stage of experimental osteoarthritis. Arch Orthop Trauma Surg 121, 181-5.
Mankin HJ, Dorfman H, Lippiello L, Zarins A, (1971). Biochemical and metabolic abnormalities in articular cartilage from osteo-arthritic human hips. II. Correlation of morphology with biochemical and metabolic data. J Bone Joint Surg Am 53, 523-37.
Marlovits S, Striessnig G, Kutscha-Lissberg F, Resinger C, Aldrian SM, Vecsei V et al., (2005). Early postoperative adherence of matrix-induced autologous chondrocyte implantation for the treatment of full-thickness cartilage defects of the femoral condyle. Knee Surg Sports Traumatol Arthrosc 13, 451-7.
Maroudas A, Thomas H, (1970). A simple physicochemical micromethod for determining fixed anionic groups in connective tissue. Biochim Biophys Acta 215, 214-6.
Martel-Pelletier J, (2004). Pathophysiology of osteoarthritis. Osteoarthritis Cartilage 12 Suppl A, S31-3.
Mazza E, Nava A, Bauer M, Winter R, Bajka M, Holzapfel GA, (2006). Mechanical properties of the human uterine cervix: an in vivo study. Med Image Anal 10, 125-36.
Mazzuca SA, Brandt KD, (2003). Is knee radiography useful for studying the efficacy of a disease-modifying osteoarthritis drug in humans? Rheum Dis Clin North Am 29, 819-30.
Mazzuca SA, Brandt KD, Lane KA, Katz BP, (2002). Knee pain reduces joint space width in conventional standing anteroposterior radiographs of osteoarthritic knees. Arthritis Rheum 46, 1223-7.
Meaney DF, (2003). Relationship between structural modeling and hyperelastic material behavior: application to CNS white matter. Biomech Model Mechanobiol 1, 279-93.
Meinel L, Hofmann S, Karageorgiou V, Zichner L, Langer R, Kaplan D et al., (2004). Engineering cartilage-like tissue using human mesenchymal stem cells and silk protein scaffolds. Biotechnol Bioeng 88, 379-91.
Miller KL, Hargreaves BA, Gold GE, Pauly JM, (2004). Steady-state diffusion-weighted imaging of in vivo knee cartilage. Magn Reson Med 51, 394-8.
Mizrahi J, Maroudas A, Lanir Y, Ziv I, Webber TJ, (1986). The "instantaneous" deformation of cartilage: effects of collagen fiber orientation and osmotic stress. Biorheology 23, 311-30.
Montella A, Manunta A, Espa E, Gasparini G, De Santis E, Gulisano M, (1992). Human articular cartilage in osteoarthrosis. I. The matrix. Transmission electron microscopic study. Ital J Anat Embryol 97, 1-12.
Morita Y, Tomita N, Aoki H, Sonobe M, Wakitani S, Tamada Y et al., (2006). Frictional properties of regenerated cartilage in vitro. J Biomech 39, 103-9.
Mow VC, Kuei SC, Lai WM, Armstrong CG, (1980). Biphasic creep and stress relaxation of articular cartilage in compression? Theory and experiments. J Biomech Eng 102, 73-84.
Mow VC, Proctor, S. C., Kelly, M. A. Biomechanics of articular cartilage. In: Basic Biomechanics of the Musculoskeletal System. Nordin M, Frankel, V. H. Philadelphia, Lippincott Williams & Wilkins (1989). 323.
Myers SL. Ultrasonography. In: Osteoarthritis. Brandt K, Doherty, M., Lohmander, S. New York, Oxford University Press (2003). 462-68.
Narmoneva DA, Wang JY, Setton LA, (2001). A noncontacting method for material property determination for articular cartilage from osmotic loading. Biophys J 81, 3066-76.
Nava A, Mazza E, Kleinermann F, Avis NJ, McClure J, Bajka M, (2004). Evaluation of the mechanical properties of human liver and kidney through aspiration experiments. Technol Health Care 12, 269-80.
Niederauer GG, Niederauer GM, Cullen LC, Athanasiou KA, B. TJ, Niederauer MQ, (2004). Correlation of Cartilage Stiffness to Thickness and level of Degeneration Using a Handheld Indentation Probe. Annals of Biomedical Engineering 32, 352-59.
Nieminen HJ, Saarakkala S, Laasanen MS, Hirvonen J, Jurvelin JS, Toyras J, (2004a). Ultrasound attenuation in normal and spontaneously degenerated articular cartilage. Ultrasound Med Biol 30, 493-500.
98

Nieminen MT, Toyras J, Laasanen MS, Silvennoinen J, Helminen HJ, Jurvelin JS, (2004b). Prediction of biomechanical properties of articular cartilage with quantitative magnetic resonance imaging. J Biomech 37, 321-8.
Nissi MJ, Toyras J, Laasanen MS, Rieppo J, Saarakkala S, Lappalainen R et al., (2004). Proteoglycan and collagen sensitive MRI evaluation of normal and degenerated articular cartilage. J Orthop Res 22, 557-64.
Obeid EM, Adams MA, Newman JH, (1994). Mechanical properties of articular cartilage in knees with unicompartmental osteoarthritis. J Bone Joint Surg Br 76, 315-9.
O'Reilly S, Doherty M. Signs, symptoms, and laboratory tests. In: Osteoarthritis. Brandt K, Doherty, M., Lohmander, S. New York, Oxford University Press (2003). 197-210.
Orford CR, Gardner DL, O'Connor P, (1983). Ultrastructural changes in dog femoral condylar cartilage following anterior cruciate ligament section. J Anat 137 ( Pt 4), 653-63.
Otterness IG, Eskra JD, Bliven ML, Shay AK, Pelletier JP, Milici AJ, (1998). Exercise protects against articular cartilage degeneration in the hamster. Arthritis Rheum 41, 2068-76.
Panula HE, Helminen HJ, Kiviranta I, (1997). Slowly progressive osteoarthritis after tibial valgus osteotomy in young beagle dogs. Clin Orthop, 192-202.
Panula HE, Hyttinen MM, Arokoski JP, Langsjo TK, Pelttari A, Kiviranta I et al., (1998). Articular cartilage superficial zone collagen birefringence reduced and cartilage thickness increased before surface fibrillation in experimental osteoarthritis. Ann Rheum Dis 57, 237-45.
Parsons JR, Black J, (1977). The viscoelastic shear behavior of normal rabbit articular cartilage. J Biomech 10, 21-9.
Pauwels F, (1976). [Developmental effects of the functional adaptation of bone]. Anat Anz 139, 213-20.
Pena E, Calvo B, Martinez MA, Doblare M, (2005). A three-dimensional finite element analysis of the combined behavior of ligaments and menisci in the healthy human knee joint. J Biomech,
Pirnog CD. Articular cartilage segmentation and tracking in sequential MR images of the knee. Department of Information Technology and Electrical Engineering. Zurich: ETH Zurich, 2005
Prendergast PJ, (1997). Finite element models in tissue mechanics and orthopaedic implant design. Clin Biomech (Bristol, Avon) 12, 343-66.
Pritzker KP, Gay S, Jimenez SA, Ostergaard K, Pelletier JP, Revell PA et al., (2006). Osteoarthritis cartilage histopathology: grading and staging. Osteoarthritis Cartilage 14, 13-29.
Quinn TM, Morel V, (2006). Microstructural Modeling of Collagen Network Mechanics and Interactions with the Proteoglycan Gel in Articular Cartilage. Biomech Model Mechanobiol,
Redman SN, Oldfield SF, Archer CW, (2005). Current strategies for articular cartilage repair. Eur Cell Mater 9, 23-32; discussion 23-32.
Rieppo J, Toyras J, Nieminen MT, Kovanen V, Hyttinen MM, Korhonen RK et al., (2003). Structure-function relationships in enzymatically modified articular cartilage. Cells Tissues Organs 175, 121-32.
Rivers PA, Rosenwasser MP, Mow VC, Pawluk RJ, Strauch RJ, Sugalski MT et al., (2000). Osteoarthritic changes in the biochemical composition of thumb carpometacarpal joint cartilage and correlation with biomechanical properties. J Hand Surg [Am] 25, 889-98.
Roberts S, Weightman B, Urban J, Chappell D, (1986). Mechanical and biochemical properties of human articular cartilage in osteoarthritic femoral heads and in autopsy specimens. J Bone Joint Surg Br 68, 278-88.
Roos H, Adalberth T, Dahlberg L, Lohmander LS, (1995). Osteoarthritis of the knee after injury to the anterior cruciate ligament or meniscus: the influence of time and age. Osteoarthritis Cartilage 3, 261-7.
Saarakkala S, Laasanen MS, Jurvelin JS, Torronen K, Lammi MJ, Lappalainen R et al., (2003). Ultrasound indentation of normal and spontaneously degenerated bovine articular cartilage. Osteoarthritis Cartilage 11, 697-705.
99

Samani A, Plewes D, (2004). A method to measure the hyperelastic parameters of ex vivo breast tissue samples. Phys Med Biol 49, 4395-405.
Setton LA, Mow VC, Howell DS, (1995). Mechanical behavior of articular cartilage in shear is altered by transection of the anterior cruciate ligament. J Orthop Res 13, 473-82.
Simon BR, (1992). Multiphase poroelastic finite element models for soft tissue structures. Appl Mech Rev 45, 191-218.
Simon BR, Liable JP, Pflaster D, Yuan Y, Krag MH, (1996). A poroelastic finite element formulation including transport and swelling in soft tissue structures. J Biomech Eng 118, 1-9.
Sittinger M, Hutmacher DW, Risbud MV, (2004). Current strategies for cell delivery in cartilage and bone regeneration. Curr Opin Biotechnol 15, 411-8.
Sittinger M, Perka C, Schultz O, Haupl T, Burmester GR, (1999). Joint cartilage regeneration by tissue engineering. Z Rheumatol 58, 130-5.
Soltz MA, Ateshian GA, (1998). Experimental verification and theoretical prediction of cartilage interstitial fluid pressurization at an impermeable contact interface in confined compression. J Biomech 31, 927-34.
Spriet MP, Girard CA, Foster SF, Harasiewicz K, Holdsworth DW, Laverty S, (2005). Validation of a 40 MHz B-scan ultrasound biomicroscope for the evaluation of osteoarthritis lesions in an animal model. Osteoarthritis Cartilage 13, 171-9.
Stockwell RA, Billingham ME, Muir H, (1983). Ultrastructural changes in articular cartilage after experimental section of the anterior cruciate ligament of the dog knee. J Anat 136, 425-39.
Stolz M, Raiteri R, Daniels AU, VanLandingham MR, Baschong W, Aebi U, (2004). Dynamic elastic modulus of porcine articular cartilage determined at two different levels of tissue organization by indentation-type atomic force microscopy. Biophys J 86, 3269-83.
Taddei F, Cristofolini L, Martelli S, Gill HS, Viceconti M, (2005). Subject-specific finite element models of long bones: An in vitro evaluation of the overall accuracy. J Biomech,
Tanaka E, Kawai N, Tanaka M, Todoh M, van Eijden T, Hanaoka K et al., (2004). The frictional coefficient of the temporomandibular joint and its dependency on the magnitude and duration of joint loading. J Dent Res 83, 404-7.
Theiler R, Ghosh P, Brooks P, (1994). Clinical, biochemical and imaging methods of assessing osteoarthritis and clinical trials with agents claiming 'chondromodulating' activity. Osteoarthritis Cartilage 2, 1-23.
Tognana E, Chen F, Padera RF, Leddy HA, Christensen SE, Guilak F et al., (2005). Adjacent tissues (cartilage, bone) affect the functional integration of engineered calf cartilage in vitro. Osteoarthritis Cartilage 13, 129-38.
Toyras J, Laasanen MS, Saarakkala S, Lammi MJ, Rieppo J, Kurkijarvi J et al., (2003). Speed of sound in normal and degenerated bovine articular cartilage. Ultrasound Med Biol 29, 447-54.
Toyras J, Rieppo J, Nieminen MT, Helminen HJ, Jurvelin JS, (1999). Characterization of enzymatically induced degradation of articular cartilage using high frequency ultrasound. Phys Med Biol 44, 2723-33.
Treppo S, Koepp H, Quan EC, Cole AA, Kuettner KE, Grodzinsky AJ, (2000). Comparison of biomechanical and biochemical properties of cartilage from human knee and ankle pairs. J Orthop Res 18, 739-48.
Uthamanthil RK, Edwards RB, Lu Y, Manley PA, Athanasiou KA, Markel MD, (2006). In vivo study on the short-term effect of radiofrequency energy on chondromalacic patellar cartilage and its correlation with calcified cartilage pathology in an equine model. J Orthop Res 24, 716-24.
Van Breuseghem I, (2004). Ultrastructural MR imaging techniques of the knee articular cartilage: problems for routine clinical application. Eur Radiol. 14, 184-92.
van de Breevaart Bravenboer J, In der Maur CD, Bos PK, Feenstra L, Verhaar JA, Weinans H et al., (2004). Improved cartilage integration and interfacial strength after enzymatic treatment in a cartilage transplantation model. Arthritis Res Ther 6, R469-76.
100

van der Heijde DM, (2000). Radiographic imaging: the 'gold standard' for assessment of disease progression in rheumatoid arthritis. Rheumatology (Oxford) 39 Suppl 1, 9-16.
van Valburg AA, Wenting MJ, Beekman B, Te Koppele JM, Lafeber FP, Bijlsma JW, (1997). Degenerated human articular cartilage at autopsy represents preclinical osteoarthritic cartilage: comparison with clinically defined osteoarthritic cartilage. J Rheumatol 24, 358-64.
Vanwanseele B. Quantification of the Influence of the Absence of Normal Joint Loading and Movement on the Articular Cartilage in the Joints of Spinal Cord Injured Patients. Department of Materials. Zurich: ETH Zurich, 2003
Vanwanseele B, Eckstein F, Knecht H, Spaepen A, Stussi E, (2003). Longitudinal analysis of cartilage atrophy in the knees of patients with spinal cord injury. Arthritis Rheum 48, 3377-81.
Vanwanseele B, Eckstein F, Knecht H, Stussi E, Spaepen A, (2002). Knee cartilage of spinal cord-injured patients displays progressive thinning in the absence of normal joint loading and movement. Arthritis Rheum 46, 2073-8.
Venn M, Maroudas A, (1977). Chemical composition and swelling of normal and osteoarthrotic femoral head cartilage. I. Chemical composition. Ann Rheum Dis 36, 121-9.
Viceconti M, Davinelli M, Taddei F, Cappello A, (2004). Automatic generation of accurate subject-specific bone finite element models to be used in clinical studies. J Biomech 37, 1597-605.
Viceconti M, Olsen S, Nolte LP, Burton K, (2005). Extracting clinically relevant data from finite element simulations. Clin Biomech (Bristol, Avon) 20, 451-4.
Vignon E, Arlot M, (1981). Macroscopically normal cartilage from the human osteoarthritis femoral head. I. Histological evaluation. J Rheumatol 8, 440-6.
Waldschmidt JG, Braunstein EM, Buckwalter KA, (1999). Magnetic resonance imaging of osteoarthritis. Rheum Dis Clin North Am 25, 451-65.
Wheaton AJ, Dodge GR, Borthakur A, Kneeland JB, Schumacher HR, Reddy R, (2005). Detection of changes in articular cartilage proteoglycan by T(1rho) magnetic resonance imaging. J Orthop Res 23, 102-8.
Wilson W, Huyghe JM, van Donkelaar CC, (2006). A composition-based cartilage model for the assessment of compositional changes during cartilage damage and adaptation. Osteoarthritis Cartilage,
Woessner JF, Jr., (1961). The determination of hydroxyproline in tissue and protein samples containing small proportions of this imino acid. Arch Biochem Biophys 93, 440-7.
Wu JZ, Herzog W, Epstein M, (1998). Evaluation of the finite element software ABAQUS for biomechanical modelling of biphasic tissues. J Biomech 31, 165-9.
101


Acknowledgment Zu allerletzt möchte ich noch die Möglichkeit nutzen, um allen zu danken, die bei der Entstehung meiner Dissertation beteiligt sind oder waren und sie namentlich hier in meiner Arbeit verewigen. Zu allererst möchte ich mich bei meinem Betreuer Edgar Stüssi dafür bedanken, dass ich für mittlerweile über 4 Jahre an seinem Institut meinen Forscherdrang mit vielen Freiheiten umsetzten und meine Ideen verwirklichen konnte. Vielen Dank auch an Jachen Denoth, der für mich nicht nur der treueste Kaffekunde sondern auch ein kritischer Diskussionspartner war. Hans Gerber Danke ich für die Unterstützung im Bereich Messtechnik und Informatik und die Einführung in den Berner Dialekt. Bei Sofia Delamanis bedanke ich mich für die stets offene Tür bei admistrativen und organisatorischen Fragen. Peter Schwilch danke ich für die vielen Ideen und die rasche Umsetzung aller praktischen Arbeiten, wie auch für die Kaffee-, Töggeli- und sonstigen Pausen und Abende.
DANKE!
Der externen Unterstützung möchte ich auf diesem Weg ebenfalls recht herzlich danken! Herrn Pete Ossent und seinen Mitarbeitern vom Institut für Veterinärpathologie der Universität Zürich danke ich für die sehr unkomplizierte und grosszügige Bereitstellung der Pferdeknie. Ein herzlicher Dank geht an Sandra Hofmann, Lorenz Übersax und Marcos Garcia Fuentes vom Institut für Pharmazeutische Wissenschaft der ETH Zürich für die sorgfältige Einführung und Unterstützung bei der biochemischen Analyse der Proben. Ein spezieller Dank gilt Martin Simnacher, der zum Einen wesentlich dafür verantwortlich ist, dass ich mich in Zürich niedergelassen habe und zum Anderen bei zahlreichen ausgleichenden, sportlichen Betätigungen für meine Probleme und Herausforderungen immer ein offenes Ohr und Ratschläge parat hatte. Und ein ganz besonderer Dank geht natürlich an Roger Lüchinger vom Magnetresonanzzentrum der Universität und ETH Zürich. Ohne seinen aufopferungsvollen Einsatz und bedingungslose Unterstützung bei den MR-Aufnahmen wäre ich lange nicht so schnell vorangekommen. Im schnelldurchlauf möchte ich auch noch der NZZ-Kantine in Schlieren für die ausgezeichnete Verpflegung im WagiWagi-Land, der FIFA für die zwei Fussball-WM’s während meiner Arbeit, der Limmat, den Bergen, dem Schnee, und was mir sonst noch das Leben neben meiner Arbeit versüsst hat, danken.
DANKE!
Besonderen Dank gilt allen WagiWagis, die mir vorgezeigt haben, wie man sich den Titel erarbeitet (oder wie man es besser nicht machen sollte): angefangen bei der No. 1 Dominik
103
Thoman, Claude Berney, Benedicte Vanwanseele, Toru Fischbach, Ivo Telley, und natürlich meinem direkten Leidensgenossen und Mitinsassen Peter Wolf, der mir mehr als die Nummer “007” überliess. Gleiches gilt natürlich für Markus Dettwyler und die zukünftigen Wagis Mauro Foresti und Urs Stöcker. Alle schönen Erlebnisse und Erfahrungen aufzuzählen würde den Rahmen dieser Arbeit sprengen und ich würde wohl als erster Doktorand in die Bücher eingehen, bei dem die Danksagung länger ist als die wissenschaftliche Arbeit.
DANKE!
Vor allem will ich hier am Ende meiner Arbeit meinen Eltern Marianne und Herbert Knecht danken (auch wenn mein Vater den Abschluss nicht mehr miterleben durfte). Ohne sie und ihre Unterstützung bei all meinen Plänen und Projekten wäre ich nie so weit gekommen! Dank auch an meinen Bruder Steffen Knecht, der mir in vielen Phasen meines Werdegangs voranging und den Weg geebnet hat. Und natürlich den herzlichsten Danke meiner Freundin Kathrin Leemann für die Unterstützung während der zeitweise recht strengen Arbeitsphase, der Toleranz und der Freude auf die Feierabende und Wochenenden mit ihr.
DANKE!
P.S. Fall ich doch noch jemanden vergessen haben sollte, dann gilt das schwäbische Motto: “Ed
gmodzd isch gloobd gnuag!”
104

105
Publications Peer-reviewed full paper: S. Knecht, C. Erggelet, M. Endres, M.Sittinger, C. Kaps, E. Stüssi. Mechanical testing of fixation techniques for scaffold-based tissue-engineering grafts. Submitted to: Journal of Biomedical Material Research, Part B: Applied Biomaterials. S. Knecht, B. Vanwanseele, E. Stüssi. A review on the mechanical quality of articular cartilage - implications for the diagnosis of osteoarthritis. Clinical Biomechanics, accepted. S. Hofmann, S. Knecht, G. Vunjak-Novakovic, R. Langer, E. Stussi, D. L. Kaplan, HP. Merkle, L. Meinel. Cartilage-like Tissue Engineering Using Silk Scaffolds and Mesenchymal Stem Cells. Tissue Engineering, accepted. Conference Abstracts: Knecht, S., Luechinger, R., Bösiger, P., Stüssi, E, 2006. Mechanical properties of the patellar cartilage by an inverse FE approach from MR-monitored compression tests. World Congress for Biomechancis, 2006, Munich Knecht, S., Luechinger, R., Pirnog, C., Bösiger, P., Stüssi, E., 2005. Finite Element contact analysis of MRI-based articular cartilage models. DGfB biomechanica V, 2005, Hamburg.

107
Curriculum Vitae Personal details
Name
Date of birth
Address
Nationality
Education
10/02 - present
04/02
10/96 - 04/02
08/86 - 06/95
Practical Training
04/01- 08/01
09/99- 03/01
06/98- 06/99
Academic working experience
since 06/02
since 06/02
Sven Knecht
13.07.1975
Hardstrasse 6
CH-8004 Zurich
German
PhD student at Institute for Biomechanics, ETH Zurich Thesis Title: Biomechanical assessment of native and tissue engineered articular cartilage
Engineer’s diploma in Process Engineering, University of Stuttgart, Germany Thesis Title: Microstructured deposition of functional nano-particles on gold, silicon and glass surfaces by means of micro-contact printing, lithography and microspotting.
Study of Process Engineering, University of Stuttgart, Germany Major: Biomedical Engineering
Comprehensive secondary school
Industrial Internship at Precision Implants AG, Aarau, Switzerland: Development of an apparatus for combined chemical and mechanical degradation of UHMWPE
Temporary Assistant at the Institute for Polymer Testing and Science (IKP), University of Stuttgart
Temporary Assistant at Fraunhofer Institute for Interfacial Engineering and Biotechnology, Stuttgart
Research Assistant at Laboratory for Biomechanics, ETH Zurich
Teaching Assistant at Laboratory for Biomechanics, ETH Zurich