rights / license: research collection in copyright - non ...23198/et… · contents abstract vii...
TRANSCRIPT
Research Collection
Doctoral Thesis
Fourier transform microwave spectroscopy of Van der Waalscomplexes of closed- and open-shell molecules
Author(s): Schäfer, Martin
Publication Date: 1999
Permanent Link: https://doi.org/10.3929/ethz-a-003837214
Rights / License: In Copyright - Non-Commercial Use Permitted
This page was generated automatically upon download from the ETH Zurich Research Collection. For moreinformation please consult the Terms of use.
ETH Library
Diss. ETH No 13328
Fourier Transform Microwave
Spectroscopy of Van der Waals
Complexes of Closed- and
Open-Shell Molecules
A dissertation submitted to the
SWISS FEDERAL INSTITUTE OF TECHNOLOGY
ZURICH
for the degree of Doctor of Natural Sciences
presented by
MARTIN SCHÄFER
Dipl. Chem. University of Basel
born November 24, 1971
citizen of Seltisberg, BL
accepted on the recommendation of
Prof. Dr. Alfred Bauder, examiner
Prof. Dr. Frederic Merkt, co-examiner
Zurich 1999

Quod quoniam constat, nimirum nulla quies est
reddita corporibus primis per inane profundum,sed magis assiduo varioque exercita motu
partim intervallis magnis confulta resultant,
pars etiam brevibus spatiis vexantur ab ictu.
et quaecumque magis condenso conciliatu
exiguis intervallis convecta resultant,
indupedita suis perplexis ipsa figuris,haec validas saxi radices et fera ferri
corpora constituunt et cetera de génère horum.
paucula quae porro magnum per inane vagantur,
cetera dissiliunt longe longeque recursant
in magnis intervallis. haec aera rarum
sufficiunt nobis et splendida lumina solis.
multaque praeterea magnum per inane vagantur,
conciliis rerum quae sunt reiecta nee usquam
consociare etiam motus potuere recepta.
cuius, uti memoro, rei simulacra et imagoante oculos semper nobis versatur et instat.
contemplator enim, cum solis lumina cumque
inserti fundunt radii per opaca domorum.
multa minuta modis multis per inane videbis
corpora misceri radiorum lumine in ipso
et velut aeterno certamine proelia pugnas
edere turmatim certantia nee dare pausam,
conciliis et discidiis exercita crebris;conicere ut possis ex hoc, primordia rerum
quale sit in magno iactari semper inani.
dumtaxat rerum magnarum parva potest res
exemplare dare et vestigia notitiai.
hoc etiam magis haec animum te advertere par est
corpora quae in solis radiis turbare videntur,
quod tales turbae motus quoque material
significant clandestinos caecosque subesse.
multa videbis enim plagis ibi percita caecis
commutare viam retroque repulsa reverti
nunc hue nunc illuc in cunctas undique partis,scilicet hic a principiis est omnibus error,
prima moventur enim per se primordia rerum;
inde ea quae parvo sunt corpora conciliatu
et quasi proxima sunt ad viris principiorum,
ictibus illorum caecis inpulsa cientur,
ipsaque proporro paulo maiora lacessunt.
sic a principiis ascendit motus et exit
paulatim nostros ad sensus, ut moveantur
ilia quoque, in solis quae lumine cernere quimus
nee quibus id faciant plagis apparet aperte.
Titus Lucretius Carus, De rerum natura II 95-141
To my parents
Contents
Abstract vii
Zusammenfassung ix
1 Introduction 1
2 Theory 3
2.1 Rotational Hamiltonian for a Semirigid Molecule 3
2.1.1 The Zero-field Effective Hamiltonian 4
2.1.2 Effects of Applied Fields 7
2.2 Large Amplitude Motions 9
3 Spectrometers 11
3.1 Molecular Beam FTMW Spectrometer 11
3.2 Waveguide FTMW Spectrometer 13
4 Fluorobenzene-Carbon Monoxide 14
4.1 Introduction 14
4.2 Experimental Details 16
4.3 Assignments and Analysis 17
4.4 Geometry of the Complex 29
4.5 Dipole Moment 35
4.6 Flexible Model Analysis 37
4.7 Discussion 41
4.8 Conclusion 44
5 Fluorobenzene—Oxygen 45
5.1 Introduction 45
5.2 Analytical Model 46
5.3 Experiments and Results 48
v
5.4 Discussion 49
6 Vibrationally Excited States of Fluorobenzene 53
6.1 Introduction 53
6.2 Experimental Details 54
6.3 Results and Discussion 55
7 Argon-Chlorine Dioxide 79
7.1 Introduction 79
7.2 Experimental Details 80
7.3 Assignments and Analysis 81
7.4 Geometry of the Complex 91
7.5 Ab initio Calculations 93
7.6 Discussion and Outlook 95
Appendices 97
A Helmholtz Coils 97
A.l Theoretical Considerations 97
A.2 Setup 100
B Microwave Spectrum and Structure of Fluorobenzene 102
Bibliography 106
Acknowledgement 117
Curriculum Vitae 118
vi
Abstract
In this work, the rotational spectra and structures of three Van der Waals complexes have
been investigated by Fourier transform microwave spectroscopy. Two of these complexes
contain open-shell molecules; these molecules, also called radicals, possess an electron
spin which couples to the magnetic field induced by the rotation of the molecule, to the
nuclear spins, and to external magnetic fields. These interactions cause splittings of the
rotational transitions. Therefore, the intensity of a single rotational line is divided among
many components, rendering the measurements of rotational spectra of open-shell Van
der Waals complexes more difficult than those of closed-shell complexes.
The complex discussed first is fluorobenzene-carbon monoxide (Chap. 4). The main
feature of the spectrum is the presence of two sets of lines, indicating that CO is exe¬
cuting a large amplitude motion between two equivalent minima in the potential energy
surface. In the ground torsional state, a structure with the CO above the ring plane was
determined. The CO is not placed in the symmetry plane of fluorobenzene (perpendic¬
ular to the molecule plane), but at a certain angle to it. The barrier hindering internal
rotation was estimated using a flexible model.
The second complex is fluorobenzene-oxygen (Chap. 5). Molecular oxygen, O2, is
a stable radical with a triplet ground electronic state. Unfortunately, all the observed
transitions were very weak; therefore, no assignment was possible. The weakness of
the lines is explained by interactions between the electron spin of the oxygen and the
nuclear spins of the hydrogens and fluorine of fluorobenzene (superhyperfine interaction),
inducing splittings and distribution of the intensity of a single rotational transition among
many components.
Finally, the rotational spectrum of the argon-chlorine dioxide complex was measured;
the preliminary results are presented in Chap. 7. From the analysis of both the moments
of inertia and the hyperfine interaction between the electron spin and the chlorine nuclear
spin, a rough structure could be obtained; the argon atom is placed above the CIO2
vn

molecule plane. A tunnelling motion between two equivalent positions of the argon
atom on opposite sides of the C102 molecule plane couples to the overall rotation of the
complex; as a consequence, the rotational spectrum deviates considerably from that of a
rigid or semirigid rotor.
The Van der Waals complexes were generated in a supersonic expansion into vacuum
of sample mixtures entrained in rare gases. Using this technique, rotational and transla-
tional degrees of freedom of the molecules are cooled very efficiently, resulting rotational
temperatures of a few degrees Kelvin; the vibrational cooling is less efficient. This is dis¬
cussed in Chap. 6 using the example of fluorobenzene when vibrationally excited states
were observed in the molecular beam.
viii
Zusammenfassung
In der vorliegenden Arbeit werden die Ergebnisse der Untersuchung dreier Van-der-Waals-
Komplexe mittels der Fourier-Transform-Mikrowellenspektroskopie präsentiert. Zwei
dieser Komplexe enthalten Moleküle mit ungepaarten Elektronen. Solche Moleküle, auch
Radikale genannt, besitzen einen Elektronenspin, der mit dem durch die Molekülrotation
hervorgerufenen Magnetfeld, mit den Spins magnetischer Kerne und mit äusseren mag¬
netischen Feldern interagiert. Diese Wechselwirkungen führen in Mikrowellenspektren
zu Aufspaltungen der Rotationsübergänge. Die damit verbundene Reduktion der Inten¬
sitäten der einzelnen Linien erschwert das Messen von Rotationsspektren von Van-der-
Waals-Komplexen mit ungepaarten Elektronen.
Der erste behandelte Komplex ist jener zwischen Fluorbenzol und Kohlenstoffmonoxid
CO (Kap. 4). Das Charakteristische am Rotationsspektrum ist die Präsenz zweier
Sätze von Übergängen, hervorgerufen durch die interne Rotation des CO. Im Grundzu¬
stand befindet sich das CO oberhalb der Ringebene, aber nicht in der Symmetrieebene
(senkrecht zur Molekülebene) des Fluorbenzols, sondern in einem gewissen Winkel zu
ihr. Entsprechend gibt es zwei äquivalente Minima; dies erklärt auch die Präsenz eines
tiefliegenden Torsionszustandes und damit des zweiten Satzes beobachteter Übergänge.
Mittels eines flexiblen Modells wurde die Potentialbarriere für die interne Rotation abge¬
schätzt.
Der zweite behandelte Komplex ist jener zwischen Fluorbenzol und molekularem
Sauerstoff O2 (Kap. 5). Sauerstoff ist ein stabiles Radikal mit einem Triplett-Grund¬
zustand. Die wenigen beobachteten Übergänge waren alle sehr schwach, so dass keine
Zuordnung möglich war. Die geringen Intensitäten werden durch die Wechselwirkung
zwischen Elektronenspin des Sauerstoffs und den Kernspins der H- und F-Atome des
Fluorbenzols erklärt (Superhyperfein-Wechselwirkung), die zu weiteren Aufspaltungen
und damit zur Intensitätsreduktion der Übergänge führt.
ix
Schliesslich wurde das Rotationsspektrum des Komplexes zwischen Argon und Chlor¬
dioxid OCIO gemessen; die vorläufigen Resultate werden in Kap. 7 präsentiert. Aus der
Analyse der Hyperfein-Wechselwirkung (zwischen Elektronenspin und dem Kernspins des
Chlors) und der Trägheitsmomente konnte eine ungefähre Struktur bestimmt werden, in
welcher das Argonatom sich oberhalb der C102-Molekülebene befindet. Eine Tunnel¬
bewegung zwischen zwei äquivalenten Positionen des Argons ober- und unterhalb der
Molekülebene koppelt mit der Gesamtrotation des Komplexes; das Rotationsspektrum
weist deshalb starke Abweichungen von dem eines starren oder halbstarren Rotors auf.
Die Van-der-Waals-Komplexe wurden in einer Überschallexpansion einer Gasmischung
ins Hochvakuum erzeugt. Diese Technik führt zu einer starken Abkühlung der transla¬
torischen und rotatorischen Freiheitsgrade der Moleküle zu Temperaturen von einigen
wenigen Kelvin. Die erreichten Vibrationstemperaturen dagegen sind meistens viel höher.
Dies wird am Beispiel vibrationsangeregter Zustände von Fluorbenzol im Molekularstrahl
diskutiert (Kap. 6).
x
Chapter 1
Introduction
Over the last three decades, weakly bound complexes between molecules or rare gas
atoms have been at the focus of much experimental and theoretical effort because they
are models for the study of intermolecular forces, which play an important role in many
physical and chemical processes. The binding energies of such complexes are small, much
smaller than for a typical chemical bond, and cover a substantial range. At the low end,
there are the Van der Waals complexes, whereas the hydrogen bonded complexes show
higher values. Since the binding energy of a Van der Waals complex is of the same
order as the thermal energy RT at room temperature (2.48 kJmol-1 or 207 cm-1), it
is likely that such a complex is dissociated by the first collision with another molecule.
Therefore, special techniques are required to produce and observe such complexes. These
are produced most efficiently in supersonic expansions, where the strong adiabatic cooling
favours their formation. The spectroscopic characterization is then performed in the
virtually collision-free region of the emerging jet or molecular beam. In a supersonic
expansion of a rare gas seeded with small amounts of other compounds, rotational and
translational temperatures well below 10 K may be achieved; the vibrational cooling is
less efficient (see Chap. 6).
Since the pioneering work of Klemperer and coworkers on weakly bound complexes [1],
rotational spectroscopy in the microwave or radio frequency range has proved to be an
excellent investigatory method, not only for the determination of molecular geometries,
but also for the study of large amplitude intermolecular vibrations [2-7]. In the pulsed
molecular beam Fourier transform microwave (MB-FTMW) technique [8], the high res¬
olution and sensitivity of pulsed Fourier transform microwave (FTMW) spectroscopy [9]
are combined with the possibility to generate and observe weakly bound complexes or
1

2 Chapter 1. Introduction
transient molecules (produced in situ through a discharge or other techniques). This
technique also offers advantages in the study of single stable molecules: (1) The su¬
personic expansion reduces the population of high J rotational levels dramatically and
therefore simplifies the spectrum considerably, or even allows the detection of the rota¬
tional spectrum, when too many populated levels make this impossible in a waveguide
FTMW spectrometer. (2) The Fabry-Pérot cavity also offers higher sensitivity, and the
resolution is higher than in conventional MW waveguide spectroscopy since there is no
pressure and wall broadening of the lines.
While there are many Van der Waals complexes that have been studied by high
resolution spectroscopy, only a few complexes containing open-shell systems have been
studied to date, with the majority of investigations having employed optical spectroscopic
techniques, because there the sensitivity is much higher than it is in the longer wavelength
regions such as infrared and microwave. Open-shell systems, also called radicals, possess
one or more unpaired electrons and are normally very reactive and short-lived species
which occur as reaction intermediates. Radicals play an important role in atmospheric
chemistry. While a few stable radicals do exist (e.g. NO, N02, 02), most have to be
produced in situ through the use of, for example, a discharge or a photochemical reaction.
High resolution spectra of open-shell systems may be extremely complex, as the non¬
zero electron spin and possible orbital angular momentum couple to the overall rotation
and, in the case of a weakly bound complex, to the large amplitude motions. In the
microwave region, the hyperfine interactions between the electron spin and nuclear spins
can provide further insight in the nature of the bonding, but cause further splittings
of the rotational lines and therefore reduce their intensities. Since the unpaired elec¬
tron possesses a magnetic moment which interacts with a magnetic field and results in
an additional splitting (Zeeman effect), devices to cancel the earth's magnetic field are
normally employed, thus eradicating these splittings. All these facts make the study of
open-shell Van der Waals complexes by microwave spectroscopy a difficult task.
Chapter 2
Theory
2.1 Rotational Hamiltonian for a Semirigid Molecule
The theory of rotational spectra is treated in detail in many textbooks [10-13]; as is
the theory of angular momentum [14]. The theory for molecules with non-zero electron
spin S or nuclear spin I was first described by Van Vleck [15], and later extended
by various other authors [16-18]. The three angular momenta N (molecular rotation
including electron orbital motion)1, S and i" interact, giving a total resultant angular
momentum F. There are three limiting coupling schemes which result if one considers one
interaction to be much stronger than the other two. These are the J scheme: N+S = J,
J + I = F, the G scheme: S + I = G, G + N = F, and the E scheme: N + I = E,
E + S = F [17]. Because J is the total angular momentum excluding nuclear spin
and N the total angular momentum excluding all spins, the notation J is usually used
to represent the molecular rotation angular momentum in closed-shell molecules (i.e. S
= 0). The most convenient way to deal with these interactions, especially for machine
computation, is to use irreducible tensor methods [17,19-23]. In this work, the fitting
program of Pickett [22] was used. Since this program utilises a complete diagonalization
procedure, identical fits are obtained regardless of the coupling scheme used.
In this section, only the form of the effective Hamiltonian used to fit the data will be
discussed; the matrix elements can be found in the literature [10,13,20,21,23].
1In linear molecules or symmetric top molecules in a degenerate electronic state, the electronic orbital
angular momentum L occurs and couples with the nuclear rotational angular momentum R to give N.
In this chapter, only cases where L = 0 are considered.
3

4 Chapter 2. Theory
2.1.1 The Zero-field Effective Hamiltonian
The Hamiltonian can be written as the sum of several separate terms [24]:
H = HTOt + Hcd + Hss + HST + HSICd + Hhîs + Hq. (2-1)
The rigid asymmetric rotor Hamiltonian HTOt has the form
Hrot = BaN2a + BbN2 + BCN2 (2.2)
where Ba, Bb and Bc are the rotational constants and Na, Nb and Nc are the components
of the rotational angular momentum N, referred to the principal inertial axes. The
rotational constants are closely related to the principal moments of inertia
Bx^h2/2hlx (x = a,b,c). (2.3)
The exact relationship depends on the form adopted for the corrections to the rotational
energy for effects of centrifugal distortion [25]. In general nomenclature, Ba, Bb and Bc
are replaced by the symbols A, B, C where, by convention, A > B > C. Eq. 2.2 may be
rewritten as
HTOt = \{BX + By)N2 + [Bz - ±(BX + By)]N2 + ^[Bx - By](N2+ + N2_) (2.4)
where N± = (Nx ± iNy) and x,y,z = b, c, a in the near-prolate case (F representation)
and x, y, z — a, b, c in the near-oblate case (IIF representation).
Centrifugal distortion effects were discussed in detail by Watson [25]. The Hamil¬
tonian Hd is normally expressed in one of two different reduced forms. The asymmetric
(A) reduced form for the quartic and sextic centrifugal distortion terms is
4Ad = -A^iV2)2 - ANKN2N2 - A^4 -±[5NN2 + 5KN2,(N2+ +N2)]+
+$N(N2)3 + $NK(N2)2N2 + $KNN2N* + §KNl (2.5)
+liMN2)2 + <f>NKN2N2 + faNÎ, (Ni + N2_)}+
where the symbol [A,B]+ stands for the anti-commutator (AB + BA). The symmetric
(S) reduced form for the quartic and sextic centrifugal distortion terms is
Hfd = -D^Ny-DNK^Nl-DKNt + d^^l + N^ + d^Nl + Ni)
+HN(N2f + HNK(N2)2N2 + HKNN2NAZ + HKN6Z (2.6)
+h(N2)2(N2+ + N2_) + h2N2(Nl + Nt) + h(N6+ + N6_).

Chapter 2. Theory 5
Note that the values determined for the rotational constants also depend on the reduction
employed.
In molecules with two or more unpaired electrons (i.e. S > 1), the electron spin-spin
dipolar interaction occurs
H„air) = -—gi92^BSJ-S2 (Sj-r)(S^-r)
in
VO gi92^B247T r3
„ „a,ß
-3fr*ö rr*ö
(2.7)
£(<W - 3eaeß)SiJ2ß (2.8)
where //0 is the permeability of free space, gi and g2 are the g factors for electron 1 and 2,
respectively, (i-q is the Bohr magneton, r is the inter-electron vector, Saß is the Kronecker
delta symbol and ea, eß are unit vectors along the principal axes a, ß (= a, 6, c) [26]. The
magnetic moment of the electron is ßs = —ß-^gS. For simplicity, g\ = g2 = g will be
assumed. Because the two electrons are coupled, it is more convenient to express Hss in
terms of the total spin operator S = Si + S2. With the relations
SiaS2a = -Sa —
-, SiaS2ß + 32aSiß = ~(SaSß + SßSa), (2.9)
Eq. 2.8 becomes
a,ß
Eq. 2.10 can be converted into a spin-hamiltonian form by suitable integration
*- = ^{g,*?Y.(5aß~*eaeß)sJß (2.11)
= ST-B-S (2.12)
The spin-spin interaction tensor D is traceless and symmetric2 and may be considered
as a pseudo-quadrupole interaction tensor [15,17]. Eq. 2.11 can be compared with the
form of the Hamiltonian obtained by Van Vleck [15]:
Hss = a(342-52)+/?(42-^2)+7(^4+45x)+5(4^+4^)+e(44+^4). (2.13)
The effective electronic spin-rotation Hamiltonian HST has been discussed by several
authors [15,17,27]. In general it takes the form
HST = \ £ eaß (Njß + SßNa) (2.14)1
a,ß
2Daa + Dbb + Dcc = 0, Daß = Dßa.
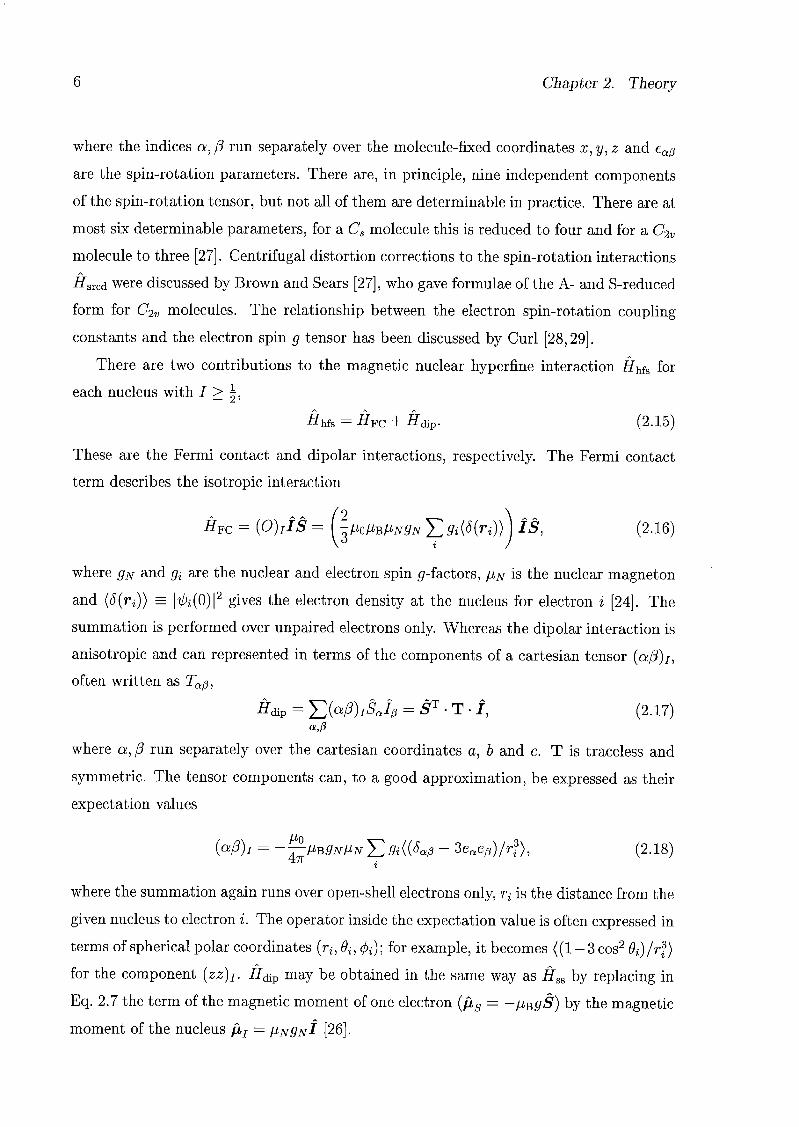
6 Chapter 2. Theory
where the indices a,ß run separately over the molecule-fixed coordinates x,y,z and eaß
are the spin-rotation parameters. There are, in principle, nine independent components
of the spin-rotation tensor, but not all of them are determinable in practice. There are at
most six determinable parameters, for a Cs molecule this is reduced to four and for a C2v
molecule to three [27]. Centrifugal distortion corrections to the spin-rotation interactions
Harcd were discussed by Brown and Sears [27], who gave formulae of the A- and S-reduced
form for C2v molecules. The relationship between the electron spin-rotation coupling
constants and the electron spin g tensor has been discussed by Curl [28,29].
There are two contributions to the magnetic nuclear hyperfine interaction iïhfs for
each nucleus with I > |,
Hhîs — Hfc + -ffdip- (2-15)
These are the Fermi contact and dipolar interactions, respectively. The Fermi contact
term describes the isotropic interaction
HFC = (0)!ÎS = (j/ioWiv<7iv£^(rO) j ÎS, (2.16)
where g^ and gt are the nuclear and electron spin <?-factors, /i/v is the nuclear magneton
and (#(r0) — l^(0)|2 gives the electron density at the nucleus for electron i [24]. The
summation is performed over unpaired electrons only. Whereas the dipolar interaction is
anisotropic and can represented in terms of the components of a cartesian tensor (aß)I}
often written as Taß,
Èdip = 52(aß)!Sjß = Sr T /, (2.17)a,ß
where a, ß run separately over the cartesian coordinates o, b and c. T is traceless and
symmetric. The tensor components can, to a good approximation, be expressed as their
expectation values
(aß)r = -—ßBgNVNj29i((Saß ~ 3eaeß)/r3), (2.18)
where the summation again runs over open-shell electrons only, r% is the distance from the
given nucleus to electron i. The operator inside the expectation value is often expressed in
terms of spherical polar coordinates (rî; 9%, <f>t); for example, it becomes {(1 — 3 cos2 0t)/r^)
for the component (zz)i- H<nv may be obtained in the same way as Hss by replacing in
Eq. 2.7 the term of the magnetic moment of one electron (ßs = —^gS) by the magnetic
moment of the nucleus fiT = ßNgNl [26].
Chapter 2. Theory 7
In the case of nuclei with / > 1, the interaction of the nuclear electric quadrupole
moment with the molecular electric field gradient can be described by the product of the
nuclear quadrupole moment tensor Qaß and the electric field gradient tensor VEaß =
-Vaß [10]:
Hq = ~Q : VE = \Y,Q^3 (2-19)h3
where i,j run over the cartesian coordinates x, y and z. The operator is often re-
expressed in terms of the nuclear spin angular momentum operators with the use of the
Wigner-Eckart theorem:
£q = EM^-U/J = 2I{2] _ 1}IT • X Î, (2.20)
where a,ß run over the principal coordinates of inertia, (aß)c are the quadrupole pa¬
rameters [17] and % is the nuclear quadrupole coupling tensor, which is traceless and
symmetric. The quadrupole parameters can be interpreted in terms of
/ o\ eQ / d2V \ eQ ._
{aß)Q=
21(21- l)\d^dß)=
2/(27-1)** (2-21)
=
m=T)X« (2-22)
where e is the electronic charge, Q is the nuclear quadrupole moment, qaß is the electric
field gradient at the nucleus and Xaß = eQ<Iaß are the nuclear quadrupole coupling
constants. Comparing Eq. 2.20 and 2.11, the analogies between Hq and Hss are obvious:
Hq <—> Hss
L ^ Sa (2.23)1
Xaß <—y Daß.21(21 - 1)
In analogy to the electron spin-rotation interaction and the electron spin-nuclear spin
interaction, additional Hamiltonian terms of the nuclear spin-rotation interaction and
nuclear spin-nuclear spin interaction may be defined [23].
2.1.2 Effects of Applied Fields
The interaction with a static electric field (Stark effect) or magnetic field (Zeeman effect)
is discussed in detail in the literature. Therefore only a brief summary will be given here.

8 Chapter 2. Theory
The Stark effect Hamiltonian can be expressed as
Hs = -E Y, MA« (2-24)cx=a,,b,c
where $^a are the direction cosines of the a, 6, c axes with reference to the space-fixed Z
axis, which gives the direction of the electric field E, and /i is the electric dipole moment
of the molecule. The first-order Stark energy for a symmetric top is given by
_
pEKMjEs - ~
7(771)(2"25)
In linear, symmetric (K = 0), and asymmetric molecules, normally a second-order effect
occurs giving a frequency shift
^ = E2 £ ßKAj^ + Bj^MD^E^+Bj^M2). (2.26)a=a,6,c
Degeneracies in asymmetric tops may lead to first-order Stark patterns. In molecules
with nuclear quadrupole coupling, the Stark effect is expressed in terms of Mp in the
weak-field case as long as J and I are not decoupled. The Stark effect may be used
to assign rotational transitions based on the Stark pattern or to determine the dipole
moment of a molecule.
The magnetic moment of a molecule with electronic angular momentum is
As = ~9s^bS - #lMb£, (2.27)
where gs = 2.00232 and çl = 1.0 for a free electron. In a weak field, the contributions
of the nuclei through the rotation of the framework in space and through their nuclear
magnetic moments may be neglected as they are much smaller than the electronic con¬
tribution. Thus the first-order Zeeman energy is given by (when L = 0) [20]
Ez = -ßsH = gjfj,BHMj (2.28)[J(J + 1)+S(S + 1)-N(N + 1)]
= 9s^HMj27(7Ti)
or, if I" couples with J,
Ez = gFßvHMF (2.29)[F(F + 1) + J(J + 1) - /(/ + 1)] [J(J + 1) + S(S + 1) - N(N + 1)]
= gsßßHMp-2F(F + l) 2J(J + l)
Chapter 2. Theory 9
or in the G coupling scheme
[F(F + 1) + G(G + 1) - N(N + 1)] [G(G + 1) + S(S + 1) - 1(1 + 1)]#z = gs^HMp-
The Zeeman pattern is
2F(F+l) 2G{G + 1)(2.30)
Ai/ = ^(gF, - gF)Mp + ^^-AMp. (2.31)
The selection rules for dipole transitions between Stark or Zeeman components are
AMp — 0 when the electric field of the microwave radiation is parallel to the static field
and AMp = ±1 when perpendicular. The relative intensities are given by the square of
If' i f \the 3-j symbol . Namely, for Mp 4— MF,
y -M'p AMp MF J
I(R branch, F + 1 <- F) oc (F + l)2 - MF,
I(Q branch, F <- F) oc MF, (2.32)
I(P branch, F - 1 <- F) oc F2 - MF.
The relative intensities of transitions satisfying the criteria that AJ = AN and AF — AJ
are stronger than all other components when the three quantum numbers (TV, J, F) are
much larger than 1.
2.2 Large Amplitude Motions
In semirigid molecules, interactions with vibrations are treated by introducing centrifugal
distortion constants into the Hamiltonian and by expressing the rotational constants Bx
as functions of the vibrational quantum numbers Vf
Bx,v - BXfi - J2 «*>; + ^) (2-33)
where di is the degeneracy of the vibrational mode. For small amplitude vibrations,
the Coriolis interaction terms are usually small compared to the difference between the
vibrational energies of the two state, and the Coriolis effect can be treated as a contri¬
bution to the a constants [30]. But for large amplitude motions (LAM), the Coriolis
interactions normally cannot be treated anymore in this way and have to be expressed
explicitly. A rotation-LAM Hamiltonian for molecular complexes has been presented
by Makarewicz and Bauder [31], who have shown that it is possible to remove locally
10 Chapter 2. Theory
the Coriolis coupling on some subspace of the internal coordinates using the method of
rotating molecular axis [32].
An elegant method for the accurate and efficient computation of rotational transitions
of a molecule with an arbitrary large amplitude motion was reported by Makarewicz [33].
The Hamiltonian is defined in the general form
h = \ E gaßJJß + \ E (PrgaT + gaTPr)Ja
+ FCd + V(r) (2.34)
Za,ß=x,y,z
Zot=x,y,z
1+
2Pr + ^(Pr^g)
TT
g Pt- -^(Pr^g)
for which the elements gaf3 of the inverted kinetic energy tensor depend on the internal
coordinate r of the large amplitude motion as well as the determinant g = det \gaß\ of the
kinetic energy tensor. Ja are the components of the overall angular momentum operator
and pT = —ih-§f is the internal angular momentum operator. The kinetic energy tensor
is calculated numerically at a number of grid points along the variable r. The effective
elements g"i(r) may be adjusted from the elements gaf5(r) of the original model with
the help of correction factors da/3 which may be expressed in form of an expansion over
reasonably chosen expansion basis functions fk(i~)
g$ (r) =5Q/3WE<AW (a,ß = x,y,z,r). (2.35)
The effects of small amplitude vibrations are included as Coriolis interaction and cen¬
trifugal distortion terms. The fourth order terms are:
#cd = -[Cm(r),fT]+Jz - [CJK(r):pT}+J2Jz - [CK(r),pr]Jl - [cK(r),pr]+[J2 Jz}+
-[Am(r),p% - [AJm(r),p2T}+J2 - [A*m(r),p2]+J2 - [5m(r),p2T]+J2xy
-Aj(r)J4 - Ajk(t)J2J2 - AK(r)Jt - 25j(t)J2J2y - 8K(r)[J2xy, J2}+ (2.36)
where Jxy — J2 — J2. The potential function V(r) for the LAM is assumed to take the
form of an expansion
y{r) = YJdVkWk(r) (2.37)k
where the expansion basis functions Wk(r) may be arbitrarily defined by the user in a
separate subroutine. This potential function is then evaluated at the same grid points as
for the kinetic energy.
For some examples of application of this program, see Refs. 34-36.
Chapter 3
Spectrometers
3.1 Molecular Beam FTMW Spectrometer
Most of the measurements were done with MB-FTMW spectrometers. The design of
these spectrometers, which are similar to that described first by Balle and Flygare [8],
has been described in detail in Refs. 4,6,37-39. Therefore only a summary is given here.
The theory of the pulsed Fourier transform microwave spectroscopy [9,40-43] and of the
molecular beam spectrometer [8,44-51] have been discussed in the literature.
The Fabry-Pérot cavity consists of two spherical mirrors of 40 cm diameter, 180 cm
(first spectrometer) or 106 cm (second spectrometer) radius of curvature and separation
of about 80 cm. One mirror may be adjusted manually or with a stepping motor to
bring the cavity into resonance with the excitation frequency. The high quality factor
Q1, which exceeds 30000 above 8 GHz, limits the accessible spectral range for a given
mirror setting to less than 1 MHz. The microwave radiation is coupled to the cavity
either through a circular iris from a waveguide with a special tuning device (Gordon
coupler, 8-26.5 GHz) or by an L-shaped antenna from a coaxial line. The Fabry-Pérot
cavity is placed in a vacuum chamber evacuated by a diffusion pump. A second set of
smaller mirrors is placed perpendicularly to the main cavity for the application of the
pump power in double resonance experiments [52].
The molecular beam is produced by an expansion of the gas mixture from a stagnation
pressure of 1-5 bar through a nozzle into vacuum (about 10~5 mbar). An electromechan¬
ical valve (General Valve Series 9, Bosch fuel injection valve 0 280150 825) generates gas
pulses with a duration of the order of 1 ms. Different types of nozzle caps can be used:
^he quality factor Q is defined by Q = (en2Jgy°dt8ipated peHycie) and determines the bandwidth Ai/
by Av = v/Q.
11
12 Chapter 3. Spectrometers
simple cylindrical nozzle caps of 3-7 mm length and 0.5 or 1 mm diameter, or conical
nozzle caps of 20-30 or 100° opening angle. The nozzle may be combined with an electric
discharge [53], or the valve can be heated when measuring substances with low vapour
pressures [35]. In the first spectrometer, the jet is introduced vertically (i.e. perpendicu¬
lar to the cavity axis) as in the original design of Flygare. In the second spectrometer, the
valve can be placed in the movable mirror; this setup with the jet along the cavity axis -
coaxially oriented beam resonator arrangement (COBRA) - gives higher sensitivity and
better resolution [51,54].
The spectrometers are operating in the frequency range 4-26.5 GHz. The output of
a microwave synthesizer is split into two parts. The frequency of the first part is shifted
by 30 MHz in a single-sideband modulator. From this signal, a microwave pulse of 1 ps
duration is formed with a pair of PIN diode switches. This signal is amplified to the
necessary power level. The pulse is applied to the Fabry-Pérot cavity via a circulator
(or a single-pole double-throw switch). The microwave pulse polarizes the molecules
or molecular complexes in the jet. When the stored microwave energy in the cavity
is decayed sufficiently, the radiation of the molecules is extracted from the cavity and
directed via the circulator to the detection system, which is protected by a third PIN
switch during the application of the microwave pulse. The signal from the molecules are
first amplified, mixed with the second part of the power from the synthesizer down to the
frequency range 27.5-32.5 MHz and, after further amplification, mixed with a frequency
of 27.5 MHz. The signals in the 0-5 MHz range are digitized with a 12-bit analog-to-
digital converter at a rate of 10 MHz for 256-4096 channels. Many averaging cycles are
accumulated by the computer, and the total signal is Fourier transformed to yield the
frequency spectrum. Up to 12 microwave pulses may be applied to a single gas pulse in
order to improve the signal-to-noise ratio, but with some loss of resolution, as the signal
is not constant over the duration of the gas pulse (see Chap. 6). Accurate frequencies
are obtained from least-squares fits to the time domain signals [55,56].
The Stark effect can be measured by mounting two solid metal plates (length 40 cm,
height 28 cm) separated by 28 cm in the central region of the resonator and applying
opposite DC voltages of up to 10 kV to each of the Stark plates. The homogeneity of the
electric field at the border of the plates is improved by mounting, on both the upper and
lower sides of the cuboid formed by the two plates, two rods at half the distance between
the centre and the plates and applying half the voltage of the plates to the rods.
Chapter 3. Spectrometers 13
In order to cancel the earth's magnetic field («0.4 G)2, three sets of rectangular
Helmholtz coils were installed around the centre of the cavity of the first spectrometer
(see App. A). As the magnetic field is very inhomogeneous in the cavity, no absolute
zero field can be achieved. On the other hand, a magnetic field of about 2 G may be
obtained by selective operation of the coils.
3.2 Waveguide FTMW Spectrometer
The details of the waveguide FTMW spectrometer have been described in Refs. [57-60].
In the meantime, the spectrometers were changed to a system with a single microwave
source [61]. A phase-locked backward wave oscillator (BWO) generates the microwave
radiation, and the output is split into two parts. The frequency of the first part is
shifted by fIFi = 150 MHz in a single-sideband modulator. A digitally driven YIG
filter (8-18 GHz, bandwidth 50 MHz) suppresses the undesired sidebands and the carrier
frequency.3 The microwave pulses, formed with a pair of PIN diode switches, are amplified
in a travelling wave tube amplifier (TWTA). Since the TWTA produces considerable
noise, a third PIN switch blocks the noise from entering the waveguide cell and detection
system, which is protected by a fourth switch behind the waveguide. The amplified signal
is mixed with the second part of the power from the BWO, amplified and mixed with
a rf signal (z^F2 = vwi — zVax/2) down to the frequency range 0-fmax. The amplified
signal is sampled for 512 channels with a 3-bit A/D convertor at a sampling frequency
of twice the bandwidth ^max = 5, 10 or 50 MHz. Pulse widths are ranging from l/vmax
(for polar molecules) up to 1000 ns for non-polar molecules, the pulse power may reach
some 10 W. Typical pulse repetition times are 18-19, 40 and 66 /is for umax = 50, 10 or
5 MHz, respectively. Typical pressures are 0.1-0.6 Pa for polar and 1-3 Pa for non-polar
molecules.
21 G (Gauss) = 1(T4 T (Tesla) = 10"4 Vsm"2.
3In the MB-FTMW spectrometer, the Fabry-Pérot cavity behaves as a narrow bandpass filter.
Chapter 4
The Fluorobenzene—Carbon
Monoxide Van der Waals Complex
4.1 Introduction
The spectroscopic study of Van der Waals or hydrogen-bonded complexes involving car¬
bon monoxide has revealed important insights into their structural and dynamical prop¬
erties. The results for more than 30 different CO complexes, mostly with rare gases or
small inorganic molecules, have been reported. Typically, the rare gas-CO complexes
have been found to be T-shaped [62,63]. Most of the hydrides form a hydrogen bond
to the negatively charged carbon end of CO [64-69], whereas in NH3-CO, the nitrogen
is closest to the CO subunit [70]. Often, the corresponding complexes with the isoelec-
tronic N2 were similar to those with CO. The small number of measured CO complexes
involving organic molecules exhibit a large variety of binding patterns [7,34,71-77].
A near slipped parallel structure was determined for the propyne-CO and propyne-N2
complexes [71], while acetylene and methanol were found to form a hydrogen bond to the
carbon end of CO [72,73]. In the complex with benzene, CO attaches to the tx electron
system in a parallel fashion with its centre of mass nearly on the six-fold symmetry
axis of benzene [74]; the same is found for benzene-N2 [78]. The observed rotational
transitions of both benzene-CO or -N2 complexes were characteristic for molecules with
essentially free internal rotation between the subunits. The rotational spectrum of the
pyrrole-CO complex was typical for an asymmetric rotor, and the absence of additional
splittings did not reveal a specific large amplitude motion [75]. Here, a geometry with CO
again above the 7r electron system in the symmetry plane perpendicular to the ring plane
14

Chapter 4. Fluorobenzene-Carbon Monoxide 15
was determined from spectra containing different CO isotopomers. In the pyridine-
CO complex, it came as a surprise that CO attaches in the ring plane [76]. Detailed
investigations of isotopomers revealed that CO lies in the region between the nitrogen
and the a hydrogen of pyridine. The rotational transitions of the furan-CO complex
were all split by a few MHz indicating a large amplitude motion between two minima on
the potential energy surface [34]. The analysis of the observed transitions was consistent
with CO being located above the tt electron system and executing an internal rotation
between two equivalent orientations approximately perpendicular to the symmetry plane
perpendicular to the ring plane. Finally, a planar structure was determined for the
isoxazole-CO complex, with CO lying approximately radially away from nitrogen [77].
Contrary to the CO complexes, all the corresponding complexes of aromatic molecules
with rare gases possess structures with the rare gas atom exclusively above the ring plane
interacting with the tt electron system [3,4,79-91].
The rules which govern the geometry preferred by complexes between aromatic mole¬
cules and CO are not clear. Each case studied so far has revealed new features. But it is
obvious that CO, as a slightly polar molecule, is a very sensitive probe for exploring the
influence of substituents on intermolecular interaction potentials of aromatic molecules.
And in addition, replacing a rare gas atom by a diatomic molecule adds two additional
degrees of freedom for the orientation of the probe molecule relative to the aromatic ring.
Fluorobenzene is an example of an aromatic molecule with an electronegative sub¬
stituent attached to the benzene ring. While there are many Van der Waals complexes
of benzene studied by rotational spectroscopy [4], only the fluorobenzene-Ar [89,90],
fluorobenzene-Ne [91], and the fluorobenzene-S02 [92] complexes have been studied by
microwave spectroscopy. In addition, the fluorobenzene-N2 complex has been studied by
resonant two-photon ionization spectroscopy without rotational resolution [93].
In this chapter, an investigation of the microwave spectrum of the fluorobenzene-CO
complex is reported. The spectrum has been measured with a pulsed nozzle Fourier
transform microwave spectrometer between 5-18 GHz. Structural information has been
gained from the measurements of fluorobenzene and fluorobenzene-4-di complexed with
12C160, 13C160, and 13C180. The electric dipole moment of the complex has been de¬
termined from the Stark splittings of selected transitions. A model of the complex is
proposed in which CO is executing an internal rotation above the ring plane with two
equivalent minima of the potential function; this was determined from the frequencies of
the two observed states using an effective Hamiltonian for this model.
16 Chapter 4. Fluorobenzene-Carbon Monoxide
4.2 Experimental Details
The rotational spectra of fluorobenzene-CO and four of its isotopomers were measured
with a pulsed nozzle Fourier transform microwave (FTMW) spectrometer between 5-
18 GHz. Two different geometrical orientations of the jet were employed during various
stages of the investigation. For initial scans over large frequency regions, the vertical
arrangement of the molecular beam was used. Accurate high resolution measurements
of individual transition frequencies were performed with the jet parallel to the Fabry-
Pérot resonator axis because in that mode narrower linewidths (of the order of 5 kHz full
width at half-maximum) are generally observed. A second set of mirrors perpendicular
to both the main cavity and molecular beam enabled the use of microwave-microwave
double resonance experiments [52] to confirm the assignment of two transitions sharing
a common energy level.
Gas pulses of 1 ms duration were generated by an electromechanical valve (General
Valve, Series 9) equipped with a simple cylindrical nozzle cap of 5 mm length and 0.5 mm
diameter. Gas mixtures containing 0.5-1% fluorobenzene and about 5% CO in helium
were used at stagnation pressures between 2-3 bar. The complexes formed in the jet were
polarized with microwave pulses of 1 ps duration and a peak power of 0.4-0.8 mW and
1-1.5 mW for ßt>- and ^a-type transitions, respectively. While up to twelve microwave
pulses were applied to each gas pulse during broadband scans, only three microwave
pulses were applied during each gas pulse for accurate frequency measurements. For
these measurements, 2048 channels were used to store the polarization decays, while only
512 channels were used during broadband scans. Individual transition frequencies were
determined from least-squares fits of the time-domain decay signals [56]. The accuracy
of the frequency determinations was estimated to be better than 1 kHz.
Measurements of the Stark effect of some of the rotational transitions were made by
mounting two solid metal plates separated by approximately 28.8 cm in the central region
of the Fabry-Pérot resonator, and applying opposite DC voltages of up to 6 kV to each
of the Stark plates. The molecular beam was perpendicular to both the resonator axis
and the Stark field; the oscillating electric field of the microwave radiation was parallel
to the Stark field, and only AMj=0 transitions were observed. The electric field between
the plates was calibrated using the J = 1 <— 0 transition of OC34S and the accurately
known permanent electric dipole moment of 0.715291(29) D [94].

Chapter 4. Fluorobenzene-Carbon Monoxide 17
The sample of the normal species of fluorobenzene was obtained from Fluka and was
used without further purification. An isotopically labelled 13C160 sample which contained
about 10 % 13C180 was obtained from Cambridge Isotope Laboratories. Fluorobenzene-
A-di was prepared from l-bromo-4-fluorobenzene by reacting with magnesium to form
the Grignard compound, which was subsequently hydrolysed with D20.
4.3 Assignments and Analysis
The frequency range from 7.7-13.8 GHz was initially scanned, and a number of intense
transitions were observed; these were attributed to a gas phase species which required
both fluorobenzene and CO to be present in the sample mixture. Characteristic doublets
could be assigned as /x6-type transitions with Ka = J or Kc = J respectively, as predicted
from a model with the CO above the ring plane of fluorobenzene. With this assignment,
further /i^- and also some ßa-tjpe transitions were readily located over the 5-18 GHz
frequency range, and the assignment could be confirmed by microwave-microwave double
resonance experiments. The spectrum is that of a very asymmetric top (k = —0.186).
Another set of transitions close to the already assigned ones could be assigned as a
different internal rotation state of the fluorobenzene-CO complex, and was labelled with
v — 1. No transitions due to a /ic electric dipole component were found.
In order to derive a reliable estimate of some of the structural parameters for the
fluorobenzene-CO complex, a number of additional isotopomers, 13C and 180 in CO and
D in fluorobenzene, were investigated over the 5-18 GHz frequency range. Rotational
transitions for fluorobenzene-13C160, fluorobenzene-4-<ii-12C160 and fluorobenzene-4-
<ii~13C160 were observed for both internal rotation states (v = 0 and 1), while for
fluorobenzene-13C180, only transitions in the v = 0 state could be observed. The deu¬
terium hyperfine structure was partially resolved for the complexes containing fluoro-
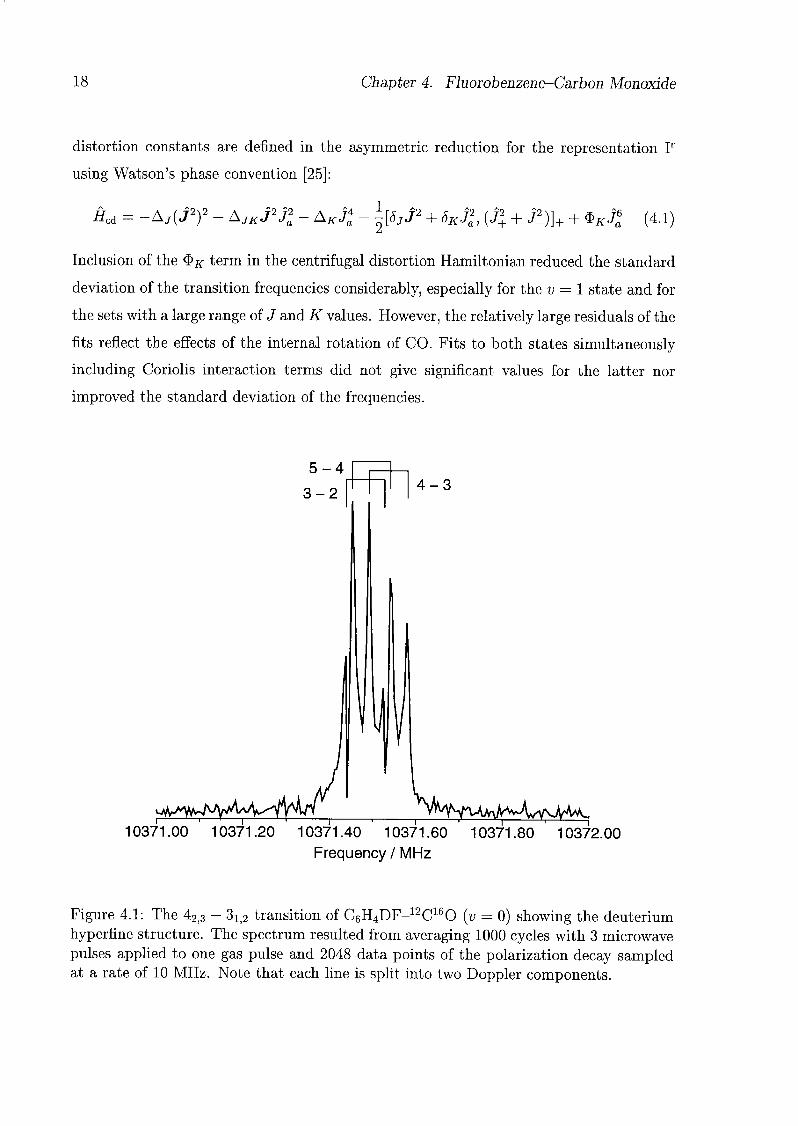
benzene-4-di (Fig. 4.1).
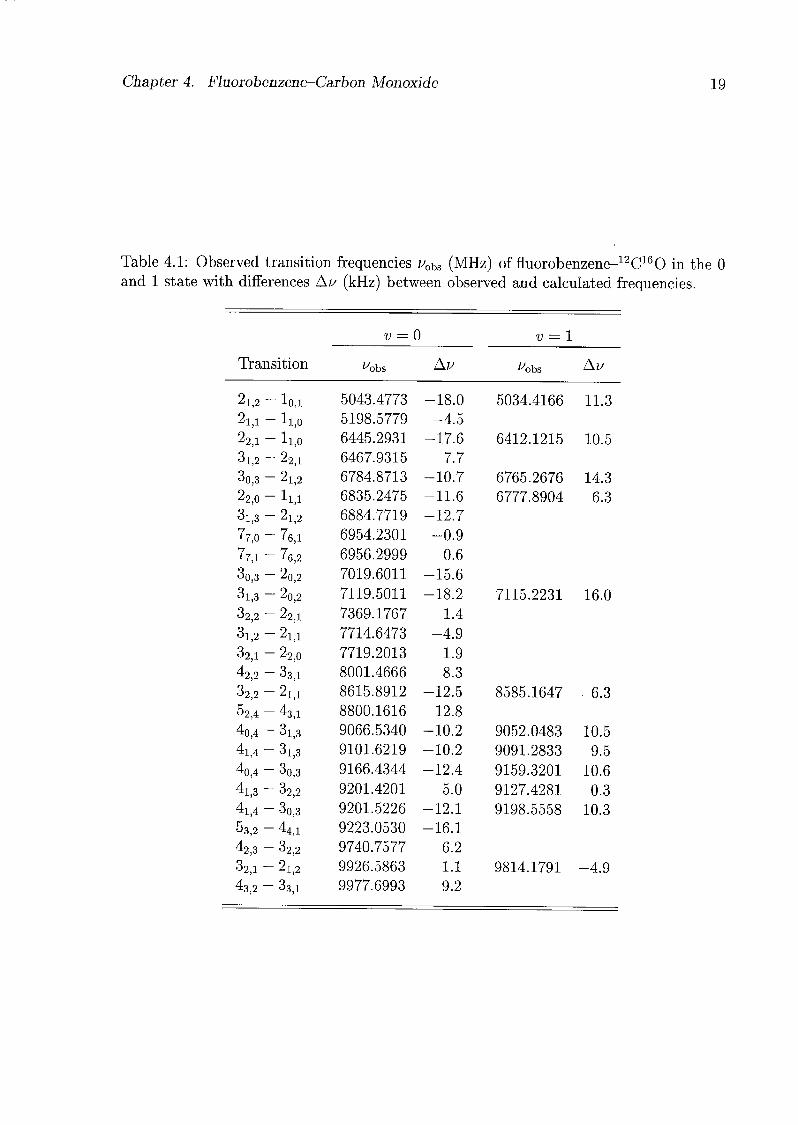
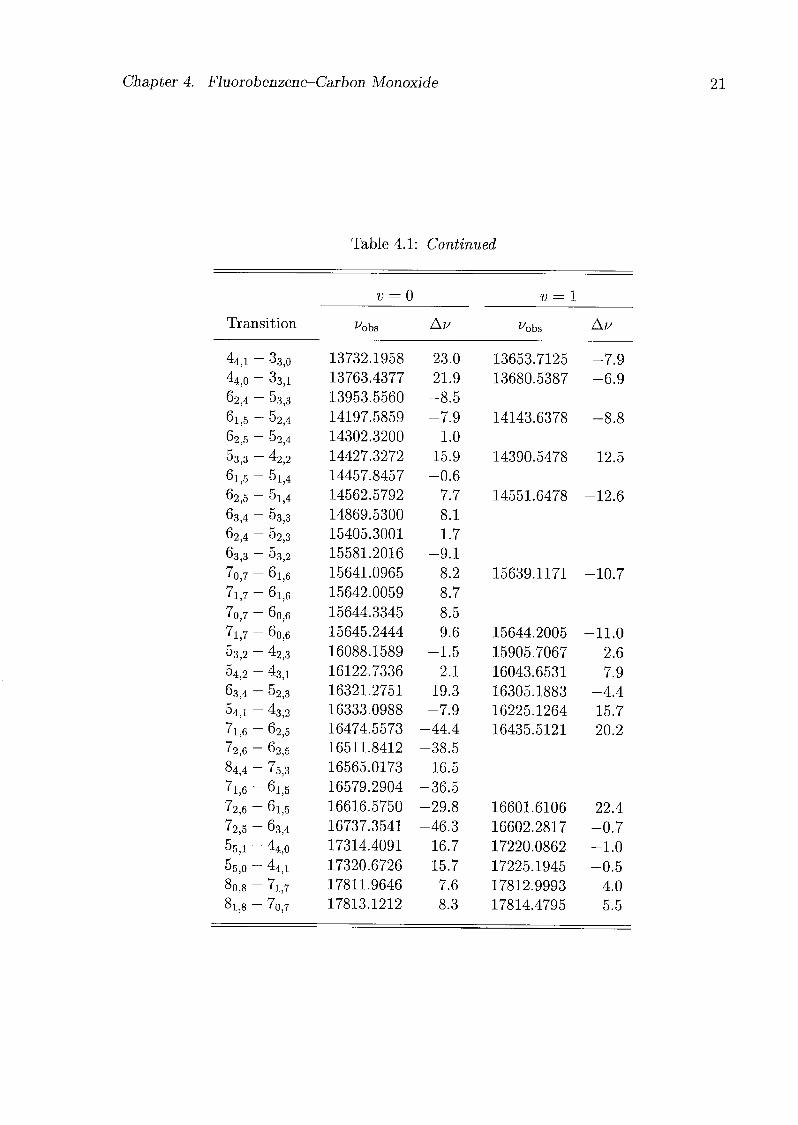
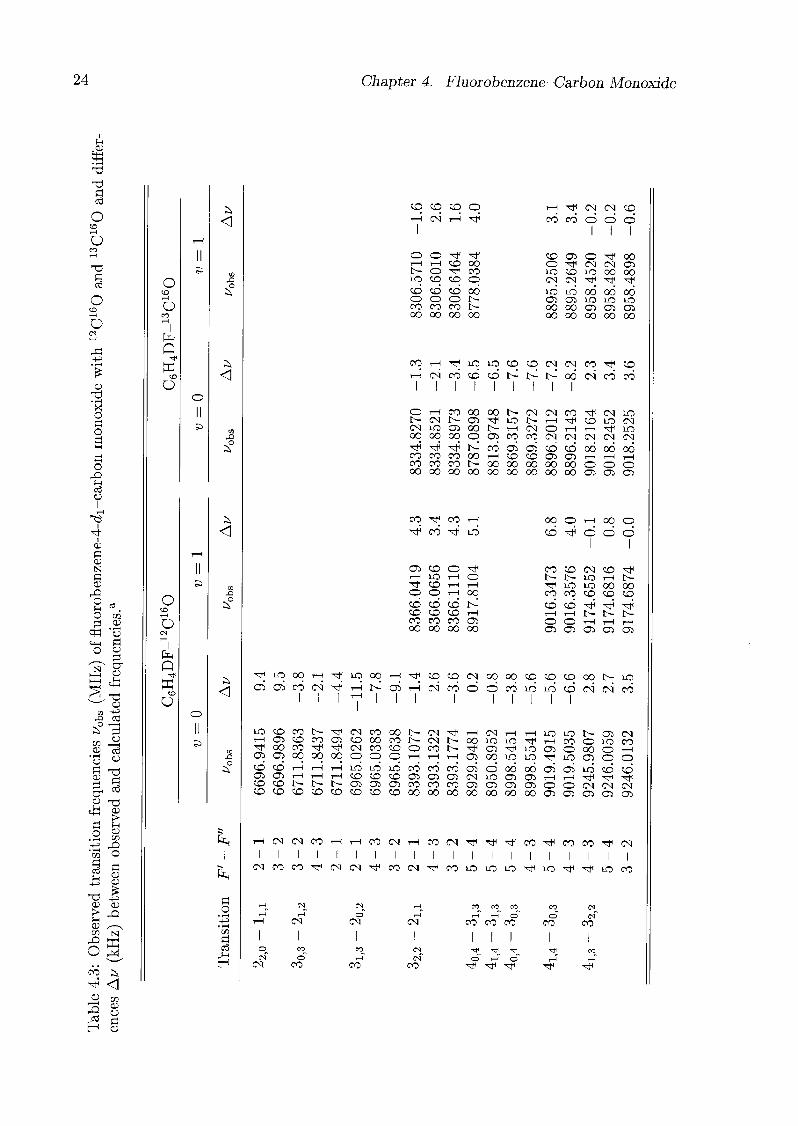
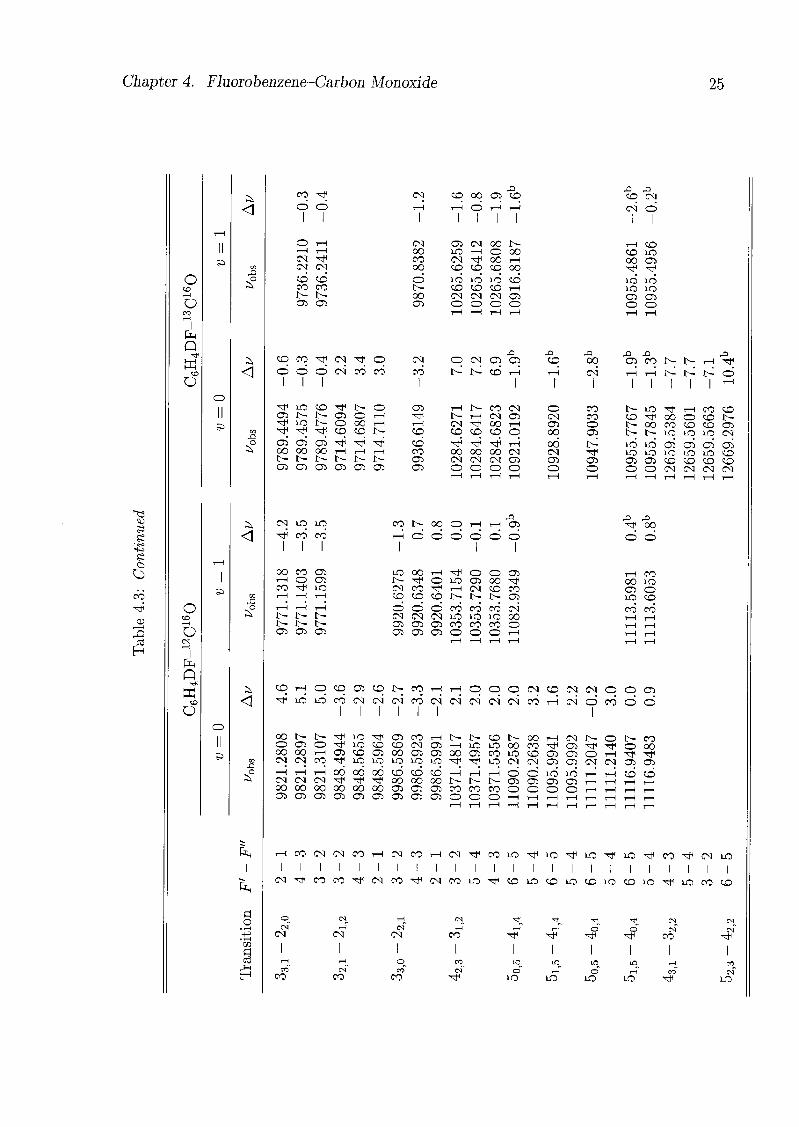
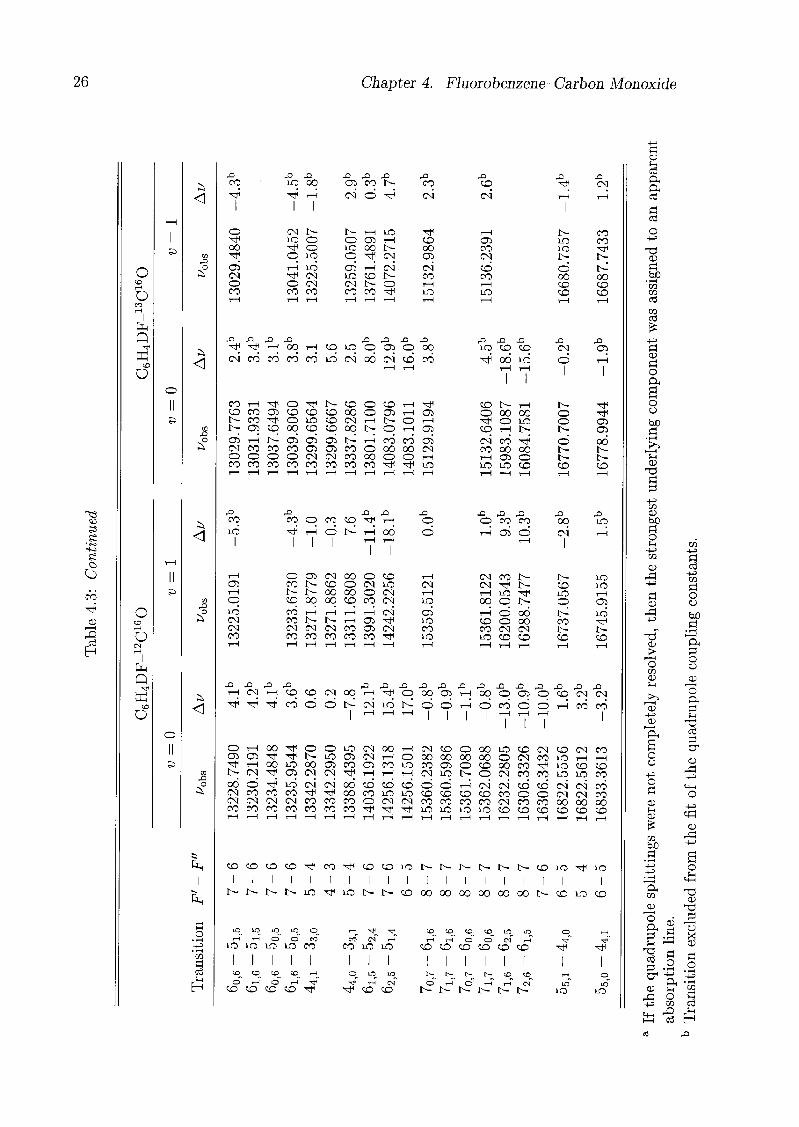
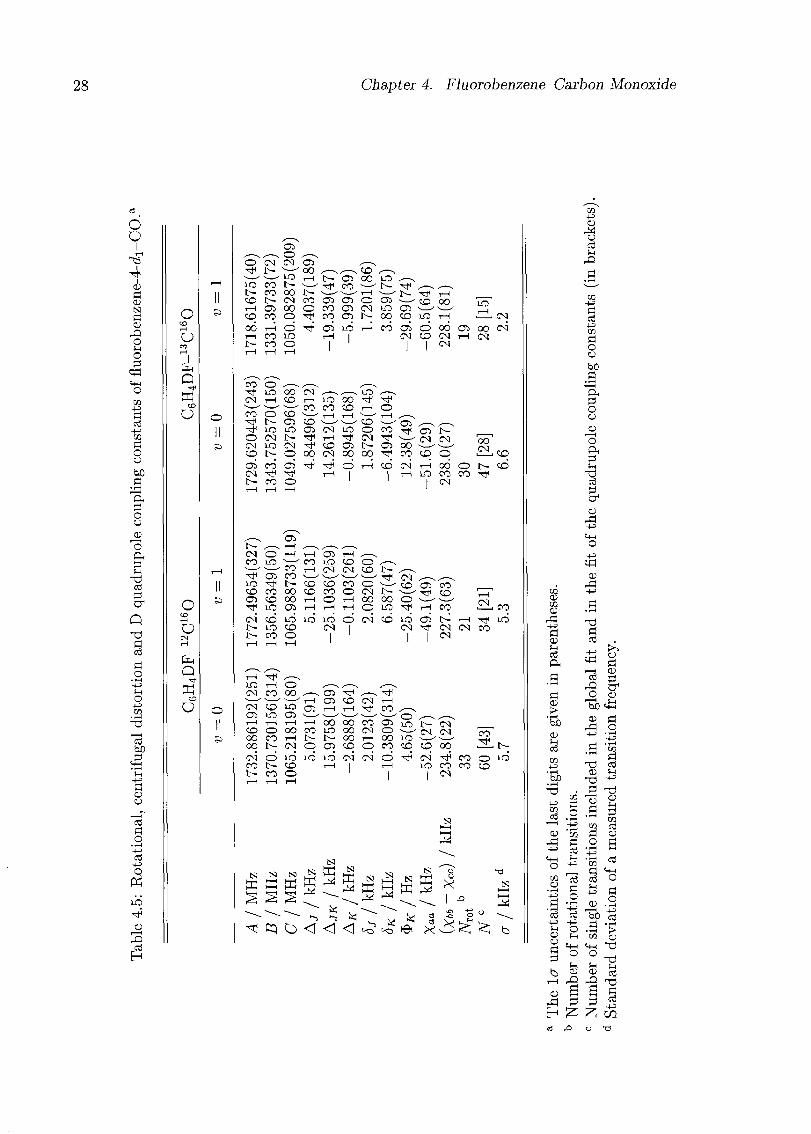
The frequencies of all measured transitions of the fluorobenzene-CO isotopomers are
listed in Tabs. 4.1-4.3. Rotational constants and centrifugal distortion constants were
fitted simultaneously for each isotopomer and each state independently; the results are
given in Tabs. 4.4-4.5. The deuterium nuclear quadrupole coupling constants were fitted
separately using only transitions with J' up to 4 (or 5 in the case of fluorobenzene-4-<i1-
12C160, v = 0), and were kept fixed in the fit with all the transitions. The centrifugal
18 Chapter 4. Fluorobenzene-Carbon Monoxide
distortion constants are defined in the asymmetric reduction for the representation F
using Watson's phase convention [25]:
H,cd Aj(J2)2 - AJKJ2J2 - AKJl - -[SjJ* + 5KJi, (JJ + Ji)]+ + $KJ6a (4.1)
Inclusion of the $# term in the centrifugal distortion Hamiltonian reduced the standard
deviation of the transition frequencies considerably, especially for the v = 1 state and for
the sets with a large range of J and K values. However, the relatively large residuals of the
fits reflect the effects of the internal rotation of CO. Fits to both states simultaneously
including Coriolis interaction terms did not give significant values for the latter nor
improved the standard deviation of the frequencies.
10371.00 10371.20 10371.40 10371.60
Frequency/MHz
10371.80 10372.00
Figure 4.1: The 42]3 - 3ij2 transition of C6H4DF-12C160 (v = 0) showing the deuterium
hyperfine structure. The spectrum resulted from averaging 1000 cycles with 3 microwave
pulses applied to one gas pulse and 2048 data points of the polarization decay sampledat a rate of 10 MHz. Note that each line is split into two Doppler components.
Chapter 4. Fluorobenzene-Carbon Monoxide 19
Table 4.1: Observed transition frequencies uohs (MHz) of fluorobenzene-12C160 in the 0
and 1 state with differences Au (kHz) between observed and calculated frequencies.
v = 0 v = 1
Transition ^obs Av ^obs Av
2l,2 -Vi 5043.4773 -18.0 5034.4166 11.3
2i,i--li,o 5198.5779 -4.5
22,1 -li,o 6445.2931 -17.6 6412.1215 10.5
3l,2 '~~ 22,1 6467.9315 7.7
3o,3 -2i>2 6784.8713 -10.7 6765.2676 14.3
22,0 -ll,l 6835.2475 -11.6 6777.8904 6.3
3i,s-- 2i>2 6884.7719 -12.7
^7,0 '- 76,1 6954.2301 -0.9
7t,i-- 76i2 6956.2999 0.6
3o,3 '— 2q,2 7019.6011 -15.6
3i,3-_ 20,2 7119.5011 -18.2 7115.2231 16.0
32,2 — 22ji 7369.1767 1.4
3l,2 "-2i,i 7714.6473 -4.9
32,1 _ 22,o 7719.2013 1.9
4,2 -33,i 8001.4666 8.3
32,2 -2i,i 8615.8912 -12.5 8585.1647 6.3
02,4 -43,i 8800.1616 12.8
40,4'-3i,3 9066.5340 -10.2 9052.0483 10.5
V--3i,3 9101.6219 -10.2 9091.2833 9.5
4o,4-- 3o,3 9166.4344 -12.4 9159.3201 10.6
4i,3-- 32)2 9201.4201 5.0 9127.4281 0.3
4m-- 3o,3 9201.5226 -12.1 9198.5558 10.3
53,2 -44,1 9223.0530 -16.1
42,3 — 32,2 9740.7577 6.2
32,i -2ll2 9926.5863 1.1 9814.1791 -4.9
43,2--3s,i 9977.6993 9.2

20 Chapter 4. Fluorobenzene-Carbon Monoxide
Table 4.1: Continued
v — 0 v = 1
Transition ^obs Au ^obs Au
4l,3-- 3i)2 10102.6644 -2.2
33,i-~~ 22j0 10112.3472 -2.3 10055.6660 2.8
43,i-~ 33io 10117.2949 4.8
33,0 '_ 22,i 10242.8443 -1.1 10173.2658 2.2
62,5 _ 53j2 10264.5278 11.9
42>2-_ 32,1 10394.6117 3.3
42,3-~ 31^ 10642.0020 -1.0 10621.0686 -4.1
63,4-- 54,i 10987.5255 30.8
52,3 '-43,2 10999.3495 3.9 10867.3945 -3.6
5o,5 '-V 11281.1976 -4.9 11271.9018 1.1
5l,5 •-4i,4 11292.2239 -3.9 11284.7455 0.5
5o,5 '-40,4 11316.2858 -4.6 11311.1363 -0.5
5l,5 •-40,4 11327.3121 -3.6 11323.9809 -0.1
5l,4"-42j3 11790.1071 2.2 11720.8901 -7.2
52,4 -42>3 12050.3672 9.8 12007.9170 -10.7
63,3 - 54,2 12296.4216 -9.4
5l,4 -4i,3 12329.4446 3.3 12290.9997 -10.6
43,2-_ 32,i 12370.8448 4.6 12318.4958 -5.6
53,3 -43,2 12451.0942 14.7
54,2 -44,i 12507.8333 -15.5
54,1 '-44,o 12547.3602 -20.8
52,4 -4i,3 12589.7043 10.5 12578.0250 -15.6
74,4 '-65,1 12763.5197 22.6
53,2 -43)i 12837.9538 2.0
02,3 -42)2 12975.5818 4.4
43,i-~ 32,2 12990.9629 2.8 12880.1391 -2.6
73,5 "-64,2 13010.0137 35.2
42,2--3i,3 13436.4261 17.1
60,6 _ 5i)5 13466.5449 2.5 13461.2889 -9.0
61,6 — 5l,5 13469.7836 3.5
60,6 — 5o,5 13477.5712 3.5
61,6 _ 50,5 13480.8098 4.5 13478.0646 -9.5
Chapter 4. Fluorobenzene-Carbon Monoxide 21
Table 4.1: Continued
v = 0 v = 1
Transition ^obs Av ^obs Au
44,1-- 33,0 13732.1958 23.0 13653.7125 -7.9
44,o--33,1 13763.4377 21.9 13680.5387 -6.9
62,4-_ 53,3 13953.5560 -8.5
61,5 -- 52,4 14197.5859 -7.9 14143.6378 -8.8
62,5 -- 52,4 14302.3200 1.0
^3,3 "-42,2 14427.3272 15.9 14390.5478 -12.5
61,5 -" 5i,4 14457.8457 -0.6
62,5 --5i,4 14562.5792 7.7 14551.6478 -12.6
63,4--53,3 14869.5300 8.1
62,4-- 52,3 15405.3001 1.7
63,3 -- 53,2 15581.2016 -9.1
7o,7 "- 61,6 15641.0965 8.2 15639.1171 -10.7
7i,r--61,6 15642.0059 8.7
7o,7 - 60,6 15644.3345 8.5
7i,7-- 60,6 15645.2444 9.6 15644.2005 -11.0
53,2 "42,3 16088.1589 -1.5 15905.7067 2.6
04,2--43,i 16122.7336 2.1 16043.6531 7.9
63,4-- 52,3 16321.2751 19.3 16305.1883 -4.4
54,1 --43,2 16333.0988 -7.9 16225.1264 15.7
7l,6-- 62,5 16474.5573 -44.4 16435.5121 20.2
72,6 "- 62,5 16511.8412 -38.5
84,4 "- 75,3 16565.0173 16.5
7i,6--61,5 16579.2904 -36.5
72,6 _- 61,5 16616.5750 -29.8 16601.6106 22.4
72,5 -63,4 16737.3541 -46.3 16602.2817 -0.7
55,1 -44,0 17314.4091 16.7 17220.0862 -1.0
55,0 "-44,1 17320.6726 15.7 17225.1945 -0.5
80,8 -7i,7 17811.9646 7.6 17812.9993 4.0
81,8 "- 7q,7 17813.1212 8.3 17814.4795 5.5

22 Chapter 4. Fluorobenzene-Carbon Monoxide
Table 4.2: Observed transition frequencies i/0bs (MHz) of fluorobenzene-carbon monoxide
with 13C160 and 13C180 and differences Au (kHz) between observed and calculated
frequencies.
isition
C6H5F-_13C16q C6H5F-13C18Q
v = 0 v = l v = 0
Tran ^obs Au ^obs Au ^obs Au
3l,2 "- 22,1 6257.9579 1.6
22,1 "-li,o 6419.0302 -8.9
3o,3 "_ 2l,2 6656.8805 -9.2
3i,3 - 2i,2 6773.6670 -10.4
22,o --li,i 6788.5127 -8.2
3o,3 "- 2o,2 6915.8835 -12.4
3l,3 "- 2o)2 7032.6709 -12.7
32,2 -2i,i 8556.1129 -6.3 8524.5300 5.8 8428.5511 -10.4
40,4-- 3i,3 8915.4777 -8.1 8904.4113 6.9 8644.1058 -5.6
4l,4-_ 3i,3 8959.0692 -7.8 8701.3180 -3.0
4l,3"- 32,2 8960.0002 3.3 8898.6046 -0.7 8564.4101 8.6
40,4-- 3o,3 9032.2646 -9.0 8786.0312 -6.1
4m-- 3o,3 9075.8561 -8.7 9075.0867 4.5 8843.2418 -5.1
42,3-- 32,2 9573.6032 5.4
43,2-- 33,i 9789.6937 2.1
32,1-- 2i,2 9797.5058 -1.5 9694.6297 0.5 9581.8646 -6.8
43,i-_ 33,o 9908.5781 -3.9
4i,3-_ 3i,2 9939.4518 1.2
33>i-_ 22,o 10079.5456 1.7 10020.4133 6.4 9989.3580 -6.5
42,2-_ 32,i 10187.0888 1.8
33,0 -- 22,1 10195.7578 0.8 10126.2785 6.4 10088.8089 -6.7
42,3-- 3i,2 10553.0556 4.1 10531.0917 -7.0 10369.6826 3.8
02,3 "-43,2 10613.1218 5.0
5o,5 "-4i,4 11103.7575 -3.7 11097.8345 0.3 10781.1885 -1.3
5l,5 "-4i,4 11118.3014 -2.8 10801.7808 0.7
5o,5 "-40,4 11147.3487 -3.6 10838.4000 0.6
5i,5 --40,4 11161.8931 -2.3 11161.7620 -2.4 10858.9924 2.7
5l,4""42,3 11538.0010 6.8 11477.6074 -1.5 11105.9334 5.0
63,3 --54,2 11770.5162 6.6

HO
Ol
Üi
MM
^COI—'d^CO^OI-1
OtOCOJ-'^^tOih-liOh-iOiCOJOCOi-'tO
ii
ii
ii
i[
ii
ii
ii
ii
ii
ii
ii
ii
ii
iSS^i^aiO5^ÜiO5i^^02O)OiroCii^CnW05ÜiCnülOiOiWi^ü0Ji.i|i
OJ-J^^^_COWtObOWtOOOH-Jh-'H-»bO^OWWCOjD^OI—'
HM
HW
HW
I—'
I—^
1—'
I—'
I—'
I—'
I—'h-'
r—»(—'h-'h-'h-'h-'I—'I—'I—'h-'h-'h-'h-'h-'h-'I—'
(—'H-»h-'h-'
-jKisscö050iO)oioiaiüiatüiüiA^ü3o:uuwwcoutoN3(o
cnentotococotototoooo^a^t^^eococo-qoientotototooo^co
iÈ.UffiffltDCiilOI-ir>itiCnQriOQmiLiKMI»^-J»Jffl01fflfflQ
4^
eo
01
en
cd
co
to
.
i-'ço<iU|fs.toi)OviÉ
ip-cibobcnbiiobcoH
bJCDÜlUi^OOOOÜltOH
COI—'CDCOOlOOtJ^OOOlOl
CO00CO00tOai4^Cn00Cn
oo
I—'Otl^enOOOOCO^^I—'00i|iSS©0l0)01O0\0i
•
-si-j
en
^i
o)œ
h'tocntOhJ^coi—'OocococDOiOicoi—'to
en
Ol
to
to
4^
COO-JtOCnOCOO
i—'Oi-aeococooioioo
oen
oo
Co
en
too o
oo
to
^a
^i
OJ^HO
CO—aOlCOtOtOCnCOh^
MSOil\3SH(OSO
II
II
Ii—
.tO
H-'
tO
i—
i—
i—
.—
i—
i—
OHOOOO^M^SHOiIxOOWWMMMai^tDWlO
coco4^boto^cntotoaitoai4^toaiaicocncobo^t>oèni—•
to
l—i
CD
en
CO
Ol
CD
Ol
to
I—iooo
CD
-4
4^
en
4^
CD
en
4^
en
CD
Cn
h->
l—i
f—i
en
en
CD
CO
co
en
f-i
as
co
en
-a
i—i
Ol
co
1—1
Ol
en
Olco
0O
4^.
Ol
1—1
1—1
OO
i—i
4^
oo
CO
h-1
1—1
to
to
o CD
co
Ol
4^
co
CO
o
1o
to
oo
-J
4^
to
0O
Ol
Cn
co
Ol
4^
en
ai
co
CO
Cn
4^
h-1
o
Cn
4^o co
en
4^o CO
4^
CO
Cn
Ol
I—1
CD
Ol
to
Ol
CD
co
co
o Ol
CO
00
1—1
00
to
1CO
too
to
oo
1—1o
to
CO
CO
00
CD
co
CO
OlCO
o
CO
Ol
o
CO
4^
1—1
Co
to
CO
Ol
to
co
to
CDCO
Ol
Ol
Ol
coOS
o CO
to
to
Ol
to
o
to
1Cn
1Cno
1en
h-1
to
en
en
oo
COto
en
-a
to
-a
ai
co
to
to
en
en
CO
-a
CO
CO
1—1
en
OO
en
o
1CO
to
-a
co
ai
h-1
P co
o > «F CT"
OOl
Ol
i i—>
co
o o
cr
to
•s c o >1o cr § fcq § ai I P cro ö o fcs S. 0>
Oi
O CO
CO
f-iO 4^
co I
CO
to
bo
en
4^
4^
CD
--4
~4
co
co
CO
i—i
ai
4^
en
CO
oo
^4
Ci
tO
4^
4^
4^
CO
co
CO
to
co
co
i—i
4^
en
en
co
ai
-.1
en
c»
CO
~J
co
4^
co
4^
-4oo
OO
oco
ai
Cn
1^
00
oi—i
1—1
CO
ai
4^
h-1
0O
4^
ai
ai
--J
too
Ol
CD
co
4^o
4^
Ol
-<I
CO
^J
CO
cn
4^
en
co
boö
to
en
co
en
co
to
to
to
to
O0
Ol
to
I—'
oo
4^
to
ai
OCn
to
4^
oi
b)uh
oo
co
ai
to
l—i
CD
CO
Ol
SW
J^w
H*1
COM
sbb
i^
>
O
Ol q G
O
o
to
co
Table
4.3:Observed
transitionfr
equenc
ies
^0bs(MHz)
offluorobenzene-4-cZi-carbon
monoxidewith12C160and13C160and
differ¬
encesAu
(kHz
)between
observedand
calculatedfrequencies.a
to
41-
sition
F'-
-
^"
C6H4DF-_12C16Q
C6H4DF-_13C16Q
u=
0v=
lv=
i DV=
l
Tran
^obs
Au
^obs
Au
^obs
Au
fobs
Au
22,0
-
-li,i
2-
3-
-1
-2
6696.9415
6696.9896
9.4
9.5
3o,3
--
2l,2
3-
4-
2-
-2
-3
-1
6711.8363
6711.8437
6711.8494
-3.8
-2.1
-4.4
3i,3
--20
;22-
4-
3-
-1
-3
-2
6965.0262
6965.0383
6965.0638
-11.5
-7.8
-9.1
32,2
-
-2i,i
2--1
8393.1077
-1.4
8366.0419
4.3
8334.8270
-1.3
8306.5710
-1.6
4--3
8393.1322
-2.6
8366.0656
3.4
8334.8521
-2.1
8306.6010
2.6
3--2
8393.1774
-3.6
8366.1110
4.3
8334.8973
-3.4
8306.6464
1.6
4o,4
-~3i
,35--4
8929.9481
0.2
8917.8104
5.1
8787.0898
-6.5
8778.0384
4.0
4m--3l,3
5--4
8950.8952
-0.8
8813.9748
-6.5
4o,4
-~3o
,35--4
8998.5451
-3.8
8869.3157
-7.6
4--3
8998.5541
-5.6
8869.3272
-7.6
4l,4
-"3o
,35--4
9019.4915
-5.6
9016.3473
6.8
8896.2012
-7.2
8895.2506
3.1
4-
39019.5035
-6.6
9016.3576
4.0
8896.2143
-8.2
8895.2649
3.4
4i,3
-~32
,24--3
9245.9807
2.8
9174.6552
-0.1
9018.2164
2.3
8958.4520
-0.2
5--4
9246.0059
2.7
9174.6816
0.8
9018.2452
3.4
8958.4824
-0.2
3--2
9246.0132
3.5
9174.6874
-0.0
9018.2525
3.6
8958.4898
-0.6
9 4X
C O "sO O-
CD Ö tsi s CD
o b g §. CD
Chapter 4. Fluorobenzene-Carbon Monoxide 25
O
T—I
OCO
Ifa
Q
w
Ü
as
-to
e
CO
CD.—(
oCO
ÜCS
fa
Q
X>
X
^
&h
o
03
Öcd
CO ^cd ö
I I
O i-H
CN ^CN CN
CD CDco cor- I--Ol Ol
CN CO 00 Ol CO
i—l
11—1
1o
11—1
11—1
1
CN
OO
COOO
OlLO
CNCD
CNi—l
co
ooo
00CD
Ir-oo
00
COtr-00Ol
LO
CD
CNO
LO
coCN
O
LO
CD
CNO
CO
Olo
X
COXICN
CN
1o
1
1—1
cooo
coLO
Ol
LO
LOOlo
LO
LO
Ol
o
CO co ^ CN ^ o CN o CN CiX
OiXCO
x
COx
Oixi
CO r- 1>- ^H
Xi
cd1
cd1
cd1
CN co co CO
1
t^ lr^ CO 1—1
1
1—1
1CN
1i—i
1
1—1
1
ir^1
lr^1
lr^1 1—1
Ol
LO
LO
co
Olo
CO
t-ooo
CD
o1—1
1—1
ir-
ai
i—i
CD
i—i
t-CN
CO
ir-i—l
CO
CO
CNCO
CD
CN
Ol1—1
o
oCNOl00
COCOo
as
t-CD
t-t-
LO
00t-
00CO
LO
i—i
CO
CD
LO
coCDCD
LO
COr-as
CN
oiOOt-Ol
oi00ir-Ol
aiooir-Ol
1—1
ir¬ai
i—l
ir¬
ai
1—1
ir¬ai
COCOOl
ai
OO
CN
o
00CN
o
oo
CNo
1—1CN
ai
o
00CNOSco
tr^
OSco
LD
LO
aso
LOLO
oso
aiLO
coCN
aiLO
coCN
ai
COCN
aico
CDCN
à CN LO LO
<l1
CO
1CO
1
OO CO asH o aico ^ LO
to i—i 1—1 T—1X!_o i—H 1—1 1—1^ ta¬ t- t-
ir¬ ir- t-as OS ai
COX
oit- 00 Oi—I
cd cd cd cd cd ö
LO OO i—I
ir- ^ oCN CO T}iCD CO CD
-tf O O OlLO os oo -^i—I CN CO COt- C- t- OS
o o oCN CN CNas os asas as ai
CO CO CO CNLO LO LO 00co co co oO O O i-H
X X
">* oo
o o
i-H CO
0O LOas oLo co
CO CO
CO!-jOCOaiCOt-CO!-ji-jOC50CNCOCN<^OOa)^LOLOCO<>icNCNCÖCNCNCNCNCNCÖi-lCNcdcÖÖo'
I I I I I I I
OOt-t- Tf LO ^f O) CO r-It— t-COt-OOi—ICNC— Ot-COCOOlO^LOCDCDCNOli—iWiCOOCl^OlTf^OMoooor-ioicDasooaiasooascoiLOcoasasoi—i^t1^cNicNco^LOLOLOLOLO^^LOcNCNasascNCNosas
HHHCOaioObcDtDHHHddlOlOHHlDCDCNCNCN^^^ooooootr— ir— t—asasasai^Hi—ii—ii—iooooooooooooasasascocorooooo^Hi—ii—ii—iasasasososaioiaiaioooi—ii—ii—ii—i^hi—ii—ii—i
i—ICOCNCNCOi—ICNCOi—IIM-^cOlO^iO^lO^lO^cOxfNLOI I I I I I I i I I I I I I I I I I I I I I I I
CN^lCOCO^tlCNCO^flCNCOLO^COLOCOLOCDLOCOLO^tlLOCOCD
(M
CN
co co
cn
CN
I
r-TCO
1
<-<
1
i-H
1
o
-<*
1
O
1
CNmCN~
CO
1
CN
11
o_co"
CO
1
CO_cn"
1
io_o"
LO
1
10
LO
1
lO
o"LO
1
in
LO
1
.-1
co"
1
C0_cn"
LO
Table
4.3:
Continued
CO
Ol
isition
F'-
.
pn
C6H4DF-_12C160
C6H4DF-_13C160
v=
0v=
1v=
0v=
l
Trar
fobs
Au
fobs
Au
fobs
Av
fobs
Au
60,6
-_
5l,5
7--6
13228.7490
4.1b
13225.0191
-5.3b
13029.7763
2.4b
13029.4840
-4.3b
61,6_
5i,5
7--6
13230.2191
4.2b
13031.9331
3.4b
60,6
--
5o,5
7--6
13234.4848
4.1b
13037.6494
3.1b
61,6
_
5o,5
7--6
13235.9544
3.6b
13233.6730
-4.3b
13039.8060
3.8b
13041.0452
-4.5b
44,i
--33
,o5--4
13342.2870
0.6
13271.8779
-1.0
13299.6564
3.1
13225.5007
-1.8b
4-
313342.2950
0.2
13271.8862
-0.3
13299.6667
5.6
44,o
--33
,15--4
13388.4395
-7.8
13311.6808
7.6
13337.8286
2.5
13259.0507
2.9b
61,5
--
52,4
7--6
14036.1922
12.1
b13991.3020
-11.4b
13801.7100
8.0b
13761.4891
0.3b
62,5
--
5i,4
7--6
14256.1318
15.4
b14242.2256
-18.lb
14083.0796
12.9b
14072.2715
4.7b
6--5
14256.1501
17.0
b14083.1011
16.0b
7o,7
--
61,6
8--7
15360.2382
-0.8b
15359.5121
0.0b
15129.9194
3.8b
15132.9864
2.3b
7i,r
- -6i
,68--7
15360.5986
-0.9b
7o,7
-60,
68--7
15361.7080
-l.lb
7i,7- -60
,68--7
15362.0688
-0.8b
15361.8122
1.0b
15132.6406
4.5b
15136.2391
2.6b
7l,6" -62
,58--7
16232.2805
-13.0b
16200.0543
9.3b
15983.1087
-18.6b
72,6
"
-61,
58-
7-
-7 6
16306.3326
16306.3432
-10.9b
-10.0b
16288.7477
10.3b
16084.7581
-15.6b
55,i
-
-44,
06-
5-
-5
-4
16822.5556
16822.5612
1.6b
3.2b
16737.0567
-2.8b
16770.7007
-0.2b
16680.7557
-1.4b
55,o
-
-44,
16--5
16833.3613
-3.2b
16745.9155
1.5b
16778.9944
-1.9b
16687.7433
1.2b
aIfthequadrupole
splittings
werenotcompletelyre
solved,thenthest
rong
estunderlyi
ngcomponentwas
assigned
toanapparent
absorption
line
.
bTransitionexcludedfromthe
fitofthequadrupolecoupling
constants.
9 4X
C O *-(o Cr
as
Ü CS)
C5 Ö CO
cro ü o ö § CD

aThe
1eruncertaintiesofthe
lastdigi
tsaregiven
inpa
rent
hese
s.bNumber
ofrotationaltransitionsincluded
inthe
fit.
cStandarddeviationofameasured
transitionfr
eque
ncy.
dConstrained
tothevalueoftheparent
species.
9 4V
Table
4.4:
Rotationaland
cent
rifu
galdistortionconstants
offluorobenzene-COand
of
itsisotopomers.
CeH5F-_12C160
CeH5F-_13C160
C6H5F-13C180
v=
0v=
lv=
Qv=
lv=
0
A/MHz
1786
.727
558(
104)
1775.073776(187)
1783.558211(179)
1771
.394
096(
235)
1771
.875
343(
204)
B/MHz
1371.057609(54)
1357.095463(114)
1343.900262(95)
1331
.699
279(
159)
1299
.599
640(
212)
C/MHz
1085.679692(47)
1086.406251(67)
1068.881201(62)
1069
.910
878(
124)
1038
.139
519(
107)
Aj
JkHz
5.28773(51)
4.80970(149)
4.84559(113)
4.35
336(
215)
4.6929(36)
AjK
/kHz
19.39564(264
)-2
5.61
82(6
3)17.1272(52)
-20.
4541
(136
)27
.230
0(17
6)AK
1kHz
-3.6
967(
58)
-3.6
810(
172)
-1.4
080(
157)
-9.1
488(
251)
-11.
6135
(144
)5j
/kHz
2.040814(272)
1.89871(72)
1.81823(57)
1.64
671(
103)
1.82
327(
177)
SK
jkHz
-10.48344(296)
6.8295(76)
-7.4
158(
64)
4.46
58(1
39)
-12.
3484
(150
)§K/Hz
26.1
65(7
1)-42.98(43)
24.3
0(39
)-4
6.54
(50)
26.16d
Nroth
87
46
59
28
29
aIkHz
c14.7
9.4
9.1
4.2
9.8
c o o cr § tsi g CD I
cro ü o ü s. CD
to
Table
4.5:
Rota
tion
al,
centrifugaldistortionandD
quadrupolecouplingconstants
offluorobenzene-4-<ii-CO.a
to
00
C6H4DF-12C160
C6H4DF-13ClbO
v=
0v=
1v=
0v=
l
A/MHz
BjMHz
CIMHz
Aj
IkHz
AJK
IkHz
AK
jkHz
6jIkHz
ÖK
jkHz
$jf/Hz
Xaa
jkHz
(Xbb-
Xcc)
IkHz
AUb
iVc
aIkHz
d
1732.886192(251)
1370.730156(314)
1065.218195(80)
5.07
31(9
1)15.9758(199)
-2.6888(164)
2.01
23(4
2)-10.3809(314)
4.65
(50)
-52.6(27)
234.
8(22
)33
60
[43]
5.7
1772.49654(327)
1356.56349(50)
1065.988733(119)
5.1166(131)
-25.
1036
(259
)-0.1103(261)
2.08
20(6
0)6.
587(
47)
-25.40(62)
-49.1(49)
227.
3(63
)21
34
[21]
5.3
1729.620
443(
243)
1343.752
570(
150)
1049.027
596(
68)
4.84
496(
312)
14.261
2(13
5)-0
.894
5(16
8)1.87
206(
145)
-6.494
3(10
4)12
.38(49)
-51.6(
29)
238.
0(27)
30
47
[28]
6.6
1718
.616
75(4
0)13
31.3
9733
(72)
1050
.082
875(
209)
4.40
37(1
89)
-19.
339(
47)
-5.9
99(3
9)1.7201(86)
3.859(75)
-29.
69(7
4)-6
0.5(
64)
228.1(81)
19
28
[15]
2.2
aThe
1eruncertaintiesofthe
last
digits
aregi
ven
inpa
rent
hese
s.bNumber
ofrotationaltransitions.
cNumber
ofsi
ngle
transitionsincluded
inthegl
obal
fitand
inthe
fitofthequadrupolecouplingconstants
(inbrackets).
dStandarddeviationofameasured
transitionfr
eque
ncy.
9 et-
4X
C O !-iO cr
CD Ü M CD Ö CD k cro b o b CD

Chapter 4. Fluorobenzene-Carbon Monoxide 29
4.4 Geometry of the Complex
For the analysis of the structure of the CO complex, the tq geometry of fluorobenzene
obtained by Doraiswamy and Sharma [95] was used (Tab. B.l), and it was assumed that
the geometry of fluorobenzene does not change significantly upon complexation, as was
shown in the case of the argon complex of iV-methylpyrrole [35,36]. The geometry of
the complex is defined in the axis system of the monomer (x,y,z) as indicated in Fig.
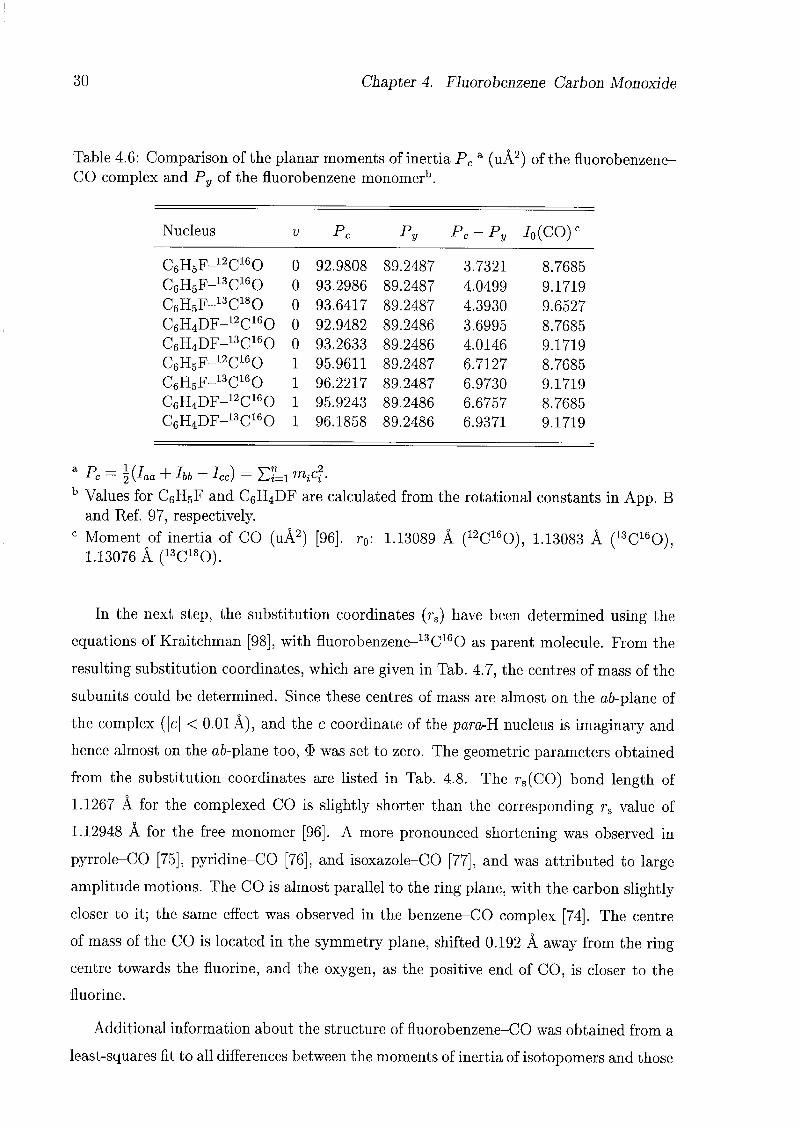
4.2. Assuming a structure with the centre of mass of the CO located in the symmetry
plane of the fluorobenzene (i.e. $ = 0), the difference between the planar moments of
inertia Pc of the CO complex and Py of the monomer should be zero when the CO
is located in the symmetry plane of the fluorobenzene (i.e. r = 0 or r = tt). But
in fact, the difference for 12C160 is about 3.7 uA2 in the v = 0 state and 6.7 uA2 in
the v = 1 state, and for 13C160 is about 4.0 uÂ2 and 6.9 uÂ2, respectively (Tab. 4.6).
These differences can be compared with the moments of inertia of CO (8.7685 uÂ2 and
9.1719 uÂ2, respectively) [96], showing that the CO is at some average angle to the
symmetry plane, so that there are two equivalent minima in the potential for the internal
rotation of the CO: V(R, 6, $, p, r) = V(R, 0, -$, p, -r). Therefore, the energy levels
should split into two states; these correspond to the two observed states v — 0 and 1.
Figure 4.2: Geometry of the fluorobenzene-CO complex defined in the axis system of
the monomer (x,y,z). The position of the centre of mass of CO is defined by the polarcoordinates R (distance between the centres of mass), O and $; the orientation of the
CO is defined by p (angle between the molecular axis of CO and the z axis) and r (angleof rotation of the CO around the z axis).
30 Chapter 4. Fluorobenzene-Carbon Monoxide
Table 4.6: Comparison of the planar moments of inertia Pc a (uÂ2) of the fluorobenzene-
CO complex and Py of the fluorobenzene monomerb.
Nucleus V Pc PyP
-
PJr
cr
y Io(CO)c
C6H5F-12C160 0 92.9808 89.2487 3.7321 8.7685
C6H5F-13C160 0 93.2986 89.2487 4.0499 9.1719
C6H5F-13C180 0 93.6417 89.2487 4.3930 9.6527
C6H4DF-12C160 0 92.9482 89.2486 3.6995 8.7685
C6H4DF-13C160 0 93.2633 89.2486 4.0146 9.1719
C6H5F-12C160 1 95.9611 89.2487 6.7127 8.7685
C6H5F-13C160 1 96.2217 89.2487 6.9730 9.1719
C6H4DF-12C160 1 95.9243 89.2486 6.6757 8.7685
C6H4DF-13C160 1 96.1858 89.2486 6.9371 9.1719
a Pc = \(ha + hb - he) = EU miC2.b Values for C6H5F and CeH4DF are calculated from the rotational constants in App. B
and Ref. 97, respectively.c Moment of inertia of CO (uÀ2) [96]. r0: 1.13089 Â (12C160), 1.13083 À (13C160),1.13076 Â (13C180).
In the next step, the substitution coordinates (rs) have been determined using the
equations of Kraitchman [98], with fluorobenzene-13C160 as parent molecule. From the
resulting substitution coordinates, which are given in Tab. 4.7, the centres of mass of the
subunits could be determined. Since these centres of mass are almost on the a6-plane of
the complex (\c\ < 0.01 À), and the c coordinate of the para-R nucleus is imaginary and
hence almost on the afr-plane too, $ was set to zero. The geometric parameters obtained
from the substitution coordinates are listed in Tab. 4.8. The rs(CO) bond length of
1.1267 Â for the complexed CO is slightly shorter than the corresponding rs value of
1.12948 A for the free monomer [96]. A more pronounced shortening was observed in
pyrrole-CO [75], pyridine-CO [76], and isoxazole-CO [77], and was attributed to large
amplitude motions. The CO is almost parallel to the ring plane, with the carbon slightly
closer to it; the same effect was observed in the benzene-CO complex [74]. The centre
of mass of the CO is located in the symmetry plane, shifted 0.192 Â away from the ring
centre towards the fluorine, and the oxygen, as the positive end of CO, is closer to the
fluorine.
Additional information about the structure of fluorobenzene-CO was obtained from a
least-squares fit to all differences between the moments of inertia of isotopomers and those

Chapter 4. Fluorobenzene-Carbon Monoxide 31
a
3Â"
1À b
X
F
Figure 4.3: Geometry of C6H5F-13C160 (v+ Centres of mass, x ring centre.
0), calculated from the rs coordinates.

32 Chapter 4. Fluorobenzene-Carbon Monoxide
Q9
<s>
U 2Â y
/\
2&"
x
Figure 4.4: Geometry of C6H5F-13C160 (v = 0), calculated from the rs coordinates,
defined in the axis system of the monomer. • Centre of mass of CO, x ring centre.
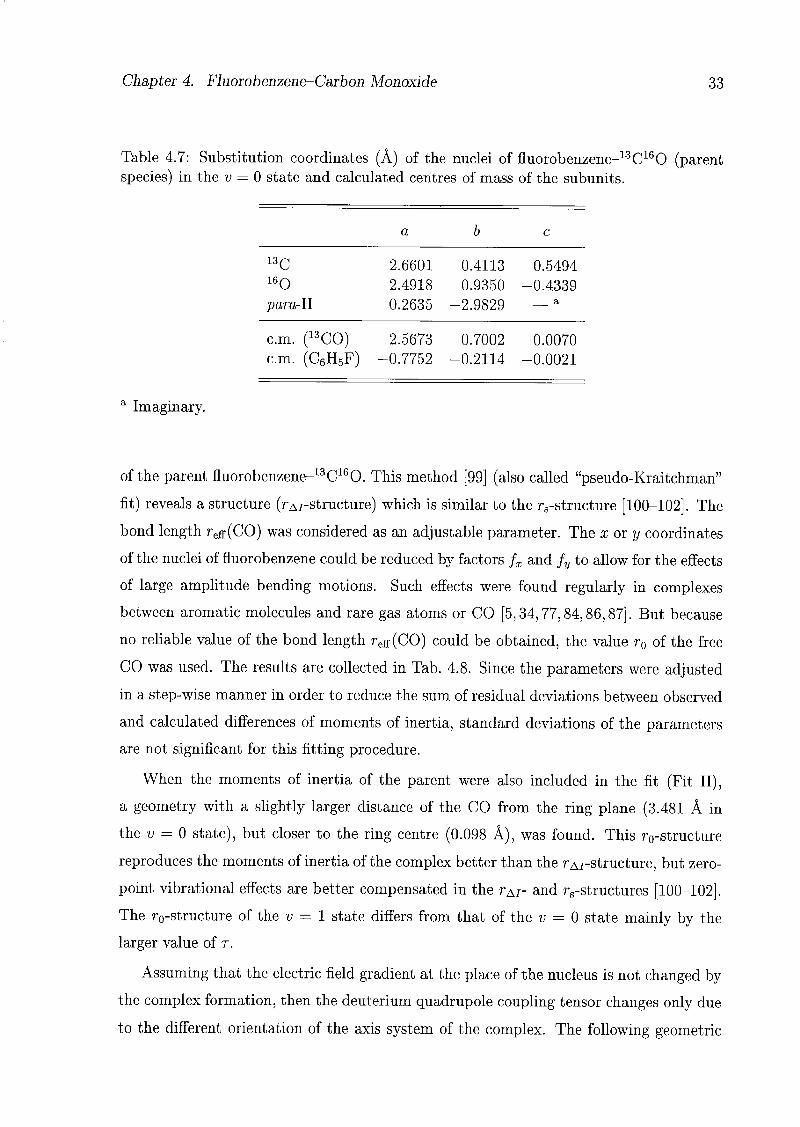
Chapter 4. Fluorobenzene-Carbon Monoxide 33
Table 4.7: Substitution coordinates (Â) of the nuclei of fluorobenzene-13C160 (parentspecies) in the v — 0 state and calculated centres of mass of the subunits.
a b c
13C
16Q
para-U
2.6601
2.4918
0.2635
0.4113
0.9350
-2.9829
0.5494
-0.4339a
cm. (13cm. (C
CO)6H5F)
2.5673
-0.7752
0.7002
-0.2114
0.0070
-0.0021
a
Imaginary.
of the parent fluorobenzene-13C160. This method [99] (also called "pseudo-Kraitchman"
fit) reveals a structure (^/-structure) which is similar to the restructure [100-102]. The
bond length reff(CO) was considered as an adjustable parameter. The x or y coordinates
of the nuclei of fluorobenzene could be reduced by factors fx and fy to allow for the effects
of large amplitude bending motions. Such effects were found regularly in complexes
between aromatic molecules and rare gas atoms or CO [5,34,77,84,86,87]. But because
no reliable value of the bond length reg(CO) could be obtained, the value r0 of the free
CO was used. The results are collected in Tab. 4.8. Since the parameters were adjusted
in a step-wise manner in order to reduce the sum of residual deviations between observed
and calculated differences of moments of inertia, standard deviations of the parameters
are not significant for this fitting procedure.
When the moments of inertia of the parent were also included in the fit (Fit II),
a geometry with a slightly larger distance of the CO from the ring plane (3.481 Â in
the v = 0 state), but closer to the ring centre (0.098 Â), was found. This fo-structure
reproduces the moments of inertia of the complex better than the rA/-structure, but zero-
point vibrational effects are better compensated in the r&r and restructures [100-102].
The r0-structure of the v = 1 state differs from that of the v = 0 state mainly by the
larger value of r.
Assuming that the electric field gradient at the place of the nucleus is not changed by
the complex formation, then the deuterium quadrupole coupling tensor changes only due
to the different orientation of the axis system of the complex. The following geometric
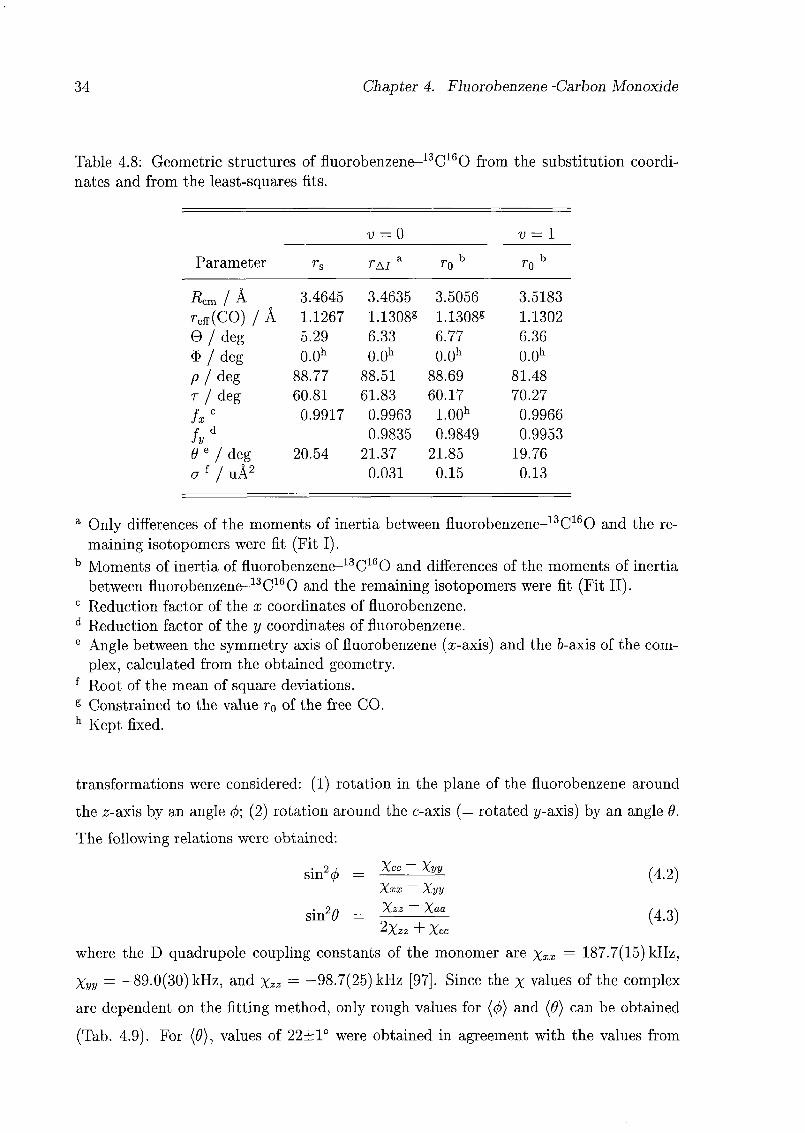
34 Chapter 4. Fluorobenzene-Carbon Monoxide
Table 4.8: Geometric structures of fluorobenzene-13C160 from the substitution coordi¬
nates and from the least-squares fits.
v = 0 v = l
Parameter rB taia r0b r0b
^cm / A 3.4645 3.4635 3.5056 3.5183
reff(CO) / Â 1.1267 1.1308« 1.1308« 1.1302
9/deg 5.29 6.33 6.77 6.36
$ / deg 0.0h 0.0h 0.0h 0.0h
p/deg 88.77 88.51 88.69 81.48
r / deg 60.81 61.83 60.17 70.27
f c
Jx 0.9917 0.9963 1.00h 0.9966
f d
Jy0.9835 0.9849 0.9953
6 e / deg 20.54 21.37 21.85 19.76
Gf / uA2 0.031 0.15 0.13
a Only differences of the moments of inertia between fluorobenzene-13C160 and the re¬
maining isotopomers were fit (Fit I).b Moments of inertia of fluorobenzene-13C160 and differences of the moments of inertia
between fluorobenzene-13C160 and the remaining isotopomers were fit (Fit II).c Reduction factor of the x coordinates of fluorobenzene.
d Reduction factor of the y coordinates of fluorobenzene.
e Angle between the symmetry axis of fluorobenzene (ic-axis) and the 6-axis of the com¬
plex, calculated from the obtained geometry.f Root of the mean of square deviations.
g Constrained to the value r0 of the free CO.hKept fixed.
transformations were considered: (1) rotation in the plane of the fluorobenzene around
the z-axis by an angle (j>; (2) rotation around the c-axis (= rotated y-axis) by an angle 9.
The following relations were obtained:
Xxx Xyy
sin20 =
*** ~Xaa (4.3)
2Xzz + XccK '
where the D quadrupole coupling constants of the monomer are Xxx = 187.7(15) kHz,
Xyy = -89.0(30) kHz, and Xzz — -98.7(25) kHz [97]. Since the x values of the complex
are dependent on the fitting method, only rough values for ((f)) and (9) can be obtained
(Tab. 4.9). For (9), values of 22±1° were obtained in agreement with the values from
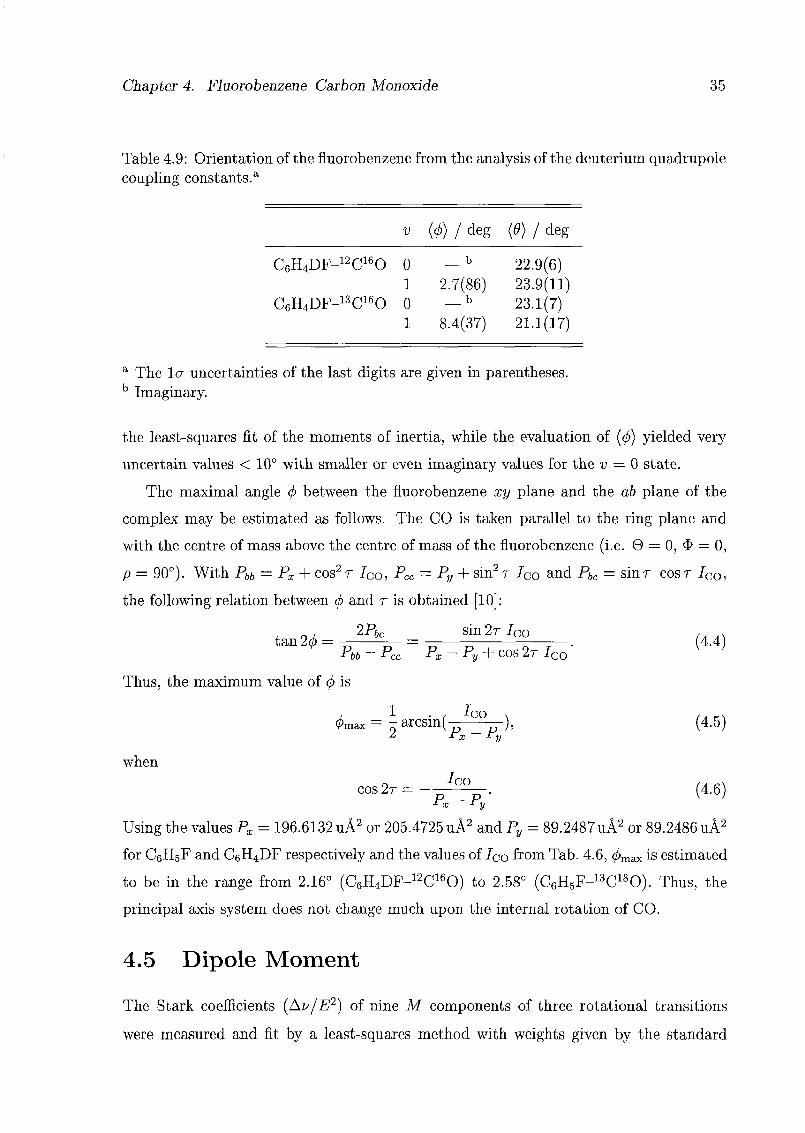
Chapter 4. Fluorobenzene-Carbon Monoxide 35
Table 4.9: Orientation of the fluorobenzene from the analysis of the deuterium quadrupole
coupling constants.3.
/ deg (9) I deg
C6H4DF-12C160 0 —b 22.9(6)1 2.7(86) 23.9(11)
C6H4DF-13C160 0 —b 23.1(7)1 8.4(37) 21.1(17)
a The la uncertainties of the last digits are given in parentheses.bImaginary.
the least-squares fit of the moments of inertia, while the evaluation of (0) yielded very
uncertain values < 10° with smaller or even imaginary values for the v = 0 state.
The maximal angle (j) between the fluorobenzene xy plane and the ab plane of the
complex may be estimated as follows. The CO is taken parallel to the ring plane and
with the centre of mass above the centre of mass of the fluorobenzene (i.e. O = 0, <3> = 0,
p = 90°). With Pbb — Px + cos2t Ico, Pec — Py + sin2t Ico and Pbc = sinr cosr /co,
the following relation between (j) and r is obtained [10]:
tan20 = -g^-= f2"700T
. (4.4)Pbb-Pcc Px-Py + cos2Tlco
y '
Thus, the maximum value of 0 is
0max = - arcsin(°°
), (4.5)Z ±x try
when
cos2r=--^-. (4.6)*i •*y
Using the values Px = 196.6132 uÂ2 or 205.4725 uÂ2 and Py = 89.2487 uÂ2 or 89.2486 uÀ2
for C6H5F and C6H4DF respectively and the values of/Co from Tab. 4.6, </>max is estimated
to be in the range from 2.16° (C6H4DF-12C160) to 2.58° (C6H5F-13C180). Thus, the
principal axis system does not change much upon the internal rotation of CO.
4.5 Dipole Moment
The Stark coefficients (Au/E2) of nine M components of three rotational transitions
were measured and fit by a least-squares method with weights given by the standard
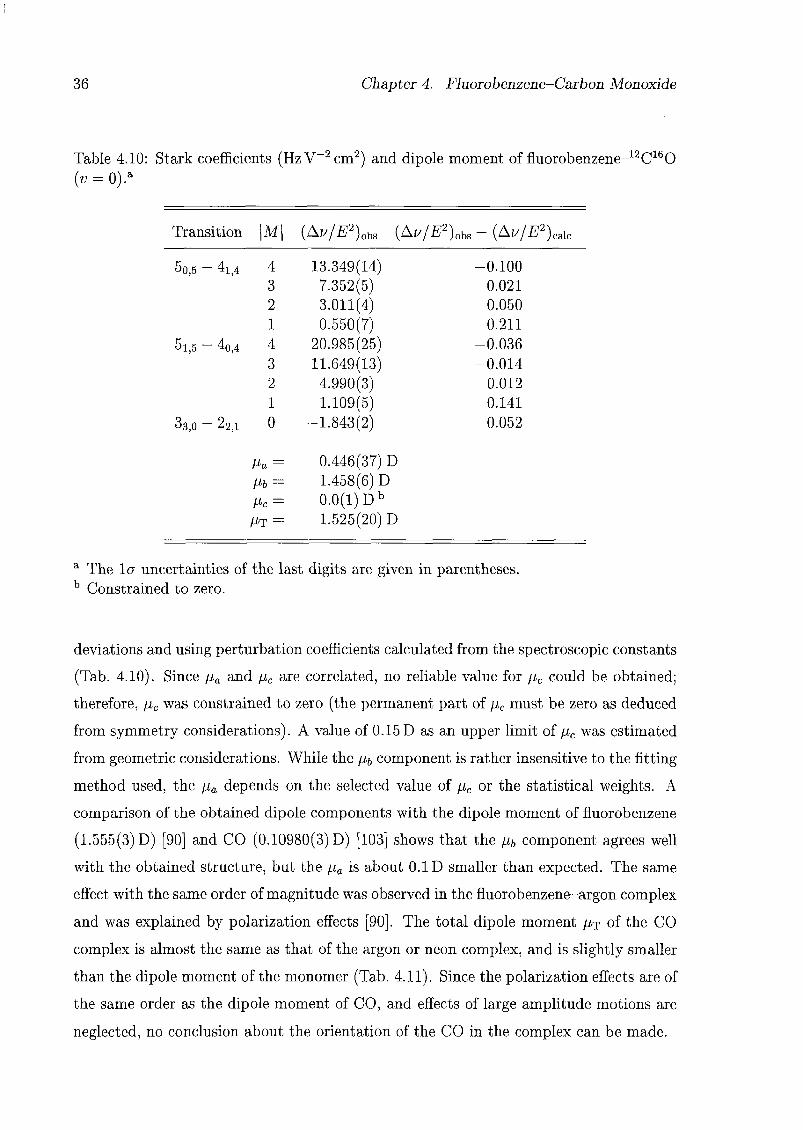
36 Chapter 4. Fluorobenzene-Carbon Monoxide
Table 4.10: Stark coefficients (HzV 2cm2) and dipole moment of fluorobenzene-12C160
(v = 0).a
Transition \M\ (Au/E2)obs (Au/E2)ohs - (Au/E2)^
5o,5 - 4i,4
5i,5 - 40,4
33,0 — 22,1
4 13.349(14) -0.100
3 7.352(5) 0.021
2 3.011(4) 0.050
1 0.550(7) 0.211
4 20.985(25) -0.036
3 11.649(13) -0.014
2 4.990(3) 0.012
1 1.109(5) 0.141
0 -1.843(2) 0.052
ßa = 0.446(37) D
ßb = 1.458(6)Dßc = 0.0(1) Db
pT = 1.525(20)D
a The la uncertainties of the last digits are given in parentheses.b Constrained to zero.
deviations and using perturbation coefficients calculated from the spectroscopic constants
(Tab. 4.10). Since pa and pc are correlated, no reliable value for pc could be obtained;
therefore, p,c was constrained to zero (the permanent part of pc must be zero as deduced
from symmetry considerations). A value of 0.15 D as an upper limit of pc was estimated
from geometric considerations. While the pb component is rather insensitive to the fitting
method used, the pa depends on the selected value of pc or the statistical weights. A
comparison of the obtained dipole components with the dipole moment of fluorobenzene
(1.555(3) D) [90] and CO (0.10980(3) D) [103] shows that the pb component agrees well
with the obtained structure, but the pa is about 0.1 D smaller than expected. The same
effect with the same order of magnitude was observed in the fluorobenzene-argon complex
and was explained by polarization effects [90]. The total dipole moment p^ of the CO
complex is almost the same as that of the argon or neon complex, and is slightly smaller
than the dipole moment of the monomer (Tab. 4.11). Since the polarization effects are of
the same order as the dipole moment of CO, and effects of large amplitude motions are
neglected, no conclusion about the orientation of the CO in the complex can be made.
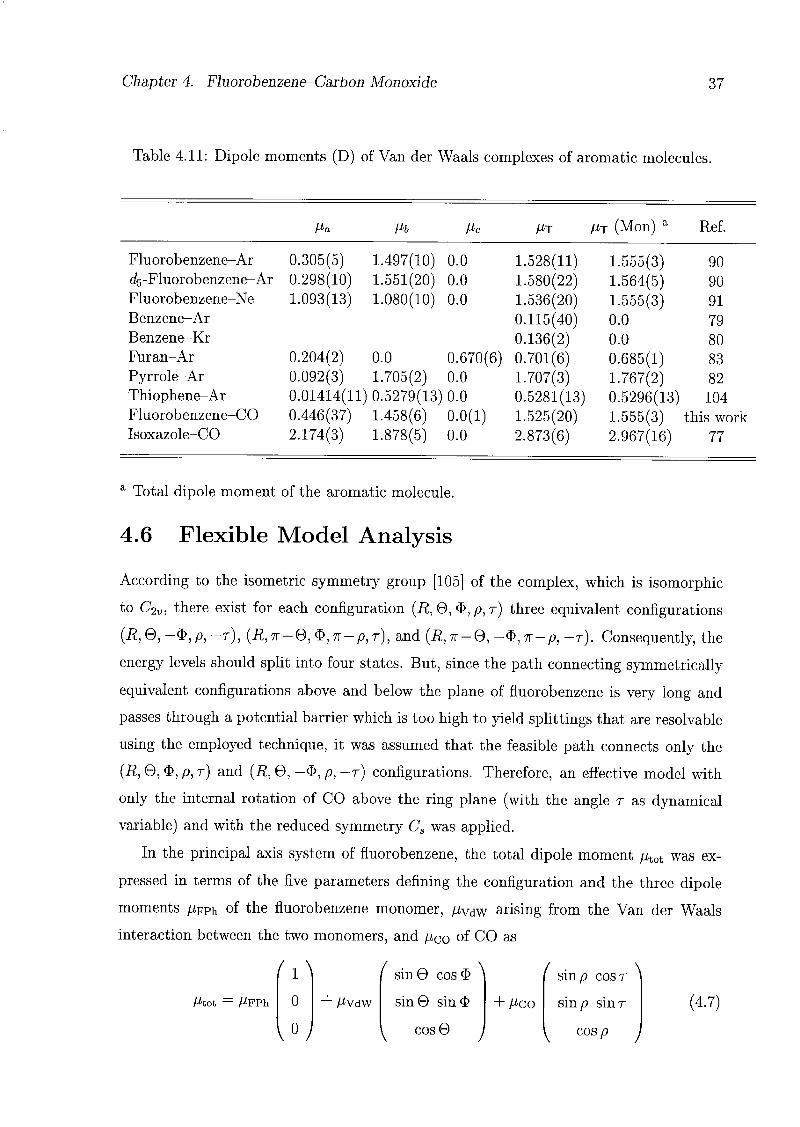
Chapter 4. Fluorobenzene-Carbon Monoxide 37
Table 4.11: Dipole moments (D) of Van der Waals complexes of aromatic molecules.
ßa ßb ßc Mt p,T (Mon) a Ref.
Fluorobenzene-Ar 0.305(5) 1.497(10) 0.0 1.528(11) 1.555(3) 90
d5-Fluorobenzene-Ar 0.298(10) 1.551(20) 0.0 1.580(22) 1.564(5) 90
Fluorobenzene-Ne 1.093(13) 1.080(10) 0.0 1.536(20) 1.555(3) 91
Benzene-Ar 0.115(40) 0.0 79
Benzene-Kr 0.136(2) 0.0 80
Furan-Ar 0.204(2) 0.0 0.670(6) 0.701(6) 0.685(1) 83
Pyrrole-Ar 0.092(3) 1.705(2) 0.0 1.707(3) 1.767(2) 82
Thiophene-Ar 0.01414(11 ) 0.5279(13; 0.0 0.5281(13) 0.5296(13) 104
Fluorobenzene-CO 0.446(37) 1.458(6) 0.0(1) 1.525(20) 1.555(3) this work
Isoxazole-CO 2.174(3) 1.878(5) 0.0 2.873(6) 2.967(16) 77
Total dipole moment of the aromatic molecule.
4.6 Flexible Model Analysis
According to the isometric symmetry group [105] of the complex, which is isomorphic
to C2v, there exist for each configuration (R, 9,<J>,p, r) three equivalent configurations
(R, 6, -$,p, —r), (R, 7T-6, $,7r-p, r), and (R, tt-Q, -$,7r-p, -t). Consequently, the
energy levels should split into four states. But, since the path connecting symmetrically
equivalent configurations above and below the plane of fluorobenzene is very long and
passes through a potential barrier which is too high to yield splittings that are resolvable
using the employed technique, it was assumed that the feasible path connects only the
(i?, 0, <£>, p, r) and (R, 6, —$, p, —r) configurations. Therefore, an effective model with
only the internal rotation of CO above the ring plane (with the angle r as dynamical
variable) and with the reduced symmetry Cs was applied.
In the principal axis system of fluorobenzene, the total dipole moment ptot was ex¬
pressed in terms of the five parameters defining the configuration and the three dipole
moments ppph of the fluorobenzene monomer, p^vdw arising from the Van der Waals
interaction between the two monomers, and pCo of CO as
Mtot — A'FPh 0
/
MVdW
sin 6 cos$
sinÖ sin$
cos 6
\
+ A*co
' sinp cost *
sinp sinr
cosp
(4.7)
38 Chapter 4. Fluorobenzene-Carbon Monoxide
The x- and ^-components of the total dipole moment transform according to the totally
symmetric irreducible representation A' of the relevant symmetry group Cs, whereas the
y-component transforms according to the antisymmetric representation A".
Even though the correspondence between the (x,y,z) axis system of fluorobenzene
and the (a,b,c) axis system of the complex is dependent on the angle r of the internal
rotation, the c-axis is almost parallel to the y-axis of fluorobenzene as discussed above.
For transitions that can still be assigned to rigid rotor labels1, only pc-type transitions
change the tunnelling state, while pa- and pj-type transitions occur within one tunnelling
state according to the selection rule for electric dipole transitions A' -H- A". However,
in cases where rigid rotor labels cannot be assigned, the simple minded explanation fails
and only explicit intensity calculations reveal all possible transitions.
The rotational-internal rotational transitions in the lowest two tunnelling states were
modelled with the help of an existing computer program [33] described in Sec. 2.2. The
potential V(r) hindering internal rotation was expressed in the form
V(r) = VQ + J2~^-cosnr). (4.8)n
^
Again, for the geometry of the complex, the r0 geometry of fluorobenzene of Ref. 95
was used. Since models with a fixed position of the centre of mass of CO could reproduce
the experimental results only approximately, relaxation terms for the coordinates x, y
and z of the centre of mass of CO were included as functions of the variable r. The results
are presented in Tab. 4.12 and in Fig. 4.5. The barriers to internal rotation are about
7.3 and 19.9 cm-1, and the minimum in the potential is at r = 76° (r = 0 corresponds
to the structure with CO in the symmetry plane and the oxygen pointing towards the
fluorine, when 0 < p < tt); for the v = 0 state, an angle r of the order of 60° is obtained.
The energy difference between the v = 0 and v = 1 state is calculated as 48.3 GHz. The
calculated equilibrium structure (where V = 0) is close to the r0-structure (Tab. 4.8)
with a slightly larger distance of the CO to the ring plane and the CO located nearer
to the ring centre. Note that the centre of mass of CO is no longer fixed to the xz-
plane in this model ($ / 0). Different calculations with similar models yielded lower
energy differences of the order 16-20 GHz, but some experiments using double resonance
techniques to locate pc-type transition, which would give the accurate energy difference
between both states, were not successfull. In all these calculations, the barrier to internal
1 Levels with even Kc values possess symmetry A', with odd Kc values A" (see Tab. 6 of Ref. 106).
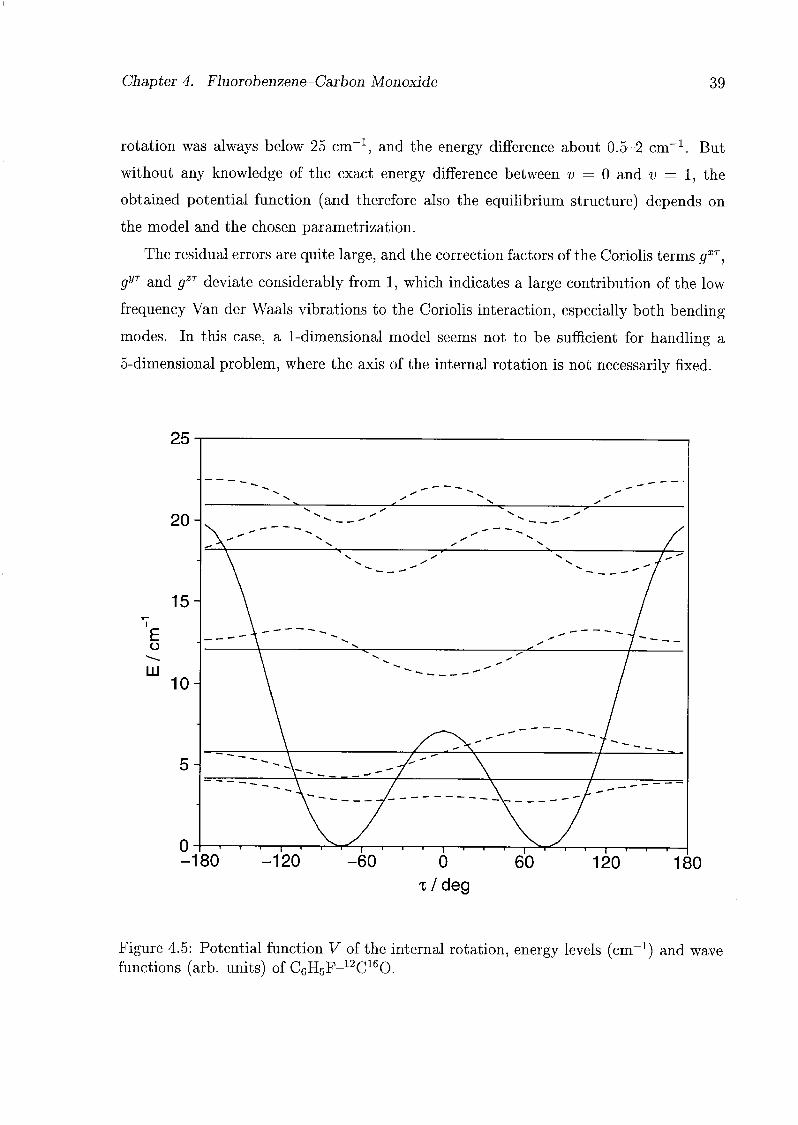
Chapter 4. Fluorobenzene-Carbon Monoxide 39
rotation was always below 25 cm-1, and the energy difference about 0.5-2 cm-1. But
without any knowledge of the exact energy difference between v = 0 and v = 1, the
obtained potential function (and therefore also the equilibrium structure) depends on
the model and the chosen parametrization.
The residual errors are quite large, and the correction factors of the Coriolis terms gXT,
gyT and gZT deviate considerably from 1, which indicates a large contribution of the low
frequency Van der Waals vibrations to the Coriolis interaction, especially both bending
modes. In this case, a 1-dimensional model seems not to be sufficient for handling a
5-dimensional problem, where the axis of the internal rotation is not necessarily fixed.
Eo
LU
Z.D
20-^
V. ^
'^__ _
"
15-
10-
\ "- -"" /
5- ~~"--^v _^/"' \ /
o- 1 1 1 1 1 T ^T^ | 1 1 1 1 1 1 1 1 ^T^ 1 1 ( 1 1 1
-180 -120 -60 0
x/deg
60 120 180
Figure 4.5: Potential function V of the internal rotation, energy levels (cm x) and wave
functions (arb. units) of C6H5F-12C160.
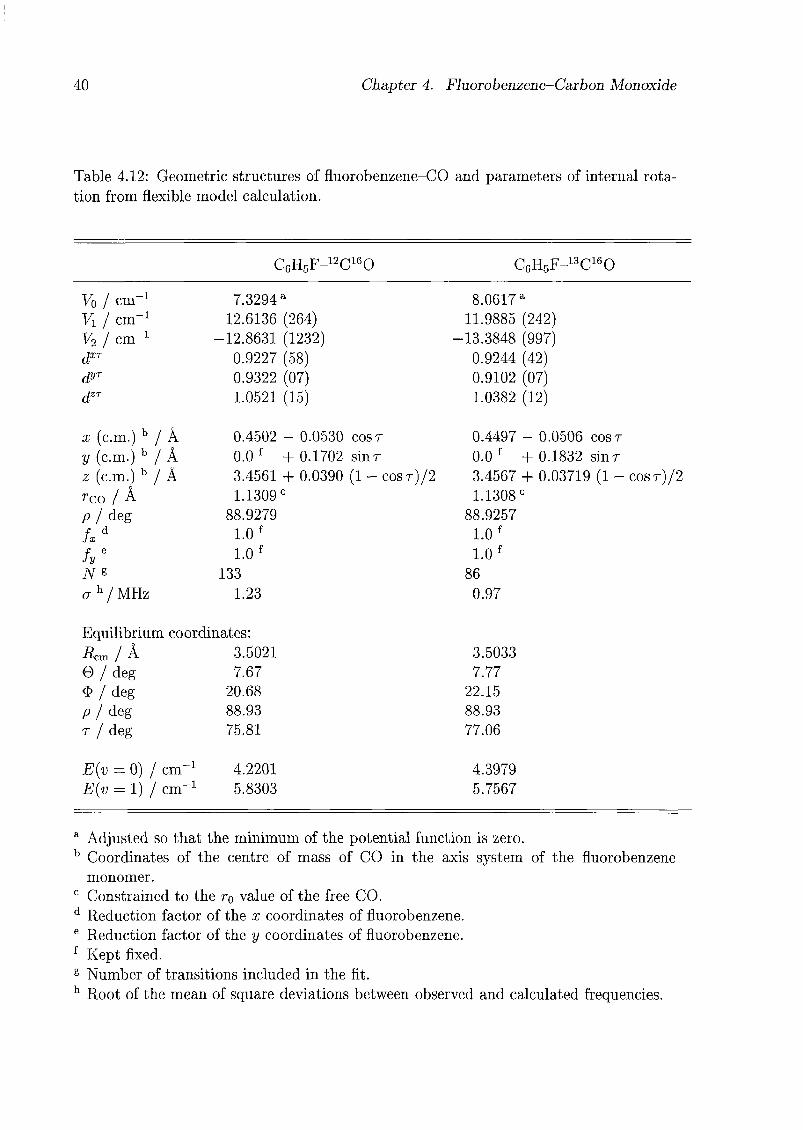
40 Chapter 4. Fluorobenzene-Carbon Monoxide
Table 4.12: Geometric structures of fluorobenzene-CO and parameters of internal rota¬
tion from flexible model calculation.
C6H5F-12C160 C6H5F-13C160
V0 1 cm"1 7.3294 a 8.0617 a
V1 / cm"1 12.6136 (264) 11.9885 (242)V2 / cm"1 -12.8631 (1232) -13.3848 (997)dXT 0.9227 (58) 0.9244 (42)d?T 0.9322 (07) 0.9102 (07)dZT 1.0521 (15) 1.0382 (12)
x (cm.)b
/ À 0.4502 - 0.0530 cost 0.4497 - 0.0506 cost
y (cm.)b
/ À 0.0f
+ 0.1702 sinr 0.0f
+ 0.1832 sinr
z (cm.)b/ Â 3.4561 + 0.0390 (l-cosr)/2 3.4567 + 0.03719 (1 - cosr)/2
reo /À 1.1309 e 1.1308 e
p / deg 88.9279 88.9257
f d 1.0 f1.0
f
f e 1.0f
1.0f
iyg 133 86
ah/ MHz 1.23 0.97
Equilibrium coordinates:
Rem 1 A 3.5021 3.5033
6/deg 7.67 7.77
$ / deg 20.68 22.15
p j deg 88.93 88.93
r / deg 75.81 77.06
E(v = 0) / cm'1 4.2201 4.3979
£(u = 1) / cm-1 5.8303 5.7567
a Adjusted so that the minimum of the potential function is zero.
b Coordinates of the centre of mass of CO in the axis system of the fluorobenzene
monomer.
c Constrained to the r0 value of the free CO.d Reduction factor of the x coordinates of fluorobenzene.e Reduction factor of the y coordinates of fluorobenzene.fKept fixed.
s Number of transitions included in the fit.h Root of the mean of square deviations between observed and calculated frequencies.
Chapter 4. Fluorobenzene-Carbon Monoxide 41
4.7 Discussion
The structure of the Van der Waals complex of CO with fluorobenzene can be compared
with the structures of other CO complexes of aromatic molecules and with the structures
of the corresponding Ar or Ne complexes (see Tab. 4.13). While for the Van der Waals
complexes of furan and pyrrole, the Ar or CO is shifted away from both the centre of mass
and the ring centre2 towards the (electronegative) heteroatom (r.c.-cm.-X-het.), the Ar,
Ne or CO is situated between the centre of mass and the ring centre in the complexes
with fluorobenzene (r.c.-X-c.m.-het.). Although the barriers to internal rotation differ
considerably between the different complexes with the CO above the ring plane, the
distance to the ring plane is always about 3.45 Â.
In the CO complexes, the orientation of CO is not always unambiguously defined.
When determined, the carbon of CO was found to be closer to the ring plane than the
oxygen (|p| < 90° in Tab. 4.13). The orientation with respect to the internal rotation
coordinate r is often ambiguous, as in pyrrole-CO, where a structure with the (negative)
carbon end pointing toward the nitrogen (positively charged end of pyrrole [107]) is
preferred, or in furan-CO, where the value of r is obtained from a model calculation.
In fluorobenzene-CO, r is determined by the substitution structure: the positive oxygen
end of CO points towards the ort/iocarbon atom with the biggest negative partial charge,
and not to the ipso-carbon with its positive partial charge [92,93]. In the complex with
pyridine and isoxazole, the CO forms an angle of about 62-64° to the line connecting
both centres of mass, which is shifted about 12-17° from the N to the neighbouring CH
group; the carbon end of CO is closer to the nitrogen and, in the preferred structures,
also to the nearest hydrogen.
A comparison of the distances Rcm or Rj_ of the CO and the corresponding Ar com¬
plexes suggests that the value of R for the fluorobenzene-N2 complex obtained by model
calculation using a Lennard-Jones potential [93] is too small, since in all the other com¬
plexes, the distance of the rare gas or the centre of mass of the diatomic to the ring plane is
greater than 3.4 Â, and R± = 3.59 À was found for the So state of para-difluorobenzene-N2
using rotationally resolved Si <— So fluorescence excitation spectroscopy [108]. Apply¬
ing the same method as in Ref. 93 to the fluorobenzene-CO complex, a value of about
3.3 Â was found for Rcm, with the CO in the symmetry plane and the oxygen closer
2Ring centre = arithmetic mean of the positions of the ring nuclei.
42 Chapter 4. Fluorobenzene-Carbon Monoxide
to the ring plane and pointing away from the fluorine. Similarly, in another study of
substituted benzene-argon complexes using LJ-potentials, shorter distances between the
argon and the ring plane than the experimental one were obtained [109]. Thus, a simple
LJ-potential is not accurate enough to predict the structure or the potential hindering in¬
ternal rotation. On the other hand, an empirical intermolecular potential surface based
on Lennard-Jones type potential functions including three-body interactions fitted to
ground state microwave data [3] may predict the vibrational spectrum of Van der Waals
modes, as was shown in the case of benzene-Ar [110,111].
Comparing the structures of the complexes, the close similarity between fluoroben¬
zene and benzene as binding partners in Van der Waals complexes is obvious. In the
fluorobenzene complexes, the binding partner is slightly shifted away from the ring cen¬
tre to the fluorine, but the distance to the ring plane is almost the same as in the benzene
complex. The main difference concerns the potential barrier hindering internal rotation.
While the benzene complexes exhibit almost free internal rotation because of the six-fold
potentials, there is a barrier of less than 25 cm-1 in fluorobenzene-CO; in fluorobenzene-
SO2, a barrier of about 155 cm-1 hindering the internal rotation around the Rcm axis was
estimated using an electrostatic interaction model. The difference between the CO and
SO2 complex can be rationalized simplistically by the different dipole moments (0.11 D
vs. 1.63 D), which interact with the dipole moment of fluorobenzene.
It is interesting to compare the complexes of aromatic molecules with CO and with
S02. In benzene-S02 [112], fluorobenzene-S02 [92], toluene-S02 [113], and furan-S02
[114], the SO2 was found to be placed above the ring plane with the sulfur closer to
the ring plane and an angle between the ring plane and the S02 plane of about 30-
60°. In contrast, the S02 is bonded via the S atom to the lone pair of the nitrogen in
pyridine-S02 [115]. While almost free internal rotation has been observed in benzene-
S02, splittings due to tunnelling motions between two equivalent configurations have
been observed in toluene-S02 and furan-S02; and in fluorobenzene-S02, the apparent
lack of any splittings due to a large amplitude motion is consistent with the Cs symmetry
of the complex. Despite the large difference in the dipole moments between CO and S02,
their complexes with aromatic molecules possess some similarities.

Table
4.13:Geometrie
structuresofVan
derWaalscomplexes
ofaromaticmoleculeswith
raregasesorsmallmolecules.
^
Fluorobenzene
Benzene
Furan
Pyrr
ole
COe
Ar
Ne
so2
CO
Ar
Ne
S02
N2
CO
Ar
COf
Ar
Reference
thiswork
[89,90]
[91]
[92]
[74]
[3]
[3]
[112
][7
8][3
4][81,87]
[75]
[82]
/£cm
/A
3.465
3.583
3.448
3.62
3.440
3.586
3.462
3.485
3.498
3.442
3.539
3.483
[3.4
81]
3.553
Rxa
jk
3.450
3.553
3.426
3.26S
3.262S
3.489
3.477
[3.4
69]
3.537
P\\b/Â
0.192
0.052
0.116
0.637
0.243
[0.3
21]
0.377
6/deg
5.29
7.4
6.6
18.70
00
011
00.
01-9.7
-3.4
[-4.7]
-
-5.5
p/deg
88.8
63.07h
85.4
57.0
h90
.01
90.01
68.7
[57.
0]r/deg
60.7
79.3
180.0
[0.0
]9c
/deg
20.54
15.46
48.12
Vd/cm"1
<25
<10k
0.28
—k
68.3
aDistance
ofthe
raregasorthe
centreofmass
ofthediatomicfromtheri
ngpl
ane.
bDistancetheraregas
orcentreofmass
ofthediatomic
isdi
spla
cedparallel
tothering
planefromthecentreofthering
towards
the
fluorineortheheteroatom.
c
Anglebetweenthesymmetry
axisoffluorobenzene
(a>axis)
and
the
ö-axisofthecomplex.
d(Lower)
barrierhi
nder
ingthe
internalrotation.
e
rsstructure.
fInbracketsanotherpo
ssib
lestructure.
sDistance
ofthe
sulfuratomfromtheri
ngpl
ane.
hAnglebetween
theS02symmetry
axisand
thez
axis
ofthe
(flu
oro)
benz
ene.
The
angles
between
theS02
planeand
the
ring
plan
eare27°and
33°
forfluorobenzeneandbenzene,
respectively.
1
Kept
fixed.
kAlmost
freeinternalrotation.
ci-
o O § s I
cr § o fcj §. CO
CO
44 Chapter 4. Fluorobenzene-Carbon Monoxide
In an investigation of Van der Waals complexes between Ar and aromatic molecules,
Kraka and Cremer have explained the preferred position of Ar above the ring plane
as a result of intermolecular dispersion and exchange repulsion effects [88,116]. The
complexes are stabilized by dispersion interactions, while exchange repulsion determines
the position of the Ar above the ring. In general, Ar moves toward the atom with
the smallest volume and the smallest exchange repulsion. This is normally the most
electronegative atom of a molecule with the strongest charge contraction. That is the N
in pyrrole or pyridine, and 0 in furan, oxazole and isoxazole - in good agreement with
the experimental results [81,82,84,86-88,116]. In the thiophene-Ar complex, the argon
atom is shifted from the centre of mass or the ring centre away from the S atom with
its larger electronic cloud [104,117]. It would be interesting to test if this model is also
valuable for the CO complexes, especially if it can explain why CO prefers to bind to the
free lone pair of N of pyridine and isoxazole.
4.8 Conclusion
The rotational spectrum of the fluorobenzene-CO complex was measured and analyzed.
The main feature of the spectrum is the presence of two sets of lines, which indicates that
CO is executing large amplitude motions between two equivalent minima in the complex.
The structure of the complex was determined from the moments of inertia of the torsional
ground state of different isotopomers and was confirmed by the analysis of the dipole
moment and of the D quadrupole coupling constants. As in benzene-CO, furan-CO and
pyrrole-CO, a structure with the CO above the ring plane was determined. The barrier
hindering internal rotation is estimated to be very low, with the magnitude between that
of furan-CO and benzene-CO. Finally, it has to be pointed out that the large amplitude
motions strongly influence the determination of the structural parameters.

Chapter 5
The Fluorobenzene-Oxygen Van der
Waals Complex
5.1 Introduction
Molecular oxygen, 02, in its ground state X 3Sj, is one of the few stable radicals. It
possesses a triplet ground state (S = l), and, therefore, the electron spin-electron spin
interaction
2A
Hss = -f(3S2,-S2), (5.1)
where Szi is the component of the electron spin operator along the molecular axis of
oxygen, has to be considered. Furthermore, because both 160 and 180 are spin / = 0
nuclei, Bose-Einstein statistics have to be considered for the 1602 and 1802 species. For
these isotopomers, only rotational states with odd values of TV exist due to the E~
symmetry of the electronic ground state. This is contrary to what is found for molecules
in a £+ state (such as C1602), which possess only rotational states with even values of N.
Hence, in a complex with oxygen, compared to one with carbon monoxide, the number of
states is larger by a factor of 3 x | due to the triplet state and nuclear statistics. Details
of the rotational spectrum and the theory regarding the fine structure and Zeeman effect
for O2 in its X 3£~ ground state have been discussed by Mizushima [118] and by Tinkham
and Strandberg [119,120].
First measurements of 02 complexes were done by Ewing and co-workers who observed
the low resolution gas phase infrared spectra of (02)2 [121] and 02-Ar [122] in a long
path, low temperature (« 90 K) cell. These complexes have also been subjects of many
theoretical papers [123-128]. In addition, the magnetic spectrum of 02-Ar was studied
using the magnetic beam resonance technique [129]. Ab initio studies of 02-Rg [130,131]
45

46 Chapter 5. Fluorobenzene-Oxygen
and of O2-H2O [132] have been published. Complexes of oxygen and aromatic molecules
have been studied by photoionization techniques (benzene and hexafluorobenzene) [133,
134] and calculations using SCF/MP2 [135], MCSCF [136], or density functional theory
[137] have been performed. The only high-resolution study of a complex containing
oxygen yet published is the infrared study of 02-N20 [138]. Other complexes of oxygen
studied by infrared or microwave spectroscopy include 02-OCS, 02-C02 and 02-S02,
but their analyses have not been completed [139,140].
5.2 Analytical Model
A Hamiltonian for a complex consisting of a diatomic open-shell molecule and a closed
shell partner has been described by Fawzy [141-144], and Howard and coworkers have
presented Hamiltonians for Ar-NO [145] and for complexes with 02 [146].
The electron spin-electron spin interaction defined in the axis system of the oxygen
molecule (Eq. 5.1) has to be transformed into the axis system of the complex according
to Fig. 5.1. The transformations are given by [14]
' — sin 9 cos 4> cos 9 sin 4> cos 9 \
0 — sin (j) cos <;
cos 9 cos è sin 9 sin è sin 9
' s,\
'y'
SxiV s*' J
( s ^
sb
yscJ
( s "^
V J
sb
Sr_
(5.2)
\S*J
— sin 9 0 cos 9
cos 0 cos 9 — sin 0 cos <f> sin 9
1 sin <j> cos 9 cos <j) sin <j> sin 9 ,
\ / q \
Syl
\ S*' /
(5.3)
and the resulting expression is
AHss = ^(3 cos2 9-1) (3S2a - S2) +X(2 cos2 <f> - 1) sin2 9(S2b - S2)
+2A(sin (j> cos 0 sin2 9) (SbSc + ScSb) + 2A(cos <p sin 9 cos 9) (SbSa + SaSb)
+2X(sin (j) sin 9 cos 9)(ScSa + SaSc). (5.4)
Depending on the symmetry of the complex, several terms of Eq. 5.4 may be zero. In the
case of an effective Cs symmetry (((f>) = 0, c axis perpendicular to the symmetry plane
(xz plane) of fluorobenzene, see Chap. 4), the third and fifth terms vanish. Assuming
free internal rotation, Eq. 5.4 is simplified to
Fiù
2A /3cos2#(zsi-s2). (5.5)
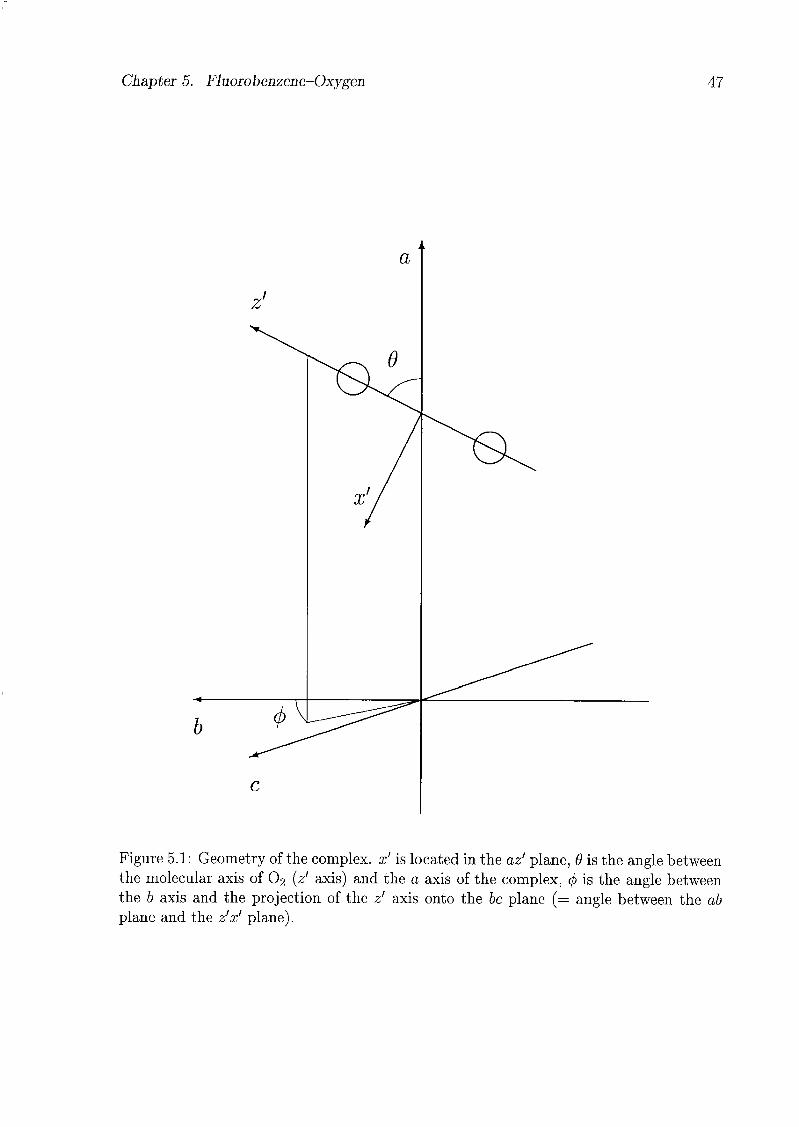
I
Chapter 5. Fluorobenzene-Oxygen 47
Figure 5.1: Geometry of the complex, x' is located in the az' plane, 9 is the angle between
the molecular axis of 02 (z' axis) and the a axis of the complex, 4> is the angle between
the b axis and the projection of the z' axis onto the bc plane (= angle between the ab
plane and the z'x' plane).
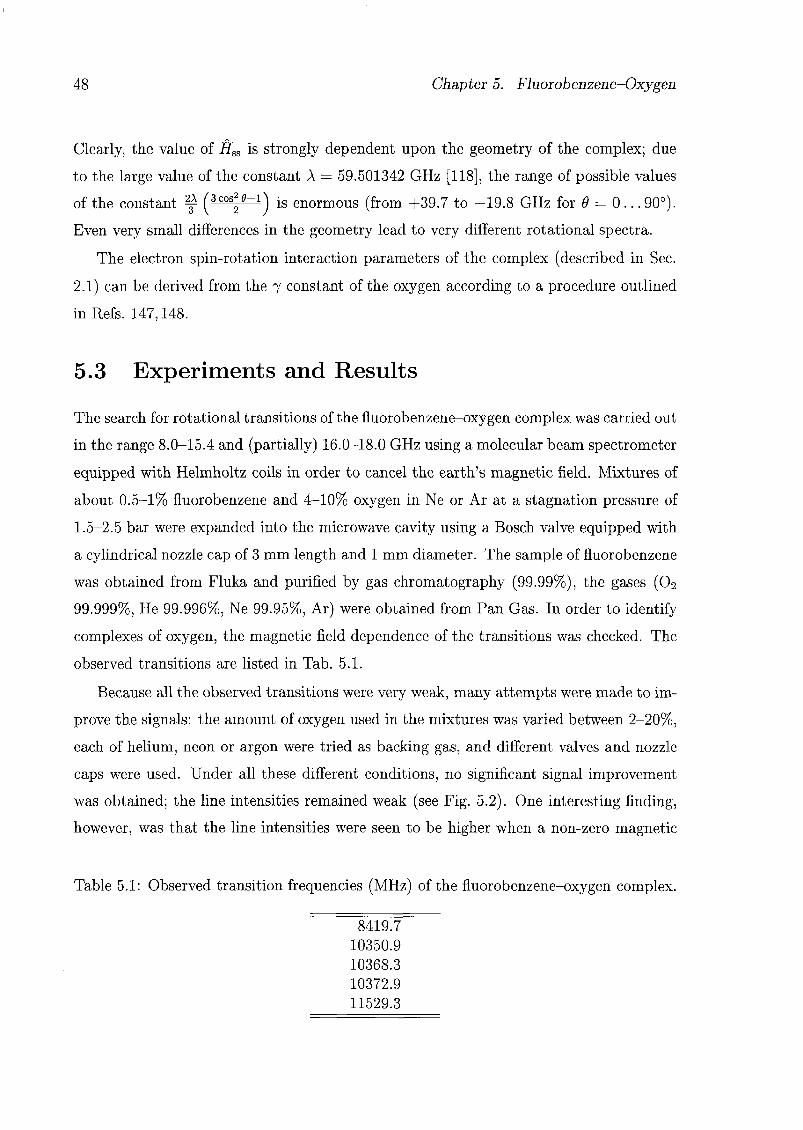
48 Chapter 5. Fluorobenzene-Oxygen
Clearly, the value of Hss is strongly dependent upon the geometry of the complex; due
to the large value of the constant A = 59.501342 GHz [118], the range of possible values
of the constant f (3cos^~1) is enormous (from +39.7 to -19.8 GHz for 9 = 0... 90°).
Even very small differences in the geometry lead to very different rotational spectra.
The electron spin-rotation interaction parameters of the complex (described in Sec.
2.1) can be derived from the 7 constant of the oxygen according to a procedure outlined
in Refs. 147,148.
5.3 Experiments and Results
The search for rotational transitions of the fluorobenzene-oxygen complex was carried out
in the range 8.0-15.4 and (partially) 16.0-18.0 GHz using a molecular beam spectrometer
equipped with Helmholtz coils in order to cancel the earth's magnetic field. Mixtures of
about 0.5-1% fluorobenzene and 4-10% oxygen in Ne or Ar at a stagnation pressure of
1.5-2.5 bar were expanded into the microwave cavity using a Bosch valve equipped with
a cylindrical nozzle cap of 3 mm length and 1 mm diameter. The sample of fluorobenzene
was obtained from Fluka and purified by gas chromatography (99.99%), the gases (02
99.999%, He 99.996%, Ne 99.95%, Ar) were obtained from Pan Gas. In order to identify
complexes of oxygen, the magnetic field dependence of the transitions was checked. The
observed transitions are listed in Tab. 5.1.
Because all the observed transitions were very weak, many attempts were made to im¬
prove the signals: the amount of oxygen used in the mixtures was varied between 2-20%,
each of helium, neon or argon were tried as backing gas, and different valves and nozzle
caps were used. Under all these different conditions, no significant signal improvement
was obtained; the line intensities remained weak (see Fig. 5.2). One interesting finding,
however, was that the line intensities were seen to be higher when a non-zero magnetic
Table 5.1: Observed transition frequencies (MHz) of the fluorobenzene-oxygen complex.
8419.7
10350.9
10368.3
10372.9
11529.3
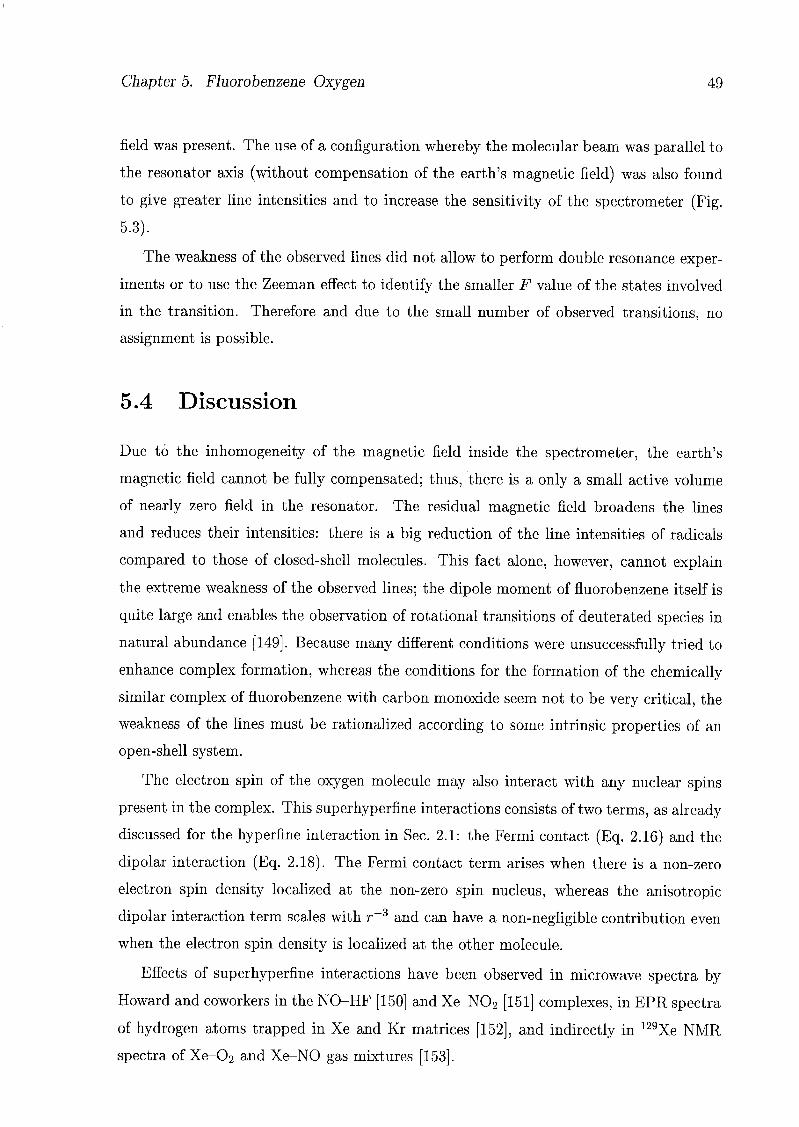
Chapter 5. Fluorobenzene-Oxygen 49
field was present. The use of a configuration whereby the molecular beam was parallel to
the resonator axis (without compensation of the earth's magnetic field) was also found
to give greater line intensities and to increase the sensitivity of the spectrometer (Fig.
5.3).
The weakness of the observed lines did not allow to perform double resonance exper¬
iments or to use the Zeeman effect to identify the smaller F value of the states involved
in the transition. Therefore and due to the small number of observed transitions, no
assignment is possible.
5.4 Discussion
Due to the inhomogeneity of the magnetic field inside the spectrometer, the earth's
magnetic field cannot be fully compensated; thus, there is a only a small active volume
of nearly zero field in the resonator. The residual magnetic field broadens the lines
and reduces their intensities: there is a big reduction of the line intensities of radicals
compared to those of closed-shell molecules. This fact alone, however, cannot explain
the extreme weakness of the observed lines; the dipole moment of fluorobenzene itself is
quite large and enables the observation of rotational transitions of deuterated species in
natural abundance [149]. Because many different conditions were unsuccessfully tried to
enhance complex formation, whereas the conditions for the formation of the chemically
similar complex of fluorobenzene with carbon monoxide seem not to be very critical, the
weakness of the lines must be rationalized according to some intrinsic properties of an
open-shell system.
The electron spin of the oxygen molecule may also interact with any nuclear spins
present in the complex. This superhyperfine interactions consists of two terms, as already
discussed for the hyperfine interaction in Sec. 2.1: the Fermi contact (Eq. 2.16) and the
dipolar interaction (Eq. 2.18). The Fermi contact term arises when there is a non-zero
electron spin density localized at the non-zero spin nucleus, whereas the anisotropic
dipolar interaction term scales with r-3 and can have a non-negligible contribution even
when the electron spin density is localized at the other molecule.
Effects of superhyperfine interactions have been observed in microwave spectra by
Howard and coworkers in the NO-HF [150] and Xe-N02 [151] complexes, in EPR spectra
of hydrogen atoms trapped in Xe and Kr matrices [152], and indirectly in 129Xe NMR
spectra of Xe-02 and Xe-NO gas mixtures [153].
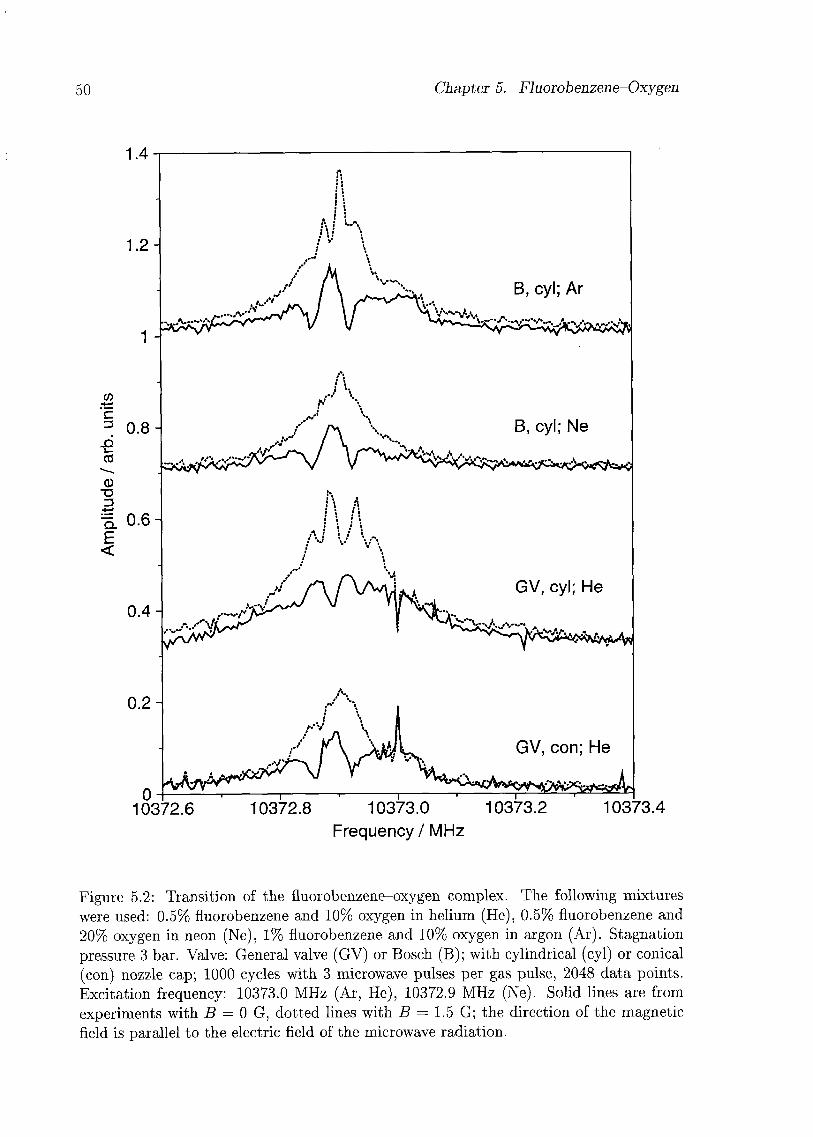
50 Chapter 5. Fluorobenzene-Oxygen
Figure 5.2: Transition of the fluorobenzene-oxygen complex. The following mixtures
were used: 0.5% fluorobenzene and 10% oxygen in helium (He), 0.5% fluorobenzene and
20% oxygen in neon (Ne), 1% fluorobenzene and 10% oxygen in argon (Ar). Stagnation
pressure 3 bar. Valve: General valve (GV) or Bosch (B); with cylindrical (cyl) or conical
(con) nozzle cap; 1000 cycles with 3 microwave pulses per gas pulse, 2048 data points.
Excitation frequency: 10373.0 MHz (Ar, He), 10372.9 MHz (Ne). Solid lines are from
experiments with B = 0 G, dotted lines with B = 1.5 G; the direction of the magnetic
field is parallel to the electric field of the microwave radiation.
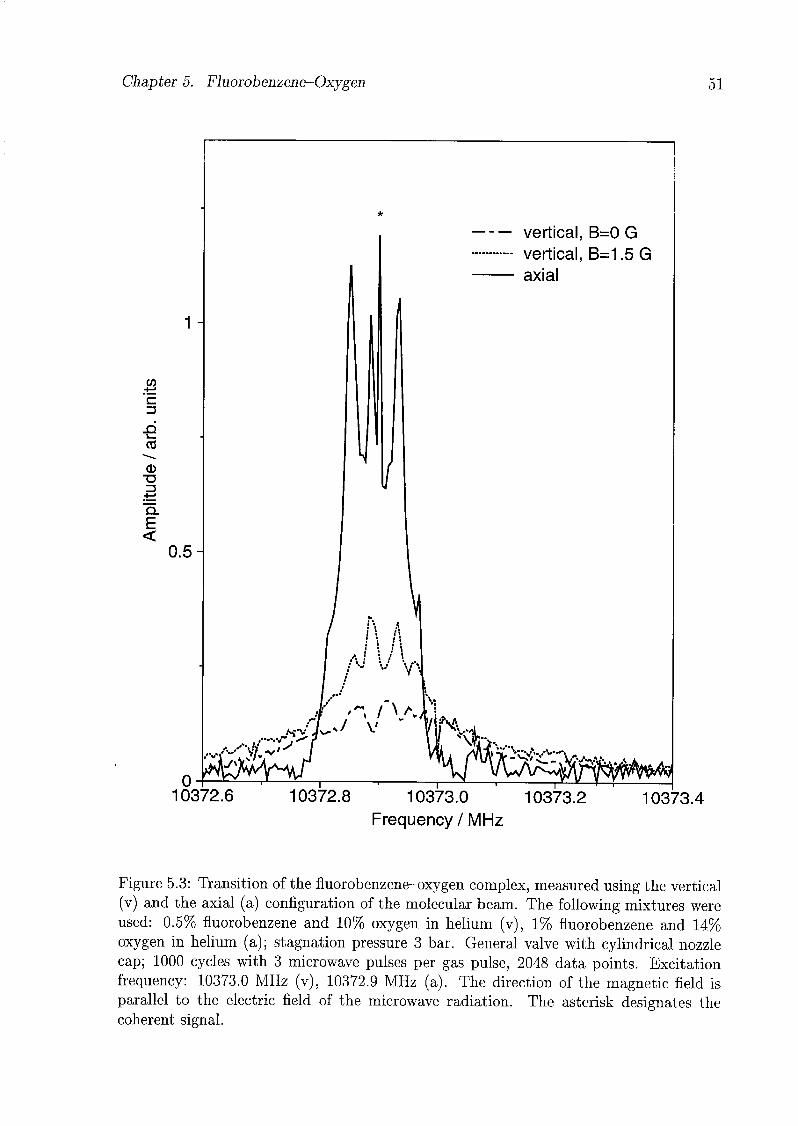
Chapter 5. Fluorobenzene-Oxygen 51
1 -
coI—I
'c
JDi_
CO
0T3
"5.E<
0.5-
vertical, B=0 G
vertical, B=1.5 G
axial
010372.6 10372.8 10373.0 10373.2
Frequency/MHz
10373.4
Figure 5.3: Transition of the fluorobenzene-oxygen complex, measured using the vertical
(v) and the axial (a) configuration of the molecular beam. The following mixtures were
used: 0.5% fluorobenzene and 10% oxygen in helium (v), 1% fluorobenzene and 14%
oxygen in helium (a); stagnation pressure 3 bar. General valve with cylindrical nozzle
cap; 1000 cycles with 3 microwave pulses per gas pulse, 2048 data points. Excitation
frequency: 10373.0 MHz (v), 10372.9 MHz (a). The direction of the magnetic field is
parallel to the electric field of the microwave radiation. The asterisk designates the
coherent signal.
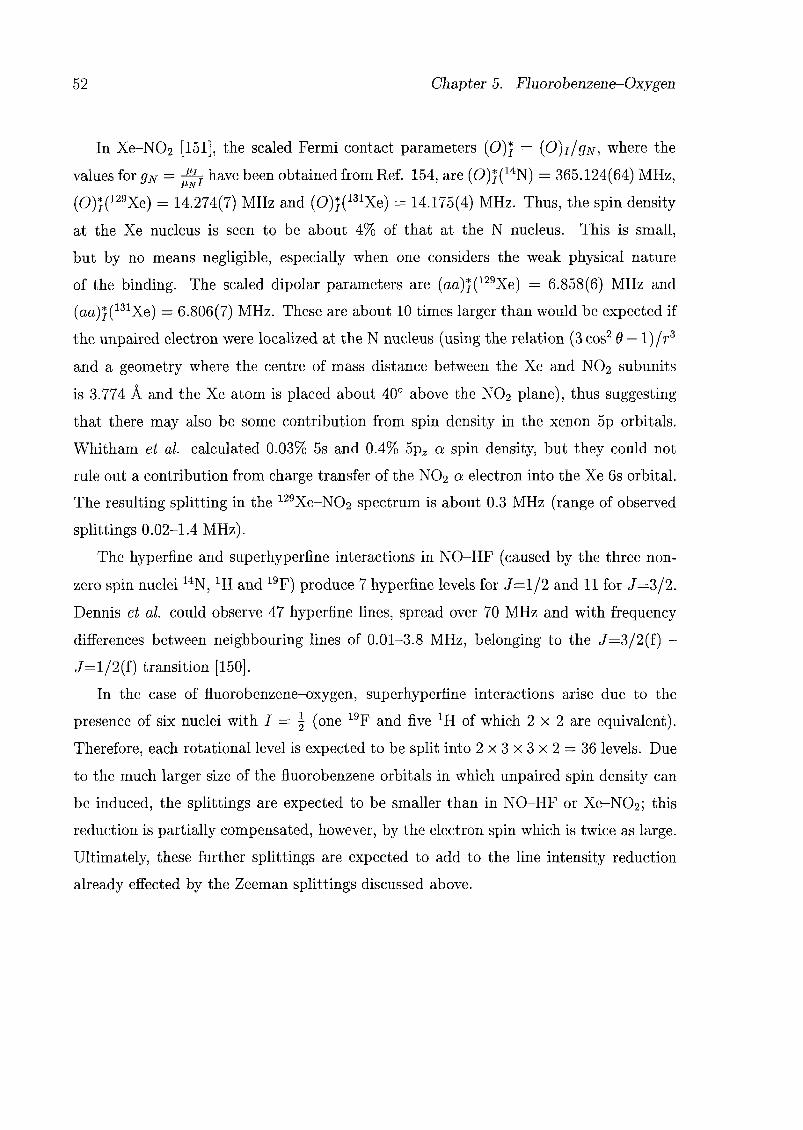
52 Chapter 5. Fluorobenzene-Oxygen
In Xe-N02 [151], the scaled Fermi contact parameters (O)} = (0)//t/jv, where the
values for gN = -jfa have been obtained from Ref. 154, are (0)}(14N) = 365.124(64) MHz,
(0)*(129Xe) = 14.274(7) MHz and (0)}(131Xe) = 14.175(4) MHz. Thus, the spin density
at the Xe nucleus is seen to be about 4% of that at the N nucleus. This is small,
but by no means negligible, especially when one considers the weak physical nature
of the binding. The scaled dipolar parameters are (aa)|(129Xe) = 6.858(6) MHz and
(aa)}(131Xe) = 6.806(7) MHz. These are about 10 times larger than would be expected if
the unpaired electron were localized at the N nucleus (using the relation (3 cos2 9 — l)/r3
and a geometry where the centre of mass distance between the Xe and N02 subunits
is 3.774 A and the Xe atom is placed about 40° above the N02 plane), thus suggesting
that there may also be some contribution from spin density in the xenon 5p orbitals.
Whitham et al. calculated 0.03% 5s and 0.4% 5p2 a spin density, but they could not
rule out a contribution from charge transfer of the N02 a electron into the Xe 6s orbital.
The resulting splitting in the 129Xe-N02 spectrum is about 0.3 MHz (range of observed
splittings 0.02-1.4 MHz).
The hyperfine and superhyperfine interactions in NO-HF (caused by the three non¬
zero spin nuclei 14N, XH and 19F) produce 7 hyperfine levels for J=l/2 and 11 for J=3/2.
Dennis et al. could observe 47 hyperfine lines, spread over 70 MHz and with frequency
differences between neighbouring lines of 0.01-3.8 MHz, belonging to the J=3/2(f) -
J=l/2(f) transition [150].
In the case of fluorobenzene-oxygen, superhyperfine interactions arise due to the
presence of six nuclei with I = \ (one 19F and five XH of which 2 x 2 are equivalent).
Therefore, each rotational level is expected to be split into 2x3x3x2 = 36 levels. Due
to the much larger size of the fluorobenzene orbitals in which unpaired spin density can
be induced, the splittings are expected to be smaller than in NO-HF or Xe-N02; this
reduction is partially compensated, however, by the electron spin which is twice as large.
Ultimately, these further splittings are expected to add to the line intensity reduction
already effected by the Zeeman splittings discussed above.
Chapter 6
Vibrationally Excited States of
Fluorobenzene in a Pulsed Jet
6.1 Introduction
The technique of supersonic molecular beam spectroscopy simplifies rotational spectra
considerably because higher energy levels are depopulated efficiently during the expan¬
sion process. At ambient temperature in a static gas, the spectrum contains numerous
rotational transitions with high angular momentum quantum numbers, and, frequently,
rotational transitions in excited vibrational states of low frequency modes are observed as
satellites accompanying the ground state transitions. Whereas the cooling of rotational
states is very efficient when using a molecular beam, the cooling of vibrational states
depends strongly on their frequencies [155,156].
The lowest rotational temperatures are achieved through a supersonic expansion of
sample mixtures entrained in rare gases. The rotational cooling increases in the order
He < Ne < Ar [155]. Even if the vibrational cooling is not very efficient, it is sufficient
under standard experimental conditions to reduce the populations of excited vibrational
states below the detection limit.
It came as a surprise that, when Van der Waals complexes of fluorobenzene were being
measured with the molecular beam FTMW spectrometer, a number of satellites were
observed near the rotational transitions of the fluorobenzene monomer. The intensities
of these satellites were comparable to those of the rotational transitions of naturally
abundant 13C isotopomers. Similar satellites were observed also in the static gas at
ambient temperature in a waveguide FTMW spectrometer.
53
54 Chapter 6. Vibrationally Excited States of Fluorobenzene
In this chapter, the results of the investigation of some rotational transitions of flu¬
orobenzene in vibrationally excited states are reported. The different carrier gases and
stagnation pressures used were seen to influence the intensity, the shape, and the time
evolution of the satellites during the gas pulse. Rotational constants of four vibrationally
excited states were determined from the accurately measured frequencies; tentative as¬
signments of the transitions to vibrational normal modes are given.
6.2 Experimental Details
Using the molecular beam FTMW spectrometer, measurements were made between 7-
17 GHz. While accurate frequency measurements of individual transitions were obtained
from spectra recorded with the jet parallel to the resonator axis, all other spectra were
recorded with the vertical arrangement of the jet (i.e. perpendicular to the resonator
axis).
A mixture of 1% fluorobenzene entrained in a rare gas at a stagnation pressure of
1-2.5 bar was injected into the vacuum of 10~5 mbar through a pulsed valve (General
Valve, Series 9), equipped with a simple cylindrical nozzle cap of 5 mm length and
0.5 mm diameter or with a conical nozzle cap of 5 mm length and 100° opening angle.
The nominal opening time of the valve was 1 ms.
The molecules in the jet were polarized with microwave pulses of 1 ps duration and
a peak power of 0.6-0.8 mW. For broadband scans, 12 microwave pulses were applied
to an individual gas pulse, starting 0.8 ms after the opening of the valve. 5-15 ps after
each microwave pulse, data collection was initialized; 512 data points were collected at
a sampling rate of 10 MHz. In high resolution measurements, only one microwave pulse
was applied per gas pulse and 512-2048 data points were recorded. Accurate transition
frequencies were obtained from fits to the time domain signals obtained using helium at
a pressure of 1.5-2 bar as carrier gas.
Rotational spectra of fluorobenzene between 8-15 GHz were also recorded using the
waveguide FTMW spectrometer. A pressure of 0.13 Pa and a temperature of 22°C was
maintained in the waveguide cell. Microwave pulses of 20 ns duration and 10 W peak
power were used to polarize a 50 MHz range. Polarization decays from 107 pulses at a
repetition rate of 55 kHz were collected in 512 channels.

Chapter 6. Vibrationally Excited States of Fluorobenzene 55
6.3 Results and Discussion
In the broadband scans recorded using 1 bar helium or neon as carrier gas, rotational
transitions of vibrationally excited states were present with relative intensities of up to
4% of that of the ground state transition, while in the scans obtained using argon as
carrier gas, only a few extremely weak excited vibrational state transitions were visible
(see Figs. 6.1 - 6.10). Although the relative line intensities measured in Fourier transform
spectra are not reliable (the relative intensities of the (1-13C)- and (2-13C)-fluorobenzene
isotopomers are 0.2-1.5 and 1.5-3.4% where 1.1 and 2.2% would be expected), these
tendencies are clear. Furthermore, even though the conditions were not really compara¬
ble, the results obtained using the two different nozzle shapes show that the cylindrical
nozzle is perhaps somewhat more favourable for the observation of excited states (Figs.
6.9, 6.10).
These excited vibrational state lines were also present in the waveguide spectra, along
with numerous Q-branch transitions with high J quantum numbers, whereas no (or only
very weak) transitions of the isotopomers were observed, thus demonstrating the higher
sensitivity of the jet spectrometer.
Figures 6.1 - 6.8. Broadband scans with argon, neon and helium as buffer gas (stagnationpressure 1 bar), and static gas waveguide spectrum (bottom trace without label). The jetand waveguide spectra are normalized in such a way that the maxima of the rotational
transitions of fluorobenzene in the vibrational ground state are set to a value of 100 in
the waveguide spectrum and to 1000 in the jet spectra. Since the broadband scans of the
jet spectrometer consist of overlapping power spectra, all data points are sorted acordingto their frequencies, and the amplitude is averaged over 5 data points. Cl, C2: (1-13C)-,(2-13C)-fluorobenzene; a-f: arbitrary labels of vibrational states of fluorobenzene; F-Ne:
fluorobenzene-Ne complex; F-Ar: fluorobenzene-Ar complex.
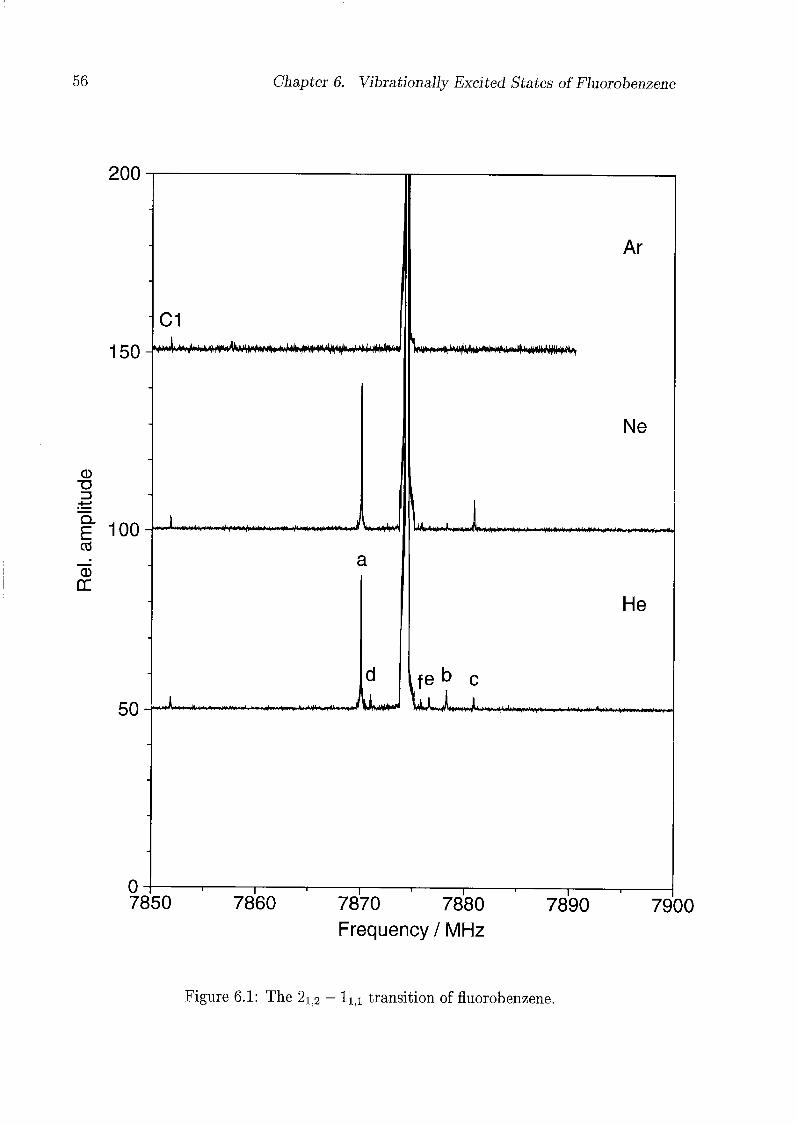
Chapter 6. Vibrationally Excited States of Fluorobenzene
200
150
C1
100-
50-
,».,iln.»Mill, mu » nt|l(i<H^rlH«»iM i«l» .i^..»»>|ini<Hl'IV* *'> V»i<.^y*MHAfwJlVw-«*Vl
»^iWI'tMi^iUnH i wil»M»i I *i
W»w
in4»M-»w'i »^'tis^*U'»P<V" ff'nfWF'^^
Ar
+ tMtfM^^ttW^ifM^tiMiito^,
Ne
MAi<h",> ihm Ai mww,^i...i '»Mill »il>l»« »im»<W« I.K'll ».V. "l^r,
He
I fe b c
4fr<t> »immiwii<ww^>*y
07850 7860 7870 7880
Frequency/MHz
7890 7900
Figure 6.1: The 2li2 — li,i transition of fluorobenzene.

Chapter 6. Vibrationally Excited States of Fluorobenzene 57
200
8510 8520 8530 8540 8550 8560
Frequency / MHz
Figure 6.2: The 202 — lo,i transition of fluorobenzene.
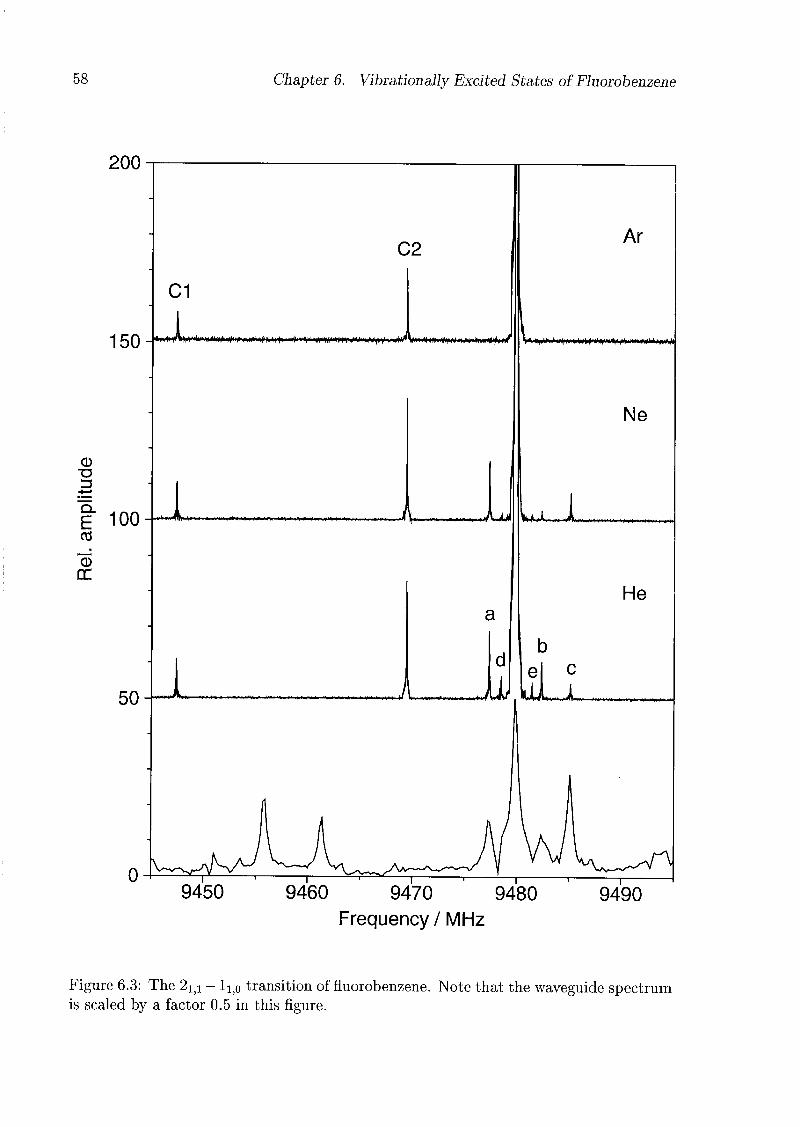
58 Chapter 6. Vibrationally Excited States of Fluorobenzene
200
9450 9460 9470 9480
Frequency / MHz
9490
Figure 6.3: The 21;1 — li)0 transition of fluorobenzene. Note that the waveguide spectrumis scaled by a factor 0.5 in this figure.

Chapter 6. Vibrationally Excited States of Fluorobenzene 59
200
Ar
C1
150-h*A*>i.i***h*'i«*>* u^^«%v^*^ift%¥.V<**»'w»iw^^i»%* W»in»t-un»<i+*«*l»v #wWi^wn*i*mi«M
0
+—'
I 100CO
50-
0
tiiit+'itiith+i******»»*,****»********^,**
JL f
d
AxJ
-J—L
f
Lu
Ne
-A_~ *_.
He
b c
~-yJ« JL
11700 11710 11720 11730
Frequency / MHz
11740
Figure 6.4: The 3ii3 — 2ij2 transition of fluorobenzene.
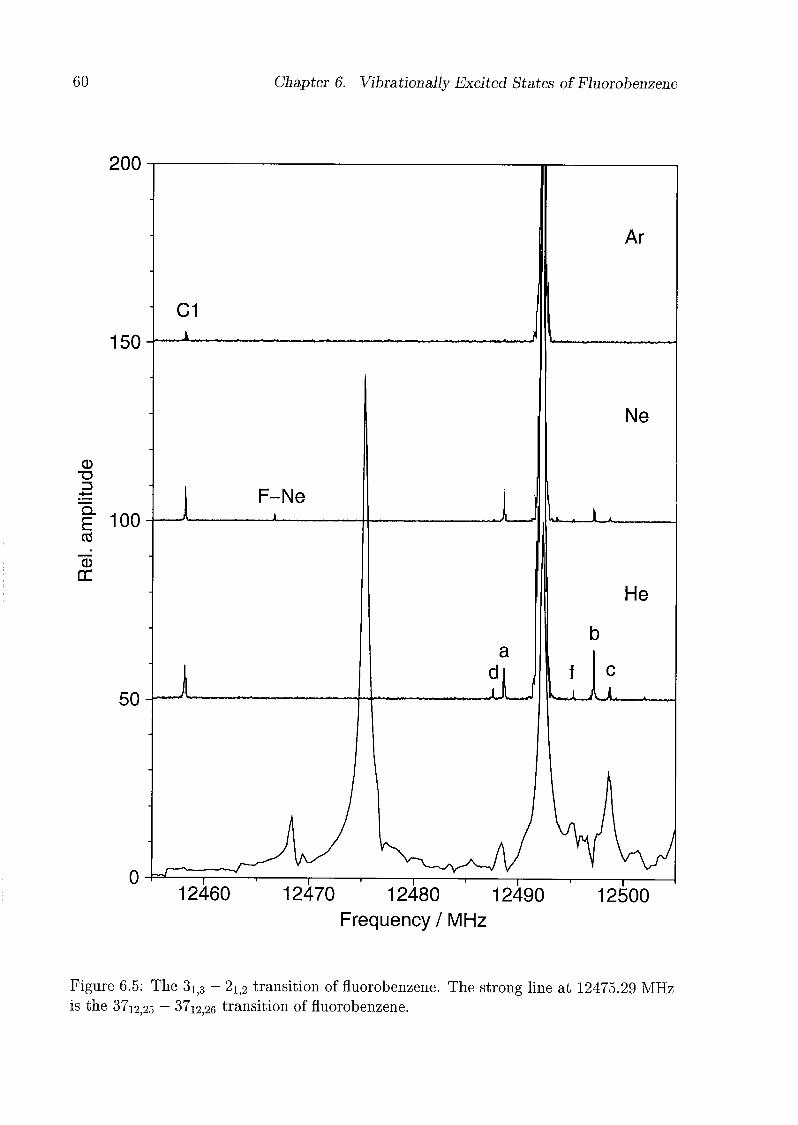
60 Chapter 6. Vibrationally Excited States of Fluorobenzene
200
150-
CD"O
| 100CO
cr
50
0
-
Ar
C1
. . .
J
" Ne
'
| F-Ne 1 J1*, \ «
' A
He
la
b
i f I'
r-' i i '
L_VWtyI 1 1 1 f
12460 12470 12480 12490
Frequency /MHz
12500
Figure 6.5: The 3ij3 — 21]2 transition of fluorobenzene. The strong line at 12475.29 MHz
is the 37i2;25 — 37i2,26 transition of fluorobenzene.
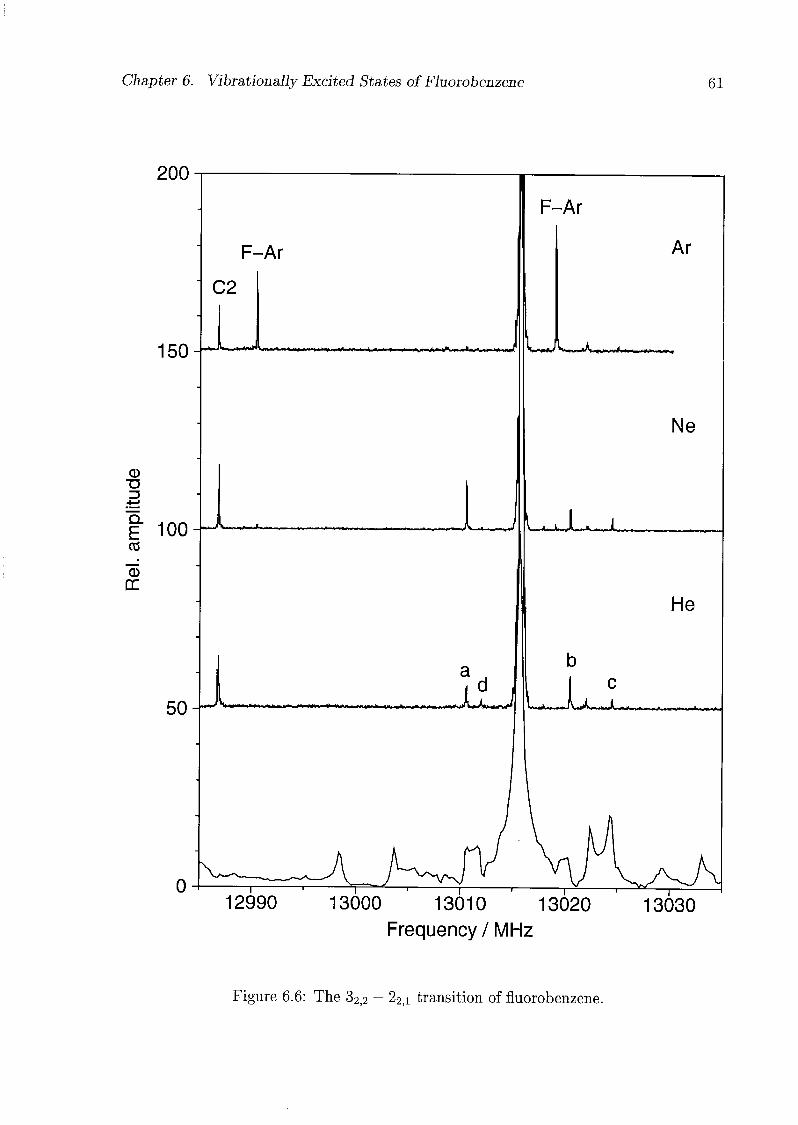
Chapter 6. Vibrationally Excited States of Fluorobenzene 61
200
F-Ar
150
C2
Jl »H* in n n i mi m ~t i-
in i tfi iiTi i \ m ni i r ni.ir-ni'i*- >ain rfcii rii n' 'i*r
CDT3
| 100CO
"CDDC
„-„ J\_4-
50 M»m**»»*<i i^J <ij» ^MWt»*4Mmr>^JiH>i1 J
12990 13000 13010 13020
Frequency / MHz
13030
Figure 6.6: The 32>2 — 22]1 transition of fluorobenzene.
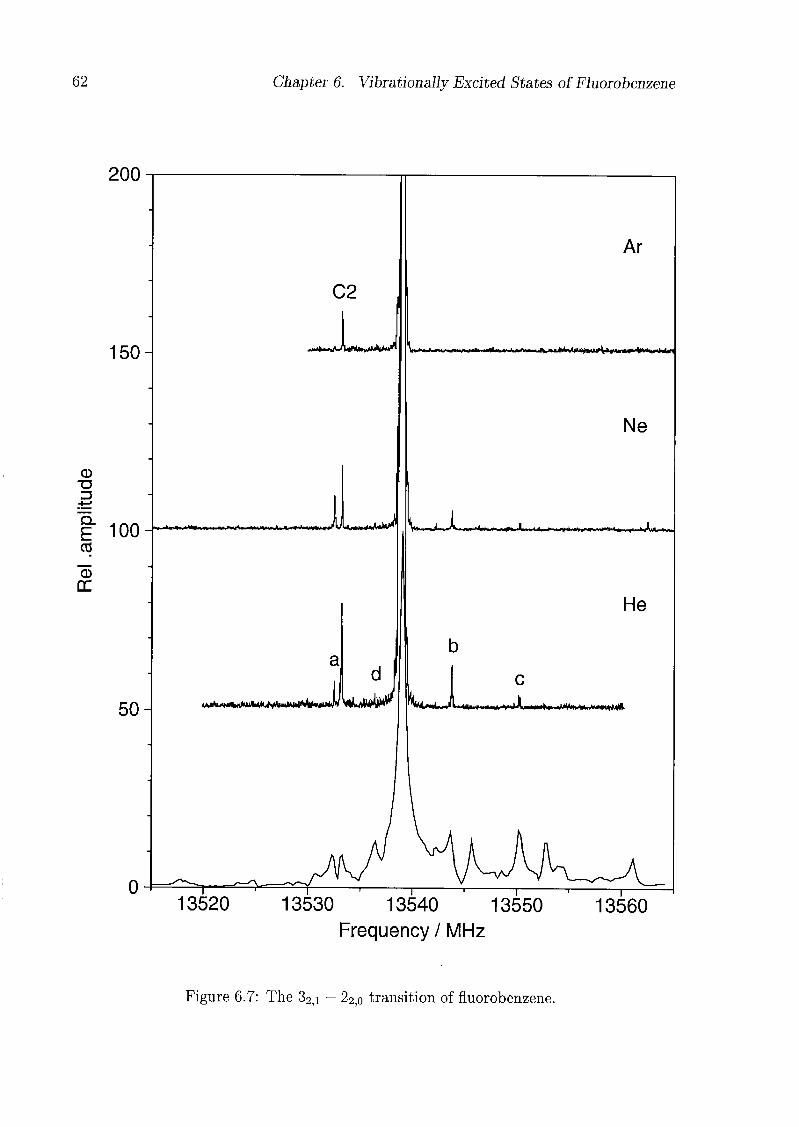
62 Chapter 6. Vibrationally Excited States of Fluorobenzene
200
C2
150- —*—JvAlM***«*^
CD
T3
-i—•
t 100^CO
rr
».*<<.H^WW.l,i»^ip.N^i<„ .i^^*MiwJu* »rf»m»<M 0 /y**«w»Ww*
50- tuh.mwwiW'M»>r*w>*mMl>«<'U4PILi
Ar
l»***«!,! ^HMi^llLi^lÉtF J.» *liil i,iHfc.iWMjMn^'<yi|aiH'***#'^"N^whj^
Ne
>fr^.,J..,^A—m -^l^*.«^..! !»<< »Ht.»».».! n^r^^wi i é h y >
He
fywJL im«m^"lA<»wm>ii n<«|<Hi Wn»«***#•
013520 13530 13540 13550
Frequency / MHz
13560
Figure 6.7: The 32,i — 22]0 transition of fluorobenzene.

Chapter 6. Vibrationally Excited States of Fluorobenzene 63
200
14120 14130
Frequency / MHz
Figure 6.8: The 3i)2 — 21;1 transition of fluorobenzene. The asterisk designates the 22;i2o 2 transition of fluorobenzene.
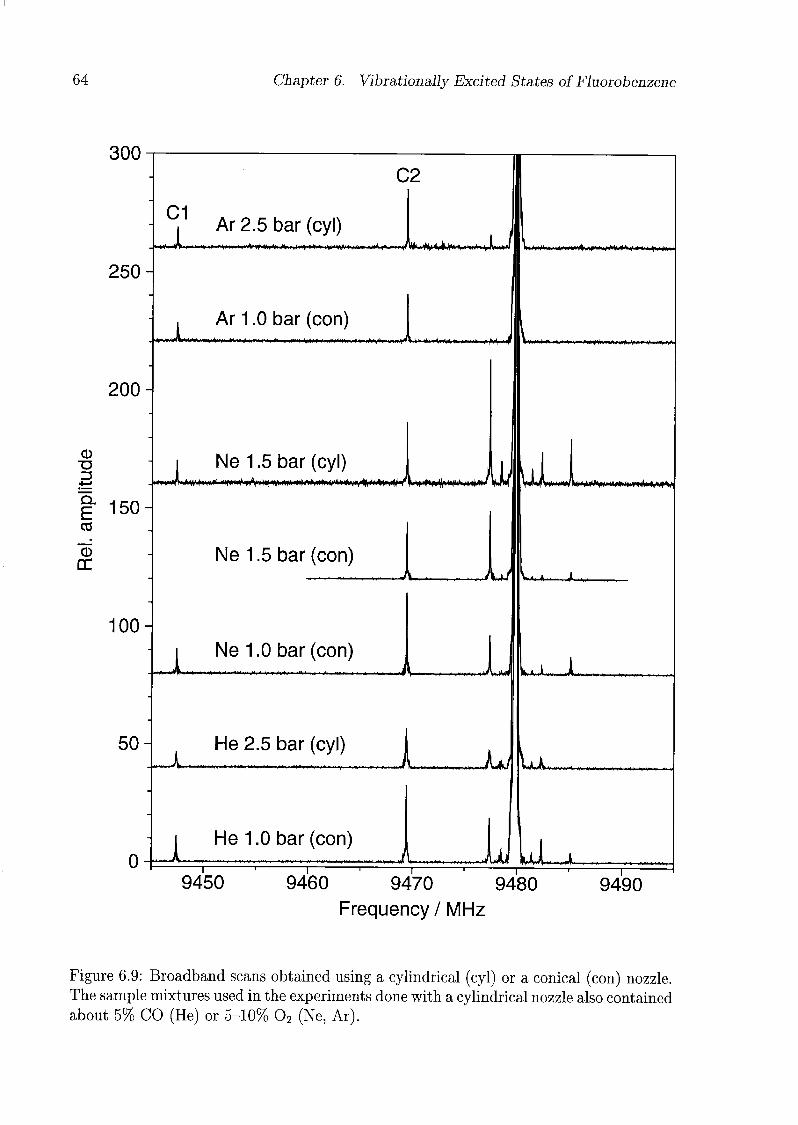
64 Chapter 6. Vibrationally Excited States of Fluorobenzene
300
250
.Ar 1.0 bar (con)
200-
CDTD13
g 150
co
CD
cr
100-
C2
R1 Ar 2.5 bar (cyl)^rW-A * * *i><H<> i|li't 'I».. ^Ill^ilflifiW ***,,*.*,, itW+ji+^^.I^MttXvMkA
i»»«w«*»^— ,*et**n+*m*,tm**»i***'*'*>-t**iiim»m>'i"\'<t'i< +»**>+*>+,+****** m*^
i Ne 1.5 bar (cyl)r>..^am^iii»' iii|w^<^ii,>»(.i».i<i),iiMrt»ii»iw|'''^'^^'<*%'i^'rV'»'f^>»H»*<«i» m\Jm
Ne 1.5 bar (con)-A \J
JL.Ne 1.0 bar (con)
-A
uJU
50 - He 2.5 bar (cyl)-.~»A.
\^t4^±^*m*#fa^*fifii'&4+<ti*i*<<i,}t*,i4<*\
^mi**,******.^******»**++,*,!* * 'IM|.*>*
v.*. * >_
JL
»(/«Jim »**»<¥<. *»
UJi 4. ,...
9450 9460 9470 9480
Frequency / MHz
9490
Figure 6.9: Broadband scans obtained using a cylindrical (cyl) or a conical (con) nozzle.
The sample mixtures used in the experiments done with a cylindrical nozzle also contained
about 5% CO (He) or 5-10% 02 (Ne, Ar).
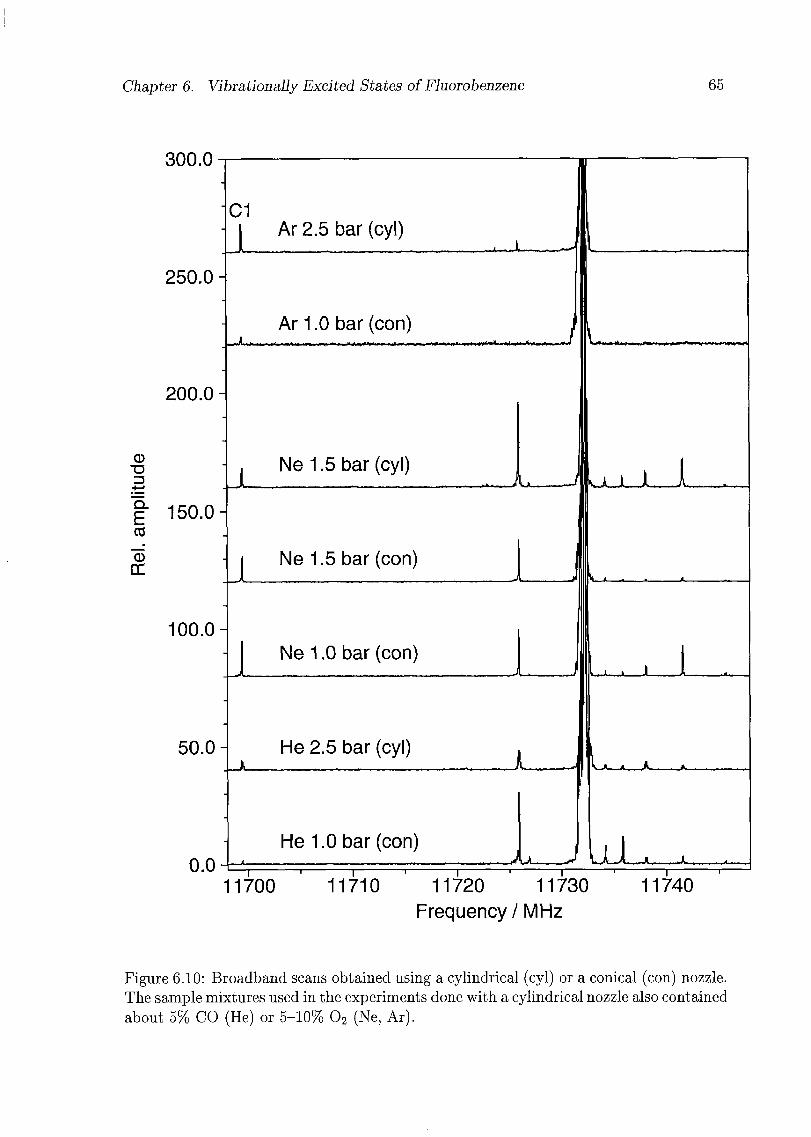
Chapter 6. Vibrationally Excited States of Fluorobenzene 65
300.0
250.0 -
200.0
CDo
g 150.0CO
DC
100.0-
50.0
0.0
C1
| Ar 2.5 bar (cyl)-Jl
Ar 1.0 bar (con)-Am* —».i<i».-w>»— **<»<,» <i«,—»dt^*«|rfi»» m*.»^JWNr»*f^*»»»l>*Mim *&***& »Mi I|l»i6»>«p0m
1
1
Ne 1.5 bar (cyl)
Ne 1.5 bar (con)
Ne 1.0 bar (con)
He 2.5 bar (cyl)
He 1.0 bar (con)
JL
JU.
L
<J-J—L
>>» ^-i «ijS*1 i »i». fc—*>»»*? wm^imrt«
Aa. J
i i > L
L_
uLL
1
—JU—_JL.
11700 11710 11720 11730 11740
Frequency /MHz
Figure 6.10: Broadband scans obtained using a cylindrical (cyl) or a conical (con) nozzle.
The sample mixtures used in the experiments done with a cylindrical nozzle also contained
about 5% CO (He) or 5-10% 02 (Ne, Ar).
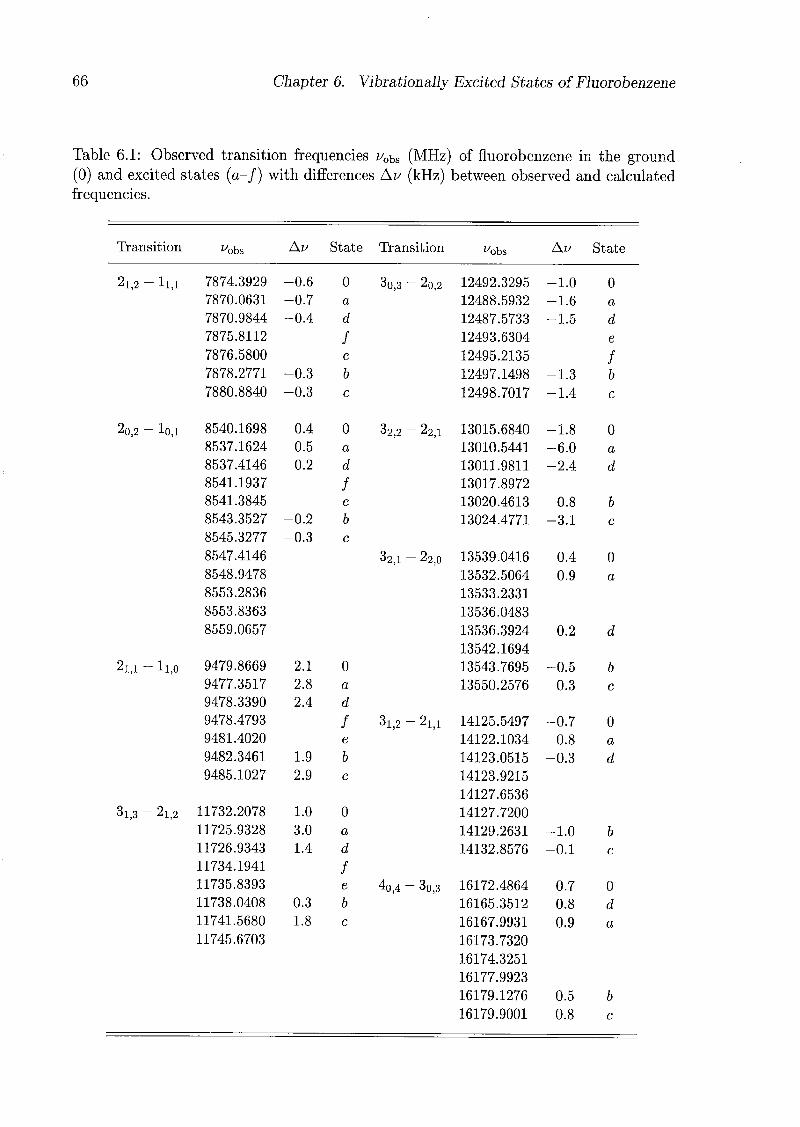
66 Chapter 6. Vibrationally Excited States of Fluorobenzene
Table 6.1: Observed transition frequencies u0^s (MHz) of fluorobenzene in the ground
(0) and excited states (a-f) with differences Au (kHz) between observed and calculated
frequencies.
Transition ^obs Au State Transition ^obs Av State
2l,2 - ll,l 7874.3929 -0.6 0 3o,3 -- 2o,2 12492.3295 -1.0 0
7870.0631 -0.7 a 12488.5932 -1.6 a
7870.9844 -0.4 d 12487.5733 -1.5 d
7875.8112 I 12493.6304 e
7876.5800 e 12495.2135 f7878.2771 -0.3 b 12497.1498 -1.3 b
7880.8840 -0.3 c 12498.7017 -1.4 c
2o,2 - lo,l 8540.1698 0.4 0 32,2 "-22,i 13015.6840 -1.8 0
8537.1624 0.5 a 13010.5441 -6.0 a
8537.4146 0.2 d 13011.9811 -2.4 d
8541.1937 f 13017.8972
8541.3845 e 13020.4613 0.8 b
8543.3527 -0.2 b 13024.4771 -3.1 c
8545.3277 -0.3 c
8547.4146 32,1 "- 22)o 13539.0416 0.4 0
8548.9478 13532.5064 0.9 a
8553.2836 13533.2331
8553.8363 13536.0483
8559.0657 13536.3924
13542.1694
0.2 d
2i,i — li,o 9479.8669 2.1 0 13543.7695 -0.5 b
9477.3517 2.8 a 13550.2576 0.3 c
9478.3390 2.4 d
9478.4793 f 3l,2 "-2i,i 14125.5497 -0.7 0
9481.4020 e 14122.1034 0.8 a
9482.3461 1.9 b 14123.0515 -0.3 d
9485.1027 2.9 c 14123.9215
14127.6536
3i,3 — 2i]2 11732.2078 1.0 0 14127.7200
11725.9328 3.0 a 14129.2631 -1.0 b
11726.9343 1.4 d 14132.8576 -0.1 c
11734.1941 f
11735.8393 e 4o,4--3o,3 16172.4864 0.7 0
11738.0408 0.3 b 16165.3512 0.8 d
11741.5680 1.8 c 16167.9931 0.9 a
11745.6703 16173.7320
16174.3251
16177.9923
16179.1276
16179.9001
0.5
0.8
b
c
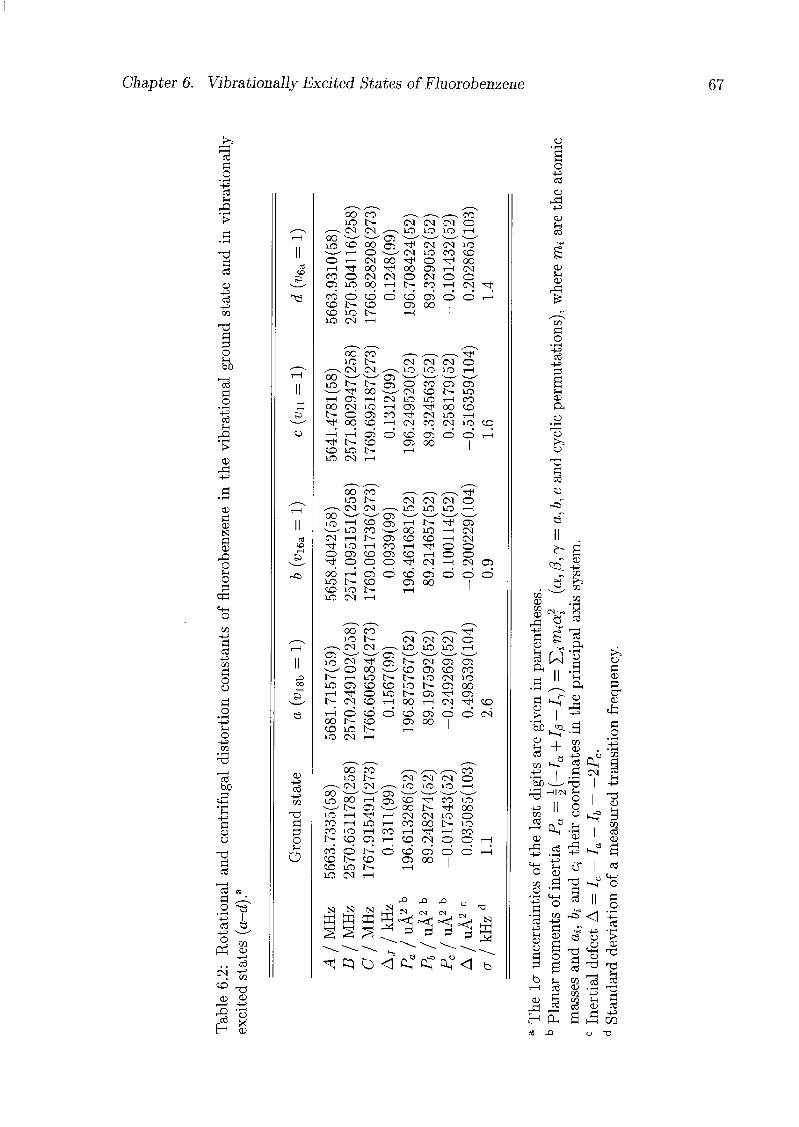
Table
6.2:
Rotationaland
centrifuga
ldistortionconstants
offluorobenzene
inthe
vibrationalground
stateand
invibrationally
excited
states
(a-d).3.
aThe
1eruncertainties
ofthe
last
digits
aregiven
inpa
rent
hese
s.bPlanarmoments
ofinertia
Pa=
\(—Ia+
Iß+1-y)=
Y,irr
iia2
(a,
/?,7=
a,b,cand
cyclic
perm
utat
ions
),wherem,
aretheatomic
massesand
ai:
biandq
theircoordinates
inthepr
inci
pal
axissystem.
cInertialdefectA=
Ic—
Ia—
Ib=—
2PC.
dStandard
deviationofameasured
transitionfr
eque
ncy.
en
cr
93
<rt-
t-i.
o tt
Ground
state
a(visb=
1)b
(«16a=
1)c
(vn=
1)d
(v6à=
1)
A/MHz
5663.7335(58)
5681.7157(59)
5658.4042(58)
5641
.478
1(58
)56
63.9
310(
58)
<rt-°
B/MHz
2570
.651
178(
258)
2570.249102(258)
2571.095151(258)
2571
.802
947(
258)
2570
.504
116(
258)
CL
C/MHz
1767
.915
491(
273)
1766.606584(273)
1769.061736(273)
1769
.695
187(
273)
1766
.828
208(
273)
Co
Co
Aj
/kHz
0.1311(99)
0.1567(99)
0.0939(99)
0.1312(99)
0.12
48(9
9)CO
Pa
1UÂ2
b196.613286(5
2)196.875767(52)
196.461681(52)
196.
2495
20(5
2)19
6.70
8424
(52)
0
Pb
jUÀ2
b89.248274(52
)89.197592(52)
89.214657(52)
89.3
2456
3(52
)89
.329
052(
52)
3Pc
/UÂ2
b-0.017543(52
)-0
.249
269(
52)
0.100114(52)
0.25
8179
(52)
-0.1
0143
2(52
)e 0
A/
uÀ2
c
0.035085(1
03)
0.498539(104)
-0.2
0022
9(10
4)-0
.516
359(
104)
0.20
2865
(103
)0 cr
a/kHz
d1.1
2.6
0.9
1.6
1.4
Ni 2 CD
Oi
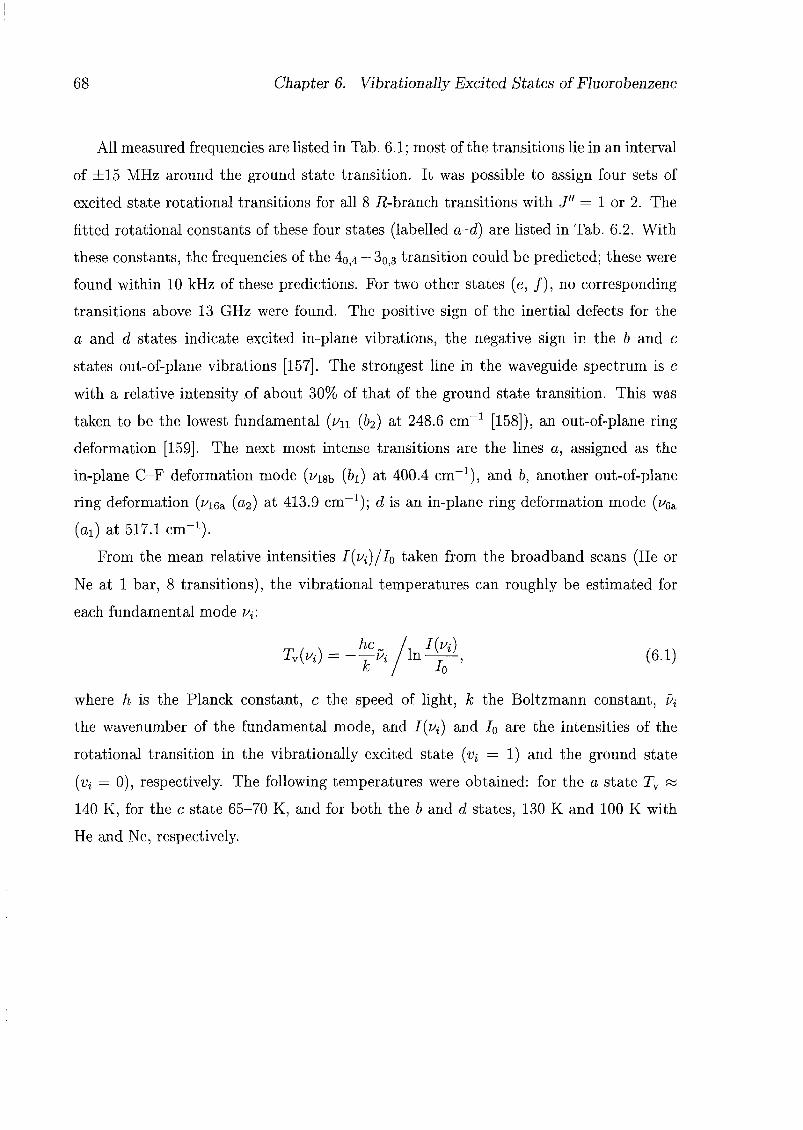
68 Chapter 6. Vibrationally Excited States of Fluorobenzene
All measured frequencies are listed in Tab. 6.1; most of the transitions lie in an interval
of ±15 MHz around the ground state transition. It was possible to assign four sets of
excited state rotational transitions for all 8 iî-branch transitions with J" = 1 or 2. The
fitted rotational constants of these four states (labelled a-d) are listed in Tab. 6.2. With
these constants, the frequencies of the 40]4 — 30,3 transition could be predicted; these were
found within 10 kHz of these predictions. For two other states (e, /), no corresponding
transitions above 13 GHz were found. The positive sign of the inertial defects for the
a and d states indicate excited in-plane vibrations, the negative sign in the b and c
states out-of-plane vibrations [157]. The strongest line in the waveguide spectrum is c
with a relative intensity of about 30% of that of the ground state transition. This was
taken to be the lowest fundamental (un (b2) at 248.6 cm-1 [158]), an out-of-plane ring
deformation [159]. The next most intense transitions are the lines a, assigned as the
in-plane C-F deformation mode (v18b (5i) at 400.4 cm-1), and b, another out-of-plane
ring deformation (uw& (a2) at 413.9 cm-1); d is an in-plane ring deformation mode (u^
(oi) at 517.1 cm"1).
From the mean relative intensities I(ui)/I0 taken from the broadband scans (He or
Ne at 1 bar, 8 transitions), the vibrational temperatures can roughly be estimated for
each fundamental mode U{.
Tv(^) = -y^/An^l, (6.1)
where h is the Planck constant, c the speed of light, k the Boltzmann constant, üi
the wavenumber of the fundamental mode, and I(vi) and I0 are the intensities of the
rotational transition in the vibrationally excited state (vi = 1) and the ground state
(vi = 0), respectively. The following temperatures were obtained: for the a state Tv «
140 K, for the c state 65-70 K, and for both the b and d states, 130 K and 100 K with
He and Ne, respectively.

0.8ms
1.0bar
1.5bar
2.0bar
2.5bar
0.9ms
1.0ms
1.5ms
1.9ms
2.0ms
2.1/2.2ms
2.5ms
11732.111732.2
11732.111732.2
11732.111732.2
11732.111732.2
11732.111732.2
11732.111732.2
11732.111732.2
11732.111732.211732.3
Frequency
/MHz
Figure
6.11:
Lineshape
oftheground
statetransitionat
differentdelaytimes
afterthe
valve
trigger
signal,withargon
as
carrier
gas.The
delay
inthe7th
figure
was
2.1ms
intheexperimentswith
1.0and
1.5barstagnationpressure,and
2.2ms
inthe
others.
•8 CD
'-S S3 cr
>-!
95
e-t-
i~..
O tt 93K-i
1^1.
ct-
CD CL
CO
c+
93
e-t-
CD
CO
O C o 1 o cr
CD tt IS)
CD
tt
CD
Oi
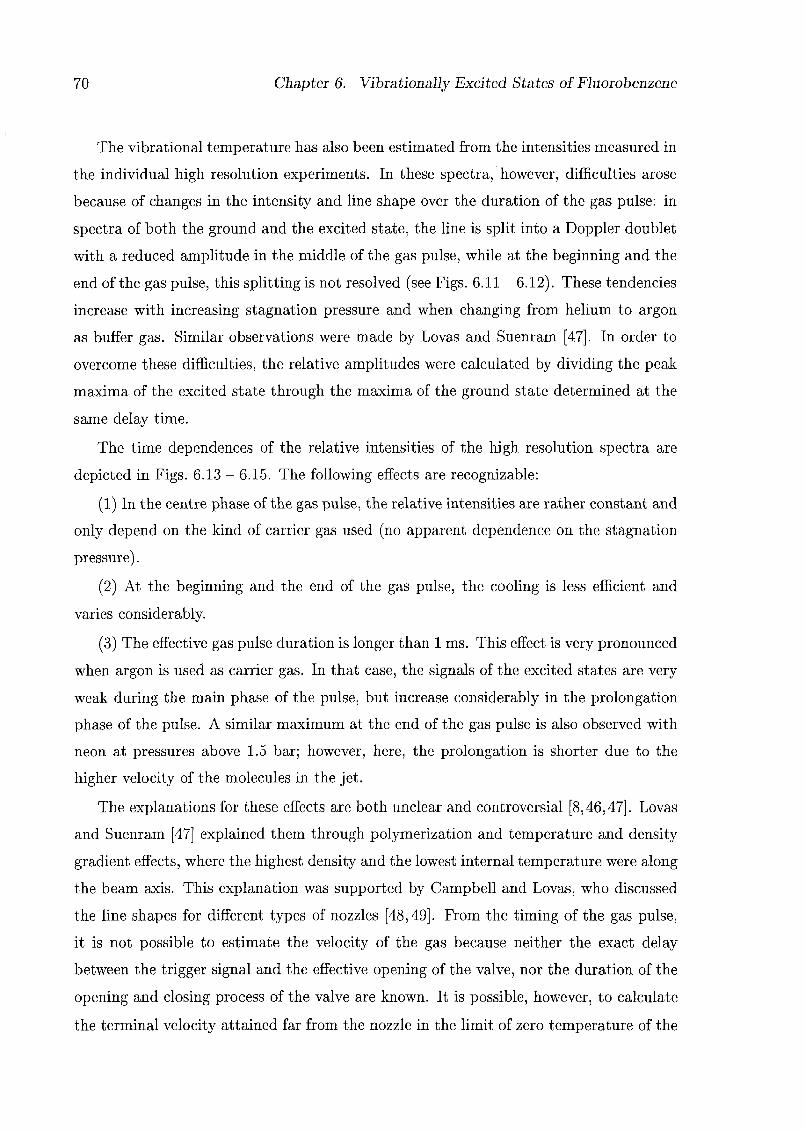
70 Chapter 6. Vibrationally Excited States of Fluorobenzene
The vibrational temperature has also been estimated from the intensities measured in
the individual high resolution experiments. In these spectra, however, difficulties arose
because of changes in the intensity and line shape over the duration of the gas pulse: in
spectra of both the ground and the excited state, the line is split into a Doppler doublet
with a reduced amplitude in the middle of the gas pulse, while at the beginning and the
end of the gas pulse, this splitting is not resolved (see Figs. 6.11 - 6.12). These tendencies
increase with increasing stagnation pressure and when changing from helium to argon
as buffer gas. Similar observations were made by Lovas and Suenram [47]. In order to
overcome these difficulties, the relative amplitudes were calculated by dividing the peak
maxima of the excited state through the maxima of the ground state determined at the
same delay time.
The time dependences of the relative intensities of the high resolution spectra are
depicted in Figs. 6.13 - 6.15. The following effects are recognizable:
(1) In the centre phase of the gas pulse, the relative intensities are rather constant and
only depend on the kind of carrier gas used (no apparent dependence on the stagnation
pressure).
(2) At the beginning and the end of the gas pulse, the cooling is less efficient and
varies considerably.
(3) The effective gas pulse duration is longer than 1 ms. This effect is very pronounced
when argon is used as carrier gas. In that case, the signals of the excited states are very
weak during the main phase of the pulse, but increase considerably in the prolongation
phase of the pulse. A similar maximum at the end of the gas pulse is also observed with
neon at pressures above 1.5 bar; however, here, the prolongation is shorter due to the
higher velocity of the molecules in the jet.
The explanations for these effects are both unclear and controversial [8,46,47]. Lovas
and Suenram [47] explained them through polymerization and temperature and density
gradient effects, where the highest density and the lowest internal temperature were along
the beam axis. This explanation was supported by Campbell and Lovas, who discussed
the line shapes for different types of nozzles [48,49]. From the timing of the gas pulse,
it is not possible to estimate the velocity of the gas because neither the exact delay
between the trigger signal and the effective opening of the valve, nor the duration of the
opening and closing process of the valve are known. It is possible, however, to calculate
the terminal velocity attained far from the nozzle in the limit of zero temperature of the

Chapter 6. Vibrationally Excited States of Fluorobenzene 71
11732.21 MHz 11732.21 MHz 11732.21 MHz
1000
800
600
400
200
i .u uai
KU H c hsr
—
INC 1.0 Dal
-- Ne 2.0 bar
""• — Ne 2.4 bar
$/\ iW\ M
_ ! l\ i
XA
i 1 M
i
ii
.I»
-
Ift
r H! ':»1 l'\f \i
y^ !
800
600
400-
200
0.0 1.0 2.0 3.0 4.0
Time after gas pulse / ms
Ar 1.0 bar
Ar 1.5 bar
Ar2.0bar
Ar 2.5 bar
0.0 1.0 2.0 4.0
Figure 6.12: Time dependence of the maximal amplitude of the ground state transition
with different carrier gases and stagnation pressures. The time scale is the time after the
trigger signal for the opening of the valve.
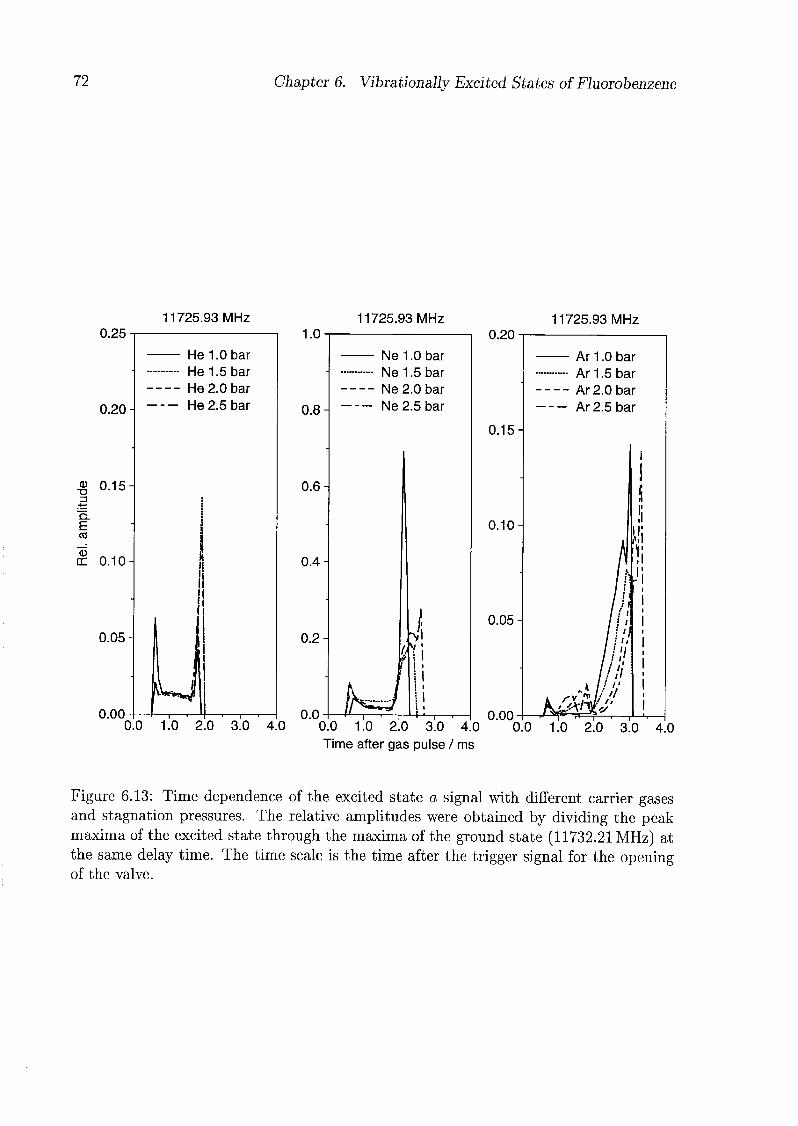
72 Chapter 6. Vibrationally Excited States of Fluorobenzene
11725.93 MHz 11725.93 MHz 11725.93 MHz
0.25
0.20
— He 1.0 bar
•--- He 1.5 bar
-- He 2.0 bar
- He 2.5 bar
T3
Q.
Eco
0.15
0.10
0.05
0.00
0.20
0.15
0.10
0.05
0.0 1.0 2.0 3.0
Time after gas pulse / ms
0.004.0 0
Figure 6.13: Time dependence of the excited state a signal with different carrier gasesand stagnation pressures. The relative amplitudes were obtained by dividing the peakmaxima of the excited state through the maxima of the ground state (11732.21 MHz) at
the same delay time. The time scale is the time after the trigger signal for the openingof the valve.

Chapter 6. Vibrationally Excited States of Fluorobenzene 73
11738.04 MHz 11738.04 MHz
0.08
0.06-
Q.
Eco
05rr
0.04-
0.02
0.00
He 1.0 bar
He 1.5 bar
He 2.0 bar
He 2.5 bar
0 1.0 2.0 3.0 4
0.12
0.10
0.08
0.06
0.04
0.02
0.000 0
Time after gas pulse / ms
Figure 6.14: Time dependence of the excited state b signal with different carrier gasesand stagnation pressures. The relative amplitudes were obtained by dividing the peakmaxima of the excited state through the maxima of the ground state (11732.21 MHz) at
the same delay time. The time scale is the time after the trigger signal for the openingof the valve.
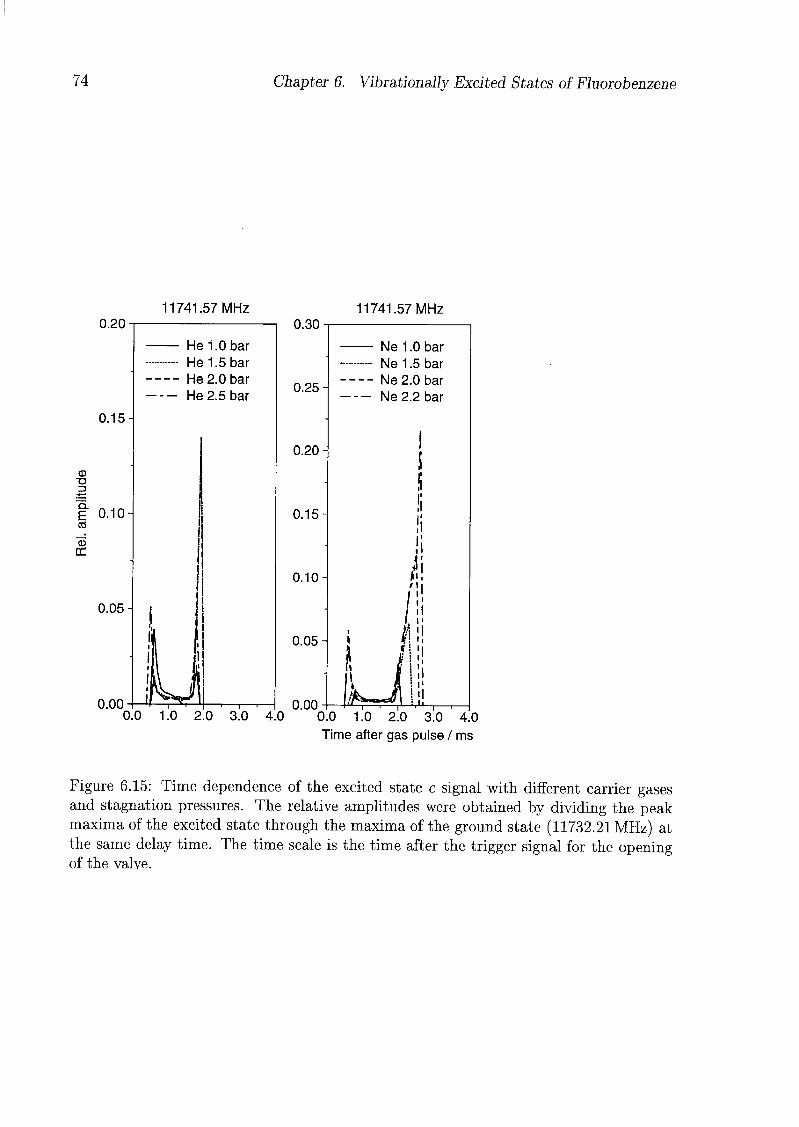
74 Chapter 6. Vibrationally Excited States of Fluorobenzene
11741.57 MHz 11741.57 MHz
— He 1.0 bar
------ He 1.5 bar
-- He 2.0 bar
— He 2.5 bar
0.30
0.25
0.20
0.15
0.10
0.05-
— Ne 1.0 bar
-- Ne 1.5 bar
-- Ne 2.0 bar
- Ne 2.2 bar
0.000 1.0 2.0 3.0 4.0 0.0 1.0 2.0 3.0 4.0
Time after gas pulse / ms
Figure 6.15: Time dependence of the excited state c signal with different carrier gasesand stagnation pressures. The relative amplitudes were obtained by dividing the peakmaxima of the excited state through the maxima of the ground state (11732.21 MHz) at
the same delay time. The time scale is the time after the trigger signal for the openingof the valve.
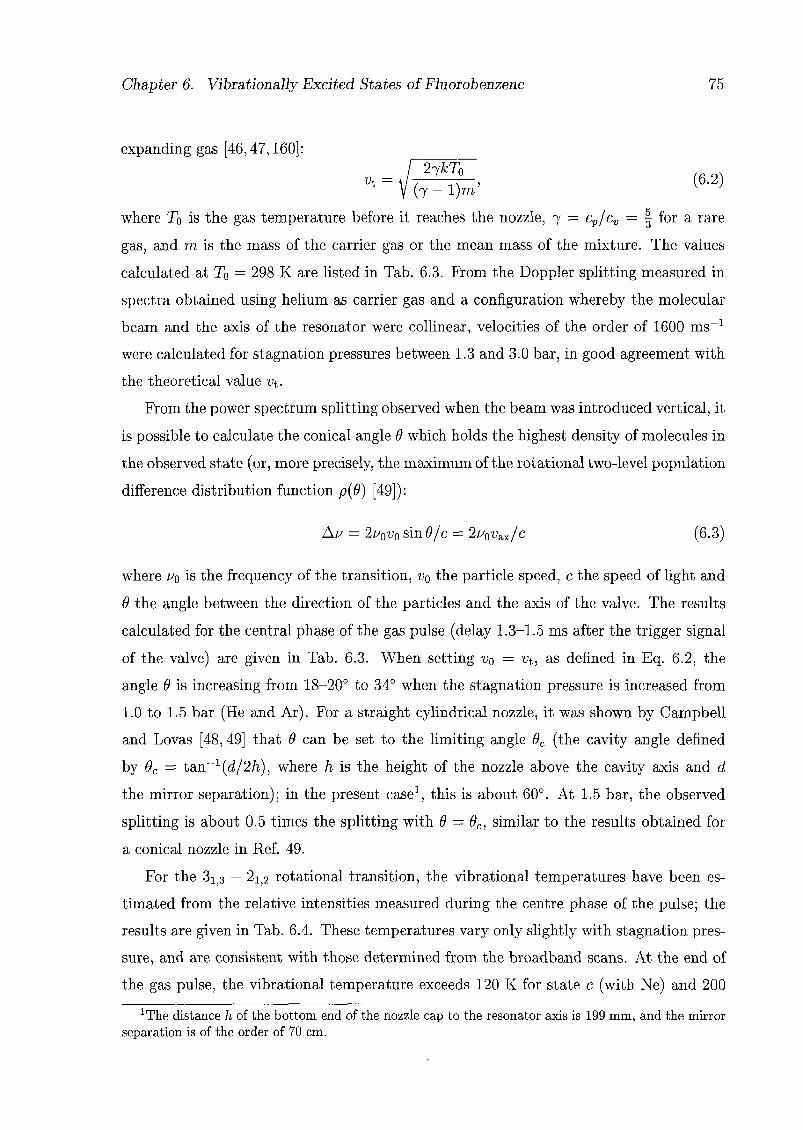
Chapter 6. Vibrationally Excited States of Fluorobenzene 75
expanding gas [46,47,160]:2jkT0
Vi = V (t^Tk (6-2)
where To is the gas temperature before it reaches the nozzle, 7 = cp/cv = | for a rare
gas, and m is the mass of the carrier gas or the mean mass of the mixture. The values
calculated at T0 = 298 K are listed in Tab. 6.3. From the Doppler splitting measured in
spectra obtained using helium as carrier gas and a configuration whereby the molecular
beam and the axis of the resonator were collinear, velocities of the order of 1600 ms-1
were calculated for stagnation pressures between 1.3 and 3.0 bar, in good agreement with
the theoretical value wt.
From the power spectrum splitting observed when the beam was introduced vertical, it
is possible to calculate the conical angle 9 which holds the highest density of molecules in
the observed state (or, more precisely, the maximum of the rotational two-level population
difference distribution function p(9) [49]):
Au = 2u0v0 sinö/c = 2u0vax/c (6-3)
where u0 is the frequency of the transition, v0 the particle speed, c the speed of light and
9 the angle between the direction of the particles and the axis of the valve. The results
calculated for the central phase of the gas pulse (delay 1.3-1.5 ms after the trigger signal
of the valve) are given in Tab. 6.3. When setting v0 = vt, as defined in Eq. 6.2, the
angle 9 is increasing from 18-20° to 34° when the stagnation pressure is increased from
1.0 to 1.5 bar (He and Ar). For a straight cylindrical nozzle, it was shown by Campbell
and Lovas [48, 49] that 9 can be set to the limiting angle 9C (the cavity angle defined
by 9C = tan_1((i/2/i), where h is the height of the nozzle above the cavity axis and d
the mirror separation); in the present case1, this is about 60°. At 1.5 bar, the observed
splitting is about 0.5 times the splitting with 9 = 9C, similar to the results obtained for
a conical nozzle in Ref. 49.
For the 3i]3 — 21>2 rotational transition, the vibrational temperatures have been es¬
timated from the relative intensities measured during the centre phase of the pulse; the
results are given in Tab. 6.4. These temperatures vary only slightly with stagnation pres¬
sure, and are consistent with those determined from the broadband scans. At the end of
the gas pulse, the vibrational temperature exceeds 120 K for state c (with Ne) and 200
^he distance h of the bottom end of the nozzle cap to the resonator axis is 199 mm, and the mirror
separation is of the order of 70 cm.
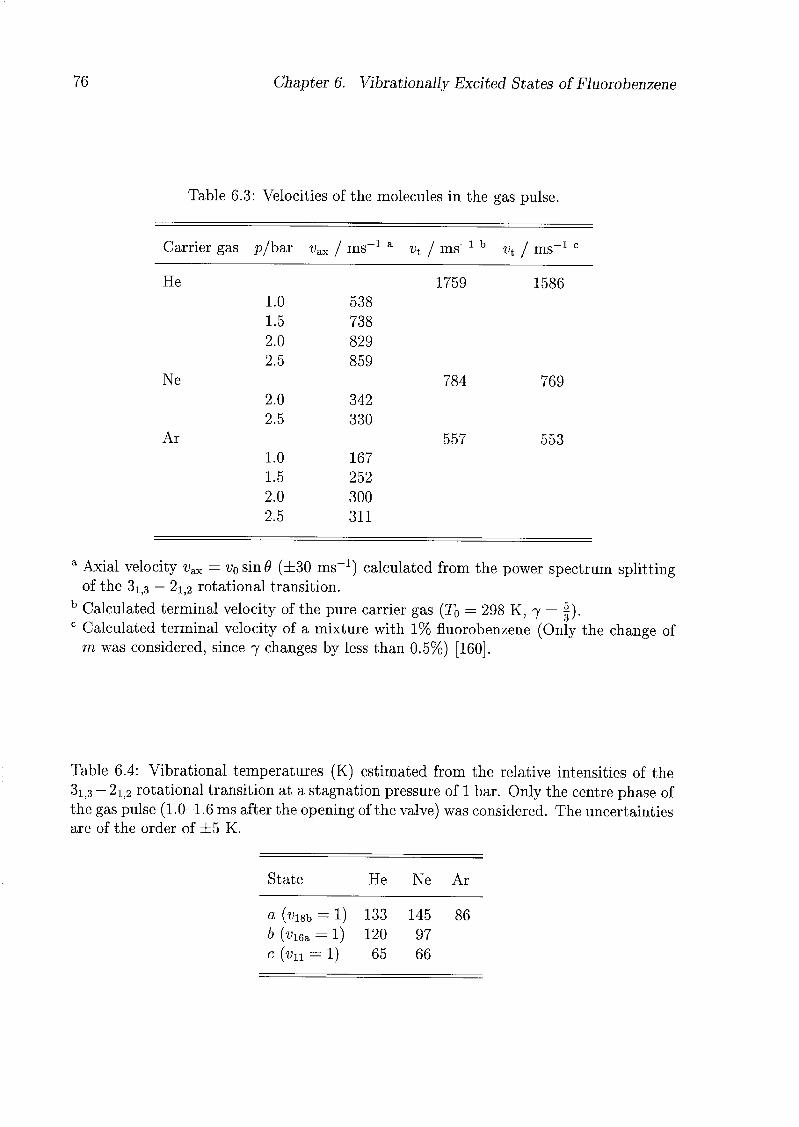
76 Chapter 6. Vibrationally Excited States of Fluorobenzene
Table 6.3: Velocities of the molecules in the gas pulse.
Carrier gas p/bar wax / ms 1 a
vt / ms 1 bvt / ms
He 1759 1586
1 c
Ne 784 769
1.0 538
1.5 738
2.0 829
2.5 859
2.0 342
2.5 330
1.0 167
1.5 252
2.0 300
2.5 311
Ar 557 553
a Axial velocity ^ax = v0sm9 (±30 ms x) calculated from the power spectrum splittingof the 31,3 — 2i)2 rotational transition.
b Calculated terminal velocity of the pure carrier gas (T0 = 298 K, 7 = |).c Calculated terminal velocity of a mixture with 1% fluorobenzene (Only the change of
m was considered, since 7 changes by less than 0.5%) [160].
Table 6.4: Vibrational temperatures (K) estimated from the relative intensities of the
3i,3 — 21;2 rotational transition at a stagnation pressure of 1 bar. Only the centre phase of
the gas pulse (1.0-1.6 ms after the opening of the valve) was considered. The uncertainties
are of the order of ±5 K.
State He Ne Ar
a (fi8b := 1) 133 145 86
b (vi6a == 1) 120 97
c (vh == 1) 65 66
Chapter 6. Vibrationally Excited States of Fluorobenzene 77
K for states a (with Ne and Ar) and b (with Ne). Such "warm beam conditions" at the
beginning and the end of the gas pulse were also mentioned in Ref. 47).
These temperatures are much higher than those estimated from measurements of the
rotational spectra of Ar-HCl in excited states of the Van der Waals modes done using
a nozzle at ambient temperature and 1 atm argon or 1.5 atm helium or neon as carrier
gas [161]: for the E bend (24 cm-1), 5.3 K in Ar and 6.9 K in He, and for the S stretch
(32 cm-1) 8.6 K were determined, while a rotational temperature of 3 K was estimated.
This case shows the much more efficient cooling of low frequency modes.
For comparison, the time dependence of the signal due to the fluorobenzene-Ar Van
der Waals complex [89] has also been measured. Here, the relative intensity reaches its
maximum in the centre phase of the gas pulse, when the cooling and the formation of
complexes are very efficient (Fig. 6.16).
When nitrogen is used as carrier gas, the excited states are almost completely cooled
out, even at 1 bar stagnation pressure. Thus, the vibrational cooling is seen to increase
in the order He « Ne < Ar < N2. This is in agreement with the results obtained
by McClelland et al. in a study of I2 [155], where they have found higher vibrational
cooling efficiencies for diatomic and many polyatomic molecules than for rare gases.
For rotational cooling, rare gases (except helium) cool more efficiently than diatomic
or polyatomic molecules; Lorenzo et al. proposed methane as carrier gas for observing
higher rotational energy levels in molecular beam microwave spectroscopy [162].
Since the vibrational cooling in the expansion is not very efficient, excited states may
be favoured by increasing their populations before the expansion. This may be achieved
by using a heated inlet system (Harmony et al. could observe rotational transitions of
OCS in states up to 4101 cm-1 when a nozzle heated up to 1120°C was used [50], and
Welzel and Stahl observed vibrationally excited states of benzothiophene using helium
as carrier gas and a nozzle heated up to 180°C [163]) or by using an electric discharge in
the nozzle (where vibrational temperatures of more than 270 K and low J transitions in
vibrational states up to 6000 cm-1 can be observed [164]). With both of these techniques,
in contrast to the vibrational temperatures, the rotational temperatures of the molecules
in the jet are seen to remain very low.

78 Chapter 6. Vibrationally Excited States of Fluorobenzene
13019.03 MHz
0.20
0.16
cu 0.12
"5.ECO
©0= 0.08
0.04
0.00
r\\ \ .u oar
Ar h c har
Ar 2.0 bar
Ar 2.5 bar
-
Ü,1
-
).0 1.0 2.0 3.0 4.
Time after gas pulse / ms
Figure 6.16: Time dependence of the fluorobenzene-Ar Van der Waals complex signal
with different stagnation pressures. The relative amplitudes were obtained by dividing
the peak maxima of the complex through the maxima of the ground state signal of the
monomer (13015.68 MHz) at the same delay time. The time scale is the time after the
trigger signal for the opening of the valve.
Chapter 7
The Argon—Chlorine Dioxide Van
der Waals Complex
7.1 Introduction
Due to its very high resolution, microwave spectroscopy is a very sensitive method, not
only for the investigation of molecular geometries, but also for the elucidation of infor¬
mation about electronic structures through the analysis of the hyperfine structure. In
an open-shell Van der Waals complex, it is possible to study a possible perturbation of
the electronic structure of the radical upon complexation, or to study how the unpaired
electron delocalizcs within the complex. But because of the complexity of their rota¬
tional spectra, only very few open-shell Van der Waals complexes have been studied by
microwave spectroscopy, namely Ar-NO [145,165], Ar-OH [166,167], Ar-N02 [147,148],
and Xe-N02 [151].
Chlorine dioxide, OCIO, is one of few simple radicals that are quite stable at room
temperature. Because it plays an important role in atmospheric chemistry [168], OCIO
has been subject of many spectroscopic and photochemical studies; most of these studies
concern the A 2A2 — X 2Bi system and the photo- and predissociation of the Ä 2A2
electronic state [169-180]. The photochemistry of OCIO has also been studied in con¬
densed phase [181], in clusters [173,182,183], in ice [184], and in solution (Ref. 185 and
references therein). The rotational spectrum of OCIO was first measured and analysed in
detail by Curl et al. [28,186-190]. The rotational spectra in the ground and vibrationally
excited states were later reinvestigated by microwave, millimeter and infrared-microwave
double-resonance spectroscopy [191-195]. These measurements, together with recent in¬
frared measurements [196-199], yielded an accurate equilibrium structure of OCIO [200].
79

80 Chapter 7. Argon-Chlorine Dioxide
Properties of the dimer of OCIO have been calculated in a photochemical study of
OCIO aggregates [173], but, up to now, no high resolution study of complexes with OCIO
has been published.
In this chapter, first results of an investigation of the microwave spectrum of the
open-shell complex argon-chlorine dioxide are presented.
7.2 Experimental Details
Caution! Because chlorine dioxide is potentially explosive, especially in the presence
of organic material, it should be handled with proper safety precautions, particularly
maintaining a partial pressure below 50 mbar. In order to avoid decomposition, chlorine
dioxide should be prevented from exposure to light.
C102 was synthesized from KC103, oxalic acid, and diluted sulfuric acid [201].
A mixture of about 171 mg KCIO3, 141 mg C2H204-2H20, and 157 mg H2S04 diluted in
580 mg H20 is heated up slowly to about 75°C under a constant flow of nitrogen. The produced
C102 (and C02) are led through a drying tube filled with P4O10 and condensed in a trap cooled
to —90°C. The reaction can be easily followed due to the colour of C102 (green gas, red-brown
liquid, yellow-orange solid). The C02 can be removed by pumping at —90°C. Yield 55-60%.
C102 diluted in Ar can be stored for several days in a 1 1 stainless steel bottle (SS316), where
it is protected from light.
The Ar-C102 complex was formed in a supersonic expansion of C102 entrained in
argon at a stagnation pressure of about 1 bar into the cavity through a pulsed valve
equipped with a cylindrical nozzle cap. The microwave spectrum was measured in the
frequency range 5-24 GHz using a FTMW spectrometer equipped with Helmholtz coils
in order to compensate the earth's magnetic field. By selective operation of these coils,
a magnetic field of up to 2 G in the vertical direction (parallel to the electric field of
the microwave radiation) was applied; the resulting Zeeman effect with the selection rule
AMp = 0 was used to identify the smaller F value of the states involved in the transitions
(Fig. 7.1). For all measurements, the vertical arrangement of the molecular beam was
used (i.e. perpendicular to the Fabry-Pérot resonator axis). For broadband scans, twelve
microwave pulses were applied to each gas pulse, and 512 channels were used to store the
polarization decays. Because the lines are anyhow broadened by the residual magnetic
field, changes in the intensity and line shape over the duration of the gas pulse (see Chap.
6) do not affect any further the accuracy of the frequency determination, and up to six
microwave pulses were applied to one gas pulse (1 ms duration) for accurate frequency
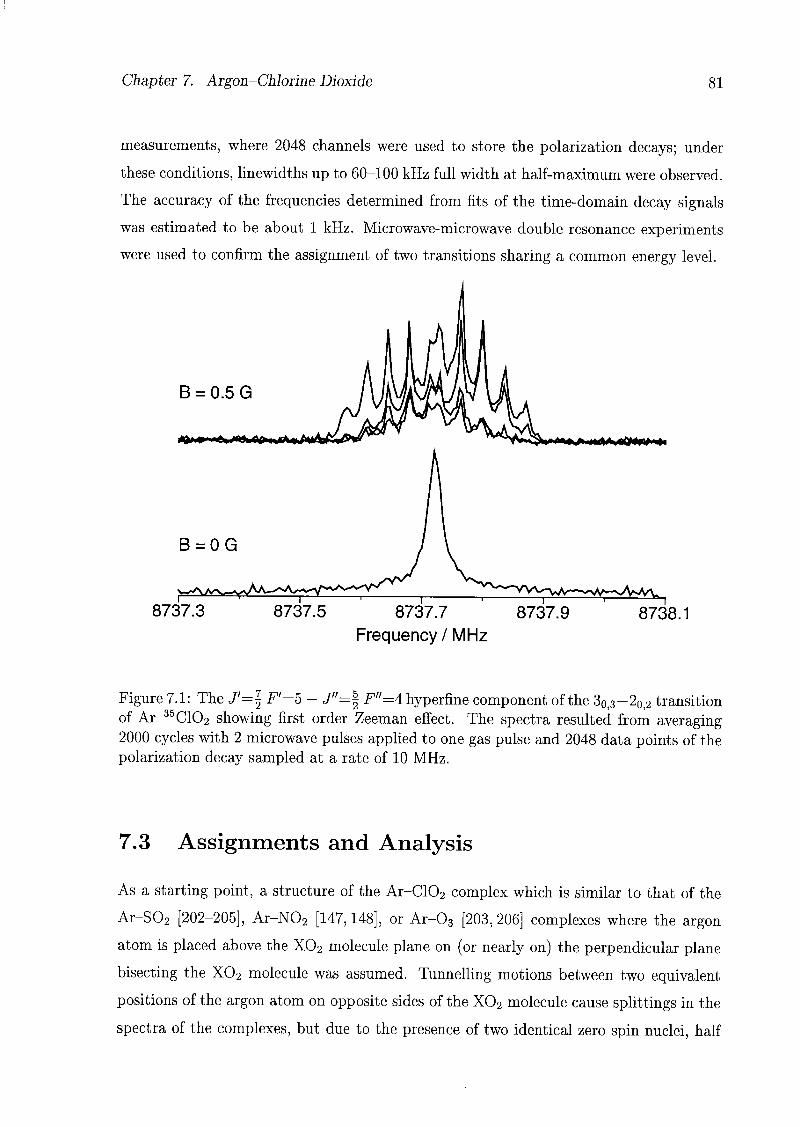
Chapter 7. Argon-Chlorine Dioxide 81
measurements, where 2048 channels were used to store the polarization decays; under
these conditions, linewidths up to 60-100 kHz full width at half-maximum were observed.
The accuracy of the frequencies determined from fits of the time-domain decay signals
was estimated to be about 1 kHz. Microwave-microwave double resonance experiments
were used to confirm the assignment of two transitions sharing a common energy level.
B = 0.5 G
<fri»"»6w«*ii<iV»i»rt»,ft»
B = 0G
8737.3 8737.5 8737.7
Frequency/MHz
8737.9 8738.1
Figure 7.1: The J'=| F'=5 </"=§ F"=A hyperfine component of the 3q,3—20,2 transition
of Ar-35C102 showing first order Zeeman effect. The spectra resulted from averaging2000 cycles with 2 microwave pulses applied to one gas pulse and 2048 data points of the
polarization decay sampled at a rate of 10 MHz.
7.3 Assignments and Analysis
As a starting point, a structure of the Ar-C102 complex which is similar to that of the
Ar-S02 [202-205], Ar-N02 [147,148], or Ar-03 [203,206] complexes where the argon
atom is placed above the X02 molecule plane on (or nearly on) the perpendicular plane
bisecting the X02 molecule was assumed. Tunnelling motions between two equivalent
positions of the argon atom on opposite sides of the X02 molecule cause splittings in the
spectra of the complexes, but due to the presence of two identical zero spin nuclei, half
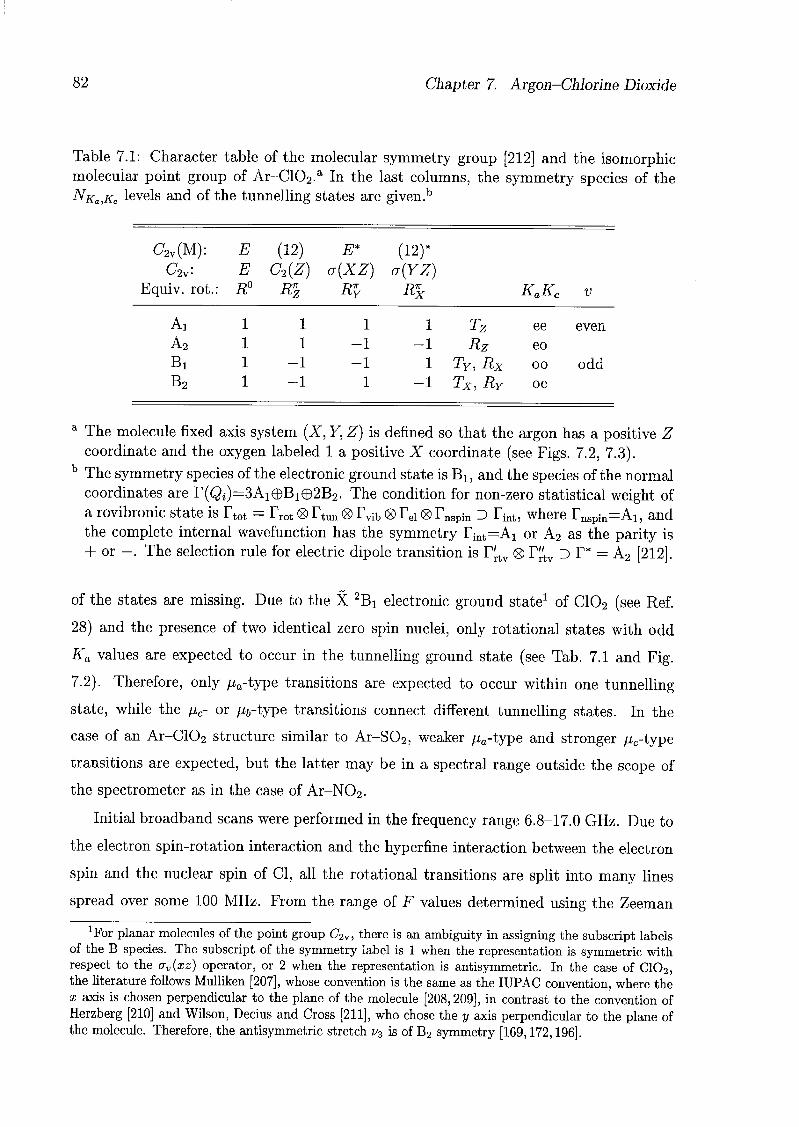
82 Chapter 7. Argon-Chlorine Dioxide
Table 7.1: Character table of the molecular symmetry group [212] and the isomorphicmolecular point group of Ar-C102.a In the last columns, the symmetry species of the
Nko.,Kc levels and of the tunnelling states are given.b
C2v(M): E (12) E* (12)*G2v- E C2(Z) o(XZ) o(YZ)
Equiv. rot.: Äu Kzr?7Tity Kx KaKc v
Ax 11 1 1 Tz ee even
A2 11-1 -1 Rz eo
Bx 1-1-1 1 TY, Rx oo odd
B2 1 -1 1 -1 Tx, RY oe
a The molecule fixed axis system (X, Y, Z) is defined so that the argon has a positive Zcoordinate and the oxygen labeled 1 a positive X coordinate (see Figs. 7.2, 7.3).
b The symmetry species of the electronic ground state is B^ and the species of the normal
coordinates are r(Qi)=3Ai©Bi©2B2. The condition for non-zero statistical weight of
a rovibronic state is rtot = rrot ® rtun <g> rvib <S> rd ® rnspin D Tint, where rnspin=Ai, and
the complete internal wavefunction has the symmetry r^t^Ai or A2 as the parity is
+ or —. The selection rule for electric dipole transition is F'Itv (g) T"tv D T* = A2 [212].
of the states are missing. Due to the X 2Bi electronic ground state1 of C102 (see Ref.
28) and the presence of two identical zero spin nuclei, only rotational states with odd
Ka values are expected to occur in the tunnelling ground state (see Tab. 7.1 and Fig.
7.2). Therefore, only pa-type transitions are expected to occur within one tunnelling
state, while the pc- or p,b-type transitions connect different tunnelling states. In the
case of an Ar-C102 structure similar to Ar-S02, weaker //„-type and stronger pc-type
transitions are expected, but the latter may be in a spectral range outside the scope of
the spectrometer as in the case of Ar-N02.
Initial broadband scans were performed in the frequency range 6.8-17.0 GHz. Due to
the electron spin-rotation interaction and the hyperfine interaction between the electron
spin and the nuclear spin of CI, all the rotational transitions are split into many lines
spread over some 100 MHz. From the range of F values determined using the Zeeman
1For planar molecules of the point group CW» there is an ambiguity in assigning the subscript labels
of the B species. The subscript of the symmetry label is 1 when the representation is symmetric with
respect to the av(xz) operator, or 2 when the representation is antisymmetric. In the case of CIO2,the literature follows Mulliken [207], whose convention is the same as the IUPAC convention, where the
x axis is chosen perpendicular to the plane of the molecule [208,209], in contrast to the convention of
Herzberg [210] and Wilson, Decius and Cross [211], who chose the y axis perpendicular to the plane of
the molecule. Therefore, the antisymmetric stretch vz is of B2 symmetry [169,172,196].
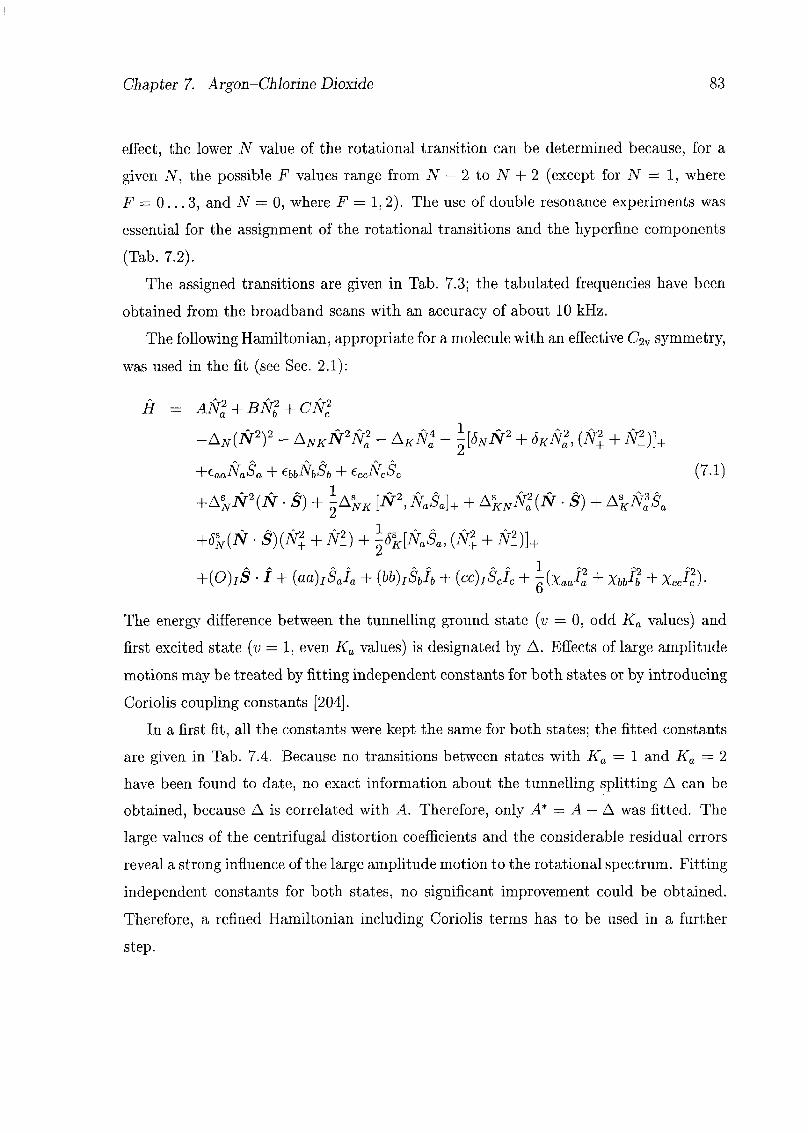
Chapter 7. Argon-Chlorine Dioxide 83
effect, the lower N value of the rotational transition can be determined because, for a
given JV, the possible F values range from N — 2 to N + 2 (except for JV = 1, where
F = 0... 3, and N = 0, where F = 1,2). The use of double resonance experiments was
essential for the assignment of the rotational transitions and the hyperfine components
(Tab. 7.2).
The assigned transitions are given in Tab. 7.3; the tabulated frequencies have been
obtained from the broadband scans with an accuracy of about 10 kHz.
The following Hamiltonian, appropriate for a molecule with an effective C2v symmetry,
was used in the fit (see Sec. 2.1):
H = AN2 + BN^ + CN2
-AN(N2)2 - ANKN2N2 - AKN4a - ±{6NN2 + SKN2, (N2+ + N2_)]+
+eaaNaSa + ebbNbSb + eccNcSc (7.1)
+A^iV2(iV • S) + ^A*NK [N2,NaSa]+ + A°KNN2a(N S) + AsKN3aSa
+ÖSN(N S)(N2+ + N2) + lssK[NaSa, (N2+ + N2)}+
+(0)jS î + (aa)ISaîa + [bb^Sbh + {cc)Ah + \{xaJl + XbJl + xJc)-
The energy difference between the tunnelling ground state (v = 0, odd Ka values) and
first excited state (v = 1, even Ka values) is designated by A. Effects of large amplitude
motions may be treated by fitting independent constants for both states or by introducing
Coriolis coupling constants [204].
In a first fit, all the constants were kept the same for both states; the fitted constants
are given in Tab. 7.4. Because no transitions between states with Ka — 1 and Ka = 2
have been found to date, no exact information about the tunnelling splitting A can be
obtained, because A is correlated with A. Therefore, only A* = A — A was fitted. The
large values of the centrifugal distortion coefficients and the considerable residual errors
reveal a strong influence of the large amplitude motion to the rotational spectrum. Fitting
independent constants for both states, no significant improvement could be obtained.
Therefore, a refined Hamiltonian including Coriolis terms has to be used in a further
step.
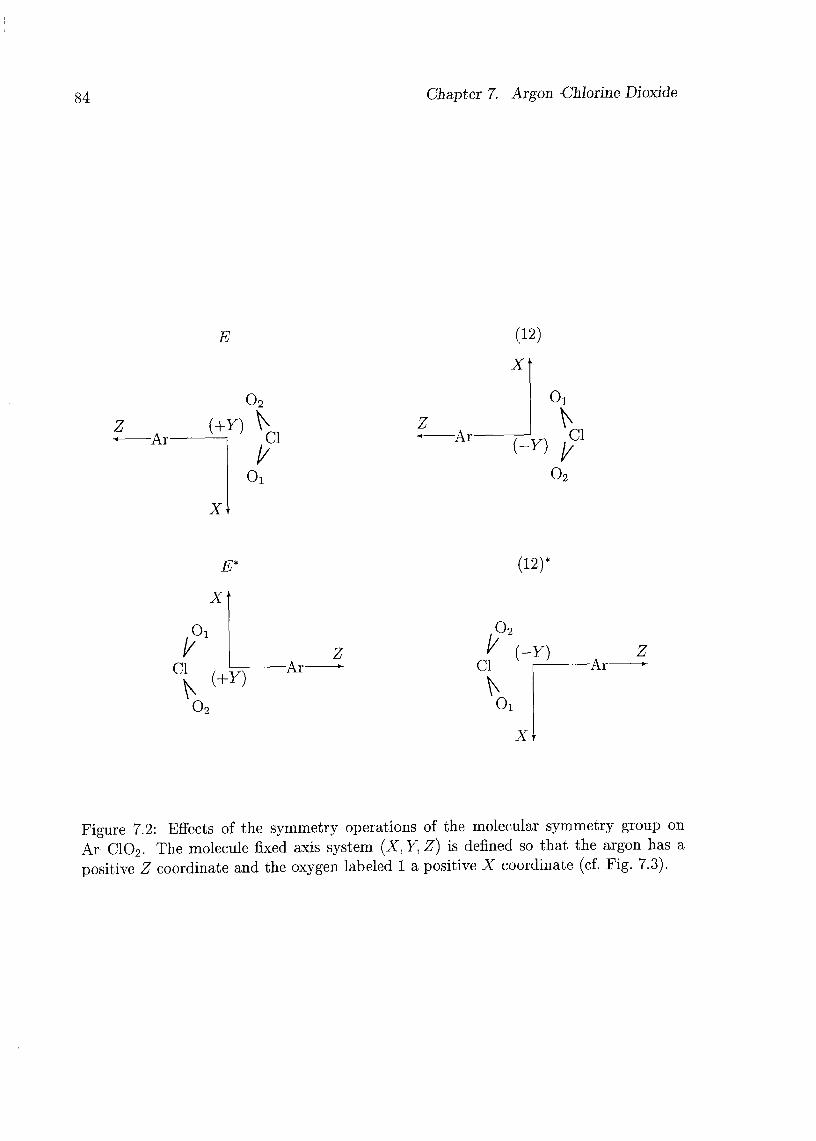
84 Chapter 7. Argon-Chlorine Dioxide
-Ar-
E
O,
(+y) V
1/
x
Cl
Ox
-Ar-
(12)
X\
Oi
o2
Cl
Art
VOi
Cl
V(+y)
-Ar-Z
0,
(12)*
02
Cl
\x
y)
Oi
X
-Ar-
Figure 7.2: Effects of the symmetry operations of the molecular symmetry group on
Ar-C102. The molecule fixed axis system (X,Y,Z) is defined so that the argon has a
positive Z coordinate and the oxygen labeled 1 a positive X coordinate (cf. Fig. 7.3).
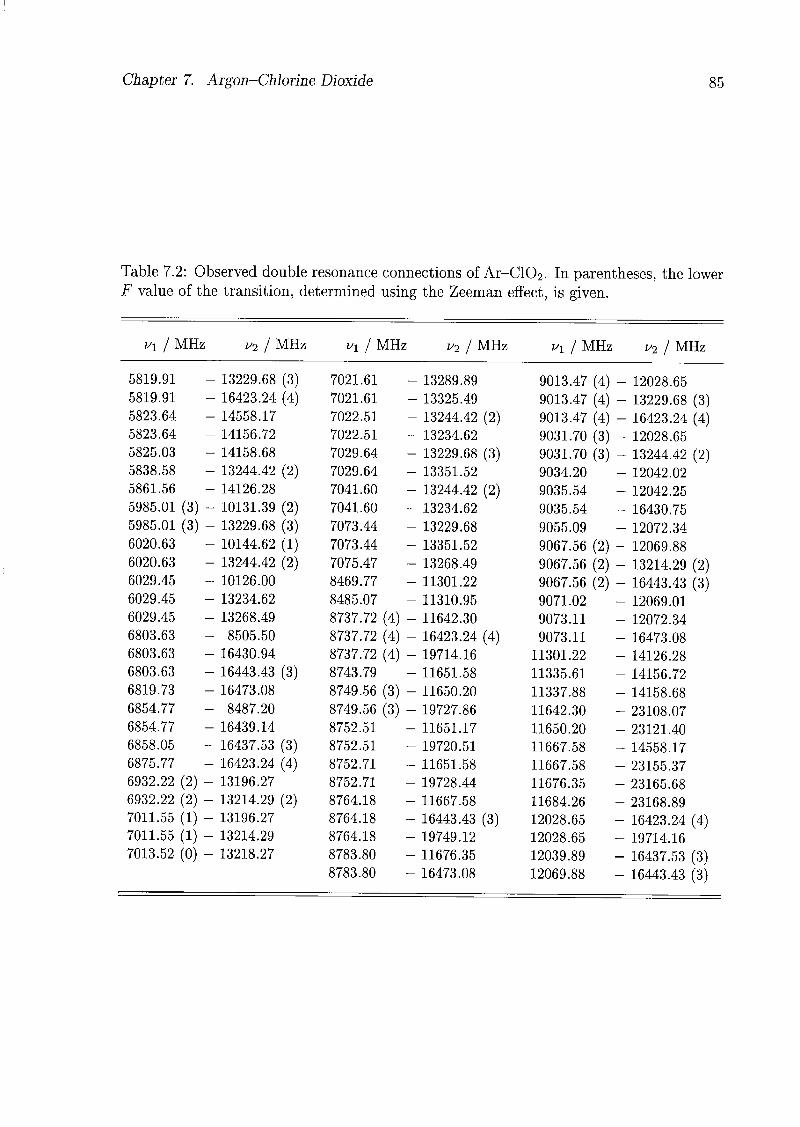
Chapter 7. Argon-Chlorine Dioxide 85
Table 7.2: Observed double resonance connections of Ar-C102. In parentheses, the lower
F value of the transition, determined using the Zeeman effect, is given.
vi j MHz v2 j MHz vi j MHz u2 j MHz vi j MHz v2 j MHz
5819.91 - 13229.68 (3) 7021.61 - 13289.89 9013.47 (4) - 12028.65
5819.91 - 16423.24 (4) 7021.61 - 13325.49 9013.47 (4) - 13229.68 (3)5823.64 - 14558.17 7022.51 - 13244.42 (2) 9013.47 (4) - 16423.24 (4)5823.64 - 14156.72 7022.51 - 13234.62 9031.70 (3) - 12028.65
5825.03 - 14158.68 7029.64 - 13229.68 (3) 9031.70 (3) - 13244.42 (2)5838.58 - 13244.42 (2) 7029.64 - 13351.52 9034.20 - 12042.02
5861.56 - 14126.28 7041.60 - 13244.42 (2) 9035.54 - 12042.25
5985.01 (3) - 10131.39 (2) 7041.60 - 13234.62 9035.54 - 16430.75
5985.01 (3) - 13229.68 (3) 7073.44 - 13229.68 9055.09 - 12072.34
6020.63 - 10144.62 (1) 7073.44 - 13351.52 9067.56 (2) - 12069.88
6020.63 - 13244.42 (2) 7075.47 - 13268.49 9067.56 (2) - 13214.29 (2)6029.45 - 10126.00 8469.77 - 11301.22 9067.56 (2) - 16443.43 (3)6029.45 - 13234.62 8485.07 - 11310.95 9071.02 - 12069.01
6029.45 - 13268.49 8737.72 (4) - 11642.30 9073.11 - 12072.34
6803.63 - 8505.50 8737.72 (4) - 16423.24 (4) 9073.11 - 16473.08
6803.63 - 16430.94 8737.72 (4) - 19714.16 11301.22 - 14126.28
6803.63 - 16443.43 (3) 8743.79 - 11651.58 11335.61 - 14156.72
6819.73 - 16473.08 8749.56 (3) - 11650.20 11337.88 - 14158.68
6854.77 - 8487.20 8749.56 (3) - 19727.86 11642.30 - 23108.07
6854.77 - 16439.14 8752.51 - 11651.17 11650.20 - 23121.40
6858.05 - 16437.53 (3) 8752.51 - 19720.51 11667.58 - 14558.17
6875.77 - 16423.24 (4) 8752.71 - 11651.58 11667.58 - 23155.37
6932.22 (2) - 13196.27 8752.71 - 19728.44 11676.35 - 23165.68
6932.22 (2) - 13214.29 (2) 8764.18 - 11667.58 11684.26 - 23168.89
7011.55 (1) - 13196.27 8764.18 - 16443.43 (3) 12028.65 - 16423.24 (4)7011.55 (1) - 13214.29 8764.18 - 19749.12 12028.65 - 19714.16
7013.52 (0) - 13218.27 8783.80
8783.80
- 11676.35
- 16473.08
12039.89
12069.88
- 16437.53 (3)- 16443.43 (3)

W
I
CO
4^
o
1
h-1 1
1
co
1
CO
CO
to
co
to
o
CO
"co to
Ts3
to
to
WUl^^^^^^UUO:^|i|^^^^UUl|i^^3^3^3UO:UUM^3UWUUUMUUWWMMWI^3IO
cncncjiorcnc^cbicbicncnüicncn
II
II
II
II
II
II
II
II
II
II
II
II
II
II
II
II
II
II
II
II
I
CnCTiCnorcnOiCncncncncnCncnCnCncnCnCnC^
^CnCo^cnaiCO^Cn^Coenai^enC^OTCO^COtOW
II
II
II
II
II
II
II
II
II
II
II
II
!I
II
II
II
II
II
II
II
I
Ul|\|^3CO^Ü^^3U^WM^^O^U^^Ült^3WœHI^5U^^^3œWMHU^WM|OW^^M^OWtOO:
to
to
to
to
to
to
Oo
oooo
-a
Oi
|_1
I1.
I1
IL
(L
(__!.
11.
11
I1.
I1
Ik
i—'i—>
i—'
i—'
i—'i—>i—i
i—'
i—»
i—'i—'(DtocûtD^tDtûoooooooooooDOoooooooooœoiœoioiai
c^c^o^c^aiaiOTOJCococooooc^ocoo^^^^^^^cn^rf^^Hi^coocooooo
I'
II
A'
vJWJ
*_JJ
WJ
WJ
UJJ
WJ
WJ
V-*J
v«^
«**^
OOOOOO
_<t
Oi
cn
co
co
co
H03S
OlW
JlM
foçDtofopoo^cns
wooMboob)MwbibiHis3wbob)biot-'üibüiios^oo
^UOÜi(0(0010)ÜiOOOOSOOMl-1Üi(OIJ01(Di^OOSO
,~j
-a
-a
-<i
~a
-
GO
Oi^
Ol
ÜlA
CO
coco4xcototoco~j
H-
cn
-<i
Cn
-3
OO
Ol
CO
Cna^rf^^hl^OO
_.-
OOOOOCCCltOtOOOCO
cn~J^üimtDOOiOo(D
k-
Ol
cn
co
Cn
OO
oto
too
-a
O-q
-J
Cn
CO
00
h^
C0C=3OOOOOC3OOOC3OOOOOOOOOOOOH-'t0OOOOOOOOOOOOOOO
COO
CO
cnoooto4^oo^^eo
-acocncocohj^-acoco
Cn
l—»
co
oo
Oh-1
Oio
—J^
CnO
>—'l—'t—'OOOUHMMOIOloo
i—1
toO
to
-a
to
h^
oo
co
ai
h-1
en^^
i4^
ai
M̂ Si I
SEL
OO
Ol
ffiS
tSl
CD
-a
c?Ço
r+ 1o
8a-
»S
CD^
5=+
<1
i-s
2S5
P_y
s»
2.
per
.P-o
o»
PH>
i—'
»-i
O05
Phû uen
late p-
2.
h-K
fD
t^
GO
2cF
0cr
CD
<B
P^
g"^
SK SI
Qv—'
fcr
O«
>M- 3
1 co
NOI
Q f—'
^O
r£
to
00,
3S
H-"
| Q b-
p-
!->.
h-<
O
CD
a.
05
CD
P Ob
CDCD
al
> ^CD
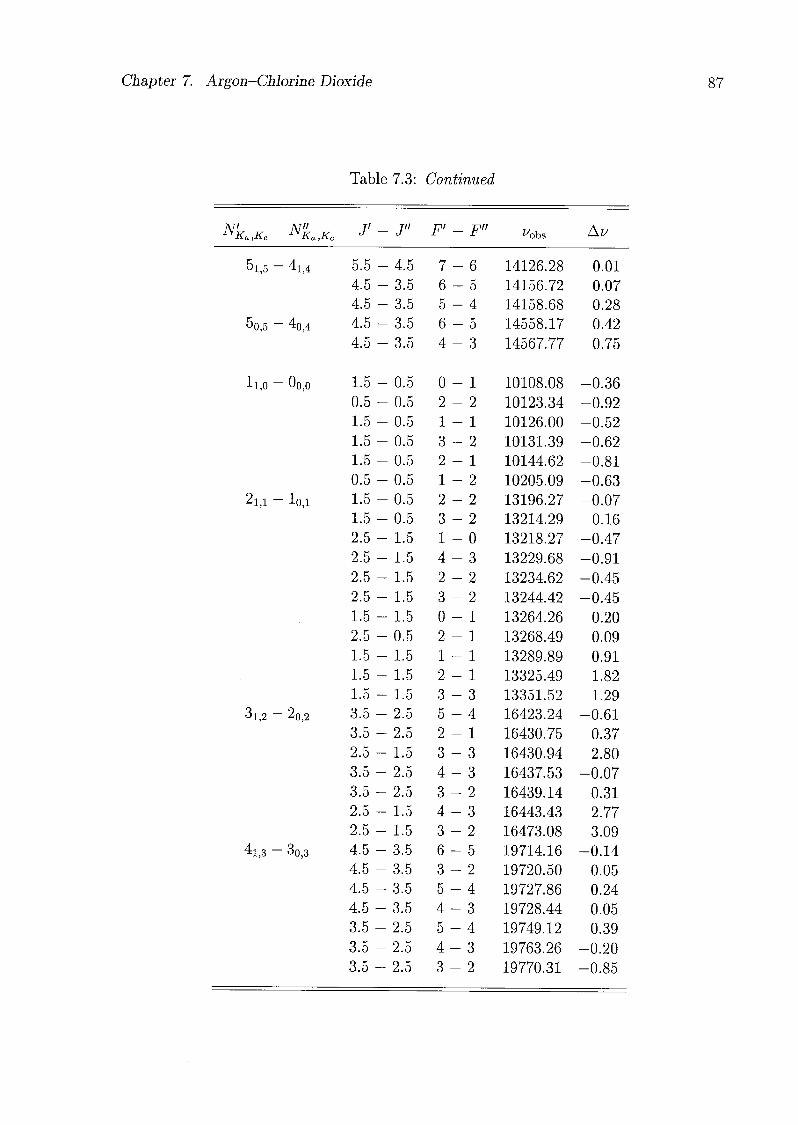
co^cn^encoaicot^-co^cotocncoto
II
II
II
II
II
II
II
II
tOCO^CO^tOCntOCOtOCOCOl—'^COI—'
tO
CO
CO
tO
tfx
II
II
I
I—>
I—'
tO
tO
CO
COtOI—'
tO
CO1—'toco
11
11
11
11
iJi
Ol
Ül
OlS
11
11
11
11
11
11
1
tOtOtOh-'M
h'tOI—'
lilt
CO
cn
£>.
en
Oï
^
CD S ^
.
S ES
Co
(D!0(DtÛ!ÛCD!û01C»CRC»05ai(5)«WWWWWUW03WW
-<|-----
"
Oen
4^
to
to
toi—'-arf^cocococotocntoooaiaihj^cotoi—»
i—'
co
ooooo
h-'
h-'
I—'
h-»
H-»
^co
to
too
u(û(»so^ajcû(osoowMoicDooifi.^i^tûooiii.c)ui^Haiuoo
WMH*i.OOÜlHO*>.HÜlCOSWWi|i.OO^tOA05aiMMI>00
HOito^oioajoowi^w^cni^isîcDtDcûaitoboGoKitDsco
Oi
co
to
COo o
coo
4^
OO
^^
£x
ji.
a^
en
cn
i—'
i—'
i—'
ai
en
en
en
to
-q
oo
oo
ai
ai
i—1
ai
-a
to
~a
oo
to
oo
Io
II
II
II
COOOOOOCOtOOOtOOOl-il—'OOOOOOOO
Io
Io
Io
II
oo
OOMUOtsJOHO^UOOOWCSKIOOtDOMiti^CD^HOOOOfflOltOü)
ÜiOtDOi^Oi^CSMSOSHfflMHlOOÜIÜlh'mQSUI-'lOMtOO)
OOOOO
sj^
tobb
Ü1M
00SH
>
9 •s CD
i-i
I
CO
CO
to
to
Cn
*^
en
"bi I
£ Ä
ÖI s Ö CD
UOJUJ^i^ilx^tOtOWCOtOMOJHMh'MHMMMbJHh'Oh'HHOH
WWOIWWC^WOIWC^ÜlÜlWCnOTÜlOlOTOlOIWMWOlOlOlOIWWWÜl
II
II
II
II
II
II
II
II
II
II
II
II
II
II
II
I
tOtOtOCOCOCOCOI—'I—'tOtOH-'MNHh'H-'COI—'H-'h-'I—'h-»OOOOOOOO
woiWOTüiwüibibiuiüiwüiwbTüibiüiwbibiwöibiüibioibioiüicn
^ï^
**•
ï^
P1
Cn
en
en
en
en
II
II
I
co
co
co
co
4^
en
en
en
en
en
Si I *-H
co
al
CD
00
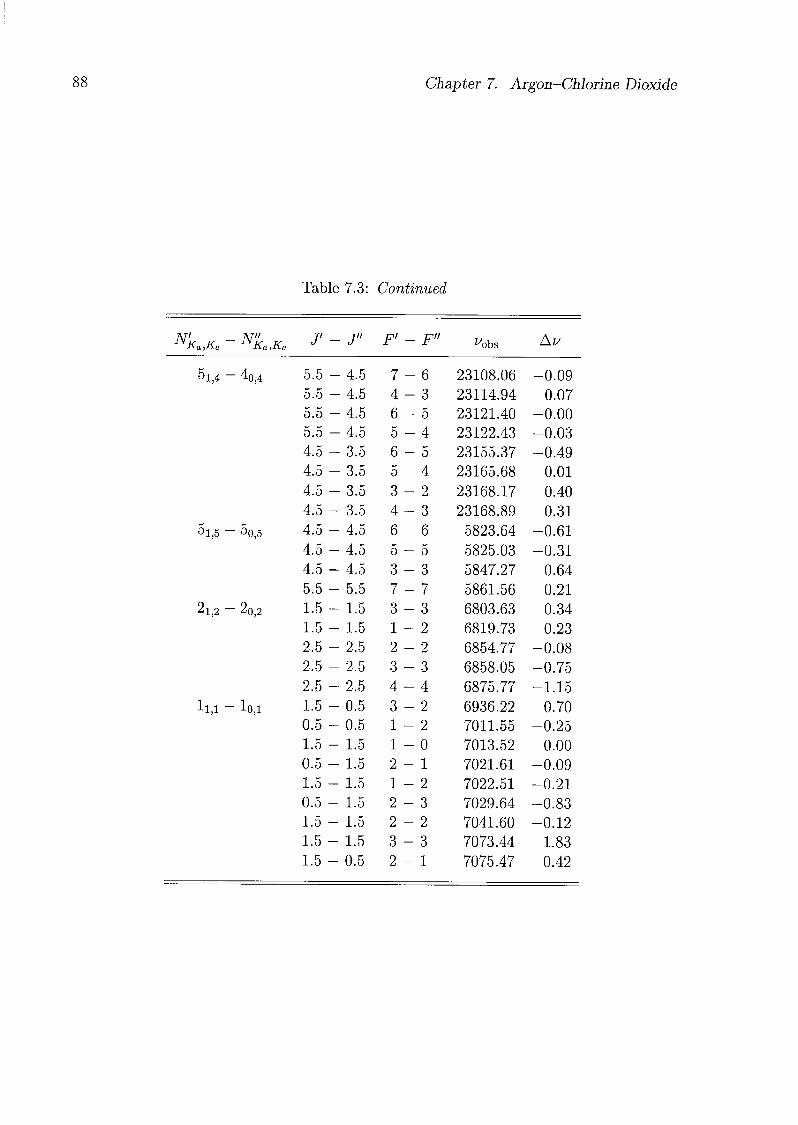
88 Chapter 7. Argon-Chlorine Dioxide
Table 7.3: Continued
NKa,Kc -N"Ka,Kc
J' - J" F' _ p" ^obs Au
5l,4 '-40,4 5.5 •-4.5 7 - 6 23108.06 -0.09
5.5 - 4.5 4 - 3 23114.94 0.07
5.5 - 4.5 6 - 5 23121.40 -0.00
5.5 - 4.5 5 - 4 23122.43 -0.03
4.5 - 3.5 6 - 5 23155.37 -0.49
4.5 - 3.5 5 - 4 23165.68 0.01
4.5 - 3.5 3 - 2 23168.17 0.40
4.5 - 3.5 4 - 3 23168.89 0.31
5l,5 '- 50,5 4.5 - 4.5 6 - 6 5823.64 -0.61
4.5 -4.5 5 - 5 5825.03 -0.31
4.5 - 4.5 3 - 3 5847.27 0.64
5.5 - 5.5 7 - 7 5861.56 0.21
21,2 — 2o,2 1.5 - 1.5 3 - 3 6803.63 0.34
1.5 - 1.5 1 - 2 6819.73 0.23
2.5 - 2.5 2 - 2 6854.77 -0.08
2.5 - 2.5 3 - 3 6858.05 -0.75
2.5 - 2.5 4 - 4 6875.77 -1.15
ll,l--lo,i 1.5 - 0.5 3 - 2 6936.22 0.70
0.5 - 0.5 1 - 2 7011.55 -0.25
1.5 - 1.5 1 - 0 7013.52 0.00
0.5 - 1.5 2 - 1 7021.61 -0.09
1.5 - 1.5 1 - 2 7022.51 -0.21
0.5 - 1.5 2 - 3 7029.64 -0.83
1.5 - 1.5 2 - 2 7041.60 -0.12
1.5 - 1.5 3 - 3 7073.44 1.83
1.5 - 0.5 2 - 1 7075.47 0.42
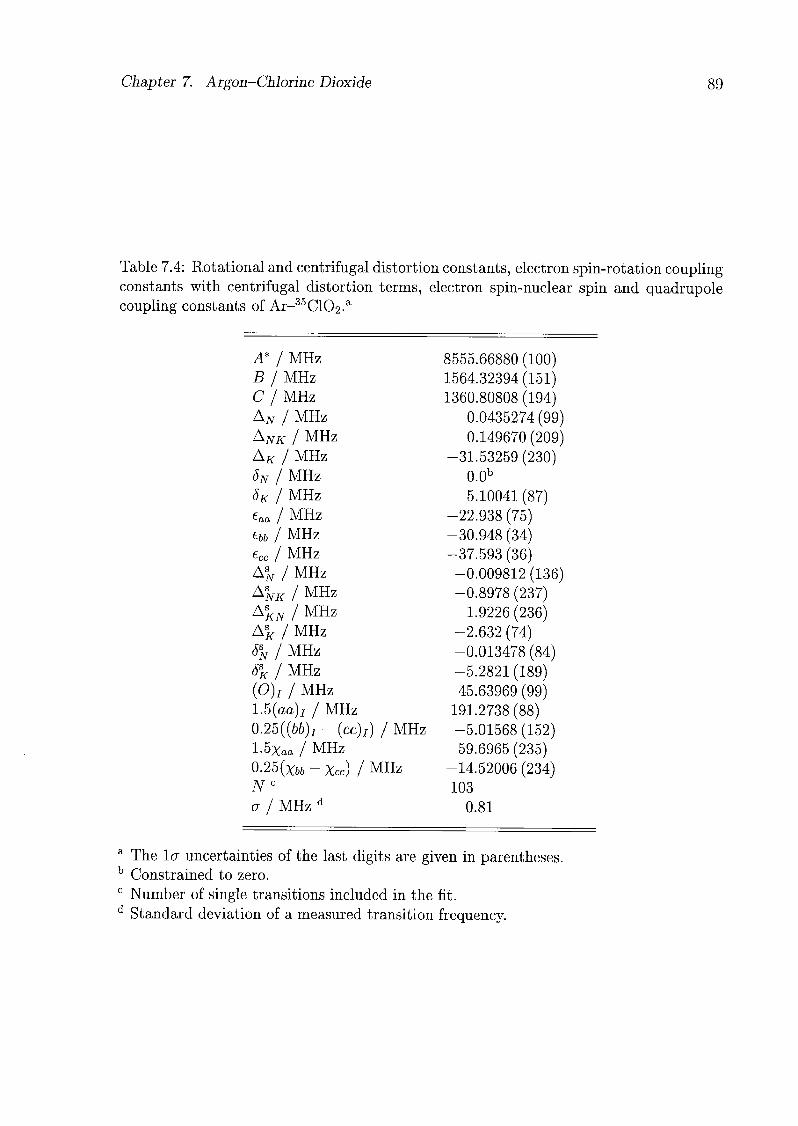
Chapter 7. Argon-Chlorine Dioxide 89
Table 7.4: Rotational and centrifugal distortion constants, electron spin-rotation couplingconstants with centrifugal distortion terms, electron spin-nuclear spin and quadrupolecoupling constants of Ar-35C102.a
A* j MHz 8555.66880 (100)B j MHz 1564.32394 (151)C j MHz 1360.80808 (194)AN j MHz 0.0435274 (99)AatWMHz 0.149670(209)A# / MHz -31.53259 (230)SN j MHz 0.0b
5K j MHz 5.10041 (87)eaa I MHz -22.938 (75)ebb I MHz -30.948 (34)ecc / MHz -37.593 (36)A8^ / MHz -0.009812 (136)A^ / MHz -0.8978 (237)ASKN / MHz 1.9226 (236)A\ j MHz -2.632 (74)6SN I MHz -0.013478 (84)SSK I MHz -5.2821 (189)(O)i I MHz 45.63969 (99)1.5(aa)i I MHz 191.2738 (88)0.25((6&)/ - (cc)i) j MHz -5.01568 (152)l.bxaa I MHz 59.6965 (235)0.25(x6h - Xcc) I MHz -14.52006 (234)Nc 103
cr / MHz d0.81
a The 1er uncertainties of the last digits are given in parentheses.b Constrained to zero.
c Number of single transitions included in the fit.d Standard deviation of a measured transition frequency.
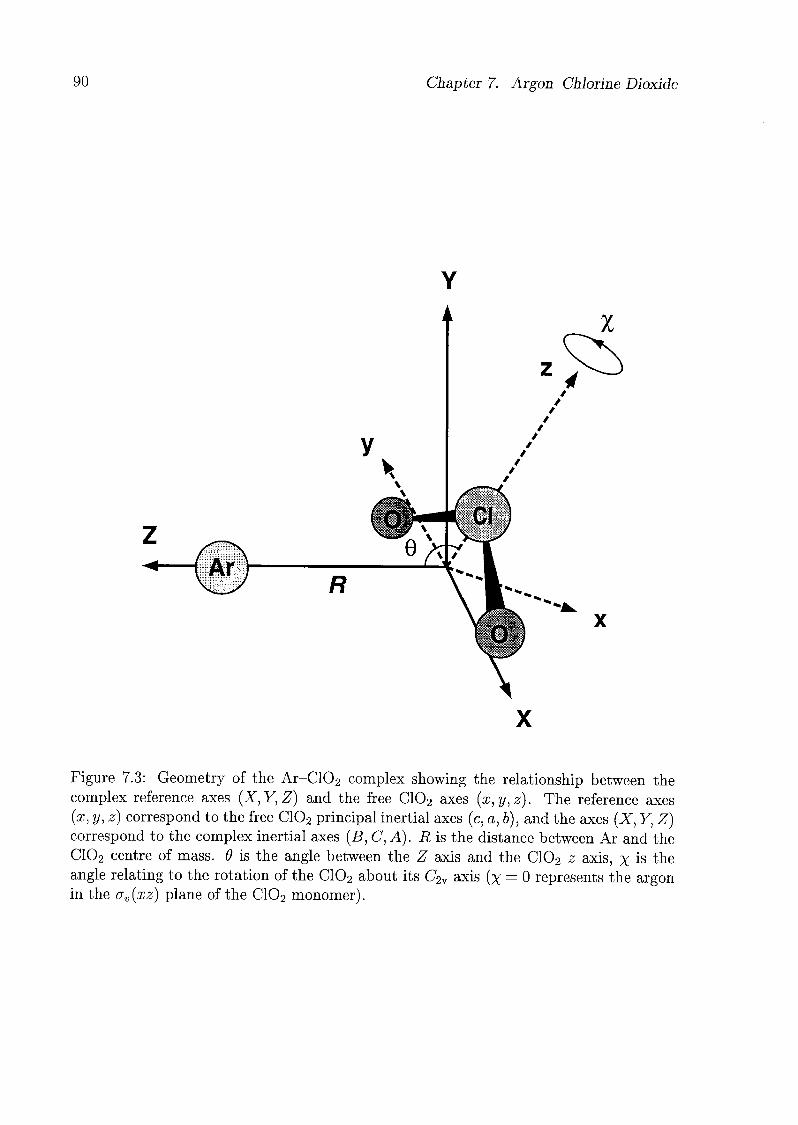
90 Chapter 7. Argon-Chlorine Dioxide
Figure 7.3: Geometry of the Ar-C102 complex showing the relationship between the
complex reference axes (X,Y,Z) and the free C102 axes (x,y,z). The reference axes
(x, y, z) correspond to the free C102 principal inertial axes (c, a, 6), and the axes (X, Y, Z)correspond to the complex inertial axes (B: C, A). R is the distance between Ar and the
C102 centre of mass. 9 is the angle between the Z axis and the C102 z axis, x is the
angle relating to the rotation of the C102 about its C2v axis (x = 0 represents the argonin the ov (xz) plane of the C102 monomer).
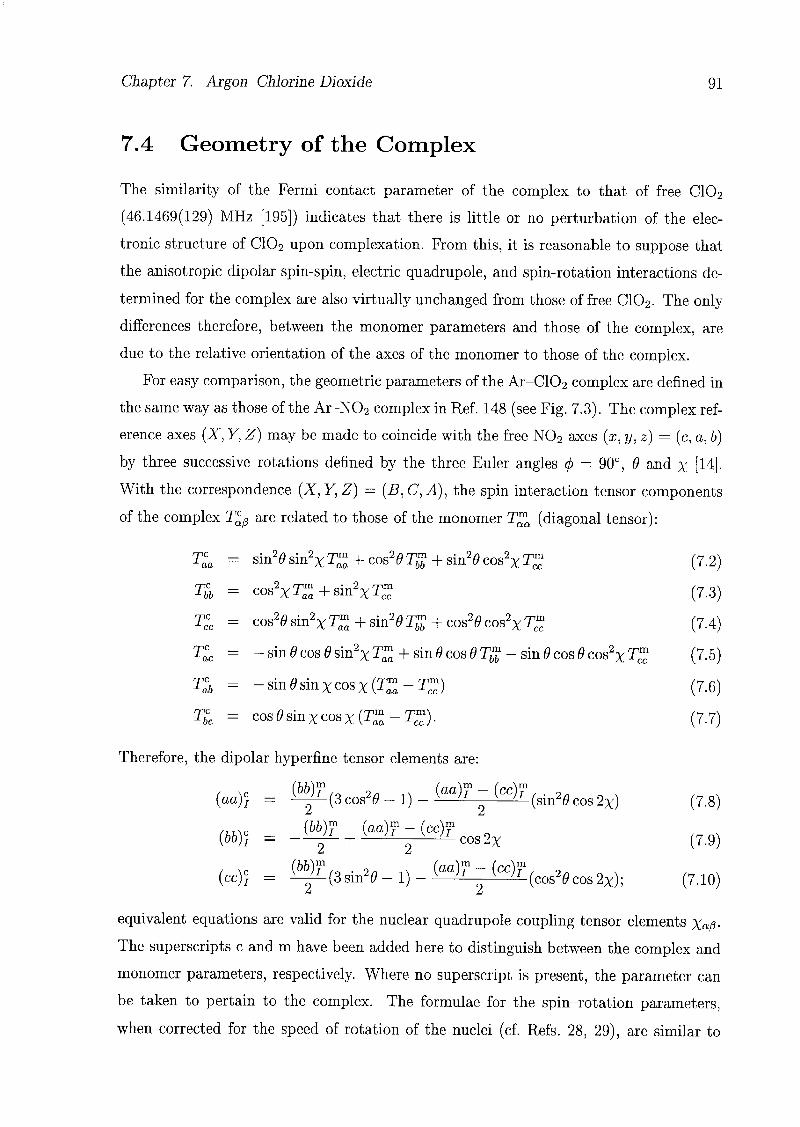
Chapter 7. Argon-Chlorine Dioxide 91
7.4 Geometry of the Complex
The similarity of the Fermi contact parameter of the complex to that of free C102
(46.1469(129) MHz [195]) indicates that there is little or no perturbation of the elec¬
tronic structure of C102 upon complexation. From this, it is reasonable to suppose that
the anisotropic dipolar spin-spin, electric quadrupole, and spin-rotation interactions de¬
termined for the complex are also virtually unchanged from those of free C102. The only
differences therefore, between the monomer parameters and those of the complex, are
due to the relative orientation of the axes of the monomer to those of the complex.
For easy comparison, the geometric parameters of the Ar-C102 complex are defined in
the same way as those of the Ar-N02 complex in Ref. 148 (see Fig. 7.3). The complex ref¬
erence axes (X, Y, Z) may be made to coincide with the free N02 axes (x, y, z) = (c, a, b)
by three successive rotations defined by the three Euler angles c/> = 90°, 9 and x [14].
With the correspondence (X,Y,Z) = (B:C, A), the spin interaction tensor components
of the complex T^ß are related to those of the monomer Ta (diagonal tensor) :
rpcaa
= sin20 sin2xT + cos20 T$ + sin20 cos2x T£ (7.2)
rpc1bb
= cos2XT- + sin2XT- (7.3)
rpccc
= cos20 sin2xT + sin20 T£ + cos20 cos2x T£ (7.4)
rpcac
—
- sin 9 cos 9 sin2xT + sin 9 cos 9 Tb^ - sin 9 cos 9 cos2x Tfc (7.5)
rpc1ab
= -sm9smxcosX(TZ-Tcmc) (7.6)
Tcbc = cos0smXcosxCC-:O (7.7)
Therefore, the dipolar hyperfine tensor elements are:
(aa)} = ^L(3 cos2fl - 1) -{aü)T ~ {c°)T
(sin29 cos 2X) (7.8)Zj Zi
.„,,. (bb)f (aa)f-(cc)f, N
(bb)} =
-L-£L + 2C0S2X (7-9)
(cc)} = ML(3sin2fl _ i) _W" -
(CC^(cos2gcos2x); (7.10)Li Ù
equivalent equations are valid for the nuclear quadrupole coupling tensor elements Xaß-
The superscripts c and m have been added here to distinguish between the complex and
monomer parameters, respectively. Where no superscript is present, the parameter can
be taken to pertain to the complex. The formulae for the spin-rotation parameters,
when corrected for the speed of rotation of the nuclei (cf. Refs. 28, 29), are similar to

92 Chapter 7. Argon-Chlorine Dioxide
Eqs. 7.8-7.10. Shown below is that for the a-axis parameter
) =
2 (# ~
V (W*- 1} -
2 (# - #) (sin2*cos2*)> (7-n)aa
where,m ,m ,mt„„ ttj, t,"aa
_|_bb , cc \ In -i r>\
3 Um 5m Cm'' { ' }
ê is the isotropic correction term that is used to convert the second-rank spin-rotation
tensor into a scalar tensor, that is then independent of the orientation of C102, and a
traceless second-rank tensor which has the same transformation properties as the dipolar
hyperfine tensor. The spectroscopically determined parameters (aa)j, Xaa, ari(l eaa are
effective values, averaged over the LAM wave functions. Using Eqs. 7.8-7.11, the expec¬
tation values (3cos20 — 1) and (sin20 cos 2x) may be obtained by plotting (sin2#cos2x)
vs (3cos20 — 1) for the well-determined spectroscopic parameters. Using the values of
(aa)r, Xaa, and eaa/A* — ë from Tab. 7.4, the lines intersect at (3 cos26> — 1) « —0.75 and
(sin2öcos2x) ~ 0.81; the resulting effective values are #eff = 107(2)° and Xeff = 14(1)°.
The analysis of the hyperfine structure does not indicate whether 9 is obtuse (9 > 90°)
or acute (9 < 90°), but an obtuse angle 9 is more likely according to the results of the
analyses of the structures of the Ar-N02, Ar-S02 and and Ar-Oß complexes. It has
to be pointed out that these effective values Xeff and öeg are measures of the internal
motions within the complex and may be quite different from the equilibrium values.
The value of R can be estimated from the moments of inertia of the complex and the
monomer. Assuming that the monomer geometry is unchanged upon complexation and
neglecting the inertial defect (J — If- — 7 = 0 for a rigid planar molecule), the moment
of inertia tensor in the complex reference axis system has the following elements [10]:
Izz = sin20/am+(l-sin20sin2x)l6m, (7.13)
Ixx = IT + sm2x4m + MÄ2, (7.14)
Iyy = cos29If+(l-cos29sm2x)Ibm + pJR2, (7.15)
IYZ = - sm 9 cos 9If+ sin9 cos 9 si^xlf, (7.16)
Ixz = sinösinxcosxC, (7.17)
Ixy = -cosösinxcosx/r, (7.18)
where 7 (a = a, b, c) are the monomer moments of inertia and p is the reduced mass
of the complex (40Ar-35Cl16O2: p = 25.026205 u). Taking x as a measure of the small
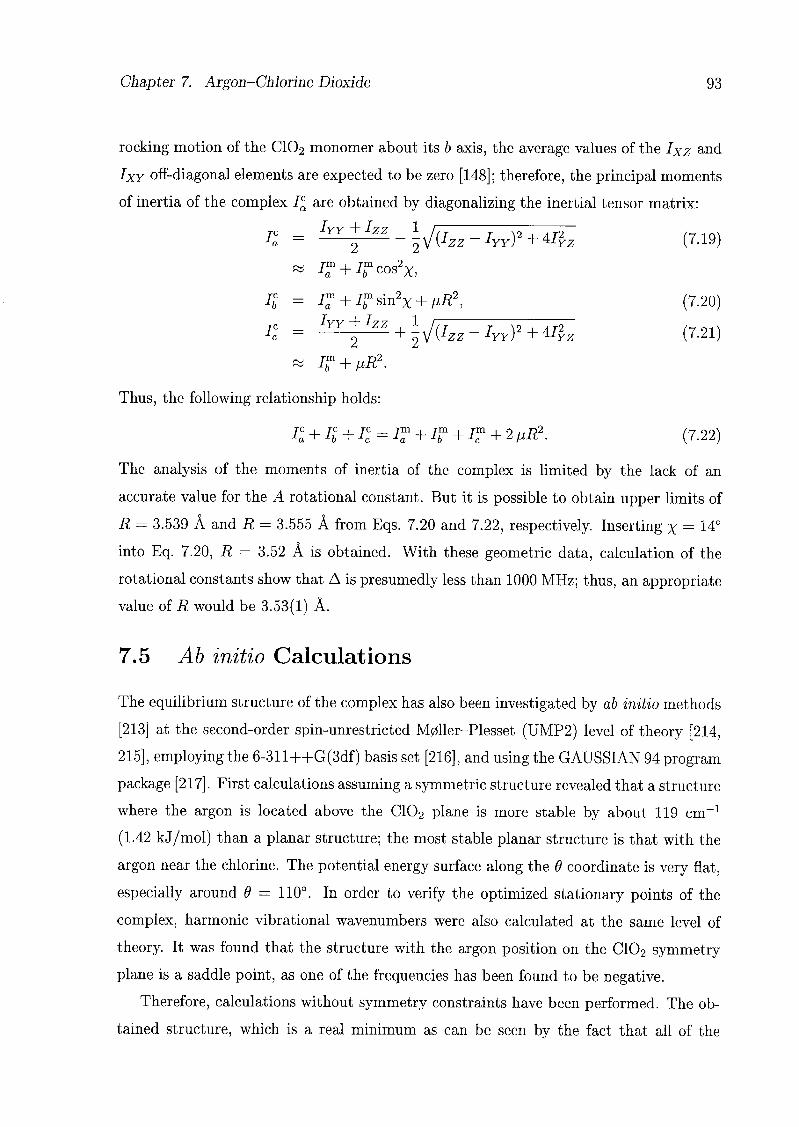
Chapter 7. Argon-Chlorine Dioxide 93
rocking motion of the C102 monomer about its b axis, the average values of the Ixz and
Ixy off-diagonal elements are expected to be zero [148]; therefore, the principal moments
of inertia of the complex i£ are obtained by diagonalizing the inertial tensor matrix:
yVzz-lYY)2 + 4%z (7-19)re
_
Wy + IzZ
2 2
« I? + If cos2x,
It = If + Ifsm2X + pR2, (7.20)
ICc = IyY+2IzZ + Iv/(Izz-Iyy)2 + ^yz (7.21)
« If + pR2.
Thus, the following relationship holds:
la + ib + il = IT + IT + IT + 2 »R2- (7.22)
The analysis of the moments of inertia of the complex is limited by the lack of an
accurate value for the A rotational constant. But it is possible to obtain upper limits of
R = 3.539 À and R = 3.555 Â from Eqs. 7.20 and 7.22, respectively. Inserting x = 14°
into Eq. 7.20, R = 3.52 Â is obtained. With these geometric data, calculation of the
rotational constants show that A is presumedly less than 1000 MHz; thus, an appropriate
value of R would be 3.53(1) Â.
7.5 Ab initio Calculations
The equilibrium structure of the complex has also been investigated by ab initio methods
[213] at the second-order spin-unrestricted M0ller-Plesset (UMP2) level of theory [214,
215], employing the 6-311++G(3df) basis set [216], and using the GAUSSIAN 94 program
package [217]. First calculations assuming a symmetric structure revealed that a structure
where the argon is located above the C102 plane is more stable by about 119 cm-1
(1.42 kJ/mol) than a planar structure; the most stable planar structure is that with the
argon near the chlorine. The potential energy surface along the 9 coordinate is very flat,
especially around 9 = 110°. In order to verify the optimized stationary points of the
complex, harmonic vibrational wavenumbers were also calculated at the same level of
theory. It was found that the structure with the argon position on the C102 symmetry
plane is a saddle point, as one of the frequencies has been found to be negative.
Therefore, calculations without symmetry constraints have been performed. The ob¬
tained structure, which is a real minimum as can be seen by the fact that all of the
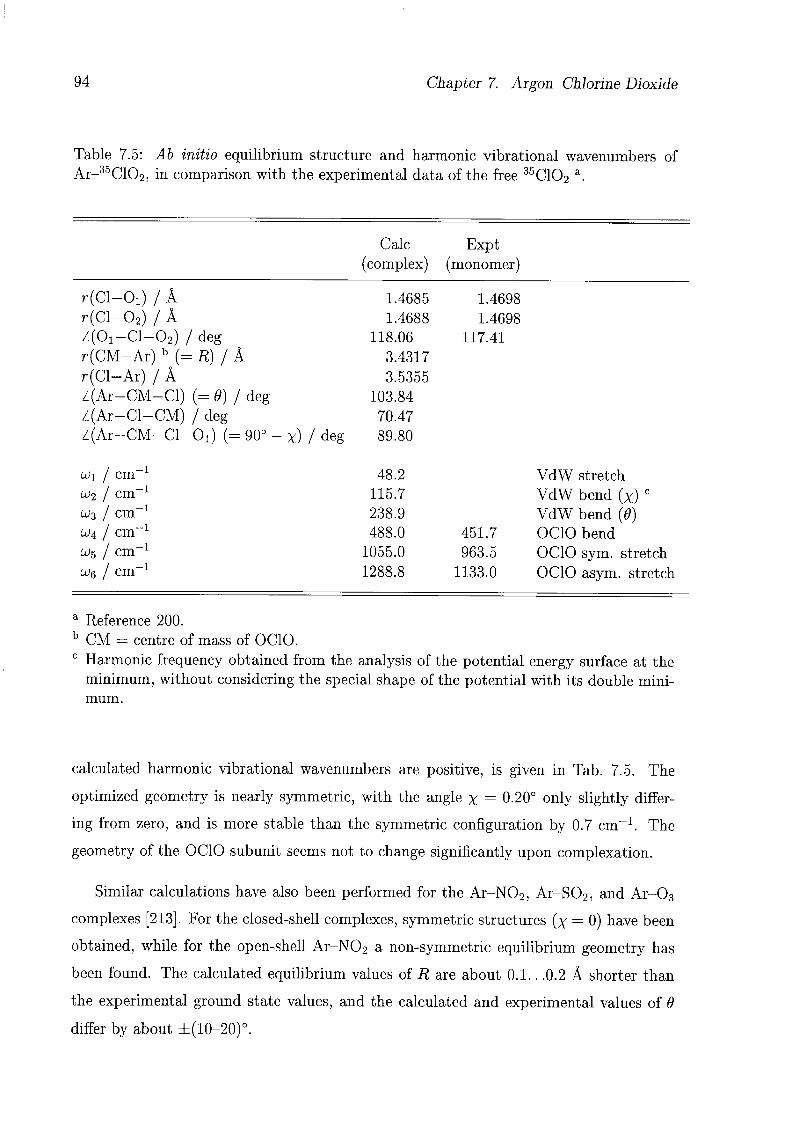
94 Chapter 7. Argon-Chlorine Dioxide
Table 7.5: Ab initio equilibrium structure and harmonic vibrational wavenumbers of
Ar-35C102, in comparison with the experimental data of the free 35C102 a.
Calc Expt
(complex) (monomer)
r(Cl-Ox) / À 1.4685 1.4698
r(Cl-02) / Â 1.4688 1.4698
Z(01-Cl-02) / deg 118.06 117.41
r(CM-Ar)b(= R) / À 3.4317
r(Cl-Ar) / Â 3.5355
Z(Ar-CM-Cl) (= 9) / deg 103.84
Z(Ar-Cl-CM) / deg 70.47
/(Ar-CM-Cl-Oi) (= 90° - x) / deg 89.80
ui / cm"1 48.2 VdW stretch
u)2 1 cm"1 115.7 VdW bend (x) c
LÜ2, / cm-1 238.9 VdW bend (9)Lü4 / cm"1 488.0 451.7 OCIO bend
(j5 / cm-1 1055.0 963.5 OCIO sym. stretch
coq 1 cm-1 1288.8 1133.0 OCIO asym. stretch
a Reference 200.b CM = centre of mass of OCIO.c Harmonic frequency obtained from the analysis of the potential energy surface at the
minimum, without considering the special shape of the potential with its double mini¬
mum.
calculated harmonic vibrational wavenumbers are positive, is given in Tab. 7.5. The
optimized geometry is nearly symmetric, with the angle x = 0.20° only slightly differ¬
ing from zero, and is more stable than the symmetric configuration by 0.7 cm-1. The
geometry of the OCIO subunit seems not to change significantly upon complexation.
Similar calculations have also been performed for the Ar-N02, Ar-S02, and Ar-03
complexes [213]. For the closed-shell complexes, symmetric structures (x = 0) have been
obtained, while for the open-shell Ar-N02 a non-symmetric equilibrium geometry has
been found. The calculated equilibrium values of R are about 0.1.. .0.2 Â shorter than
the experimental ground state values, and the calculated and experimental values of 9
differ by about ±(10-20)°.
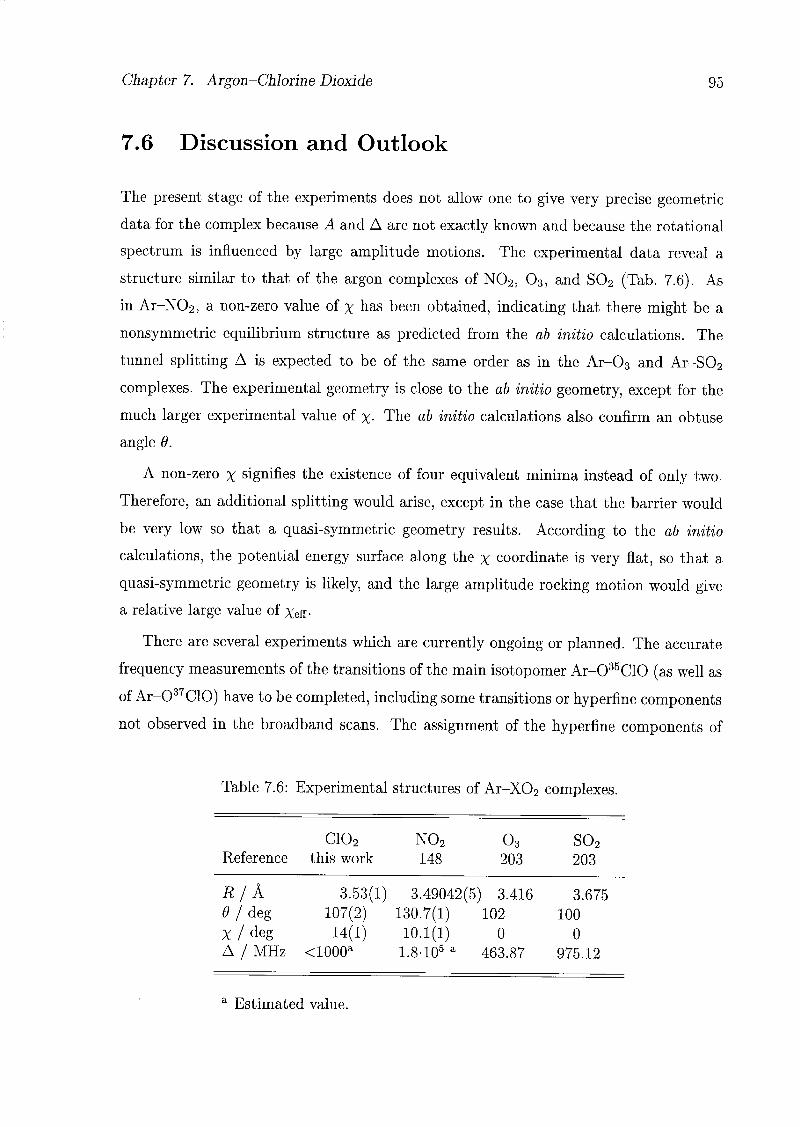
Chapter 7. Argon-Chlorine Dioxide 95
7.6 Discussion and Outlook
The present stage of the experiments does not allow one to give very precise geometric
data for the complex because A and A are not exactly known and because the rotational
spectrum is influenced by large amplitude motions. The experimental data reveal a
structure similar to that of the argon complexes of N02, 03, and S02 (Tab. 7.6). As
in Ar-N02, a non-zero value of x has been obtained, indicating that there might be a
nonsymmetric equilibrium structure as predicted from the ab initio calculations. The
tunnel splitting A is expected to be of the same order as in the Ar-03 and Ar-S02
complexes. The experimental geometry is close to the ab initio geometry, except for the
much larger experimental value of %. The ab initio calculations also confirm an obtuse
angle 9.
A non-zero x signifies the existence of four equivalent minima instead of only two.
Therefore, an additional splitting would arise, except in the case that the barrier would
be very low so that a quasi-symmetric geometry results. According to the ab initio
calculations, the potential energy surface along the x coordinate is very flat, so that a
quasi-symmetric geometry is likely, and the large amplitude rocking motion would give
a relative large value of Xeff-
There are several experiments which are currently ongoing or planned. The accurate
frequency measurements of the transitions of the main isotopomer Ar-035C10 (as well as
of Ar-037C10) have to be completed, including some transitions or hyperfine components
not observed in the broadband scans. The assignment of the hyperfine components of
Table 7.6: Experimental structures of Ar-X02 complexes.
C102 N02 03 S02Reference this work 148 203 203
R/k 3.53(1) 3.49042(5) 3.416 3.675
9 j deg 107(2) 130.7(1) 102 100
x/deg 14(1) 10.1(1) 0 0
A / MHz <1000a 1.8-105 a 463.87 975.12
a Estimated value.
96 Chapter 7. Argon-Chlorine Dioxide
the observed transitions of Ar-037C10 has to be done as well. The analysis of the second
isotopomer would give additional information about the geometry of the complex. The
main goal of the current measurements is the search for K'a = 2 — K" = 1 transitions,
from which accurate values of A and A can be obtained. This would also improve the
structure analysis and give some information about the internal motions.
Additional information about the nature of the rare gas-OCIO bond can be obtained
from the study of the xenon complexes, because there are two naturally occuring Xe
isotops with a nuclear spin (129Xe and 131Xe). The analysis of the superhyperfine inter¬
action between the electron spin and the Xe nuclear spin would reveal information about
the unpaired electron délocalisation within the complex, as was shown in the case of the
Xe-N02 complex [151].
Appendix A
Design of the Helmholtz Coils
A.l Theoretical Considerations
The magnetic field of a straight conductor (see Fig. A.la) can be calculated using the
law of Biot-Savart
dH(P) = -^ds x r. (A.l)
Since s = d tan <j> and r = dj cos <j>, the magnetic field at the point P is
dH(P) = -1— sin 9 ds = -J- cos 0 d<f>. (A.2)47rr2 4-ïïd
Integration over the whole length (2s) of the conductor (see Fig. A. lb) yields
/ r4>+ IH(P) = -—-/ cos</> d<j)= -—(sm<j)+ -sinc/>_). (A.3)
47Tü J(j>- 47ra
Using Eq. A.3, it is easy to calculate the magnetic field of a square or rectangular coil by
superposing the fields of straight conductor pieces.
For a pair of square Helmholtz coils with length 2s and 2sp coil spacing, the field at
a point P on the symmetry axis can be calculated as follows (see Fig. A.2). The position
of P is given by the relative coordinate r, which is zero for the centre position and ±1
at the positions of the coils. Therefore, the distances of P to the centres of the coils are
sp(l + t) and sp(l — r), respectively. The distances to one side of the coils are
dx = s^Jl + p2(l + r)2 and d2 = sy/l + p2(l - r)2, (AA)
and the sines of the limiting angles are
sin <j>i — . and sin (f>2 = , (A.5)^ + p2(l + r)2 ^2 + p2(l-r)2
97
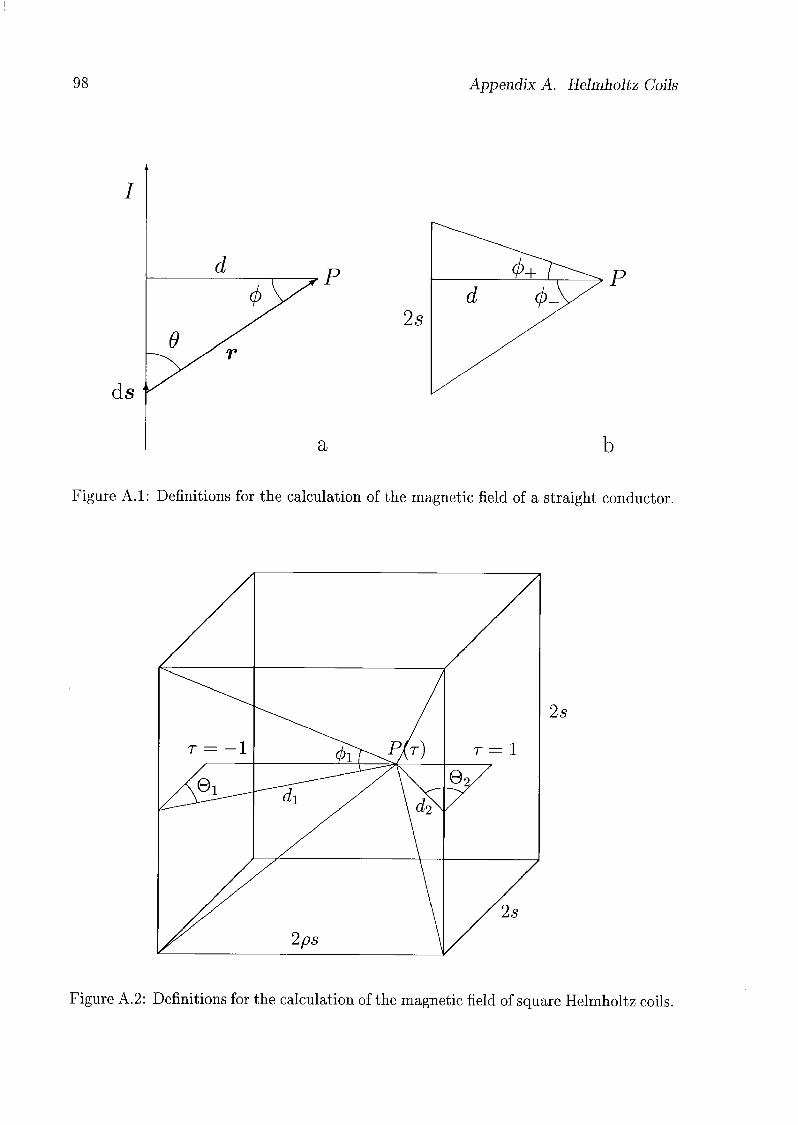
98 Appendix A. Helmholtz Coils
I
ds '*
a b
Figure A.l: Definitions for the calculation of the magnetic field of a straight conductor.
r = -l
Jl£^p/r) r= 1
/&---^dT^y' \d,2\
§2/
2ps
/2s
2s
Figure A.2: Definitions for the calculation of the magnetic field of square Helmholtz coils.
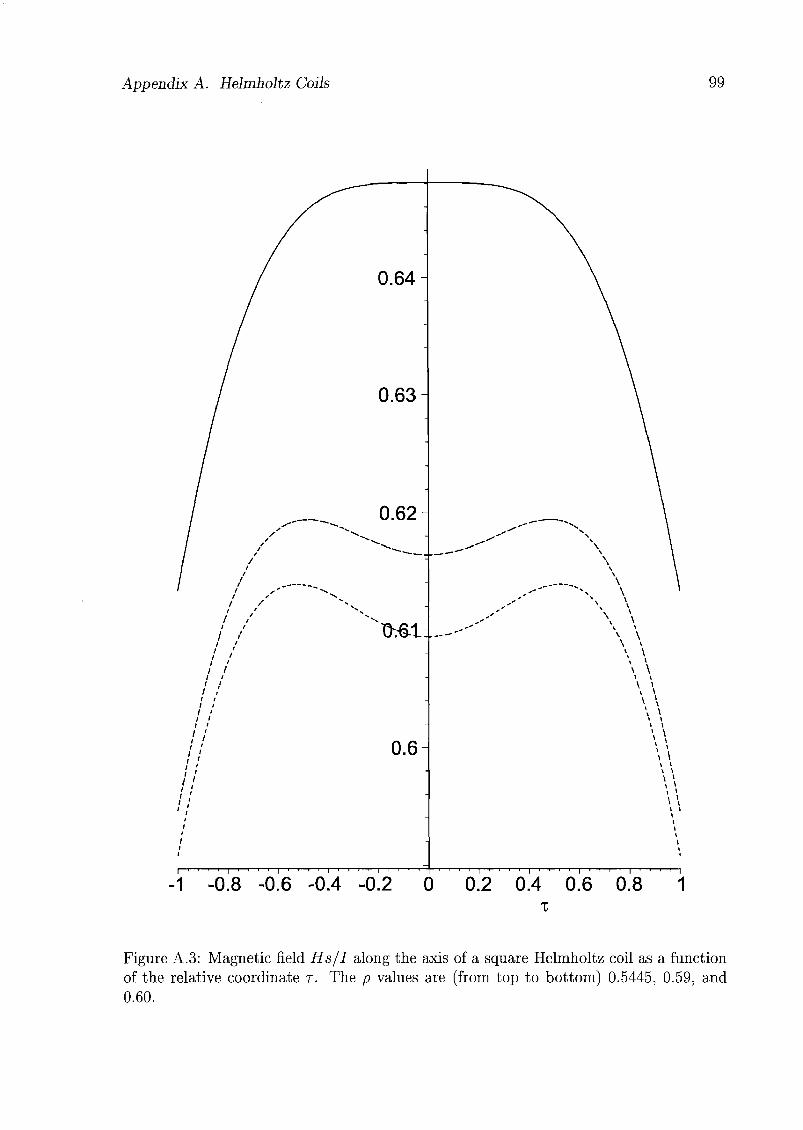
Appendix A. Helmholtz Coils 99
0.64
0.63
0.62
>£1
0.6
1 -0.8 -0.6 -0.4 -0.2 0 0.2 0.4 0.6 0.8 1
Figure A.3: Magnetic field Hs/I along the axis of a square Helmholtz coil as a function
of the relative coordinate r. The p values are (from top to bottom) 0.5445, 0.59, and
0.60.
100 Appendix A. Helmholtz Coils
The axial component of the field of one coil i is, using Eq. A.3,
#*,ax = 4cosetiZ1(r) = 4 cosG, ——(2sin^), (A.6)47rUî
where the cosines of O are
cos 81 = ,and cos 02 = . (A.7)
^l + p2(l + r)2 ^/l + p2(l-r)2
The axial field at the position r is then
,
_
21 ( 1 1 1 1
{T,P)~ks{(1 + p2(1 + t)2)J2 + p2(1 + t)2+
(1 + P2(1-t)2)x/2 + p2(1-t)2(A.8)
The Helmholtz condition, that the second derivative of the axial field with respect to
the axial coordinate is zero at the origin, defines a cubic equation whose solution yields
the coil spacing p. For a square coil, the Helmholtz spacing is given by p = 0.5445, which
is slightly larger than for circular coils (p — 0.5) [218]. In order to maximize the region
over which the field has a prescribed uniformity, the spacing may be increased to p = 0.59
(see Fig. A.3).
For a pair of rectangular Helmholtz coils with sides 2s and 2/s, and 2sp coil spacing,
the field along the symmetry axis is given by
H(r,pJ) =I-tITS
1 1 \ 1+
i + p2(i + t)2 f2 + p2(i + r)2) v/i + /2 + p2(1 + r)
1 \ 1+ (A.9)
VI + p2(l - r)2 f2 + p2(l - rf) v/l + /2 + p2(1_r)2_
The magnetic induction or flux density B is related to the magnetic field strength H by
(B/G) = Ait 10~3 (H/Am-1) (A.10)
when the relative permeability pr is set to 1.
A.2 Setup
The actual dimensions of the coils are given in Tab. A.l. The axial (a), perpendicular
(p) and vertical (v) coil axes are along the axes of the main cavity, the small cavity, and
the molecular beam, respectively. The geometry of these coils was determined by the
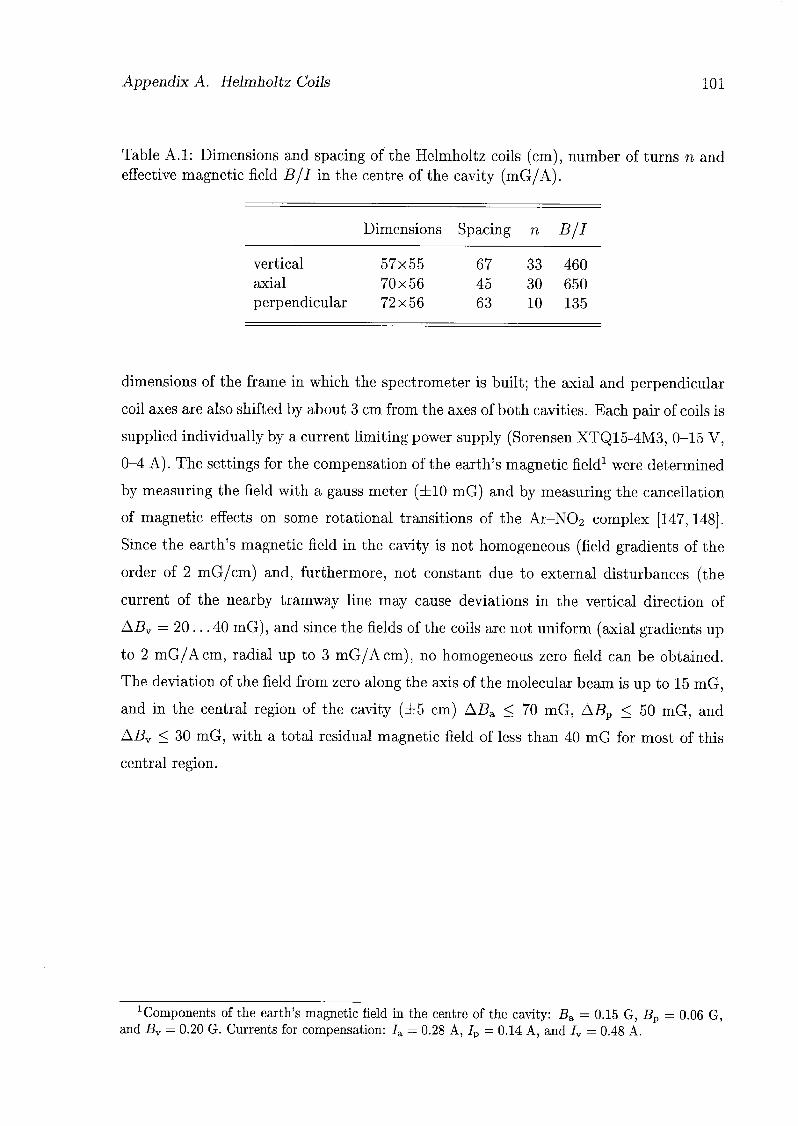
Appendix A. Helmholtz Coils 101
Table A.l: Dimensions and spacing of the Helmholtz coils (cm), number of turns n and
effective magnetic field B/I in the centre of the cavity (mG/A).
Dimensions Spacing n B/I
vertical 57x55 67 33 460
axial 70x56 45 30 650
perpendicular 72x56 63 10 135
dimensions of the frame in which the spectrometer is built; the axial and perpendicular
coil axes are also shifted by about 3 cm from the axes of both cavities. Each pair of coils is
supplied individually by a current limiting power supply (Sorensen XTQ15-4M3, 0-15 V,
0-4 A). The settings for the compensation of the earth's magnetic field1 were determined
by measuring the field with a gauss meter (±10 mG) and by measuring the cancellation
of magnetic effects on some rotational transitions of the Ar-N02 complex [147,148].
Since the earth's magnetic field in the cavity is not homogeneous (field gradients of the
order of 2 mG/cm) and, furthermore, not constant due to external disturbances (the
current of the nearby tramway line may cause deviations in the vertical direction of
ABV = 20...
40 mG), and since the fields of the coils are not uniform (axial gradients up
to 2 mG/A cm, radial up to 3 mG/A cm), no homogeneous zero field can be obtained.
The deviation of the field from zero along the axis of the molecular beam is up to 15 mG,
and in the central region of the cavity (±5 cm) ABa < 70 mG, ABP < 50 mG, and
ABV < 30 mG, with a total residual magnetic field of less than 40 mG for most of this
central region.
1Components of the earth's magnetic field in the centre of the cavity: Ba = 0.15 G, Bv = 0.06 G,
and Bv = 0.20 G. Currents for compensation: Ja — 0.28 A, Jp = 0.14 A, and Iv = 0.48 A.
Appendix B
Microwave Spectrum and Structure
of Fluorobenzene
The microwave spectra of fluorobenzene and several of its isotopomers were measured
by the Copenhagen group [219,220] with a Stark-modulated spectrometer. They fit only
the rotational constants without any centrifugal distortion constants, which are small in
the case of fluorobenzene, and determined the substitution structure of fluorobenzene
(Tabs. B.l, B.2). A refined r0-structure was obtained by Doraiswamy and Sharma [95]
by adjusting the bond lengths and bond angles to give moments of inertia as nearly equal
as possible to the reciprocals of the observed rotational constants for the ground vibra¬
tional state (Tab. B.l). Fluorobenzene has also been studied by electron diffraction; the
obtained rg structure agrees excellently with the rs structure [221]. Some high-resolution
data of the parent isotopomer are published in a study of the dipole moment [222]. The
dipole moment of fluorobenzene (p — 1.555(3) D) was reanalysed and published together
with the data of fluorobenzene-ds (p, = 1.564(5) D) [90].
High-resolution spectra of the three mono-deuterated fluorobenzenes were obtained by
molecular beam FTMW spectroscopy with resolved deuterium hyperfine splittings [97].
In these fits, some high J-transitions measured by waveguide FTMW spectroscopy were
also included.
In order to obtain reliable frequencies also for high J transitions and to identify them
in the broadband scans for van der Waals complexes of fluorobenzene, all the frequencies
obtained by molecular beam FTMW measurements (with the jet parallel to the resonator
axis) and from measurements done in this lab with a Stark spectrometer (L. Primo,
1990/91) were fit together and listed in Tab. B.4. As uncertainties were taken: 1 kHz
102
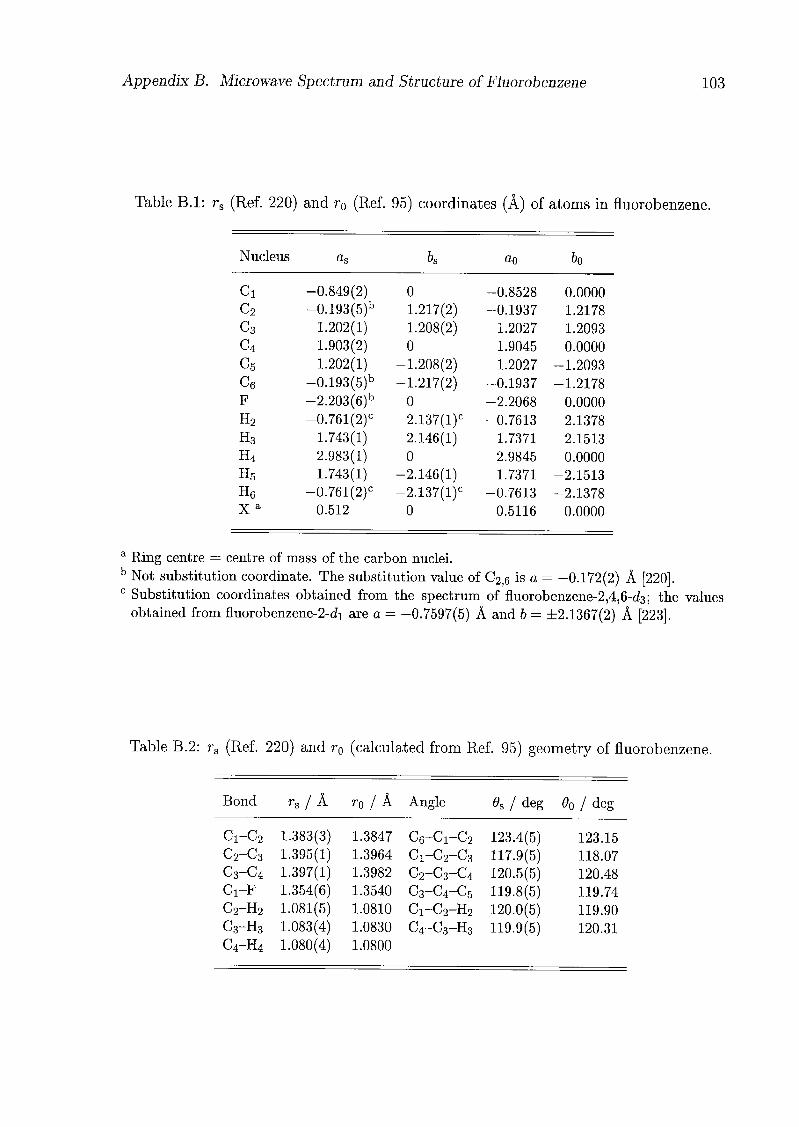
Appendix B. Microwave Spectrum and Structure of Fluorobenzene 103
Table B.l: rs (Ref. 220) and r0 (Ref. 95) coordinates (Â) of atoms in fluorobenzene.
Nucleus as bs ao bo
Ci -0.849(2) 0 -0.8528 0.0000
c2 -0.193(5)b 1.217(2) -0.1937 1.2178
c3 1.202(1) 1.208(2) 1.2027 1.2093
c4 1.903(2) 0 1.9045 0.0000
c5 1.202(1) -1.208(2) 1.2027 -1.2093
c6 -0.193(5)b -1.217(2) -0.1937 -1.2178
F -2.203(6)b 0 -2.2068 0.0000
H2 -0.761(2)c 2.137(l)c -0.7613 2.1378
H3 1.743(1) 2.146(1) 1.7371 2.1513
H4 2.983(1) 0 2.9845 0.0000
H5 1.743(1) -2.146(1) 1.7371 -2.1513
H6 -0.761(2)c -2.137(l)c -0.7613 -2.1378
Xa 0.512 0 0.5116 0.0000
a
Ring centre = centre of mass of the carbon nuclei.b Not substitution coordinate. The substitution value of C2)6 is a = —0.172(2) Â [220].c Substitution coordinates obtained from the spectrum of fluorobenzene-2,4,6-<i3; the values
obtained from fluorobenzene-2-di are a = -0.7597(5) A and b = ±2.1367(2) A [223].
Table B.2: rs (Ref. 220) and r0 (calculated from Ref. 95) geometry of fluorobenzene.
Bond rs / k ro j k Angle 6>s / deg d0 I deg
C1-C2 1.383(3) 1.3847 C6-C1-C2 123.4(5) 123.15
C2-C3 1.395(1) 1.3964 Ci-C2-C3 117.9(5) 118.07
C3-C4 1.397(1) 1.3982 C2-C3-C4 120.5(5) 120.48
Ci-F 1.354(6) 1.3540 C3-C4-C5 119.8(5) 119.74
C2-H2 1.081(5) 1.0810 Ci-C2-H2 120.0(5) 119.90
C3-H3 1.083(4) 1.0830 C4-C3-H3 119.9(5) 120.31
C4—H4 1.080(4) 1.0800
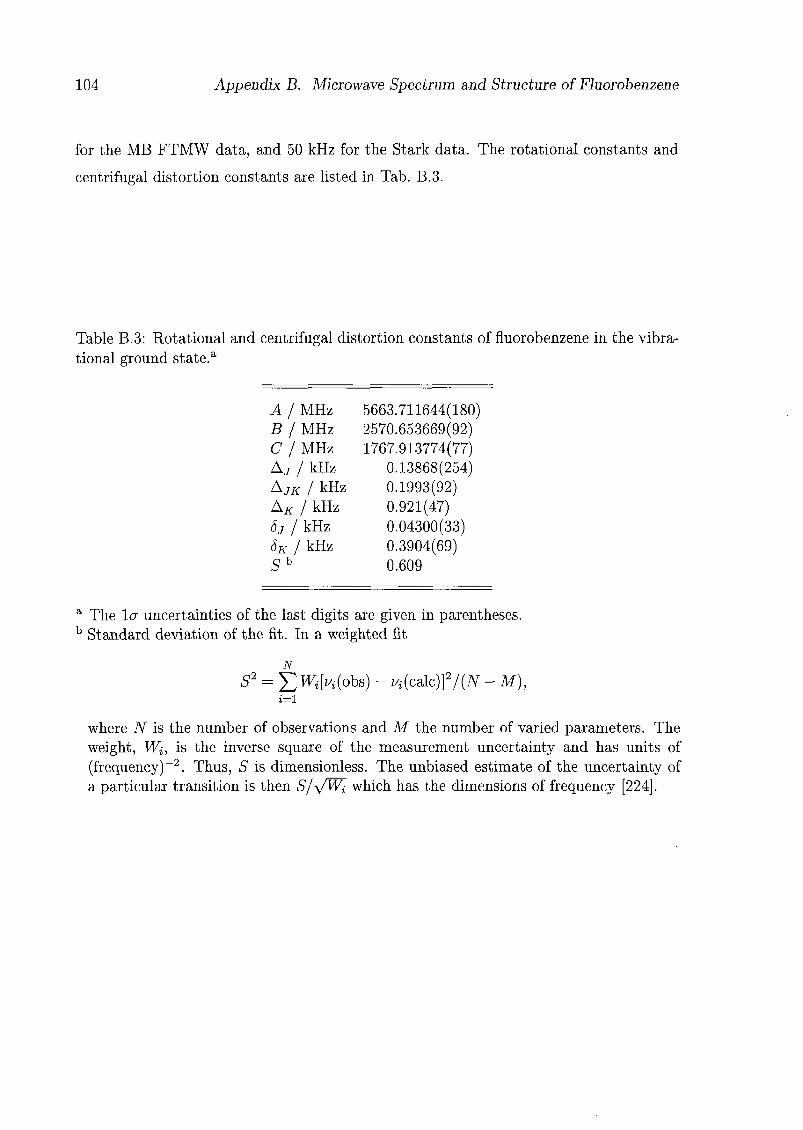
104 Appendix B. Microwave Spectrum and Structure of Fluorobenzene
for the MB FTMW data, and 50 kHz for the Stark data. The rotational constants and
centrifugal distortion constants are listed in Tab. B.3.
Table B.3: Rotational and centrifugal distortion constants of fluorobenzene in the vibra¬
tional ground state.a
A /MHz 5663.711644(180)B /MHz 2570.653669(92)C/MHz 1767.913774(77)Aj j kHz 0.13868(254)Ajk / kHz 0.1993(92)AK 1 kHz 0.921(47)5j / kHz 0.04300(33)6K j kHz 0.3904(69)Sb 0.609
a The 1er uncertainties of the last digits are given in parentheses.b Standard deviation of the fit. In a weighted fit
S2 = JtWiWi(obB) - ^(calc)]7(7V - M),i=l
where N is the number of observations and M the number of varied parameters. The
weight, Wi, is the inverse square of the measurement uncertainty and has units of
(frequency)-2. Thus, S is dimensionless. The unbiased estimate of the uncertainty of
a particular transition is then S/y/Wi which has the dimensions of frequency [224].
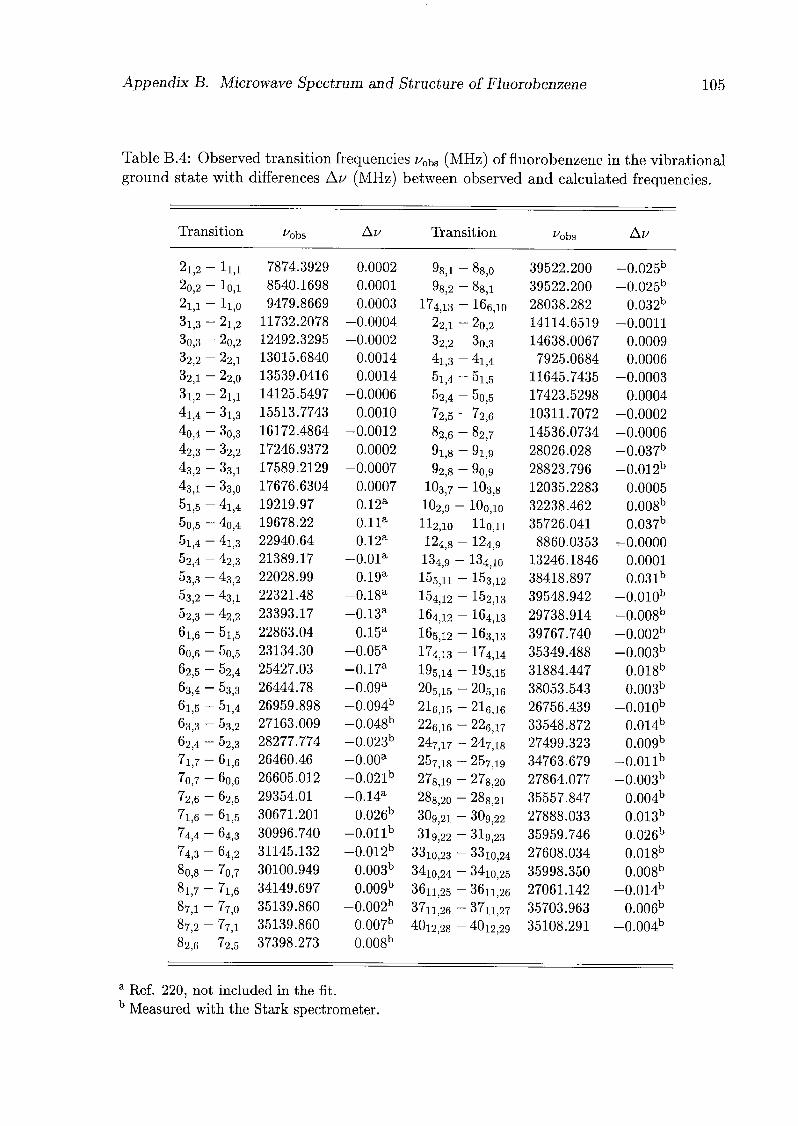
Appendix B. Microwave Spectrum and Structure of Fluorobenzene 105
Table B.4: Observed transition frequencies uohs (MHz) of fluorobenzene in the vibrational
ground state with differences Av (MHz) between observed and calculated frequencies.
Transition ^obs Au Transition ^obs Av
2i)2-- ll.l 7874.3929 0.0002 98>i-- 88,0 39522.200 -0.025b
2o,2 --lo,i 8540.1698 0.0001 98,2-- 88,1 39522.200 -0.025b
2i,i--li,o 9479.8669 0.0003 174,13 -- 166,10 28038.282 0.032b
3l,3--2i,2 11732.2078 -0.0004 22,i-- 20,2 14114.6519 -0.0011
3o,3 -- 20)2 12492.3295 -0.0002 32,2 "- 3o,3 14638.0067 0.0009
32,2 "- 22,i 13015.6840 0.0014 4i,3--4i,4 7925.0684 0.0006
32,1 -- 22,0 13539.0416 0.0014 5l,4 --5i,5 11645.7435 -0.0003
3l,2 --2i,i 14125.5497 -0.0006 52,4 "-5o,5 17423.5298 0.0004
4m--31>3 15513.7743 0.0010 ^2,5 "- 72,6 10311.7072 -0.0002
4o,4-- 3o,3 16172.4864 -0.0012 82,6 "- 82,7 14536.0734 -0.0006
42,3"- 32,2 17246.9372 0.0002 9l,8"-9i,9 28026.028 -0.037b
43,2--33>i 17589.2129 -0.0007 92,8--90,9 28823.796 -0.012b
43,1-- 33,0 17676.6304 -0.0007 103,7 --103,8 12035.2283 0.0005
5l,5 --4M 19219.97 0.12a 102,9 "- 10o,io 32238.462 0.008b
5o,5 --40,4 19678.22 0.11a 112,10 "- llo.ii 35726.041 0.037b
5l,4 --4i,3 22940.64 0.12a 124,8 "- 124,9 8860.0353 -0.0000
52,4 --42,3 21389.17 -0.01a 134,9 --134,10 13246.1846 -0.0001
53,3 --43j2 22028.99 0.19a 155,11 "-153,12 38418.897 0.031b
53,2 --43,1 22321.48 -0.18a 154,12 "- 152,13 39548.942 -0.010b
52,3 --42,2 23393.17 -0.13a 164,12 "-164,13 29738.914 -0.008b
6l,6 -- 5i,5 22863.04 0.15a 165,12 "-163,13 39767.740 -0.002b
6o,6 --5o,5 23134.30 -0.05a 174,13 -- 174,14 35349.488 -0.003b
62,5-- 52,4 25427.03 -0.17a 195,14 - 195,15 31884.447 0.018b
63,4 -- 53,3 26444.78 -0.09a 205,i5 -- 205,16 38053.543 0.003b
61,5 -- 5l,4 26959.898 -0.094b 216,15 "- 216,16 26756.439 -0.010b
63,3 -- 53,2 27163.009 -0.048b 226,16 "- 226,i7 33548.872 0.014b
62,4-- 52,3 28277.774 -0.023b 247,i7 -- 247,i8 27499.323 -0.009b
7i,r--6i,6 26460.46 -0.00a 257,18 -- 257,19 34763.679 -0.011b
7o,7 -- 60,6 26605.012 -0.021b 278,19 '- 278,20 27864.077 -0.003b
72,6 -- 62,5 29354.01 -0.14a 288,20 -- 28s,2i 35557.847 0.004b
7i,6-- 61,5 30671.201 0.026b 309,21 -- 30g,22 27888.033 0.013b
74,4 --64,3 30996.740 -0.011b 31g,22 -- 31g,23 35959.746 0.026b
74,3-- 64,2 31145.132 -0.012b 33io,23 - 33io,24 27608.034 -0.018b
80,8 -- 7o,7 30100.949 0.003b 34io,24 - 34io,25 35998.350 0.008b
81,7 --7i,6 34149.697 0.009b 36n,25 -- 36n,26 27061.142 -0.014b
87,1 -- 77,0 35139.860 -0.002b 37n,26 -- 37n,27 35703.963 0.006b
87,2 --77,1 35139.860 0.007b 40l2,28 - 40l2,29 35108.291 -0.004b
82,6 "-72,5 37398.273 0.008b
a Ref. 220, not included in the fit.
b Measured with the Stark spectrometer.

Bibliography
[1] T. R. Dyke, B. J. Howard, and W. Klemperer, J. Chem. Phys. 56, 2442 (1972).
[2] K. R. Leopold, G. T. Fraser, S. E. Novick, and W. Klemperer, Chem. Rev. 94,
1807 (1994).
[3] T. Brupbacher, J. Makarewicz, and A. Bauder, J. Chem. Phys. 101, 9736 (1994).
[4] F. L. Bettens, R. P. A. Bettens, and A. Bauder, in Jet Spectroscopy and Molecular
Dynamics, edited by J. M. Hollas and D. Phillips (Blackie Academic & Professional,
Glasgow, 1995), pp. 1-28.
[5] R. P. A. Bettens, R. M. Spycher, and A. Bauder, Mol. Phys. 86, 487 (1995).
[6] A. Bauder, in Low Temperature Spectroscopy, edited by R. Fausto (Kluwer Acad¬
emic, Dordrecht, 1996), pp. 271-289.
[7] A. Bauder, in Low Temperature Spectroscopy, edited by R. Fausto (Kluwer Acad¬
emic, Dordrecht, 1996), pp. 291-309.
[8] T. J. Balle and W. H. Flygare, Rev. Scient. Instrum. 52, 33 (1981).
[9] J. Ekkers and W. H. Flygare, Rev. Scient. Instrum. 47, 448 (1976).
[10] W. Gordy and R. L. Cook, Microwave Molecular Spectra, 3rd ed. (Inter-science/Wiley, New York, 1984).
[11] C. H. Townes and A. L. Schawlow, Microwave Spectroscopy (McGraw Hill, New
York, 1955).
[12] H. W. Kroto, Molecular Rotation Spectra (Wiley, London, 1975).
[13] E. Hirota, High-Resolution Spectroscopy of Transient Molecules (Springer,Berlin/Heidelberg, 1985).
[14] R. N. Zare, Angular Momentum (Wiley, New York, 1988).
[15] J. H. Van Vleck, Revs. Modern Phys. 23, 213 (1951).
[16] R. S. Henderson, Phys. Rev. 100, 723 (1955).
[17] R. F. Curl, Jr. and J. L. Kinsey, J. Chem. Phys. 35, 1758 (1961).
106
Bibliography 107
[18] W. T. Raynes, J. Chem. Phys. 41, 3020 (1964).
[19] H. P. Benz, A. Bauder, and H. H. Giinthard, J. Mol. Spectrosc. 21, 156 (1966).
[20] I. C. Bowater, J. M. Brown, and A. Carrington, Proc. R. Soc. London A 333, 265
(1973).
[21] T. J. Sears, Comp. Phys. Rep. 2, 1 (1984).
[22] H. M. Pickett, J. Mol. Spectrosc. 148, 371 (1991).
[23] G. Columberg, Mikrowellen-Spektroskopie T-förmiger Van der Waals Komplexe,Ph.D. thesis, Eidgenössische Technische Hochschule, Zürich, 1996.
[24] J. M. Brown, in Landolt-Börnstein. New Series: Molecular Constants, edited byK.-H. Hellwege (Springer, Berlin/Heidelberg/New York/Tokyo, 1983), Vol. II/14b,pp. 171-291.
[25] J. K. G. Watson, in Vibrational Spectra and Structure, edited by J. R. Durig (El¬sevier, Amsterdam, 1977), Vol. 6, pp. 1-89.
[26] J. A. Weil, J. R. Bolton, and J. E. Wertz, Electron Paramagnetic Resonance (Wiley,New York, 1994).
[27] J. M. Brown and T. J. Sears, J. Mol. Spectrosc. 75, 111 (1979).
[28] R. F. Curl, Jr., J. Chem. Phys. 37, 779 (1962).
[29] R. F. Curl, Jr., Mol. Phys. 9, 585 (1965).
[30] D. Papousek and M. R. Aliev, Molecular Vibrational-Rotational Spectra (Elsevier,Amsterdam/Oxford/New York, 1982).
[31] J. Makarewicz and A. Bauder, Mol. Phys. 84, 853 (1995).
[32] H. M. Pickett, J. Chem. Phys. 56, 1715 (1972).
[33] J. Makarewicz, J. Mol. Spectrosc. 176, 169 (1996).
[34] T. Brupbacher, J. Makarewicz, and A. Bauder, J. Chem. Phys. 108, 3932 (1998).
[35] S. R. Huber, Mikrowellen-Spektroskopie von N-Methylpyrrol und seinen Argon
Komplexen, Ph.D. thesis, Eidgenössische Technische Hochschule, Zürich, 1997.
[36] S. Huber, J. Makarewicz, and A. Bauder, Mol. Phys. 95, 1021 (1998).
[37] S. Jans-Bürli, Molekularstrahl-Spektrometer im MikroWellenbereich: Deuterium-
quadrupolhyperfeinaufSpaltung, Ph.D. thesis, Eidgenössische Technische Hoch¬
schule, Zürich, 1987.
[38] R. M. Spycher, Mikrowellen-Spektroskopie von Heterocyclen-Argon van der Waals
Komplexen, Ph.D. thesis, Eidgenössische Technische Hochschule, Zürich, 1993.
108 Bibliography
[39] T. A. Brupbacher, Mikrowellen-Spektroskopie von schwach polaren Benzol-van der
Waals Komplexen, Ph.D. thesis, Eidgenössische Technische Hochschule, Zürich,1994.
[40] J. C. McGurk, T. G. Schmalz, and W. H. Flygare, in Advances in Chemical Physics,edited by I. Prigogine and S. A. Rice (Wiley, New York, 1974), Vol. XXV, pp. 1-68.
[41] J. C. McGurk, H. Mäder, R. T. Hofmann, T. G. Schmalz, and W. H. Flygare, J.
Chem. Phys. 61, 3759 (1974).
[42] W. H. Flygare and T. G. Schmalz, Ace. Chem. Res. 9, 385 (1976).
[43] H. Dreizier, Mol. Phys. 59, 1 (1986).
[44] T. J. Balle, E. J. Campbell, M. R. Keenan, and W. H. Flygare, J. Chem. Phys. 72,922 (1980).
[45] E. J. Campbell, L. W. Buxton, T. J. Balle, and W. H. Flygare, J. Chem. Phys. 74,813 (1981).
[46] E. J. Campbell, L. W. Buxton, T. J. Balle, M. R. Keenan, and W. H. Flygare, J.
Chem. Phys. 74, 829 (1981).
[47] F. J. Lovas and R. D. Suenram, J. Chem. Phys. 87, 2010 (1987).
[48] E. J. Campbell, Rev. Scient. Instrum. 64, 2166 (1993).
[49] E. J. Campbell and F. J. Lovas, Rev. Scient. Instrum. 64, 2173 (1993).
[50] M. D. Harmony, K. A. Beran, D. M. Angst, and K. L. Ratzlaff, Rev. Scient. Instrum.
66, 5196 (1995).
[51] J.-U. Grabow, W. Stahl, and H. Dreizler, Rev. Scient. Instrum. 67, 4072 (1996).
[52] L. Martinache, S. Jans-Bürli, B. Vogelsanger, W. Kresa, and A. Bauder, Chem.
Phys. Lett. 149, 424 (1988).
[53] B. Brupbacher-Gatehouse and T. Brupbacher, J. Chem. Phys. 111, 6300 (1999).
[54] J.-U. Grabow and W. Stahl, Z. Naturforsch. Teil A 45, 1043 (1990).
[55] I. Merke and H. Dreizler, Z. Naturforsch. Teil A 43, 196 (1988).
[56] J. Haekel and H. Mäder, Z. Naturforsch. Teil A 43, 203 (1988).
[57] M. Oldani, Pulsed Microwave Fourier Transform Spectroscopy of Molecules
with Small Electric Dipole Moments, Ph.D. thesis, Eidgenössische Technische
Hochschule, Zürich, 1985.
[58] B. Vogelsanger, Stark-, Doppelresonanz- und zweidimensionale Korrelations-
Experimente in der Mikrowellen-Fourier-Transformations-Spektroskopie, Ph.D.
thesis, Eidgenössische Technische Hochschule, Zürich, 1988.

Bibliography 109
[59] C. F. Styger, Verbotene Spektren symmetrischer Kreisel in der Mikrowellen-
Fourier-Transformations-Spektroskopie, Ph.D. thesis, Eidgenössische Technische
Hochschule, Zürich, 1991.
[60] A. Bauder, in Vibrational Spectra and Structure, edited by J. R. Durig (Elsevier,Amsterdam/New York, 1993), Vol. 20, pp. 157-188.
[61] M. Krüger and H. Dreizler, Z. Naturforsch. Teil A 45, 724 (1990).
[62] T. Ogata, W. Jäger, I. Ozier, and M. C. L. Gerry, J. Chem. Phys. 98, 9399 (1993).
[63] K. A. Walker, T. Ogata, W. Jäger, M. C. L. Gerry, and I. Ozier, J. Chem. Phys.
106, 7519 (1997).
[64] D. Yaron, K. I. Peterson, D. Zolandz, W. Klemperer, F. J. Lovas, and R. D.
Suenram, J. Chem. Phys. 92, 7095 (1990).
[65] A. C. Legon, P. D. Soper, M. R. Keenan, T. K. Minton, T. J. Balle, and W. H.
Flygare, J. Chem. Phys. 73, 583 (1980).
[66] M. R. Keenan, T. K. Minton, A. C. Legon, T. J. Balle, and W. H. Flygare, Proc.
Natl. Acad. Sei. U.S.A. 77, 5583 (1980).
[67] P. D. Soper, A. C. Legon, and W. H. Flygare, J. Chem. Phys. 74, 2138 (1981).
[68] A. C. Legon, P. D. Soper, and W. H. Flygare, J. Chem. Phys. 74, 4944 (1981).
[69] E. J. Goodwin and A. C. Legon, Chem. Phys. 87, 81 (1984).
[70] G. T. Fraser, D. D. Nelson, Jr., K. I. Peterson, and W. Klemperer, J. Chem. Phys.84, 2472 (1986).
[71] F. J. Lovas, P. W. Fowler, Z. Kisiel, S. Tseng, R. D. Beck, D. F. Eggers, T. A.
Blake, and R. O. Watts, J. Chem. Phys. 100, 3415 (1994).
[72] A. C. Legon, A. L. Wallwork, J. W. Bevan, and Z. Wang, Chem. Phys. Lett. 180,57 (1991).
[73] F. J. Lovas, S. P. Belov, M. Y. Tretyakov, J. Ortigoso, and R. D. Suenram, J. Mol.
Spectrosc. 167, 191 (1994).
[74] T. Brupbacher and A. Bauder, J. Chem. Phys. 99, 9394 (1993).
[75] R. P. A. Bettens, S. R. Huber, and A. Bauder, J. Phys. Chem. 98, 4551 (1994).
[76] R. P. A. Bettens and A. Bauder, J. Chem. Phys. 102, 1501 (1995).
[77] S. McGlone and A. Bauder, J. Chem. Phys. 109, 5383 (1998).
[78] Y. Ohshima, H. Kohguchi, and Y. Endo, Chem. Phys. Lett. 184, 21 (1991).
[79] T. Brupbacher and A. Bauder, Chem. Phys. Lett. 173, 435 (1990).
110 Bibliography
[80] T. D. Klots, T. Emilsson, and H. S. Gutowsky, J. Chem. Phys. 97, 5335 (1992).
[81] S. G. Kukolich, J. Am. Chem. Soc. 105, 2207 (1983).
[82] R. K. Bohn, K. W. Hillig, II, and R. L. Kuczkowski, J. Phys. Chem. 93, 3456
(1989).
[83] J. J. Oh, K. W. Hillig, II, R. L. Kuczkowski, and R. K. Bohn, J. Phys. Chem. 94,
4453 (1990).
[84] T. D. Klots, T. Emilsson, R. S. Ruoff, and H. S. Gutowsky, J. Phys. Chem. 93,
1255 (1989).
[85] R. M. Spycher, P. M. King, and A. Bauder, Chem. Phys. Lett. 191, 102 (1992).
[86] R. M. Spycher, D. Petitprez, F. L. Bettens, and A. Bauder, J. Phys. Chem. 98,
11863 (1994).
[87] R. M. Spycher, L. Hausherr-Primo, G. Grassi, and A. Bauder, J. Mol. Struct. 351,
7 (1995).
[88] U. Spoerel, H. Dreizler, W. Stahl, E. Kraka, and D. Cremer, J. Phys. Chem. 100,14298 (1996).
[89] W. Stahl and J.-U. Grabow, Z. Naturforsch. Teil A 47, 681 (1992).
[90] R. A. Appleman, S. A. Peebles, and R. L. Kuczkowski, J. Mol. Struct. 446, 55
(1998).
[91] R. J. Wilson, S. A. Peebles, S. Antolïnez, M. E. Sanz, and R. L. Kuczkowski, J.
Phys. Chem. A 102, 10630 (1998).
[92] R. J. Wilson and R. L. Kuczkowski, J. Mol. Struct. 376, 1 (1996).
[93] Y. Hu, W. Lu, and S. Yang, J. Chem. Phys. 105, 5305 (1996).
[94] J.-G. Lahaye, R. Vandenhaute, and A. Fayt, J. Mol. Spectrosc. 123, 48 (1987).
[95] S. Doraiswamy and S. D. Sharma, J. Mol. Struct. 102, 81 (1983).
[96] F. J. Lovas and P. H. Krupenie, J. Phys. Chem. Ref. Data 3, 245 (1974).
[97] S. Jans-Bürli, M. Oldani, and A. Bauder, Mol. Phys. 68, 1111 (1989).
[98] J. Kraitchman, Am. J. Phys. 21, 17 (1953).
[99] P. Nösberger, A. Bauder, and H. H. Günthard, Chem. Phys. 1, 418 (1973).
[100] H. D. Rudolph, Struct. Chem. 2, 581 (1991).
[101] J. Demaison, in Structures and Conformations of Non-Rigid Molecules, edited byJ. Laane, M. Dakkouri, B. van der Veken, and H. Oberhammer (Kluwer Academic
Publishers, Dordrecht/Boston/London, 1993), pp. 239-256.

Bibliography 111
[102] H. D. Rudolph, in Advances in Molecular Structure Research, edited by M. Hargittaiand I. Hargittai (JAI Press, Greenwich, London, 1995), Vol. 1, pp. 63-114.
[103
[104
[105
[106
[107
[108
[109
[110
[111
[112
[113
[114
[115
[116
[117;
[118
[119
[120
[121
[122
J. S. Muenter, J. Mol. Spectrosc. 55, 490 (1975).
U. Spoerel and D. Consalvo, Chem. Phys. 239, 199 (1998).
H. Frei, A. Bauder, and H. H. Günthard, The Isometric Group of Nonrigid Mole¬
cules, in Topics in Current Chemistry, edited by F. L. Boschke (Springer, Berlin,
1979), Vol. 81, pp. 1-97.
G. Herzberg, Molecular Spectra and Molecular Structure. III. Electronic Spectra and
Electronic Structure of Polyatomic Molecules, reprint ed. with corrections (Krieger,Malabar, 1991).
L. Nygaard, J. T. Nielsen, J. Kirchheiner, G. Maltesen, J. Rastrup-Andersen, and
G. O. S0rensen, J. Mol. Struct. 3, 491 (1969).
C. Kang and D. W. Pratt, 54th International Symposium on Molecular Spec¬
troscopy, Ohio State University, Columbus, paper WJ12 (1999).
M. Mons and J. Le Calvé, Chem. Phys. 146, 195 (1990).
W. Kim and P. M. Felker, J. Chem. Phys. 107, 2193 (1997).
H. Koch, B. Fernandez, and J. Makarewicz, J. Chem. Phys. Ill, 198 (1999).
A. Taleb-Bendiab, K. W. Hillig, II, and R. L. Kuczkowski, J. Chem. Phys. 97, 2996
(1992).
A. Taleb-Bendiab, K. W. Hillig, II, and R. L. Kuczkowski, J. Chem. Phys. 98, 3627
(1993).
J. J. Oh, L.-W. Xu, A. Tabeb-Bendiab, K. W. Hillig, II, and R. L. Kuczkowski, J.
Mol. Spectrosc. 153, 497 (1992).
K. W. H. J. J. Oh and R. L. Kuczkowski, J. Am. Chem. Soc. 113, 7480 (1991).
E. Kraka, D. Cremer, U. Spoerel, I. Merke, W. Stahl, and H. Dreizler,J. Phys. Chem. 99, 12466 (1995).
U. Kretschmer, W. Stahl, and H. Dreizler, Z. Naturforsch. Teil A 48, 1107 (1993).
M. Mizushima, The Theory of Rotating Diatomic Molecules (Wiley, New York,
1975).
M. Tinkham and M. W. P. Strandberg, Phys. Rev. 97, 937 (1955).
M. Tinkham and M. W. P. Strandberg, Phys. Rev. 97, 951 (1955).
C. A. Long and G. E. Ewing, J. Chem. Phys. 58, 4824 (1973).
G. Henderson and G. E. Ewing, J. Chem. Phys. 59, 2280 (1973).
112 Bibliography
[123] A. van der Avoird, J. Chem. Phys. 79, 1170 (1983).
[124] J. Tennyson and J. Mettes, Chem. Phys. 76, 195 (1983).
[125] P. E. S. Wormer and A. van der Avoird, J. Chem. Phys. 81, 1929 (1984).
[126] A. van der Avoird and G. Brocks, J. Chem. Phys. 87, 5346 (1987).
[127] B. Bussery and P. E. S. Wormer, J. Chem. Phys. 99, 1230 (1993).
[128] B. Bussery, Chem. Phys. 184, 29 (1994).
[129] J. Mettes, B. Heymen, P. Verhoeve, J. Reuss, D. C. Laine, and G. Brocks, Chem.
Phys. 92, 9 (1985).
[130] S. M. Cybulski, R. Burcl, M. Szczçsniak, and G. Chalasihski, J. Chem. Phys. 104,
7997 (1996).
[131] S. M. Cybulski, R. A. Kendall, G. Chalasinski, M. W. Severson, and M. Szczesniak,J. Chem. Phys. 106, 7731 (1997).
[132] I. J. Palmer, W. B. Brown, and I. H. Hillier, J. Chem. Phys. 104, 3198 (1996).
[133] J. R. Grover, G. Hagenow, and E. A. Walters, J. Chem. Phys. 97, 628 (1992).
[134] G. DeBoer and M. A. Young, J. Chem. Phys. 106, 5468 (1997).
[135] G. Granucci and M. Persico, Chem. Phys. Lett. 205, 331 (1993).
[136] B. F. Minaev, K. V. Mikkelsen, and H. Âgren, Chem. Phys. 220, 79 (1997).
[137] T. A. Wesolowski, O. Parisel, Y. Ellinger, and J. Weber, J. Phys. Chem. A 101,
7818 (1997).
[138] H. Qian, D. Seccombe, and B. J. Howard, J. Chem. Phys. 107, 7658 (1997).
[139] B. J. Howard, private communication (1998).
[140] J. T. Hougen, private communication (1998).
[141] W. M. Fawzy and J. T. Hougen, J. Mol. Spectrosc. 137, 154 (1989).
[142] W. M. Fawzy, J. Mol. Spectrosc. 160, 84 (1993).
[143] W. M. Fawzy, J. Chem. Phys. 109, 348 (1998).
[144] W. M. Fawzy, J. Mol. Spectrosc. 191, 68 (1998).
[145] P. D. A. Mills, C. M. Western, and B. J. Howard, J. Phys. Chem. 90, 3331 (1986).
[146] H. Qian, S. J. Low, D. Seccombe, and B. J. Howard, J. Chem. Phys. 107, 7651
(1997).
Bibliography 113
[147] R. J. Low, C. J. Whitham, T. D. Varberg, and B. J. Howard, Chem. Phys. Lett.
222, 443 (1994).
[148] R. J. Low, M. D. Brookes, C. J. Whitham, and B. J. Howard, J. Chem. Phys. 105,6756 (1996).
[149] H. Dreizler, U. Andresen, J.-U. Grabow, and D. H. Sutter, Z. Naturforsch. Teil A
53, 887 (1998).
[150] C. R. Dennis, C. J. Whitham, R. J. Low, and B. J. Howard, Chem. Phys. Lett.
282, 421 (1998).
[151] C. J. Whitham, R. J. Low, and B. J. Howard, Chem. Phys. Lett. 286, 408 (1998).
[152] J. R. Morton, K. F. Preston, S. J. Strach, F. J. Adrian, and A. N. Jette, J. Chem.
Phys. 709, 2889 (1979).
[153] A. D. Buckingham and P. A. Kollman, Mol. Phys. 23, 65 (1972).
[154] I. Mills, T. Cvitas, K. Homann, N. Kallay, and K. Kuchitsu, Quantities, Units and
Symbols in Physical Chemistry, 2nd ed. (Blackwell Science, Oxford, 1993).
[155] G. M. McClelland, K. L. Saenger, J. J. Valentini, and D. R. Herschbach,J. Phys. Chem. 83, 947 (1979).
[156] A. Amirav, U. Even, and J. Jortner, Chem. Phys. 51, 31 (1980).
[157] D. R. Herschbach and V. W. Laurie, J. Chem. Phys. 40, 3142 (1964).
[158] E. D. Lipp and C J. Seliskar, J. Mol. Spectrosc. 73, 290 (1978). Note that the
notation used for Bi and B2 symmetry species is inverted with respect to that in
Ref. [159] and in the present work.
[159] D. H. Whiffen, J. Chem. Soc. 1350 (1956).
[160] H. S. Zivi, Mikrowellenspektroskopie mit Uberschallmolekularstrahlen, Ph.D. thesis,Eidgenössische Technische Hochschule, Zürich, 1982.
[161] C. Chuang and H. S. Gutowsky, J. Chem. Phys. 94, 86 (1991).
[162] F. Lorenzo, J. Grabow, and H. Dreizler, Z. Naturforsch. Teil A 51, 1091 (1996).
[163] A. Welzel, private communication (1998).
[164] J.-U. Grabow, N. Heineking, and W. Stahl, Z. Naturforsch. Teil A 46, 914 (1991).
[165] P. D. A. Mills, C. M. Western, and B. J. Howard, J. Phys. Chem. 90, 4961 (1986).
[166] Y. Ohshima, M. Iida, and Y. Endo, J. Chem. Phys. 95, 7001 (1991).
[167] Y. Endo, H. Kohguchi, and Y. Ohshima, Faraday Discuss. 97, 341 (1994).
[168] V. Vaida and J. D. Simon, Science 268, 1443 (1995).

114 Bibliography
[169] Y. Hamada, A. J. Merer, S. Michielsen, and S. A. Rice, J. Mol. Spectrosc. 86, 499
(1981).
[170
[171
[172
[173;
[174
[175;
[176
[177;
[178
[179
[180
[181
[182
[183
[184
[185
[186
[187
[188
[189
[190
[191
E. C. Richard and V. Vaida, J. Chem. Phys. 94, 153 (1993).
E. C. Richard and V. Vaida, J. Chem. Phys. 94, 163 (1993).
H. S. P. Müller and H. Willner, J. Phys. Chem. 97, 10589 (1993).
R. Flesch, B. Wassermann, B. Rothmund, and E. Rühl, J. Phys. Chem. 98, 6263
(1994).
H. F. Davis and Y. T. Lee, J. Chem. Phys. 105, 8142 (1996).
K. A. Peterson and H.-J. Werner, J. Chem. Phys. 96, 8948 (1992).
K. A. Peterson and H.-J. Werner, J. Chem. Phys. 105, 9823 (1996).
A. Furlan, H. A. Scheid, and J. R. Huber, J. Chem. Phys. 106, 6538 (1997).
J. J. Lin, D. W. Hwang, Y. T. Lee, and X. Yang, J. Chem. Phys. 108, 10061 (1998).
C.-P. Liu, L.-H. Lai, Y.-Y. Lee, S.-C. Hung, and Y. P. Lee, J. Chem. Phys. 109,978 (1998).
L.-H. Lai, C.-P. Liu, and Y. P. Lee, J. Chem. Phys. 109, 988 (1998).
J. D. Graham, J. T. Roberts, L. D. Anderson, and V. H. Grassian, J. Phys. Chem.
100, 19551 (1996).
K. Fenner, A. Furlan, and J. R. Huber, J. Phys. Chem. A 101, 5736 (1997).
C. J. Kreher, R. T. Carter, and J. R. Huber, J. Chem. Phys. 110, 3309 (1999).
C. J. Purcell, J. Conyers, and C. Denison, J. Phys. Chem. 100, 15450 (1996).
S. C. Hayes, M. P. Philpott, S. G. Mayer, and P. J. Reid, J. Phys. Chem. A 103,5534 (1999).
R. F. Curl, Jr., J. L. Kinsey, J. G. Baker, J. C. Baird, G. R. Bird, R. F. Heidelberg,T. M. Sugden, D. R. Jenkins, and C. N. Kenney, Phys. Rev. 121, 1119 (1961).
R. F. Curl, Jr., R. F. Heidelberg, and J. L. Kinsey, Phys. Rev. 125, 1993 (1962).
M. G. K. Pillai and R. F. Curl, Jr., J. Chem. Phys. 37, 2921 (1962).
W. M. Tolles, J. L. Kinsey, R. F. Curl, Jr., and R. F. Heidelberg, J. Chem. Phys.37, 927 (1962).
R. P. Mariella, Jr. and R. F. Curl, Jr., J. Chem. Phys. 52, 757 (1970).
H. Jones and J. M. Brown, J. Mol. Spectrosc. 90, 222 (1981).
Bibliography 115
[192] M. Tanoura, K. Chiba, K. Tanaka, and T. Tanaka, J. Mol. Spectrosc. 95, 157
(1982).
[193] K. Tanaka and T. Tanaka, J. Mol. Spectrosc. 98, 425 (1983).
[194] K. Miyazaki, M. Tanoura, K. Tanaka, and T. Tanaka, J. Mol. Spectrosc. 116, 435
(1986).
[195] H. S. P. Müller, G. O. S0rensen, M. Birk, and R. R. Friedl, J. Mol. Spectrosc. 186,
177 (1997).
[196] J. Ortigoso, R. Escribano, J. B. Burkholder, C. J. Howard, and W. J. Lafferty, J.
Mol. Spectrosc. 148, 346 (1991).
[197] J. Ortigoso, R. Escribano, J. B. Burkholder, and W. J. Lafferty, J. Mol. Spectrosc.
155, 25 (1992).
[198] J. Ortigoso, R. Escribano, J. B. Burkholder, and W. J. Lafferty, J. Mol. Spectrosc.
156, 89 (1992).
[199] J. Ortigoso, R. Escribano, J. B. Burkholder, and W. J. Lafferty, J. Mol. Spectrosc.
158, 347 (1993).
[200] K. A. Peterson, J. Chem. Phys. 109, 8864 (1998).
[201] F. Huber and M. Schmeisser, in Handbuch der Präparativen Anorganischen Chemie,3rd ed., edited by G. Brauer (Ferdinand Enke, Stuttgart, 1975), Vol. 1, pp. 312-314.
[202] R. L. DeLeon, A. Yokozeki, and J. S. Muenter, J. Chem. Phys. 73, 2044 (1980).
[203] J. S.-Muenter, R. L. DeLeon, and A. Yokozeki, Faraday Discuss. Chem. Soc. 73,63 (1982).
[204] L. H. Coudert, K. Matsumura, and F. J. Lovas, J. Mol. Spectrosc. 147, 46 (1991).
[205] A. K. Lewin, M. A. Walsh, and T. R. Dyke, J. Mol. Spectrosc. 151, 334 (1992).
[206] R. L. DeLeon, K. M. Mack, and J. S. Muenter, J. Chem. Phys. 71, 4487 (1979).
[207] R. S. Mulliken, Revs. Modem Phys. 14, 204 (1942).
[208] R. S. Mulliken, J. Chem. Phys. 23, 1997 (1953).
[209] C. J. Schutte, J. E. Bertie, P. R. Bunker, J. T. Hougen, L M. Mills, J. K. G.
Watson, and B. P. Winnewisser, Pure Appl. Chem. 69, 1633 (1997).
[210] G. Herzberg, Molecular Spectra and Molecular Structure. II Infrared and Raman
Spectra of Polyatomic Molecules, reprint ed. with corrections (Krieger, Malabar,
1991).
[211] E. B. Wilson, J. C. Decius, and P. C. Cross, Molecular Vibrations (McGraw Hill,New York, 1955).

116 Bibliography
[212] P. R. Bunker, Molecular Symmetry and Spectroscopy (Academic Press, New
York/San Francisco/London, 1979).
[213] T.-K. Ha, private communication.
[214] C. M0ller and M. S. Plesset, Phys. Rev. 46, 618 (1934).
[215] J. A. Pople, J. S. Binkley, and R. Seeger, Int. J. Quantum Chem. Symp. 10, 1
(1976).
[216] M. J. Frisch, J. A. Pople, and J. S. Binkley, J. Chem. Phys. 80, 3266 (1984).
[217] M. J. Frisch, G. W. Trucks, H. B. Schlegel, P. M. W. Gill, B. G. Johnson,
M. A. Robb, J. R. Cheeseman, T. Keith, G. A. Peterson, J. A. Montgomery, K.
Raghavachari, M. A. Al-Laham, V. G. Zakrzewski, J. V. Ortiz, J. B. Foresman,J. Cioslowski, B. B. Stefanov, A. Nanayakkara, M. Challacombe, C. Y. Gomperts,R. L. Martin, D. J. Fox, J. S. Binkley, D. J. Defrees, J. Baker, J. P. Stewart,M. Head-Gordon, C. Gonzalez, and J. A. Pople, GAUSSIAN 94, Revision C.3,
Gaussian Inc., Pittsburgh, 1995.
[218] A. H. Firester, Rev. Scient. Instrum. 37, 1264 (1966).
[219] B. Bak, D. Christensen, L. Hansen-Nygaard, and E. Tannenbaum, J. Chem. Phys.
26, 134 (1957).
[220] L. Nygaard, I. Bojesen, T. Pedersen, and J. Rastrup-Andersen, J. Mol. Struct. 2,
209 (1968).
[221] G. Portalone, G. Schultz, A. Domenicano, and I. Hargittai, J. Mol. Struct. 118, 53
(1984).
[222] M. Onda, H. Mukaida, and I. Yamaguchi, J. Mol. Spectrosc. 176, 146 (1996).
[223] M. Onda, K. Suga, and I. Yamaguchi, J. Mol. Struct. 193, 301 (1989).
[224] W. H. Kirchhoffand D. R. Lide, Jr., J. Mol. Spectrosc. 47, 491 (1973).
Acknowledgement
First, I would like to acknowledge my supervisor Prof. Dr. Alfred Bauder for offering
me the opportunity to do my doctoral studies in his group and for the support during
this work. His vast experience and knowledge gave me a deep insight into the matter of
rotational spectroscopy and other topics in physical chemistry.
I thank Prof. Dr. Frederic Merkt for his acceptance of the position of acting as co-
examiner, and for providing me the possibility to perform some time of flight mass spec¬
trometer experiments on clusters in his lab.
A special thank to Willi Groth for the precise mechanical work which made the
adaption of the spectrometers to new projects possible, and for the quick repair works
which kept the experiments running. Considering the electronics and microwave systems,
the same has to be said about Markus Andrist, who has also built the new setup of the
waveguide FTMW spectrometer.
Guido Grassi is acknowledged for the preparation of different chemical samples and
for the initial help in the synthesis of OCIO.
I thank PD Dr. Tae-Kyu Ha for performing the ab initio calculations, Dr. hab. Jan
Makarewicz (Uniwersytet im. Adama Mickiewicza, Poznan) for many fruitful discussions,
and Dr. Holger S. P. Müller (Universität zu Köln) for proposing the Ar-C102 study and
giving many suggestions about OCIO.
This work would not have been possible without the help of all the co-workers in
the MW group, providing also a stimulating and friendly atmosphere: Dr. Bethany
Brupbacher-Gatehouse, who is also acknowledged for critically reading the manuscript,
Dr. Thomas Brupbacher, Dr. Gieri Columberg, Dr. Sonja Huber, Dr. Shane McGlone,
Dr. Franz Müller, Dr. Dominique Priem.
Finally, I thank all the members of the Laboratorium für Physikalische Chemie who
provided an excellent infrastructure and atmosphere.
117
Curriculum Vitae
I was born in Basel on November 24, 1971. After five years at the Primarschule, four
years at the Sekundärschule and four years at the Gymnasium (Matura type B in 1990)
in Liestal, I began to study chemistry at the Universität Basel in 1991. In 1995,1 got my
diploma in chemistry with a diploma thesis on IR and UV/VIS spectroscopy of matrix
isolated molecules and molecular ions done in the research group of Prof. Dr. John P.
Maier. Subsequently, I started my doctoral studies in the group of Prof. Dr. Alfred
Bauder at the Laboratorium für Physikalische Chemie of the Eigenössische Technische
Hochschule (ETH) Zürich. During these studies, I was assistant in laboratory courses
and teaching assistant in undergraduate courses in physical chemistry.
Zürich, September 1999
118