right to food assessment philippines - fao.org · the analysis is guided by tools such as content...
TRANSCRIPT
Right to Food Assessment
Philippines
1
ExecutiveSummary
3
2

Right to Food Assessment
Philippines
ExecutiveSummary
The study was developed by APPC for Food and Agriculture Organization for the project “Developing methods and instruments to implement the right to food” funded by the Government of Germany. The study team is composed of Carlos O. Abad-Santos, Rosemarie G. Edillon, Sharon Faye A. Piza, Virgilio del os Reyes and Maria Socorro I. Diokno. The team acknowledges the valuable inputs and comments given during the Right to Food Workshop held last September 3-4, 2008 where an initial draft of this study was presented. They are also grateful to the excellent research assistance of Regina Baroma, Donna Mae Odra, Sharon Fangonon and Francis Alan Piza. The analyses, views, and opinions presented herein are those of the authors and should not be represented as those of either FAO or APPC.gr
aphi
c des
igne
r: D
anie
la V
eron
a

iiiExecutive Summary
�� Table�of�Content
� Rationale�and�Objectives� 1� Objectives Component 1: Causes of Hunger 2 Component 2: Legal Framework Assessment on the Right to Food Component 3: Assessment of Safety Nets & Social Protection Policies
and Programs 3
� � Executive�Summary 4
� � A�Profile�of�Hunger�and�Analysis�of�its�Causes 5 Underlying Causes of Hunger 9
� � Assessment�of�the�Philippine�Legal�Framework�Governing�the�Right�to�Food 12
� � Assessment�of�Safety�Nets�and�Social�Protection�Policies�and�Programs 15
� � Research�Framework 19 Definitions of hunger Causes of Hunger 20 Review of Available Data on Hunger and Related Variables 22
� � References� 25

1Executive Summary
�� Rationale�and�ObjectivesThe Government of the Philippines (GOP), through the National Anti-Poverty Commission is speeding up its efforts
to address the issue of hunger and food insecurity in the Philippines. The main avenue to consolidate all efforts against hunger and food insecurity is the Accelerated Hunger Mitigation Program (AHMP). Discussions by FAO with Philippine government officials indicate that there is a need to enhance the AHMP to ensure that interventions are appropriate and that these interventions are geared toward the population groups that need them the most.
The GOP is also a party to the International Covenant on Economic, Social and Cultural Rights (ICESCR) that obligates it to recognize the right of every Filipino to an adequate standard of living including food, clothing and housing. The covenant recognizes the fundamental right of everyone to be free from hunger. This implies enabling individuals to produce or procure adequate quantities and quality of food for an active and healthy life. This is consistent with a human rights-based approach to development that empowers individuals and civil society to participate in decision-making, to claim their rights and to demand recourse, by holding public officials and governments accountable for their programs and policies.
The entirety of Government policies and programs should build an enabling environment that ensures that individuals can feed themselves. A clear and unambiguous legal framework will provide the necessary enabling environment to ensure that legal and institutional mechanisms are in place to support efforts toward the mitigation and eventual eradication of hunger in the country. An assessment of the policy framework will reveal the extent to which policies, strategies and programs are conducive to progressively realizing the right to adequate food and whether the policy framework responds to the underlying and root causes of the non-realization of the right to adequate food.
The FAO has responded to this concern by highlighting the agenda for food security and the right to food. It has initiated efforts to examine the various issues related to food insecurity in the Philippines and to arrive at recommendations grounded on sound policy research and analysis. In line with this, it has commissioned the Asia-Pacific Policy Center to a Right to Food Assessment. The assessment will include an analysis of the anatomy of hunger in the Philippines, including the causes and socio-economic characteristics of the hungry, an assessment of the legal framework on the right to food, and a review of the government’s safety nets and social protection policies and programs related to the population’s right to adequate food.
ObjectivesThe general objective of the assessment is to provide analytical support to the Philippine Government in its efforts
to mitigate the incidence of hunger in the country and to address the underlying causes of food insecurity in the Philippines.
Specifically, the study will:
1. Identify the socio-economic characteristics of the hungry in the country;
2. Analyze the root causes of food insecurity and hunger in the Philippines;
3. Assess the legal framework on the right to food;
4. Assess the government’s safety nets and social protection programs.
Item 1 will enhance the Government’s efforts to provide direct assistance to those in need, through better design and targeting of its interventions. Items 2, 3 and 4 will inform policy and institutional reform measures to reduce hunger and improve the prospects of food security in the country.

2 Right to Food Assessment Philippines
Component�1:�Causes�of�HungerThe Voluntary Guidelines on the Progressive Realization of the Right to Adequate Food in the Context of National
Food Security (VG) emphasize that the design of policies to achieve the right to food should begin with identifying the hungry and understanding the reasons for their food insecurity.
There are currently many difficulties in identifying the hungry and analyzing the causes of hunger in the Philippines. Sufficient data to identify and characterize food insecure and vulnerable groups may not always be available or, more often, may not be adequately analyzed for this purpose.
Component 1 covers the first two items stated above. In particular,
1. Monitoring the hungry and food insecure. The status of hunger in the country, particularly the incidence of hunger and food insecurity based on various data sources. It will present comparisons between the different measures of hunger.
2. Profiling the hungry and the food insecure. A profile of the hungry and food insecure which include geographic/locational characteristics, demographic characteristics, and socio-economic characteristics. This will be important in targeting the hungry and food insecure. It is likewise an important input in the conduct of causality analysis on the causes of hunger.
3. Identifying the causes of hunger and food insecurity. The causes of hunger and food insecurity must be clearly understood by those who formulate policies and implement programs. This will be done using the extensive data sets on hunger and other related variables.
The analysis and conclusions drawn from the abovementioned sub-study areas will provide the basis for coming up with specific recommendations on the following:
1. Information and data requirements to properly identify the hungry and food insecure (including a hunger indicators survey)
2. Targeting and enhancement of the Accelerated Hunger Mitigation Program.
Component�2:�Legal�Framework�Assessment�on�the�Right�to�FoodThe Voluntary Guidelines put emphasis on strengthening the national legal framework on the right to food.
The central question in assessing of the country’s legal framework is: Does the legal framework recognize, promote and protect the right to food?
The assessment will ascertain whether legal provisions are implemented to guarantee the right to food and to what extent the legal framework of the Philippines influences (positively or negatively) the food insecurity situation of the vulnerable groups.
The following are the key areas of investigation of Component 2:
1. International Human Rights Obligations Related to the Right to Food
2. Legal Framework Analysis
3. Review of Recourse Mechanisms
4. National Human Rights Institutions
5. Awareness on the Right to Food
6. Human Rights in Crafting Laws
The legal framework assessment shall take into consideration the provisions of the Draft Guide on Legislating for the Right to Food (particularly guideline 7) prepared by the Right to Food Unit of the FAO.
The conduct of Component 2 generally employed desk research particularly in the extensive review of all relevant

3Executive Summary
international obligations and local laws, issuances and regulations (this covers constitutional rights, national laws, local laws, and customary laws) on the right to adequate food, and to what extent have they been implemented.
The analysis is guided by tools such as content assessment matrix, and PANTHER process assessment. A rider module to the second quarter SWS is used to gauge the general population awareness on the Right to Food.
Component�3:�Assessment�of�Safety�Nets�&�Social�Protection�Policies�and�ProgramsThe entirety of Government programs should build an enabling environment that ensures that individuals can feed
themselves. This would require improving long-run sustainability of food and at the same time, addressing immediate food requirements. In line with these requirements, Component 3 will focus on two main areas of concern:
1. Long run food sustainability:
• To what extent do trade policies influence the access of food of the most vulnerable?
• What is the impact of marketing and distribution policies on access to food?
• To what extent do high food prices influence the perception of hunger (relation between high food prices and SWS-survey results)
2. Immediate food requirements:
• The availability, design and implementation of safety net programs in the Philippines
Component 3 utilized both documentary research and econometric analysis to ensure a holistic approach in reviewing food sustainability issues and social protection requirements.

4 Right to Food Assessment Philippines
�� Executive�SummaryThe Government of the Philippines (GOP), through the National Anti-Poverty Commission is speeding up its
efforts to address the issue of hunger and food insecurity in the Philippines. The main avenue to consolidate all efforts against hunger and food insecurity is the Accelerated Hunger Mitigation Program (AHMP) which needs to be enhanced to ensure that interventions are appropriate and that these interventions are geared toward the population groups that need them the most.
This Right to Food Assessment is composed of three different studies. The first is an analysis of the anatomy of hunger in the Philippines, including the causes and socio-economic characteristics of the hungry; the second is an assessment of the legal framework on the right to food; and the third a review of the government’s safety nets and social protection policies and programs related to the population’s right to adequate food.
Definitions of hunger may be endogenous (qualitative based on individual perception) or more quantitative, involving calories consumed. Data from the Family Income and Expenditures Survey (FIES) and poverty statistics present an opportunity to resolve some of the limitations of both the qualitative and quantitative definitions. The estimation of the poverty line of the Philippines begins with the specification of food menus that meet the 100% RDA for energy and 80% RDA for micronutrients. Any amount less than the foodline would imply less than adequate quantity and/or quality of food. The comprehensive question sequence on income and expenditure can provide information on involuntary lack of access to food. In particular, we are interested in the income of the household, Y and its expenditure on food, F. We need to compare this against two thresholds—the poverty threshold, Pline and the food threshold, Fline. We then have the following typology:
Table�1.�Typology of Hunger
FOOD CONSUmPTiON
< Fline ≥ Fline
iNCO
mE Y < Fline Severe and chronic hunger moderate to severe hunger
Fline ≤ Y < Pline moderate hunger Slight to moderate hunger
Y ≥ Pline Slight, perhaps transitory hunger No incidence of involuntary hunger
The underlying framework in the conduct of the study is presented in Figure 1. The Right to Food implies freedom from hunger. This will be achieved only if food is available, accessible and safe. The government, as duty-bearers, has the obligation to the rights-holders, the population, to ensure freedom from hunger. Consequently, for the population segment that cannot afford food or has no access to food, the government needs to provide adequate programs and safety nets to bridge this gap. Only by identifying who the hungry are and why such has occurred can adequate responses be made to achieve freedom from hunger.
The key primary data sources on hunger are the National Nutrition Surveys (NNS); the Survey of Hunger Incidence in the Philippines (SHIP); the self-rated hunger indicator of the Social Weather Stations (SWS); and household surveys of the National Statistics Office, namely the FIES and the Annual Poverty Indicators Survey (APIS). The SHIP and SWS surveys measure qualitative hunger, while the FIES measures quantitative hunger.

5Executive Summary
Figure�1.�Framework
Right to Food
Availability
DemandSupply EconomicPhysical
AccessibilityAdequacyand Safety
Production, storage &
preparation
Freedom from hungerEntitlement to food that meets dietary requirements
�� A�Profile�of�Hunger�and�Analysis�of�its�CausesThe Philippines’ progress in hunger reduction has been slow. In 2003, the hunger index is 17.6 (from 21.8 in 1992),
almost the same level Thailand and Indonesia started with in 1992.
The following table provides the estimates of hunger incidence in 2006, according to the typology discussed earlier. Hunger incidence is 13.4% if based on adequacy of food consumption while the incidence of severe and possibly chronic hunger is 1.9%.
Table�2.�Typology of Hunger, 2006
FOOD CONSUmPTiON
< Fline ≥ Fline
iNCO
mE
Y < Fline1 9%
Severe and chronic hunger0 1%
moderate to severe hunger
Fline ≤ Y < Pline9 7%
moderate hunger15 4%
Slight to moderate hunger
Y ≥ Pline1 7%
Slight, perhaps transitory hunger71 2%
No incidence of involuntary hunger
Source: Authors’ computation base on FIES 2006.
The absolute number of the hungry is difficult to ascertain. Based on the FIES, the number of families who experienced hunger in 2006 was 2.2 million. Depending on how many members of the family went hungry, this could mean a figure between 2.2 million to 12 million.

6 Right to Food Assessment Philippines
Based on FIES, the incidence of severe hunger among households is about two percentage points lower than the figures estimated based on the SHIP and SWS. The figures from both sources of the qualitative data are similar. Over time, the quantitative measure displays a decreasing trend of severe hunger (though this change is minimal). On the other hand, the trend shown by the SWS estimate is a bit steeper.
The FIES-based measure of hunger incidence is given in the figure below for the years 2000, 2003 and 2006.
Figure�1.2.�Trends in hunger incidence
2000 2003 20060 0
3 0
6 0
9 0
12 0
15 0 14 3
9 9
2 3
2 1
11 7
8 3
2 0
1 5
13 4
9 7
1 9
1 7
Percent
Source: Authors’ computations based on various FIES rounds.
overall
slight, perhaps transitory
moderate
severe to chronic
In 2000, we estimate that 14% of households experienced hunger ranging from slight, perhaps transitory to severe and chronic hunger. The situation improved in 2003, where the hunger incidence decreased to 11.7%; although improvement in severe and chronic hunger incidence was only slight, down to 2%. In 2006, the situation worsened again; hunger incidence increased to 13.4%; moderate hunger to 9.7%. The incidence of severe and chronic hunger has actually been declining, albeit very slowly but the incidence of slight, perhaps transitory and moderate hunger have increased.
The SWS time series data, meanwhile is longer (see Figure 3).
Figure�3.�Trends in self-rated hunger
Source: Authors’ computations based on various SWS rounds.
Percent
0 0
4 0
8 0
12 0
16 0
20 0
2006Q1 Q2 Q3 Q4
2005Q1 Q2 Q3 Q4
2004Q1 Q2 Q3 Q4
2003Q1 Q2 Q3 Q4
2002Q1 Q2 Q3 Q4
2001Q1 Q2 Q3 Q4
2000Q1 Q2 Q3 Q4
1999Q1 Q2 Q3 Q4

7Executive Summary
From 1999 to 2002, the general trend shows hunger incidence increasing during the 4th, 1st and 2nd quarters, followed by a correction in the third quarter. The correction however is not adequate to bring back hunger to the same level as the previous year. Thus, the increasing trend observed over time. The pattern shifts in the latter part of 2002, where we see a downward trend over several quarters. Unfortunately we see a reversal of this trend starting 2004. There is an increasing trend of hunger incidence, but this time at a higher level.
In terms of geographical location, three Mindanao regions register the highest incidence of hunger (food consumption below the food line)—ARMM, Caraga and Western Mindanao. However, if we consider population share, the Visayas regions and Bicol region contribute at least 8% each to overall hunger. The highest incidence of severe to chronic hunger is in Western Mindanao, while ARMM is highest in slight to moderate hunger. On the other hand, the National Capital Region and its surrounding regions (Central Luzon and CALABARZON) have the least incidence, followed by Cagayan Valley.
Table�3.�Hunger incidence by household size and composition
NUmbER OVERALL NUmbER OVERALL
Household size Young dependents
one to two 3 7 none 5 3
three to four 6 4 one to two 9 8
five to six 15 3 three to four 22 3
seven to eight 28 8 five to six 45 3
nine or more 37 4 seven or more 56 3
Source: Authors’ computations based on FIES.
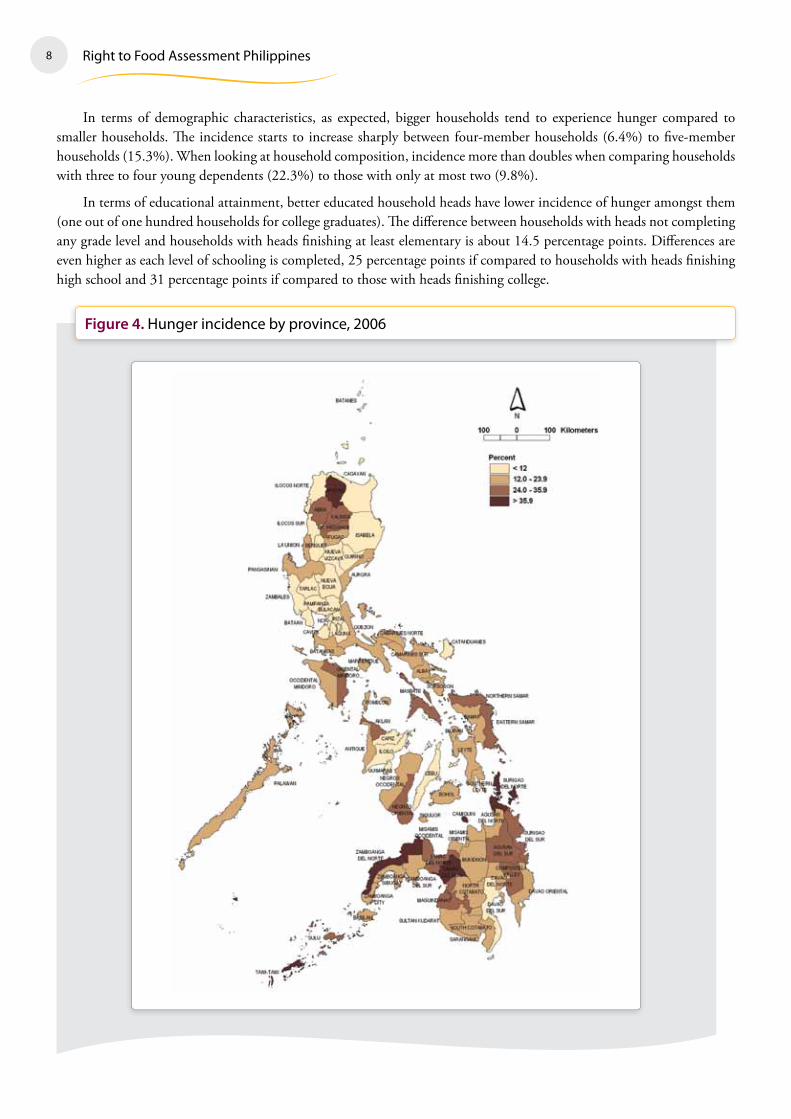
Looking at provinces, hunger incidence is highest in Tawi-Tawi and Zamboanga del Norte; most cases are of moderate hunger in the former and severe to chronic in the latter. Figure 4 shows that the other provinces with high hunger incidence are mostly found in Mindanao (Camiguin, Surigao del Norte, Lanao del Sur, Maguindanao and Misamis Occidental). Davao del Sur is the only province with less than 12% hunger incidence. Moreover, landlocked provinces (e.g., CAR provinces) as well as provinces located along the typhoon belt (e.g., Bicol and Eastern Visayas provinces) register higher incidence figures. Provinces where major cities are situated have lower incidence.
Table�4.�Hunger incidence by characteristics of household head, 2006
CHARACTERiSTiC OVERALL CHARACTERiSTiC OVERALL
Age Educational attainment
15-24 7 6 No grade completed 32 5
25-35 11 5 Elementary Undergraduate 23 8
36-50 16 4 Elementary Graduate 18 0
51-65 12 8 High School Undergraduate 13 6
65 and above 10 2 High School Graduate 7 6
Gender College Undergraduate 4 0
male 14 6 College Graduate 1 1
Female 9 0
Source: Authors’ computations based on FIES.
8 Right to Food Assessment Philippines
In terms of demographic characteristics, as expected, bigger households tend to experience hunger compared to smaller households. The incidence starts to increase sharply between four-member households (6.4%) to five-member households (15.3%). When looking at household composition, incidence more than doubles when comparing households with three to four young dependents (22.3%) to those with only at most two (9.8%).
In terms of educational attainment, better educated household heads have lower incidence of hunger amongst them (one out of one hundred households for college graduates). The difference between households with heads not completing any grade level and households with heads finishing at least elementary is about 14.5 percentage points. Differences are even higher as each level of schooling is completed, 25 percentage points if compared to households with heads finishing high school and 31 percentage points if compared to those with heads finishing college.
Figure�4.�Hunger incidence by province, 2006

9Executive Summary
In terms of economic characteristics, incidence of hunger is highest among agriculture workers, followed by those in construction and mining. Hunger is also highest among the self-employed class of worker and lowest for those working in the government. About thirty-five percent of households belonging to the poorest quintile experienced hunger compared to less than one percent incidence in the richest quintile. Incidence of transitory hunger is highest at the middle income quintile. Among households who experienced hunger, fifty-three percent belong to the bottom quintile. If the bottom forty percent households are considered, they account for about 82.7% of the total hunger incidence and 99.8% of sever to chronic hunger incidence.
Table�5.�Hunger incidence by economic characteristics, 2006
CHARACTERiSTiC OVERALL CHARACTERiSTiC OVERALL CHARACTERiSTiC OVERALL
Sector of employment Class of worker income quintile
Agriculture 24 6Works for Private
Household12 8 1st - poorest 34 9
mining & Quarrying 22 2Works for Private Establishments
12 2 2nd 20 3
manufacturing 7 5Works for Gov't/
Gov't Corporation5 8 3rd 8 7
Electricity, Gas and Water
1 8 Self Employed 19 6 4th 2 4
Construction 12 1 Employer 10 5 5th - richest 0 6
Wholesale & Retail Trade
7 4With Pay
(family operated)13 3
Transportation & Telecommunications
7 7Without Pay
(family operated)10 7
Finance 2 4
Services 6 8
Source: Authors’ computations based on FIES.
Underlying�Causes�of�HungerThe analytical framework for investigating the underlying causes of hunger starts with looking into the differences between
the official definition of the hungry and the definition of the subsistence poor, leading to the typology described earlier. Based on the framework, a model was developed that includes indicators of income, relative prices, preferences and vulnerability. Variables included in the analysis are family characteristics, employment characteristics, price volatility, structural factors.
Comparing the hungry and the non-hungry. For household characteristics, large families and those with high dependency ratios are more likely to go hungry. The age of the spouse is also significant, but not the age of the household head. The impact of age of the spouse is nonlinear in that the probability of being hungry increases with age until age 42, then decreases thereafter. This could be indicative of the wealth of the household which is expected to build up after a number of years of productive employment. Families with educated parents are less likely to be hungry.
A family whose head has been working for different employers over a period of 3 months is more likely to go hungry. A contractual worker, even if less than one year, is 15% less likely to hungry. If the household head works under a longer-term contract (at least one year), the likelihood is reduced by 33%.
Sector of employment affects the likelihood of going hungry. The more members there are in the family working in agriculture, the higher this likelihood. Workers in agriculture are paid low returns for their labor and are subject to many and varied shocks. On the other hand, we find that households with the most number of workers in the finance sector are the least likely to go hungry.

10 Right to Food Assessment Philippines
High levels of overall inflation increase the likelihood of going hungry. Interestingly, high levels of inflation and volatility in the price of rice reduces the likelihood of going hungry, ceteris paribus. Given two provinces with the same level of general inflation, the province with lower food inflation will host the higher incidence of the hungry. Note that the price situation is such that inflation of nonfood prices in the province with lower food inflation is higher. A number of these items are regular expenditures like tuition fees, house rental, utilities; hence the family will absorb the higher price and probably scrimp on food consumption if there is no savings. In contrast, in the other province, it may be the case that the higher food price has translated into higher returns for the producers of food—agriculture workers. This then leads to lower incidence of hunger.
The above result should be taken with a grain of salt. Recall that the data on which this is based only covers the years 2003 and 2006, when there was no incident of hyperinflation in food. It may very well be the case that the impact of relative prices on the incidence of hunger is nonlinear, where it becomes positive at very high levels of food inflation, given a high level of general inflation.
In terms of structural factors, residence in a rich province or having a rich neighboring province reduces the probability of suffering from hunger. Provinces with a high proportion of agricultural households, other factors remaining the same, also have lower incidence of hunger. These findings, taken together, support our earlier discussion where the province could be enjoying extensive trade and market infrastructure. Being adjacent to food supply further reduces transport and marketing costs.
Some regions also exhibit higher probability of being hungry (compared against Region 12): Ilocos, MIMAROPA, Western and Northern Mindanao, CAR, ARMM and CARAGA. On the other hand, we observe lower probability in the following regions: Cagayan Valley, Central Luzon, Central Visayas and NCR.
Comparing the Hungry Poor vs. Non-Hungry Poor. Here, we consider only the poor and try to determine the factors that differentiate the hungry poor from the non-hungry poor. We expect these variables to reflect differences in preferences, relative prices and vulnerability to shocks.
The hungry poor has a bigger family size, although there is no significant difference with respect to dependency ratio compared against the non-hungry poor. The spouse is also much younger than 46 years old. Most probably, the parents have not received any formal education at all since even a few years in elementary would have reduced significantly the probability of going hungry.
Families who are more likely to go hungry are those with many members engaged in agriculture, mining and services. Note that the latter sectors do not appear in the previous model. Since the subsample is only the poor, workers in these sectors are probably informal workers. If the head of household is employed in a private household and the spouse is employed in a private establishment, the higher the likelihood of going hungry. On the other hand, having a permanent job or being employed by a single employer reduces the probability of being hungry.
The family with the higher proportion of bought rice is less likely to be hungry. Other things remaining the same, this variable could be capturing the extent of market participation of the household. Even if the household is agricultural, it could be that they do not plant rice for subsistence.
The impact of relative price movements is the same as above—higher general inflation increases the likelihood of going hungry, while higher inflation in the price of rice and higher variability reduces this likelihood.
A province with high income inequality is more likely to have more of the hungry poor. Although being in a rich province or adjacent to one reduces this probability. This means that the advantages of a good trade and marketing infrastructure remain, but the poor is bound to be marginalized even more if there is severe inequality in the province.
Some regions appear to host a higher proportion of the hungry poor (compared to region 12, SOCCSKSARGEN): MIMAROPA, Western and Northern Mindanao, Davao region, ARMM and CARAGA. In contrast, a lower proportion of the hungry poor is observed in Cagayan Valley, Central Luzon and NCR.
Comparing the Hungry Nonpoor vs. Non-Hungry Nonpoor. Among the nonpoor, there are the hungry and non-hungry. In the following model, we seek to explain the distinction. Perhaps there is some level of income that makes

11Executive Summary
the household still vulnerable, despite being able to earn above the poverty line. We then expect factors that reflect differences in coping ability towards shocks and even differences in preferences to figure prominently in the model.
The nonpoor with a bigger family size is more likely to go hungry, ceteris paribus. The other characteristics do not significantly differ—dependency ratio, age of household head and spouse. Education of parents does matter. The family whose parents have some college education is less likely to go hungry.
A nonpoor family whose head is employed in a private household is more likely to go hungry. In contrast, someone who is self-employed but with at least one employee is less likely to go hungry. Note that the latter category implies that the family business is able to generate surplus enough to employ others.
Tenure of employment cannot discriminate between the two groups, but sector of employment does. Agricultural and mining households are more likely to go hungry, although they are nonpoor. The feature that could be increasing their likelihood of going hungry is their vulnerability to shocks—higher probability of occurrence and less ability to cope with the shock. In contrast, a family with more members working in the financial sector is less likely to go hungry.
Similar to previous results, high overall inflation increases probability of being hungry. However, given two households residing in two provinces with the same inflation rate, but with different rice price inflation rates, the one living in the province with the higher rice price inflation rate is less likely to go hungry. This demonstrates the more adverse effect of nonfood inflation especially among the nonpoor households where a lot of these expenditures cannot be immediately reduced.
The impact of inequality is different from the previous results. It is nonlinear, where a higher level of inequality reduces the probability that a nonpoor household would go hungry; but at very high levels of inequality (representing about 2/3 of provinces) the probability then increases. It could mean that in low-inequality provinces, the threshold income in order not to go hungry is much lower. In contrast, in high-inequality provinces, this threshold income is much higher.
Comparing the Hungry Poor vs. Hungry Non-Poor. For completeness, we also compare the hungry poor against the hungry non-poor. In this case, we are more interested in commonalities rather than differences (which is really their incomes).
The model, in a way, supports earlier findings. We find that both types of families have the same age profile of parents. They would also have either very low education or have reached college but did not finish. Both families would have many working members engaged in agriculture or mining. They also face the same levels of general and rice price inflation. They also reside in provinces with almost the same proportion of agricultural households.
What do these all mean in terms of policy? Residing in a rich province or near one reduces the probability of going hungry. If there is a neighboring agricultural province, then so much the better. This should guide the development of regional urban centers that is strategically linked to the periphery. The objective is to stimulate trade and market linkages.
High inflation increases the vulnerability of households to hunger. In particular, high price of nonfood items relative to food implies that the terms of trade is against the producers of food. This means a lower return to agricultural labor; at the same time they will need to shell out more money to meet their nonfood needs. This is true even among the nonpoor, perhaps because a number of these nonfood spending have become “necessary conveniences.”
Households with parents who are younger and are less educated are also more likely to go hungry. Perhaps this reflects the low level of wealth build-up of these households, and therefore, their inability to cope with shocks. This supports the cash for work programs of government. In addition, saving should be encouraged.
Again, we should not forget that hyperinflation in food could also produce disastrous results. If the agricultural sector is not able to respond to the high prices by producing more, perhaps due to high input costs, then both agriculture and non-agriculture sectors suffer. What this means that agricultural productivity programs should still be pursued. The objective is not to enable each household to produce its own food, but for the agriculture sector to produce surplus enough to trade with the domestic market and even the rest of the world.

12 Right to Food Assessment Philippines
If the working members of the household are employed in agriculture, mining, and certain types of trade activities, then the more likely that the household will go hungry. These sectors are confronted with volatility in output. Moreover, many of these are informal sector workers and therefore have poor access to social protection mechanisms. If the working member is employed by a single employer either for the long term or under a short term contract, then the likelihood of going hungry is reduced.Anti-hunger programs should improve access to social protection mechanisms.
Large households are more likely to go hungry. The likelihood increases if, in addition, the dependency ratio is high. Therefore, population management programs should be paramount in addressing the problem of hunger.
�� Assessment�of�the�Philippine�Legal�Framework�Governing�the�Right�to�FoodThis study assessed the Philippine legal framework governing the right to food to determine the extent to which
it influences the hunger situation in the country and contributes to the progressive realization of the right to food. It evaluated the 1987 Constitution, 47 Philippine laws and related jurisprudence that focus on normative entitlements to food (see Schematic Diagram on Figure 5), and the law-making process involved in 37 laws.
At the outset it is important to point out that those most vulnerable to hunger often rely on the informal or underground economy to secure food and/or the means to procure food. Yet the informal or underground economy remains largely unregulated and hidden from the legal framework. This is a major limitation of the study.

13Executive Summary
Figure�1.�Framework
The Right to Food ENTiTLEmENT TO FOOD that meets dietary needs, free from adverse
substances, culturally acceptable, in large enough quantities, physically and economically accessible, and with
sustainable supply for present and future generations
FREEDOmFROm HUNGER
FOOD AVAiLAbiLiTYin quantity and
quality sufficient to meet dietary needs
of individuals
– Land Productivity
– Technology, Research and Extension
budget
– infrastructure
– Access to Credit
– Taxation
– Population Growth
– Consumption Patterns
Culture
– Domestic market
– External Environment
– Access to land and security of land tenure
– Access to agricultural inputs
– Access to farm equipment and pre- and post-harvest facilities
budget
– Access to Credit
– Health status of farmers
– Extent of peoples’ participation
– Take steps to maximum of available resource to achieve progressively full realization of right to food by all appropriate means
– Ensure freedom from hunger
– Ensure de facto and de jure equality and nondiscrimination
– Obligations of international cooperation and assistance
– Specific legal obligations
– Regulation
– monitoring
– Environmental Hygiene and Sanitation
– Preparation and Production Processes
– investment
– Taxation
– Sale, Advertising, marketing Food Products
– Family Consumption Patterns
–
–
–
– Respect
– Protect
– Fulfill
– independence of Judiciary
– Regulatory Framework
– institutional Capacity
– Capacity of Public Officials
– Weather
– international market
– Weather
– international market
– Availability
– Price
– Quality
ObLiGATiONS arising from right to food
FOOD ADEQUACY AND SAFETY,
free from adverse substances and
culturally acceptable
FOOD ACCESSibiLiTY in ways that are
sustainable and do not interfere with
other rights
– Transportation
budget
– infrastructure
– External Environment
Food Physical Accessibility
– Weather
– income
– Prices
Food Economic Accessibility
– Health
– Education
– Employment
– Total Food Supply
– Transport Costs
– Production Costs
– Taxation
– Credit
– Degree of market integration
– marketing
– infrastructure
budget
– Access to Credit
– Taxation
– Family Consumption Pattern
– Access to and availability of information on food and nutrition
– External Environment
– bargaining Power
– Wages
– infrastructure
– incentives
– Transparency
– Accountability
– independence of Judiciary
– Family Size
– Culture
14 Right to Food Assessment Philippines
There is also a lack of availability of and access to official documents, such as, for instance, Statements of Assets, Liabilities and Net Worth of legislators, statistics of the Commission on Human Rights, and congressional deliberations on some food laws. Another limitation of the study is its inability to assess the extent of implementation of those laws that are vested in local government units.
While an analysis of the 2007 national budget forms part of this study, it is important to recognize that national government expenditures that are sourced from foreign loans or grants are not included in the analysis, primarily because of insufficient data reflected in the budget. The assessment of the degree to which human rights principles were incorporated into law-making is limited to the law making process at the House of Representatives and to laws passed after the adoption of the 1987 Constitution.
This component is divided into five parts: Part 1 describes international human rights obligations related to the right to food and their applicability to the Philippines. Part 2 assesses the Philippine legal framework, including the 1987 Constitution and relevant laws that affect food availability, physical accessibility, economic accessibility and safety; it also looks at the extent to which laws are implemented and includes an analysis of the impact of the 2007 national budget on the right to food. Part 3 discusses available legal remedies for violations of Philippine laws. Part 4 assesses the mandate and activities of national human rights institutions (Office of the Ombudsman and Commission on Human Rights) related to the right to food. Part 5 looks at the extent to which human rights were incorporated in law making. Lastly, Part 6 looks at the awareness of government agencies and the public on state obligations in the right to food.
The study found:
• The 1987 Constitution does not explicitly recognize the right to food but it may be inferred from various human rights provisions and from the constitutional intent to address mass poverty.
• The food legal framework does not enhance physical access to food, especially by those most vulnerable to hunger while the laws on availability need to be harmonized.
• The 3 laws governing food prices do not significantly contribute to hunger mitigation.
• Income related laws (i.e., those on wages, employment and income generating opportunities) influence the hunger situation in a variety of ways, both good and bad. The 6 laws governing wages and employment are generally unfavorable to workers, while the other 6 laws relating to income generating opportunities are generally flawed.
• The 3 laws governing access to credit influence the hunger situation in limited ways since they do not actually enlarge access to credit.
• Special laws and regulations for those most vulnerable to hunger or in special situations (i.e., children, the elderly, persons with disabilities and persons with HIV/AIDS) both positively and negatively influence the hunger situation of these special groups.
• 9 food safety laws fully recognize the notion of safe food that meets dietary needs; while these laws may not directly contribute to alleviating hunger, these laws nonetheless ensure that food available for consumption contains enough nutritive values and is free from contaminants and other microorganisms.
• 5 laws set food safety standards to regulate the food industry, and designate the Bureau of Food and Drugs, the National Meat Inspection Service, and local government officials to ensure food safety.
• The one law that deals with sanitation devolves authority over sanitary inspections and prosecutions to local government units.
• The food legal framework does not sufficiently address human rights obligations arising from the right to food.
• The food legal framework falls short of the Voluntary Guidelines to Support the Realization of the Right to Adequate Food in the Context of Food Security.
• The right to food is among the country’s lowest priority areas for national spending, while debt service interest payments constitute the second largest share of the 2007 national budget.

15Executive Summary
• The country’s national human rights institutions contribute very little—if at all—to address the hunger situation in the country, and vindicate breaches of the right to food.
• In general, the law making process fails to meet human rights principles.
• Government agencies are still largely unaware of their obligations related to the right to food.
• A national survey found that awareness and perception among the public regarding their right to food varies by income class and educational attainment.
The study recommends:
1. Passage of the law that will stabilize the agrarian reform program;
2. Amending the Price Act by clearly defining “illegal acts of price manipulation” and setting objective standards to allow the operation and enforcement of the law;
3. Repealing Article 130 of the Labor Code prohibiting night work for women;
4. Amending RA 8187 (Paternity Leave Act of 1996), which amended Article 133 of the Labor Code, by including common-law spouses-employees and live-in partners-employees, in addition to married male employees;
5. Reconsidering the one year ban on granting minimum wage increases;
6. Formulating clear standards to better guide employers when adjusting wages of house helpers;
7. Amending RA 7658 on the employment of children below the age of 15, by including provisions guaranteeing the working child’s right to food and stipulating strict guidelines on the management of the child’s income;
8. Reconciling contradictory implications on food availability and food accessibility of RA 7809 (High Value Crops Development Act);
9. Amending RA 7277 (Magna Carta for Disabled Persons) by guaranteeing the right to food of persons with disabilities, and reconsidering the hiring requirements to include regular positions;
10. Incorporating temporary special measures in all appropriate laws to address the inherent disadvantages women face in the grant of titles, leasehold agreements, credit, microfinance, access to pre- and post-harvest facilities, marketing, technology transfer, capital, fishing gear or equipment, etc.; require information targeting addressed to women; include women in various councils and boards created to address hunger; and ensure that gender-based decision making and gender division of labor in food production, preparation, distribution and consumption are referenced into all laws.
11. Setting aside the provision in the Rules and Regulations on Children in Situations of Armed Conflict limiting the delivery of goods, including food, to areas of conflict;
12. Amending the law on persons with HIV/AIDS by expressly guaranteeing their right to food;
13. Enacting an organic law strengthening the mandate of the Commission on Human Rights.
�� Assessment� of� Safety� Nets� and� Social� Protection� Policies��and�ProgramsSocial protection consists of mechanisms to protect individuals and families against shocks and/or the adverse
consequences of shocks. These shocks are events (external or internal to the household) that can adversely impact on families and individuals but, unfortunately, cannot be predicted with certainty. Protection mechanisms are intended to mitigate the risks and/or cushion the impact, in case the shock occurs. Acquisition of insurance to protect against shocks should be encouraged but for those who cannot afford it, government should provide enabling conditions for their social protection. Protection of every individual’s right to food is of paramount importance, not only because it is a basic human right, but because prolonged food deprivation will reduce the capability of the individual to live a productive life.
16 Right to Food Assessment Philippines
The design of a social protection mechanism should begin with identifying the shocks that will most likely confront the individual/family, particularly the poor. In the 2004 Annual Poverty Indicators Survey, the major reason respondents felt worse off was “high food prices” followed by “lower income.” Risk factors for future shocks include the sector (e.g., agriculture has the greatest number of poor) and tenure of employment of family members in the different income deciles. Life-cycle factors, such as the age profile among poorer families where heads of households and their spouses are younger and who also have more family members, should also be considered. Natural disasters most probably affect food availability, accessibility and safety. Man-made disasters probably constrain economic access to food. In general, shocks most likely to be faced by the poor are: (a) poor health, illness, injury, (b) labor market shocks, (c) calamities both natural and man-made, (d) food price shocks.
The Philippines has several laws and statutes promoting social protection, particularly in the aspects of health and work security; it also has all the requisite forms of protection according to Ortiz (2002). The 1987 Constitution gives priority to the health needs of the “under-privileged, sick, elderly, disabled, women and children” and the Labor Code regulates employer-employee relationships.
The viability of a social insurance rests on the spread of its clientele to ensure that there is no co-variation in risks. Its effectiveness, meanwhile, is the extent to which the most disadvantaged, excepting moral hazard problems, are covered.
Overall, less than half of families have health insurance coverage. Among the poor, the proportion is less than 1 in 3, while among the rich, it is 3 in 4. The PhilHealth Indigent Program is part of the National Health Insurance Act of 1995 and is for the underprivileged, sick, elderly, disabled, women and children. The policy premium of the indigent beneficiary is paid for by other sources. It addresses part of the direct cost of hospital treatment and the costs of some drugs, medicines, x-rays, laboratory procedures and others. In some cases, outpatient benefits are provided as well. A previous study by Edillon (2008) finds inefficiencies in the system: instability of fund sources, a leakage rate estimated to be 2 million beneficiaries and an undercoverage rate estimated to be 72% in 2004, and underutilization by the poor. The low utilization rate by the poor is due to difficulty in their access to hospitals. The viability of the PHIP can be improved by promoting the Individual Paying Program (IPP) which targets those employed in the informal sector. Presently, they make up only about 15% of membership.
Social Security provides security to its members during times of sickness, disability, retirement, death or even times when lump sum cash is needed. The fund is administered by the SSS for private sector members and GSIS for government sector members. It is not easy to estimate the extent of undercoverage. Computations imply undercoverage of at least 45%. The number of employers enrolled with SSS is only 780,000. This is only 52% of the estimated number of employers. GSIS, meanwhile, reports a membership of 1.3 million in 2006 and about 140,000 availing of the optional life insurance. We also know from APIS 2004 that only 10% of government employees belong to the bottom 30%.
There are 2,161 registered NGOs with the DSWD as of September 2007. Almost 40% of these provide livelihood assistance. Only 89 provide credit and saving services, and only 3 implement an insurance mechanism. About 1 in every 10 conducts supplementary feeding activities. More than 45% claim that their clientele are the poor and depressed communities. The distribution by region seems to follow the population distribution and not the number of the poor in the region. It seems that a number of the poor are not be covered by NGO operations.
While there are only a few programs listed that are meant to address man-made and natural disasters, these have been quite effective in the past. There is an elaborate disaster response protocol through the Disaster Coordination Council constituted at the national, regional, provincial and down to the municipal level. Reasons for the protocol’s success may include the high level of visibility and the clarity of focus of the relief operation. The geographical area affected and the needs are easily identified. Even NGOs can be mobilized to provide relief.
Agriculture contributes 20% to national output and employs about one-third of workers. Roughly one in every 4 families depend on agriculture for livelihood so it is very likely that domestic terms of trade will be in favor of the non-agriculture sector. Also, population distribution by region does not vary with the distribution of agricultural land. Unfortunately, only the NCR regions can absorb surplus agricultural produce and therefore farmers can only be price-takers. Moreover, inefficient market structure increases the cost of transport, distribution and marketing of agricultural produce.

17Executive Summary
There are no restrictions to domestic trade except perhaps during times of crisis or calamity. International trade in food and agricultural inputs is regulated by the Department of Agriculture to ensure food safety and protect local producers from unfair competition.
The National Food Authority (NFA) has sole authority over the international trade in rice and corn. The NFA monitors prevailing world prices to serve as guide in setting the budget and evaluating international bids. It also implements a price support program for rice farmers. The NFA Rice Procurement Program seems to lack correlation between production and procurement volumes although the available data is inconclusive. Lack of frequently collected data on production, procurement and prices means the effectiveness of the NFA’s domestic procurement program cannot be measured. Very poor farmers do not avail of the service but may benefit indirectly from the price benchmark set by the NFA. A consumer price subsidy program exists in the form of rolling stores and also through the sale of NFA rice in stalls. The latter is probably the source of most leakage of the subsidy program. The NFA also partners with the DepEd and the DSWD in implementing supplementary feeding programs. The Food for School Program (FSP) in 2006 targeted provinces with the highest incidence of self-rated hunger based on the Survey of Hunger Incidence in the Philippines (SHIP). In 2007, target provinces were based on the FIES and priority municipalities identified with small area estimates.
Two other intervention programs are the Cash/Food for Work Project and Conditional Cash Transfer (CCT). The former provides temporary employment to distressed or displaced individuals. Beneficiaries are paid in food packs or cash. The CCT program, known as the 4P, targets the extreme poor and is implemented by the DSWD that gives cash grants in exchange for availment of health care and education services. Compliance with requirements and availment of the grant, if targeting is done correctly, may be too high for the target beneficiaries.
The Accelerated Hunger Mitigation Program was launched at the start of 2007 in answer to an upward trend in self-reported hunger incidence and is implemented in 42 priority provinces that rated highest in the SWS questions on self-rated hunger. Its supply side strategy is to increase food production and enhance the efficiency of logistics and food delivery. The demand side components are to put more money in poor people’s pockets (training, microfinance, upland land distribution), promote good nutrition by educating people on the right kinds of food for proper nutrition, and manage population. The AHMP is directed by the National Nutrition Council. The other agencies involved are the DA, DENR, NIA, NFA, DSWD, DTC, PPA, DPWH, DAR, DILG, DepEd, PhilCoA, MMDA, TESDA, DOLE, LGUs, CHED, PopCom, NAPC, DOH, and the Microfinance Program Committee. Most of the AHMP components appear to correspond with the mandate of the agencies.
When the food crisis struck in 2008, the AHMP could not be mobilized to respond. The institutional arrangements are simply too cumbersome and the interventions could not be expected to produce immediate results. Because the AHMP is meant to be area-focused, an efficient delivery mechanism should be decentralized. Since the LGUs are also implementers of some components, this could mean coordination problems for the national agencies and/or additional burden for the LGUs. Moreover, national line government agencies also have their original mandate to fulfill, therefore their program strategic areas many not coincide with the AHMP priority provinces.
Examination of the AHMP interventions reveals that they do address the underlying and root causes of hunger, except for a major factor—shocks. As such, the program falls short of becoming a social protection mechanism.
To enhance the effectiveness of AHMP, the NNC should utilize its decentralized structure for all phases from analysis to M&E. The Nutrition Committee at all levels should be activated as steering committees of AHMP. The LGUs should be given a prominent role and the private sector should also be involved. Most importantly, principles of good governance should be observed: participation of interest groups, accountability, non-discrimination, transparency, human dignity, empowerment, and rule of law.
Interventions should also be categorized into macro and micro, with the appropriate lines of responsibility. There should be a decentralized assessment of vulnerabilities as well as the existing institutions to address them. Then social protection mechanisms should be included in the package of interventions including the nonpoor in its design. Risk mitigation mechanisms and savings mobilization and credit programs are also necessary.
In order to support the decentralized implementation of the AHMP, there should be data available at such levels of

18 Right to Food Assessment Philippines
disaggregation. It may not be necessary for national statistical agencies to conduct the data collection, but there should be proper training of local statistics personnel. Meanwhile, official surveys can include a special module that can be used to evaluate impact of the program later on. This will ascribe importance to the program and impose accountability.
It is also important to devise a response protocol to a food price shock. This will necessarily be short-term, but immediate. There are research and operational issues involved. Edillon (2008) identifies some of the research agenda—definition of hunger, development of an early warning system, definition of a “food crisis”, determination of the transmission mechanism, and resolving the tradeoffs between short-term interventions and longer term repercussions.
Strategies to protect the right to food go beyond food supply and income support, although these are necessary. They should include social protection strategies—those that mitigate the risks and/or cushion the impact of shocks if and when they occur. While we have all the necessary components for social protection, these have not been able to reach the most vulnerable. On the other hand, the program that is meant to reach the poorest, i.e., the most vulnerable, do not contain social protection mechanisms. The solution, therefore, is within reach.

19Executive Summary
�� Research�Framework
Definitions�of�hunger�The definition of hunger has been evolving. There are definitions that rely on self-assessment. In this paper, we will
refer to this as qualitative measure, as in:
“Hunger is the body’s way of signalling that it is running short of food and needs to eat something. It can lead to undernutrition, although it is only one of many causes, including diarrhoea, malaria and HIV/AIDS.”
– Progress for children, UNICEF
“The uneasy or painful sensation caused by a lack of food”“The recurrent and involuntary lack of access to food”
– Anderson, 1990
If hunger is defined as in above, we may say that the question as phrased by Social Weather Stations would suffice as indicator. This indicator is easy and relatively inexpensive to obtain. However, the benchmark is bound to be endogenous, dependent on individual cravings and inability to satisfy these food cravings.
During the past three months, did it happen even once that your household experienced hunger and have nothing to eat?
This is then followed by a question inquiring about the frequency of occurrence.
Then, there are the more operational definitions, which will be subsequently referred to as quantitative measures:
“Condition resulting from chronic under-consumption of food and/or nutritious food products” • Subjacent hungry: those who consume between 1,800 and 2,200 calories per day• Medial hungry: those who consume between 1,600 and 1,800 calories per day• Ultra hungry: those who consume less than 1,600 calories per day
– Lenhart & Read, 1989
“International experts recommend 2,200 calories as the average energy requirement for adults undertaking light activity. The 1,800 calorie cut-off identifies people who do not consume sufficient dietary energy to meet the minimum requirement for light activity, as established by the Food and Agriculture Organization of the United Nations. Those consuming less than 1,600 calories per day are at risk of dying from extreme hunger or starvation.”
– Akhter U. Ahmed, Ruth Vargas Hill, Lisa C. Smith, Doris M. Wiesmann, and Tim Frankenberger, 2007
If the latter set of definitions is adopted, then the indicator becomes more data-intensive, requiring no less than a nutritional survey. The survey is bound to be expensive. Even then, we would not be able to address the issue of “involuntary lack of access to food.”
The Philippines’ official definition makes use of the UN World Food Program’s definition of hunger.
“A condition in which people lack the required nutrients (protein, energy, and vitamins and minerals) for fully productive, active and healthy lives. Hunger can be a short-term phenomenon, or a longer-term chronic problem. And it can have a range of severities from mild to clinical. It can result from people not taking in sufficient nutrients or their bodies not being able to absorb the required nutrients”
– UN WFP
20 Right to Food Assessment Philippines
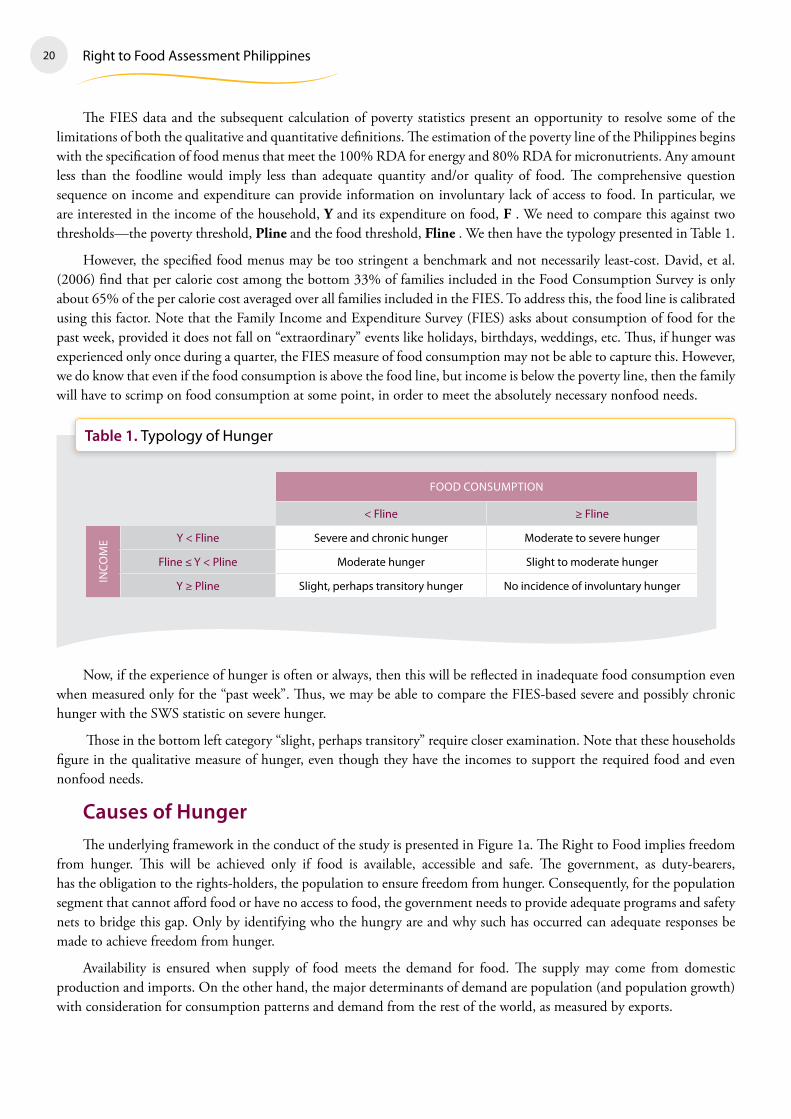
The FIES data and the subsequent calculation of poverty statistics present an opportunity to resolve some of the limitations of both the qualitative and quantitative definitions. The estimation of the poverty line of the Philippines begins with the specification of food menus that meet the 100% RDA for energy and 80% RDA for micronutrients. Any amount less than the foodline would imply less than adequate quantity and/or quality of food. The comprehensive question sequence on income and expenditure can provide information on involuntary lack of access to food. In particular, we are interested in the income of the household, Y and its expenditure on food, F . We need to compare this against two thresholds—the poverty threshold, Pline and the food threshold, Fline . We then have the typology presented in Table 1.
However, the specified food menus may be too stringent a benchmark and not necessarily least-cost. David, et al. (2006) find that per calorie cost among the bottom 33% of families included in the Food Consumption Survey is only about 65% of the per calorie cost averaged over all families included in the FIES. To address this, the food line is calibrated using this factor. Note that the Family Income and Expenditure Survey (FIES) asks about consumption of food for the past week, provided it does not fall on “extraordinary” events like holidays, birthdays, weddings, etc. Thus, if hunger was experienced only once during a quarter, the FIES measure of food consumption may not be able to capture this. However, we do know that even if the food consumption is above the food line, but income is below the poverty line, then the family will have to scrimp on food consumption at some point, in order to meet the absolutely necessary nonfood needs.
Table�1.�Typology of Hunger
FOOD CONSUmPTiON
< Fline ≥ Fline
iNCO
mE Y < Fline Severe and chronic hunger moderate to severe hunger
Fline ≤ Y < Pline moderate hunger Slight to moderate hunger
Y ≥ Pline Slight, perhaps transitory hunger No incidence of involuntary hunger
Now, if the experience of hunger is often or always, then this will be reflected in inadequate food consumption even when measured only for the “past week”. Thus, we may be able to compare the FIES-based severe and possibly chronic hunger with the SWS statistic on severe hunger.
Those in the bottom left category “slight, perhaps transitory” require closer examination. Note that these households figure in the qualitative measure of hunger, even though they have the incomes to support the required food and even nonfood needs.
Causes�of�HungerThe underlying framework in the conduct of the study is presented in Figure 1a. The Right to Food implies freedom
from hunger. This will be achieved only if food is available, accessible and safe. The government, as duty-bearers, has the obligation to the rights-holders, the population to ensure freedom from hunger. Consequently, for the population segment that cannot afford food or have no access to food, the government needs to provide adequate programs and safety nets to bridge this gap. Only by identifying who the hungry are and why such has occurred can adequate responses be made to achieve freedom from hunger.
Availability is ensured when supply of food meets the demand for food. The supply may come from domestic production and imports. On the other hand, the major determinants of demand are population (and population growth) with consideration for consumption patterns and demand from the rest of the world, as measured by exports.

21Executive Summary
Figure�1a.�Framework
Right to Food
Availability AccessibilityAdequacyand Safety
Freedom from hungerEntitlement to food that meets dietary requirements
There are two aspects of accessibility—physical and economic1. Physical accessibility is determined by transportation and infrastructure, given geoclimatic factors. Economic accessibility pertains to the ability of households to afford the food. This depends on the income of the household, the amount and stability of income, relative to its size, i.e., number of members, and demographic profile.
Adequacy and safety is concerned with the processes of production, storage and preparation. These should be culturally acceptable and free from adverse substances.
The next figure extends the previous one to incorporate the key determinants of food availability, accessibility, and adequacy and safety.
Figure�1b. Expanded�Framework
Right to Food
Availability
DemandSupply EconomicPhysical
AccessibilityAdequacyand Safety
Production, storage &
preparation
Freedom from hungerEntitlement to food that meets dietary requirements
1 Tobecomplete,thereisathirdaspectofaccessibility–physiological.Thispertainstophysiologicalconditionsthathinderthebodytoadequatelyprocessfood.However,thisstudywillnotdealwiththisthirdaspect.

22 Right to Food Assessment Philippines
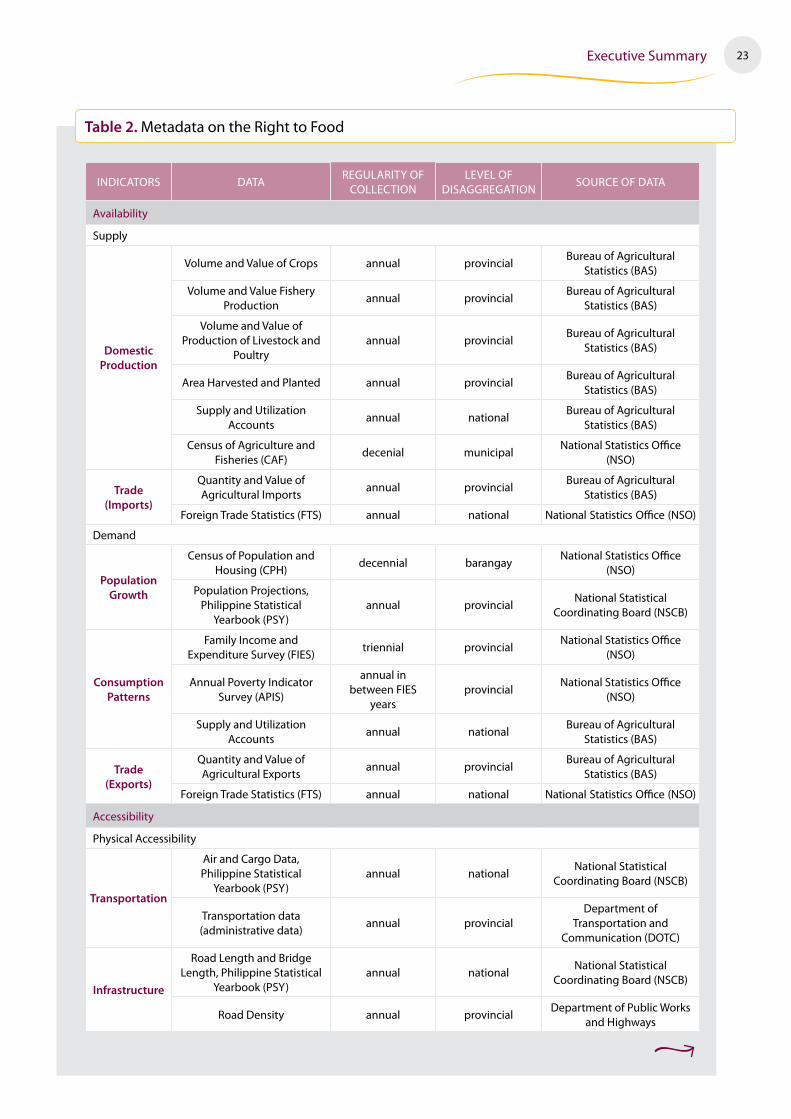
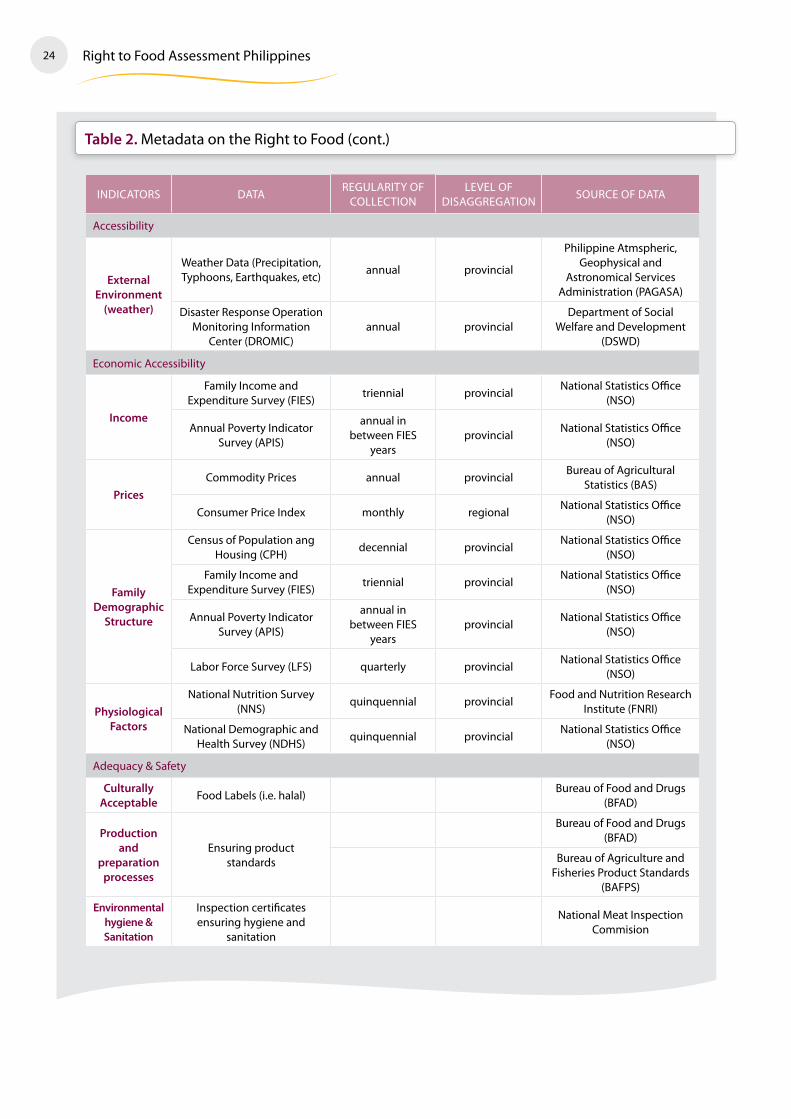
Review�of�Available�Data�on�Hunger�and�Related�VariablesThe available data that can inform us of the phenomenon of hunger is presented in Table 2. This is organized
according to its pertinence to food availability, accessibility, adequacy and safety.
Table 2 indicates that data is relatively available for those indicators related to food availability and accessibility, but there are substantial gaps in data relating to food adequacy and safety. It also shows the varied sources of data which makes it difficult to access and retrieve them, unless a central database is created. Note also that regularity of data collection is quite uneven across data sets and some are dependent on the availability of funds. In addition, not all of the datasets are disaggregated at the provincial level and none is disaggregated at the municipal level. These limitations substantially affect any analysis on the status of right to food in the country.
Data on who and where the hungry are is likewise saddled with several limitations. Hunger has several dimensions (social, economic, health/nutrition), and as discussed previously, there are several ways to define it.
In the Philippines, the different available surveys reflect these various ways of defining hunger. The key primary data sources on hunger are the following:
1. National Nutrition Surveys (NNS) is conducted every five years. The survey is made up of the following components: (a) Anthropometric Nutrition Survey; (b) Biochemical Nutrition Survey; and (c) Dietary Assessment and Household Food Security Survey. The first component determines the prevalence of underweight, underheight, overweight and obesity among various age groups through height and weight measurements. The second component provides an assessment of iron, vitamin A and iodine status of selected population groups through the analysis of collected blood and urine samples. The first two components can reveal evidences of prolonged hunger. The third component determines the food and nutrient intake among specific population groups, consumption of fortified foods and household food security. For the 2003 NNS, FNRI included a food security module that asked households with children 10 years old and below whether they have experience hunger during the past six months.2
2. Survey of Hunger Incidence in the Philippines (SHIP) – This survey was piloted by the Bureau of Agriculture Statistics (BAS) last August 2006. Incidence, frequency and reasons for experiencing hunger were collected in the survey. Member-specific variables such as demographic characteristics, educational attainment and occupation are also included. The sample consists of 13,400 households in 80 provinces including Metro Manila. No follow-up survey has been conducted.
3. Self-rated hunger indicator of the Social Weather Stations (SWS) – Since 1999 the SWS has been conducting quarterly surveys on self-rated poverty and hunger. These surveys each cover 1,200 households with balanced distribution among the major island groupings including Metro Manila.
2 The current round of the NNS (2008) which is currently being conducted has expanded the food security module to include households withpregnantandlactatingmothers.
23Executive Summary
Table�2.�metadata on the Right to Food
iNDiCATORS DATA REGULARiTY OF
COLLECTiONLEVEL OF
DiSAGGREGATiONSOURCE OF DATA
Availability
Supply
Domestic�Production
Volume and Value of Crops annual provincialbureau of Agricultural
Statistics (bAS)
Volume and Value Fishery Production
annual provincialbureau of Agricultural
Statistics (bAS)
Volume and Value of Production of Livestock and
Poultryannual provincial
bureau of Agricultural Statistics (bAS)
Area Harvested and Planted annual provincialbureau of Agricultural
Statistics (bAS)
Supply and Utilization Accounts
annual nationalbureau of Agricultural
Statistics (bAS)
Census of Agriculture and Fisheries (CAF)
decenial municipalNational Statistics Office
(NSO)
Trade�(Imports)
Quantity and Value of Agricultural imports
annual provincialbureau of Agricultural
Statistics (bAS)
Foreign Trade Statistics (FTS) annual national National Statistics Office (NSO)
Demand
Population�Growth
Census of Population and Housing (CPH)
decennial barangayNational Statistics Office
(NSO)
Population Projections, Philippine Statistical
Yearbook (PSY)annual provincial
National Statistical Coordinating board (NSCb)
Consumption�Patterns
Family income and Expenditure Survey (FiES)
triennial provincialNational Statistics Office
(NSO)
Annual Poverty indicator Survey (APiS)
annual in between FiES
yearsprovincial
National Statistics Office (NSO)
Supply and Utilization Accounts
annual nationalbureau of Agricultural
Statistics (bAS)
Trade�(Exports)
Quantity and Value of Agricultural Exports
annual provincialbureau of Agricultural
Statistics (bAS)
Foreign Trade Statistics (FTS) annual national National Statistics Office (NSO)
Accessibility
Physical Accessibility
Transportation
Air and Cargo Data, Philippine Statistical
Yearbook (PSY)annual national
National Statistical Coordinating board (NSCb)
Transportation data (administrative data)
annual provincialDepartment of
Transportation and Communication (DOTC)
Infrastructure
Road Length and bridge Length, Philippine Statistical
Yearbook (PSY)annual national
National Statistical Coordinating board (NSCb)
Road Density annual provincialDepartment of Public Works
and Highways
24 Right to Food Assessment Philippines
Table�2.�metadata on the Right to Food (cont )
iNDiCATORS DATA REGULARiTY OF
COLLECTiONLEVEL OF
DiSAGGREGATiONSOURCE OF DATA
Accessibility
External�Environment�
(weather)
Weather Data (Precipitation, Typhoons, Earthquakes, etc)
annual provincial
Philippine Atmspheric, Geophysical and
Astronomical Services Administration (PAGASA)
Disaster Response Operation monitoring information
Center (DROmiC)annual provincial
Department of Social Welfare and Development
(DSWD)
Economic Accessibility
Income
Family income and Expenditure Survey (FiES)
triennial provincialNational Statistics Office
(NSO)
Annual Poverty indicator Survey (APiS)
annual in between FiES
yearsprovincial
National Statistics Office (NSO)
PricesCommodity Prices annual provincial
bureau of Agricultural Statistics (bAS)
Consumer Price index monthly regionalNational Statistics Office
(NSO)
Family�Demographic�
Structure
Census of Population ang Housing (CPH)
decennial provincialNational Statistics Office
(NSO)
Family income and Expenditure Survey (FiES)
triennial provincialNational Statistics Office
(NSO)
Annual Poverty indicator Survey (APiS)
annual in between FiES
yearsprovincial
National Statistics Office (NSO)
Labor Force Survey (LFS) quarterly provincialNational Statistics Office
(NSO)
Physiological�Factors
National Nutrition Survey (NNS)
quinquennial provincialFood and Nutrition Research
institute (FNRi)
National Demographic and Health Survey (NDHS)
quinquennial provincialNational Statistics Office
(NSO)
Adequacy & Safety
Culturally�Acceptable Food Labels (i e halal)
bureau of Food and Drugs (bFAD)
Production�and�
preparation�processes
Ensuring product standards
bureau of Food and Drugs (bFAD)
bureau of Agriculture and Fisheries Product Standards
(bAFPS)
Environmental�hygiene�&�Sanitation
inspection certificates ensuring hygiene and
sanitation
National meat inspection Commision

25Executive Summary
4. Household surveys from the National Statistics Office:
• Family Income and Expenditures Survey (FIES) – Collected every 3 years, the FIES is a survey of households done mainly to gauge their living conditions. Information on the households’ expenditures and disbursements and their sources of income and receipts are collected in this survey. This survey’s expenditure module includes extensive detail on food consumption of households.
• Annual Poverty Indicators Survey (APIS) - Fielded in between FIES years, the APIS is designed to generate information on different indicators related to poverty. This household survey not only includes quantitative measures but also qualitative measures. These indicators are inputs to the development of an integrated poverty indicator and monitoring system for the assessment of government programs on poverty alleviation. Member-specific characteristics, particularly demographic, that are not included in the FIES are found in this database. Information on access of households to certain government services is also included in these surveys.
For the study, APPC procured the FIES and APIS datasets and 24 rounds of the SWS module on hunger incidence. It has likewise acquired the SHIP data from BAS.3
�� References• Ahmed, A., R. Hill, L. Smith, D. Wiesmann, and T. Frankenberger. 2007. The World’s Most Deprived:
Characteristics and Causes of Extreme Poverty and Hunger. Washington, D.C.: IFPRI. Downloaded from www.ifpri.org/2020/dp/vp43/vp43.pdf
• Anderson, S.A. (1990). The 1990 Life Sciences Research Office (LSRO) Report on Nutritional Assessment defined terms associated with food access. Core indicators of nutritional state for difficult to sample populations. Journal of Nutrition. 102:1559-1660
• Lenhart, N.M. & Read, M.H. (1989). Demographic profile and nutrient intake assessment of individuals using emergency food programs. Journal of the American Dietetic Association. 89:9.
• Progress for Children: A Report Card on Nutrition (No. 4)). May 2006. UNICEF. Downloaded from: http://www.unicef.org/publications/files/Progress_for_Children_-_No._4.pdf
• World Food Programme. World Hunger Series 2006: Hunger and Learning. 2006. Italy. http://www.wfp.org/policies/introduction/other/documents/pdf/World_Hunger_Series_2006_En.pdf
3 APPCwasunabletoacquirethe2003NNSrecordunitdataduetobudgetconstraints.However,publishedtablesandstudiesusingtheNNSserveasreference.