rifle-au gres-tawas rivers rapid watershed …...rifle-au gres-tawas rivers rapid watershed...
TRANSCRIPT

Rifle-Au Gres-Tawas Rivers Rapid Watershed Assessment
In Cooperation With
Natural Resources Conservation Service
Prepared by
Huron Pines Conserving the Forests, Lakes and Streams of Northeast Michigan
March 2008
Funding Provided by:
Natural Resources Conservation Service
&
Americana Foundation
A Special Thanks
To the technical committee for their valuable input and
participation in the development of watershed assessment
Photo courtesy: Dan Jennings

Rifle River-Au Gres-Tawas Rapid Watershed Assessment Technical Committee
Thank you to everyone who participated in the planning and review of the Rapid Watershed Assessment. A special thanks to Steve Rodock, Soil Scientist with the Natural Resources Conservation Service, for production of the map database.
Andrea Ania US Fish & Wildlife Service Charlie Bauer Department of Environmental Quality Tim Bohnhoff Natural Resources Conservation Service Bill Carpenter MSU Extension Gus Chutorash Rifle River Restoration Committee Scott Colclasure Ogemaw County Commissioner June Gragemeyer Natural Resources Conservation Service Jack Gregg Rifle River Restoration Committee Janice Golda Troll Landing Jim Hergott Saginaw Bay RC&D Greg Illig Ogemaw County Commissioner & Conservation District Brad Jensen Huron Pines Ryan Kruse Natural Resources Conservation Service Aaron Lauster Natural Resources Conservation Service Doug Morse Department of Environmental Quality Terry Moultane Citizen Craig Ogg Natural Resources Conservation Service Lisha Ramsdell Huron Pines Steve Rodock Natural Resources Conservation Service Mieka Rueger Natural Resources Conservation Service Kathleen Ryan Natural Resources Conservation Service Jill Scarzo Huron Pines Kathrin Schrouder Department of Natural Resources Bob Spence Mershon Chapter of Trout Unlimited Michelle Vander Haar US Fish & Wildlife Service Susan Wells US Fish & Wildlife Service
Rifle-Au Gres-Tawas Rivers--HUC: 04080101 Rapid Watershed Assessment
TABLE OF CONTENTS 1.0 Purpose ..........................................................................................................................1 2.0 Introduction .................................................................................................................1 3.0 Physical Description ..................................................................................................2 3.1 Sub-basins and River Systems ........................................................................... 2 3.2 Land Cover .......................................................................................................... 5 3.3 Public Lands ........................................................................................................ 7 3.4 Drainage Classification ...................................................................................... 7 3.5 Hydric Soils ......................................................................................................... 8 3.6 K Factor ............................................................................................................... 9 3.7 T Factor ............................................................................................................. 10 3.8 Land Capability ................................................................................................ 10 3.9 Common Resource Area .................................................................................... 12 4.0 Socio-Economic Description .................................................................................. 14 4.1 Population Statistics ......................................................................................... 14 4.2 Agriculture Census Data .................................................................................. 14 5.0 Surveys, Reports and Projects .............................................................................. 16 5.1 Existing Reports Summary .............................................................................. 16 5.2 Threatened and Endangered Species .............................................................. 18 5.3 NRCS Performance Results System (PRS) ...................................................... 20 6.0 Nonpoint Source Pollution .................................................................................... 21 6.1 Agriculture Areas .............................................................................................. 22 6.2 Road/Stream Crossings..................................................................................... 24 6.3 Dams and Barriers ............................................................................................ 26 6.4 Invasive Species ................................................................................................ 27 6.5 Impaired Waterbodies ...................................................................................... 27
7.0 Resource Concerns .................................................................................................. 29 8.0 Priority Goals for 2008-2012 .................................................................................. 31 8.1 Land Use Goal ................................................................................................... 31 8.2 Agriculture Goal ................................................................................................ 33 8.3 Erosion and Sedimentation Goal ..................................................................... 34 8.4 Education and Outreach Goal .......................................................................... 37

LIST OF MAPS Map 1: Watershed Base Map ................................................................................................1 Map 2: Watershed Sub-Basins .............................................................................................2 Map 3: Rivers and Drains .....................................................................................................4 Map 4: Land Cover ................................................................................................................5 Map 5: Public Lands ..............................................................................................................7 Map 6: Drainage Classification ............................................................................................8 Map 7: Hydric Soils ...............................................................................................................8 Map 8: K Factor .....................................................................................................................9 Map 9: T Factor ...................................................................................................................10 Map 10: Land Capability Classification ...............................................................................11 Map 11: Common Resource Area ..........................................................................................12 Map 12: Croplands Adjacent to Waterbodies .......................................................................22 Map 13: Croplands Adjacent to Waterbodies with Highly Erodible Soils ..........................23 Map 14: Road/Stream Crossings ..........................................................................................24 Map 15: Road Crossings with Highly Erodible Soils ...........................................................25 Map 16: Dam Locations ........................................................................................................26 Map 17: Location of Invasive Species ...................................................................................27 LIST OF TABLES Table 1: Watershed Sub-basins ..............................................................................................2 Table 2: Land Cover Classification ........................................................................................5 Table 3: Public Lands ..............................................................................................................7 Table 4: Land Capability Classification ...............................................................................11 Table 5: Population Statistics ...............................................................................................14 Table 6: Comparison of 1987 to 2002 Agriculture Census Data .........................................15 Table 7: Endangered, Threatened, and Special Concern Species .......................................18 Table 8: Conservation Practices ...........................................................................................20 Table 9: Impaired Waterbodies ............................................................................................28 Table 10: Resource Concerns ..................................................................................................29

Rifle-Au Gres-Tawas Rivers—HUC: 04080101 Rapid Watershed Assessment
Page | 1
1.0 Purpose The Rapid Watershed Assessment (RWA) Program is designed to identify and organize information into one document that conservation leaders, resource professionals and units of governments can use to identify existing resource conditions and conservation opportunities. This will enable the user to direct technical and financial resources to the most significant needs of the watershed. The RWA provides a brief assessment of the Rifle-Au Gres-Tawas watershed’s natural resources, resource concerns and conservation needs. As part of the Resource Profile, geographic and statistical data has been compiled using Geographic Information System (GIS) database. In addition, past studies have been reviewed to provide baseline and trend data where applicable. 2.0 Introduction The Rifle-Au Gres-Tawas watershed drains approximately 1024 square miles (655,824 acres) of land directly to Lake Huron. Located in Michigan’s Lower Peninsula the watershed includes Ogemaw, Iosco and Arenac counties and the communities of West Branch, Omer, Tawas, East Tawas, Rose City and Au Gres. In addition, there are 31 townships located in the watershed. The area is predominately rural with agriculture, tourism and forestry as the main economy. There are 684 miles of rivers and drains and 11 named lakes covering 10,176 acres in the watershed.
Most of the topographical features of the watershed are a result of erosion or deposition during the most recent glacial period. The ice from this glacial period began receding from Michigan about 14,000 years ago and completely moved out about 8,000 years ago. Elevations range from 1500 feet above sea level in the western part of the watershed in Ogemaw County to 580 feet above sea level along the Lake Huron Shore in Arenac and Iosco counties.
Map 1: Watershed Base Map

Rifle-Au Gres-Tawas Rivers—HUC: 04080101 Rapid Watershed Assessment
Page | 2
There are several organizations in the watershed which coordinate resource protection efforts. Those include the Natural Resources Conservation Service, US Forest Service, Ogemaw, Iosco and Arenac Conservation Districts, Michigan State University Extension, Saginaw Bay Watershed Initiative Network (WIN), Huron Pines, Saginaw Bay Resource Conservation and Development Council, Rifle River Watershed Restoration Committee, HeadWaters and Saginaw Bay land conservancies, Department of Natural Resources (DNR), Department of Environmental Quality (DEQ), and the U.S. Fish & Wildlife Service.
3.0 Physical Description
3.1 Sub-basins and River Systems
The geographic scope of this project includes the sub-basins of Rifle River, Au Gres River, East Branch Au Gres River, Tawas River, and rivers and drains (colored in green) that flow directly to Lake Huron. The East Branch Au Gres River no longer flows to the Au Gres River and now reaches Lake Huron via Whitney Drain. Throughout the Resource Profile the term “watershed” refers to these sub-basins collectively.
Map 2:
Watershed Sub-basins
Table 1: Watershed Sub-basins
Sub-basins Acres Sq. Miles % of Total Watershed Rifle River 244,425 382 37.3% Au Gres River 156,506 245 23.9% Tawas River 99,842 156 15.2% East Br. Au Gres River (Whitney Drain) 94,103 147 14.3% Big Creek-Coastal (Frontal) Lake Huron 60,948 95 9.3% Total 655,824 1,024 100%

Rifle-Au Gres-Tawas Rivers—HUC: 04080101 Rapid Watershed Assessment
Page | 3
The Rifle River originates in northern Ogemaw County and flows southeasterly to its discharge point in Lake Huron (Saginaw Bay). The watershed drains approximately 382 square miles, the mainstem is about 60 miles long and the tributaries total 140 miles in length. The Rifle River has a fairly steep gradient throughout the watershed making it one of Michigan’s swiftest rivers. The Au Gres River, not including the east branch, drains approximately 245 square miles. The river begins in Ogemaw County, near Sage Lake, and flows in a southern direction to its discharge into Lake Huron. The upper sub-basin flows through forested land; as the river reaches the Iosco County line agriculture activities become more prevalent. The Tawas River Watershed is nearly 156 square miles comprising over 15% of the total watershed area. This sub-basin is located in Iosco County with the headwater tributaries originating in the Huron National Forest; it discharges into Tawas Bay. Much of the watershed consists of wetland areas and poor drainage classification. Tawas River flows into Tawas Lake, the largest lake in the watershed with over 1,600 acres. The East Branch of the Au Gres River begins in northern Iosco County in the Huron National Forest and drains 147 square miles of land. Historically, it flowed into the Au Gres River but has since been diverted because of downstream flooding concerns. The east branch now flows into Whitney Drain which empties into Lake Huron at Singing Bridge road crossing. Waters that flow directly to Lake Huron and are not part of a larger drainage basin are considered coastal waters. These waters account for approximately 10% of the total watershed, 95 square miles, and include Big Creek.

Rifle-Au Gres-Tawas Rivers—HUC: 04080101 Rapid Watershed Assessment
Page | 4
The Rifle River, from the headwaters to just north of Omer, is designated by the state as a Natural River. This designation sets stricter building guidelines within the riparian corridor. In addition, the East Branch of the Au Gres River, for a twelve mile stretch from the confluence of Hall and Smith Creek to Whittemore Road, is designated by the DNR as a Blue Ribbon Trout Stream. This stream is considered a premier top-quality trout stream characterized by excellent stocks of wild resident trout, access to fly-casting, diverse insect life and good fly hatches, and excellent water quality and has earned a reputation for providing an excellent trout fishing experience.
Map 3:
Rivers and Drains

Rifle-Au Gres-Tawas Rivers—HUC: 04080101 Rapid Watershed Assessment
Page | 5
3.2 Land Cover Determining current land cover conditions is essential in the watershed assessment process. The type and intensity of land use can contribute to nonpoint source pollution if adequate prevention measures are not implemented. Increasing development places higher demands on the natural resources when forests, riparian lands and open spaces are converted to homes, roads and commercial centers. Table 2 depicts each land cover classification in the watershed by number of acres and percentage of the total area.
Table 2: Land Cover Classification Land Use Acres in Watershed Percentage of Watershed Residential 5,709 0.7% Pits, quarry, rock 2,029 0.3% Forest 298,120 45% Pasture 96,151 15% Crops 89,334 14% Wetlands 150,861 23% Water 13,620 2% Total 655,824 100%
Map 4: Land Cover

Rifle-Au Gres-Tawas Rivers—HUC: 04080101 Rapid Watershed Assessment
Page | 6
The following definitions describe the land cover classifications. Residential: Residential land includes residential dwelling structures such as single family or duplexes, multi-family residential and mobile home parks. The total residential land use in the watershed is 5,709 acres (0.7%). The largest concentrations of people in the watershed are located in West Branch, Tawas, Rose City, Omer and along the Lake Huron coast. Pasture, Grassland: Pasture and grasslands include “open land” and rangeland classifications such as barren land, herbaceous open land, and shrubland. Herbaceous open land is usually subjected to continuous disturbance such as mowing, grazing, or burning, and typically it can have a variety of grasses, sedges, and clovers. Shrubland is land in transition from being open to becoming forested. It contains native shrubs and woody plants like blackberry, dogwood, willow, sumac, and tag alder. Pasture and grassland account for 96,151 acres (15%) of the watershed. Crops: The agricultural land use category generally includes land that is used for the production of food and fiber. These classes are cropland, orchards (including vineyards and ornamental horticulture), confined feeding operations for livestock of any kind, permanent pasture lands, farmsteads, greenhouse operations, and horse training areas. The total crop land in the watershed is 89,334 acres (14%). Pits, Quarry, Rock: Pit, quarry and rock land includes both surface and sub-surface mining operations, such as sand and gravel pits, stone quarries, oil and gas wells, and other mines. These areas are devoid of vegetation and oftentimes house large processing plants, stockpiles, and waste dumps. Pits, quarry and rock account for 2,029 acres (0.3%) in the watershed. Forest: Forest land areas are generally at least 10% covered by trees of any size. The forest category includes upland hardwoods like maple and beech, other upland species like aspen and birch, species of pine like red, white or jack pine, and other upland conifers like white spruce, blue spruce, eastern hemlock, and balsam fir. Lowland forest areas are dominated by tree species that grow in very wet soils. Lowland hardwoods include ash, elm, soft maple, cottonwood and others. Lowland conifers include cedar, tamarack, black and white spruce, and balsam fir. Forested areas in the watershed comprise the majority of land cover with a total of 298,120 acres (45%) of the land area. Wetlands: Wetlands are those areas where the water table is at or near the land surface for a significant part of most years. Examples of wetlands are marshes, mudflats, wooded swamps, and shallow areas along rivers, lakes or ponds. Wetlands areas include both non-vegetated mud flats and areas of hydrophytic vegetation. Wetlands in the Rifle-Au Gres-Tawas Watershed cover 150,861 acres (23%) of the land. Surface Water: The surface water category includes areas such as lakes, reservoirs, ponds, rivers and streams. Surface water in the watershed covers 13,620 acres (2%) of the total land area.

Rifle-Au Gres-Tawas Rivers—HUC: 04080101 Rapid Watershed Assessment
Page | 7
3.3 Public Lands Public lands account for nearly 20% of the total watershed area. The majority of public lands are part of the Huron National Forest located in northern Iosco County and the Au Sable State Forest located in Ogemaw and Iosco counties.
Table 3: Public Lands
Ownership Acres in Watershed Percentage in Watershed Huron National Forest 64,415 9.8% Au Sable State Forest 53,554 8.2% State of Michigan 5,343 0.8% Rifle River Recreation Area and Tawas Point State Park 4,556 0.7% Total 127,868 19.5%
Map 5:
Public Lands
3.4 Drainage Classification Drainage class refers to the frequency and duration of wet periods under conditions similar to those in which the soil formed. For comparison purposes the seven classes of natural soil drainage were combined into three groups. Excessively drained, somewhat excessively drained and well drained soils (high water table greater than 4 feet) cover 232,656 acres (35.5%), moderately well drained and somewhat poorly drained soils (high water table between 1 and 4 feet) include 233,327 acres (35.6%), poorly drained and very poorly drained soils (high water table 1 foot above to 1 foot below the surface) cover 173,952 acres (26.5%), and water encompasses 15,889 acres (2.4%). Drainage conditions may affect agriculture suitability, dictate what type of vegetation grows and influence building conditions.

Rifle-Au Gres-Tawas Rivers—HUC: 04080101 Rapid Watershed Assessment
Page | 8
Map 6: Drainage Classification
3.5 Hydric Soils
Hydric soils are defined as soils that formed under conditions of saturation, flooding, or ponding long enough during the growing season to develop anaerobic conditions in the upper part. These soils, under natural conditions, are either saturated or inundated long enough during the growing season to support the growth and reproduction of hydrophytic vegetation. Hydric soils make up part of the criteria for the identification of wetlands.
Map 7: Hydric Soils
Note: At the time the Arenac County Soil Survey was conducted in the mid 1960’s, complexes of hydric and non - hydric soils were not grouped together. Soil Scientists then chose the more limiting soil (the hydric one) to name the map unit. More recent Soil Surveys, which have been completed for Iosco and Ogemaw counties, now recognize these low rolling landscapes as a complex of hydric and non – hydric soils.

Rifle-Au Gres-Tawas Rivers—HUC: 04080101 Rapid Watershed Assessment
Page | 9
3.6 K Factor Erosion factor K indicates the susceptibility of a soil to sheet and rill erosion by water. Factor K is one of six factors used in the Revised Universal Soil Loss Equation (RUSLE) to predict the average annual rate of soil loss by sheet and rill erosion in tons per acre per year. The estimates are based primarily on percentage of silt, sand, and organic matter and on soil structure and saturated hydraulic conductivity (Ksat). Values of K range from 0.02 to 0.69. Other factors being equal, the higher the value, the more susceptible the soil is to sheet and rill erosion by water. K factor was combined into three categories to determine coverage acreage and percentage. Soils with K factor .10, .15 and .17 cover 363,276 acres (55.5%); .20, .24 and .28 include 99,805 acres (15.2%); the highly erodible soils with K factors of .32, .37 and .43 cover 86,263 acres (13.1%); non-rated soils cover 106,480 acres (16.2%).
Map 8: K Factor
Rifle-Au Gres-Tawas Rivers—HUC: 04080101 Rapid Watershed Assessment
Page | 10
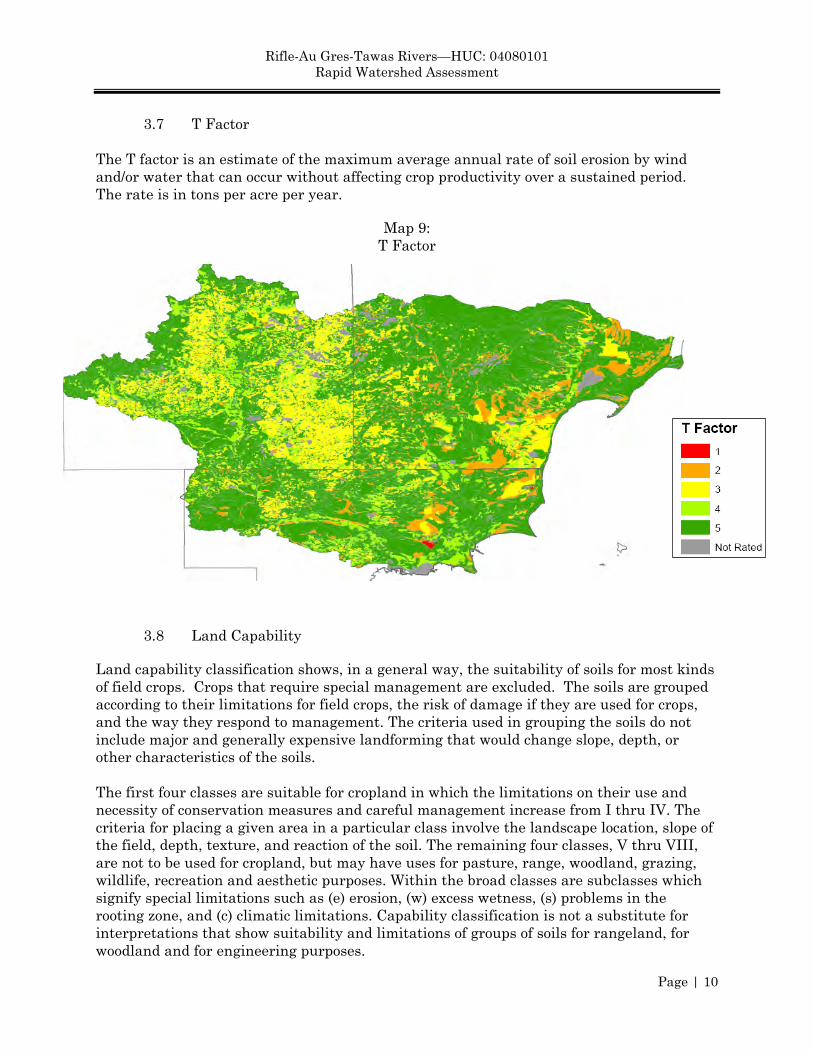
3.7 T Factor
The T factor is an estimate of the maximum average annual rate of soil erosion by wind and/or water that can occur without affecting crop productivity over a sustained period. The rate is in tons per acre per year.
Map 9: T Factor
3.8 Land Capability Land capability classification shows, in a general way, the suitability of soils for most kinds of field crops. Crops that require special management are excluded. The soils are grouped according to their limitations for field crops, the risk of damage if they are used for crops, and the way they respond to management. The criteria used in grouping the soils do not include major and generally expensive landforming that would change slope, depth, or other characteristics of the soils. The first four classes are suitable for cropland in which the limitations on their use and necessity of conservation measures and careful management increase from I thru IV. The criteria for placing a given area in a particular class involve the landscape location, slope of the field, depth, texture, and reaction of the soil. The remaining four classes, V thru VIII, are not to be used for cropland, but may have uses for pasture, range, woodland, grazing, wildlife, recreation and aesthetic purposes. Within the broad classes are subclasses which signify special limitations such as (e) erosion, (w) excess wetness, (s) problems in the rooting zone, and (c) climatic limitations. Capability classification is not a substitute for interpretations that show suitability and limitations of groups of soils for rangeland, for woodland and for engineering purposes.

Rifle-Au Gres-Tawas Rivers—HUC: 04080101 Rapid Watershed Assessment
Page | 11
Map 10: Land Capability Classification
Factors that would make land unsuitable for crops include steep slope, excessively wet soils, droughty soils and excessive stones. Capability classes are designated by the numbers 1 through 8. The numbers indicate progressively greater limitations and narrower choices for practical use.
Table 4: Land Capability Classification Capability Class Acres in Watershed Percentage of Watershed Capability Class I 133 <0.1% Capability Class II 106,271 16% Capability Class III 136,959 21% Capability Class IV 119,528 18% Capability Class V 55,774 8% Capability Class VI 175,778 27% Capability Class VII 37,484 6% Capability Class VIII 4,719 1% Not Rated 19,178 3% Total 655,824 100%

Rifle-Au Gres-Tawas Rivers—HUC: 04080101 Rapid Watershed Assessment
Page | 12
3.9 Common Resource Area
Common Resource Area (CRA) map is defined as a geographical area where resource concerns, problems, or treatment needs are similar. It is considered a subdivision of an existing Major Land Resource Area (MLRA) map delineation. Landscape conditions, soil, climate, human considerations, and other natural resource information are used to determine the geographic boundaries of a Common Resource Area. The following are the three CRAs for the watershed.
Map 11: Common Resource Area
94A.1 - Tawas Lake Plain Tawas Lake Plain covers the majority of the watershed and is found in the eastern and southern portion of the watershed. It is characterized by nearly level well drained to very poorly drained sandy and clayey soils on lake plains. Dominant land use is cropland consisting of corn, navy beans, and sugar beets in the southeastern part and woodland in the northwestern part. Primary resource concerns are soil erosion, groundwater quality, surface water quality, and forestland productivity. 94A.2 - Mio Outwash Plain, Kames and Lake Plain Found in the northwest portion of the watershed this CRA is characterized by nearly level to rolling well drained to very poorly drained sandy and organic soils on outwash plains. Comprised of mostly deciduous and coniferous forest the CRA also has minor areas of cropland. Dominant land use is forestland and recreation. Primary resource concerns are soil erosion, groundwater quality, surface water quality, forestland productivity and wildlife habitat.

Rifle-Au Gres-Tawas Rivers—HUC: 04080101 Rapid Watershed Assessment
Page | 13
99.1 - Erie-Huron Lake Plain Comprising a small fraction of the watershed the Erie-Huron Lake Plain is flat-lying, ice-age lake basin with beach ridges, bars, dunes, delta, and clay flats with very low relief. Soils are very poorly drained to somewhat poorly drained, formed in wave-planed, clayey till and lacustrine sediments. Dominant land use includes corn, soybeans, and livestock farming on artificially drained soils with scattered woodlots, residential, commercial, and industrial development near Lake Erie. Urban development is an increasing land use in this area. Primary resource concerns are soil erosion, groundwater quality, surface water quality and quantity.

Rifle-Au Gres-Tawas Rivers—HUC: 04080101 Rapid Watershed Assessment
Page | 14
4.0 Socio-Economic Description
4.1 Population Statistics
The Rifle-Au Gres-Tawas Watershed is located in a predominantly rural setting in central Michigan. Table 5 depicts the population, median household income, persons employed in agriculture related services and persons per square mile in Arenac, Iosco and Ogemaw counties. In 2000, the State of Michigan median income was $44,667, approximately 40% higher than those counties in the watershed; and has on average 175 persons per square mile, roughly 4 times the population density of the watershed.
4.2 Agriculture Census Data
The census of agriculture is the leading source of statistics about the Nation's agricultural production and the only source of consistent, comparable data at the county, State, and National levels. Census statistics are used by Congress to develop and change farm programs, study historical trends, assess current conditions, and plan for the future. Many National and State programs use census data to design and allocate funding for extension service projects, agricultural research, soil conservation programs, and land-grant colleges and universities. Private industry uses census statistics to provide a more effective production and distribution system for the agricultural community.
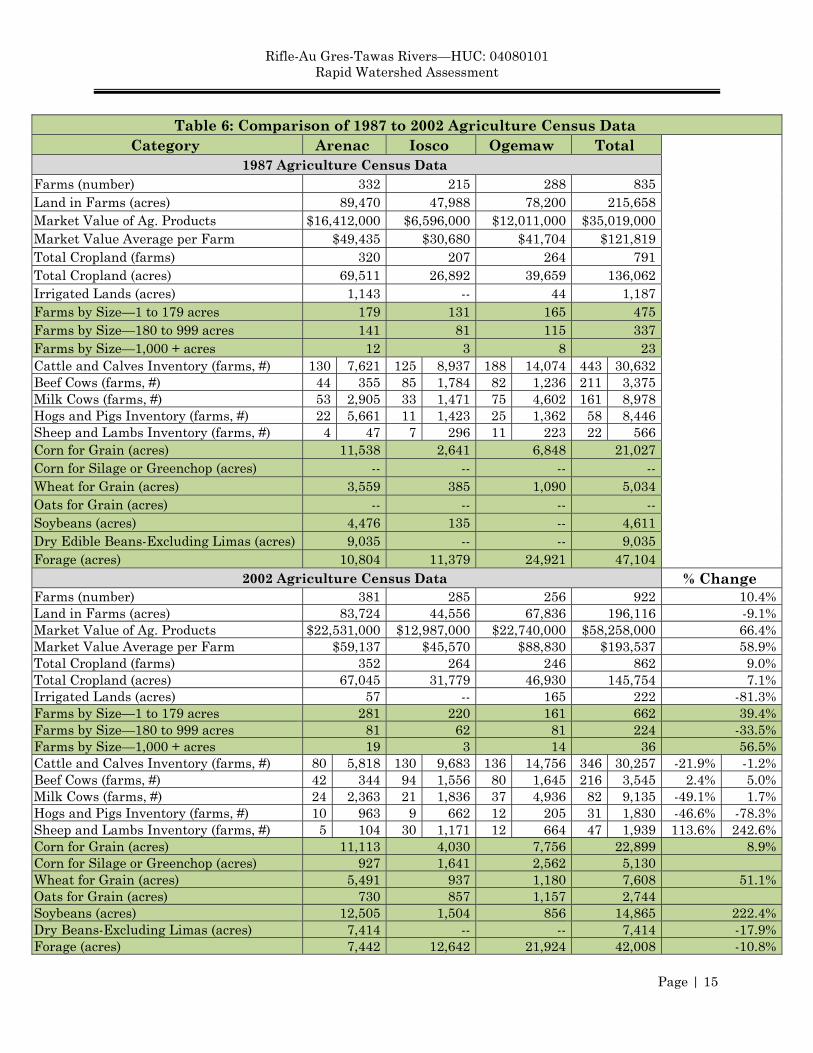
Table 5 shows select 1987 and 2002 agriculture census data for Arenac, Iosco and Ogemaw counties. The number of total farms increased by 10% during that period; however, the acres of agricultural land decreased 9%. In addition, the market value of agriculture products increased 66% and average market value per farm increased 60%.
Table 5: Population Statistics County 1990 2000 % Change Arenac Population 14,931 17,269 15.7% Median Household Income $19,489 $32,805 68% Agriculture (persons employed) 286 245 -14.3% Persons per Square Mile 40.8 47.2 15.7% Iosco Population 30,209 27,339 -9.5% Median Household Income $20,091 $31,321 55.9% Agriculture (persons employed) 238 184 -22.7% Persons per Square Mile 55 49.8 -9.5% Ogemaw Population 18,681 21,645 15.9% Median Household Income $17,665 $30,474 73% Agriculture (persons employed) 329 360 9.4% Persons per Square Mile 33.1 38.4 16% State of Michigan Population 9,295,297 9,938,297 6.92% Median Household Income $31,020 $44,667 43.99% Agriculture (persons employed) 72,530 49,496 -31.76% Persons per Square Mile 164 175 6.71%
Rifle-Au Gres-Tawas Rivers—HUC: 04080101 Rapid Watershed Assessment
Page | 15
Table 6: Comparison of 1987 to 2002 Agriculture Census Data Category Arenac Iosco Ogemaw Total
1987 Agriculture Census Data Farms (number) 332 215 288 835 Land in Farms (acres) 89,470 47,988 78,200 215,658 Market Value of Ag. Products $16,412,000 $6,596,000 $12,011,000 $35,019,000 Market Value Average per Farm $49,435 $30,680 $41,704 $121,819 Total Cropland (farms) 320 207 264 791 Total Cropland (acres) 69,511 26,892 39,659 136,062 Irrigated Lands (acres) 1,143 -- 44 1,187 Farms by Size—1 to 179 acres 179 131 165 475 Farms by Size—180 to 999 acres 141 81 115 337 Farms by Size—1,000 + acres 12 3 8 23 Cattle and Calves Inventory (farms, #) 130 7,621 125 8,937 188 14,074 443 30,632 Beef Cows (farms, #) 44 355 85 1,784 82 1,236 211 3,375 Milk Cows (farms, #) 53 2,905 33 1,471 75 4,602 161 8,978 Hogs and Pigs Inventory (farms, #) 22 5,661 11 1,423 25 1,362 58 8,446 Sheep and Lambs Inventory (farms, #) 4 47 7 296 11 223 22 566 Corn for Grain (acres) 11,538 2,641 6,848 21,027 Corn for Silage or Greenchop (acres) -- -- -- -- Wheat for Grain (acres) 3,559 385 1,090 5,034 Oats for Grain (acres) -- -- -- -- Soybeans (acres) 4,476 135 -- 4,611 Dry Edible Beans-Excluding Limas (acres) 9,035 -- -- 9,035 Forage (acres) 10,804 11,379 24,921 47,104
2002 Agriculture Census Data % Change Farms (number) 381 285 256 922 10.4% Land in Farms (acres) 83,724 44,556 67,836 196,116 -9.1% Market Value of Ag. Products $22,531,000 $12,987,000 $22,740,000 $58,258,000 66.4% Market Value Average per Farm $59,137 $45,570 $88,830 $193,537 58.9% Total Cropland (farms) 352 264 246 862 9.0% Total Cropland (acres) 67,045 31,779 46,930 145,754 7.1% Irrigated Lands (acres) 57 -- 165 222 -81.3% Farms by Size—1 to 179 acres 281 220 161 662 39.4% Farms by Size—180 to 999 acres 81 62 81 224 -33.5% Farms by Size—1,000 + acres 19 3 14 36 56.5% Cattle and Calves Inventory (farms, #) 80 5,818 130 9,683 136 14,756 346 30,257 -21.9% -1.2% Beef Cows (farms, #) 42 344 94 1,556 80 1,645 216 3,545 2.4% 5.0% Milk Cows (farms, #) 24 2,363 21 1,836 37 4,936 82 9,135 -49.1% 1.7% Hogs and Pigs Inventory (farms, #) 10 963 9 662 12 205 31 1,830 -46.6% -78.3% Sheep and Lambs Inventory (farms, #) 5 104 30 1,171 12 664 47 1,939 113.6% 242.6% Corn for Grain (acres) 11,113 4,030 7,756 22,899 8.9% Corn for Silage or Greenchop (acres) 927 1,641 2,562 5,130 Wheat for Grain (acres) 5,491 937 1,180 7,608 51.1% Oats for Grain (acres) 730 857 1,157 2,744 Soybeans (acres) 12,505 1,504 856 14,865 222.4% Dry Beans-Excluding Limas (acres) 7,414 -- -- 7,414 -17.9% Forage (acres) 7,442 12,642 21,924 42,008 -10.8%

Rifle-Au Gres-Tawas Rivers—HUC: 04080101 Rapid Watershed Assessment
Page | 16
5.0 Surveys, Reports and Projects There have been numerous reports, surveys and projects conducted within the watershed identifying resource concerns. In addition, many projects have taken place to protect water quality, improve wildlife habitat, and preserve farming heritage; the following is a list of those surveys and projects that have been completed. 5.1 Existing Reports Summary In 2007 a graduate student from Michigan State University, Andrea Ania, completed a master’s thesis on the Rifle River watershed titled “Application of a science-based, multi-scaled approach to watershed protection and rehabilitation in the Rifle River Watershed, Michigan.” The research involved describing hydrologic and land use trends, determining the current stream temperature regime, predicting the impacts of global warming on stream temperature, and qualitatively assessing stream channel morphology in the Rifle River watershed. A summary of this research include:
1) Hydrologic trends – base flow, or summer low flow, has actually increased and the river flow patterns have become more stable over the past 69 years (1938-2006).
2) Land use trends (GIS) – there has been an increase in developed land, grassland, and shrub land over the last 10 years (1992-2001) throughout the watershed and in the near riparian zone areas (90m, 60m, and 30m buffers.
3) Stream temperature model – Based on measured and predicted water temperatures, the thermal regime of the Rifle River does not appear to be limiting salmonid distribution.
4) Qualitative assessment - provided useful information regarding the quality of potential fish habitat, and was useful for understanding the problems and their causes such as the impacts of riparian vegetation removal, beaver dams, stream channelization, and improperly placed culverts on the mainstream and tributaries of the Rifle River.
The Department of Natural Resources (DNR) conducted a biological survey of the Rifle River and select tributaries to assess the current biological and habitat conditions. The report was compiled in 1995 with surveys being conducted in 1983, 1985 and 1994. The fish community and macroinvertebrate community were rated “good” which indicates slight impairments are occurring. Habitat rated from “poor” to “excellent” depending on monitoring location. Impairments are a result of livestock access, stormwater runoff and excess sediment. The DNR conducted a biological survey of Tawas River and selected tributaries in 1996. The study found that fish community rated “poor” in the Tuttle Drain while Silver and Cold Creeks had populations of salmonids. Habitat and macroinvertebrate communities rated “poor” at Dead Creek and the lower Tawas River. The poor ratings are attributed to reduced bottom substrate and degraded physical habitat conditions most likely due to improper land use practices, livestock access, poor road/stream crossings, and lack of riparian buffers.

Rifle-Au Gres-Tawas Rivers—HUC: 04080101 Rapid Watershed Assessment
Page | 17
For the past 10 years the Rifle River Watershed Restoration Committee has been involved with erosion control practices along the Rifle River. There were 270 erosion sites identified and as of 2005 134 of those sites have been restored. Over $400,000 has been spent on these sites and implementation practices include, LUNKER structures, tree revetment, bank shaping, seeding and planting, rock riprap and access management practices. In 1999, the Saginaw Bay RC&D, in partnership with Huron Pines and the Rifle River Watershed Restoration Committee, produced a watershed management plan for the Rifle River. As part of the project field inventories were conducted and public input was gathered to identify resource concerns and develop water quality recommendations. Pollutants of concern are sediment, nutrients, toxins, pathogens and increased water temperature. Goals established in the management plan include:
1. Reduce sediment loading to the point that instream habitat is restored and the resident and anadromous fisheries rebound.
2. Reduce pollutant loadings to a level that allows macroinvertebrate communities to be restored to a more natural condition.
3. Reduce nutrient loading to meet or exceed DEQ targets. 4. Reduce stormwater runoff so that peak flows within the West Branch Rifle and its
tributaries are attenuated and downstream impacts are minimized. 5. Develop regional stormwater management plans for West Branch, Rose City, Omer
and the 1-75/Cook Road corridor to accommodate projected growth over the next 20 years and beyond.
6. Complete erosion inventory work on all tributary streams. 7. Addition of instream habitat for fish.
In 2001, Lapham Associates prepared a report titled “A Study of the Feasibility of Four Alternative Levels of Diversion of Portions of the East Branch of the Au Gres River”. The assessment discussed the potential for rerouting significant portions of the water flowing down Whitney Drain from tributaries of the East Branch into a constructed stream and lake in order to alleviate soil erosion problems and reduce sedimentation to Lake Huron. Huron Pines and the Ogemaw Stormwater Committee conducted a stormwater assessment for the City of West Branch in 2005. The report noted there are 20 discharge points from West Branch and the surrounding areas. A rough estimate of discharges is 170,000 lbs. Total Suspended Solids, 700 lbs of Total Phosphorous and 3900 lbs of Total Nitrogen. Recommendations of the plan include:
1. Implement structure BMPs to retrofit existing drainage areas and discharge points 2. Implement non-structural BMPs (outreach programs) 3. Draft and implement a stormwater ordinance 4. Designate a stormwater agent/permits officer to oversee the area’s stormwater
system 5. Implement a municipal stormwater maintenance program

Rifle-Au Gres-Tawas Rivers—HUC: 04080101 Rapid Watershed Assessment
Page | 18
5.2 Threatened and Endangered Species
The following is a list of Endangered, Threatened or Species of Concern categorized by sub-basin. This information was compiled from the Michigan Natural Features Inventory.
Table 7: Rifle River Endangered, Threatened, Species of Concern
Scientific Name Common Name Federal Status State Status Buteo lineatus Red-shouldered Hawk T Glyptemys insculpta Wood Turtle SC Great Blue Heron Rookery Great Blue Heron Rookery Merolonche dolli Doll's Merolonche SC Percina copelandi Channel Darter E Dentaria maxima Large Toothwort T Gavia immer Common Loon T Alasmidonta viridis Slippershell Mussel SC Dalibarda repens False-violet T Pandion haliaetus Osprey T Opuntia fragilis Fragile Prickly-pear E
Au Gres River Scientific Name Common Name Federal Status State Status Glyptemys insculpta Wood Turtle SC Mesic northern forest Panax quinquefolius Ginseng T Elaphe vulpina gloydi Eastern Fox Snake T Pandion haliaetus Osprey T Gavia immer Common Loon T Great Blue Heron Rookery Great Blue Heron Rookery Buteo lineatus Red-shouldered Hawk T Emys blandingii Blanding's Turtle SC
East Branch Au Gres River Scientific Name Common Name Federal Status State Status Glyptemys insculpta Wood Turtle SC Appalachia arcana Secretive Locust SC Cirsium hillii Hill's Thistle SC Dendroica kirtlandii Kirtland's Warbler LE E Sistrurus catenatus catenatus Eastern Massasauga C SC Bog Buteo lineatus Red-shouldered Hawk T Coregonus artedi Cisco or Lake Herring T Emys blandingii Blanding's Turtle SC Gavia immer Common Loon T Great Blue Heron Rookery Great Blue Heron Rookery Accipiter gentilis Northern Goshawk SC Prunus alleghaniensis var. davisii Alleghany or Sloe Plum SC

Rifle-Au Gres-Tawas Rivers—HUC: 04080101 Rapid Watershed Assessment
Page | 19
Tawas River
Scientific Name Common Name Federal Status State Status Accipiter gentilis Northern Goshawk SC Appalachia arcana Secretive Locust SC Chlidonias niger Black Tern SC Emys blandingii Blanding's Turtle SC Glyptemys insculpta Wood Turtle SC Haliaeetus leucocephalus Bald Eagle LT,PDL T Pandion haliaetus Osprey T Accipiter cooperii Cooper's Hawk SC Appalachia arcana Secretive Locust SC Cirsium hillii Hill's Thistle SC Dendroica kirtlandii Kirtland's Warbler LE E Sistrurus catenatus catenatus Eastern Massasauga C SC Atrytonopsis hianna Dusted Skipper T
Big Creek-Frontal Lake Huron Scientific Name Common Name Federal Status State Status Botaurus lentiginosus American Bittern SC Chlidonias niger Black Tern SC Cistothorus palustris Marsh Wren SC Ixobrychus exilis Least Bittern T Cirsium pitcheri Pitcher's Thistle LT T Percina copelandi Channel Darter E Wooded dune and swale complex
Interdunal wetland Alkaline Shoredunes Pond/marsh, Great Lakes Type
Trimerotropis huroniana Lake Huron Locust T State Status: E = endangered, T = threatened, SC = special concern. Federal Status: LE = listed endangered, LT = listed threatened, LELT = partly listed endangered and partly listed threatened, PDL = proposed delist, E(S/A) = endangered based on similarities/appearance, PS = partial status (federally listed in only part of its range), C = species being considered for federal status.

Rifle-Au Gres-Tawas Rivers—HUC: 04080101 Rapid Watershed Assessment
Page | 20
5.3 NRCS Performance Results System (PRS) The following table is a product of the NRCS Performance Results System (PRS) and reflects progress made over the past 4 years in several key areas of conservation.
Table 8: Conservation Practices
Conservation Treatment 2004 2005 2006 2007 (Planned)
Total
Access Road (feet) 3,020 3,020 Agrichemical Mixing Facility (#) 1 1 Animal Trails and Walkways (feet) 2 2,244 2,246 Comprehensive Nutrient Mgnt. Plan (#) 3 2 5 Conservation Cover (acres) 44 82 10 136 Conservation Crop Rotation (acres) 1,260 445 333 2,038 Critical Area Planting (acres) 3 3 6 Early Successional Habitat Development/Management (acres) 7 128 19 264 418 Fence (feet) 15,300 19,884 5,050 9,512 49,746 Filter Strip (acres) 25 29 26 80 Grassed Waterway (acres) 3 3 Hedgerow Planting (feet) 1,088 1,088 Heavy Use Area Protection (acres) 1 1 Manure Transfer (#) 1 1 Mulching (acres) 3 3 Nutrient Management (acres) 968 1,956 538 95 3,557 Pasture and Hay Planting (acres) 30 172 202 Pest Management (acres) 873 2,382 590 303 4,148 Pipeline (feet) 2,100 2,200 2,677 6,977 Prescribed Grazing (acres) 232 297 17 706 1,252 Recreation Area Improvement (acres) 1 1 Residue Management, Mulch Till (acres) 436 843 1,277 170 2,726 Residue Mgnt., No-Till/Strip Till (acres) 274 596 870 Riparian Forest Buffer (acres) 9 14 35 58 Stream Crossing (#) 2 2 Streambank and Shoreline Protection (feet) 630 630 Subsurface Drain (feet) 3,600 3,600 Tree/Shrub Establishment (acres) 3 16 100 252 371 Upland Wildlife Habitat Mgnt. (acres) 22 231 457 783 1,493 Use Exclusion (acres) 3 1 29 33 Waste Storage Facility (#) 1 1 Waste Utilization (acres) 944 3,238 595 4,777 Water Well (#) 1 1 1 3 Watering Facility (#) 3 2 3 8 Well Decommissioning (#) 1 1 Wetland Creation (acres) 5 5 Wetland Enhancement (acres) 3 30 56 5 94 Wetland Restoration (acres) 92 123 246 280 741 Wetland Wildlife Habitat Mgnt. (acres) 147 119 277 543 Windbreak/Shelterbelt Establishment (feet) 760 4,697 2,740 663 8,860 Use Exclusion (acres) 3,020 3,020 Waste Utilization (acres) 2 2

Rifle-Au Gres-Tawas Rivers—HUC: 04080101 Rapid Watershed Assessment
Page | 21
6.0 Nonpoint Source Pollution
Nonpoint source pollution is the primary pollution threat facing the water resources of the Rifle-Au Gres-Tawas River Watershed. Nonpoint source pollution is any pollutant carried off the land by water or wind and deposited into surface water. The most common nonpoint source pollutant in nearly every rural river system is sediment. Sediment degrades habitat for fish and aquatic insects and contributes to the widening of the stream channel and the associated increase in stream temperature. Sources of sediment typically include road/stream crossings, runoff from agricultural operations, streambank erosion, runoff from impervious surfaces and construction practices, and shoreline erosion. Excessive quantities of nutrients, particularly phosphorus, are also a pollutant of concern in watersheds and are often the major pollutant in lake ecosystems. The addition of artificially high amounts of nutrients contributes to high levels of algae and aquatic plant growth. As these plants eventually die off, they can consume dissolved oxygen and thus degrade fish habitat. Nutrient inputs are often tied closely to agriculture production and residential development, and can come from such sources as fertilizer use, septic systems and animal waste. Oftentimes the protective shoreline vegetation is removed as a result of development or production decreasing the filtering capabilities. Loss of the natural shoreline can contribute to erosion, accelerate nutrient runoff, eliminate wildlife habitat, and reduce the effectiveness of nutrient uptake by root systems. Other common watershed pollutants include such things as thermal pollution, pathogens, oils and greases, fluctuating water levels, salts, metals, animal waste, and organic matter. The following maps highlight potential areas of nonpoint source pollutants. Detailed field inventories and surveys should be completed in order to identify actual problem sites within the watershed.

Rifle-Au Gres-Tawas Rivers—HUC: 04080101 Rapid Watershed Assessment
Page | 22
6.1 Agriculture Areas Agriculture is an important land use in the area and makes up nearly 30% of the watershed. The market value of agriculture products for Arenac, Iosco and Ogemaw counties is nearly 60 million dollars per year according to the 2002 Agriculture Census data. This is an increase of 66% from the 1987 values. Agriculture is an important economic and community factor within the watershed. However, agricultural practices on the land, particularly near riparian corridors, may negatively influence water quality and can contribute to soil loss. The over-application of fertilizers and animal waste near the water’s edge can introduce excessive amounts of nutrients such as nitrogen and phosphorus into the river system. Animal waste can also contribute to increased bacteria levels in local waterbodies. Sediment runoff from cropland and livestock also can contribute to soil loss and increased deposits in the water. According to the 2002 Agriculture Census data there are 424 farms with livestock and over 34,000 animals in the watershed. Map 12 indicates that there are 6,769 acres of cropland adjacent to waterbodies.
Map 12: Croplands Adjacent to Waterbodies
(Highlighted in Yellow)

Rifle-Au Gres-Tawas Rivers—HUC: 04080101 Rapid Watershed Assessment
Page | 23
Map 13 shows there are 4,084 acres of cropland adjacent to waterbodies with soils that are more erodible. These locations are more likely contributing sediment and nutrients to the watershed and should be considered a higher priority for management practices. There are several conservation practices that can be applied in order to mitigate agricultural impacts on water quality and habitat loss. These may include vegetative buffers, grade stabilization structures, fencing, water crossings, alternate watering facilities and nutrient management programs.
Map 13: Croplands Adjacent to Waterbodies with Highly Erodible Soils
(Highlighted in Yellow)

Rifle-Au Gres-Tawas Rivers—HUC: 04080101 Rapid Watershed Assessment
Page | 24
6.2 Road/Stream Crossings There are over 1,000 road/stream crossings identified within the watershed. Road crossings are often a conduit for nonpoint pollution when excessive soils from roads and/or eroding embankments flow into a stream. For many high-quality coldwater streams, sediment from road/stream crossings is the number one source of pollution. In addition, runoff from roads carries other pollutants such as salt and other deicers and fluids from automobiles including oil, gas and antifreeze. Road crossings located on back roads (gravel or sand surface) and those with steep approaches typically exhibit the most severe runoff and erosion problems. Road crossings are also potential barriers to fish if a culvert is perched or undersized. This is most commonly seen on smaller headwater streams that are typically ideal nursery areas for fish and other aquatic animals. In addition, some road crossings are popular access sites for fishing, canoeing or swimming, contributing to erosion problems.
Map 14: Road/Stream Crossings

Rifle-Au Gres-Tawas Rivers—HUC: 04080101 Rapid Watershed Assessment
Page | 25
Map 15 shows areas where road crossings are located in areas with highly erodible soils. These sites, especially if located on non-paved roads, would be considered a high priority from a water quality standpoint. Soils with higher erodibility are more susceptible to sheet and rill erosion by water. Therefore these are the crossings which should have higher probability of erosion problems and contributing sediment to the streams.
Map 15:
Road Crossings with Highly Erodible Soils
There are numerous practices to lessen the impact of road crossings on water quality. Huron Pines developed a Better Backroads Guidebook to encourage and provide guidelines for managerial, structural and vegetative best practices. Road crossing improvements include hardening the approaches, installing diversion outlets, replacing the existing structure with a larger culvert or preferably a bridge, revegetating disturbed areas and stabilizing embankments. Road commissions are also encouraged to improve their grading and de-icing practices at road crossings.
Ogemaw 126 Crossings Iosco 159 Crossings Arenac 192 Crossings Total 477 Crossings

Rifle-Au Gres-Tawas Rivers—HUC: 04080101 Rapid Watershed Assessment
Page | 26
6.3 Dams and Barriers
Dams and other physical barriers on rivers and streams can create numerous ecological problems and can contribute to the decline of water quality. Many fish and other species must be able to move throughout the river system in order to successfully fulfill their life-cycle needs. When a dam or other barrier obstructs their passage it can contribute to a degradation of the species. In addition to impeding fish passage, barriers also contribute to changes in the stream geomorphology and temperature of a river system. Most dams create an upstream impoundment that can increase the overall river temperature, back up sediment and contribute to downstream erosion. Map 16 shows the location of 101 dams throughout the watershed. This information was obtained from a database compiled by the DEQ and DNR based on topographic maps and aerial photography.
Map 16: Dam Locations

Rifle-Au Gres-Tawas Rivers—HUC: 04080101 Rapid Watershed Assessment
Page | 27
6.4 Invasive Species Invasive species, whether plant or animal, are species that are non-native to the Great Lakes basin and were either intentionally or accidentally released. The Great Lakes basin is very susceptible to invasives because of the transatlantic shipping industry, and it is estimated that there are over 180 invasive species now present. Invasive species can be very disruptive to existing ecosystems because they typically have no natural predators. They can outcompete and displace native populations, disrupt the food web, and in some cases can be a threat to human health. The presence of non-native species also has a significant economic impact. Millions of dollars have already been spent to control invasive species. There has been an increase in the use of pesticides and herbicides to control non-native plant species, fish populations have declined in areas and many public intake pipes are clogged regularly, resulting in vigilant and costly control programs. Map 17 shows areas within the Rifle-Au Gres-Tawas Watershed where round goby, purple loosestrife, sea lamprey and zebra mussels have been located. (Note: there are numerous other species present and GIS datasets were only available for the species listed above.)
Map 17: Location of Invasive Species
6.5 Impaired Waterbodies
The State of Michigan has established water quality standards in which waterbodies must meet established designated uses. Designated uses are recognized uses of water established by state and federal water quality programs. In Michigan, the goal is to have all waterbodies meet all designated uses.

Rifle-Au Gres-Tawas Rivers—HUC: 04080101 Rapid Watershed Assessment
Page | 28
Designated Uses 1 Agriculture 2 Industrial water supply 3 Public water supply at the point of
intake 4 Navigation 5 Warmwater fishery 6 Other indigenous aquatic life and
wildlife 7 Partial body contact recreation 8 Total body contact recreation
between May 1 and October 31 9 *Coldwater fishery *Only certain waterbodies are designated as coldwater fishery If a waterbody is not meeting one or more designated uses it becomes classified as impaired. The following is a list of impaired waterbodies provided by DEQ.
Table 9: Impaired Waterbodies
Name Stretch Problem Summary Comments 1 Au Gres River Turtle Road to
Saginaw Bay confluence
Habitat modification Channelization
Poor habitat rating resulting from row crop sedimentation and livestock feeding. High Total Dissolved Solids (TDS) concentrations near Mackinac Road. River channelization at mouth.
2 Cedar Creek Drain
Vicinity of Twining, from M-65 to Au Gres confluence
Habitat modification Channelization
Untreated sewage—a treatment system was installed to resolve discharge problems to surface water—sources eliminated.
3 Elm Creek National City Road to Au Gres confluence
Habitat modification Channelization
Modified riparian area Possible new drainage channel. High TDS concentrations.
4 Rifle River Saginaw Bay confluence to 1 mile of US 23
Fish Consumption Advisory (FCA) for PCBs Mercury in fish tissue
Elevated Polychlorinated biphenyls (PCBs) in Redhorse Sucker and Rock Bass. Fish tissue mercury problem added in 2005.
5 Rifle River Stover Road Bridge Mercury Monitoring indicated elevated mercury concentrations.
6 Saginaw Bay Singing Bridge Beach
US 23 Singing Bridge and drainage from East Branch Au Gres (Whitney Drain) to Lake Huron along Turner Road
Pathogens In 2005 monitoring data collected over a 16-week total body contact recreation period indicated E. coli levels exceeded water quality standards three times.
7 Tawas River Lake Huron to Tawas Lake
Fish Consumption Advisory for PCBs
Consumption advisory for Northern Pike > 22” for women and children.
8 Tuttle Drain Au Sable Road to Silver Creek confluence
Habitat modification Channelization
Maintained drain, 1996 survey found poor fish community.
Impaired waterbodies are highlighted in red.
Map 18: Impaired Waterbodies

Rifle-Au Gres-Tawas Rivers—HUC: 04080101 Rapid Watershed Assessment
Page | 29
7.0 Resource Concerns Resource concerns in the watershed include soil loss, water quality impairment, loss of productive farmlands, habitat fragmentation and degradation, increased nutrient input and lack of coordinated land use policies aimed at protecting natural resources.
Table 10: Resource Concerns
Watershed Concerns Source Cause Sedimentation Eroding streambanks Removal of vegetation
Livestock access Foot access Ice damage Fluctuating flow
Poor road/stream crossings
Runoff from steep and/or unpaved approaches Embankment erosion from undersized culverts, road grading practices, foot traffic
Stormwater runoff Artificial drainage, directing polluted runoff to waterbodies
Cropland erosion Inadequate buffers, farming practices
Loss of productive farmlands Parcel subdivision Increased development
Invasive species Inadequate control/prevention measures
Lack of proper stewardship
Availability and types of assistance programs isn’t widely known
Loss of productive soils
Erosion from runoff
Financial hardship Demographic changes Taxes Availability and types of assistance programs isn’t widely known
Marginal lands Lands were marginal to begin with compounding farming problems

Rifle-Au Gres-Tawas Rivers—HUC: 04080101 Rapid Watershed Assessment
Page | 30
Watershed Concerns Source Cause Habitat fragmentation/degradation Loss of riparian
corridor Removal of vegetation Increased development Agriculture practices Recreational use
Road/stream crossings Increased water temperature Turbidity Sedimentation Direct conduit of road runoff
Compromised coastal areas
Increased development Artificial drainage Invasive species Water levels
Loss of wetlands Increased development Artificial drainage
Marginal farming practices
Financial hardships
Channelization Flashiness Sedimentation Erosion
Increased nutrients Septic, sewage effluent
Poor/malfunctioning septic systems
Residential fertilizers Over application Crop fertilizers Poorly timed application Stormwater runoff Poor design Livestock waste Runoff from pastures/fields
Water quality Pathogens Sewage, livestock access PCB accumulation Point source Mercury deposition Atmospheric deposition Chemical changes Runoff from developed,
residential and agricultural lands
Thermal pollution Stormwater runoff Impoundments Removal of riparian zone
Unplanned development Land fragmentation and parcel splits
Lack of coordinated planning which include up-to-date land conservation planning principles
Increasing development
Lack of coordinated planning which include up-to-date land conservation planning principles
Lack of proper zoning Lack of coordinated planning which include up-to-date land conservation planning principles

Rifle-Au Gres-Tawas Rivers—HUC: 04080101 Rapid Watershed Assessment
Page | 31
8.0 Priority Goals for 2008-2012 The goals for the Rifle-Au Gres-Tawas Watershed are based on past studies conducted in the watershed, information gathered in developing the Resource Profile and input provided by the Steering Committee. The goals are aimed at protecting the water quality and wildlife habitat and address resource concerns of the watershed. Milestones were identified indicating the steps needed to reach the objective. Implementing most objectives requires a combination of three types of activities. These include 1) implementing structural and/or vegetative Best Management Practices, 2) reviewing and modifying existing projects, programs and ordinances, and 3) designating and implementing education and information activities. (Many of the objectives, especially those related to education, will be an ongoing effort. Once the objective is achieved it may be prudent to modify and/or begin the tasks again.) The following goals are broken into four categories: Land Use, Erosion & Sedimentation, Agriculture, and Outreach & Education.
8.1 Land Use Goal: Institute responsible land use protection and public policy to protect parcels within the watershed that provide groundwater recharge, key wildlife habitats, headwater stream protection, important wetland functions, coastal areas, etc.
1) Identify and map environmentally sensitive parcels and ecological corridors
throughout the watershed and prioritize areas to work with landowners on a voluntary basis to improve land stewardship practices on the most critical parcels. a. Key Partners: Huron Pines, County Foresters, NRCS b. Tasks:
i. Identify mapping criteria ii. Develop GIS database to be used in planning/implementation
decisions iii. Present data to partners
c. Cost: $10,000 to develop a GIS database
2) Meet individually with at least 20 landowners each year to promote and implement land stewardship practices. a. Key Partners: Huron Pines, Saginaw Bay RC&D, Conservation Districts,
County Foresters, NRCS b. Tasks:
i. Compile landowner contact information ii. Contact landowners via direct mail, local meetings, etc. iii. Prepare land stewardship materials for landowners iv. Meet with property owners to address needs and develop a plan for
implementation v. Promote cost share programs available to landowners
c. Cost: $10,000/yr for site visits

Rifle-Au Gres-Tawas Rivers—HUC: 04080101 Rapid Watershed Assessment
Page | 32
3) Assist interested landowners of environmentally sensitive parcels with the voluntary protection of their property through a donated conservation easement program. Secure 5 easements per year in the watershed. a. Key Partners: Saginaw Bay Land Conservancy, HeadWaters Land
Conservancy b. Tasks:
i. Conservancies meet to discuss priorities and opportunities for collaboration
ii. Target outreach program to key landowners iii. Meet with interested landowners and develop permanent deed
restrictions c. Cost: $20,000/yr
4) Provide sample ordinance language to local planning commissions that incorporates the principles of Better Site Design & Low Impact Development; conduct at least 5 presentations each year on this topic during part of regular planning commission meetings. a. Key Partners: Huron Pines (coordinating with help from outside
consultants) b. Tasks:
i. Review local ordinances to identify gaps ii. Provide sample ordinance language to planning commissions iii. Actively promote modern solutions including low impact
development principles, site plan reviews, schematics, etc. iv. Highlight regional planning success stories v. Promote rural community character of the watershed vi. Conduct presentations at township, county and planning
commission meetings vii. Make information accessible via the internet
c. Cost: $2,500/yr
5) Provide training for planning and zoning commissioners on issues related to watershed protection; offer programs every year. a. Key Partners: MSU Extension, Huron Pines b. Tasks:
i. Obtain funding to host seminars ii. Coordinate training seminars for local planning and zoning
personnel iii. Conduct periodic follow-up seminars regarding new planning
issues iv. Complete a “Citizens Planner” program for the area
c. Cost: $3,000/yr
6) Encourage watershed-wide land use collaboration. a. Key Partners: MSU Extension, Huron Pines, Conservation Districts b. Tasks:

Rifle-Au Gres-Tawas Rivers—HUC: 04080101 Rapid Watershed Assessment
Page | 33
i. Provide watershed information and goals to local decision makers ii. Promote regional collaboration iii. Encourage local leaders to support conservation efforts and
programs c. Cost: $2,000/yr
8.2 Agriculture Goal: Identify sites contributing to water quality problems and
work with producers to implement Best Management Practices.
1) Perform a field inventory and identify agriculture sites contributing nonpoint source pollution to waterbodies. a. Key Partners: Huron Pines, NRCS, Conservation Districts, Saginaw Bay
RC&D b. Tasks:
i. Begin by inventorying sites within the riparian zone where soils have a higher erodibility factor
ii. Prioritize sites based on water quality and habitat impacts iii. Share results with agencies capable of implementing agriculture
BMPs iv. Contact producers and make cost share programs available to them
c. Cost: $20,000
2) Direct funding programs to priority agriculture issues within the watershed (e.g. filter strips, livestock access, fencing, tillage practices, soils tests, etc.). a. Key Partners: NRCS, Conservation Districts b. Tasks:
i. After inventories are completed evaluate the most cost effective way to protect water quality and wildlife habitat
ii. Target outreach, workshops and landowner meetings to address primary concerns
iii. Develop or direct cost-share programs to priority areas c. Cost: $50,000/year
3) Reduce confusion among public about the myriad of programs available by focusing on establishing filter strips and other related practices over the next five years. a. Key Partners: Conservation Districts, NRCS, MSU Extension b. Tasks:
i. Conduct a coordinate effort among agencies and make sure everyone has the same filter strip language and information displayed (avoid jargon, acronyms and complicated issues)
ii. Conduct presentations and send out press releases specific to filter strips
iii. Identify specific producers that could use filter strips iv. Direct mail to those producers and follow-up by phone
c. Cost: $2,000

Rifle-Au Gres-Tawas Rivers—HUC: 04080101 Rapid Watershed Assessment
Page | 34
4) Make programs more user friendly, eliminate the overuse of acronyms for
conservation programs. a. Key Partners: NRCS, Conservation District, and all other partners b. Tasks:
i. Ensure all conservation providers read, understand and agree to the importance of using language that resonates well with the public
ii. After one year, conduct internal “audit” of outreach materials produced pre- and post-goal and compare number of acronyms
iii. Conduct same assessment with target audience to determine if there is a noticeable difference
iv. Share results with conservation partners c. Cost: No additional costs
5) Encourage and promote farmland preservation programs where appropriate.
a. Key Partners: NRCS, MDA, land conservancies b. Tasks:
i. Promote the rural community character of the watershed and how agriculture is a key component
ii. Make programs accessible and understandable to producers iii. Identify likely participants and send information iv. Host at least 3 small “town hall” meetings to discuss the program v. Meet with at least 20 interested landowners vi. Enroll properties into preservation programs
c. Cost: $15,000/year
6) Promote projects in order to focus attention on success stories. a. Key Partners: Conservation Districts b. Tasks:
i. Identify 2-3 agriculture projects in each county ii. Obtain permission of producers to highlight projects iii. Post on websites and submit press releases iv. Host watershed tours to highlight successful implementation
projects v. Make information accessible via the internet
c. Cost: $2,000/year
8.3. Erosion and Sedimentation Goal: Identify sites that are unnaturally adding sediment to the river system and implement a system of Best Management Practices where possible.
1) Conduct a field inventory of all road-stream crossing sites.
a. Key Partners: Huron Pines, Saginaw Bay RC&D, road commissions b. Tasks:
i. Inventory sites, complete data sheets, take photographs ii. Estimate pollutant loading

Rifle-Au Gres-Tawas Rivers—HUC: 04080101 Rapid Watershed Assessment
Page | 35
iii. Determine BMPs iv. Develop cost estimates v. Rank sites vi. Present results to road commission and other partners vii. Make information accessible via the internet
c. Cost: $20,000
2) Conduct an inventory of dams and other barriers in the watershed. a. Key Partners: USFWS, DNR, DEQ, Huron Pines, Saginaw Bay RC&D,
Trout Unlimited b. Tasks:
i. Inventory sites, complete data sheets, take photographs ii. Determine ownership iii. Develop recommendations for maintenance or removal iv. GPS and map each location v. Rank sites vi. Present results to partners vii. Make information accessible via the internet
c. Cost: $25,000
3) Conduct inventory of likely erosion areas on the Rifle, Au Gres and Tawas rivers, including access sites, locations and abundance of invasive species and streambank erosion. a. Key Partners: Saginaw Bay RC&D, Rifle River Watershed Restoration
Committee, NRCS, Huron Pines, Trout Unlimited b. Tasks:
i. Inventory sites, complete data sheets, take photographs ii. Estimate pollutant loading iii. Determine BMPs iv. Develop cost estimates v. Rank sites vi. Present results to partners vii. Make information accessible via the internet
c. Cost: $10,000/yr 4) Implement BMPs at the 20 most important sites within watershed --
(approximately 4 per year throughout the watershed) a. Key Partners: Road Commissions, U.S. Fish &Wildlife Service, Trout
Unlimited, Rifle River Watershed Restoration Committee, Saginaw Bay RC&D, Huron Pines, DEQ
b. Tasks: i. Select priority sites ii. Prepare engineer designs iii. Raise funds iv. Obtain appropriate permits v. Install BMPs

Rifle-Au Gres-Tawas Rivers—HUC: 04080101 Rapid Watershed Assessment
Page | 36
c. Cost: $200,000/yr 5) Continue efforts in City of West Branch to implement stormwater Best
Management Practices by implementing one to two key sites each year. a. Key Partners: City of West Branch, Ogemaw Conservation District,
MDOT, Huron Pines, MSU Extension, NRCS b. Tasks:
i. Select priority sites based on 2005 inventory results ii. Funding secured for first year of site implementation
c. Cost: $50,000/yr 6) Inventory stormwater outfalls in other potential problem areas throughout
watershed. a. Key Partners: Huron Pines, NRCS b. Tasks:
i. Identify high priority areas to conduct an inventory ii. Develop BMPs iii. Estimate pollutant loading iv. Estimate implementation costs v. Present general stormwater recommendations to partners vi. Make information accessible via the internet
c. Cost: $30,000 7) Continue efforts of Rifle River Watershed Restoration Committee to stabilize key
streambank erosion sites on the Rifle River. a. Key Partners: Saginaw Bay RC&D, Rifle River Watershed Restoration
Committee, NRCS, Huron Pines, DNR b. Tasks:
i. Update original inventory and remove sites that have been stabilized
ii. Revisit problem sites and develop BMPs and cost estimates iii. Make information accessible via the internet iv. Submit a collaborative restoration grant by partners in order to
fund additional work c. Cost: $50,000/yr
8) Install native plant buffers along lakes and streams to reduce runoff, minimize erosion, and improve the quality of riparian wildlife habitat. Do approximately 5 sites each year and highlight as demonstration projects to help educate landowners. a. Key Partners: Huron Pines, Conservation Districts b. Tasks:
i. Develop promotional materials for landowners ii. Identify potential sites iii. Develop conceptual designs iv. Create cost-share and maintenance agreements with landowners

Rifle-Au Gres-Tawas Rivers—HUC: 04080101 Rapid Watershed Assessment
Page | 37
v. Order plant materials vi. Install greenbelts
c. Cost: $15,000/yr
9) Develop a monitoring program to determine if best management practices are effective at protecting water quality. a. Key Partners: DEQ, Huron Pines, NRCS, Trout Unlimited, Rifle River
Watershed Restoration Committee b. Tasks:
i. Create an interactive database where all monitoring results will be stored and easily accessible
ii. Develop a GIS database of all locations and findings iii. Make information accessible via the internet iv. Obtain funding for consistent water quality monitoring v. Develop volunteer monitoring program for water chemistry and
biological assessments 1. Develop monitoring criteria (location, frequency,
parameters, etc.) 2. Host training program
vi. Perform stream geomorphology assessments at locations with BMP installation 1. Host trainings for partners implementing BMPs 2. Gather existing stream data prior to implementation 3. Perform a post-assessment after BMPs have been installed
to determine if the stream was restored to a more natural condition
c. Cost: $8,000/yr
8.4 Education & Outreach Goal: Increase and develop citizen involvement/public awareness and responsible use of the watershed through stewardship and education.
1) Establish ongoing education program (workshops, television and radio PSAs,
watershed newsletter distributed via community businesses) to promote activities landowners can do to improve water quality. a. Key Partners: Conservation Districts, Huron Pines, Saginaw Bay RC&D
MSU Extension b. Tasks:
i. Focus on greenbelts, rain gardens, exotic species control, soil testing and proper fertilizer use, and hazardous waste disposal
ii. Develop concise and consistent messages iii. Create a list of contacts for citizens iv. Align educational materials and key messages among partners v. Make information accessible via the internet
c. Cost: $10,000/yr

Rifle-Au Gres-Tawas Rivers—HUC: 04080101 Rapid Watershed Assessment
Page | 38
2) Develop watershed protection packets of information that real estate agents would hand out to new landowners at the time of property purchase. a. Key Partners: Conservation Districts b. Tasks:
i. Develop packets ii. Discuss with individual real estate agents and provide information
to those willing iii. Follow-up with agents one year later to determine how effective
c. Cost: $5,000 (one time cost for printing, packet development) 3) Develop and install watershed interpretive signs at 30 key locations
a. Key Partners: Huron Pines, road commission, sign company b. Tasks:
i. Work with partners to identify key messages & locations for signage
ii. Solicit bids for development of signs iii. Install sign
c. Cost: $20,000 (one time cost) 4) Host yearly workshop on soil erosion control for construction contractors
throughout the watershed. As an incentive, develop some sort of certification program/approval process that they can use to help expedite permits (including DEQ) more quickly. a. Key Partners: County Soil Erosion officers, DEQ Land & Water
Management Division Staff, NRCS staff b. Tasks:
i. Design incentive program to hook contractors in ii. Contact contractors to determine interest iii. Arrange workshop details and publicity iv. Host workshop
c. Cost: $0 (Should be able to pull together through the use of existing agency staff resources, just need coordination)

Rifle-Au Gres-Tawas Rivers—HUC: 04080101 Rapid Watershed Assessment
Page | 39
Footnotes/Bibliography 1. Hydrologic Unit Boundary maps. Natural Resources Conservation Service Geospatial Data Gateway. http://datagateway.nrcs.usda.gov/NextPage.aspx?Progress=1&AValue=1&QuickCounty=*&QuickState=Michigan&ExtentMinX=-125.5&ExtentMinY=16.35&ExtentMaxX=-65.0&ExtentMaxY=59.0&HitTab=2 2. National Land Cover Data (NLCD) – Originator: United States Geological Survey (USGS). Information available http://www.mcgi.state.mi.us/mgdl/?rel=ext&action=cext then navigate to counties of interest, then 1992 National Land Cover Dataset. 3. Public Land information is available from http://www.mcgi.state.mi.us/mgdl/?rel=ext&action=cext then Select County, and look under Ownership. 4. Soil Survey Geographical Database (SSURGO) tabular and spatial data were downloaded for the following surveys:
a. Arenac Co., MI (MI011) Published 1967 b. Iosco Co., MI (MI069) Published 2002 c. Ogemaw Co., MI (MI129) Published 1990
5. Metadata and SSURGO data for the above surveys were downloaded from the NRCS Soil Data Mart at https://soildatamart.nrcs.usda.gov/ . Component and layer tables from the tabular data were linked to the spatial data to derive the soil classification found in this section. Visit the online Web Soil Survey at http://websoilsurvey.nrcs.usda.gov/app/ for official and current USDA soil information as viewable maps and tables. 6. Common Resource Area (CRA) Map delineations are defined as geographical areas where resource concerns, problems, or treatment needs are similar. It is considered a subdivision of an existing Major Land Resource Area (MLRA) map delineation or polygon. Landscape conditions, soil, climate, human considerations, and other natural resource information are used to determine the geographical boundaries of a CRA. For more information about a CRA visit http://soils.usda.gov/survey/geography/cra.html 7. Population Statistics were obtained from the US Census Bureau, State and County Quick Facts. http://quickfacts.census.gov/qfd/states 8. Agriculture Census Data was downloaded from the National Agriculture Statistics Service (NASS) website. For more information on individual census queries visit the NASS website at http://www.nass.usda.gov/ 9. Threatened and Endangered Species information was extracted from Michigan Natural Features Inventory (MNFI) 14 digit Hydrologic Unit Codes (HUC) and inserted

Rifle-Au Gres-Tawas Rivers—HUC: 04080101 Rapid Watershed Assessment
Page | 40
into 10 digit HUC. Visit the MNFI website at http://web4.msue.msu.edu/mnfi/ then click on Data Resources and Watershed Element Data to find more information on T&E species. 10. 303d listed streams were derived from Michigan Department of Environmental Quality (MIDEQ) data at the MIDEQ website at http://www.michigan.gov/deq/0,1607,7-135-3313_3686_3728-12711--,00.html 11. Performance Results System (PRS) data was extracted from the PRS homepage by year, conservation systems and practices and Hydrologic Unit Code (HUC) level. For more information on these and other performance reports visit http://ias.sc.egov.usda.gov/prsreport2007/report.aspx?report_id=222 12. Michigan Dams was clipped to the watershed from data generated by the MDEQ. For more information visit http://www.glfc.org/glgis/support_docs/html/lake_GISs/LHGIS_index.htm 13. Invasive Species information was gathered and clipped to the three counties. For more info visit http://www.great-lakes.net/envt/flora-fauna/invasive/mapping.html

Rifle-Au Gres-Tawas Rivers—HUC: 04080101 Rapid Watershed Assessment
Appendix A Page | 1
Agricultural Practices Assessment Matrix The Au Gres-Rifle River Rapid Watershed Agricultural Practices Assessment Matrices and Potential Costs and Benefits Summary Matrix were produced through a consensus process of a NRCS Technical Team. Participants included the District Conservationists and Soil Conservationists assigned to the three counties located within the watershed and who have knowledge of and responsibilities for bringing USDA-Natural Resource Conservation Service (NRCS) programs to the public. Additional assistance was provided by the USDA-NRCS Area Conservationist, the Agriculture Economist and the State Resource Conservationist. The matrix illustration provided in the USDA-NRCS’s Rapid Watershed Assessment promotion brochure was used as a discussion starting point. As there is no established National or State methodology for this work, the procedure discussed in the next paragraphs was followed. Watershed-specific data was obtained from the USDA-NRCS Performance Results System (PRS) for Conservation Practices used in 2004, 2005, and 2006 and planned for 2007. It was assumed that all practices planned for 2007 were implemented. The Technical Team determined that four Land Uses: Cropland, Grazing Land, Wildlife Habitat, and Headquarters were the broad brush categories that most closely reflected agriculture and NRCS programs usage in the Rifle-Au Gres-Tawas Watershed. Next, the Technical Team determined which of the practices would best represent Bench Mark (BM) conditions for each of the Land Uses. Bench Mark conditions can also be thought of as “baseline” or “existing” conditions as of 2007. The BM numbers are the starting measurements used for determining future benefits. After establishing the Bench Marks, the Technical Team organized the practices into typical Resource Management Systems (RMS). The RMSs represent a collection of practices that an agricultural producer or others might use to produce a desired effect for their business and property. The RMS used for each of the Land Uses in this project is theoretical based on recent usage in the Watershed. The USDA-NRCS program arsenal contains many more practices that could be used, but for the sake of manageability, additional practices are not included in this assessment. The RMSs practice acres were determined by taking an average of the 4-year PRS data and then multiplying by 5. For example, the Conservation Crop Rotation Practice acres shown in RMS1 under the Cropland Land Use category is the 4-year average (2,038 / 4 = 509.5) multiplied by 5 years (=2,548). Past usage showed a usage range from 0 (planned for 2007) to 1,260 acres (implemented in 2004). The Technical Team consensus is that a goal of 510 acres of Crop Rotation Practice per year in the watershed is attainable, provided land owners are willing and resources are available. The 5-year goal is given since this is a typical planning timeframe and it allows time to launch a concentrated effort to reach landowners. This rational was used to complete all of the Agricultural Land Use Assessment Matrices. Typical installation cost estimates are based on cost list information provided by the USDA-NRCS State Economist for a suite of USDA-NRCS Conservation Practices that is included

Rifle-Au Gres-Tawas Rivers—HUC: 04080101 Rapid Watershed Assessment
Appendix A Page | 2
in table 2-5. The units in the Matrix Tables are the same as the units used by USDA-NRCS to determine the cost of installing a Conservation Practice. The Resource Concerns for the watershed include: Soil Erosion, Soil Condition, Water Quality, Air Quality, Plant Health, and Animal Habitat. Animal Habitat includes both domestic livestock and wildlife. The Effects of installing RMS practices and for operating and maintaining the BM and RMS practices are assumed to have positive benefits on the Resource Concerns. The Technical Team investigated a number of options for presenting a broad brush illustration of the potential Effects or benefit of putting Conservation Practices on the ground in this watershed. The National and State Conservation Practice Sheets and other developed tools are intended for site-specific evaluation. The Technical Team found little consistency in the templates that are available that could be reasonably applied to such an assessment. Therefore, in lieu of an existing template or tested evaluation model, the Technical Team came to consensus as to whether a Conservation Practice would have a primary benefit, a secondary benefit, or no benefit on each of the six general natural resource concerns. A simple scoring system was developed to give a rough estimate of the relative comparison of practice benefits. The scoring system assigned a numeric value of 4 to every primary benefit, of 1 to every secondary benefit and 0 to no benefit. The Technical Team recognizes that a benefit to one resource concern that might result from using a specific Conservation Practice could have an associated detrimental effect or negative benefit on another resource concern. However, site-specific evaluation of impacts is a required planning step that would be taken before actual installation of a practice. As care is routinely taken to produce the most benefit with the least amount of harm on all natural resources, the Technical Team feels that overall Effects on natural resource concerns at the scale of this assessment would be positive. The Implementation columns of the matrices are reflective of USDA-NRCS Programs available under the 2002 Farm Bill. The Other category suggests that different Programs could become available under the 2008 Farm Bill authorization. The assumption here is that positive portions of 2002 Farm Bill Programs will be incorporated into the 2008 Farm Bill and will not entirely disappear from the public offerings of USDA-NRCS. The relationship of these Assessment Matrices to the Geographic Information System (GIS) Resource Profile is loose due to a lack of easily available data that ties Conservation Practice implementation to the on-the-ground geographic locations. Developing that data set that could illustrate this relationship is beyond the scope of the current project. The acreages given in the Assessment Matrices do not exceed 10% of the land area that appears to be appropriate for the given Land Use as shown on the Resource Profile GIS.

Rifle-Au Gres-Tawas Rivers—HUC: 04080101 Rapid Watershed Assessment
Appendix A Page | 3
The total costs and effects are shown in the table below:
Table 1: Summary of Effects and Costs Cost:
Land Use:
Total Average
Annual Cost for Bench
Mark
Total Average Annual Cost
RMS Practices
Total Average Annual Costs BM & RMS
Investment Cost (new practice
implementation)
Potential Farm Bill Program Cost Share
Cropland $1,069 $314,973 $316,042 $331,370 Grazing Land $4,286 $1,824,065 $1,828,351 $737,675 Wildlife Habitat Upland $1,120 $81,597 $82,717 $415,193 Wildlife Habitat Wetland $244 $256,098 $256,342 $2,353,955 Headquaters $26,607 $246,399 $273,006 $1,202,108 Totals $33,326 $2,723,131 $2,756,458 $5,040,301 $2,520,151 Present Value of Bench
Mark $144,796 BM Effects Pts
133
Present Value of RMS $11,831,461
RMS Effects Pts 446
Present Value of Total Costs $11,976,257
Cumulative Effects Points 579

Rifle-Au Gres-Tawas Rivers—HUC: 04080101 Rapid Watershed Assessment
Appendix A Page | 4
Agricultural Practices Assessment Matrices by Land Use
TABLE 2: Future Conditions for Cropland Management Systems Quantity Costs1 Effects2
Implementation3
Practices Unit Quantity Investment Cost
Annual O&M Cost X 5 years
Soil Erosion
Soil Condition
Water Quality
Air Quality
Plant Health
Animal Habitat
E Q I P
W H I P
W R P
O T H E R
BM14 Current Conditions Total Ac.6 2,038 4 1 4 1 4 1 Conservation Crop Rotation Ac. 2,038 ------------ $0 P S P S P S
RMS15 5 year Future Conditions Total Ac.7 22,756 ----------- --------- 21 20 33 23 27 8 Conservation Crop Rotation Ac. 2,548 $1,688 $0 P S P S P S X X Filter Strip Ac. 100 $23,750 $5,873 S S P S S S X X Grassed Waterway Ac. 4 $19,000 $4,627 P S P S S N X Nutrient Management Ac. 4,446 $35,920 $8,747 N P P N P N X Pest Management Ac. 5,185 $405,000 $98,618 N S P P P N X Residue Management, Mulch Till Ac. 3,408 $25,560 $6,224 P P P P P S X Residue Management No-Till/Strip Till Ac. 1,088 $8,156 $1,986 P P P P P S X Waste Utilization Ac. 5,974 $112,012 $27,275 N P P P P N X Windbreak/Shelterbelt Establishment Ac. 3 $27,687 $6,742 P N S P S P X X X X
Total RMS Costs $658,773 $156,181 RMS1 AND MAINTENANCE POTENTIAL BENNEFIT 25 21 37 24 31 9
Possible High Score8 40 40 40 40 40 40

Rifle-Au Gres-Tawas Rivers—HUC: 04080101 Rapid Watershed Assessment
Appendix A Page | 5
TABLE 3: Future Conditions for Grazing Land Management Systems Quantity Costs1 Effects2 Implementation3
Practices Unit Quantity Investment Cost
Annual O&M Cost X 5 years
Soil Erosion
Soil Condition
Water Quality
Air Quality
Plant Health
Animal Habitat
E Q I P
W H I P
W R P
O T H E R
BM14 Current Conditions Total Ac.6 213 8 9 3 2 12 12 Fence Ac. 11 ------------ $30,282 N S S N P P Pasture and Hay Planting Ac. 202 ------------ $21,107 P P S S P P Prescribed Grazing Ac. 202 ------------ $25,252 P P S S P P
RMS15 5 year Future Conditions Total Ac. 280 21 15 23 3 17 27 Fence Ac. 15 $155,455 $37,853 N S S N P P X X Pasture and Hay Planting Ac. 253 $108,675 $26,462 P P S S P P X Animal Trails and Walkways Ac. 1 $41,769 $10,170 P P N S P S X Pipeline Ac. 2 $43,610 $10,619 N N P N N P X Stream Crossing Ac. 2 $90,000 $2,192 P S P N N S X X Use Exclusion Ac. 1 $2,862 $697 P S P N S S X X Water Well Ac. 5 $56,250 $13,697 N N P N N P X Watering Facility Ac. 1 $1,563 $350 S N P N N P X X Prescribed Grazing Ac. 253 ------------ #31,625 P P S S P P X
Total RMS Costs $500,184 $210,336 RMS1 AND MAINTENANCE POTENTIAL BENNEFIT 29 24 26 5 29 39
Possible High Score8 48 48 48 48 48 48

Rifle-Au Gres-Tawas Rivers—HUC: 04080101 Rapid Watershed Assessment
Appendix A Page | 6
TABLE 4: Future Conditions for Wildlife Habitat
Management Systems Quantity Costs1 Effects2 Implementation3 Practices Unit Quantity Investment
Cost Annual
O&M Cost X 5 years
Soil Erosion
Soil Condition
Water Quality
Air Quality
Plant Health
Animal Habitat
E Q I P
W H I P
W R P
O T H E R
BM14 Current Conditions Total Ac.6 1,493 1 1 1 1 1 4 Upland Wildlife Habitat Management Ac. 1,493 ------------ $77,783 S N S N S P
BM2 Current Conditions Total Ac. 543 1 1 4 1 1 4
Wetland Wildlife Habitat Management Ac. 543 ------------- $35,031 S N P N S P
RMS15 5 year Future Conditions Total Ac. 3,115 15 4 12 7 9 24
Upland Wildlife Habitat Management Ac. 1,886 $1,781,650 $433,832 S N S N S P X X X
Conservation Cover Ac. 170 $40,375 $9,831 P S P S S P X X X X Early Successional Habitat
Development/Management Ac. 523 $44,838 $10,918 S N S N P P X X
Hedgerow Planting Ac. 2 $2,720 $662 S S S S S P X X X Riparian Buffer Ac. 70 $49,000 $11,932 P S P S S P X X X Tree/Shrub Establishment Ac. 464 $324,800 $79,089 P S S P S P X X X
RMS2 5 year Future Condition Total Ac. 3,112 14 3 17 10 5 20 Wetland Wildlife Habitat Management Ac. 679 $179,900 $43,805 S N P N S P X X X
Conservation Cover Ac. 170 $40,375 $9,831 P S P S S P X X X X Riparian Buffer Ac. 70 $49,000 $11,932 P S P S S P X X Tree/Shrub Establishment Ac. 464 $324,800 $79,089 P S S P S P X X X Wetland Creation, Enhancement,
Restoration Ac. 1,729 $2,670,688 $650,312 S N P N S P X X
Total RMS Costs $5,508,146 $1,454,047 RMS1 AND MAINTENANCE POTENTIAL BENNEFIT 16 5 13 8 10 28
Possible High Score8 28 28 28 28 28 28 RMS2 AND MAINTENANCE POTENTIAL BENNEFIT 15 4 21 11 6 24
Possible High Score8 24 24 24 24 24 24

Rifle-Au Gres-Tawas Rivers—HUC: 04080101 Rapid Watershed Assessment
Appendix A Page | 7
TABLE 5: Future Conditions for Headquarters Management Systems Quantity Costs1 Effects2 Implementation3
Practices Unit Quantity Investment Cost
Annual O&M Cost X 5 years
Soil Erosion
Soil Condition
Water Quality
Air Quality
Plant Health
Animal Habitat E Q I P
W H I P
W R P
O T H E R
BM14 Current Conditions Total Ac.6 6 5 10 24 6 5 5 Agrichemical Mixing Facility Ac. 1 ----------- $9,131 N S P P N S Heavy Use Protection Ac. 1 ----------- $11,270 P P P N N S Waste Storage Facility Ac. 1 ----------- $331,464 N S P S S S Roof Run off Structure Ac. 1 ----------- $583 S N P N N S Manure Transfer Ac. 1 ----------- $8,116 N P P S P S Well Decommissioning Ac. 1 ---------- ----------- N N P N N N
RMS1 5 year Future Conditions Total Ac. 10 4 5 12 4 0 2 Agrichemical Mixing Facility Ac. 5 $103,125 $25,111 N S P P N S X Well Decommissioning Ac. 1 $2,500 $0 N N P N N N X X Heavy Use Area Protection Ac. 5 $231,413 $56,349 P P P N N S X
RMS2 5 year Future Conditions Total Ac. 10 5 5 17 6 6 7 Manure Transfer Ac. 3 $100,000 $24,350 N P P S P S X Roof Runoff Structure Ac. 3 $7,188 $1,750 S N P N N S X Waste Storage Facility Ac. 1 $1,361,250 $331,464 N S P S S S X Windbreak/Shelterbelt Establishment Ac. 3 $27,688 $6,742 P N S P S P X X X
Total RMS Costs $1,835,664 $806,330 RMS1 AND MAINTENANCE POTENTIAL BENNEFIT 9 15 36 10 5 7
Possible High Score8 36 36 36 36 36 36 RMS2 AND MAINTENANCE POTENTIAL BENNEFIT 10 15 41 12 11 12
Possible High Score8

Rifle-Au Gres-Tawas Rivers—HUC: 04080101 Rapid Watershed Assessment
Appendix A Page | 8
Footnotes Apply to Tables 2-5: 1Costs: The Draft Michigan Statewide Conservation Practice Typical Installation Cost Information FY2008 Update, Section I, Efotg is used as a bases for the installation costs multiplied by 25% to cover items such as permits, acquisition of technical assistance and general administrative costs. The O&M total is derived by multiplying the Installation Cost by 4.87% for 5 years. 2Effects: Conservation Practices in this watershed were determined to have a Primary (P), Secondary (S), or No (N) benefit on each of six general natural Resource Concerns. A point numeric value for the RMS is shown as a total of the potential benefits of all the Conservation Practices being applied: P=4; S=1; N=0. 3Implementation refers to the NRCS Programs that can be applied to help landowners apply conservation practices on their property. 4BM=Bench Mark refers to the current or starting conditions. The numbers are based 0n 2004 through 2006 Applied Practices and 2007 Planned Practices for the watershed as derived from the NRCS Performance Results System (PRS). 5RMS=Resource Management System refers to a suite of conservation practices that would typically be applied to lands to address all the most common resource concerns in the watershed. An individual parcel may have one to all practices in the suite applied. The Conservation Practices selected as typical are based on historic common usage in the watershed. There are many other Practices in the USDA-NRCS arsenal that could be appropriately applied to a Resource Concern. 6Total Acres estimates for both BM and RMS Conditions include a conversion of feet to acres based on the assumption that each linear foot of practice is 10 feet wide: 1 ft. X 10 ft = 10 sq. ft. = 0.002 acre; Hedgerow conversion assumed the minimum 65 ft width for each linear foot; No. of stream crossings, wells and watering facilities, and structures are assumed to be 50 ft. X 50 ft. (each) = 0.516 acre; No acres are included for plans or for well decommissioning; Quantities are expressed to the nearest whole number. 7RMS Acre estimates are based on the Performance Results System history (2004 through 2007) acreage for each practice which was averaged and then multiplied by 5 years to give a per practice acreage estimate; Quantities are expressed to the nearest whole number. No acreage estimates are given for plans or well decommissioning. In general the acreages shown do not exceed 10% of the area where practices might be appropriate and that could be determined from reviewing the Resource Profile GIS of this watershed. 8Possible High Score: The highest possible Effect score for each Resource Concern under each Land Use Category assumes that every Conservation Practice has the potential to be ranked as having a Primary (P) positive effect. Therefore: If P = 4 and the RMS contains 9 possible Conservation Practice Options and all are used, with the addition of the Bench Mark (BM) condition score (for example P=4 and there is only one BM Conservation Practice), then the Possible High Score would be 40.