rieti bbl seminar handout · rieti bbl seminar handout march 11, 2016 ... , jakarta lrt, shia...
TRANSCRIPT
RIETI BBL Seminar
Handout
March 11, 2016Speaker: Dr. Fauziah ZEN
http://www.rieti.go.jp/jp/index.html
Research Institute of Economy, Trade and Industry (RIETI)
“Jokowi's economic policy: What will it take to reach sustainable development?”

2015 Macroeconomic Performance Show Positive IndicatorPositive development despite external pressure
GDP Growth YoY %; Source: BPS Trade USD Juta; YoY; Source: BPS
2014 2015 2014 2015 2014 2015
HH. Cons 5,2 5,0 Agriculture. Forestry. Fisheries 4.2 4.0 Total Trade ‐2.199 (deficit) 7.513 (surplus)
Non ProfitHH Cons 12,2 ‐0,6
Govt. Cons 1,2 5,4
Investment 4,6 5,1
Exports 1,0 ‐2,0
Imports 2,2 ‐5,8
IndonesiaGDP Growth
0.7 (5.1)Mining Industries
Industrial Processing 4.6 4.2Construction 7.0 6.6
Big traders and Wholesale and 5.2 2.5Retail; Automotive Repair
Transportation & Warehouse 7.4 6.7
2014 : 5,0 2015 : 4,8
Exports 175.980
Imports 178.179
Non Oil & Gas 11.242
Exports 145.961
Imports 134.719
Oil & Gas ‐13.441
Exports 30.019
Imports 43.460
・3,6% 150.253 ・14,6%
・4,5% 142.740 ・19,9%
13.574
・2,6% 131.701 ・9,8%
・4,7% 118.127 ・12,3%
‐6.061
・8,0% 18.552 ・38,2%
・4,0% 24.613 ・43,4%
Direct Investment YoY Growth; Source: BKPM Inflation YoY, YTD; Source: BPS Balance of Payment USD Bin, Source: BI
2014 2015 2014 20152014 2015
TOTAL
DDI
・16,2% ・17,8%Rp. 463,1 T Rp. 545,4 T
・21,8% ・15,0%Rp. 156,1 T Rp. 179,5 T
CPI 8,36% 3,35%
CORE INF. 4,93% 3,95%
VOL. FOOD 10,88% 4,84%
Balance of Payment 6,5 ‐4,6
Current Account ‐7,0 ‐4,0(% to GDP) 3,02% 1,95%
Capital & Financial Account 14,7 1,2
FDI ・13,5% ・ 19,2%Rp. 307,0 T Rp. 359,9 T ADM. PRICE 17,57% 0,39% Foreign Reserve
Per Desember 111,8 105,9
1
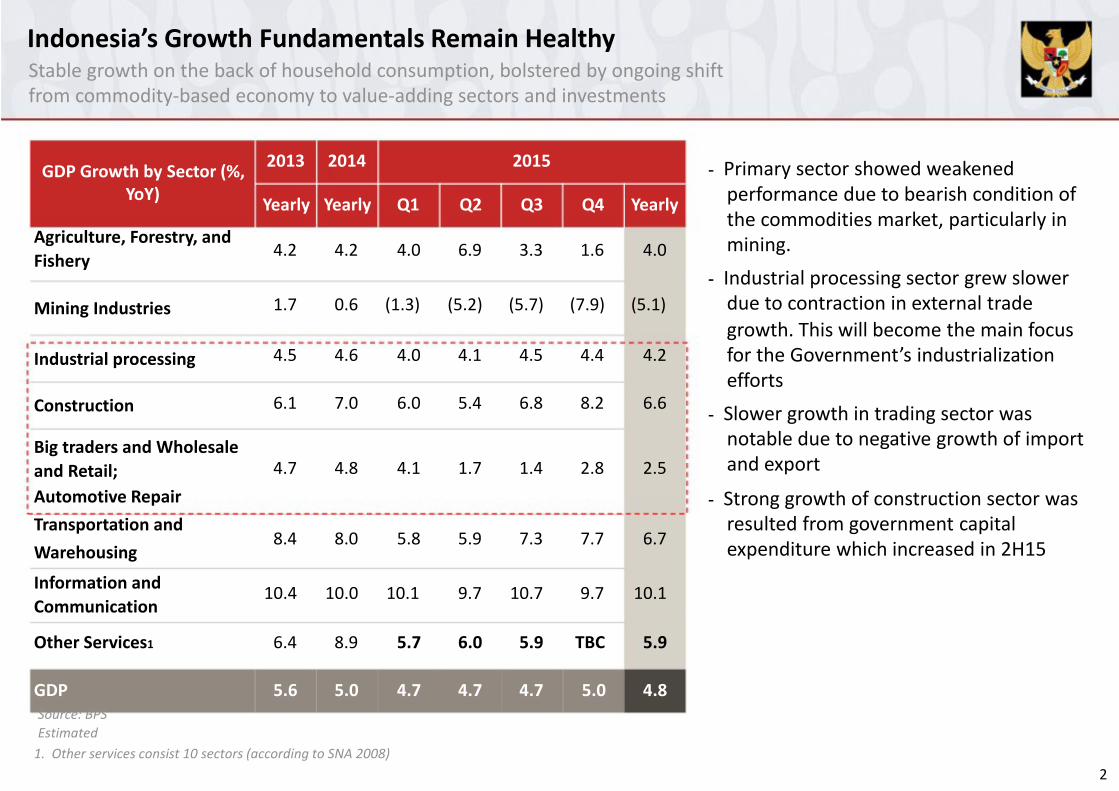
Indonesia’s Growth Fundamentals Remain HealthyStable growth on the back of household consumption, bolstered by ongoing shiftfrom commodity‐based economy to value‐adding sectors and investments
GDP Growth by Sector (%, 2013 2014 2015 - Primary sector showed weakenedYoY)
Agriculture, Forestry, andFishery
Mining Industries
Industrial processing
Construction
Big traders and Wholesaleand Retail;Automotive RepairTransportation andWarehousing
Yearly Yearly Q1
4.2 4.2 4.0
1.7 0.6 (1.3)
4.5 4.6 4.0
6.1 7.0 6.0
4.7 4.8 4.1
8.4 8.0 5.8
Q2 Q3 Q4 Yearly
6.9 3.3 1.6 4.0
(5.2) (5.7) (7.9) (5.1)
4.1 4.5 4.4 4.2
5.4 6.8 8.2 6.6
1.7 1.4 2.8 2.5
5.9 7.3 7.7 6.7
performance due to bearish condition ofthe commodities market, particularly inmining.
- Industrial processing sector grew slowerdue to contraction in external tradegrowth. This will become the main focusfor the Government’s industrializationefforts
- Slower growth in trading sector wasnotable due to negative growth of importand export
- Strong growth of construction sector wasresulted from government capitalexpenditure which increased in 2H15
Information andCommunication
10.4 10.0 10.1 9.7 10.7 9.7 10.1
Other Services1 6.4 8.9 5.7 6.0 5.9 TBC 5.9
GDP 5.6 5.0 4.7 4.7 4.7 5.0 4.8Source: BPSEstimated1. Other services consist 10 sectors (according to SNA 2008)
2
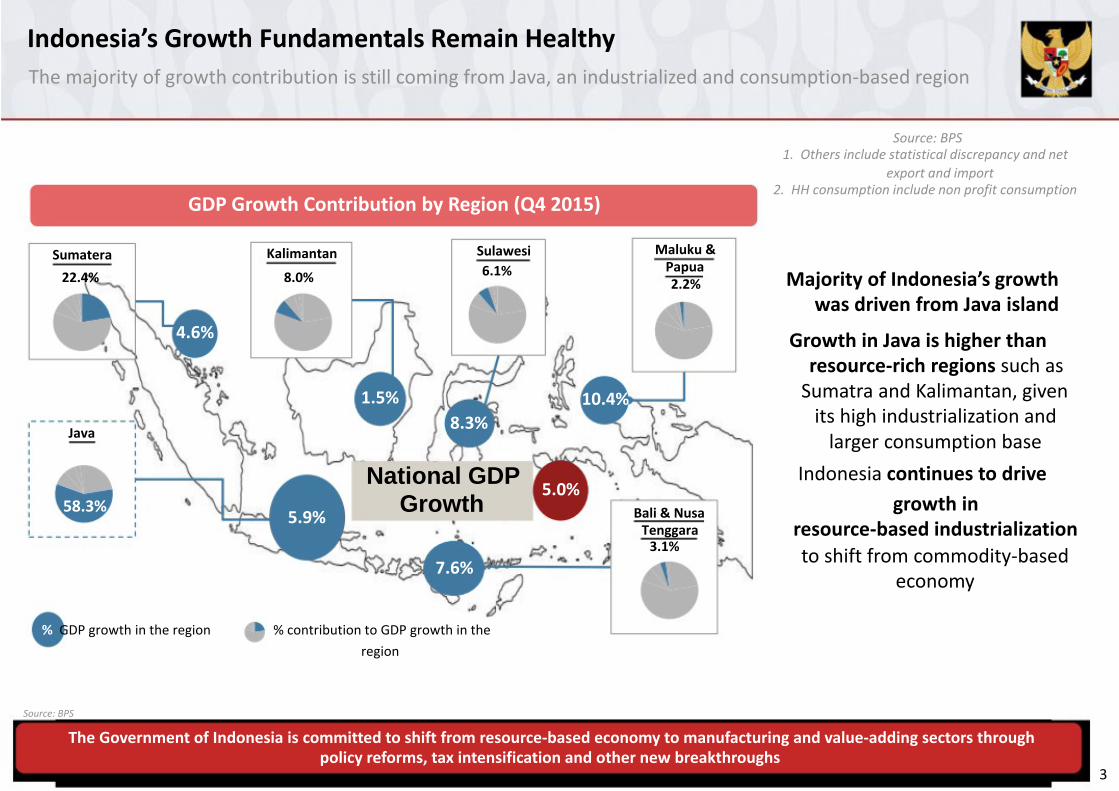
Indonesia’s Growth Fundamentals Remain HealthyThe majority of growth contribution is still coming from Java, an industrialized and consumption‐based region
Source: BPS1. Others include statistical discrepancy and net
export and import2. HH consumption include non profit consumption
GDP Growth Contribution by Region (Q4 2015)
Sumatera22.4%
4.6%
Java
58.3%
Kalimantan
8.0%
5.9%
Sulawesi6.1%
1.5%8.3%
National GDPGrowth
7.6%
Maluku &Papua2.2%
10.4%
5.0%Bali & NusaTenggara3.1%
Majority of Indonesia’s growthwas driven from Java island
Growth in Java is higher thanresource‐rich regions such asSumatra and Kalimantan, givenits high industrialization andlarger consumption base
Indonesia continues to drivegrowth in
resource‐based industrializationto shift from commodity‐based
economy
% GDP growth in the region % contribution to GDP growth in theregion
Source: BPS
The Government of Indonesia is committed to shift from resource‐based economy to manufacturing and value‐adding sectors throughpolicy reforms, tax intensification and other new breakthroughs
3
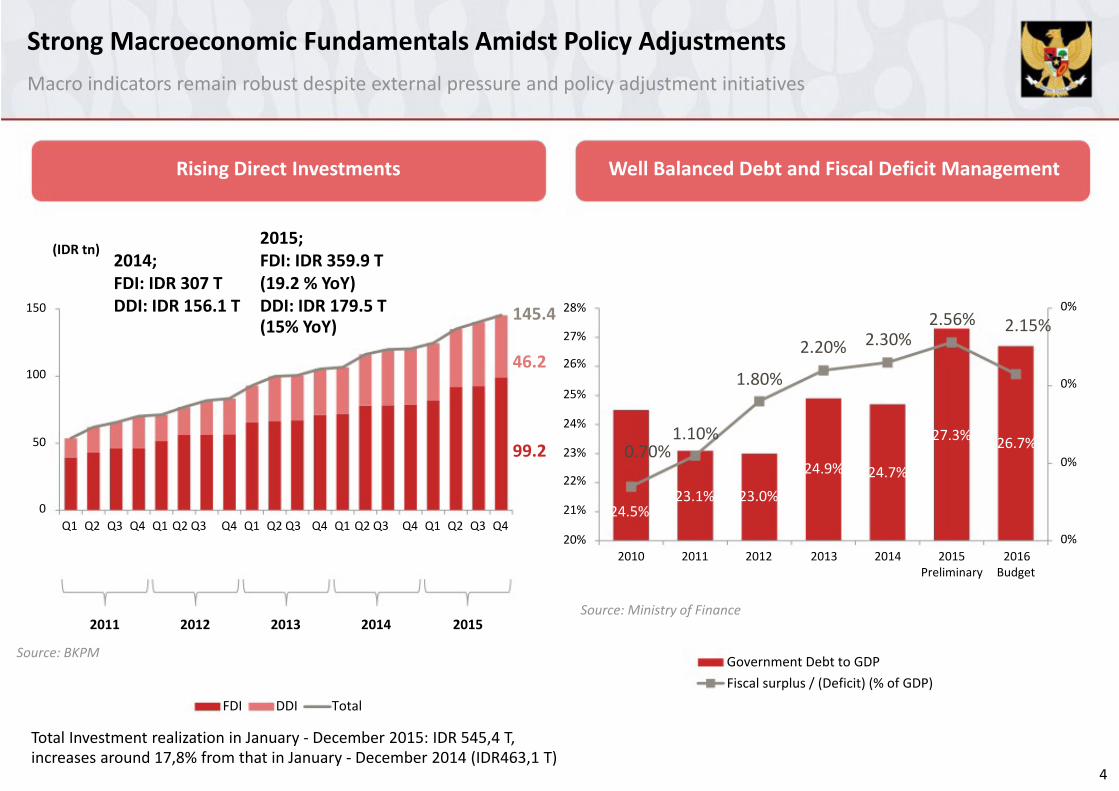
Strong Macroeconomic Fundamentals Amidst Policy AdjustmentsMacro indicators remain robust despite external pressure and policy adjustment initiatives
(IDR tn)
150
Rising Direct Investments
2015;2014; FDI: IDR 359.9 TFDI: IDR 307 T (19.2 % YoY)DDI: IDR 156.1 T DDI: IDR 179.5 T 28%145.4
Well Balanced Debt and Fiscal Deficit Management
2.56%0%
100
50
0Q1 Q2 Q3 Q4 Q1 Q2 Q3
(15% YoY)
Q4 Q1 Q2 Q3 Q4 Q1 Q2 Q3
27%
46.2 26%
25%
24%
99.2 23%
22%
21%Q4 Q1 Q2 Q3 Q4
20%
2.20%
1.80%
1.10%0.70%
24.9%
23.1% 23.0%24.5%
2010 2011 2012 2013
2.30%
27.3%
24.7%
2014 2015Preliminary
2.15%
0%
26.7%0%
0%2016Budget
Source: Ministry of Finance2011 2012 2013 2014 2015
Source: BKPM
FDI DDI Total
Total Investment realization in January ‐ December 2015: IDR 545,4 T,
Government Debt to GDPFiscal surplus / (Deficit) (% of GDP)
increases around 17,8% from that in January ‐ December 2014 (IDR463,1 T)4
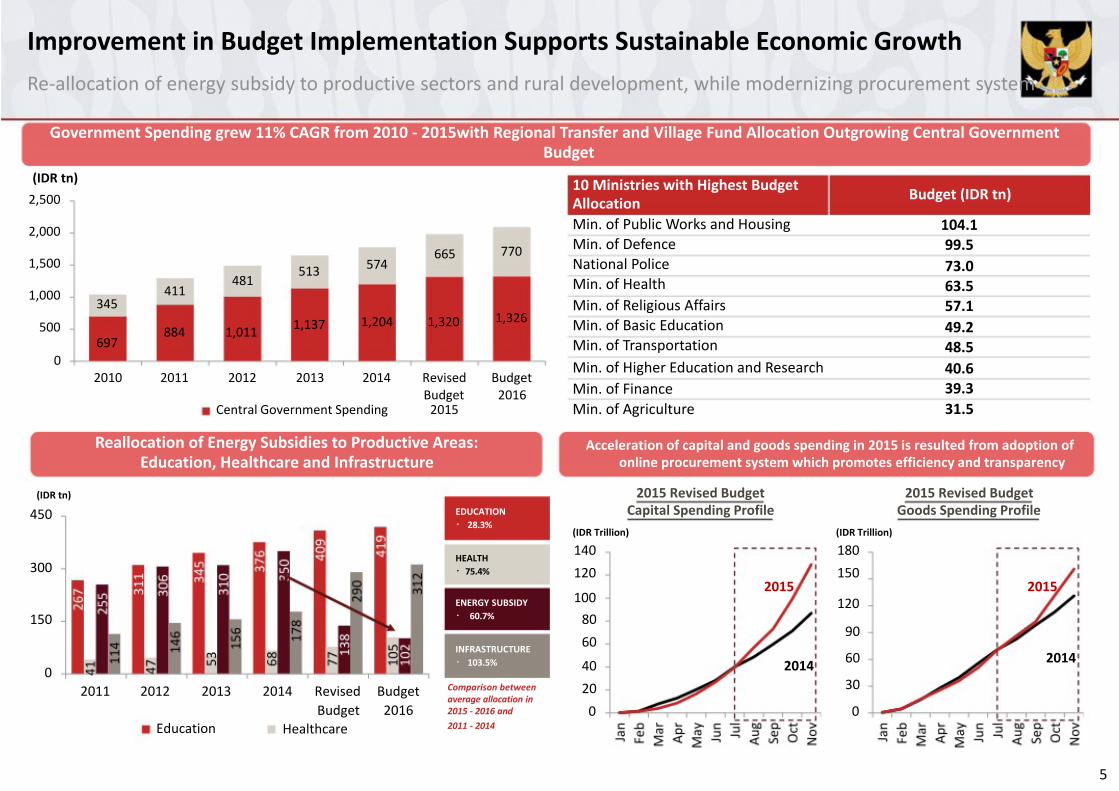
Improvement in Budget Implementation Supports Sustainable Economic GrowthRe‐allocation of energy subsidy to productive sectors and rural development, while modernizing procurement system
Government Spending grew 11% CAGR from 2010 ‐ 2015with Regional Transfer and Village Fund Allocation Outgrowing Central GovernmentBudget
(IDR tn)2,500
2,000
1,500
1,000
500
0
481411
345
884 1,011697
2010 2011 2012
513
1,137
2013
665574
1,204 1,320
2014 RevisedBudget
770
1,326
Budget2016
10 Ministries with Highest BudgetAllocationMin. of Public Works and HousingMin. of DefenceNational PoliceMin. of HealthMin. of Religious AffairsMin. of Basic EducationMin. of TransportationMin. of Higher Education and ResearchMin. of Finance
Budget (IDR tn)
104.199.573.063.557.149.248.540.639.3
(IDR tn)
450
300
Central Government Spending 2015
Reallocation of Energy Subsidies to Productive Areas:Education, Healthcare and Infrastructure
EDUCATION・ 28.3%
HEALTH・75.4%
Min. of Agriculture 31.5
Acceleration of capital and goods spending in 2015 is resulted from adoption ofonline procurement system which promotes efficiency and transparency
2015 Revised Budget 2015 Revised BudgetCapital Spending Profile Goods Spending Profile
(IDR Trillion) (IDR Trillion)
140 180120 150
150
02011 2012 2013
Education
2014 Revised BudgetBudget 2016
Healthcare
ENERGY SUBSIDY・ 60.7%
INFRASTRUCTURE・ 103.5%
Comparison betweenaverage allocation in2015 ‐ 2016 and2011 ‐ 2014
20151008060
40 2014200
2015120
90
60 2014
30
0
5
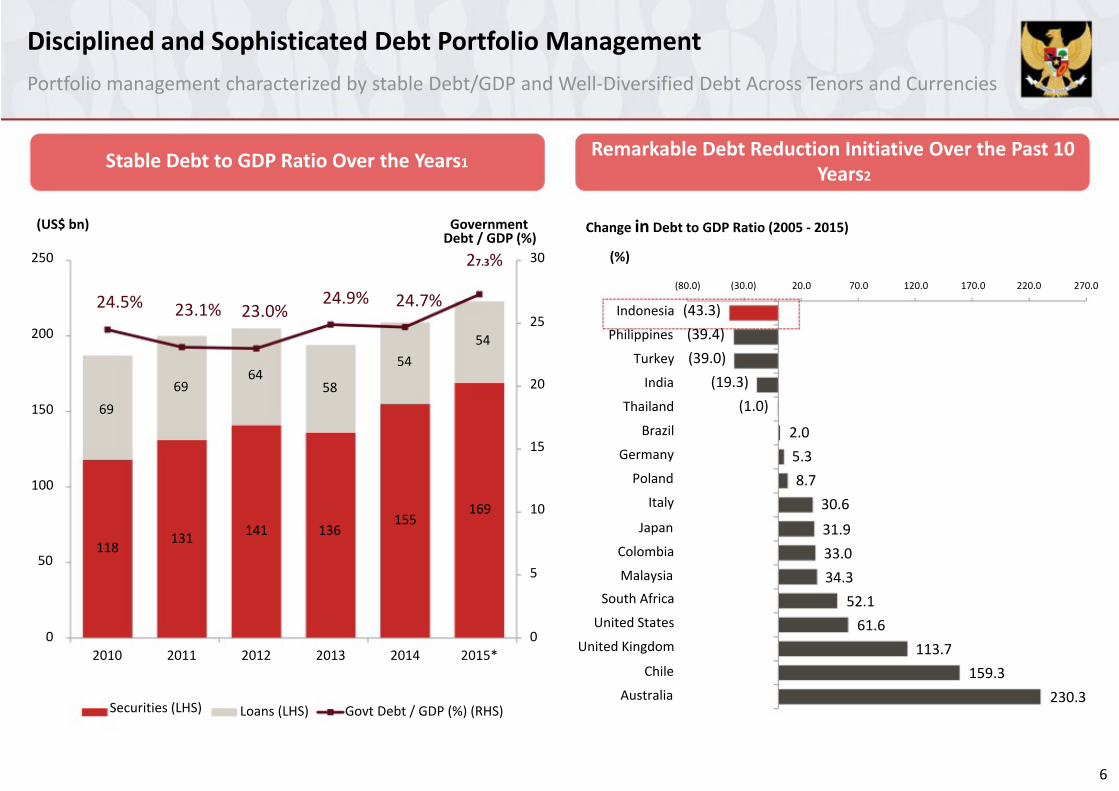
Disciplined and Sophisticated Debt Portfolio ManagementPortfolio management characterized by stable Debt/GDP and Well‐Diversified Debt Across Tenors and Currencies
Stable Debt to GDP Ratio Over the Years1
(US$ bn) GovernmentDebt / GDP (%)
250 30
Remarkable Debt Reduction Initiative Over the Past 10Years2
Change in Debt to GDP Ratio (2005 ‐ 2015)
(%)27.3%
24.5%
200
150 69
100
11850
02010
23.1%
69
131
2011
24.9%23.0%
6458
141 136
2012 2013
24.7%
54
155
2014
2554
20
15
169 10
5
02015*
(80.0) (30.0)
Indonesia (43.3)Philippines (39.4)
Turkey (39.0)India (19.3)
Thailand (1.0)Brazil
Germany
Poland
Italy
Japan
Colombia
Malaysia
South Africa
United States
United Kingdom
Chile
Australia
20.0 70.0 120.0 170.0 220.0 270.0
2.05.38.7
30.6
31.933.034.3
52.161.6
113.7159.3
230.3Securities (LHS) Loans (LHS) Govt Debt / GDP (%) (RHS)
6
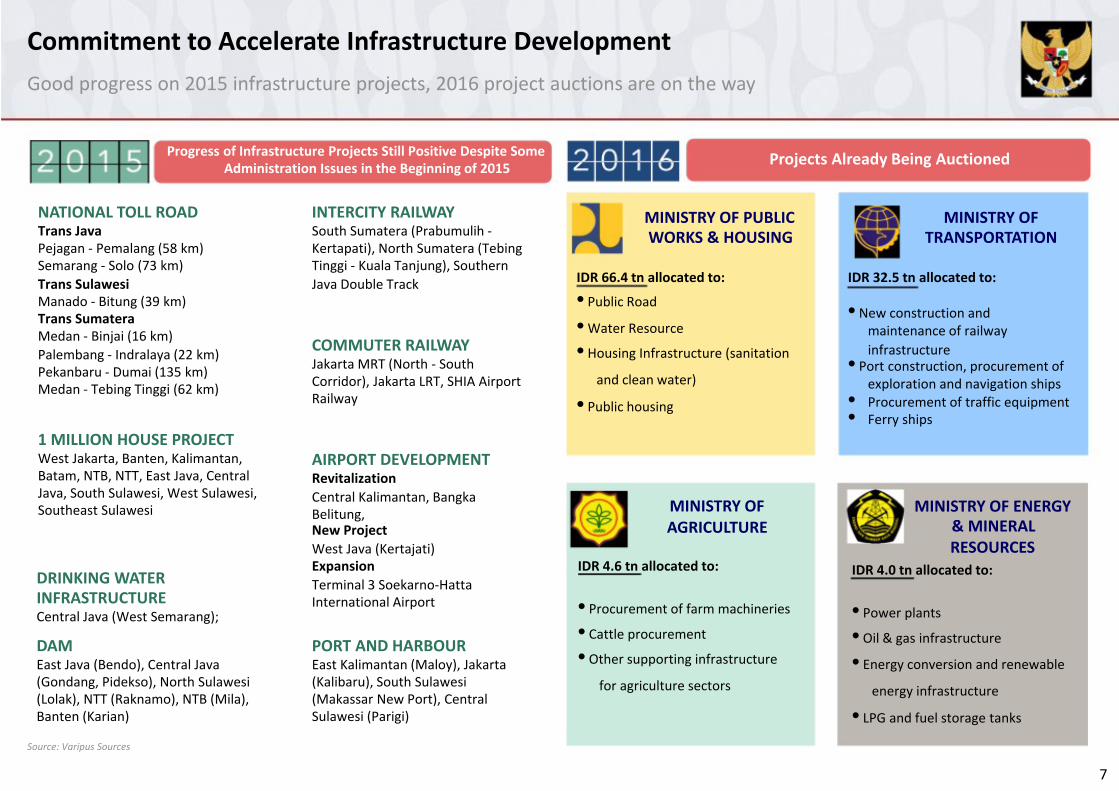
Commitment to Accelerate Infrastructure DevelopmentGood progress on 2015 infrastructure projects, 2016 project auctions are on the way
Progress of Infrastructure Projects Still Positive Despite SomeAdministration Issues in the Beginning of 2015
NATIONAL TOLL ROAD INTERCITY RAILWAYTrans Java South Sumatera (Prabumulih ‐Pejagan ‐ Pemalang (58 km) Kertapati), North Sumatera (TebingSemarang ‐ Solo (73 km) Tinggi ‐ Kuala Tanjung), SouthernTrans Sulawesi Java Double TrackManado ‐ Bitung (39 km)
Projects Already Being Auctioned
MINISTRY OF PUBLIC MINISTRY OFWORKS & HOUSING TRANSPORTATION
IDR 66.4 tn allocated to: IDR 32.5 tn allocated to:
• Public RoadTrans SumateraMedan ‐ Binjai (16 km)Palembang ‐ Indralaya (22 km)Pekanbaru ‐ Dumai (135 km)Medan ‐ Tebing Tinggi (62 km)
1 MILLION HOUSE PROJECTWest Jakarta, Banten, Kalimantan,Batam, NTB, NTT, East Java, CentralJava, South Sulawesi, West Sulawesi,Southeast Sulawesi
DRINKING WATERINFRASTRUCTURECentral Java (West Semarang);
DAMEast Java (Bendo), Central Java(Gondang, Pidekso), North Sulawesi(Lolak), NTT (Raknamo), NTB (Mila),Banten (Karian)
Source: Varipus Sources
COMMUTER RAILWAYJakarta MRT (North ‐ SouthCorridor), Jakarta LRT, SHIA AirportRailway
AIRPORT DEVELOPMENTRevitalizationCentral Kalimantan, BangkaBelitung,New ProjectWest Java (Kertajati)ExpansionTerminal 3 Soekarno‐HattaInternational Airport
PORT AND HARBOUREast Kalimantan (Maloy), Jakarta(Kalibaru), South Sulawesi(Makassar New Port), CentralSulawesi (Parigi)
•Water Resource
• Housing Infrastructure (sanitation
and clean water)
• Public housing
MINISTRY OFAGRICULTURE
IDR 4.6 tn allocated to:
• Procurement of farm machineries
• Cattle procurement
• Other supporting infrastructure
for agriculture sectors
• New construction andmaintenance of railwayinfrastructure
• Port construction, procurement ofexploration and navigation ships
• Procurement of traffic equipment• Ferry ships
MINISTRY OF ENERGY& MINERALRESOURCES
IDR 4.0 tn allocated to:
• Power plants
• Oil & gas infrastructure
• Energy conversion and renewable
energy infrastructure
• LPG and fuel storage tanks
7
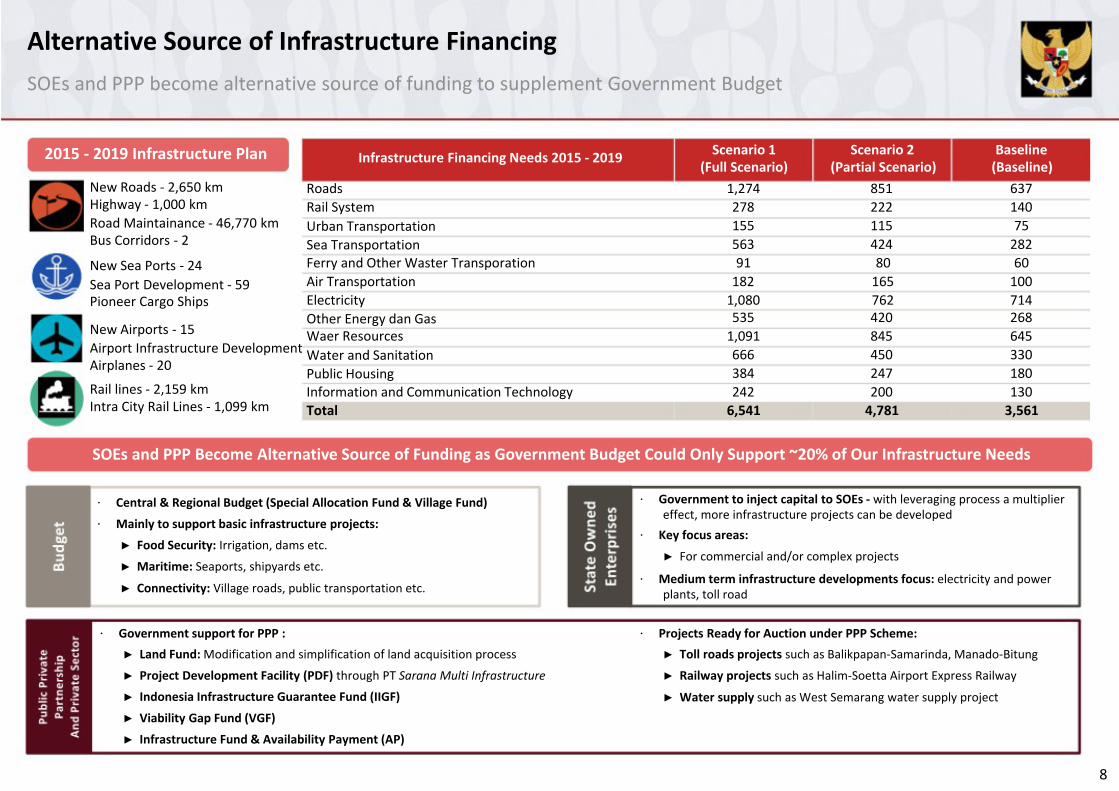
Alternative Source of Infrastructure FinancingSOEs and PPP become alternative source of funding to supplement Government Budget
2015 ‐ 2019 Infrastructure Plan
New Roads ‐ 2,650 kmHighway ‐ 1,000 kmRoad Maintainance ‐ 46,770 kmBus Corridors ‐ 2
Infrastructure Financing Needs 2015 ‐ 2019
RoadsRail SystemUrban TransportationSea Transportation
Scenario 1 Scenario 2 Baseline(Full Scenario) (Partial Scenario) (Baseline)
1,274 851 637278 222 140155 115 75563 424 282
New Sea Ports ‐ 24 Ferry and Other Waster Transporation 91 80 60Sea Port Development ‐ 59 Air Transportation 182 165 100Pioneer Cargo Ships Electricity 1,080 762 714
New Airports ‐ 15Airport Infrastructure DevelopmentAirplanes ‐ 20
Rail lines ‐ 2,159 kmIntra City Rail Lines ‐ 1,099 km
Other Energy dan GasWaer ResourcesWater and SanitationPublic HousingInformation and Communication TechnologyTotal
535 420 2681,091 845 645666 450 330384 247 180242 200 1306,541 4,781 3,561
SOEs and PPP Become Alternative Source of Funding as Government Budget Could Only Support ~20% of Our Infrastructure Needs
・ Central & Regional Budget (Special Allocation Fund & Village Fund)
・ Mainly to support basic infrastructure projects:
► Food Security: Irrigation, dams etc.
► Maritime: Seaports, shipyards etc.
► Connectivity: Village roads, public transportation etc.
・ Government support for PPP :► Land Fund: Modification and simplification of land acquisition process
► Project Development Facility (PDF) through PT Sarana Multi Infrastructure
► Indonesia Infrastructure Guarantee Fund (IIGF)
► Viability Gap Fund (VGF)
► Infrastructure Fund & Availability Payment (AP)
・ Government to inject capital to SOEs ‐ with leveraging process a multipliereffect, more infrastructure projects can be developed
・ Key focus areas:
► For commercial and/or complex projects
・ Medium term infrastructure developments focus: electricity and powerplants, toll road
・ Projects Ready for Auction under PPP Scheme:► Toll roads projects such as Balikpapan‐Samarinda, Manado‐Bitung
► Railway projects such as Halim‐Soetta Airport Express Railway
► Water supply such as West Semarang water supply project
8
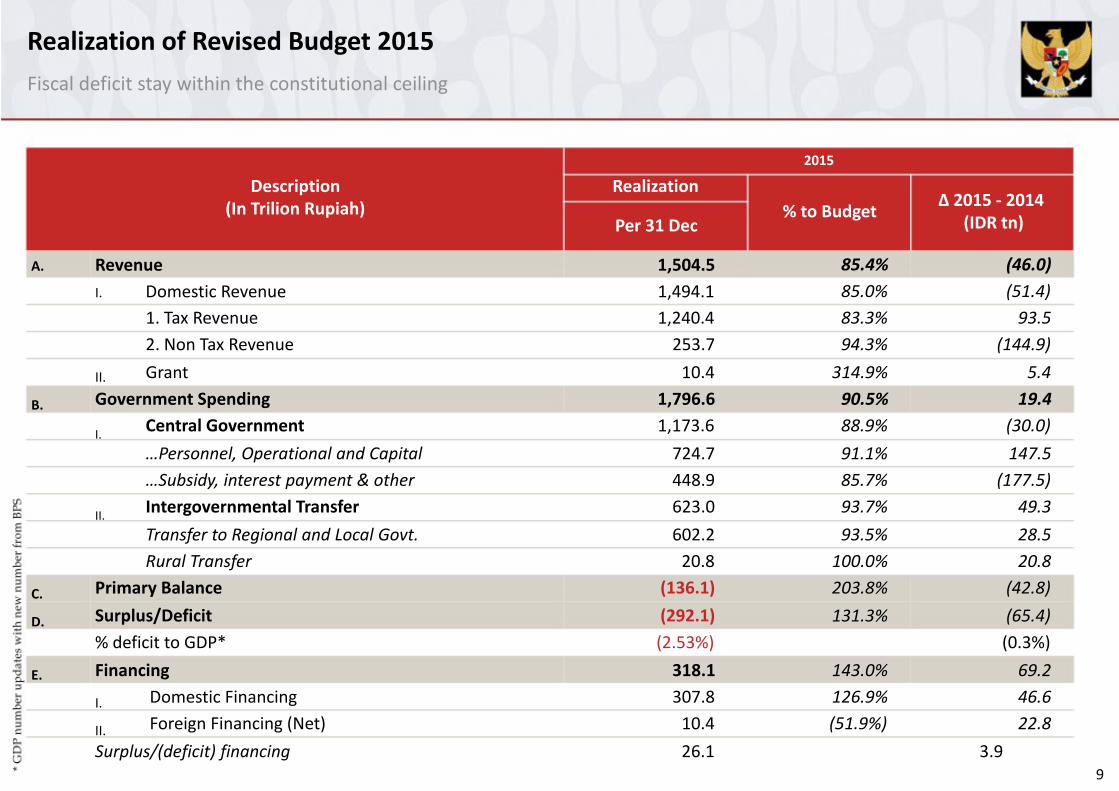
Realization of Revised Budget 2015Fiscal deficit stay within the constitutional ceiling
2015
Description Realization(In Trilion Rupiah)
Per 31 Dec
A. Revenue 1,504.5I. Domestic Revenue 1,494.1
% to Budget
85.4%85.0%
Δ 2015 ‐ 2014(IDR tn)
(46.0)(51.4)
1. Tax Revenue 1,240.4 83.3% 93.52. Non Tax Revenue 253.7 94.3% (144.9)
II. Grant 10.4 314.9% 5.4
B. Government Spending 1,796.6 90.5% 19.4
I. Central Government 1,173.6 88.9% (30.0)…Personnel, Operational and Capital 724.7 91.1% 147.5…Subsidy, interest payment & other 448.9 85.7% (177.5)
II. Intergovernmental Transfer 623.0 93.7% 49.3Transfer to Regional and Local Govt. 602.2 93.5% 28.5Rural Transfer 20.8 100.0% 20.8
C. Primary Balance (136.1) 203.8% (42.8)
D. Surplus/Deficit (292.1) 131.3% (65.4)% deficit to GDP* (2.53%) (0.3%)
E. Financing 318.1 143.0% 69.2
I. Domestic Financing 307.8 126.9% 46.6
II. Foreign Financing (Net) 10.4 (51.9%) 22.8Surplus/(deficit) financing 26.1 3.9
9
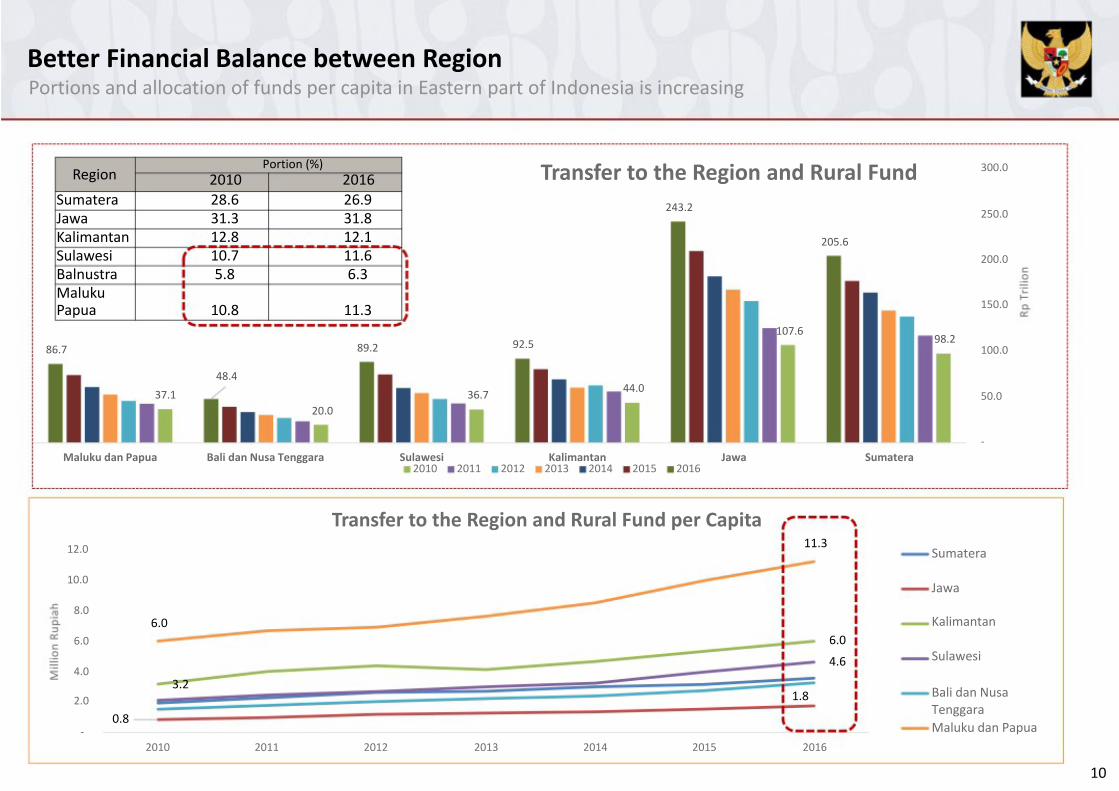
Better Financial Balance between RegionPortions and allocation of funds per capita in Eastern part of Indonesia is increasing
Region
SumateraJawaKalimantanSulawesiBalnustraMalukuPapua
Portion (%)2010 201628.6 26.931.3 31.812.8 12.110.7 11.65.8 6.3
10.8 11.3
Transfer to the Region and Rural Fund243.2
205.6
300.0
250.0
200.0
150.0
86.7
48.437.1
20.0
Maluku dan Papua Bali dan Nusa Tenggara
92.589.2
36.7
Sulawesi2010 2011 2012
44.0
Kalimantan2013 2014 2015 2016
107.6
Jawa Sumatera
98.2100.0
50.0
‐
Transfer to the Region and Rural Fund per Capita12.0
10.0
8.06.0
6.0
4.03.2
2.00.8
‐
11.3
6.0
4.6
1.8
Sumatera
Jawa
Kalimantan
Sulawesi
Bali dan NusaTenggaraMaluku dan Papua
2010 2011 2012 2013 2014 2015 2016
10