ridership report - june 2017 with memo - metra
TRANSCRIPT

RIDERSHIP TRENDS
June 2017
Prepared by the Division of Strategic Capital Planning
August 2017

Table of Contents Executive Summary ....................................................................................................................................................1
Ridership ....................................................................................................................................................................3
Estimated Passenger Trips by Line ........................................................................................................................3
Estimated Passenger Trips by Fare Zone Pair ........................................................................................................4
Estimated Passenger Trips by Ticket Type ............................................................................................................5
Passenger Loads .....................................................................................................................................................5
Free Trips ...............................................................................................................................................................5
Accessible Trips .....................................................................................................................................................7
Bicycle Trips ..........................................................................................................................................................7
Ridership Influences ...................................................................................................................................................8
Employment ...........................................................................................................................................................8
Gas Prices ...............................................................................................................................................................9
Road Construction ..................................................................................................................................................9
Service Changes ................................................................................................................................................... 10
Special Events and Promotions ............................................................................................................................ 10
Passenger Revenue and Ticket Sales ........................................................................................................................ 11
Passenger Revenue ............................................................................................................................................... 11
Ticket Sales .......................................................................................................................................................... 14
Link-Up and PlusBus Sales .............................................................................................................................. 19
Reduced Fare Sales ........................................................................................................................................... 20

Executive Summary Estimated passenger trips decreased by 1.8 percent in June 2017 compared to June 2016. June 2017 had the same number of weekdays, Saturdays, and Sundays compared to June 2016. Year-to-date, estimated passenger trips in 2017 have decreased 1.7 percent compared to 2016, and 2017 has had the same number of weekdays, one less Saturday, and the same number of Sunday/holidays compared to 2016.
Table 1: Estimated Passenger Trips by Month
2013 2014 2015 2016 2017 2013-2017 2016-2017
Jan 6,412 6,437 6,764 6,513 6,762 5.5% 3.8%
Feb 6,329 6,419 6,297 6,310 5,985 -5.4% -5.1%
Mar 6,707 6,805 6,770 6,666 6,474 -3.5% -2.9%
Apr 6,783 6,885 6,663 6,497 6,305 -7.0% -3.0%
May 6,928 6,953 6,656 6,681 6,608 -4.6% -1.1%
Jun 7,103 7,318 7,260 7,066 6,941 -2.3% -1.8%
Jul 7,399 7,473 7,286 7,110 - - -
Aug 7,194 7,192 7,100 6,866 - - -
Sep 6,987 7,144 6,896 6,766 - - -
Oct 7,187 7,260 6,949 6,832 - - -
Nov 6,750 6,760 6,606 6,943 - - -
Dec 6,489 6,724 6,385 6,153 - - -
Last 3 Months 20,814 21,156 20,578 20,244 19,854 -4.6% -1.9%
Last 12 Months 81,125 82,823 82,962 80,954 79,745 -1.7% -1.5%
Year-to-date 40,262 40,817 40,409 39,733 39,075 -2.9% -1.7%
Estimated Passenger Trips (thousands) Change
Figure 1: Estimated Passenger Trips by Month
4,000
4,500
5,000
5,500
6,000
6,500
7,000
7,500
8,000
Jan Feb Mar Apr May Jun Jul Aug Sep Oct Nov Dec
Es
tima
ted
Pa
sse
nge
r Tri
ps
(t
ho
us
an
ds)
2013 2014 2015 2016 2017

-2-
For the 2017 budget year, Metra estimated total annual passenger trips to be 80.0 million. To track how well ridership is comparing to this budgeted amount, monthly estimates have been calculated by distributing the budgeted trips throughout the year. Table 2 shows the estimated monthly passenger trips compared to this distribution.
Table 2: Estimated vs. Budget Passenger Trips 2017 Budget (thousands)
2017 Actual (thousands)
Variance
Jan 6,553 6,762 3.2%
Feb 6,251 5,985 -4.3%
Mar 6,604 6,474 -2.0%
1st Quarter 19,409 19,220 -1.0%
Apr 6,437 6,305 -2.0%
May 6,619 6,608 -0.2%
Jun 7,001 6,941 -0.9%
2nd Quarter 20,057 19,854 -1.0%
Jul 7,044 - -
Aug 6,714 - -
Sep 6,874 - -
3rd Quarter 20,632 - -
Oct 6,927 - -
Nov 6,585 - -
Dec 6,365 - -
4th Quarter 19,877 - -
Year-to-date 39,466 39,075 -1.0%
Total 79,974 - -

-3-
Ridership Estimated ridership figures are based on the number of ticket sales multiplied by a standard ridership factor unique to each ticket type, in addition to the number of Benefit Access free passenger trips reported by conductors.
Estimated Passenger Trips by Line Table 3 shows estimated passenger trips by line for June, the last three months, and the last 12 months. Estimated passenger trips decreased by 1.9 percent in the last three months compared to the previous year, and decreased 1.5 percent in the last 12 months compared to the previous year.
Table 3: Estimated Passenger Trips by Line
2016 2017 Change 2016 2017 Change 2016 2017 Change
BNSF 1,435,372 1,439,251 0.3% 4,115,132 4,099,731 -0.4% 16,333,081 16,310,477 -0.1%
ME 742,580 702,944 -5.3% 2,190,160 2,066,632 -5.6% 8,870,746 8,446,236 -4.8%
HC 61,946 61,907 -0.1% 180,209 182,337 1.2% 690,863 732,938 6.1%
MD-N 615,253 612,023 -0.5% 1,739,878 1,716,719 -1.3% 6,982,696 6,883,558 -1.4%
MD-W 580,710 554,532 -4.5% 1,665,780 1,600,931 -3.9% 6,724,358 6,500,110 -3.3%
NCS 152,287 149,794 -1.6% 435,264 423,692 -2.7% 1,748,112 1,705,949 -2.4%
RI 706,966 695,193 -1.7% 2,041,707 2,001,707 -2.0% 8,201,468 8,046,348 -1.9%
SWS 216,480 207,049 -4.4% 637,329 609,194 -4.4% 2,578,749 2,487,287 -3.5%
UP-N 827,294 806,301 -2.5% 2,332,719 2,278,872 -2.3% 9,256,919 9,145,043 -1.2%
UP-NW 986,750 970,516 -1.6% 2,801,189 2,767,607 -1.2% 11,215,779 11,098,440 -1.0%
UP-W 740,735 741,676 0.1% 2,104,621 2,107,028 0.1% 8,350,900 8,388,201 0.4%
Total 7,066,372 6,941,185 -1.8% 20,243,986 19,854,447 -1.9% 80,953,668 79,744,584 -1.5%
June Last 3 Months Last 12 Months
-4-
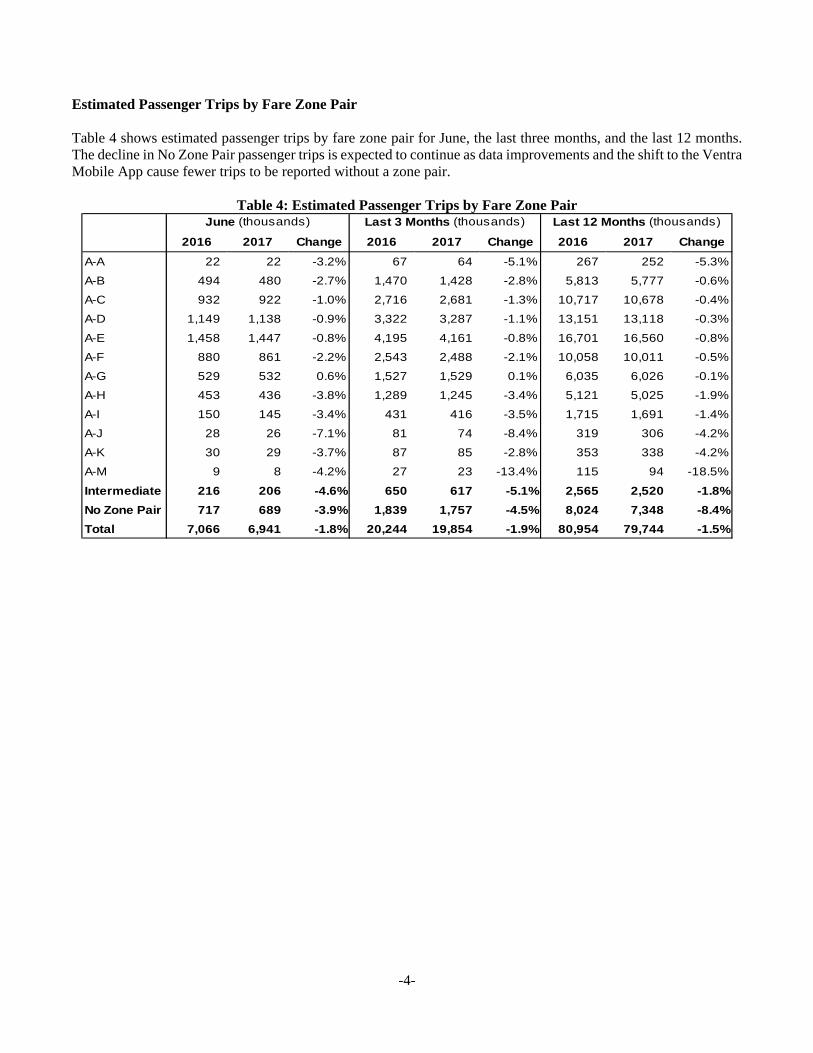
Estimated Passenger Trips by Fare Zone Pair Table 4 shows estimated passenger trips by fare zone pair for June, the last three months, and the last 12 months. The decline in No Zone Pair passenger trips is expected to continue as data improvements and the shift to the Ventra Mobile App cause fewer trips to be reported without a zone pair.
Table 4: Estimated Passenger Trips by Fare Zone Pair
2016 2017 Change 2016 2017 Change 2016 2017 Change
A-A 22 22 -3.2% 67 64 -5.1% 267 252 -5.3%
A-B 494 480 -2.7% 1,470 1,428 -2.8% 5,813 5,777 -0.6%
A-C 932 922 -1.0% 2,716 2,681 -1.3% 10,717 10,678 -0.4%
A-D 1,149 1,138 -0.9% 3,322 3,287 -1.1% 13,151 13,118 -0.3%
A-E 1,458 1,447 -0.8% 4,195 4,161 -0.8% 16,701 16,560 -0.8%
A-F 880 861 -2.2% 2,543 2,488 -2.1% 10,058 10,011 -0.5%
A-G 529 532 0.6% 1,527 1,529 0.1% 6,035 6,026 -0.1%
A-H 453 436 -3.8% 1,289 1,245 -3.4% 5,121 5,025 -1.9%
A-I 150 145 -3.4% 431 416 -3.5% 1,715 1,691 -1.4%
A-J 28 26 -7.1% 81 74 -8.4% 319 306 -4.2%
A-K 30 29 -3.7% 87 85 -2.8% 353 338 -4.2%
A-M 9 8 -4.2% 27 23 -13.4% 115 94 -18.5%
Intermediate 216 206 -4.6% 650 617 -5.1% 2,565 2,520 -1.8%
No Zone Pair 717 689 -3.9% 1,839 1,757 -4.5% 8,024 7,348 -8.4%
Total 7,066 6,941 -1.8% 20,244 19,854 -1.9% 80,954 79,744 -1.5%
June (thousands) Last 3 Months (thousands) Last 12 Months (thousands)

-5-
Estimated Passenger Trips by Ticket Type Table 5 shows estimated passenger trips by ticket type for June, the last three months, and the last 12 months.
Table 5: Estimated Passenger Trips by Ticket Type
2016 2017 Change 2016 2017 2016 2017 Change 2016 2017
Monthly 4,116 3,926 -4.6% 58.2% 56.5% 12,382 11,812 -4.6% 61.1% 59.5%
Ten-Ride 1,559 1,617 3.7% 22.0% 23.3% 4,342 4,534 4.4% 21.4% 22.8%
One-Way 983 967 -1.7% 13.9% 13.9% 2,450 2,394 -2.3% 12.1% 12.1%
Weekend 320 350 9.2% 4.5% 5.0% 827 884 6.9% 4.1% 4.4%
Special Event & Ravinia 5 4 - 0.1% 0.1% - 4 - 0.0% 0.0%
Benefit Access (free) 89 84 -5.5% 1.3% 1.2% 256 234 -8.4% 1.3% 1.2%
Total ¹ 7,073 6,947 -1.8% 20,261 19,861 -2.0%
June (thousands) Last 3 Months (thousands)
Share Share
2016 2017 Change 2016 2017
Monthly 49,672 47,648 -4.1% 61.3% 59.7%
Ten-Ride 17,187 18,045 5.0% 21.2% 22.6%
One-Way 9,547 9,365 -1.9% 11.8% 11.7%
Weekend 3,446 3,408 -1.1% 4.3% 4.3%
Special Event & Ravinia 152 336 120.9% 0.2% 0.4%
Benefit Access (free) 1,032 959 -7.1% 1.3% 1.2%
Total ¹ 81,035 79,762 -1.6%
¹ Passenger trip totals differ from those presented in other tables in this report, due to adjustments made for group sales, marketing sales, and refunds
Share
Last 12 Months (thousands)
Passenger Loads
Table 6 shows the average daily passenger loads by service period for June, the last three months, and the last 12 months, derived from conductor counts. Average peak-peak direction passenger loads decreased by 1.5 percent compared to the previous year, and total weekday passenger loads decreased by 1.9 percent in the same period.
Table 6: Average Daily Passenger Loads
2016 2017 Change 2016 2017 Change 2016 2017 Change
Peak - Peak Direction 224 221 -1.5% 224 222 -0.7% 224 221 -1.3%
Peak - Reverse Direction 22 21 -4.1% 21 20 -4.7% 21 19 -5.9%
Midday 35 34 -1.2% 33 32 -2.0% 32 31 -2.5%
Evening 20 19 -5.7% 18 16 -7.5% 18 16 -8.4%
Weekday 300 294 -1.9% 295 290 -1.5% 295 288 -2.2%
Saturday 74 73 -2.3% 65 65 -0.9% 66 64 -3.6%
Sunday 52 51 -1.0% 45 43 -4.8% 42 40 -5.2%
June (thousands) Last 3 Months (thousands) Last 12 Months (thousands)
Free Trips
-6-
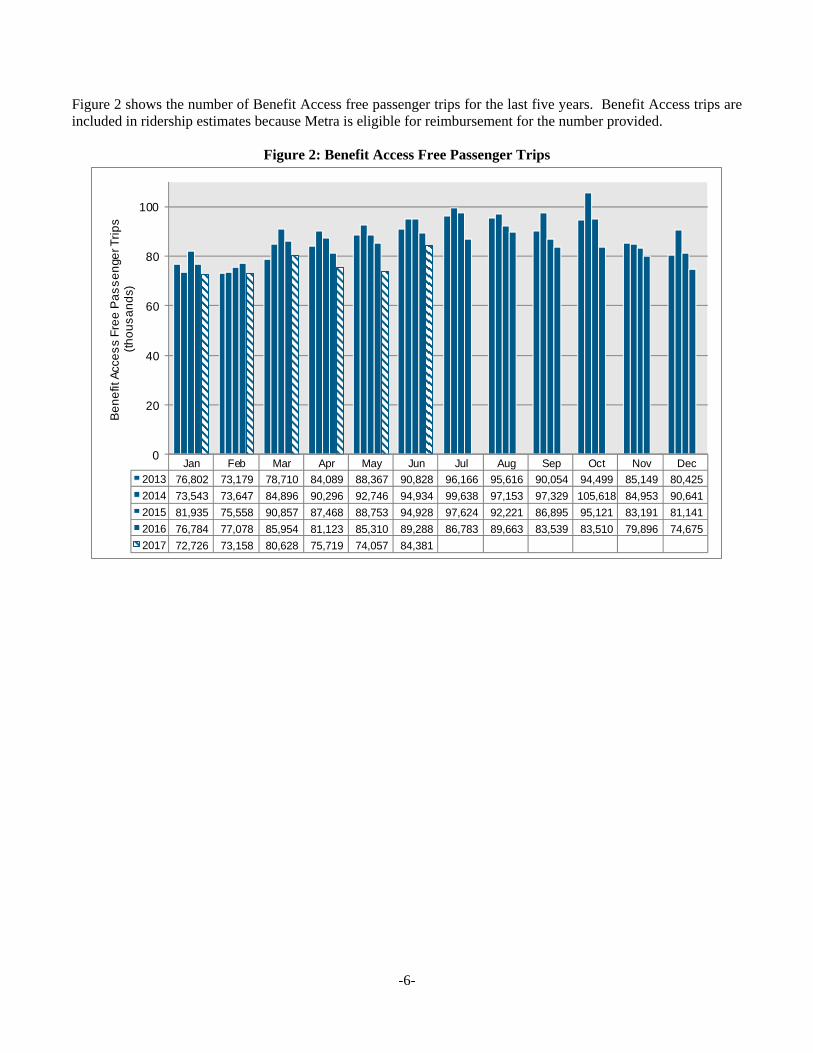
Figure 2 shows the number of Benefit Access free passenger trips for the last five years. Benefit Access trips are included in ridership estimates because Metra is eligible for reimbursement for the number provided.
Figure 2: Benefit Access Free Passenger Trips
Jan Feb Mar Apr May Jun Jul Aug Sep Oct Nov Dec
2013 76,802 73,179 78,710 84,089 88,367 90,828 96,166 95,616 90,054 94,499 85,149 80,425
2014 73,543 73,647 84,896 90,296 92,746 94,934 99,638 97,153 97,329 105,618 84,953 90,641
2015 81,935 75,558 90,857 87,468 88,753 94,928 97,624 92,221 86,895 95,121 83,191 81,141
2016 76,784 77,078 85,954 81,123 85,310 89,288 86,783 89,663 83,539 83,510 79,896 74,675
2017 72,726 73,158 80,628 75,719 74,057 84,381
0
20
40
60
80
100
Be
ne
fit A
cce
ss
Fre
e P
as
se
nge
r Tri
ps
(th
ou
sa
nd
s)

-7-
Accessible Trips
Figure 3 shows the number of trips provided using accessible equipment. Accessible equipment consists of bridge plates on the Metra Electric and wheelchair lifts on all other lines.
Figure 3: Accessible Trips
Jan Feb Mar Apr May Jun Jul Aug Sep Oct Nov Dec
2016 1,841 2,073 2,501 2,522 2,767 3,380 2,936 3,257 3,076 2,937 2,668 2,053
2017 2,259 2,274 2,418 2,578 2,757 3,109
0
500
1,000
1,500
2,000
2,500
3,000
3,500
4,000
Acc
es
sib
le P
as
sen
ger T
rip
s
Bicycle Trips Figure 4 shows the number of trips provided where the passenger transported a bicycle.
Figure 4: Bicycle Trips
Jan Feb Mar Apr May Jun Jul Aug Sep Oct Nov Dec
2016 10,054 11,911 15,394 18,423 23,443 27,311 27,829 27,756 26,074 23,036 19,078 10,937
2017 10,939 13,451 13,549 16,038 17,955 25,236
0
5,000
10,000
15,000
20,000
25,000
30,000
Bic
ycle
Pa
ss
en
ge
r Tri
ps

-8-
Ridership Influences Many different factors (such as the employment, fare changes, gas prices, road construction, service changes, and special events) can influence ridership trends.
Employment Figure 5 shows the number of persons employed in the six-county Chicago Region. The number of persons employed decreased 0.8 percent in June 2017 compared to June 2016.
Figure 5: Persons Employed in the Chicago Region
3,700
3,800
3,900
4,000
4,100
4,200
4,300
2013 2014 2015 2016 2017
Per
sons
Em
ploy
ed (
thou
sand
s)
Jan Feb Mar Apr May Jun Jul Aug Sep Oct Nov DecYear-to-date
Average
2013 3,896 3,890 3,884 3,893 3,940 3,964 3,966 3,951 3,955 3,945 3,964 3,951 3,911
2014 3,922 3,927 3,972 3,960 3,980 4,045 4,068 4,032 4,033 4,076 4,075 4,075 3,968
2015 4,010 4,014 4,016 4,038 4,066 4,122 4,134 4,108 4,084 4,107 4,078 4,072 4,044
2016 4,033 4,078 4,115 4,128 4,150 4,192 4,218 4,155 4,125 4,106 4,105 4,087 4,116
2017 4,044 4,070 4,098 4,066 4,102 4,157 4,090
Change 0.3% -0.2% -0.4% -1.5% -1.1% -0.8% -0.6%
Source: Illinois Department of Employment Security
-9-
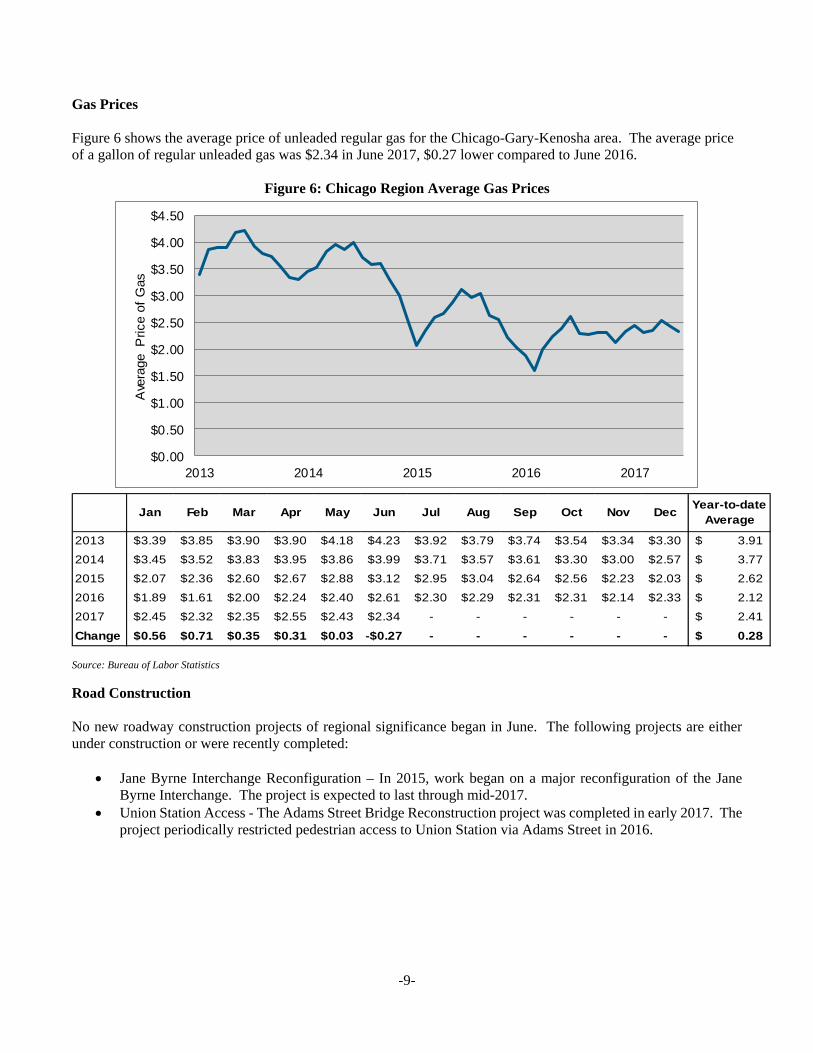
Gas Prices Figure 6 shows the average price of unleaded regular gas for the Chicago-Gary-Kenosha area. The average price of a gallon of regular unleaded gas was $2.34 in June 2017, $0.27 lower compared to June 2016.
Figure 6: Chicago Region Average Gas Prices
$0.00
$0.50
$1.00
$1.50
$2.00
$2.50
$3.00
$3.50
$4.00
$4.50
2013 2014 2015 2016 2017
Ave
rage
Pric
e of
Gas
Jan Feb Mar Apr May Jun Jul Aug Sep Oct Nov DecYear-to-date
Average
2013 3.39$ 3.85$ 3.90$ 3.90$ 4.18$ 4.23$ 3.92$ 3.79$ 3.74$ 3.54$ 3.34$ 3.30$ 3.91$
2014 3.45$ 3.52$ 3.83$ 3.95$ 3.86$ 3.99$ 3.71$ 3.57$ 3.61$ 3.30$ 3.00$ 2.57$ 3.77$
2015 2.07$ 2.36$ 2.60$ 2.67$ 2.88$ 3.12$ 2.95$ 3.04$ 2.64$ 2.56$ 2.23$ 2.03$ 2.62$
2016 1.89$ 1.61$ 2.00$ 2.24$ 2.40$ 2.61$ 2.30$ 2.29$ 2.31$ 2.31$ 2.14$ 2.33$ 2.12$
2017 2.45$ 2.32$ 2.35$ 2.55$ 2.43$ 2.34$ - - - - - - 2.41$
Change 0.56$ 0.71$ 0.35$ 0.31$ 0.03$ -$0.27 - - - - - - 0.28$
Source: Bureau of Labor Statistics
Road Construction No new roadway construction projects of regional significance began in June. The following projects are either under construction or were recently completed:
Jane Byrne Interchange Reconfiguration – In 2015, work began on a major reconfiguration of the Jane Byrne Interchange. The project is expected to last through mid-2017.
Union Station Access - The Adams Street Bridge Reconstruction project was completed in early 2017. The project periodically restricted pedestrian access to Union Station via Adams Street in 2016.

-10-
Service Changes No service changes occurred in June.
Special Events and Promotions Metra added additional service for Blues Fest and Spring Awakening (June 9-10) and the Chicago Pride Parade (June 25).

-11-
Passenger Revenue and Ticket Sales
Passenger Revenue Table 7 shows passenger revenue by line for June, the last three months, and the last 12 months.
Table 7: Passenger Revenue by Line
2016 2017 Change 2016 2017 Change 2016 2017 Change
BNSF 6,366$ 6,774$ 6.4% 18,096$ 19,194$ 6.1% 70,784$ 73,598$ 4.0%
ME 2,938$ 2,969$ 1.0% 8,590$ 8,644$ 0.6% 34,298$ 34,033$ -0.8%
HC 288$ 309$ 7.3% 834$ 901$ 8.1% 3,148$ 3,489$ 10.8%
MD-N 2,757$ 2,907$ 5.4% 7,708$ 8,093$ 5.0% 30,458$ 31,285$ 2.7%
MD-W 2,606$ 2,620$ 0.5% 7,398$ 7,509$ 1.5% 29,442$ 29,484$ 0.1%
NCS 785$ 814$ 3.7% 2,223$ 2,286$ 2.8% 8,795$ 8,894$ 1.1%
RI 2,952$ 3,078$ 4.3% 8,449$ 8,809$ 4.3% 33,446$ 34,170$ 2.2%
SWS 898$ 920$ 2.5% 2,617$ 2,682$ 2.5% 10,438$ 10,529$ 0.9%
UP-N 3,269$ 3,400$ 4.0% 9,075$ 9,464$ 4.3% 35,447$ 36,544$ 3.1%
UP-NW 4,542$ 4,702$ 3.5% 12,735$ 13,272$ 4.2% 50,208$ 51,540$ 2.7%
UP-W 3,275$ 3,471$ 6.0% 9,197$ 9,770$ 6.2% 35,906$ 37,528$ 4.5%
Total 30,675$ 31,962$ 4.2% 86,922$ 90,625$ 4.3% 342,370$ 351,095$ 2.5%
June (thousands) Last 3 Months (thousands) Last 12 Months (thousands)

-12-
Table 8 shows passenger revenue by ticket type for June, the last three months, and the last 12 months.
Table 8: Passenger Revenue by Ticket Type
2016 2017 Change 2016 2017 2016 2017 Change 2016 2017
Monthly 15,964$ 16,267$ 1.9% 52.0% 50.8% 47,984$ 48,916$ 1.9% 55.1% 53.9%
Ten-Ride 8,022$ 8,765$ 9.3% 26.1% 27.4% 22,267$ 24,508$ 10.1% 25.6% 27.0%
One-Way 5,686$ 5,830$ 2.5% 18.5% 18.2% 14,119$ 14,436$ 2.2% 16.2% 15.9%
Weekend 1,025$ 1,119$ 9.2% 3.3% 3.5% 2,645$ 2,814$ 6.4% 3.0% 3.1%
Special Event & Ravinia
20$ 14$ -30.6% 0.1% 0.0% 20$ 14$ -30.4% 0.0% 0.0%
Total ¹ 30,717$ 31,996$ 4.2% 87,036$ 90,687$ 4.2%
Last 3 Months (thousands)June (thousands)
Share Share
2016 2017 Change 2016 2017
Monthly 190,869$ 189,863$ -0.5% 55.7% 54.0%
Ten-Ride 86,606$ 94,572$ 9.2% 25.3% 26.9%
One-Way 54,063$ 55,101$ 1.9% 15.8% 15.7%
Weekend 11,027$ 10,893$ -1.2% 3.2% 3.1%
Special Event & Ravinia
351$ 915$ 160.5% 0.1% 0.3%
Total ¹ 342,917$ 351,345$ 2.5%
¹ Passenger revenue totals differ from those presented in other tables in this report due to adjustments made for group sales, marketing sales, and refunds
Share
Last 12 Months (thousands)
-13-
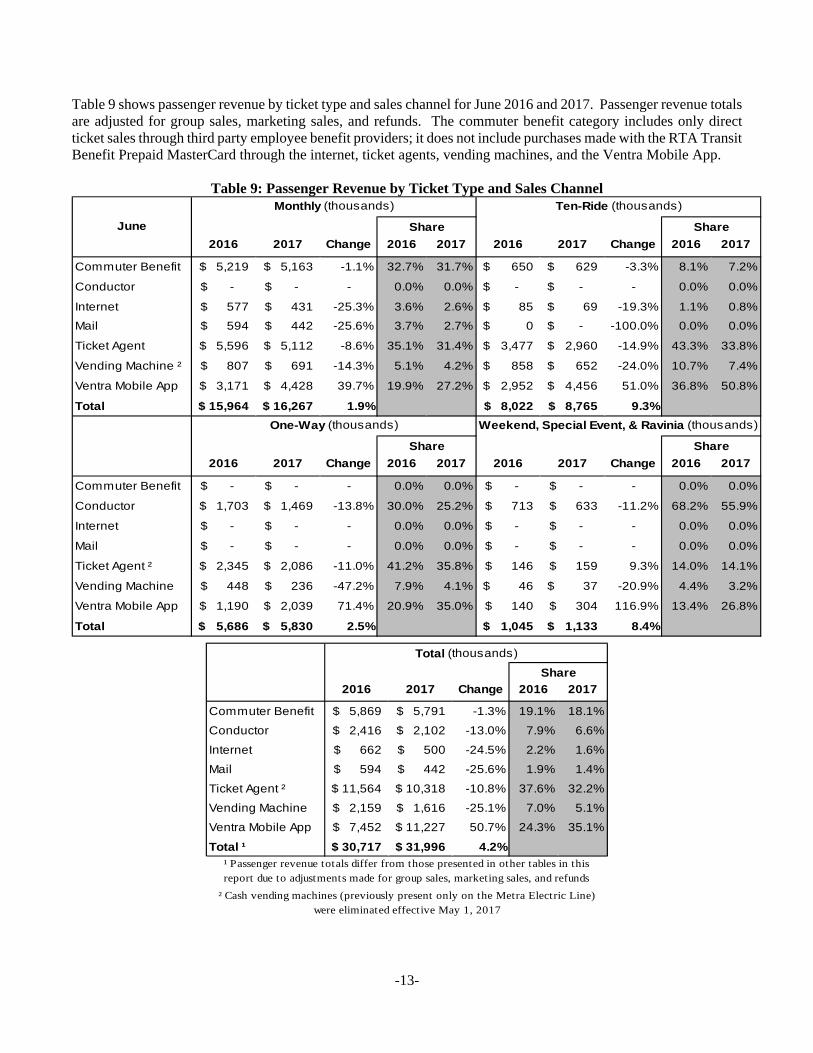
Table 9 shows passenger revenue by ticket type and sales channel for June 2016 and 2017. Passenger revenue totals are adjusted for group sales, marketing sales, and refunds. The commuter benefit category includes only direct ticket sales through third party employee benefit providers; it does not include purchases made with the RTA Transit Benefit Prepaid MasterCard through the internet, ticket agents, vending machines, and the Ventra Mobile App.
Table 9: Passenger Revenue by Ticket Type and Sales Channel
2016 2017 Change 2016 2017 2016 2017 Change 2016 2017
Commuter Benefit 5,219$ 5,163$ -1.1% 32.7% 31.7% 650$ 629$ -3.3% 8.1% 7.2%
Conductor -$ -$ - 0.0% 0.0% -$ -$ - 0.0% 0.0%
Internet 577$ 431$ -25.3% 3.6% 2.6% 85$ 69$ -19.3% 1.1% 0.8%
Mail 594$ 442$ -25.6% 3.7% 2.7% 0$ -$ -100.0% 0.0% 0.0%
Ticket Agent 5,596$ 5,112$ -8.6% 35.1% 31.4% 3,477$ 2,960$ -14.9% 43.3% 33.8%
Vending Machine ² 807$ 691$ -14.3% 5.1% 4.2% 858$ 652$ -24.0% 10.7% 7.4%
Ventra Mobile App 3,171$ 4,428$ 39.7% 19.9% 27.2% 2,952$ 4,456$ 51.0% 36.8% 50.8%
Total 15,964$ 16,267$ 1.9% 8,022$ 8,765$ 9.3%
2016 2017 Change 2016 2017 2016 2017 Change 2016 2017
Commuter Benefit -$ -$ - 0.0% 0.0% -$ -$ - 0.0% 0.0%
Conductor 1,703$ 1,469$ -13.8% 30.0% 25.2% 713$ 633$ -11.2% 68.2% 55.9%
Internet -$ -$ - 0.0% 0.0% -$ -$ - 0.0% 0.0%
Mail -$ -$ - 0.0% 0.0% -$ -$ - 0.0% 0.0%
Ticket Agent ² 2,345$ 2,086$ -11.0% 41.2% 35.8% 146$ 159$ 9.3% 14.0% 14.1%
Vending Machine 448$ 236$ -47.2% 7.9% 4.1% 46$ 37$ -20.9% 4.4% 3.2%
Ventra Mobile App 1,190$ 2,039$ 71.4% 20.9% 35.0% 140$ 304$ 116.9% 13.4% 26.8%
Total 5,686$ 5,830$ 2.5% 1,045$ 1,133$ 8.4%
Ten-Ride (thousands)
Share
Share
Weekend, Special Event, & Ravinia (thousands)
Monthly (thousands)
June
Share
Share
One-Way (thousands)
2016 2017 Change 2016 2017
Commuter Benefit 5,869$ 5,791$ -1.3% 19.1% 18.1%
Conductor 2,416$ 2,102$ -13.0% 7.9% 6.6%
Internet 662$ 500$ -24.5% 2.2% 1.6%
Mail 594$ 442$ -25.6% 1.9% 1.4%
Ticket Agent ² 11,564$ 10,318$ -10.8% 37.6% 32.2%
Vending Machine 2,159$ 1,616$ -25.1% 7.0% 5.1%
Ventra Mobile App 7,452$ 11,227$ 50.7% 24.3% 35.1%
Total ¹ 30,717$ 31,996$ 4.2%
² Cash vending machines (previously present only on the Metra Electric Line) were eliminated effective May 1, 2017
¹ Passenger revenue totals differ from those presented in other tables in this report due to adjustments made for group sales, marketing sales, and refunds
Total (thousands)
Share
-14-
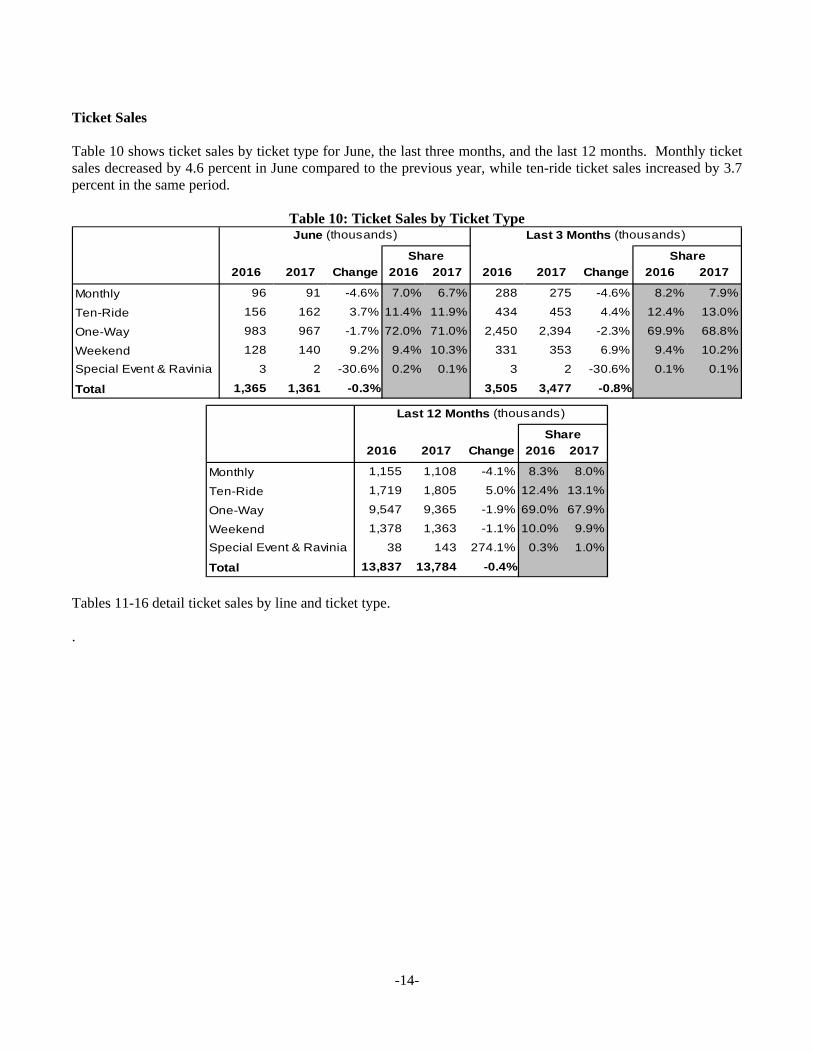
Ticket Sales Table 10 shows ticket sales by ticket type for June, the last three months, and the last 12 months. Monthly ticket sales decreased by 4.6 percent in June compared to the previous year, while ten-ride ticket sales increased by 3.7 percent in the same period.
Table 10: Ticket Sales by Ticket Type
2016 2017 Change 2016 2017 2016 2017 Change 2016 2017
Monthly 96 91 -4.6% 7.0% 6.7% 288 275 -4.6% 8.2% 7.9%
Ten-Ride 156 162 3.7% 11.4% 11.9% 434 453 4.4% 12.4% 13.0%
One-Way 983 967 -1.7% 72.0% 71.0% 2,450 2,394 -2.3% 69.9% 68.8%
Weekend 128 140 9.2% 9.4% 10.3% 331 353 6.9% 9.4% 10.2%
Special Event & Ravinia 3 2 -30.6% 0.2% 0.1% 3 2 -30.6% 0.1% 0.1%
Total 1,365 1,361 -0.3% 3,505 3,477 -0.8%
June (thousands) Last 3 Months (thousands)
Share Share
2016 2017 Change 2016 2017
Monthly 1,155 1,108 -4.1% 8.3% 8.0%
Ten-Ride 1,719 1,805 5.0% 12.4% 13.1%
One-Way 9,547 9,365 -1.9% 69.0% 67.9%
Weekend 1,378 1,363 -1.1% 10.0% 9.9%
Special Event & Ravinia 38 143 274.1% 0.3% 1.0%
Total 13,837 13,784 -0.4%
Share
Last 12 Months (thousands)
Tables 11-16 detail ticket sales by line and ticket type. .

-15-
June 2016 2017 Change June 2016 2017 Change
BNSF 20,955 20,335 -3.0% BNSF 31,632 33,466 5.8%
MED 9,680 9,073 -6.3% MED 14,510 14,287 -1.5%
HC 1,103 1,051 -4.7% HC 1,159 1,295 11.7%
MD-N 7,572 7,200 -4.9% MD-N 15,862 16,699 5.3%
MD-W 7,775 7,303 -6.1% MD-W 10,510 10,468 -0.4%
NCS 2,278 2,145 -5.8% NCS 3,487 3,690 5.8%
RID 10,734 10,317 -3.9% RID 12,612 12,865 2.0%
SWS 3,579 3,302 -7.7% SWS 4,053 4,193 3.5%
UP-N 9,206 8,693 -5.6% UP-N 24,075 24,684 2.5%
UP-NW 13,054 12,354 -5.4% UP-NW 21,270 22,404 5.3%
UP-W 9,779 9,521 -2.6% UP-W 16,742 17,698 5.7%
Total 95,715 91,294 -4.6% Total 155,912 161,749 3.7%
June 2016 2017 Change June 2016 2017 Change
BNSF 119,100 131,448 10.4% BNSF 34,195 28,253 -17.4%
MED¹ 109,312 90,430 -17.3% MED¹ 29,326 33,531 14.3%
HC 2,189 3,019 37.9% HC 790 707 -10.5%
MD-N 58,878 64,879 10.2% MD-N 30,563 26,751 -12.5%
MD-W 61,223 62,355 1.8% MD-W 34,198 27,212 -20.4%
NCS 9,611 11,453 19.2% NCS 9,043 8,236 -8.9%
RID 59,998 63,892 6.5% RID 27,725 22,398 -19.2%
SWS 12,499 14,264 14.1% SWS 7,353 6,080 -17.3%
UP-N 73,723 82,001 11.2% UP-N 53,697 42,891 -20.1%
UP-NW 95,436 104,712 9.7% UP-NW 49,151 36,719 -25.3%
UP-W 72,448 79,912 10.3% UP-W 32,589 25,458 -21.9%
Total 674,417 708,365 5.0% Total 308,630 258,236 -16.3%
June 2016 2017 Change June 2016 2017 Change
BNSF 8,448 13,290 57.3% BNSF 14,008 11,813 -15.7%
MED¹ 6,035 6,650 10.2% MED¹ 2,669 4,190 57.0%
HC - - - HC - - -
MD-N 3,983 6,492 63.0% MD-N 10,330 8,724 -15.5%
MD-W 3,456 5,671 64.1% MD-W 11,010 8,862 -19.5%
NCS - - - NCS - - -
RID 1,956 3,467 77.2% RID 7,994 8,257 3.3%
SWS 51 136 166.7% SWS 401 442 10.2%
UP-N 6,949 8,988 29.3% UP-N 12,779 10,439 -18.3%
UP-NW 6,735 10,797 60.3% UP-NW 17,240 15,472 -10.3%
UP-W 3,923 7,023 79.0% UP-W 12,680 10,915 -13.9%
Total 41,536 62,514 50.5% Total 89,111 79,114 -11.2%
Table 11: Monthly Ticket Sales by Line Table 12: Ten-Ride Ticket Sales by Line
Table 13: One-Way (Station and Mobile) Ticket Sales by Line
Table 14: One-Way (Conductor) Ticket Sales by Line
Table 15: Weekend, Special Event, Ravinia (Station and Mobile) Ticket
Sales by Line
Table 16: Weekend, Special Event, Ravinia (Conductor) Ticket Sales by
Line
¹ Cash vending machines (previously present only on the Metra Electric Line) were eliminated effective May 1, 2017
-16-
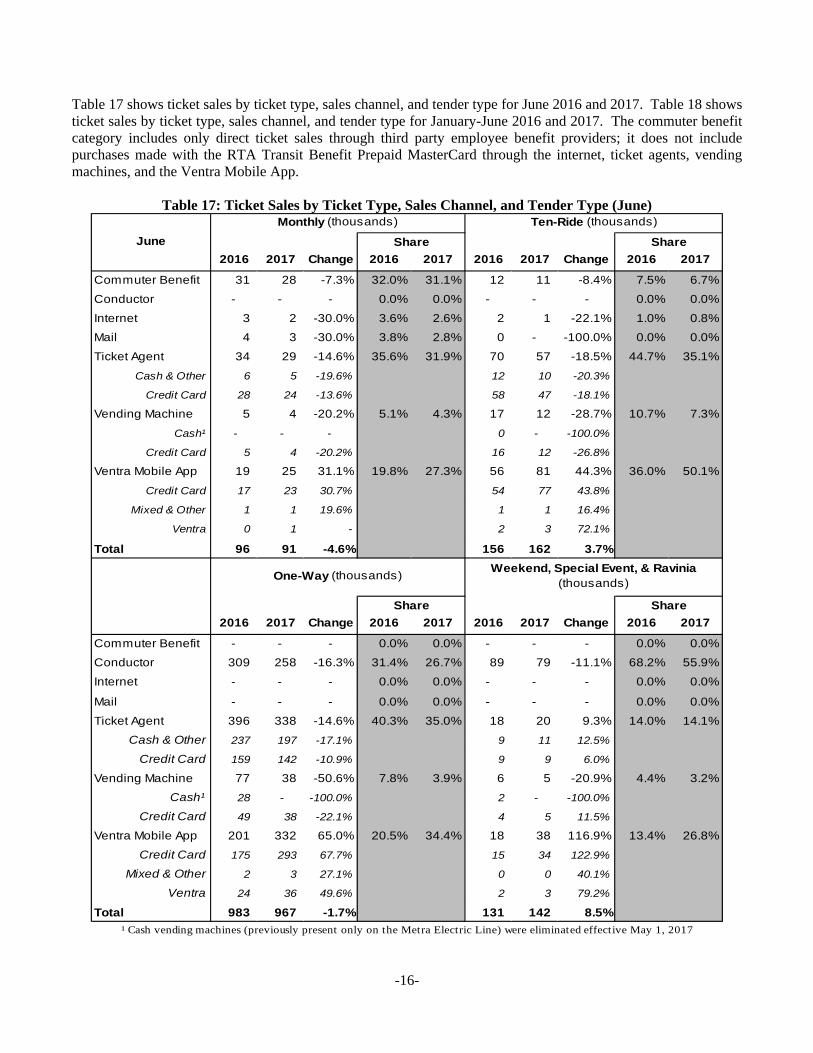
Table 17 shows ticket sales by ticket type, sales channel, and tender type for June 2016 and 2017. Table 18 shows ticket sales by ticket type, sales channel, and tender type for January-June 2016 and 2017. The commuter benefit category includes only direct ticket sales through third party employee benefit providers; it does not include purchases made with the RTA Transit Benefit Prepaid MasterCard through the internet, ticket agents, vending machines, and the Ventra Mobile App.
Table 17: Ticket Sales by Ticket Type, Sales Channel, and Tender Type (June)
2016 2017 Change 2016 2017 2016 2017 Change 2016 2017
Commuter Benefit 31 28 -7.3% 32.0% 31.1% 12 11 -8.4% 7.5% 6.7%
Conductor - - - 0.0% 0.0% - - - 0.0% 0.0%
Internet 3 2 -30.0% 3.6% 2.6% 2 1 -22.1% 1.0% 0.8%
Mail 4 3 -30.0% 3.8% 2.8% 0 - -100.0% 0.0% 0.0%
Ticket Agent 34 29 -14.6% 35.6% 31.9% 70 57 -18.5% 44.7% 35.1%
Cash & Other 6 5 -19.6% 12 10 -20.3%
Credit Card 28 24 -13.6% 58 47 -18.1%
Vending Machine 5 4 -20.2% 5.1% 4.3% 17 12 -28.7% 10.7% 7.3%
Cash¹ - - - 0 - -100.0%
Credit Card 5 4 -20.2% 16 12 -26.8%
Ventra Mobile App 19 25 31.1% 19.8% 27.3% 56 81 44.3% 36.0% 50.1%
Credit Card 17 23 30.7% 54 77 43.8%
Mixed & Other 1 1 19.6% 1 1 16.4%
Ventra 0 1 - 2 3 72.1%
Total 96 91 -4.6% 156 162 3.7%
2016 2017 Change 2016 2017 2016 2017 Change 2016 2017
Commuter Benefit - - - 0.0% 0.0% - - - 0.0% 0.0%
Conductor 309 258 -16.3% 31.4% 26.7% 89 79 -11.1% 68.2% 55.9%
Internet - - - 0.0% 0.0% - - - 0.0% 0.0%
Mail - - - 0.0% 0.0% - - - 0.0% 0.0%
Ticket Agent 396 338 -14.6% 40.3% 35.0% 18 20 9.3% 14.0% 14.1%
Cash & Other 237 197 -17.1% 9 11 12.5%
Credit Card 159 142 -10.9% 9 9 6.0%
Vending Machine 77 38 -50.6% 7.8% 3.9% 6 5 -20.9% 4.4% 3.2%
Cash¹ 28 - -100.0% 2 - -100.0%
Credit Card 49 38 -22.1% 4 5 11.5%
Ventra Mobile App 201 332 65.0% 20.5% 34.4% 18 38 116.9% 13.4% 26.8%
Credit Card 175 293 67.7% 15 34 122.9%
Mixed & Other 2 3 27.1% 0 0 40.1%
Ventra 24 36 49.6% 2 3 79.2%
Total 983 967 -1.7% 131 142 8.5%
Monthly (thousands) Ten-Ride (thousands)
Weekend, Special Event, & Ravinia (thousands)
ShareJune Share
Share Share
One-Way (thousands)
¹ Cash vending machines (previously present only on the Metra Electric Line) were eliminated effective May 1, 2017

-17-
Table 18: Ticket Sales by Ticket Type, Sales Channel, and Tender Type (Year-to-date)
2016 2017 Change 2016 2017 2016 2017 Change 2016 2017
Commuter Benefit 187 174 -7.2% 32.4% 31.5% 70 64 -8.7% 8.2% 7.0%
Conductor - - - 0.0% 0.0% - - - 0.0% 0.0%
Internet 23 14 -37.3% 3.9% 2.6% 10 7 -28.7% 1.2% 0.8%
Mail 23 17 -25.1% 4.0% 3.2% 0 0 -92.1% 0.0% 0.0%
Ticket Agent 214 181 -15.2% 37.0% 32.8% 407 326 -19.8% 47.5% 35.9%
Cash & Other 47 32 -30.4% 73 58 -21.5%
Credit Card 167 149 -11.0% 334 269 -19.4%
Vending Machine 31 24 -21.2% 5.3% 4.4% 104 70 -32.8% 12.1% 7.7%
Cash¹ - - - 2 1 -60.7%
Credit Card 31 24 -21.2% 101 69 -32.1%
Ventra Mobile App 100 141 41.4% 17.3% 25.6% 265 440 65.9% 31.0% 48.5%
Credit Card 89 128 43.5% 253 418 65.5%
Mixed & Other 9 10 10.0% 5 6 32.3%
Ventra 1 3 121.8% 8 16 98.9%
Total 577 552 -4.4% 857 908 6.0%
2016 2017 Change 2016 2017 2016 2017 Change 2016 2017
Commuter Benefit - - - 0.0% 0.0% - - - 0.0% 0.0%
Conductor 1,417 1,145 -19.2% 32.3% 26.6% 402 343 -14.7% 66.6% 55.9%
Internet - - - 0.0% 0.0% - - - 0.0% 0.0%
Mail - - - 0.0% 0.0% - - - 0.0% 0.0%
Ticket Agent 1,793 1,458 -18.7% 40.8% 33.9% 102 91 -10.0% 16.8% 14.9%
Cash & Other 1,078 857 -20.5% 56 51 -9.0%
Credit Card 715 601 -16.0% 45 40 -11.3%
Vending Machine 384 216 -43.9% 8.8% 5.0% 31 23 -26.9% 5.1% 3.7%
Cash¹ 142 52 -63.7% 8 3 -59.9%
Credit Card 242 164 -32.3% 23 19 -15.1%
Ventra Mobile App 796 1,480 85.9% 18.1% 34.4% 69 156 126.3% 11.4% 25.5%
Credit Card 687 1,297 88.8% 60 140 133.7%
Mixed & Other 10 15 43.8% 1 2 69.7%
Ventra 99 168 69.7% 7 14 93.1%
Total 4,390 4,298 -2.1% 604 613 1.6%
¹ Cash vending machines (previously present only on the Metra Electric Line) were eliminated effective May 1, 2017
Share Share
Ten-Ride (thousands)
Share Share
One-Way (thousands)Weekend, Special Event, & Ravinia
(thousands)
Year-to-date
Monthly (thousands)

-18-
Table 19 shows total ticket sales by sales channel and tender type for June 2016 and 2017. Table 20 shows total ticket sales by sales channel and tender type for January-June 2016 and 2017. The commuter benefit category includes only direct ticket sales through third party employee benefit providers; it does not include purchases made with the RTA Transit Benefit Prepaid MasterCard through the internet, ticket agents, vending machines, and the Ventra Mobile App.
Table 19: Total Ticket Sales by Sales Channel and Tender Type (June)
2016 2017 Change 2016 2017
Commuter Benefit 42 39 -7.6% 3.1% 2.9%
Conductor 398 337 -15.2% 29.1% 24.8%
Internet 5 4 -27.5% 0.4% 0.3%
Mail 4 3 -30.1% 0.3% 0.2%
Ticket Agent 518 444 -14.3% 38.0% 32.6%
Cash & Other 265 222 -16.3%
Credit Card 253 222 -12.2%
Vending Machine 104 58 -44.1% 7.6% 4.3%
Cash¹ 30 - -100.0%
Credit Card 74 58 -21.1%
Ventra Mobile App 294 476 61.9% 21.5% 35.0%
Credit Card 261 427 63.6%
Mixed & Other 5 6 24.0%
Ventra 28 43 53.5%
Total 1,365 1,361 -0.3%¹ Cash vending machines (previously present only on the Metra Electric
Line) were eliminated effective May 1, 2017
June
Total (thousands)
Share
Table 20: Total Ticket Sales by Sales Channel and Tender Type (Year-to-date)
2016 2017 Change 2016 2017
Commuter Benefit 257 237 -7.7% 4.0% 3.7%
Conductor 1,819 1,488 -18.2% 28.3% 23.3%
Internet 33 22 -34.6% 0.5% 0.3%
Mail 23 17 -25.2% 0.4% 0.3%
Ticket Agent 2,515 2,057 -18.2% 39.1% 32.3%
Cash & Other 1,253 998 -20.4%
Credit Card 1,262 1,059 -16.1%
Vending Machine 550 332 -39.6% 8.6% 5.2%
Cash¹ 152 56 -63.4%
Credit Card 397 276 -30.4%
Ventra Mobile App 1,231 2,218 80.2% 19.1% 34.8%
Credit Card 1,089 1,984 82.1%
Mixed & Other 25 33 30.4%
Ventra 116 201 73.8%
Total 6,428 6,371 -0.9%
Total (thousands)
ShareYear-to-date
¹ Cash vending machines (previously present only on the Metra Electric Line) were eliminated effective May 1, 2017

-19-
Link-Up and PlusBus Sales Sales of CTA Link-Up passes declined by 12.5 percent in June compared to the previous year, and sales of Pace PlusBus passes declined by 8.2 percent in the same period. Table 21 shows Link-Up and PlusBus sales by month for 2016 and 2017.
Table 21: Link-Up and PlusBus Sales
Link-Up PlusBus Link-Up PlusBus Link-Up PlusBus Link-Up Plus Bus
Jan 3,686 1,314 3,414 1,276 -7.4% -2.9% 18.4% 14.9%
Feb 3,737 1,333 3,346 1,284 -10.5% -3.7% 17.9% 14.5%
Mar 3,657 1,360 3,278 1,287 -10.4% -5.4% 18.0% 15.1%
Apr 3,496 1,320 3,179 1,226 -9.1% -7.1% 18.6% 15.1%
May 3,443 1,269 3,115 1,185 -9.5% -6.6% 18.8% 14.2%
Jun 3,410 1,261 2,985 1,158 -12.5% -8.2% 17.2% 15.0%
Jul 3,310 1,221 - - - - - -
Aug 3,182 1,201 - - - - - -
Sep 3,266 1,267 - - - - - -
Oct 3,338 1,272 - - - - - -
Nov 3,345 1,291 - - - - - -
Dec 3,190 1,174 - - - - - -
Last 3 Months 10,596 3,949 9,572 3,698 -9.7% -6.4% 18.2% 14.5%
Last 12 Months 43,135 15,746 39,373 14,945 -8.7% -5.1% 14.5% 12.7%
Year-to-date 18,019 6,596 16,332 6,258 -9.4% -5.1% 7.5% 6.0%
2016 2017 Change Mobile Share (2017)

-20-
Reduced Fare Sales Seniors, some Medicare recipients, some persons with disabilities, primary and secondary school students, children, and military personnel are eligible for reduced fares on Metra. Table 22 shows the number of reduced fare tickets sold by month for 2016 and 2017.
Table 22: Reduced Fare Ticket Sales
Monthly Ten-RideOne-Way Station & Mobile
One-Way Conductor
Monthly Ten-RideOne-Way Station & Mobile
One-Way Conductor
Jan 3,227 13,652 29,830 27,709 3,057 16,713 40,985 24,673
Feb 3,229 10,806 32,860 28,032 3,125 9,763 39,437 23,774
Mar 3,328 12,215 56,952 34,402 3,215 12,430 55,605 26,617
Apr 3,286 12,109 43,836 29,853 3,121 11,599 47,172 26,185
May 3,223 12,472 51,834 36,428 3,161 13,217 53,480 27,866
Jun 3,064 13,604 75,390 45,745 2,927 13,494 83,163 39,002
Jul 3,104 12,094 86,271 41,886 - - - -
Aug 2,803 12,941 67,737 38,311 - - - -
Sep 3,389 13,287 42,399 29,616 - - - -
Oct 3,439 13,521 47,203 31,237 - - - -
Nov 3,308 13,559 51,255 28,764 - - - -
Dec 2,851 11,693 59,212 31,034 - - - -
Last 3 Months 9,573 38,185 171,060 112,026 9,209 38,310 183,815 93,053
Last 12 Months 38,149 150,185 612,901 433,429 37,500 154,311 673,919 368,965
Year-to-date 19,357 74,858 290,702 202,169 18,606 77,216 319,842 168,117
2016 2017
Monthly Ten-RideOne-Way Station & Mobile
One-Way Conductor
Jan -5.3% 22.4% 37.4% -11.0%
Feb -3.2% -9.7% 20.0% -15.2%
Mar -3.4% 1.8% -2.4% -22.6%
Apr -5.0% -4.2% 7.6% -12.3%
May -1.9% 6.0% 3.2% -23.5%
Jun -4.5% -0.8% 10.3% -14.7%
Jul - - - -
Aug - - - -
Sep - - - -
Oct - - - -
Nov - - - -
Dec - - - -
Last 3 Months -3.8% 0.3% 7.5% -16.9%
Last 12 Months -1.7% 2.7% 10.0% -14.9%
Year-to-date -3.9% 3.1% 10.0% -16.8%
Change