richard yorke deputy chief executive, china business
TRANSCRIPT

Richard Yorke
Deputy Chief Executive, China Business

China Economic Trends
Qu HongbinSenior Economist, China
19 April 2005
China’s key policy and economic trends in 2005

4
Key points
Tight credit policy will remain in place
– investment remains overheated and inflationary pressure has not eased
– quantitative controls vs. interest rate hikes
Market-oriented reforms are the ultimate solution
– land and energy prices must be unshackled
– speed up banking reform to stop credit misallocation
Hard landing for investment, but not GDP growth
– fixed investment growth to slow from 25% in 3Q04 to less than 10% by 2H05
– consumption growth will act as a buffer for GDP growth
No change in RMB policy under speculative circumstance

5
Investment has been overheated since late 2002
Local governments rushing to convert farmland into industrial zones, while promoting property and road projects
Nearly 4,000 industrial parks and development zones under construction, with a planned area of 36,000 sq km, equal to 1.5 times China’s existing urban area, or 62 times the size of Singapore
36 airports to be built within a 300-mile radius of Shanghai
0
1
2
3
4
5
6
Korea(1970-
80)
Taiwan(1970-
80)
Malaysia(1975-
85)
Japan(1955-
65)
US(1890-1910)
China(1998-2003)
Annual change in urbanisation ratio (percentage point)
ICOR

6
Quantitative tightening is working...
0
5
10
15
20
25
99 00 01 02 03 04 05
% Yr
0
5
10
15
20
25% YrIndustrial output
Heavy industry
Light industry
5
10
15
20
25
98 99 00 01 02 03 04 05
% Yr
5
10
15
20
25
% YrMoney supply M1Bank loansMoney supply M2

7
…but investment is still too hot...
0
10
20
30
40
50
60
02 03 04
% Yr
0
10
20
30
40
50
60% Yr
Total fixed investment Steel output Real estate investment

8
... And inflationary pressure has not eased
-10
-5
0
5
10
15
97 98 99 00 01 02 03 04 05
% Yr
-10
-5
0
5
10
15
20
% YrProducer output price index
Producer input price index
Consumer price index
94
96
98
100
102
104
106
108
02 03 04 05
-2.0
-1.5
-1.0
-0.5
0.0
0.5
1.0
1.5
2.0
% mom (SA, RHS) CPI index ( SA,Dec.02=100)
9
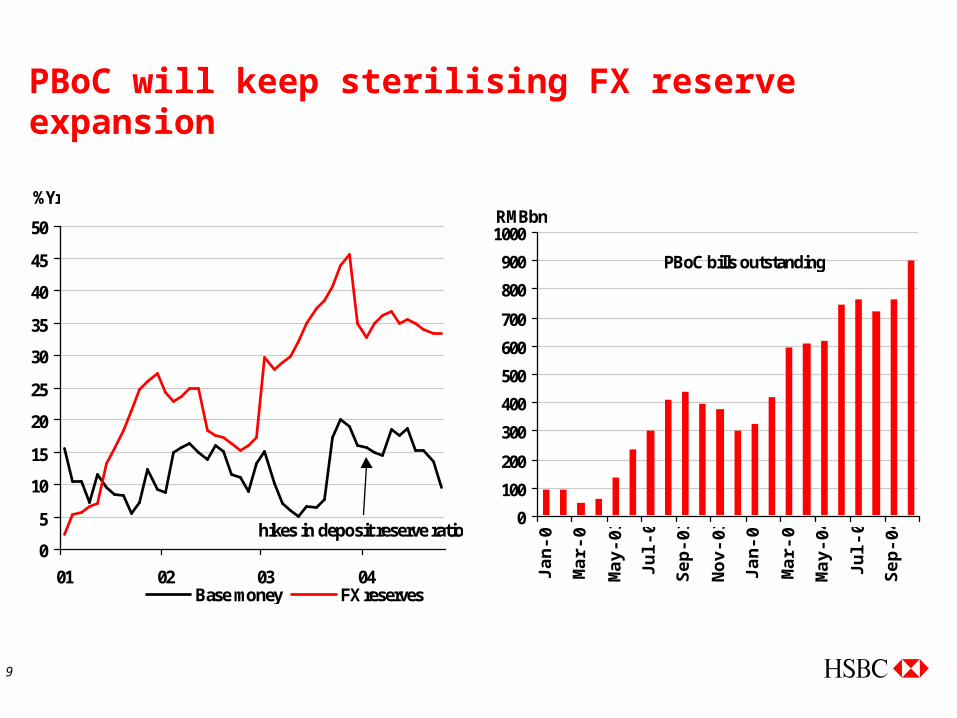
PBoC will keep sterilising FX reserve expansion
0
100
200
300
400
500
600
700
800
900
1000
Jan-
03
Mar
-03
May
-03
Jul-0
3
Sep-
03
Nov
-03
Jan-
04
Mar
-04
May
-04
Jul-0
4
Sep-
04
RMBbn
PBoC bills outstanding
0
5
10
15
20
25
30
35
40
45
50
01 02 03 04Base money FX reserves
%Yr
hikes in deposit reserve ratio
10
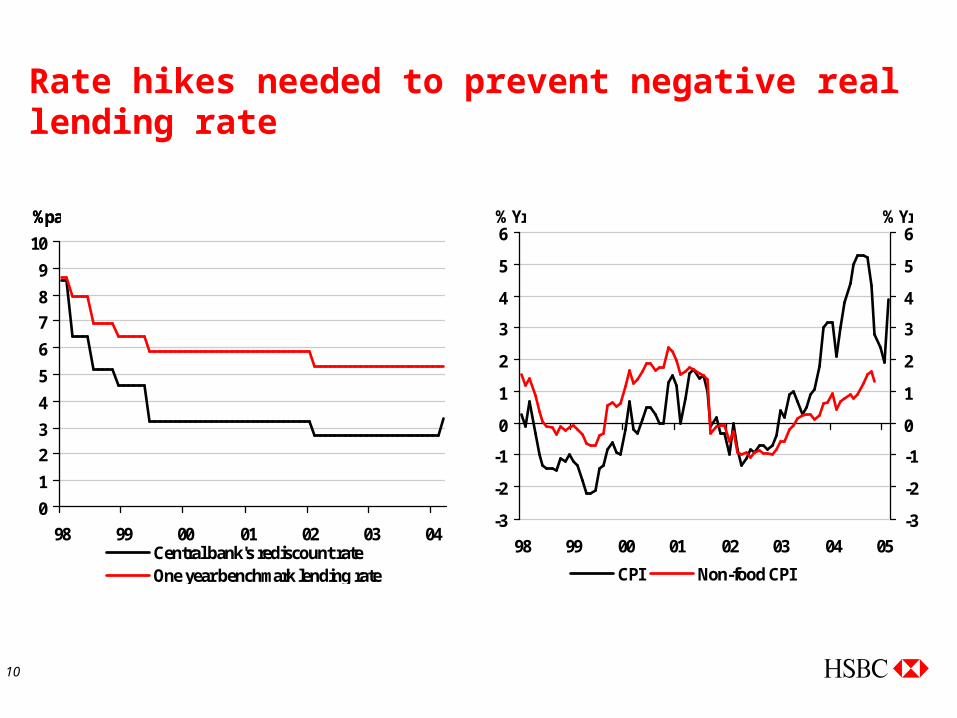
Rate hikes needed to prevent negative real lending rate
0
1
2
3
4
5
6
7
8
9
10
98 99 00 01 02 03 04Central bank's rediscount rateOne year benchmark lending rate
%pa%pa
-3
-2
-1
0
1
2
3
4
5
6
98 99 00 01 02 03 04 05
-3
-2
-1
0
1
2
3
4
5
6
CPI Non-food CPI
% Yr % Yr

11
Credit cycle vs. investment cycle
-10
0
10
20
30
40
50
60
70
1980
1982
1984
1986
1988
1990
1992
1994
1996
1998
2000
2002
2004 -10
0
10
20
30
40
50
60
70
M1 Fixed-asset investment
%Yr %Yr

12
Would a renminbi revaluation help to cool investment?
Monthly net inflows of short-term capital
-15000
-10000
-5000
0
5000
10000
15000
20000
97 98 99 00 01 02 03 04
7.0
7.5
8.0
8.5
9.0
9.5
10.0
Short-term capital inflows RMB NDF 1yr forward rate RMB spot rate
US$mn RMB/USD

13
Is the renminbi undervalued?
-4
-3
-2
-1
0
1
2
3
4
5
1990 1991 1992 1993 1994 1995 1996 1997 1998 1999 2000 2001 2002 2003
Trade balance of China/Hong Kong combined China trade balance
As % of GDP
14
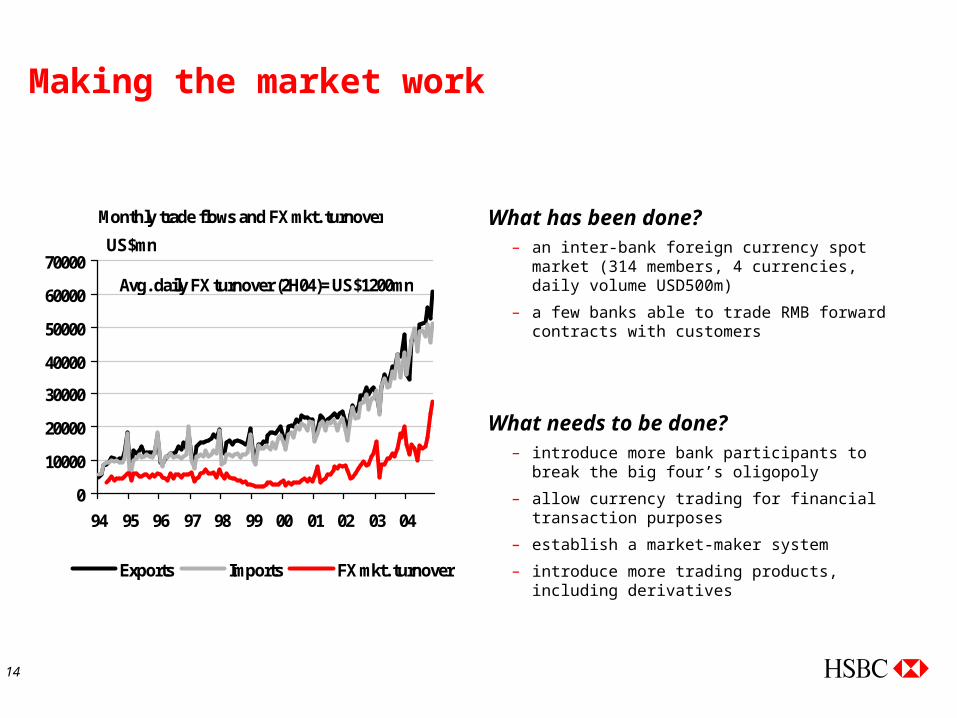
Making the market work
What has been done?– an inter-bank foreign currency spot market (314
members, 4 currencies, daily volume USD500m)
– a few banks able to trade RMB forward contracts with customers
What needs to be done?– introduce more bank participants to break the big
four’s oligopoly
– allow currency trading for financial transaction purposes
– establish a market-maker system
– introduce more trading products, including derivatives
0
10000
20000
30000
40000
50000
60000
70000
94 95 96 97 98 99 00 01 02 03 04
Exports Imports FX mkt. turnover
US$mn
Monthly trade flows and FX mkt. turnover
Avg. daily FX turnover (2H04)= US$1200mn
15
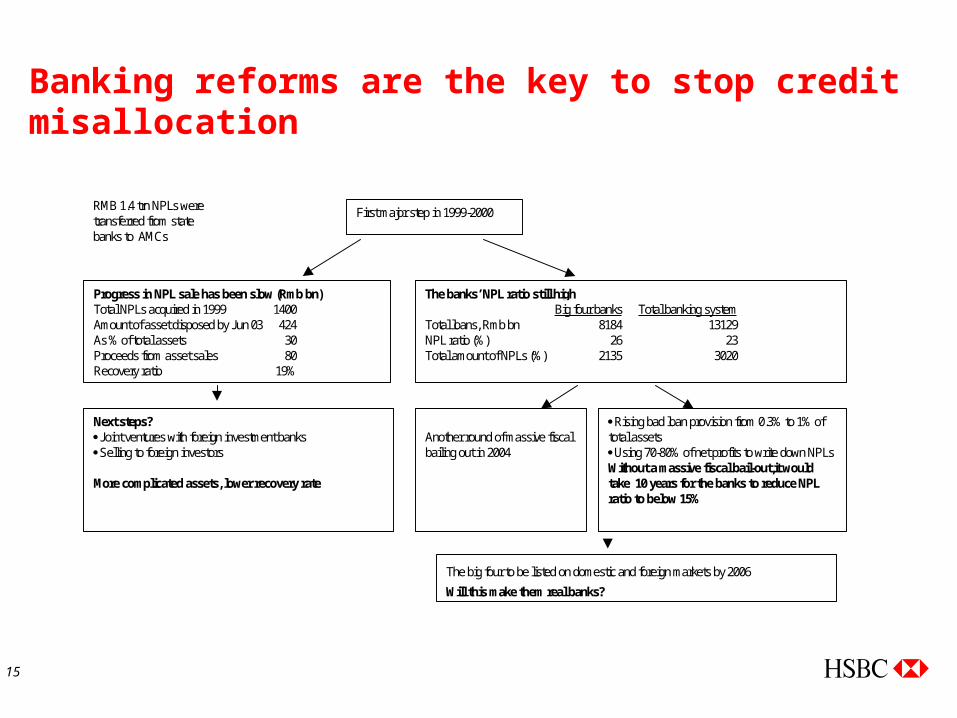
Banking reforms are the key to stop credit misallocation
Progress in NPL sale has been slow (Rmb bn)Total NPLs acquired in 1999 1400Amount of asset disposed by Jun 03 424As % of total assets 30Proceeds from asset sales 80Recovery ratio 19%
The banks’ NPL ratio still highBig four banks Total banking system
Total loans, Rmb bn 8184 13129NPL ratio (%) 26 23Total amount of NPLs (%) 2135 3020
First major step in 1999-2000RMB 1.4 trn NPLs weretransferred from statebanks to AMCs
Next steps?Joint ventures with foreign investment banksSelling to foreign investors
More complicated assets, lower recovery rate
Another round of massive fiscalbailing out in 2004
Rising bad loan provision from 0.3% to 1% oftotal assetsUsing 70-80% of net profits to write down NPLsWithout a massive fiscal bail-out,it wouldtake 10 years for the banks to reduce NPLratio to below 15%
The big four to be listed on domestic and foreign markets by 2006
Will this make them real banks?

16
Land and energy prices must be unshackled
A market-based pricing mechanism for land is essential to cure over-expansion in construction.
Replacing current land leasing policy with property taxation system can remove the incentives for local governments rushing into converting farmland into industrial/commercial zones
The rigid controls over prices of energy and transportation must be eased to cool reckless investment
0
1
2
3
4
5
6
Korea(1970-
80)
Taiwan(1970-
80)
Malaysia(1975-
85)
Japan(1955-
65)
US(1890-1910)
China(1998-2003)
Annual change in urbanisation ratio (percentage point)
ICOR

17
Only a third of the way to investment cycle trough
-30
-20
-10
0
10
20
30
40
50
81 83 85 87 89 91 93 95 97 99 01 03 05P
% Yr
-30
-20
-10
0
10
20
30
40
50% Yr
Real growth in fixed investment Forecast Linear (Trend growth)
policy tightening policy tighteningpolicy tightening

18
Hiatus needed to work off excess capacity
Manufacturing15%
Power,gas and water
17%
Real estate31%
Other service sectors
22%
Mining3%
Transportation11%
Farming1%
Fixed investment breakdown by sector
0
50
100
150
200
250
Farm
ing
Min
ing
Man
ufac
turin
g
Pow
er,g
asan
d w
ater
Tran
spor
tatio
n
Rea
l est
ate
Oth
er s
ervi
cese
ctor
s
US$bn 2003 total fixed investment=US$664bn
The main area of excess
investment

19
Consumption growth to hold up well
0
2000
4000
6000
8000
10000
12000
Household deposits in banks Household debt
RMB bn
-5
0
5
10
15
20
25
30
35
40
1992
1993
1994
1995
1996
1997
1998
1999
2000
2001
2002
2003
2004
2005
% Yr
-5
0
5
10
15
20
25
30
35
40% Yr
Rural household income Fixed investmentUrban household income

20
Housing privatisation has a big wealth effect
Housing privatisation: A tale of two families
Beijing: A ministerial-level organisation Xian: A state-owned manufacturing enterprise
Lao Li Division chief Xiao Fang EngineerSize of apartment 120 sq m Size of apartment 60 sq mPurchase price paid by Mr Li RMB1,400 / sq m Purchasing price paid by Mr Wang RMB500 / sq mMarket price RMB7,000 / sq m Market price RMB3,000 / sq mNet gain in wealth RMB672,000 Net gain in wealth RMB150,000Net gain in wealth / family income 13x Net gain in wealth / family income 7xSource: HSBC

21
Fiscal spending targeted at stimulating consumption rather than construction
0% 10% 20% 30% 40%
Unpredictableevents
Home purchase
Retirement
Children'seducation
2004 household survey: key motivations for saving
0
1
2
3
4
5
6
7
China Asianaverage
India Thailand Malaysia OECDaverage
Fiscal spending on education as % of GDP%

22
GDP growth to slow from over 10% y-o-y in 1H04 to 7% by 2005/6
% Year 2001 2002 2003 2004e 2005f 2006f
Consumer Spending 6.2 6.2 6.5 7.0 6.4 6.5
Gov't Consumption 11.5 12.0 5.0 4.0 -4.5 2.5
Fixed Investment 12.2 15.0 20.4 20.0 12.0 8.0
Stockbuilding (% GDP) -1.4 -1.2 0.1 0.0 -0.1 -0.1
Exports 7.5 18.0 32.0 32.0 14.0 5.0
Imports 8.8 19.0 36.0 31.0 11.0 5.0
GDP 7.3 8.0 9.3 9.0 7.0 7.0
Industrial Production 9.9 12.6 12.8 12.0 7.6 7.3
Retail Sales 10.1 8.8 9.1 13.1 12.0 10.5
Consumer Prices 0.7 -0.8 1.2 3.9 3.0 2.0
Current Acc. (% GDP) 1.5 2.2 3.3 2.5 1.8 1.4
Budget Bal. (% GDP) -2.7 -3.0 -2.9 -2.5 -1.8 -1.8
CNY/USD 8.3 8.3 8.3 8.3 8.3 8.3
1-Yr time deposit (%) 7.1 10.1 14.3 8.7 9.0 8.5
1 Yr Lending (%) 5.9 5.3 5.3 5.4 5.8 5.8
23
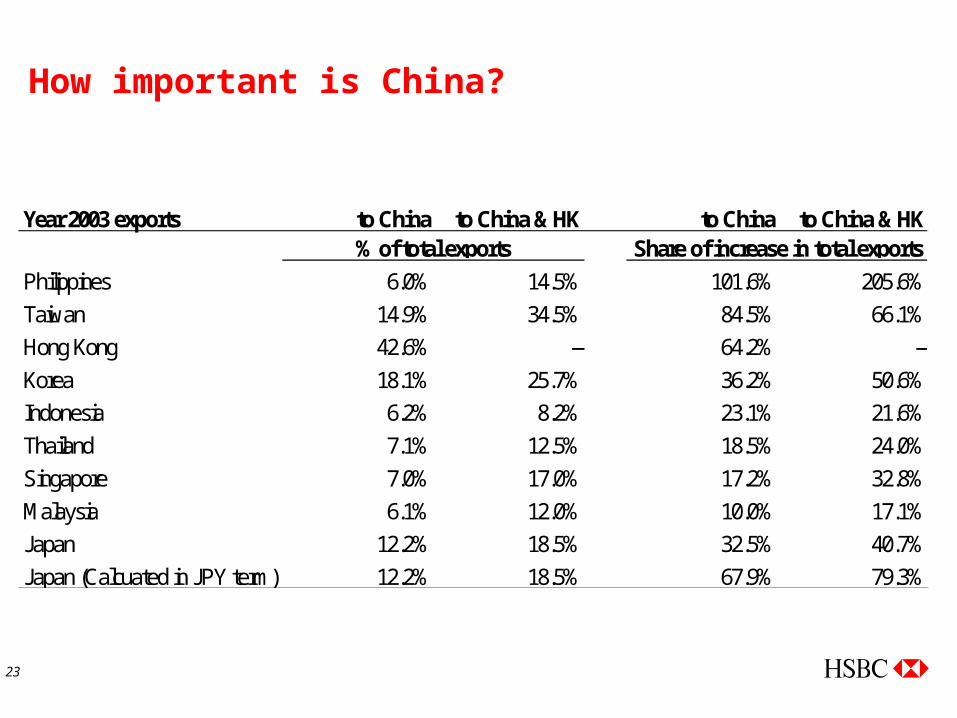
How important is China?
Year 2003 exports to China to China & HK to China to China & HK% of total exports Share of increase in total exports
Philippines 6.0% 14.5% 101.6% 205.6%Taiwan 14.9% 34.5% 84.5% 66.1%Hong Kong 42.6% -- 64.2% --Korea 18.1% 25.7% 36.2% 50.6%Indonesia 6.2% 8.2% 23.1% 21.6%Thailand 7.1% 12.5% 18.5% 24.0%Singapore 7.0% 17.0% 17.2% 32.8%Malaysia 6.1% 12.0% 10.0% 17.1%Japan 12.2% 18.5% 32.5% 40.7%Japan (Calcuated in JPY term) 12.2% 18.5% 67.9% 79.3%
24
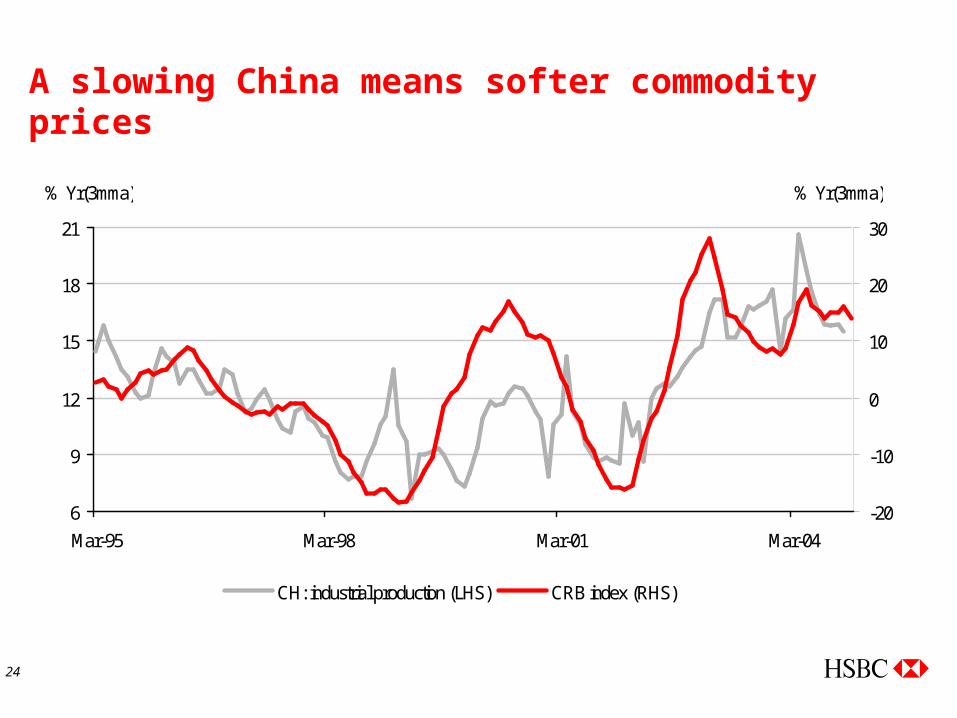
A slowing China means softer commodity prices
6
9
12
15
18
21
Mar-95 Mar-98 Mar-01 Mar-04-20
-10
0
10
20
30
CH: industrial production (LHS) CRB index (RHS)
% Yr(3mma) % Yr(3mma)
China’s New Industrialization
26
Key points
Relocation of global manufacturing business into China
– market reforms, WTO deal and globalization
– domestic market and cheap resources
Expansion of industrial base creates city jobs
– cluster of industries
– service sectors
Each year 10m people will migrate from their villages to cities
– additional demand ranging from food to housing
Fixing the financial system crucial to sustain growth

27
Foreigner investors remain bullish on China
1.99
1.89
1.511.50
1.29
1.16
1.12
1.05
0.95
0.93
0.91
0.89
0.8524. Taiwan
22. Singapore
21. Korea
20. Thailand
18. Hong Kong
15. India
12. Japan
10. Australia
5. France4. Germany3. UK
2. US
1. China
0.0 0.5 1.0 1.5 2.0 2.5 3.0
Low confidence High confidence
Values calculated on a 0 to 3 scale

28
Foreign-invested enterprises account for 75% of the increase in China’s market share
0%
1%
2%
3%
4%
5%
6%
93 94 95 96 97 98 99 00 01 02 03
China's total share FIE's share Domestic firm's share

29
Over 150m surplus rural labour queuing for city jobs
0
10
20
30
40
50
60
Primary industry Secondary Industry Tertiary industry
Share in GDP Share in employment
%
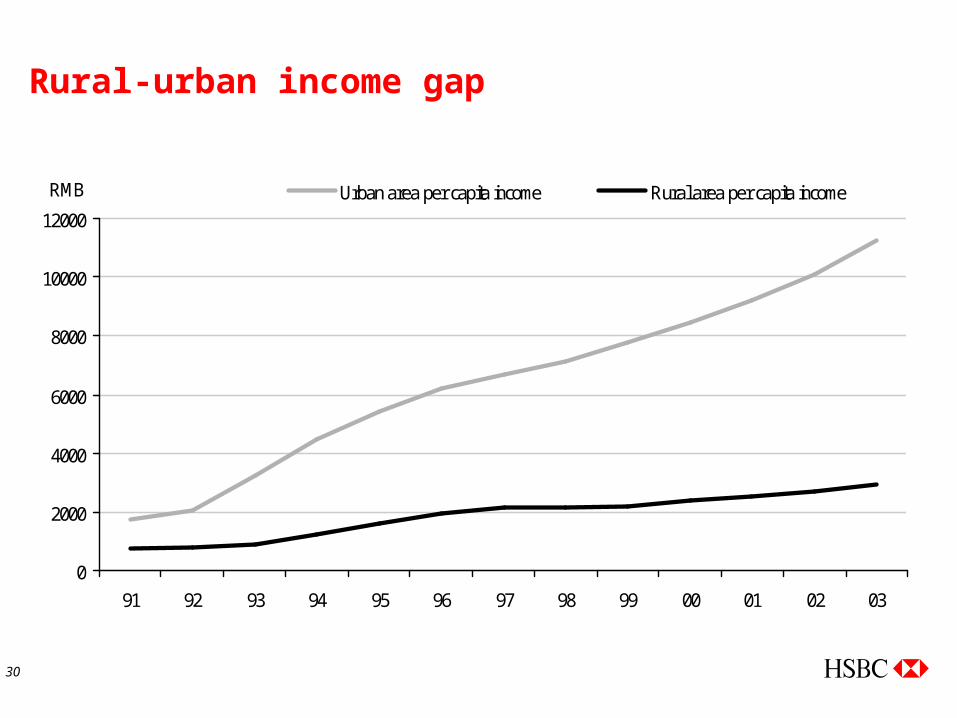
30
Rural-urban income gap
0
2000
4000
6000
8000
10000
12000
91 92 93 94 95 96 97 98 99 00 01 02 03
RMB Urban area per capita income Rural area per capita income
31
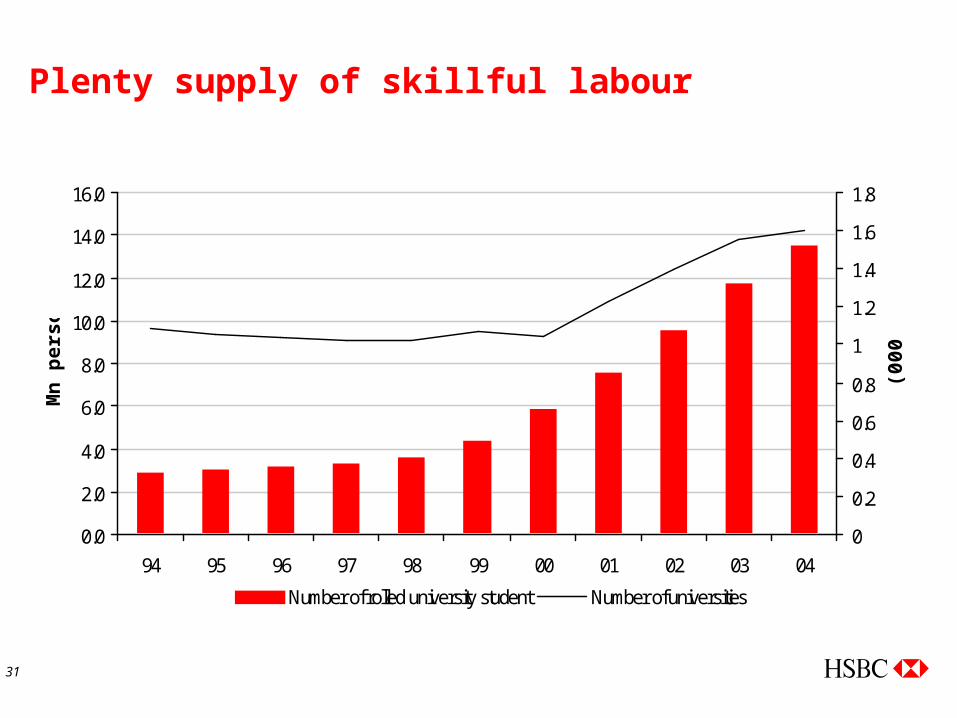
Plenty supply of skillful labour
0.0
2.0
4.0
6.0
8.0
10.0
12.0
14.0
16.0
94 95 96 97 98 99 00 01 02 03 04
Mn
pers
on
0
0.2
0.4
0.6
0.8
1
1.2
1.4
1.6
1.8
(000
')
Number of rolled university student Number of universities

32
Is the NPL situation beyond redemption?
China’s total public debt 2003
Treasury bonds outstanding (RMBbn) 1,930
Special financial bonds (RMBbn) 1,001
Total explicit government debt (RMBbn) 2,931
– as % of GDP 28.6%
Unrecoverable NPLs of state banks (RMBbn) 2,277
Pension shortfalls (RMBbn) 5,000
Total public debt (RMBbn) 10,000
– as % of GDP 90%
Source: PBoC, HSBC
33
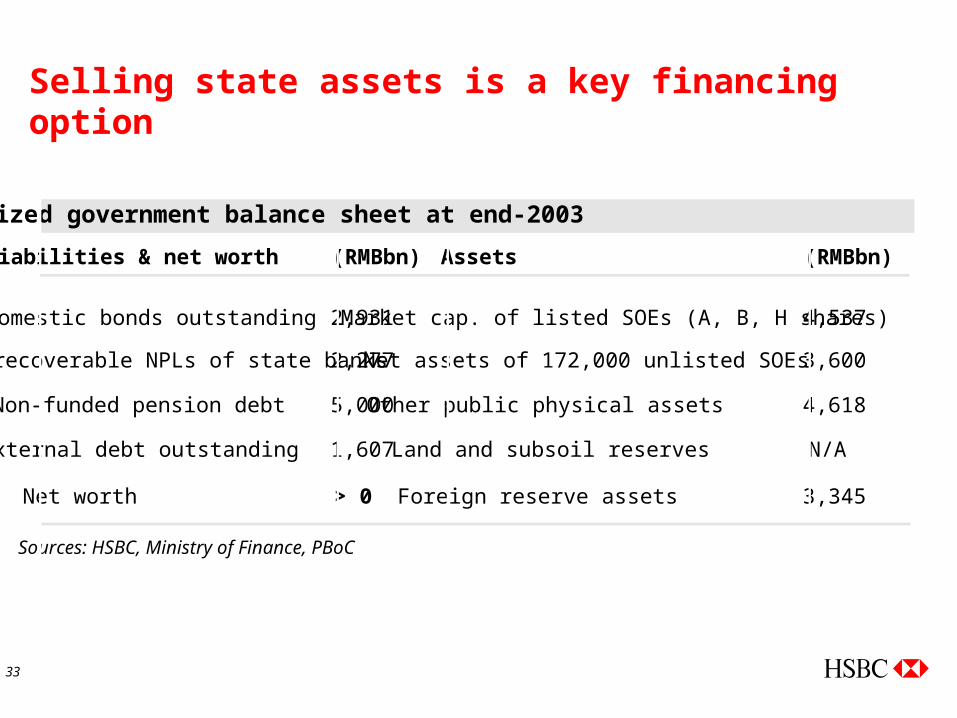
Selling state assets is a key financing option
Stylized government balance sheet at end-2003
Liabilities & net worth (RMBbn) Assets (RMBbn)
Domestic bonds outstanding 2,931 Market cap. of listed SOEs (A, B, H shares) 4,537
Unrecoverable NPLs of state banks 2,277 Net assets of 172,000 unlisted SOEs 3,600
Non-funded pension debt 5,000 Other public physical assets 4,618
External debt outstanding 1,607 Land and subsoil reserves N/A
Net worth > 0 Foreign reserve assets 3,345
Sources: HSBC, Ministry of Finance, PBoC
34
Real restructuring holds the key
Corporatisation of state banks
– limit direct intervention by government
Commerialistion of state banks
– make profit the primary motive
– appoint professional rather than political managers
– introduce performance-based salaries
Introduction of competition
– smaller, non-state banks are more efficient
35
Foreign JVs are a short-cut to strengthen banks
Foreign JVs instrumental in upgrading China’s manufacturing sector
– spillover effect of technology and management
This should also apply to knowledge-intensive finance industry
– foreign stake limit in banks is raised from 10% to 25%
– removing hurdles to enable foreign financial service providers to tap China market
WTO-led expansion of foreign banks

36
Appendix 1: China’s main trading partners
China's main trade partners (as % of China's total in 2003)
Country/region Export share Import share Total trade share
US USD 25.5 8.4 17.2Euroland EUR 20.5 13.0 16.9Japan JPY 15.0 18.4 16.7Hong Kong HKD 5.2 1.2 3.3Korea KRW 4.6 10.6 7.5Taiwan TWD 2.5 12.3 7.2UK GBP 2.5 0.9 1.7Singapore SGD 2.4 2.5 2.5Austria AUD 1.7 1.8 1.7Malaysia MYR 1.4 3.4 2.4

37
Appendix 2: 45% investment-GDP ratio unsustainable
China's fixed investment-GDP ratio
15
20
25
30
35
40
45
50
80 82 84 86 88 90 92 94 96 98 00 02
%
0
5
10
15
20
25
30
35
Thailand(1976-96)
Korea(1976-96)
Japan(1950-70)
US(1890-1910)
UK(1820-40)
Fixed investment-GDP ratio%

38
Appendix 3: Manufacturing job losses happening in China too
80
85
90
95
100
105
94 95 96 97 98 99 00 01 02 03 04
80
85
90
95
100
105
US UK Germany China
Employ ment in manufacturingIndexIndex
Source: HSBC, Thomson Financial Datastream

39
Appendix 4: A renminbi cure for global economic imbalance?
China accounts for 25% of the overall US trade deficit, and the ratio remained stable
A 10% revaluation in the RMB would weaken real exchange rate of USD by 1% and cut the US trade deficit US$10bn
China runs a big trade deficit with Asian countries

40
Appendix 5: China’s bilateral surplus bigger with the US but now has deficit with Asia
-20,000
-10,000
0
10,000
20,000
30,000
40,000
50,000
60,000
82 83 84 85 86 87 88 89 90 91 92 93 94 95 96 97 98 99 00 01 02 03 04
-20,000
-10,000
0
10,000
20,000
30,000
40,000
50,000
60,000
Chinese trade balance w ith US Chinese trade balance w ith Asia
$ mn$ mn
Source: HSBC, Thomson Financial Datastream

41
Appendix 6: The dollar's trade weighted index: the Fed's measure
Country Weight (out of 100) Country Weight (out of 100)
Eurozone 18.5 Philippines 1.2Canada 16.5 Australia 1.3Japan 11.1 Indonesia 1.0Mexico 11.0 India 1.1China 9.8 Israel 1.0United Kingdom 5.2 Saudi Arabia 0.6Taiwan 3.0 Russia 0.7Korea 3.9 Sweden 1.1Singapore 2.2 Argentina 0.4Hong Kong SAR 2.0 Venezuela 0.4Malaysia 2.3 Chile 0.5Brazil 1.9 Colombia 0.4Switzerland 1.4Thailand 1.4 Total 100.0Source: Federal Reserve. Weights are for the broad index of the foreign exchange value of the dollar and were last updated on 16December 2003. The weights reflect a mixture of export and import patterns.
42
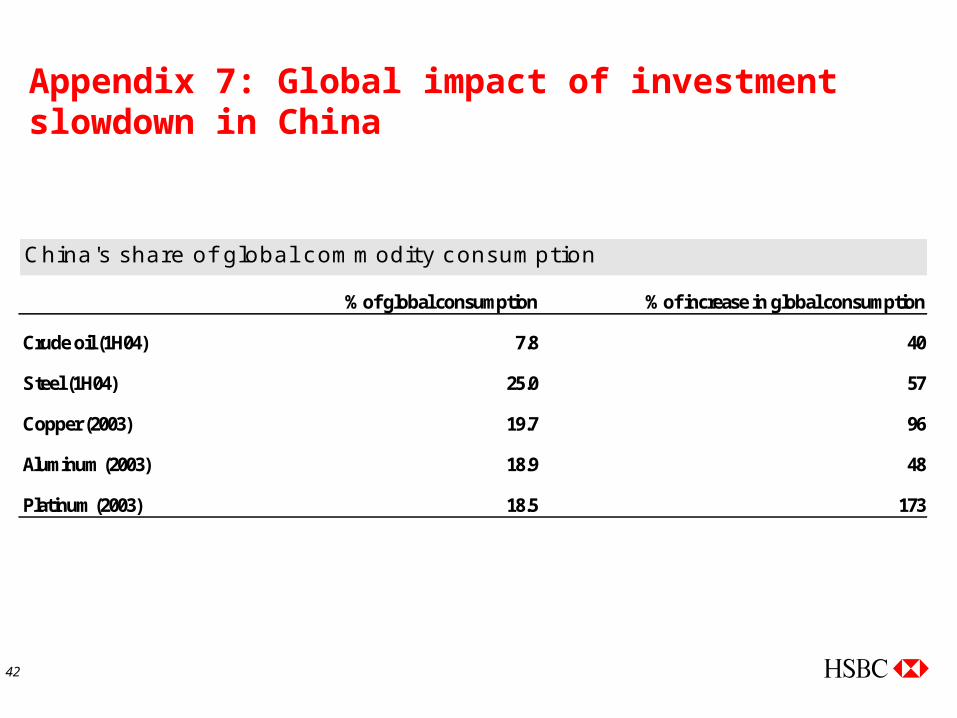
Appendix 7: Global impact of investment slowdown in China
China's share of global commodity consumption
% of global consumption % of increase in global consumption
Crude oil (1H04) 7.8 40
Steel (1H04) 25.0 57
Copper (2003) 19.7 96
Aluminum (2003) 18.9 48
Platinum (2003) 18.5 173
43
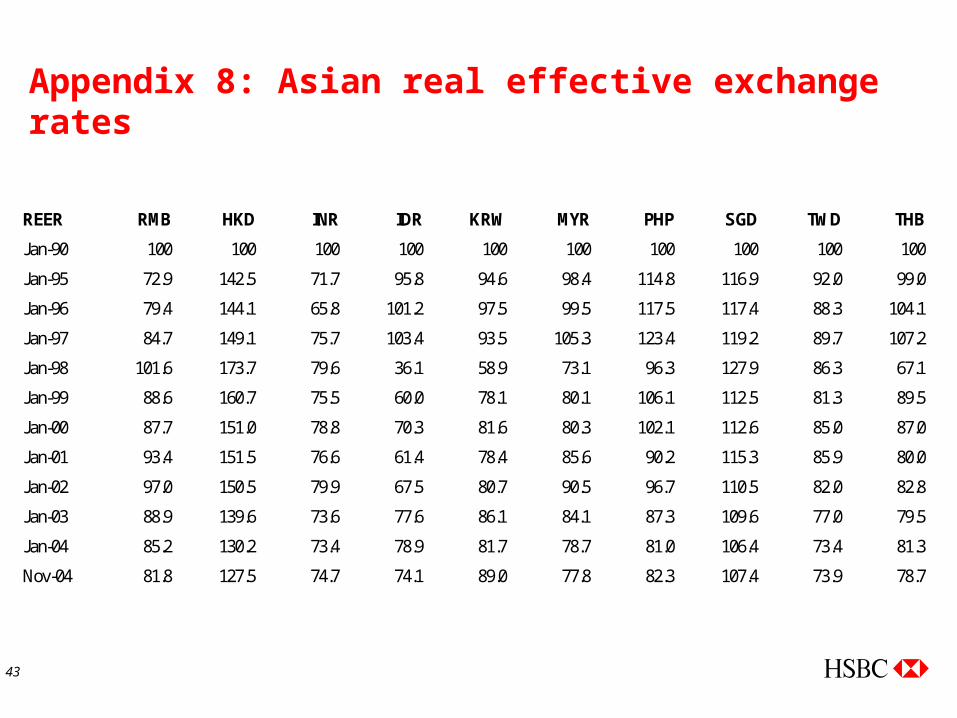
Appendix 8: Asian real effective exchange rates
REER RMB HKD INR IDR KRW MYR PHP SGD TWD THB
Jan-90 100 100 100 100 100 100 100 100 100 100
Jan-95 72.9 142.5 71.7 95.8 94.6 98.4 114.8 116.9 92.0 99.0
Jan-96 79.4 144.1 65.8 101.2 97.5 99.5 117.5 117.4 88.3 104.1
Jan-97 84.7 149.1 75.7 103.4 93.5 105.3 123.4 119.2 89.7 107.2
Jan-98 101.6 173.7 79.6 36.1 58.9 73.1 96.3 127.9 86.3 67.1
Jan-99 88.6 160.7 75.5 60.0 78.1 80.1 106.1 112.5 81.3 89.5
Jan-00 87.7 151.0 78.8 70.3 81.6 80.3 102.1 112.6 85.0 87.0
Jan-01 93.4 151.5 76.6 61.4 78.4 85.6 90.2 115.3 85.9 80.0
Jan-02 97.0 150.5 79.9 67.5 80.7 90.5 96.7 110.5 82.0 82.8
Jan-03 88.9 139.6 73.6 77.6 86.1 84.1 87.3 109.6 77.0 79.5
Jan-04 85.2 130.2 73.4 78.9 81.7 78.7 81.0 106.4 73.4 81.3
Nov-04 81.8 127.5 74.7 74.1 89.0 77.8 82.3 107.4 73.9 78.7

44
Appendix 9: China’s three-tier banking system
Big four state banks54%
Regional banks 15%
Rural credit cooperatives10%
Municipal banks5%
Foreign banks2%
Other financial institutions14%
Breakdown of financial institution assets (June 2004)

45
DisclaimerThe research analyst(s) who prepared this report certifies(y) that the views expressed herein accurately reflect the research analyst's(s') personal views about the subject security(ies) and issuer(s) and that no part of his/her/their compensation was, is or will be directly or indirectly related to the specific recommendation(s) or views contained in this research report.*in this publication, HSBC Group offices are indicated by the following codes: 'AU' HSBC Bank plc - Sydney Branch and HSBC Bank Australia Limited; 'UK' HSBC Bank plc in London in the United Kingdom; 'DE' HSBC Trinkaus & Burkhardt KgaA in Dusseldorf, Germany; 'FR' HSBC CCF Social SA in Paris, France; 'HK' The Hongkong and Shanghai Banking Corporation Limited, in Hong Kong SAR in China; 'JP' HSBC Securities (Japan) Limited in Tokyo, Japan; 'US' HSBC Securities (USA) Inc., in New York, USA; 'CA' HSBC Bank Canada.
The Hongkong and Shanghai Banking Corporation Limited (“HSBC”) has issued this research material. This material is distributed in the United Kingdom by HSBC Bank plc, and in Australia by HSBC Bank plc – Sydney Branch (ABN 98 067 329 015) and HSBC Bank Australia Limited (ABN 48 006 434 162) for the general information of its “wholesale” customers (as defined in the Corporations Act 2001). It makes no representations that the products or services mentioned in this document are available to persons in Australia or are necessarily suitable for any particular person or appropriate in accordance with local laws. This material is distributed in Japan by HSBC Securities (Japan) Limited. This material may be distributed in the United States solely to "major US institutional investors" (as defined in Rule 15a-6 of the US Securities Exchange Act of 1934); such recipients should note that any transactions effected on their behalf will be undertaken through HSBC Securities (USA) Inc. in the United States. Note, however, that HSBC Securities (USA) Inc. is not distributing this report, has not contributed to or participated in its preparation, and does not take responsibility for its contents. Among other things, this means that the legends and other disclosures set forth in this report do not conform to the rules of the regulatory and self-regulatory organizations to which HSBC Securities (USA) Inc. is subject. In the UK this material may only be distributed to institutional and professional customers and is not intended for private customers. It is not to be distributed or passed on, directly or indirectly, to any other person. Any recommendations contained in it are intended for the professional investors to whom it is distributed. This material is not and should not be construed as an offer to sell or the solicitation of an offer to purchase or subscribe for any investment. HSBC has based this document on information obtained from sources it believes to be reliable but which it has not independently verified; HSBC makes no guarantee, representation or warranty and accepts no responsibility or liability as to its accuracy or completeness. Expressions of opinion are those of HSBC only and are subject to change without notice. The decision and responsibility on whether or not to invest must be taken by the reader. HSBC and its affiliates and/or their officers, directors and employees may have positions in any securities mentioned in this document (or in any related investment) and may from time to time add to or dispose of any such securities (or investment). HSBC and its affiliates may act as market maker or have assumed an underwriting commitment in the securities of any companies discussed in this document (or in related investments), may sell them to or buy them from customers on a principal basis and may also perform or seek to perform banking or underwriting services for or relating to those companies. This material may not be further distributed in whole or in part for any purpose. No consideration has been given to the particular investment objectives, financial situation or particular needs of any recipient.
© Copyright. The Hongkong and Shanghai Banking Corporation Limited 2004, ALL RIGHTS RESERVED. No part of this publication may be reproduced, stored in a retrieval system, or transmitted, on any form or by any means, electronic, mechanical, photocopying, recording, or otherwise, without the prior written permission of The Hongkong and Shanghai Banking Corporation Limited. (May 2004)
The Hongkong and Shanghai Banking Corporation Limited1 Queen’s Road Central, Hong Kong SARTelephone: +852 2843 9111 Telex: 75100 CAPEL HXFax: +852 2801 4138Website: www.markets.hsbc.comWebsite: www.research.hsbc.com