richard k. lester edward a. cunningham china … · edward s. steinfeld richard k. lester edward a....
TRANSCRIPT

Edward S. Steinfeld
Richard K. Lester
Edward A. Cunningham
China Energy Group
MIT Industrial Performance Center
August 2008

The views expressed herein are the authors’ responsibility and do not
necessarily reflect those of the MIT Industrial Performance Center or the
Massachusetts Institute of Technology.
Edward S. Steinfeld <[email protected]>
Richard K. Lester <[email protected]>
Edward A. Cunningham <[email protected]>

Steinfeld|Lester|Cunningham Greener Plants, Grayer Skies? August 2008
2
I. Introduction∗
China’s emergence as the world’s largest emitter of carbon dioxide and second largest
consumer of energy overall (behind the United States) has caused observers worldwide to
become aware of a basic fact. To a significant degree, our planet’s energy and environmental
future is now being written in China. Consequential energy decisions are being made
throughout this rapidly transforming nation. Every new building, every new urban transport
system, and every new factory involves decisions about energy. Collectively, this vast array of
decisions has implications not just for China’s own environment, but more generally for global
resource availability, global energy prices, and global environmental conditions.
In no domain are China’s energy-related decisions more crucial and the linkages to the
global environment more direct than in electric power. China’s power sector is critical for a
number of reasons. First, it is very large in global terms. In 2007, installed generating capacity
in China stood at 713 thousand megawatts, or gigawatts (GW), second only to the United
States’ roughly 1075 GW.1 Second, the power sector in recent years has been expanding at a
frenetic pace, more than doubling in size since 2000. In 2006 alone, 102 GW of new
generating capacity was added, an increment substantially larger than the United Kingdom’s
entire electric power system. It is reasonable to estimate that during the past three years, the
equivalent of three or four 500 megawatt (MW) power plants have been coming on line in
China every single week. In terms of physical energy infrastructure, what took the United
States the better part of a century to construct has gone up in China in less than a decade.
Third, China’s power sector is fueled overwhelmingly by coal. Roughly 80 percent of Chinese
electricity is generated through coal combustion, as compared to 50 percent in the United
States, the world’s second largest coal user. Coal is also used extensively in China’s industrial
∗ The authors wish to thank Shell, the MIT Energy Initiative, and the MIT Sloan School of Management China Program for their generous financial support. Throughout this project, we have benefited greatly from discussions with other members of the MIT Industrial Performance Center’s China Energy Group: Greg Distelhorst, Valerie Karplus, Jonas Nahm, Kyoung Shin, Lily Tong, and Hiram Samel. We are also grateful to Janos Beer for his detailed comments on an earlier version of this paper. 1 China figure from China Electricity Council, 2008; US figure from Energy Information Agency, U.S. Department of Energy, “Existing Capacity by Energy Source” (http://www.eia.doe.gov/cneaf/electricity/epa/epat2p2.html)

Steinfeld|Lester|Cunningham Greener Plants, Grayer Skies? August 2008
3
sector and as a source of chemical feedstocks. That said, coal demand is increasing much more
rapidly in the power sector, which today already accounts for over half of total consumption.2
This matters partly because the byproducts of coal combustion have major environmental
consequences. Atmospheric emissions of sulfur oxides (SOx) and nitrogen oxides (NOx) have
long been recognized as the primary drivers of acid precipitation. Other harmful emissions
include fine particulates, volatile organic compounds, and toxic trace metals like mercury and
arsenic. And now, carbon dioxide, because of its link to global warming, has become the most
prominent item on the pollutant list. Coal is the most abundant energy resource globally and
the most carbon-intensive. Its combustion worldwide is the largest single driver of
anthropogenic climate change. In 2005, coal accounted for 42 percent of global CO2
emissions. In that year, coal combustion accounted for 82 percent of China’s CO2 emissions,
and 36 percent of America’s CO2 emissions.3
Despite much current attention to alternative energy technologies such as wind and solar
power, fuel cells, biomass, and nuclear power, the likelihood is that coal will remain the
world’s largest source of electricity for decades to come. Thus the most important questions
for the earth’s environmental future, at least over the coming decades, concern how coal will
be utilized. Will it be used cleanly or destructively? Will it be used efficiently or inefficiently?
And will its pollutant byproducts be dealt with effectively or effectively ignored? These
questions matter wherever coal is being used, but they matter most where coal is being used
most extensively, China.
The scale of China’s coal use makes it a global concern. Furthermore, since China is still
setting the regulatory, technological, and economic parameters that will govern exactly how
coal is used, there is at least the possibility of achieving constructive change in China with
global reach. In essence, the power sector encompasses a series of potential ‘leverage points’.
These include, for example, the type and quality of the coal consumed, the mechanisms and
prices by which coal is sourced, the technologies used to burn coal, and the systems employed
2 National Bureau of Statistics, China Energy Statistical Yearbook, 2006. 3 Energy Information Agency, “World Carbon Dioxide Emissions from the Consumption of Coal, 1980-2006” (http://www.eia.doe.gov/pub/international/iealf/tableh4co2.xls); Energy Information Agency, “World Carbon Dioxide Emissions from the Consumption and Flaring of Fossil Fuels, 1980-2005,” (http://www.eia.doe.gov/pub/international/iealf/tableh1co2.xls).

Steinfeld|Lester|Cunningham Greener Plants, Grayer Skies? August 2008
4
to deal with its emissions. Most of these leverage points intersect at the level of analysis of this
paper, the power plants coming on line in China every week.
It must be noted that this paper does not directly address any efforts on China’s part to
deal specifically with CO2 emissions. China – like other countries including the United States
-- has yet to embark on a serious effort here. What the paper does do, however, is to examine
two sets of issues that will be of great importance should serious efforts at climate change
mitigation ultimately move forward. The first pertains to the efficiency with which fossil fuel-
based energy production is being carried out. The second concerns the overall responsiveness
of the system to change and innovation. By examining how the Chinese system is responding
today to a variety of new economic and environmental pressures – namely, rising fuel costs
and growing concerns over air pollution – this paper aims to illuminate the system’s ability to
deal in the future with the even greater regulatory, economic, technological, and operational
innovations that will be necessary to deal with carbon.
The Conventional Wisdom
The phrase “opportunities for leverage” has a hopeful ring. The conventional wisdom
about China’s power sector today, however, suggests anything but hope. Observers focusing
on this topic – particularly those from outside China – have for the most part arrived at a
consensus view on what the sector is really like. The picture is essentially as follows.
First, China’s energy infrastructure is expanding rapidly, but it is being built with
retrograde, antiquated, and inefficient technologies. Furthermore, these technologies are being
deployed in small plants, which neither capture minimum scale economies nor are subject to
effective regulatory supervision. Basically, in this view China is building the quickest, cheapest,
dirtiest system possible – a 21st century infrastructure with Eisenhower-era technology. In so
doing, the country is locking itself into a sub-standard energy system for decades to come.
A second component of the conventional wisdom is that the main fuel for that
infrastructure, domestically-sourced coal, is heavily subsidized and of low quality. Because coal
prices are controlled by the state, utility operators face few incentives to switch to cleaner

Steinfeld|Lester|Cunningham Greener Plants, Grayer Skies? August 2008
5
alternative fuels or use technologies that burn coal more efficiently. In addition, artificially low
coal prices lead to underpriced electricity, which then pushes China’s overall industrial
structure toward more energy-intensive sectors. China as a result becomes a repository for the
world’s most energy-intensive industries, and in an environment in which few price incentives
exist for the efficient operation of those industries.
Third, China has neither the political will nor the governmental capacity to shift from the
environmentally destructive, resource intensive path it is currently on. Some observers suggest
that this stems from problems at the top, an overarching leadership ethos that privileges
economic enrichment and national power over environmental sustainability. Others suggest
that the problem has more to do with the peripheries, and with an inability on the part of
environmentally-conscious leaders in Beijing to control the local officials who build and
operate power plants. In the end, both views arrive at a similar conclusion; the officials who
count, whether in the center or at the peripheries, will not push for more sound environmental
practices.
Taken together, these three points – about technology, fuels, and political context – fit
together into a single punch line. In the bluntest terms, “China builds crap, it burns crap, and it
doesn’t give a crap.”
Conventional Wisdom Challenged: MIT’s 2007 China Energy Survey
At least initially, the picture sketched in the preceding paragraphs resonated with our
research team in the MIT Industrial Performance Center’s China Energy Group. Having
carried out substantial amounts of China-based field work in recent years, we had all witnessed
many of the darker aspects of the Chinese energy system – the intense urban air pollution, the
antiquated technologies, the substandard operational practices, and the haphazard, spotty
pattern of regulatory enforcement. Yet these views were often impressionistic and were
complicated by instances we had witnessed of almost the complete opposite – investment in
very advanced technologies, rapid uptake of advanced managerial practices, and serious
attention to environmental cleanup. As we struggled to make sense of our own experiences,
we were continually struck by the extent to which the emerging conventional wisdom was

Steinfeld|Lester|Cunningham Greener Plants, Grayer Skies? August 2008
6
based on precious little systematic data. Nobody, whether in academia, government, or
industry, seemed to have the kind of comprehensive data -- particularly firm-level data –
needed to back up such an assessment. It was not only the outsiders who were lacking data.
Chinese regulators themselves, especially at the center, seemed at a loss to identify exactly what
was happening on the ground. While it may have been plausible to believe that China could
“build crap, burn crap, and not give a crap,” our experience told us that the system was far
more complex and varied than that. Meanwhile, as our own impressions were getting
increasingly confused and ambivalent, the conventional wisdom, especially outside China,
seemed to be getting more blunt, more certain, and more entrenched, especially as it was
articulated alongside the policy question of whether the United States should do anything
about climate change if China was just continuing along an environmentally retrograde path.
In 2005, our MIT team decided to tackle the information problem by embarking on a first-
of-its-kind data collection effort, a full-scale survey of China’s coal-fired electric power sector.
The survey, done in partnership with a domestic Chinese research firm, was ultimately
conducted in 2007 and completed in early 2008. Administered at the level of the power plant,
it involved an extensive 26-page Chinese-language survey instrument covering multiple areas
of power plant infrastructure, investment, operations, and environmental cleanup. In total, the
survey sample encompassed 85 power plants, many of which had multiple generating units.
Two-hundred ninety-nine separate generating units were included in total. Senior specialists
within each plant – plant managers, chief engineers, senior environmental officers, and chief
financial officers – were called upon, via telephone or face-to-face interview, to answer
portions of the survey corresponding to their respective areas of professional responsibility.
The survey results uncovered a reality far more complicated than anything suggested by
the conventional wisdom. The findings are briefly summarized below, and then addressed in
detail in the main body of the paper.
First, particularly with the onset of the most rapid phase of energy sector expansion, the
period dating from 2002 through 2007, the system could not unequivocally be described as
dominated by small-scale facilities. Many new generating units have been built in recent years,
and they have come in a variety of sizes and types. We see on the one hand the building of
Steinfeld|Lester|Cunningham Greener Plants, Grayer Skies? August 2008
7
many smaller scale units (capacity under 50 MW), but on the other hand the appearance of
more and more large scale units (capacity over 300 MW). Thus, while small-scale units, just in
terms of sheer numbers, account for the majority of new units coming on line, large units
account for the bulk of the new generating capacity added to the system. It is worth noting
that such size variation is consistent not only with China’s power sector expansion, but also
America’s.
Second, across power plants of all scales in China, there has in recent years been significant
uptake of advanced combustion and turbine technologies. China’s power sector exhibits a
wide range of equipment types. The survey sample certainly revealed older systems no longer
commonly found in advanced industrial economies. Yet, it also revealed substantial
representation at the other end of the spectrum, with a sizable portion of plants employing
state-of-the-art equipment, much of it sourced from global suppliers. Interestingly, some of
the newest and most advanced coal combustion technologies currently used in China are most
suitable for – and most frequently found in – smaller to medium size generating units.
Contrary to what the conventional wisdom might suggest, it is not simply the case in Chinese
– or even global – power generation that “small equals bad” in terms of operational efficiency
and environmental performance.
Third, technologies for environmental cleanup, most notably those for handling SOx
emissions, are appearing with increasing frequency in Chinese coal-fired power plants. In some
cases, “clean coal” technologies have been installed that permit SOx neutralization and
removal in the combustion unit. In other cases, flue-gas desulfurization (FGD) systems, or
“scrubbers,” enabling post-combustion capture of SOx, have been added to conventional
units. Again, these systems are being sourced from a variety of suppliers, multinational and
domestic. Evidently some kind of institutional pressure exists in the Chinese system to push at
least some kinds of power producers to purchase environmental cleanup technologies.
Fourth, a substantial portion – and possibly the bulk -- of all coal consumed by Chinese
power plants is now sourced on open markets at market-determined prices. Subsidized prices
and state-controlled allocation channels have been largely phased out. Instead, the majority of
Chinese electric utilities secure fuel by dealing directly with mines either through long-term

Steinfeld|Lester|Cunningham Greener Plants, Grayer Skies? August 2008
8
(one year) supply contracts or, not infrequently today, through immediate spot market
purchases. With coal demand now exceeding supply, Chinese coal prices have risen
significantly, converging in recent years to global levels. It is fair to say that in fuel acquisition,
a core aspect of day-to-day operations, Chinese power producers are now functioning in a
marketized environment. Facing rapidly rising fuel costs, they are experiencing a variety of
both long and short-term pressures to economize.
Within this environment, Chinese power utilities burn a wide range of coal types sourced
from a wide range of mines, both local and more distant. Interestingly, regardless of which
type they access, plants on the whole seem to be purchasing coal of relatively low sulfur
content. Again, this suggests that even in a rising cost environment, power producers are being
pushed by certain institutional pressures to purchase more expensive, more environmentally-
friendly low-sulfur fuels.
Fifth, and of critical importance, in terms of actual environmental performance, Chinese
power plants operate quite poorly. The data for SOx emissions show this most clearly. The
MIT survey depended on self-reported data by plant-level respondents, but even here, plants
were reporting SOx emission levels far above global standards, and in some cases, levels
exceeding China’s own domestic legal limits.
This last finding in particular makes for a complex picture. Important aspects of
marketization are clearly underway in China’s energy sector. Power plants, now falling under a
variety of ownership schemes, for the most part operate as autonomous economic actors. In
terms of infrastructure, they must choose their own technologies and cobble together the
financing necessary to secure them. In terms of operations, they must source most of their
fuel, their largest operating expense, on open markets at variable prices. In terms of regulatory
environment, they must cope with a series of new rules and strictures, some of which are
ambiguously defined, and many of which have changed repeatedly in recent years. Meanwhile,
these utilities are expected to be commercially-viable entities, realizing operating profits in the
near term and positive returns on investment over the long run.
What do they do under such conditions? Some – a substantial fraction, in fact – install
modern generating technologies, offering far greater operational efficiencies, and thus lower

Steinfeld|Lester|Cunningham Greener Plants, Grayer Skies? August 2008
9
costs over the lifetime of the plant, than had previously been achievable in China. After all,
more efficient electric power generating technologies permit less fuel to be burned per unit of
electricity produced. The environmental side benefit is that greater fuel efficiency means fewer
pollutants emitted per unit of electricity generated. Escalating coal prices and mandatory
emission control policies clearly serve as an important lever for encouraging change in this
direction.
At the same time, while a substantial number of power producers invest in expensive
environmental cleanup technologies, the emissions data suggest that these technologies are not
being operated on a regular basis. Here, we may perhaps be witnessing the downside of rising
coal prices, for plants can balance fuel price hikes by cutting back on the operational costs
associated with using cleanup systems.
The bottom line is that in environmental terms, Chinese coal-fired power plants are
performing poorly today, but they are investing in the sorts of physical infrastructure necessary
for better performance in the future. As MIT’s 2007 China Power Survey shows, it is not
simply the case that “China builds crap, burns crap, and does not give a crap.” Yet it is also
clearly not the case that China has already arrived at a solution for sustainable energy
production. Somehow, enough leverage – whether commercial, regulatory, or political – exists
in the Chinese context to get plants to spend money on modernization and to purchase the
kinds of technologies necessary for achieving better environmental outcomes in the future. Yet
there does not appear to be sufficient leverage to employ those technologies so as to realize
better environmental outcomes today. Meanwhile, all of this is taking place in a rapidly
marketizing environment. The real question is whether societal pressure and political
determination – governance, in effect – will tilt the balance, transforming the potential for
better environmental performance into actual reality.
II. Description of the Survey and Sampling Technique
MIT’s 2007 China Power Survey covered 85 power plants across 14 Chinese provinces.
The geographic distribution of the respondents is illustrated in Chart 2.1 and Table 2.1.

Steinfeld|Lester|Cunningham Greener Plants, Grayer Skies? August 2008
10
Chart 2.1 Location of Power Plants in MIT 2007 China Energy Survey
These plants encompass 299 separate generating units, the vast majority of which are coal-fired. The exceptions are 9 small units that burn oil, one that burns coke oven gas, and 13 that burn coal gangue, a solid waste product from the processing of coal. These ended up in the survey because they happen to be ancillary units of some of the coal-burning utilities that responded. Similarly, the survey also captured 7 units that are either planned or currently under construction, and 35 units that have already been shut down. Among the closed units are two oil-burning facilities.
The plants surveyed comprise a total combined generating capacity of 32.68 GW, though
2.2 GW of that total pertains to units no longer in operation, and 2.7 GW pertains to plants
not yet completed. Power plants within China are categorized as “large sized” if total capacity
equals exceeds 300 MW, “medium-sized” if capacity is below 300 MW but above 50 MW, and
“small-sized” if capacity is below 50 MW. Of the 85 power plants in the survey, 24, or 28.2
percent of the total, are large scale, 18 (21.2 percent of the total) are medium scale, and 43
(50.6 percent of the total) are small scale. Not surprisingly given the relatively recent expansion

Steinfeld|Lester|Cunningham Greener Plants, Grayer Skies? August 2008
11
of China’s energy sector, for over three-quarters of the plants surveyed, their first unit came on
line after 1980. For just under half of the sample, the first unit came on line during the 1980s
and 1990s. And for about a quarter of the sample, the first unit came on line after 2000. Many
of the plants surveyed have either built new units or expanded and upgraded older units in the
last five years. Of the 299 units surveyed, 71 came on line after 2001, and 14 older units
underwent upgrading during that period.
The MIT survey captured a significant fraction of the “known universe” of coal-fired
power plants in China, at least in terms of what Chinese governmental figures officially
recognize. Industrial boilers or other “within the fence” forms of power generation by major
industrial energy users are included neither in the MIT survey nor in official state statistics on
the electric power sector.4 The 257 units in the survey that are currently in operation represent
a total capacity of 27.8 GW, which amounts to 5 percent of all coal-fired generating capacity
and 4 percent of total generating capacity nationwide in China.
In terms of the number of generating units in the MIT sample versus the total number of
units nationally, the data issues become tricky. Chinese official figures for 2006 note the
existence of 2794 power generating units nationally in 2006. That would mean that the MIT
survey, extending into 2007 and encompassing 257 operating units, captured roughly 9 percent
of China’s total. But these standard official figures do not include small generators rated below
100 MW capacity. Table 2.2, based on a variety of Chinese governmental reports and our own
calculations, presents what we believe is a more accurate summation of the total number of
coal-fired generating units nationally. The table then compares the size distribution of units in
our sample against the size distribution of units nationally. As indicated by the table, the
distribution of scale among our survey respondents, at least in comparison to our
understanding of the known universe of Chinese coal-fired units, tended to skew slightly
toward the larger and smaller ends of the spectrum. In other words, if one were to extrapolate
4 Results of earlier MIT studies on the efficiency, emissions and health effects of small industrial boilers in China are discussed in: Fang, J., T. Zeng, L.I. Shen Yang, K.A. Oye, A.F. Sarofim and J.M. Beér, “Coal Utilization in Industrial Boilers in China – a Prospect for Mitigating CO2 Emissions”, Applied Energy, v 63, n 1, pp. 35-52, 1999., and Fang, J.,G.Li, K. Aunan, H.Vennemo, H.M.Seip,K.A.Oye and J.M.Beér, „A proposed industrial efficiency program in Shangxi:potential CO2-mitigation, health benefits and associated costs”, Applied Energy 71 (2002) pp 275-285

Steinfeld|Lester|Cunningham Greener Plants, Grayer Skies? August 2008
12
directly from the MIT sample, the universe would have fewer medium-sized plants, and more
small-scale and large-scale plants than is suggested by the official Chinese statistics.
This point is important because it leads to questions about what the total population of
Chinese power plants really looks like. As in so many aspects of China’s political economy,
data, while often available, tend to be inconsistently reported, incomplete, and at times
extremely confusing. This is true not just for publicly available data, but also for the internal
data upon which policy decisions are made. In energy, as in many other industrial sectors, the
information appears to become more confused as it is aggregated across broader domains of
the system. Producers at the micro-level report information selectively, if at all, and when these
reports are aggregated, data reported using entirely different terms, standards, or units not
infrequently are merged into single categories.
The way researchers in the central government’s State Electricity Regulatory Commission
(Dianjianhui or “SERC”) cope with this is not very different from the strategy employed by the
MIT research team. Both the MIT team and Chinese governmental researchers employ what
may be termed “purposive stratified sampling.” In the MIT case, our sample was stratified in
terms of power plant location (province) and size (generating capacity), yet it was “purposive”
in that we relied on the personal networks of our Chinese partners to identify plants willing to
participate. The reliance on network-based sampling was necessitated by the sensitivities in the
Chinese context surrounding energy sector performance, particularly at the individual plant
level. Put simply, most Chinese utility operators are disinclined to reveal the sorts of
information we were seeking.
Interestingly, they tend to be no more inclined to reveal such information to the Chinese
government than to independent academic researchers. In the Chinese government’s version
of purposive sampling, SERC and National Bureau of Statistics researchers survey the power
sector via partnerships with local energy research institutes that have preexisting relationships
with local power producers. Data from separate locally-based survey efforts are then
aggregated into what is purported to be a representative sample. This sample is then compared
to data submitted by those plants across the system that are willing to report. Of course, not all
plants cooperate with these data collection efforts. As one governmental researcher noted,
Steinfeld|Lester|Cunningham Greener Plants, Grayer Skies? August 2008
13
statisticians in the Chinese system end up trying to understand the whole system by “looking
through a straw.”5 Both the MIT survey and official state efforts end up relying on samples
that are at once small and driven by network relationships. In the MIT case, these tended to be
informal personal networks. In the government’s case, these tend to be the networks of the
particular local energy research institutes that partner with the center in data collection efforts.
It is fair to assume that in the government’s case, these networks lead to a sample skewed
toward coastal (where local energy institutes are usually found), larger, and more compliant (in
regulatory terms) firms. In the MIT case, the sample also is arguably skewed toward coastal
areas, especially Shandong province, but we seem to have picked up a greater proportion of
smaller and less environmentally compliant firms. It is conceivable that along these dimensions
of scale and compliance, the MIT sample presents a more accurate picture of the universe of
Chinese power producers.
III. Capacity: Chinese power sector scaling up over time
The conventional wisdom about China’s power sector often begins with the assertion that
the Chinese are building coal-fired power plants of inordinately small scale. Our survey results,
though, reveal a more complex reality. If one looks at the size of new generating units in our
sample added during various time periods in China (Chart 3.1), the story seems to be that
average size rises in the early 1990s, and then steadily declines (red bars in chart). For reference
purposes, U.S. size averages are also included in the chart (blue bars).
Chart 3.2 shows how the population of generating units in the MIT sample is distributed
across size categories (red bars). Chart 3.3 shows how the generating capacity in the sample is
distributed by unit size. For comparison purposes, the charts also show the corresponding unit
size distributions for all coal-fired generating units built in the United States over the past fifty
years
The charts indicate that while many small-scale units populate the system, the bulk of the
system’s total generating capacity is accounted for by large-scale units. Some of these units are
among the largest in the world. In short, the data suggest that China is both building small and
5 Authors’ interview, August 9, 2007.

Steinfeld|Lester|Cunningham Greener Plants, Grayer Skies? August 2008
14
building big, and that the broad range of unit sizes coming on line in China is characteristic of
the size range of units added in the U.S. over a similar period.
IV. Technology: The mix is becoming more advanced over time
The question of unit size is important for several reasons. Outside observers and Chinese
state regulators alike frequently use scale as a proxy for other features they are more interested
in, such as plant-level operational efficiency, technological sophistication, and environmental
“friendliness.” As will be discussed in this section, it is not just that Chinese power plants are
bigger – or at least more varied in size -- than many people recognize, but also that scale turns
out to be a poor proxy for the issues mentioned above. That is, size does not relate to
environmental impact or operational efficiency in a simple, linear way.6
In general, the relationship between generating unit size and environmental impact is
complicated by two sets of factors: the nature of the technology the unit uses to generate
electricity, and the manner by which that technology is operated by plant managers. In this
section we consider only the physical equipment found in Chinese power plants. We shall see
that even absent the operational issues, the connections between technology, scale, and
pollutant levels may still be very complicated, often involving a multitude of choices and
tradeoffs. These issues are not unique to China, but rather are encountered wherever coal-fired
power generation takes place.
Scale and Generating Efficiency
As a first step in assessing environmental impact, it is useful to consider the overall
efficiency with which a generating unit converts coal into electricity. The more efficient the
plant, the less fuel burned – and the fewer pollutants emitted – per unit of energy generated.
Also lessened are the amount of limestone consumed; the size of front-end and flue-gas
treatment equipment; water use; waste generated; and parasitic energy consumption.
6 Indeed, for fouling ash coals, boiler availability is actually better for smaller units because of the higher surface-to-volume ratio of the combustion chamber, resulting in more effective cooling of the coal ash entering the convective pass of the boiler. We are grateful to Janos Beer for pointing this out.

Steinfeld|Lester|Cunningham Greener Plants, Grayer Skies? August 2008
15
Particularly in countries like China where the energy system is expanding so rapidly and so
much new infrastructure is being built, the efficiency characteristics of the new technologies
being installed will likely prove one of the biggest determinants of long-term environmental
impact.
With respect to efficiency, our 2007 survey indicates some progress in China. In recent
years, a number of larger scale units have come on line, and those units are usually associated
with more efficient performance (higher steam conditions). These larger units employ
advanced pulverized coal combustion technologies, for which efficiency increases with scale.
An overall picture is presented in Charts 4.1 and 4.2.
Chart 4.1, presenting a current snapshot of all the generating units in the sample, illustrates
the frequency with which different steam conditions are encountered within the three size
categories of units: small, medium, and large. In each category, we see a variety of performance
levels representing a variety of different technologies currently employed in Chinese plants.
Smaller size units (below 50 MW) tend to operate at low temperatures and pressures, whereas
large-scale systems (above 300 MW) tend to be associated with higher temperature, higher
pressure conditions. It should be noted that our sample includes several supercritical plants,
i.e., those with steam conditions at or above 22.19 Mpa/540C. As of 2007 when the survey
was conducted, China had 22 supercritical units, several of which were captured in the survey,
and the first of which came on line in the early 1990s.7 A number of ultra supercritical plants
are under construction in China and are soon slated to come on line.
Chart 4.2 illustrates how steam conditions in Chinese coal plants have evolved over time.
Note that the chart illustrates the frequency of occurrence of units of different performance
type, but says nothing about the scale of those units. Also, the temporal categories are not of
equal duration. The middle period covers 17 years, while the most recent period covers 7
years. The logic behind this presentation is that the power sector experienced very little growth
before 1985, underwent an important growth phase between 1985 and 2001, and then entered
an extremely rapid growth phase – doubling its total capacity, in fact – between 2002 and
2007. What the chart suggests is that across its two major post-1985 growth phases, China’s
7 “Power Becomes Supercritical,” China Daily, Sept. 7, 2007.

Steinfeld|Lester|Cunningham Greener Plants, Grayer Skies? August 2008
16
power sector has employed a range of technologies with a range of steam conditions. Over
time, though, the system has been migrating away from low pressure, low temperature units,
toward higher temperature, higher pressure units. Moreover, these higher performance units
tend to be of larger scale. Chart 4.3 shows how the total generating capacity represented in the
sample is distributed across different performance conditions.
Boiler Technologies and Environmental Impact
Long-term environmental impact is influenced by the choice of technology, as well as scale
and efficiency.
In China today, coal-fired units employ one of three main classes of combustion systems:
chain grate stoker boilers, pulverized coal combustion (PCC), and fluidized bed combustion
(FBC). Chart 4.4 shows how these technologies are distributed across different size categories
of generating units. Chart 4.5 shows how the distribution of technologies has evolved over
time.
As Chart 4.6 shows, pulverized coal combustion (PCC) accounts for the vast bulk of coal-
fired power generation in China. Within the MIT survey, of the 32.68 GW of total generating
capacity contained in the sample, 22.04 GW (67 percent) use PCC, 2.90 GW (8 percent) use
FBC, and 0.534 (2 percent) use chain grate stokers. An additional 5 percent of total capacity
was fueled by coal gangue and oil, and plants representing 14.5 percent of total capacity did
not answer the question.
As indicated by Chart 4.4, almost all large scale units in China use PCC, as do many
medium and even small-scale units. Chain grate stokers are found almost exclusively in small-
scale units. Over time, as indicated by Chart 4.5, chain grate stokers have been phased out and
replaced by FBC technologies at the lower end of the scale spectrum. New units employing
PCC are fewer in number but larger in size. The basic picture then is of a system in which
PCC dominates the higher end of the scale spectrum, and FBC has replaced chain grate stoker
technologies at the lower end. FBC has also made inroads against PCC in medium-sized
plants.

Steinfeld|Lester|Cunningham Greener Plants, Grayer Skies? August 2008
17
What does this all signify? Of the three technology types noted above, chain grate stokers
are the oldest and least advanced, dating back to mid-19th century. In such systems, raw or
semi-processed coal chunks, often several inches in diameter, are fed into the combustor on a
moving chain grate, and burned in place on that conveyor. In more modern pulverized coal
combustion, rough coal -- rather than being burned directly -- is ground into a fine powder.
The coal powder is then combined with heated air, and injected into the combustion chamber
as a cloud of pulverized particles. The particles then combust rapidly at high temperature, in
some respects more like a gas or atomized liquid than a solid fuel.
Compared with chain grate stokers, PCC technology allows for far greater fuel and
operational efficiencies. So, as the Chinese system has shifted away from chain grate stokers
towards larger scale PCC, the average generating efficiency has risen, and environmental gains
have also been realized as a result.
PCC produces a series of atmospheric pollutants: sulfur oxides (SOx) and nitrogen oxides
(NOx) associated with acid rain, carbon dioxide (CO2) associated with global warming, and
particulates and trace metals, including mercury, associated with human health issues. In terms
of CO2, it is only recently that people in advanced industrial nations, let alone China, have
begun to understand this as an environmental threat. Solutions involving carbon capture and
sequestration have yet to be demonstrated at scale. Mercury emissions from coal-fired power
plants have also eluded effective remediation in many parts of the world, including the United
States. With respect to SOx and NOx, on the other hand, a variety of proven cleanup
technologies are now available to power producers.
Compared with PCC, fluidized bed combustion technology (FBC) offers both advantages
and disadvantages. FBC works by feeding minimally processed solid fuel into a combustor
which is comprised of a bed of inert particles through which gas is blown upward.8 The fuel is
then suspended in an airborne and turbulent state, making it behave in a fashion somewhat
akin to a bubbling liquid.9 This allows for efficient burning and heat transfer – on par with
8 World Coal Institute, “Fluidised Bed Combustion,” (http://www.worldcoal.org/pages/content/index.asp?PageID=420). 9 United States Department of Energy, “Fluidized Bed Technology – An Overview,”

Steinfeld|Lester|Cunningham Greener Plants, Grayer Skies? August 2008
18
many PCC systems – but at substantially lower temperatures. The SO2 that is produced as a
by-product of combustion is mostly neutralized by the limestone in the fluidized bed (and of
which it is mostly comprised). This may obviate the need for expensive stack gas scrubbers or
other costly-to-operate post-combustion cleanup technologies (though to achieve very low
SOx emissions in the absence of flue-gas cleanup requires the use of low-sulfur coal.). Because
combustion takes place at lower temperatures than in PCC, the production of NOx is
somewhat reduced. On the other hand, nitrous oxide (N2O), a potent greenhouse gas, is
produced at the lower temperatures characteristic of FBC, and this adds a significant
increment to overall GHG emissions relative to PCC.
It should be noted that in China today there is an intensifying debate regarding whether
FBC technology should be encouraged by state policy. Some experts on the technical side
argue that under strict emissions standards -- levels of sulfur dioxide stack gas emission
concentrations below 200 mg/m3 (in the range of current US and EU standards, but lower
than current Chinese levels) -- absorption of SOx emissions in the fluidized bed would not be
adequate except for very low-sulfur coal. To meet such standards, FBC units would have to
add on post-combustion flue-gas desulfurization systems. Should Chinese environmental
regulations strengthen in the near term, it is argued, this retrofitting cost could become
considerable for FBC plants.12
Chinese power producers are choosing FBC systems for many of the smaller scale units
being built today. This choice may have less to do with FBC’s environmental qualities than its
flexibilities on the fuel side. FBC systems can burn virtually any combustible fuel, from the full
gamut of coal types to coal mining waste products and municipal refuse. This is an important
feature in China, where power plants often face challenges in controlling fuel type and quality.
Regardless of the reasons driving it, the proliferation of FBC systems means that at the lower
end of the size spectrum, Chinese power plants are accessing technologies considered by many
(http://www.fossil.energy.gov/programs/powersystems/combustion/fluidizedbed_overview.html). See also, IEA Clean Coal Centre, “Clean Coal Technologies – Fluidised Bed Combustion,” (http://www.iea-coal.org.uk/site/ieacoal_old/clean-coal-technologies-pages/clean-coal-technologies-fluidised-bed-combustion-fbc?). 12 Authors’ interviews, July, 2008.
Steinfeld|Lester|Cunningham Greener Plants, Grayer Skies? August 2008
19
observers to be state-of-the-art for controlling several key pollutants. Basically, infrastructure is
being built at the lower end of the scale spectrum that, if operated appropriately, can provide
real leverage over the SOx and NOx problems. At the very least, this raises questions about
two of the simplifying assumptions often used to analyze China’s power sector: the idea that
bigger is better, and the notion that China has too many small-scale plants.
Prevalence of Stack Gas Scrubbers
Although technological upgrades may be obviating the need for post-combustion cleanup
systems in smaller power plants, the bulk of China’s electric power infrastructure burns
pulverized coal. To address SOx and NOx emissions, pulverized coal units have to employ
post-combustion cleanup systems. Some sulfur can also be removed prior to combustion
through coal washing. One of the goals of the MIT survey was to gain insight into the
prevalence of at least one variety of such technologies – flue gas desulfurization (FGD)
systems – across China’s power sector. Governmental regulations now require most new
plants to install and operate such systems, but observers have long questioned the extent of
regulatory enforcement in this area. MIT’s survey results speak to this issue, but some caveats
are in order regarding the data.
For the data to be most useful, they would need to be reported at the generating unit,
rather than plant level. A single plant, after all, may operate several different units employing
several different kinds of technologies. Some of the units, if employing boiler technologies like
FBC, would not necessarily need post-combustion cleanup systems. Others that would require
FGD, such as pulverized coal systems, might simply not have installed them, thus falling out
of compliance with state regulations. Unfortunately, our data were reported only at the plant
level. Thus we can only say whether a given plant has an FGD system installed on at least one
of its generating units. We can present a rough sense of FGD penetration in the industry, but
not the kind of fine-grained, unit-level analysis contained in other parts of the study.
As indicated in Chart 4.7, 82 of the 85 power plants in our sample provided information
about FGD. Of those 82 plants, 67 reported purchasing and installing FGD systems on at
least one of their generating units. It could be the case, of course, that FGD has been installed

Steinfeld|Lester|Cunningham Greener Plants, Grayer Skies? August 2008
20
on only one of the units of a multiple unit power plant. It could also be the case that some
plants operate only FBC boilers, which would not likely utilize FGD for SOx cleanup. Within
the group of 67 plants with at least one FGD-equipped unit, fifty plants reported also having
continuous emissions monitoring systems, and 17 plants reported having systems limited to
periodic testing. The presence of continuous emissions monitoring is important because such
systems provide real time, verifiable data -- presumably also accessible by third party observers
– regarding the environmental performance of the generating unit. Again, through a
combination of punitive regulations and positive incentive programs, the Chinese
government’s State Environmental Protection Administration (now Ministry for
Environmental Protection), often with the support of a variety of NGOs and international
agencies, has been promoting the spread of such monitoring systems.
FGD systems represent a fairly significant capital expenditure for power plants. That
roughly 80 percent of the plants surveyed reported installing at least one such system on a
generating unit suggests that environmental officials are achieving some regulatory traction.
Recent national figures reveal a similarly encouraging story. By the end of 2007, according to
some Chinese estimates, over 270 GW of generating capacity had been installed with some
form of FGD equipment.13 In particular, state regulations demand that all new power plants as
of January 1, 2004, must be equipped with FGD systems, and a series of programs have been
initiated to insure retrofitting of FGD systems on older plants by the end of the decade.14 The
rules are now on the books, and they seem to be having some effect, but as will be discussed
later, regulatory traction is partial at best. The shortfalls appear particularly serious on the
operational side of power plants. That is, the systems are increasingly in place, but whether
they are actually operated is another question.
The broader message of this section is that many Chinese power plants are investing in a
range of modern systems. The phenomenon is clearest with regard to coal combustion
technologies across a variety of scales and steam conditions. Modern technology acquisition is
also apparent to some degree on the environmental cleanup side. The bottom line is that it is
13 China Electricity Council, “Guojia Fagaiwei Fabu 2007 Nian Huodianchang Yanqi Tuoliu Chanye Xinxi,” March 19, 2008 (http://www.cec.org.cn/news/deptnews.asp?id=2871). 14 Andrew Minchener, “Coal Supply Challenges for China, IEA Clean Coal Centre, 2007, p. 16.
Steinfeld|Lester|Cunningham Greener Plants, Grayer Skies? August 2008
21
not generally correct to say that China today is building a second-rate, technologically obsolete
electric power infrastructure.
V. Coal Supply: The Power Plant Perspective on Fuel Sourcing and Pricing
Technology and capital equipment constitute one major piece of the puzzle for how power
systems impact the environment. Power plant operation constitutes the other. Coal access,
pricing, and quality are obviously central to a host of operational issues. Indeed, because fuel
costs are the single largest operating expense of a coal-fired power plant, they can under
certain circumstances also exert major influence on long-term technology acquisition and
investment decisions.
State and Market Channels of Allocation
Over the last five to six years, Chinese power plants have faced rapidly changing
conditions for fuel supply. Coal is generally available through two main channels: a national
allocation system managed by the state, and an ad hoc system of direct, market-like
transactions between mines and power plants. Until at least 2002, the state managed system,
involving annual delivery contracts at state-set prices, accounted for the bulk of coal delivered
to power plants. Since 2002, when coal demand began to surge in China, the market channel
has become far more important. Much of the new coal demand in China has been met by
smaller, locally-owned mines, which were never part of the state coal allocation system.
Moreover, the larger, more state-oriented mines anchoring the state allocation system proved
increasingly unwilling to move output through state channels in such a tight market. With
demand soaring and no risk of being saddled with excess inventory, why sell at a low state-set
price when one could instead contract directly with major consumers at a higher market price?
The upshot in recent years has been two-fold. First, market transactions – direct interactions
between producers and consumers at variable prices – have come to account for an increasing
share of all coal delivered in China. Second and concomitantly, Chinese domestic coal prices
have been rising, effectively converging toward world market levels.
Steinfeld|Lester|Cunningham Greener Plants, Grayer Skies? August 2008
22
Just over half the plants in the survey sample (44 of 85 plants) responded to questions
about coal allocation and pricing. Of the plants that responded, 55 percent (24 plants) reported
that none of their fuel supply was subsidized, while 45 percent (20 plants) reported that at least
some fraction of their supply came through state channels at subsidized prices. Interestingly, as
indicated by Chart 5.1, only six plants reported receiving all of their fuel through subsidized
channels. For many of the other plants accessing subsidized coal, these lower-priced fuels
accounted for only a fraction – and sometimes a very small fraction – of the plant’s total fuel
supply.
For coal coming in through market channels, one-year contracts between mine and power
plant appear to be the norm, but spot market transactions also take place. As indicated by
Chart 5.2, of the 25 plants that provided contracting information, 17 (68 percent) reported the
use of one-year contracts. Four plants reported contracts of less than one year in duration, and
three plants reported that they were accessing fuel via “temporary” contracts – that is, on spot
markets.
In visits to power plants and mines in the past year, members of our team witnessed the
operation of these spot markets. Under the strained supply conditions of the present,
consumers entering these markets have to take what coal they can get, often without any clear
information or assurances about the type and quality of the coal being offered. If the
consumer delays by taking time to test the coal, the mine will likely just sell to someone else in
the interim.
Pricing in the Chinese Coal Market
Power plants are essentially price takers in what amounts to a complex and chaotic seller’s
market for coal. As illustrated by Chart 5.3, plants across the sample reported a wide range of
maximum prices for delivered coal paid in 2007. Spot contracts (red bars) can be found across
the price spectrum running from roughly 250 RMB per ton to just over 600 RMB per ton.
For comparison purposes, the average price for delivered coal paid by U.S. power plants is
included at the far right of the chart (black bar).

Steinfeld|Lester|Cunningham Greener Plants, Grayer Skies? August 2008
23
In addition to coal prices varying across plants, individual plants themselves source coal at
multiple price points through the year. The survey responses permit us to measure that
differential for each plant in the sample. Chart 5.4 categorizes these differentials according to
the magnitude of the price range, and then shows how many plants in the sample fall into each
category. Chart 5.5 shows similar information, but controls for the size of the plant, effectively
showing how much generating capacity of the sample’s total falls into each of the price
differential categories. What is clear is that a substantial portion of plants, particularly if one
controls for size, are experiencing considerable price differentials, ranging anywhere from
RMB 200 to RMB 349 per ton of coal.
A possible explanation for these price differentials between and within plants is that they
simply reflect the different types and qualities of coal available on the market. This may be
true, but it is also true that coal quality standards are loosely specified and poorly enforced in
China. Thus, information asymmetries exist between coal suppliers and buyers in this market.
Prices technically may differ across coal types, but buyers are often either uncertain of what
they are getting or facing situations of scarcity in which they have to take whatever they can
get, regardless of preferred type. Hence, we witness the situation of single firms paying a
variety of prices – i.e., experiencing substantial price volatility -- in their coal sourcing
operations. Given the volatility of the current coal market and the fact that fuel costs are the
single greatest operational expense in power generation, plants are disinclined to maintain large
coal inventories. Furthermore, given that electricity prices are set by the state and do not move
fluidly upward with rising coal prices, plants have to find ways to reduce operational costs in
the face of escalating fuel expenses. One response is to purchase cheaper, lower grade coal,
particularly on the margins to fill out narrow inventories. Mines too may substitute lower grade
coal to round out a shipment of ostensibly higher-grade material.
In either case, plants end up burning a wide variety of coal types, sometimes to the
detriment of their installed technology. This is a particularly serious problem for firms
employing more advanced PCC and FGD technologies, systems that have low tolerances for
fluctuations in coal ash and sulfur content. Here, we can see how rising coal prices can limit
FGD use in two ways. First, with rising fuel expenses, plants may be inclined to cut costs by
simply not operating their FGD systems. Second, rising fuel expenses encourage plants to
Steinfeld|Lester|Cunningham Greener Plants, Grayer Skies? August 2008
24
source lower quality, cheaper coal, just as soaring demand encourages mines to round out
shipments with lower quality material. As this substandard coal runs through the plant that
actually is running FGD, the cleanup system gets overtaxed and degraded.
Indeed, these factors help to explain why fluidized bed combustion systems have an
important market in China. Such systems can burn virtually any type of coal with no ill effect.
It is not surprising therefore that so many of these systems are being installed in smaller scale
units, and that the Chinese state has been encouraging research into FBC applications at the
high end of the size spectrum as well.
Coal Transport
Because the prices reported in the survey are for delivered coal, some of the price variation
experienced across firms may be due to transport costs. Nonetheless, the survey uncovered a
somewhat different picture of coal market geography from what the conventional wisdom
usually asserts. The conventional view is that coal in China moves long distances, via rail, from
major suppliers – mines in Central and Northwest China – to major consumers, the power
plants along the East and Southeast Coast. The picture emerging from the survey, however, is
that a substantial amount of steam coal – coal burned by power plants – is still sourced locally,
trucked in from relatively nearby mines. This result was found despite the overrepresentation
in the sample of power plants in Shandong, a province that is not a major mining center. In
contrast to issues surrounding pricing, most of the plants in the sample – 79 of 85 -- were able
and willing to provide information about fuel transport. As illustrated by Chart 5.6, 28 plants
(37 percent of all that responded), reported that all of their fuel came in via truck. Slightly
fewer plants, 23, reported that all their fuel arrived via train. The remainder utilized a mix of
train and truck, as well as oceangoing collier barge.
Three interesting points emerge from these data. First, as noted previously, a considerable
portion of power plant fuel seems to be sourced locally, thus reinforcing the idea that at least
in the current market, plants on the margin take what they can get, as opposed to relying
exclusively on the larger state mines and higher grade fuels found in the Northwest. Second,
while it may be true that the Chinese national railway system is overburdened by long-distance

Steinfeld|Lester|Cunningham Greener Plants, Grayer Skies? August 2008
25
coal transport, the road system is also playing a key role in fuel transport. That may have
important ramifications for everything from diesel markets to environmental controls for
vehicles. Third, there is an environmental ramification. That so much coal is being sourced
locally suggests that Chinese power plants burn very little washed coal. It has long been
asserted in the literature that Chinese power plants do not wash their coal, a practice that
matters since washing is a primary means of lowering sulfur and ash levels prior to
combustion. The MIT survey confirmed that plants themselves are certainly not washing --
none of the plants in the sample reported doing so. However, in recent years, the Chinese
central government, as part of its environmental agenda, has pushed major investments in
steam coal washing facilities in large state-owned mines, particularly in the Northwest.15 In
addition to environmental concerns, the government policy was motivated by the desire to
lessen the amount of mineral material that would have to be shipped along the national railway
system. For the large mines themselves, washing facilities may be appealing to the degree that
they increase the attractiveness of China’s steam coal in global export markets. The key point,
though, is that smaller, local coal mines have neither the resources nor incentive to invest in
washing facilities. That local mines are supplying such a large portion of power plant fuel
suggests that while some washed coal may be reaching Chinese power plants, much of the coal
burned is unwashed.
Coal Quality: Sulfur Content
Coal on the Chinese market comes in a variety of types and quality grades. Coal quality in
general is a complicated issue involving multiple dimensions. The MIT survey collected data
along several of these dimensions, but for the sake of brevity, this section will focus on sulfur
content, an important parameter both for plant-level pollutant emissions and for the integrity
of sensitive boiler and cleanup systems.
Roughly 90 percent of all coal currently mined in China falls into the low to medium sulfur
content classification (sulfur concentrations at or below 2 percent).16 As indicated by Chart 5.7,
most of the plants in the survey sample reported using coal at or below the 2 percent level. Six
15 Minchener, p. 23. 16 Minchener, p. 11.

Steinfeld|Lester|Cunningham Greener Plants, Grayer Skies? August 2008
26
plants of the 80 that responded in total (8 percent) reported using coal of considerably higher
sulfur content, one as high as seven percent. Nonetheless, the general point is that most
Chinese power plants, at least in self-reported data, seem to be accessing low-sulfur coal.
Indeed, some recent observers have commented that their tendency to do so – basically in
response to governmental pressures on the environmental front – has squeezed out other non-
power-related industrial consumers of coal from the low-sulfur market. In theory, at least, this
could be a worst-of-all-worlds policy outcome. Power plants, in part because they are better
monitored by the state, and in part because they seek to lower operating costs by avoiding the
overtaxing of their FGD systems, conceivably are willing to keep paying slightly higher prices
for low-sulfur coal. Meanwhile, other industrial consumers, poorly monitored by the state and
devoid of any cleanup systems, migrate over to the higher sulfur content end of the coal
market.
The broader point is that while plants are burning a variety of coal types, there appears to
be enough regulatory traction in the system to push them under most conditions to continue
sourcing low-sulfur coal. Of course, another possible explanation is that plants are
misreporting the quality of their fuel. We return to this subject below.
The Cross-Cutting Effects of Coal Marketization
For Chinese power plants, the marketization of coal creates a jumbled mix of new
incentives, many of which are cross-cutting and difficult to untangle. This is an important
subject requiring more research; however, we can already speculate about some of the
incentive effects, several of which are borne out in the survey results.
First, the price increases and volatility associated with marketization make understandable
the finding that many plants have invested in advanced coal combustion technologies. More
efficient combustion translates into better fuel economy and lower operating costs over the
life of the plant, a good way over the long run to cope with rising fuel expenses.
Second, to the extent they have been forced through regulatory pressure to install post-
combustion cleanup systems, plants may attempt to counter rising fuel costs by operating

Steinfeld|Lester|Cunningham Greener Plants, Grayer Skies? August 2008
27
those cleanup systems less frequently, if at all. Flue-gas desulfurization systems are very
expensive to operate. Under certain conditions they may account for upwards of a third of a
power plant’s operating expenses.
Third, particularly given the low fuel inventories maintained in a volatile price
environment, power plants face pressures to access coal from a variety of different suppliers at
a variety of different price points. As the number of suppliers increases – particularly when
smaller, more locally-controlled mines get involved – coal quality becomes less certain. It is
highly probable that many power producers today are running a wide variety of coal types
through their boilers, whether knowingly or not. As noted previously, this can have not only
environmental ramifications, but also consequences for the integrity of the physical plant.
Fourth, power plants, in an effort to reduce overall costs by saving on transport, may
increasingly be sourcing coal from local suppliers. Again, this can lead to a fuel supply of
lower, or at least more variable quality actually reaching the power plant.
In the end, what does this all mean for the environment? The development of markets for
coal – like the development of markets for any commodity – solves certain problems and
creates others. The unleashing of fuel prices to reflect real market demand appears to be
having a positive impact on long-term technology choice and infrastructure quality. Yet, as will
be discussed in the following section, the impact on plant-level environmental practice appears
far more ambiguous, and in some cases, even negative.
VI. Power Plant Environmental Performance
Power plant environmental performance is obviously a multi-dimensional issue involving a
number of pollutants. Measuring the quantity of emissions of each type of pollutant is
extremely challenging. Determining whether emissions levels for a given plant are within
regulatory limits is also challenging, given all the regulatory changes that have occurred in
China in recent years. The rules are complex, and have changed repeatedly, thus affecting in all
sorts of ways the manner and accuracy by which plants report emissions data. As noted
previously, continuous emissions monitoring systems have become more prevalent in China,

Steinfeld|Lester|Cunningham Greener Plants, Grayer Skies? August 2008
28
but even so, available emissions data are frequently dismissed as unreliable by industry insiders
and government regulators alike. That said, the MIT survey did collect information – self-
reported by power plant respondents – on environmental performance. With all appropriate
caveats in mind, we present results for one of the pollutants most emphasized in recent
regulatory efforts, sulfur dioxide.
Forty-seven of 85 plants in the sample provided information about SO2 emissions, as
shown in Chart 6.1. These data refer to average annual pollutant concentrations in the
smokestack gas. As with the figures presented earlier on FGD installation, the data here were
unfortunately reported at the plant rather than generating unit level. Emissions concentrations
depend upon the particular boiler and cleanup technologies in use, as well as the manner by
which those technologies are operated. These are all factors pertinent to the unit rather than
the plant. Nonetheless, the plant-level data that we have can provide a general sense of the
overall emissions story.
To clarify how these levels relate to regulatory compliance, a word is in order about the
Chinese government’s current emissions standards for SO2. The standards, adopted in 2003,
delineate a range of emissions limits depending primarily on power plant age.17 For the first
category of plants -- plants that came on-line prior to January 1, 1997 – average annual stack
SO2 emissions are currently not permitted to exceed 2100 mg/m3. On January 1, 2010, the
limit will drop to 1200 mg/m3. For the second category of plants – those that came on line
from the beginning of 1997 through the end of 2003 -- the limits are 2100 mg/m3 through the
end of 2009, and then 400 mg/m3 from there on out. Exempted from this category are plants
whose environmental impact assessment report was approved prior to the promulgation of the
rules in 2003. Also exempted is a particular set of mine-mouth power plants in Western China
– located outside the two special restriction zones for acid rain control – that burn low-sulfur
(<0.5%) coal. Their emissions limits are set at 1200 mg/m3, a level that will be maintained
after 2009. A third category of plants – those that have come on line since the beginning of
2004 – must abide by limits of 400 mg/m3, a restriction set to continue indefinitely.
Exceptions exist in this category as well, however. Certain power plants burning coal waste are
17 Zhonghua Renmin Gongheguo Guojia Biaojun, GB 13223-2003, “Emission Standard of Air Pollutants for Thermal Power Plants,” 12/30/2003.

Steinfeld|Lester|Cunningham Greener Plants, Grayer Skies? August 2008
29
permitted to emit up to 800 mg/m3. Also, like their older counterparts, new mine-mouth
plants in Western China are also permitted to emit up to 1200 mg/m3.
Chart 6.1 codes the respondent plants by color according to the regulatory category in
which they belong. Blue pertains to plants that came on line prior to 1997, yellow to plants
that came on line between 1997 and 2003, and green to plants that came on line after 2003.
We are fairly certain that none of the exceptions noted in the regulations apply to any of the
Category Two and Category Three plants. We cannot say the same for the older Category One
plants. We have left unclassified those plants whose regulatory category is indeterminate.
These, colored red in the chart, are primarily older plants that happen to have new units that
came on-line after 2003. Presumably for such plants, some of the units fall under one
regulatory category while other units fall under another. The chart also demarcates the legal
emissions limits for each category. For comparative reference purposes, emissions limits in the
United States and European Union are included as well.
Several things are noteworthy about this chart. First, relative to EU and US standards, SO2
emissions levels in Chinese plants appear to be very high, far beyond the compliance limits
that exist outside China. Second, a number of plants in the sample – even with self-reported
data – appear to be out of compliance with China’s own domestic limits. At least one of the
pre-1997 plants and three of the unclassified plants reported emissions beyond China’s legal
limits. Perhaps most interesting, four out of the six plants falling under the strictest regulatory
category reported non-compliant emissions levels. These are China’s newest plants, required
by law to be equipped with environmental cleanup systems, and held to emissions limits that
while relatively lax by European or American standards are strict relative to what older plants
in China face. Most of these new plants, however, seem unable to meet the standards, often by
a large margin.
In some respects this is an extraordinary finding, not least because it is based on data
reported by plants themselves. It is well known that aggregate Chinese emissions have
consistently exceeded, often by a large margin, the annual SO2 emissions targets established by
the government. The data presented in Chart 6.1 suggest why, in part. It is also usually
assumed that Chinese power plants are massive emitters of SO2. This too is confirmed by the
Steinfeld|Lester|Cunningham Greener Plants, Grayer Skies? August 2008
30
survey results. Yet what is striking is the contrast between these bleak performance data and
the relatively positive data about technology modernization presented earlier. The basic story
seems to be that on the investment side, Chinese power plants are pumping money into
massive technology modernization and upgrading efforts. They are in many cases installing
state-of-the-art equipment. This is even true to some extent on the environmental cleanup
side. Yet they do not appear to be operating that equipment. The FGD systems are going in,
but they are not, it would appear, being turned on. An alternative possibility, as indicated
earlier, is that plants may be burning sub-standard coal types that are overwhelming these
systems even when they are operated. In either case, the basic story is that while market
pressures seem to be driving substantial upgrading on the combustion technology side, and
regulatory pressures seem to be bringing about widespread installation of environmental
cleanup systems, neither of these forces appears to be driving sound environmental practice at
the plant level. Indeed, day-to-day environmental performance appears grim.
VII. Conclusion
This study has attempted to add systematic data to an increasingly public, vociferous, and
global debate about China’s energy future. Many people now understand that China’s energy
sector build-out has global ramifications, involving long term environmental impacts,
geopolitics, worldwide resource availability, and global commodity pricing. Many
constituencies around the world are now voicing opinions about that build-out. These
opinions often inform policy decisions in other countries. This is unquestionably the case in
the United States as the American government -- and American society more broadly --
consider how, whether, and how aggressively to address global warming. Our aim in this study
has been to inject real data into this growing public debate. We have sought to test the
emergent conventional wisdom about China against empirical findings from the field.
The data we have collected are by no means foolproof or complete. The findings
presented in this paper represent the first step in what we expect to be an ongoing, long-term
program of data collection and analysis. Moreover, in this overview paper we have been able
to present only a fraction of our survey results, leaving out, for example, important findings
about ownership diversification and investment sources in China’s energy sector. We also
Steinfeld|Lester|Cunningham Greener Plants, Grayer Skies? August 2008
31
acknowledge that our tentative conclusions are based on a relatively small sample of power
plants. At the same time, it must be emphasized that supposedly more comprehensive official
analyses of the “entire” sector are based on samples of similar size. In this initial survey effort,
we have effectively duplicated the scale and scope of official data collection efforts. It is
interesting to note how even in the most straightforward areas – such as in the size
distribution of Chinese power plants – our results differ from official estimates. We also note
the differences in more sensitive areas such as environmental compliance.
What we have found, perhaps not surprisingly, is that Chinese coal-fired power generation
– the heart of the nation’s energy sector – is far more complex than most observers
understand, and more complex than we ourselves anticipated when embarking on this study.
Several changes – almost revolutions in some cases – are occurring simultaneously. New
energy infrastructure is being added at a torrid rate. Fuel allocation is shifting rapidly toward a
market footing, with prices responding accordingly, if chaotically. Myriad new transactions are
taking place between coal suppliers and consumers, often in the context of imperfect
information and ambiguous product standards. Power plants, like mines, have increasingly
come to be treated as commercial entities, autonomously pursuing and financing a range of
long-term investment and day-to-day operational strategies. Meanwhile, as the central state has
increasingly removed itself from direct control over production – whether for mines or power
plants – it has become ever more focused on regulation, particularly in new areas like
environmental management. As a result, all manner of new rules have been put into play, even
as the state scrambles to build the capacity needed to ensure that those rules get enforced.
Given the scope of change in the contemporary energy sector, regulators are scrambling
simply to figure out what is unfolding on the ground.
Meanwhile, Chinese policy makers, like many concerned outsiders, are looking for points
of leverage to achieve desired change. The MIT study, focusing on levers for influencing near-
and long-term environmental practice, demonstrated the complex combination of positive and
negative outcomes produced by reform and marketization. On the environmental front,
policies designed to achieve change in one dimension frequently lead to undesired changes in
others. Also worth remembering is that Chinese policy makers are seeking levers over a far
broader array of issues, including energy security concerns, political concerns, national

Steinfeld|Lester|Cunningham Greener Plants, Grayer Skies? August 2008
32
economic competitiveness concerns, economic growth and stability concerns. Most of these
involve the energy sector, and many operate in contradictory directions. Energy security
concerns, for example, push China toward greater use of coal, but concerns – and doubts –
about the magnitude and quality of national coal reserves push toward more efficient use of
coal. Efficiency concerns motivate national efforts at technological upgrading, as well as
efforts to marketize fuel supply. Yet, the price hikes associated with marketization in some
respects discourage sustainable environmental practice at the plant level, thus countering
another major concern of policy makers, clean air and a sound ecosystem. Environmental
demands emerging from across society – demands that of course have political implications --
may encourage switching to alternative fuels such as gas, but those fuels must be imported
from abroad, thus exacerbating energy security concerns. Meanwhile, Chinese policy makers
seek to ensure and expand the flow of energy to a citizenry that by global standards – at least
in per capita terms – consumes at very low levels. China may conserve, but it is inconceivable
that in overall consumption terms it will solve its own – or the world’s – energy problems by
scaling back. Chinese energy consumption, and by extension, Chinese coal-fired electric power
generation will continue to expand rapidly.
From this perspective, the issues explored in MIT’s China Energy Survey will become only
more consequential over time. Our study suggest grounds for hope in certain areas – such as
long-term infrastructural choice – and pessimism in others, such as present-day power plant
environmental practice. More than anything else, the study, in touching upon just a fraction of
the complex reality on the ground, provides an indication of how far we collectively – whether
in our capacity as observers, regulators, overseas governmental counterparts, or global
commercial players – still have to go in developing a solid understanding of China’s energy
sector and how it might be influenced to move in a preferred direction.
Building upon the survey data presented in this initial descriptive paper, follow-on papers
will explore a range of questions about causation. How are technology choice and day-to-day
operational practice influenced by ownership patterns? How is ownership related to modes of
finance? How does financing, in turn, affect technology choice and operations? How does the
presence of foreign commercial suppliers and foreign technologies influence power plant
performance and strategy? What factors account for environmental compliance in some plants

Steinfeld|Lester|Cunningham Greener Plants, Grayer Skies? August 2008
33
rather than others? How exactly does fuel price influence plant operations? This paper has
provided an initial descriptive overview. Deeper, more focused analyses will follow.

Steinfeld|Lester|Cunningham Greener Plants, Grayer Skies? August 2008
34
Charts and Tables
Table 2.1 Distribution of Power Plants by Province in 2007 MIT China Energy Survey
Province # of Plants Shandong 33 Heilongjiang 12 Jiangsu 7 Hebei 8 Henan 4 Hubei 4 Anhui 3 Guangdong 3 Inner Mongolia 3 Tianjin 2 Shaanxi 2 Yunnan 2 Shanxi 1 Beijing 1 Total 85
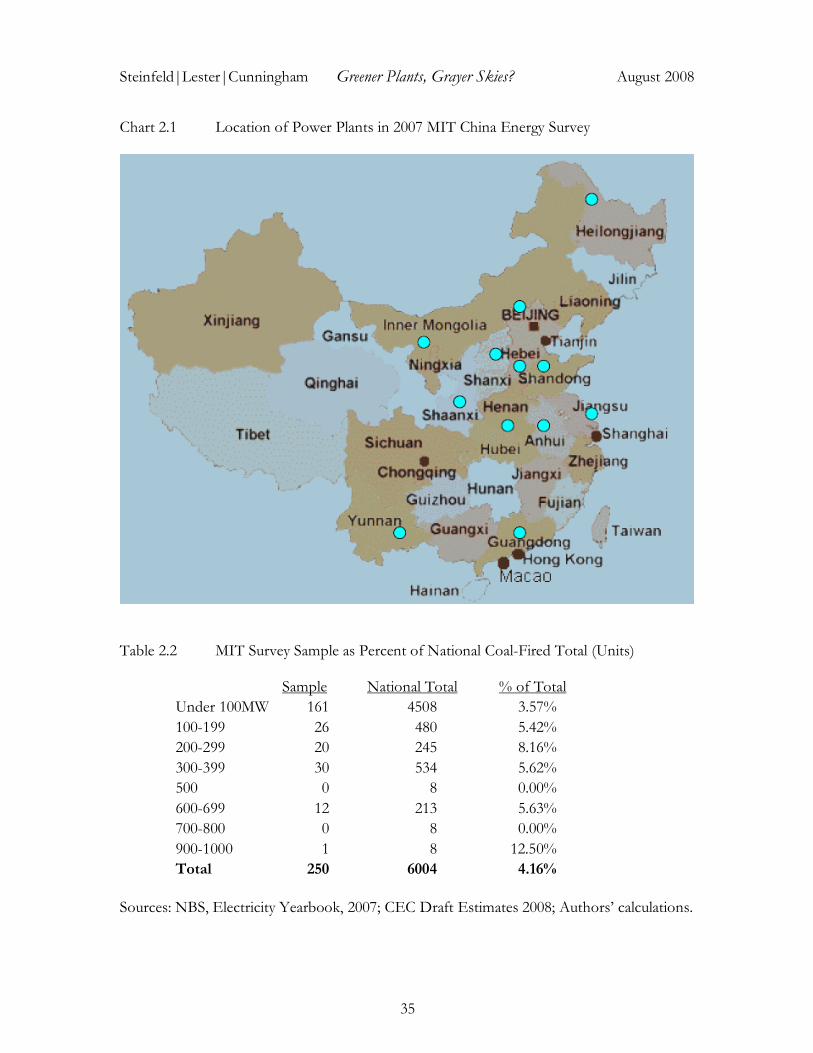
Steinfeld|Lester|Cunningham Greener Plants, Grayer Skies? August 2008
35
Chart 2.1 Location of Power Plants in 2007 MIT China Energy Survey
Table 2.2 MIT Survey Sample as Percent of National Coal-Fired Total (Units)
Sample National Total % of Total Under 100MW 161 4508 3.57% 100-199 26 480 5.42% 200-299 20 245 8.16% 300-399 30 534 5.62% 500 0 8 0.00% 600-699 12 213 5.63% 700-800 0 8 0.00% 900-1000 1 8 12.50% Total 250 6004 4.16%
Sources: NBS, Electricity Yearbook, 2007; CEC Draft Estimates 2008; Authors’ calculations.

Steinfeld|Lester|Cunningham Greener Plants, Grayer Skies? August 2008
36
Chart 3.1 Average Size of Generating Units Added By Period
0
0.02
0.04
0.06
0.08
0.1
0.12
0.14
Pre-1985 1985-1989 1990-1994 1995-1999 2000-2004 2005 (US all
Energy Sources)
2005 (US
Bituminous)
Un
it C
ap
acit
y (
GW
)
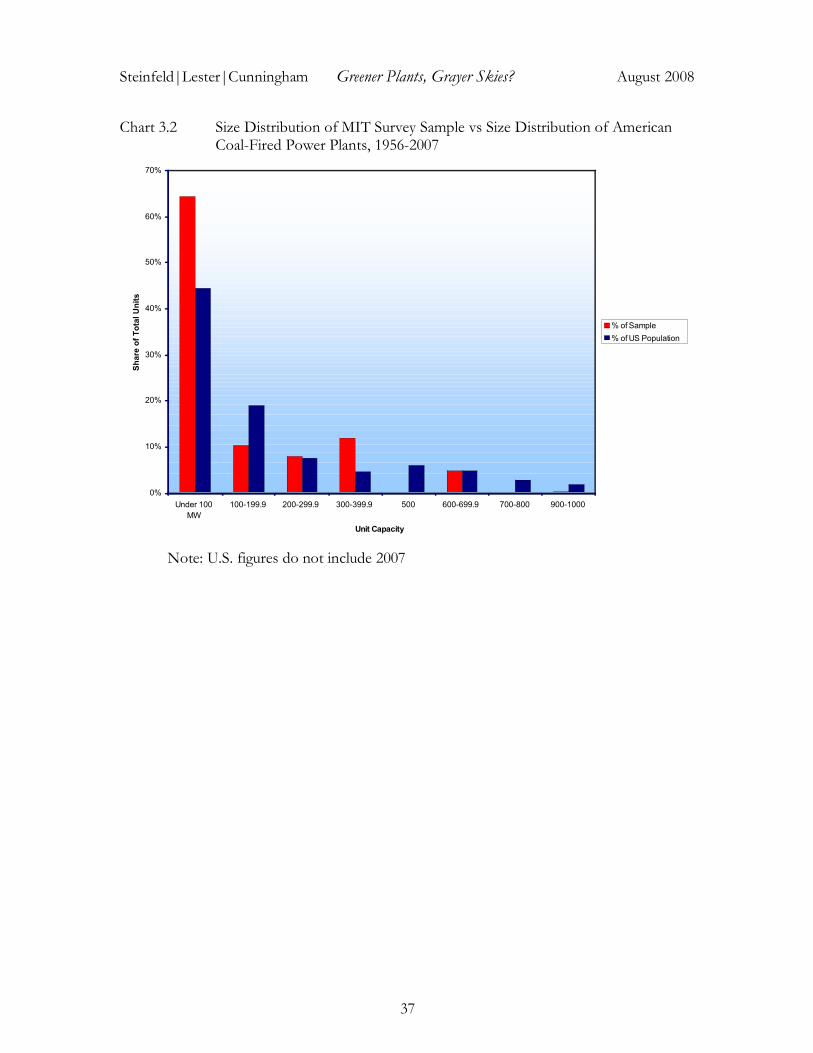
Steinfeld|Lester|Cunningham Greener Plants, Grayer Skies? August 2008
37
Chart 3.2 Size Distribution of MIT Survey Sample vs Size Distribution of American Coal-Fired Power Plants, 1956-2007
0%
10%
20%
30%
40%
50%
60%
70%
Under 100
MW
100-199.9 200-299.9 300-399.9 500 600-699.9 700-800 900-1000
Unit Capacity
Sh
are
of
To
tal U
nit
s
% of Sample
% of US Population
Note: U.S. figures do not include 2007

Steinfeld|Lester|Cunningham Greener Plants, Grayer Skies? August 2008
38
Chart 3.3 Capacity-Weighted Size Distribution of MIT Survey Sample vs. Size Distribution of American Power Plants, 1956-2007
0%
5%
10%
15%
20%
25%
30%
35%
Under 100
MW
100-199.9 200-299.9 300-399.9 500 600-699.9 700-800 900-1000
MW
Unit Capacity (MW)
Sh
are
of
To
tal C
ap
acit
y
% of Sample (Capacity)
% of US Population (Capacity)
Note: U.S. figures do not include 2007.

Steinfeld|Lester|Cunningham Greener Plants, Grayer Skies? August 2008
39
Chart 4.1 Steam Conditions in MIT Survey Sample Plants
0
10
20
30
40
50
60
70
80
90
100
Small (below 50MW) Medium Large (300MW and above)
Unit Capacity (MW)
# o
f U
nit
s
1.4-3.9MPa/400-450C
3.9-9.9MPa/450-540C
9.9-13.8MPa/540C
13.8-17.5MPa/540C
17.5-22.19MPa/540C
22.19+Mpa/540C
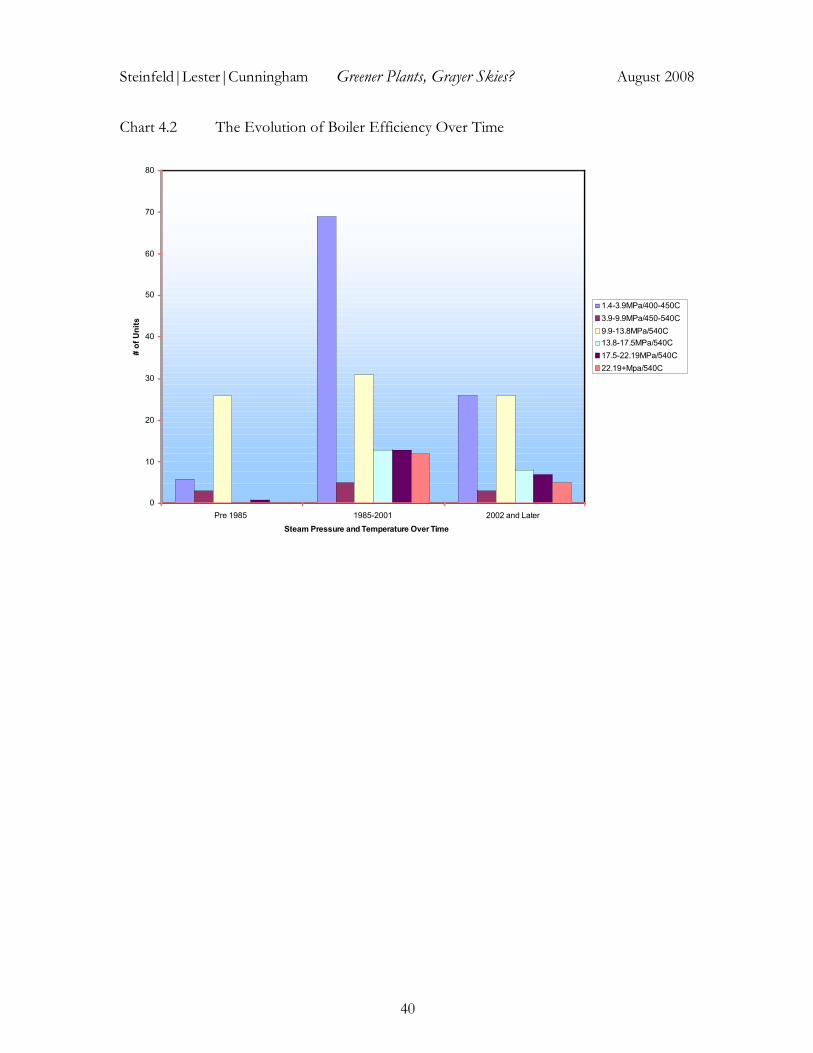
Steinfeld|Lester|Cunningham Greener Plants, Grayer Skies? August 2008
40
Chart 4.2 The Evolution of Boiler Efficiency Over Time
0
10
20
30
40
50
60
70
80
Pre 1985 1985-2001 2002 and Later
Steam Pressure and Temperature Over Time
# o
f U
nit
s
1.4-3.9MPa/400-450C
3.9-9.9MPa/450-540C
9.9-13.8MPa/540C
13.8-17.5MPa/540C
17.5-22.19MPa/540C
22.19+Mpa/540C

Steinfeld|Lester|Cunningham Greener Plants, Grayer Skies? August 2008
41
Chart 4.3 Distribution of Steam Conditions in Total MIT Survey Sample
0
1
2
3
4
5
6
7
8
9
1.4-3.9MPa/400-450C 3.9-9.9MPa/450-540C 9.9-13.8MPa/540C 13.8-17.5MPa/540C 17.5-22.19MPa/540C 22.19+Mpa/540C
Steam Pressure and Temperature
To
tal C
ap
acit
y (
GW
)
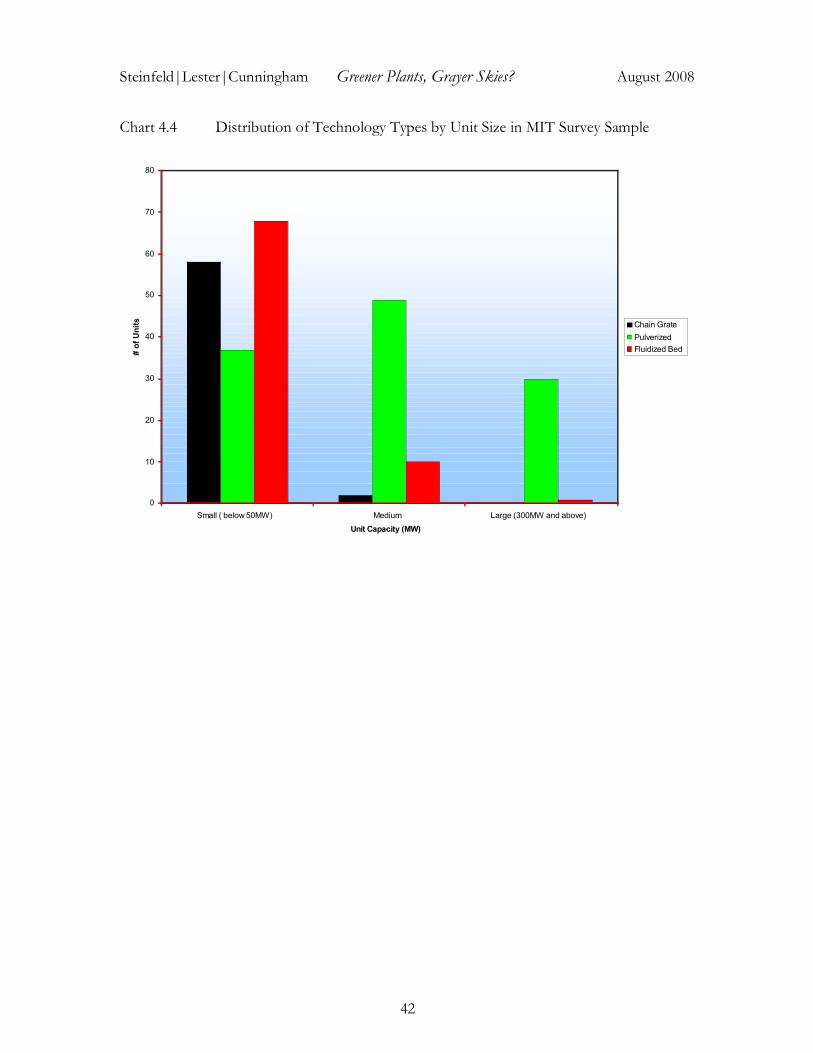
Steinfeld|Lester|Cunningham Greener Plants, Grayer Skies? August 2008
42
Chart 4.4 Distribution of Technology Types by Unit Size in MIT Survey Sample
0
10
20
30
40
50
60
70
80
Small ( below 50MW) Medium Large (300MW and above)
Unit Capacity (MW)
# o
f U
nit
s
Chain Grate
Pulverized
Fluidized Bed

Steinfeld|Lester|Cunningham Greener Plants, Grayer Skies? August 2008
43
Chart 4.5 Distribution of Technology Types Over Time
0
10
20
30
40
50
60
70
Chain Grate Pulverized Fluidized Bed
Boiler Type
# o
f U
nit
s
Pre 1985
1985-2001
2002 and Later

Steinfeld|Lester|Cunningham Greener Plants, Grayer Skies? August 2008
44
Chart 4.6 Distribution of Sample’s Total Generating Capacity Across Boiler Types
0
5
10
15
20
25
Chain Grate Fluidized Bed Pulverized
Boiler Type
To
tal C
ap
acit
y (
GW
)

Steinfeld|Lester|Cunningham Greener Plants, Grayer Skies? August 2008
45
Chart 4.7 Occurrence of FGD Systems in Survey Sample
FGD Type by Plant
50 plants, 61%
17 plants, 21% 15 plants, 18%
No FGD
FGD+CEMS on some units
FGD+Plant monitors on some units
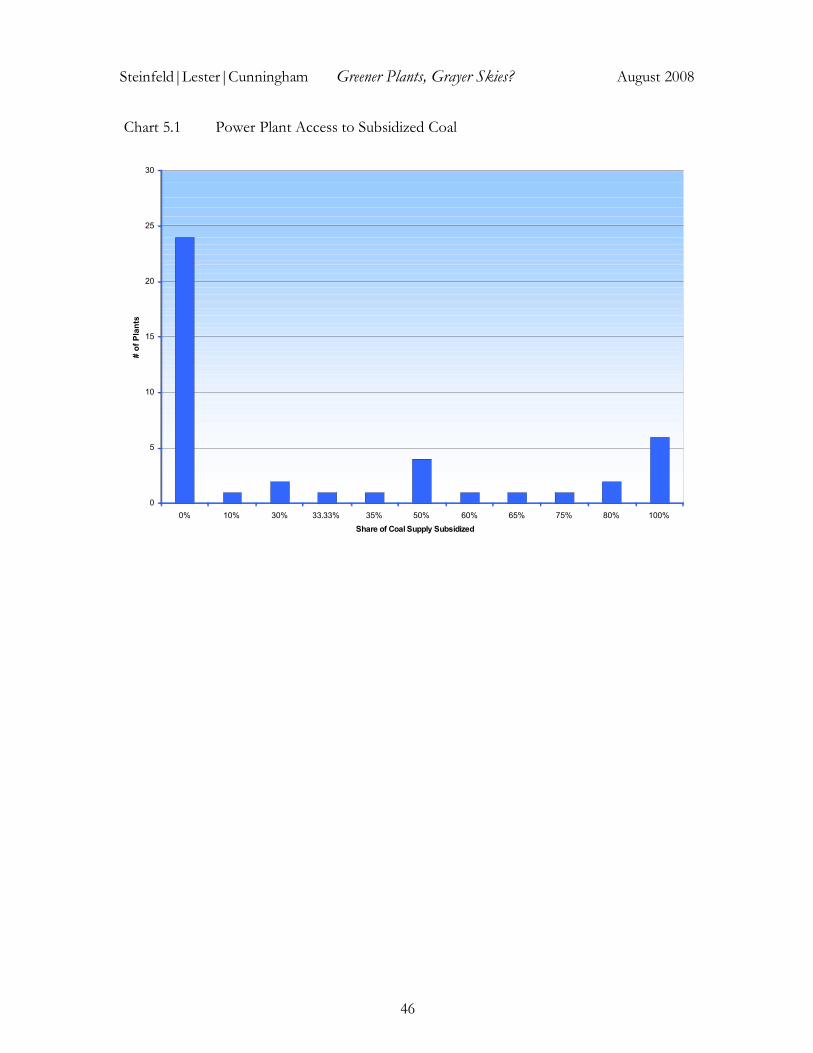
Steinfeld|Lester|Cunningham Greener Plants, Grayer Skies? August 2008
46
Chart 5.1 Power Plant Access to Subsidized Coal
0
5
10
15
20
25
30
0% 10% 30% 33.33% 35% 50% 60% 65% 75% 80% 100%
Share of Coal Supply Subsidized
# o
f P
lan
ts

Steinfeld|Lester|Cunningham Greener Plants, Grayer Skies? August 2008
47
Chart 5.2 Contract Types for Coal Accessed Through Market Channels
Under 1 Year (but
not Temporary),
4 Plants, 16%
Temporary
Contract, 3 Plants,
12%
Over 1 Year
Contract, 1 Plant,
4%
1 Year Contract,
17 plants, 68%
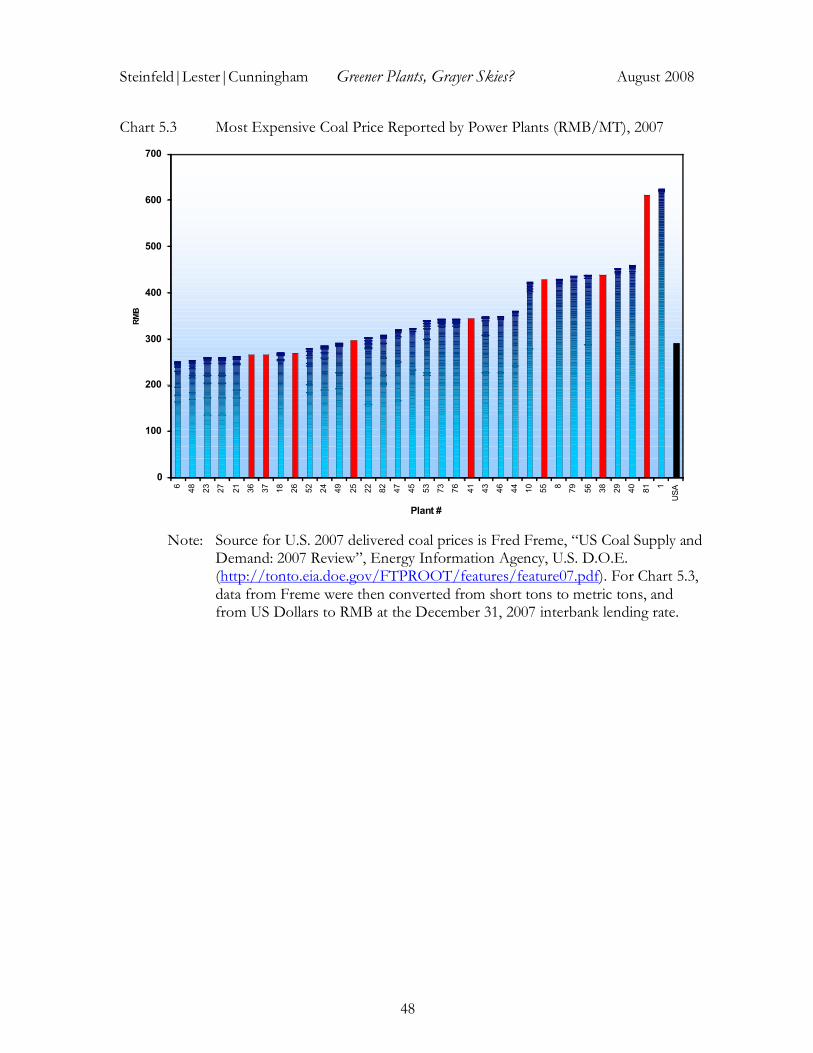
Steinfeld|Lester|Cunningham Greener Plants, Grayer Skies? August 2008
48
Chart 5.3 Most Expensive Coal Price Reported by Power Plants (RMB/MT), 2007
0
100
200
300
400
500
600
700
6
48
23
27
21
36
37
18
26
52
24
49
25
22
82
47
45
53
73
76
41
43
46
44
10
55 8
79
56
38
29
40
81 1
USA
Plant #
RM
B
Note: Source for U.S. 2007 delivered coal prices is Fred Freme, “US Coal Supply and
Demand: 2007 Review”, Energy Information Agency, U.S. D.O.E. (http://tonto.eia.doe.gov/FTPROOT/features/feature07.pdf). For Chart 5.3, data from Freme were then converted from short tons to metric tons, and from US Dollars to RMB at the December 31, 2007 interbank lending rate.

Steinfeld|Lester|Cunningham Greener Plants, Grayer Skies? August 2008
49
Chart 5.4 Coal Price Differentials Experienced by Individual Plants
0
10
20
30
40
50
60
70
80
90
0-49 50-99 100-149 150-199 200-249 250-299 300-349
RMB
# o
f U
nit
s
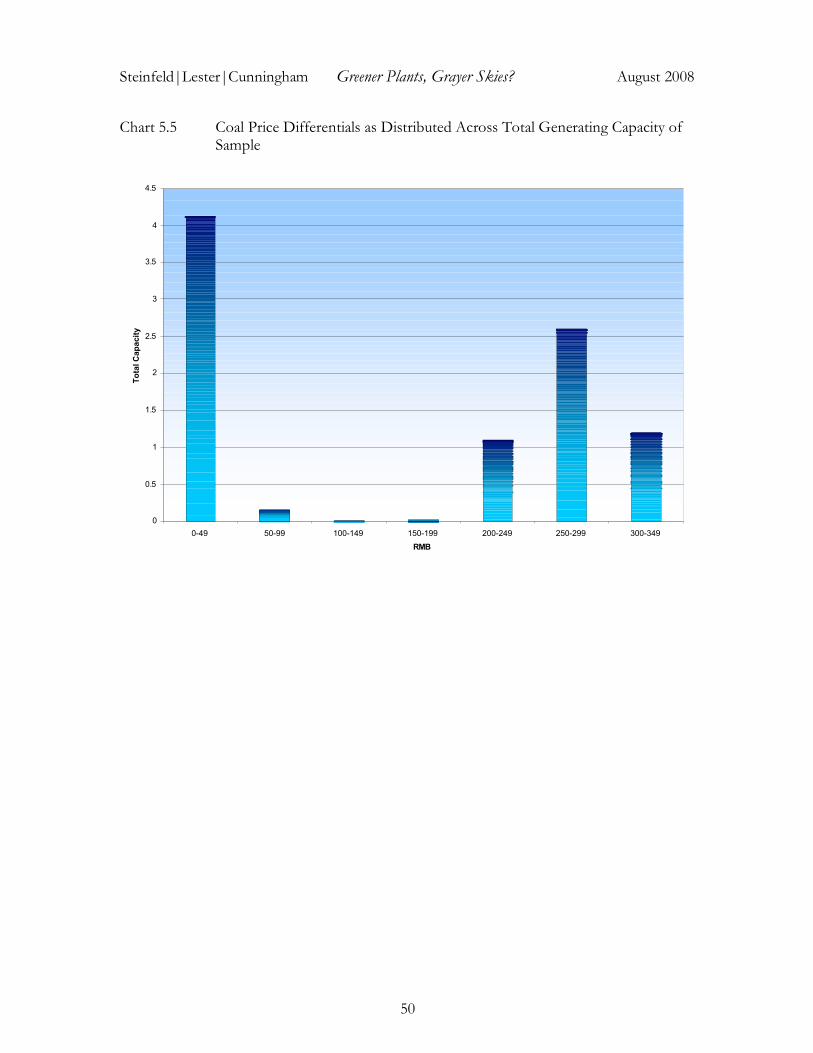
Steinfeld|Lester|Cunningham Greener Plants, Grayer Skies? August 2008
50
Chart 5.5 Coal Price Differentials as Distributed Across Total Generating Capacity of Sample
0
0.5
1
1.5
2
2.5
3
3.5
4
4.5
0-49 50-99 100-149 150-199 200-249 250-299 300-349
RMB
To
tal C
ap
acit
y

Steinfeld|Lester|Cunningham Greener Plants, Grayer Skies? August 2008
51
Chart 5.6 Modes of Coal Transport for Plants in the the Survey Sample
Truck, 28 Plants,
37%
Train, 23 Plants,
29%
Truck Dominant, 7
Plants, 9%
Ocean Tanker, 3
Plants, 4%
Train Dominant, 11
Plants, 14%
Train and Truck
Even, 1 Plant, 1%
Boat, 4 Plants, 5%
Boat and Truck, 1
Plant, 1%

Steinfeld|Lester|Cunningham Greener Plants, Grayer Skies? August 2008
52
Chart. 5.7 Sulfur Content of Power Plant Fuel (weight percent)
0
1
2
3
4
5
6
7
8
12 14 49 45 61 39 57 74 20 52 80 17 18 60 33 65 23 63 79 64 38 5 76 40 72 32 54
Plant #
%

Steinfeld|Lester|Cunningham Greener Plants, Grayer Skies? August 2008
53
Chart 6.1 Plant Level Sulfur Dioxide Emissions
(Blue: Online Prior to 1997 Yellow: Online 1997-2003;
Green: Online 2004 and Later; Red: Year Unknown)
0
500
1000
1500
2000
2500
3000
3500
4000
4500
17 65 15 55 31 14 40 56 29 47 7 10 18 24 27 26 82 42 67 63 35 25 66 71 20 78 22 23 75 49 16 33 19 39 46 45 85 64 38 43 62 79 80 61 81 3
Plant #
mg
/cu
bic
m
ete
r
PRC Plants Online prior to 1997
PRC Plants Online 1997-2003
PRC Plants Online After 2003
EU (50-100MW)
EU (100+ MW)

Steinfeld|Lester|Cunningham Greener Plants, Grayer Skies? August 2008
54
Selected Bibliography
Andrews-Speed, Philip (2005) ‘China’s energy woes: running on empty’, Far Eastern Economic Review, June.
Asia Pacific Energy Research Center (APERC) (2004) ‘Energy in China: transportation, electric power and fuel markets’.
China Electricity Council, “Guojia Fagaiwei Bu 2007 Nian Huodianchang Yanqi Tuoliu Chanye Xinxi, March 19, 2008, http://www.cec.org.cn/news/deptnews.asp?id=2871
Cui, Minxuan (ed) (2008), “Zhongguo Nengyuan Fazhan Baogao (2008)”, Shehui Kexue Wenxian Chubanshe.
EIA, “Existing Capacity by Energy Source”, http://www.eia.doe.gov/cneaf/electricity/epa /epat2p2.html;
EIA, “World Carbon Dioxide Emissions from the Consumption of Coal, 1980-2006”, http://www.eia.doe.gov/pub/international/iealf/tableh4co2.xls
EIA, “World Carbon Dioxide Emissions from the Consumption and Flaring of Fossil Fuels, 1980-2005”, http://www.eia.doe.gov/pub/international/iealf/tableh1co2.xls
EIA http://www.eia.doe.gov/cneaf/coal/page/acr/table34.html
http://www.maps-of-china.net/province_map.html
IEA (International Energy Agency) (2004b) World Energy Outlook 2004, Paris: IEA.
Feme, Fred, “US Coal Supply and Demand: 2007 Review”, EIA, http://tonto.eia.doe.gov/FTPROOT/features/feature07.pdf.
Kynge, James (2000) ‘New doubts over Chinese plant’, Financial Times, 10 March.
Li, Binsheng and James Dorian (1995) ‘Change in China’s power sector’, Energy Policy, 23 (7): 619–626.
Minchener, Andrew, “Coal Supply Challenges for China, IEA, 2007
MIT, “Future of Coal,” 2007.

Steinfeld|Lester|Cunningham Greener Plants, Grayer Skies? August 2008
55
NBS (National Bureau of Statistics) (2004a) China Electric Power Yearbook, Beijing: China Electric Power Press.
NBS (National Bureau of Statistics) (2004b) China Energy Statistical Yearbook, Beijing: China Statistics Press.
NBS (National Bureau of Statistics) (2005-6) China Energy Statistical Yearbook, Beijing: China Statistics Press.
NBS (National Bureau of Statistics) (2005) China’s Economy and Trade Yearbook. Beijing: China Economy and Trade Yearbook Press.
NBS (National Bureau of Statistics) (2005) China Electric Power Yearbook, Beijing: China Electric Power Press.
NBS (National Bureau of Statistics) (2006) China Electric Power Yearbook, Beijing: China Electric Power Press.
NBS (National Bureau of Statistics) (2007) China Electric Power Yearbook, Beijing: China Electric Power Press.
NDRC Energy Bureau (Fagaiwei Nengyuan Yanjiusuo) (2005) ‘Shijie yu Zhongguo de nengyuan shuju bijiao [A comparison of world and Chinese energy statistics]’, Energy Bureau, National Development and Reform Commission, 28 November; see <http://nyj.ndrc.gov.cn/sjtj/t20051128_51344.htm>.
Pei, Yee Woo (2005) ‘China’s electric power market: the rise and fall of IPPs’, PESD Working Paper No. 45.
Ping, Junkai,Shenyouting Guolu Yuanli Ji Jisuan (Dierban) (1992), Beijing: Kexue Chubanshe.
“Power Becomes Supercritical,” China Daily, Sept. 7, 2007
Rosen, Daniel and Trevor Houser, “China Energy: A Guide for the Perpelexed,” China Balance Sheet, CSIS and Peterson Institute for International Economics, 2007.
Schreifels, Jeremy, “International Practices and Experiences with Infrastructure Investment and Pollution Control Programs,” Report Submitted to China Council for International Cooperation on Environment and Development, U.S. Environmental Protection Agency, 2007
Steinfeld|Lester|Cunningham Greener Plants, Grayer Skies? August 2008
56
State Environmental Protection Agency, Zhonghua Renmin Gongheguo Guojia Biaojun, GB 13223-2003, “Emission Standard of Air Pollutants for Thermal Power Plants,” 12/30/2003
State Council Office of Economic Restructuring (2004) ‘Zhongguo dianli jianguan jigou jianshe yanjiu baogao’, November.
US Department of Energy web site.
Wang, Dazhong (ed) (2008), “Ershiyi Shiji Zhongguo Nengyuan Keji Fazhan Zhanwang”, Qinghua Daxue Chubanshe.
Wei, Yiming, Han Zhiyong, Fan Ying and Wu Gang (eds) (2006) ‘Zhongguo Nengyuan Baogao: Zhanlue yu zhengce yanjiu,. Beijing: Kexue Chubanshe.
World Coal Institute web site.
Xu, Yichong (2002) Powering China: Reforming the Electric Power Industry in China, Aldershot: Ashgate Publishing Ltd.
Xu, Yichong (2004) Electricity Reform in China, India and Russia, Cheltenham: Edward Elgar.
Zeng, Lemin, Zhang Chi, Chen Lijia and Xiang Xiaomin (2004) ‘Guangdong electric power market reform: options and impact’, PESD Paper 43, November.
Zhang, Chi (2003) ‘Reform of Chinese electric power market: economics and institutions’, PESD draft paper, Stanford University, 31 January.
