richard c. adkerson
TRANSCRIPT

www.fcx.comNovember 11, 2008November 11, 2008
Richard C. AdkersonPresident & CEO
Richard C. AdkersonPresident & CEO

2
This presentation contains forward-looking statements in which we discuss factors we believe may affect our performance in the future. Forward-looking statements are all statements other than historical facts, such as statements regarding projected ore grades and milling rates, projected sales volumes, projected unit net cash costs, projected operating cash flows, projected capital expenditures, the impact of copper, gold and molybdenum price changes, the impact of changes in deferred intercompany profits on earnings and timing of dividend payments and open market purchases of FCX common stock. The declaration and payment of dividends is at the discretion of FCX’s Board of Directors and will depend on FCX’sfinancial results, cash requirements, future prospects, and other factors deemed relevant by the Board. Accuracy of the forward-looking statements depends on assumptions about events that change over time and is thus susceptible to periodic change based on actual experience and new developments. FCX cautions readers that it assumes no obligation to update or publicly release any revisions to the forward-looking statements in this presentation and, except to the extent required by applicable law, does not intend to update or otherwise revise the forward-looking statements more frequently than quarterly. Additionally, important factors that might cause future results to differ from these projections include mine sequencing, production rates, industry risks, commodity prices, political risks, weather-related risks, labor relations, currency translation risks and other factors described in FCX's Annual Report on Form 10-K for the year ended December 31, 2007, filed with the Securities and Exchange Commission (SEC).
In our filings with the SEC, we disclose recoverable proven and probable reserves calculated in accordance with Industry Guide 7 as required by the Securities and Exchange Act of 1934. In this presentation we refer to potential reserve additions and use phrases such as “potential additions in medium term,” “mineralized material” and “potential to add reserves.”Potential reserve additions will not qualify as reserves until sufficient mapping, drilling, sampling, and assaying are completed and until comprehensive engineering studies establish their economic feasibility. Accordingly, no assurance can be given that any potential reserve additions will become recoverable proven or probable reserves. We urge you to consider closely the disclosure of recoverable proven and probable reserves in our Annual Report on Form 10-K for the year ended December 31, 2007.
This presentation also contains certain financial measures such as unit net cash costs per pound of copper and unit net cash costs per pound of molybdenum. As required by SEC Regulation G, reconciliations of these measures to amounts reported in FCX’s consolidated financial statements or pro forma consolidated financial results are in the supplemental schedule, “Product Revenues and Production Costs,” which is available on our internet web site www.fcx.com.
www.fcx.comwww.fcx.com
Cautionary Statement Regarding Forward-Looking Statements
Cautionary Statement Regarding Forward-Looking Statements
3
FCX Investment SummaryFCX Investment Summary
World’s Premier Publicly Traded Copper Company
World’s Largest Molybdenum Producer & Significant Gold Producer
World Class, Long-lived, Geographically Diverse Operations
Strong Cash Flows and Financial Strength
Attractive Project Pipeline
Significant Exploration Potential
4
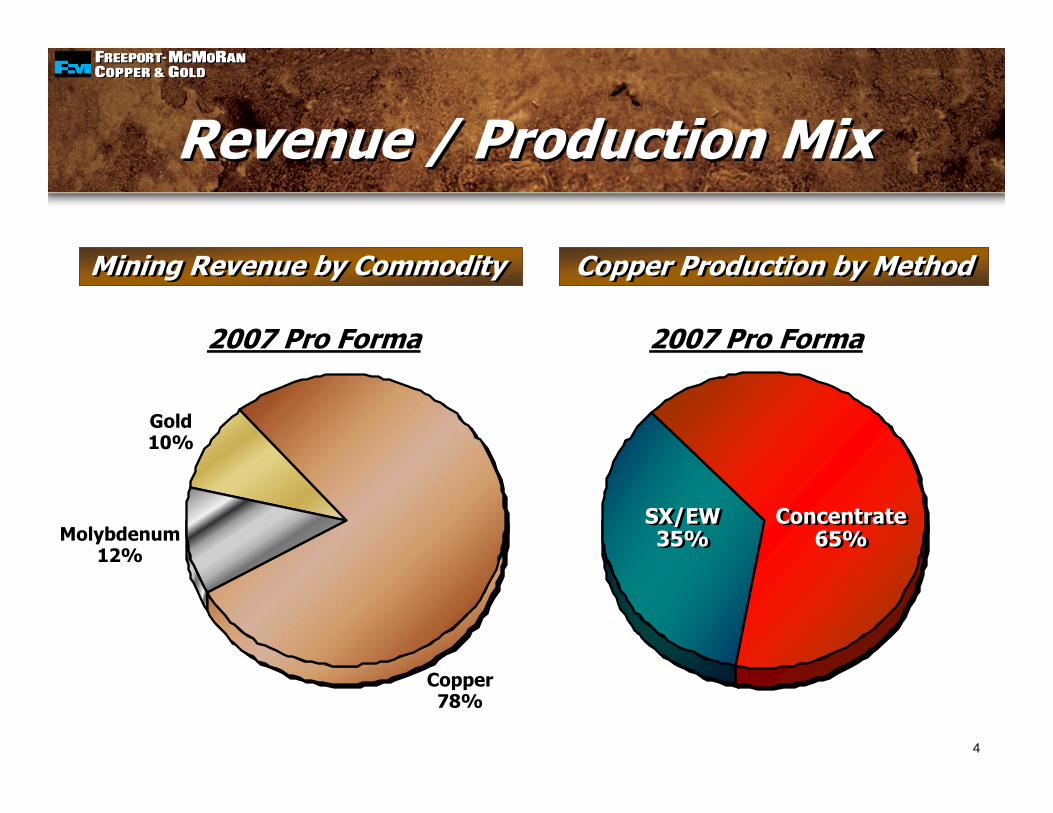
Revenue / Production MixRevenue / Production Mix
Molybdenum12%
Copper78%
Gold10%
Mining Revenue by Commodity Mining Revenue by Commodity
2007 Pro Forma
Concentrate65%
Concentrate65%
SX/EW35%
SX/EW35%
Copper Production by Method Copper Production by Method
2007 Pro Forma

5
World’s Leading Copper ProducersWorld’s Leading Copper Producers
0
200
400
600
800
1,000
1,200
1,400
1,600
1,800
2,000
Codelco FCX BHP Billiton Xstrata Rio Tinto AngloAmerican
SouthernCopper
RAO Norilsk KGHM PolskaMiedz
Kazakhmys
(000 t)
Top 10 Copper Producers (2008E)
____________________Source: Brook Hunt 3Q08 Report. Rankings based on net equity ownership.

6
Tenke (57.75%)Tenke (57.75%)Reserves
Cu 4.3 billion lbsCo 0.6 billion lbs
Grasberg (90.64%)Grasberg (90.64%)
ReservesCu 37.1 billion lbsAu 41.0 million ozs
ProductionCu 1.1 billion lbsAu 1.1 million ozs
CopperCopper/Gold/SilverMolybdenum
Major Mine Operations & Development ProjectsAll major assets majority-controlled and operated
ReservesCu 25.8 billion lbsMo 1.8 billion lbs
ProductionCu 1.4 billion lbsMo 74 million lbs2
North America1North America1
Note: FCX consolidated reserves and annual production; Reserves as of December 31, 2007. Production figures are based on average annual estimates for 2008.1 Cu operations: Morenci (85%), Sierrita (100%), Bagdad (100%), Chino/Cobre (100%), Tyrone (100%), Miami (100%) and Safford (100%),
Primary Mo: Henderson (100%) and Climax (100%)2 Includes Cerro Verde moly3 Copper operations Candelaria/Ojos del Salado (80%), Cerro Verde (53.6%) and El Abra (51%)
Geographically DiverseGeographically Diverse
6
CopperReserves 25.9 billion lbsProduction 1.5 billion lbs
South America3South America3

7
Long-Lived Asset BaseLong-Lived Asset Base
Reserves 12/31/07 (1)
Copper (billion lbs) 93.2Molybdenum (billion lbs) 2.0Gold (million ozs) 41.0
Average Sales Volumes (2008-2010)Copper (billion lbs) 4.5Molybdenum (million lbs) 85Gold (million ozs) 1.9
Implied Reserve Life (years)Copper 21Molybdenum 24Gold 22
Mineralized Material (2)
Ore (million metric tons) 12,073 Contained Copper (billion lbs) 100 average % copper 0.38average g/t gold 0.07
ConsolidatedConsolidated
____________________(1) Estimated recoverable reserves in 2007 were assessed using a copper price of $1.20 per pound, a gold price of $450 per ounce, and a molybdenum price of $6.50 per pound.
(2) Mineralized Material is not included in reserves and will not qualify as reserves until comprehensive engineering studies establish their economic feasibility. Accordingly, no assurance can be giventhat the estimated resources and mineralization will become proven and probable reserves. See Cautionary Statement.
8
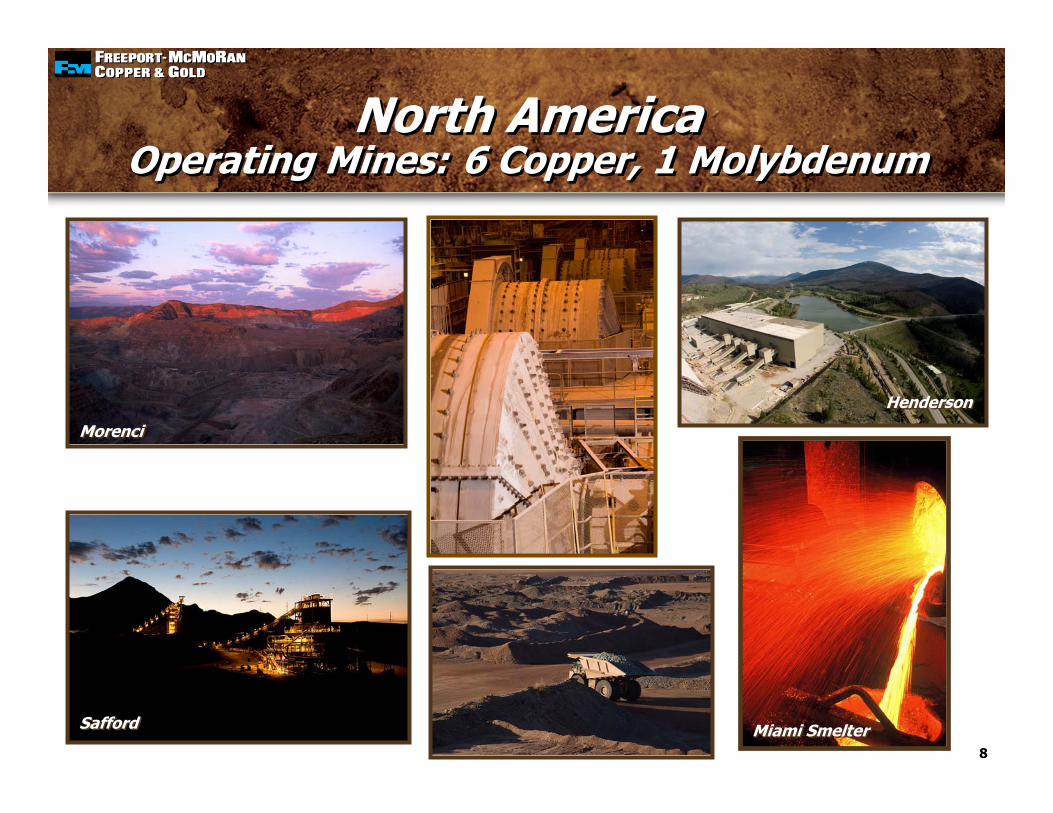
North AmericaOperating Mines: 6 Copper, 1 Molybdenum
North AmericaOperating Mines: 6 Copper, 1 Molybdenum
SaffordSafford
MorenciMorenci
Miami SmelterMiami Smelter
HendersonHenderson

9
South America4 Operating Copper Mines
South America4 Operating Copper Mines
Cerro Verde MillCerro Verde MillCerro Verde in PeruCerro Verde in Peru
El Abra in Chile Candelaria/OjosCandelaria/Ojos

10
Indonesia ̶ GrasbergIndonesia ̶ Grasberg
GrasbergMill Complex GrasbergMill Complex
Underground DevelopmentUnderground Development
GrasbergGrasberg
11
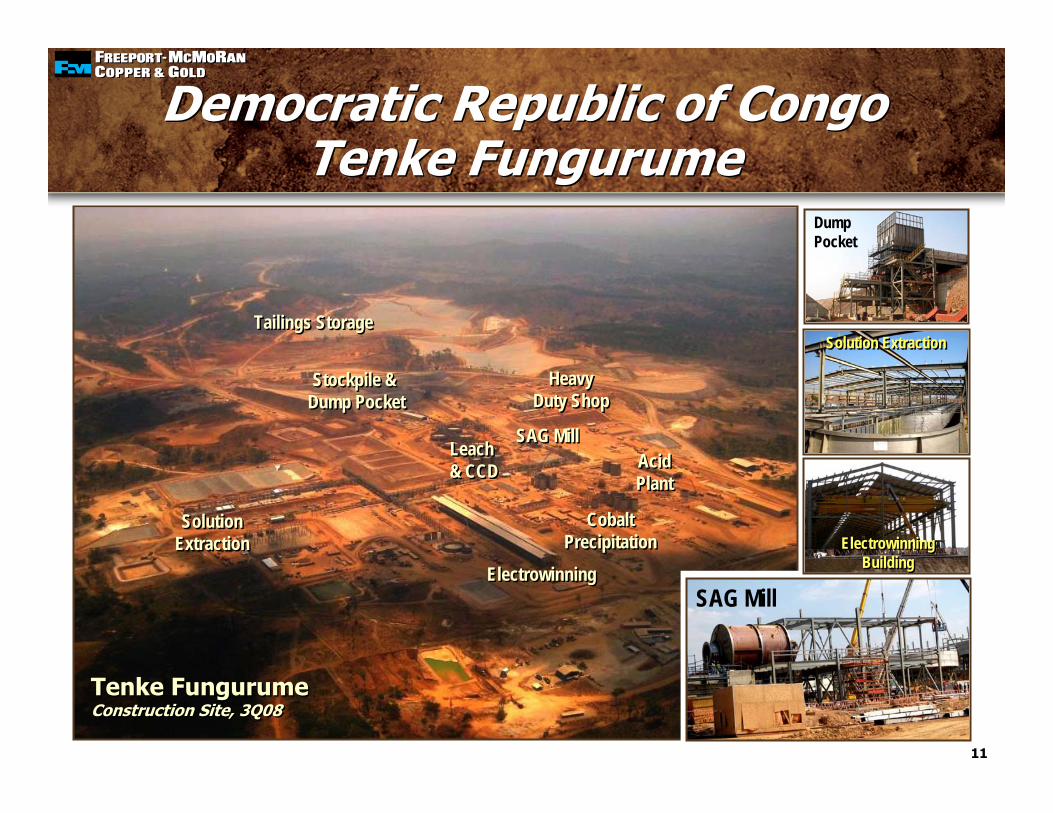
ElectrowinningElectrowinning
CobaltPrecipitation
CobaltPrecipitation
HeavyDuty Shop
HeavyDuty Shop
Leach& CCDLeach& CCD
SAG MillSAG Mill
Stockpile & Dump PocketStockpile &
Dump Pocket
Tenke FungurumeConstruction Site, 3Q08Tenke FungurumeConstruction Site, 3Q08
SolutionExtractionSolution
Extraction
AcidPlantAcidPlant
Tailings StorageTailings Storage
SAG Mill
Solution ExtractionSolution Extraction
ElectrowinningBuilding
ElectrowinningBuilding
DumpPocket
Democratic Republic of CongoTenke Fungurume
Democratic Republic of CongoTenke Fungurume
12
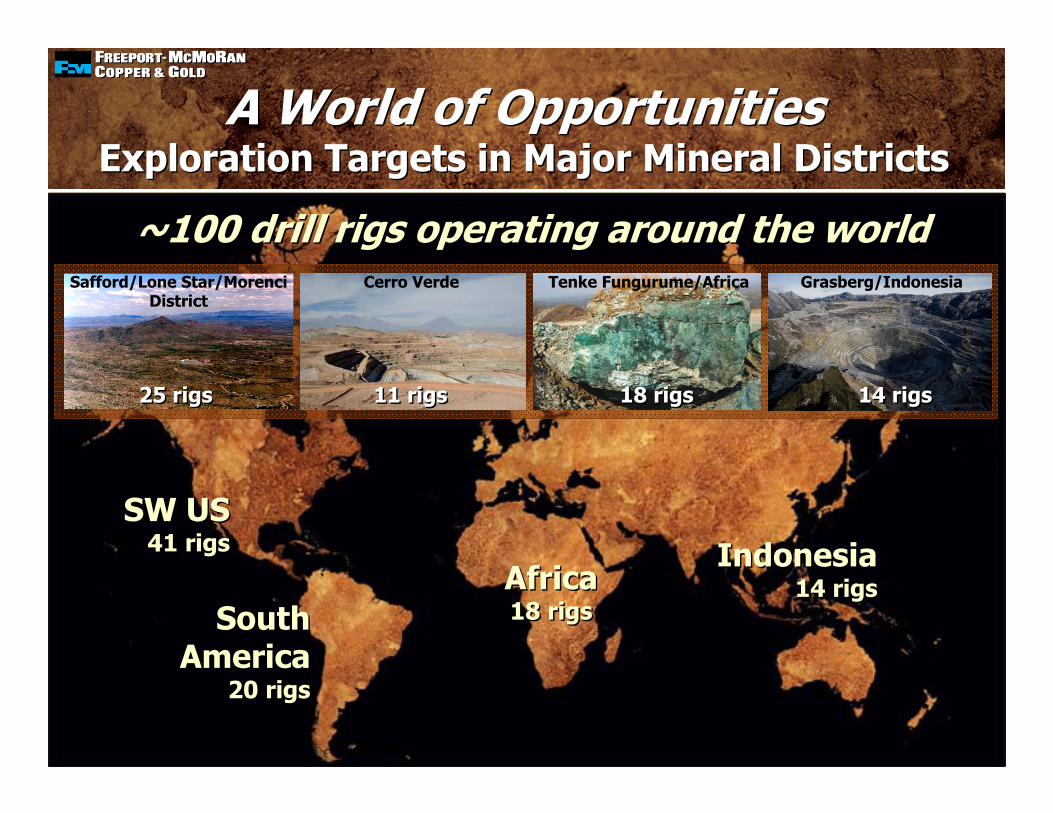
A World of OpportunitiesExploration Targets in Major Mineral Districts
A World of OpportunitiesExploration Targets in Major Mineral Districts
SouthAmerica
20 rigs
SouthAmerica
20 rigs
Indonesia14 rigs
Indonesia14 rigsAfrica
18 rigsAfrica18 rigs
SW US41 rigs
SW US41 rigs
Safford/Lone Star/MorenciDistrict
Cerro Verde Tenke Fungurume/Africa Grasberg/Indonesia
~100 drill rigs operating around the world~100 drill rigs operating around the world
25 rigs25 rigs 11 rigs11 rigs 18 rigs18 rigs 14 rigs14 rigs

13
Recent EventsRecent Events
Global Market Conditions Financial Market Turmoil/Credit Crisis
Economic Weakness in U.S./Europe
Market Concerns About Slower Growth in China
Sharp Decline in Commodities Prices During September/October
Underlying Fundamentals of Copper Business Remain Positive
Low Inventories
Supply Constraints/Shortfalls
Absence of New Projects

14
MarketsMarkets
*LME and Comex, excluding Shanghai stocks, producer, consumer and merchant stocks.
London Gold Price ($/oz) Molybdenum Price* ($/lb)
$0
$200
$400
$600
$800
$1,000
$1,200
Jan-99 Jan-00 Jan-01 Jan-02 Jan-03 Jan-04 Jan-05 Jan-06 Jan-07 Jan-08$0
$5
$10
$15
$20
$25
$30
$35
$40
Jan-02
Jul-02
Jan-03
Jul-03
Jan-04
Jul-04
Jan-05
Jul-05
Jan-06
Jul-06
Jan-07
Jul-07
Jan-08
Jul-08
* Metals Week – Molybdenum Dealers Oxide Price
Cen
ts Per P
oun
d0
00
’s M
etri
c To
ns
0
250
500
750
1,000
1,250
1,500
1,750
2,000
Jan-99 Jul-99 Jan-00 Jul-00 Jan-01 Jul-01 Jan-02 Jul-02 Jan-03 Jul-03 Jan-04 Jul-04 Jan-05 Jul-05 Jan-06 Jul-06 Jan-07 Jul-07 Jan-08 Jul-08
0
50
100
150
200
250
300
350
400
LME & COMEX Exchange Stocks* LME & COMEX Exchange Stocks*
LME Copper Price

15
Revised Operating PlansRevised Operating Plans
Dramatic Shift in Economic Conditions in September/October Requires Change in Near-term Strategy
Targeting Large Reductions in All Elements of Costs and Capital Expenditures
Defer Discretionary Capital Spending, Including Major Projects in Early Stages of Planning and Construction
Curtail Production (Molybdenum/High Cost Copper Operations)
Expect to Provide Update on Revised Operating Plans in December
Long Range Strategy Not Affected

16
Achievement of Significant Debt Reduction
Achievement of Significant Debt Reduction
$7.2
$17.6
$0
$5
$10
$15
$20
(US$ billions)
(1) Pro Forma year-end 2006 total debt of $1.6 billion plus $16 billion in acquisition debt
At Time of PD Acquisition in March 2007
9/30/08
Tota
l Deb
t
(1)
17
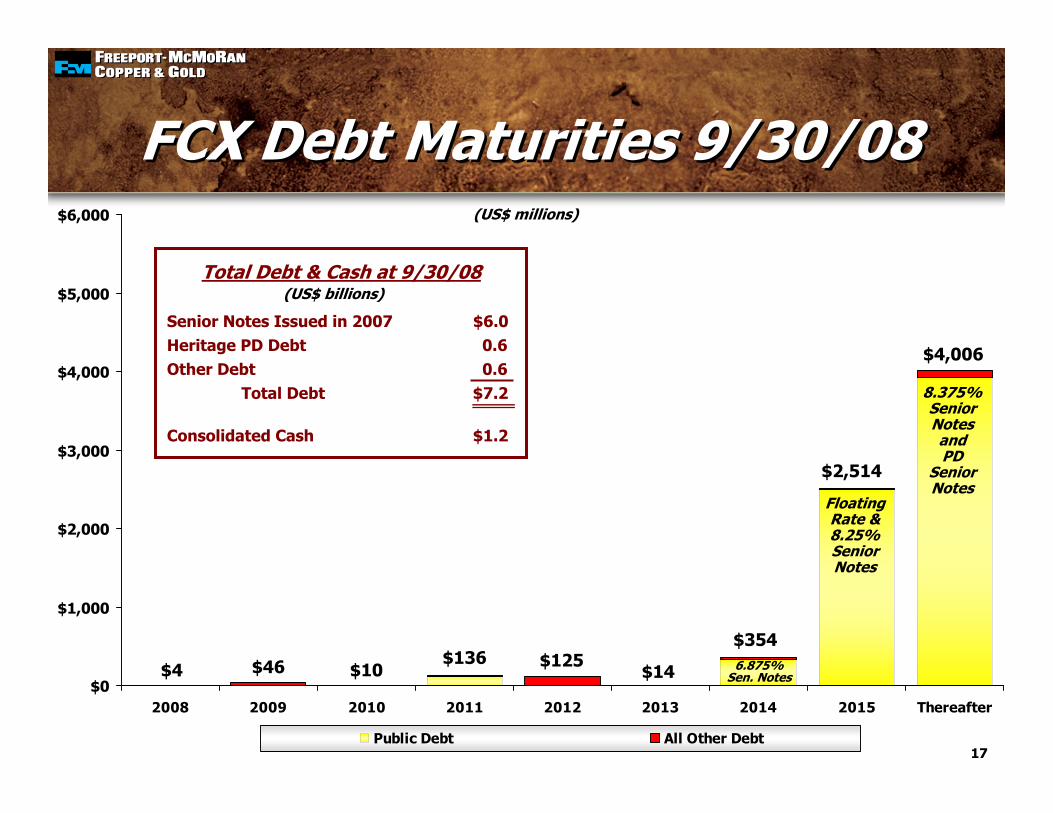
FCX Debt Maturities 9/30/08FCX Debt Maturities 9/30/08
$0
$1,000
$2,000
$3,000
$4,000
$5,000
$6,000
2008 2009 2010 2011 2012 2013 2014 2015 Thereafter
Public Debt All Other Debt
$4 $46 $10$136 $125
$14
(US$ millions)
$2,514
$4,006
$354
8.375% Senior NotesandPD
SeniorNotes
Floating Rate & 8.25% Senior Notes
6.875% Sen. Notes
Total Debt & Cash at 9/30/08
Senior Notes Issued in 2007 $6.0Heritage PD Debt 0.6Other Debt 0.6
Total Debt $7.2
Consolidated Cash $1.2
(US$ billions)
18
Since March 2007 Acquisition of Phelps Dodge, Strategy was Focused on Defining Potential of Resources and Development of Growth Plans
Following Achievement of $10 Billion in Debt Reduction During 2007, Financial Policy was Designed to Use Cash Flows to Invest in Growth Projects and Return Excess Cash Flow to Shareholders
High Prices Enabled Increased Dividend and Expanded Share Purchase Authorization
Near-Term Focus Will be on Protecting Liquidity While Preserving Large Mineral Resources and Growth Options
Board to Review Financial Policy on an Ongoing Basis
Financial PolicyFinancial Policy