rich caruana alexandru niculescu-mizil presented by varun sudhakar
Post on 19-Dec-2015
223 views
TRANSCRIPT

Rich Caruana
Alexandru Niculescu-Mizil
Presented by Varun Sudhakar
An Empirical Comparison of Supervised Learning
Algorithms

Importance:
Empirical comparison of different learning algorithms provides answers to questions such as
Which is the best learning algorithm?How well does a particular learning algorithm
perform when compared to another algorithm over the same data?
This paper provides an extensive comparison of different learning algorithms over several performance measures.

The last comprehensive empirical comparison was STATLOG in 1995
Several new learning algorithms have been developed after STATLOG (Random forests, Bagging, SVMs)
No extensive evaluation of these new methods.
Background:

SVMsANNLogistic RegressionNaïve BayesKNNRandom ForestsDecision Trees(Bayes, Cart, Cart0, ID3,c4,
MML,SMML)Bagged TreesBoosted TreesBoosted Stumps
ALGORITHMS EVALUATED

Threshold Metrics:Accuracy-The proportion of correct
predictions the classifier makes relative to the size of the dataset
F-score - Harmonic mean of the precision and recall at a given threshold
Lift - %of true positives above the threshold-------------------------------------------- %of dataset above the threshold
Performance Metrics Used:
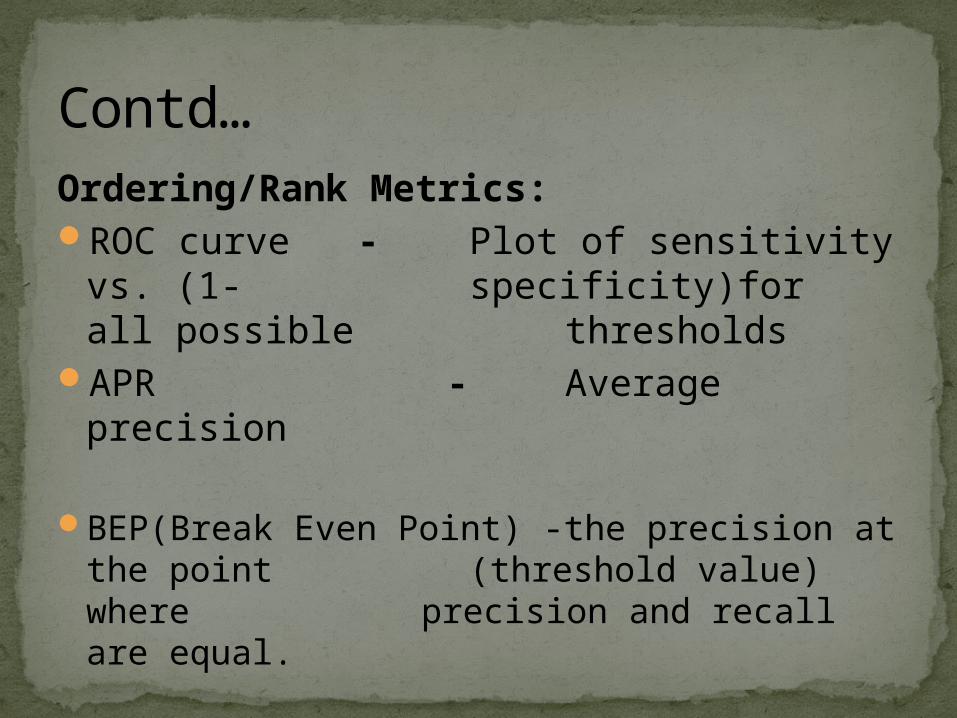
Ordering/Rank Metrics:ROC curve - Plot of sensitivity vs.
(1- specificity)for all possible thresholds
APR - Average precision
BEP(Break Even Point) -the precision at the point (threshold value) where precision and recall are equal.
Contd…

Probability Metrics:(Root Mean Square Error) - A measure of total error
defined as the square root of the sum of the variance and the square of the bias
MXE (Mean Cross Entropy) - used in the probabilisticsetting when interested in predicting the probability that an example is
positiveMXE = -1/NΣ(True©*ln(Pred(c)) + (1-true(c)*ln(1-
pred(c))
Contd…

Lift is appropriate for marketingMedicine prefers ROCPrecision/Recall is used for information
retrieval
…It is also possible for a algorithm to perform well over one metric and perform poorly over some other metric
Reason for using different Metrics

Letter Cover Type Adult Protein codingMEDISMGIndianPine92California HousingBacteriaSLAC(Stanford linear accelerator)
Data Sets Used

For each data set, 5000 random instances are used for training and the rest are used as one large test set.
5 fold cross validation is used on the 5000 training instances
5 fold cross validation is used to select the best parameters for the learning algorithm.
…The purpose of the 5 fold cross validation is to calibrate the different algorithms using either Platt scaling or Isotonic regression
Methodology

SVM predictions are transformed to posterior probabilities by passing them through a sigmoid
Platt's method also works well for boosted trees and boosted stumps
… might not be the correct transformation for all learning algorithms.
Isotonic regression provides a more general solution since the only restriction it makes is that the mapping function should be isotonic (strictly increasing or strictly decreasing)
Platt Scaling

SVMs: radial width
{.001,0.005,0.01,0.05,0.1,0.5,1,2} The regularization parameter is varied by
factors of ten from 10-7 to 103
ANN hidden units{1,2,4,8,32,128} momentum {0,0.2,0.5,0.9}

Logistic Regression: The ridge (regularization) parameter is
varied by factors of 10 from 10-8 to 104
KNN: 26 values of K ranging from K = 1 to K = |
trainset|
Random Forests: The size of the feature set considered at each
split is 1,2,4,6,8,12,16 or 20.

Boosted Trees:2,4,8,16,32,64,128,256,512,1024 and 2048
steps of boosting
Boosted Stumps: single level decision trees generated with 5
different splitting criteria, each boosted for 2,4,8,16,32,64,128,256,512,1024,2048,4096,8192 steps

Without calibration, the best algorithms were bagged trees, random forests, and neural nets.
After calibration, the best algorithms were calibrated boosted trees, calibrated random forests, bagged trees, PLT-calibrated SVMs and neural nets
…SVMs and Boosted trees have improved rankings with calibrations.
Did Calibration help?

Interestingly, calibrating neural nets with PLT or ISO hurts their calibration.
And some algorithms such as Memory-based methods (e.g. KNN) are unaffected by calibration
Contd…

Results (Mean over 8 metrics)
BST-D
T(PL
T)
RF(PLT
)
Bagge
d DT
SVM
(PLT
)
ANN
KNN(P
LT)
BST-S
TMP(
PLT)
DT(IS
O)
Log
reg
Naï
ve B
ayes
(ISO)
0
0.2
0.4
0.6
0.8
1
Algorithm
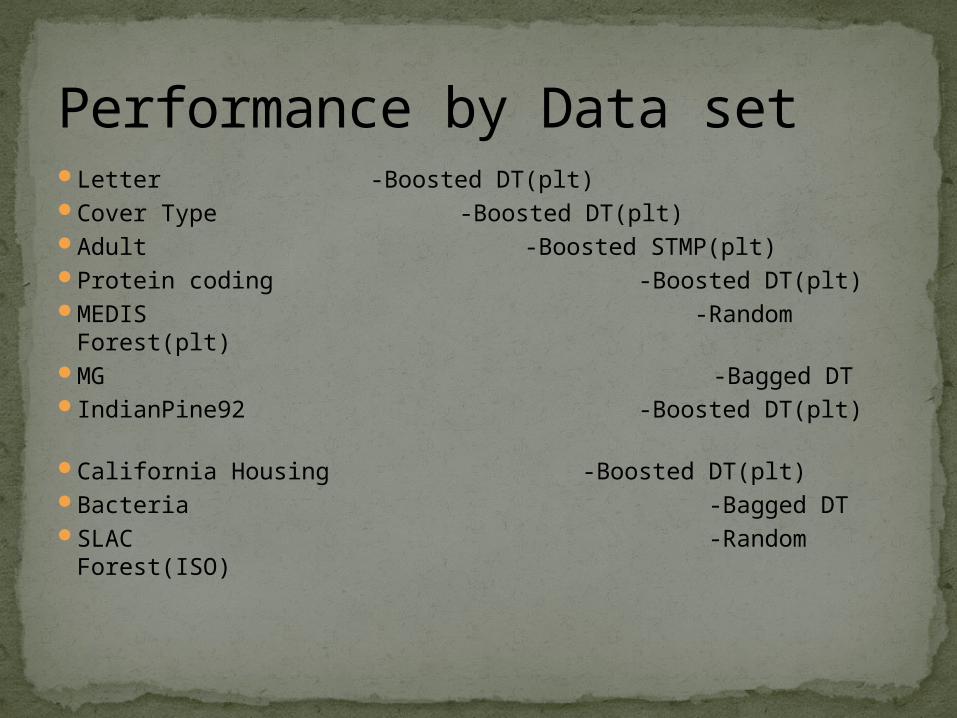
Letter -Boosted DT(plt)Cover Type -Boosted DT(plt)Adult -Boosted STMP(plt)Protein coding -Boosted DT(plt)MEDIS -Random Forest(plt)MG -Bagged DTIndianPine92 -Boosted DT(plt) California Housing -Boosted DT(plt)Bacteria -Bagged DTSLAC -Random Forest(ISO)
Performance by Data set
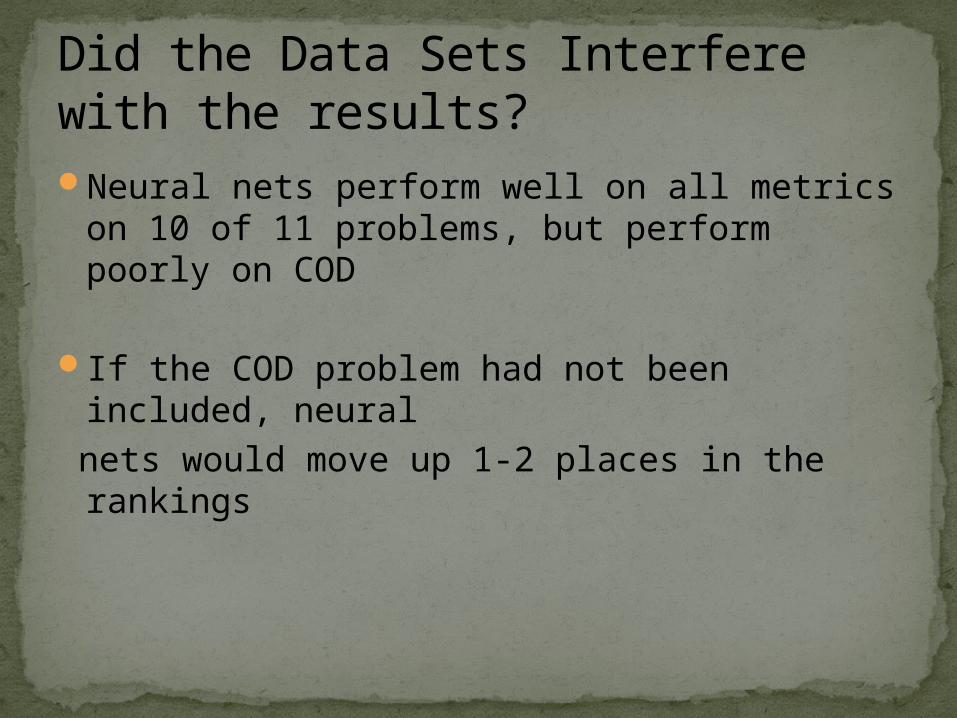
Neural nets perform well on all metrics on 10 of 11 problems, but perform poorly on COD
If the COD problem had not been included, neural
nets would move up 1-2 places in the rankings
Did the Data Sets Interfere with the results?

Bootstrap analysis
The Solution?

randomly select a bootstrap sample from the original 11 problems
randomly select a bootstrap sample of 8 metrics from the original 8 metrics
rank the ten algorithms by mean performance across the sampled problems and metrics
Repeat bootstrap sampling 1000 times, yielding 1000 potentially different rankings of the learning methods
Contd…

BST-DT RF BG-DT0
0.1
0.2
0.3
0.4
0.5
0.6
0.7
Algorithm
Algorithm
Results (algorithms that rank first)

Naïve Bayes Log reg DT0
0.1
0.2
0.3
0.4
0.5
0.6
0.7
0.8
Algorithm
Algorithm
Results (algorithms that rank last)

Model
1st 2nd 3rd 4th 5th 6th 7th 8th 9th 10th
Bst DT
.580
.228 .160 .023
.009 .0 .0 .0 .0 .0
RF .390
.525 .084 .001
.0 .0 .0 .0 .0 .0
Bag DT
.030
.232 .571 .150
.017 .0 .0 .0 .0 .0
SVM .0 .008 .148 .574
.240 .029 .001 .0 .0 .0
ANN .0 .007 .035 .230
.606 .122 .0 .0 .0 .0
KNN .0 .0 .0 .009
.114 .592 .245 .038 .002
.0
Bst stm
.0 .0 .002 .013
.014 .257 .710 .004 .0 .0
DT .0 .0 .0 .0 .0 .0 .004 .616 .291
.089
logreg
.0 .0 .0 .0 .0 .0 .040 .312 .423
.225
NB .0 .0 .0 .0 .0 .0 .0 .030 .284
.686
Results Table

The models that performed poorest were naive bayes, logistic regression, decisiontrees, and boosted stumps
bagged trees, random forests, and neural nets give the best average performance without calibration
After calibration with Platt's Method, boosted trees predict better probabilities than all other methods
But at the same time boosted stumps and logistic regression, which perform poorly on average, are the best models for some metrics
Effectiveness of an algorithm depends on the metric used and the data set.
Conclusions

The End