rice farms in the murray–darling basin - australian...
TRANSCRIPT

Rice farms in the Murray–Darling Basin Dale Ashton, Mark Oliver and Declan Norrie
Research by the Australian Bureau of Agricultural
and Resource Economics and Sciences
ABARES research report 16.2 July 2016
© Commonwealth of Australia 2016 Ownership of intellectual property rights Unless otherwise noted, copyright (and any other intellectual property rights, if any) in this publication is owned by the Commonwealth of Australia (referred to as the Commonwealth). Creative Commons licence All material in this publication is licensed under a Creative Commons Attribution 3.0 Australia Licence, except for content supplied by third parties, logos and the Commonwealth Coat of Arms.
The Creative Commons Attribution 3.0 Australia Licence is a standard form licence agreement that allows you to copy, distribute, transmit and adapt this publication provided you attribute the work. A summary of the licence terms is available from creativecommons.org/licenses/by/3.0/au/deed.en. The full licence terms are available from creativecommons.org/licenses/by/3.0/au/legalcode. Cataloguing data Ashton, D, Oliver, M & Norrie, D 2016, Rice farms in the Murray–Darling Basin, ABARES research report 16.2, Canberra, July. CC BY 3.0. ISSN 1447-8358 ISBN 978-1-74323-291-0 ABARES project 43540 Internet Rice farms in the Murray–Darling Basin is available at agriculture.gov.au/abares/publications. Contact Australian Bureau of Agricultural and Resource Economics and Sciences (ABARES) Postal address GPO Box 858 Canberra ACT 2601 Switchboard +61 2 6272 3933 Email [email protected] Web agriculture.gov.au/abares Inquiries about the licence and any use of this document should be sent to [email protected]. The Australian Government acting through the Department of Agriculture and Water Resources, represented by the Australian Bureau of Agricultural and Resource Economics and Sciences, has exercised due care and skill in preparing and compiling the information and data in this publication. Notwithstanding, the Department of Agriculture and Water Resources, its employees and its advisers disclaim all liability, including for negligence and for any loss, damage, injury, expense or cost incurred by any person as a result of accessing, using or relying on information or data in this publication, to the maximum extent permitted by law.
Acknowledgements This report uses data collected in the ABARES Murray–Darling Basin Irrigation Survey. This survey would not be possible without the cooperation and assistance of farmers and their accountants who provide information on farm operations. The 2012–13 and 2013–14 surveys were funded by the Murray–Darling Basin Authority. Earlier surveys were funded by the Department of the Environment, Water, Heritage and the Arts, the Department of Agriculture, Fisheries and Forestry and the National Water Commission. The authors acknowledge comments provided on a draft of this report by Phil Townsend and Sandra Walpole of the Murray–Darling Basin Authority. Kenton Lawson of ABARES provided the maps used in this report. The authors are also grateful for the industry insights provided by rice growers at a workshop held at Finley in New South Wales in March 2016.
Rice farms in the Murray–Darling Basin ABARES
iii
Contents Summary v
Introduction 1
1 Rice production in the Murray–Darling Basin 3
2 Farm financial performance 6
3 Water use and irrigation technology 11
4 Water trading 13
References 16
Figures Figure 1 Rice area and price indicator, Australia, 1988–89 to 2014–15 4
Figure 2 Farm cash income, rice farms, Murray–Darling Basin, 2006–07 to 2014–15 6
Figure 3 Share of cash receipts, rice farms, Murray–Darling Basin, 2006–07 to 2014–15 7
Figure 4 Proportion of receipts by enterprise type, rice farms, Murray–Darling Basin, 1983–84 to 1988–89 and 2006–07 to 2014–15 8
Figure 5 Proportion of total cash costs, rice farms, Murray–Darling Basin, 2006–07 to 2014–15 8
Figure 6 Purchases of temporary allocation water as a proportion of total cash costs, rice farms, Murray–Darling Basin, 2006–07 to 2014–15 9
Figure 7 Rate of return, rice farms, Murray–Darling Basin, 1983–84 to 1989–90 and 2006–07 to 2014–15 9
Figure 8 Farm business debt and debt servicing ratio, rice farms, Murray–Darling Basin, 2006–07 to 2013–14 10
Figure 9 Rice area harvested and general security allocation percentages, NSW Murray and Murrumbidgee regions, 2006–07 to 2013–14 11
Figure 10 Rice area and water use, rice growers, Murray–Darling Basin, 2006–07 to 2014–15 12
Figure 11 Allocation water indicator price, southern Basin, 2007 to 2014 13
Figure 12 Proportion of rice farms by allocation water trade group, Murray–Darling Basin, 2006–07 to 2013–14 14
Figure 13 Averages for selected variables by allocation water trade group, Murray–Darling Basin, 2006–07 to 2013–14 14
Figure 14 Area of crops by allocation water trade group, Murray–Darling Basin, 2006–07 to 2013–14 15
Rice farms in the Murray–Darling Basin ABARES
iv
Figure 15 Proportion of farms selling water entitlements and Australian Government purchases of entitlements, Murray–Darling Basin, 2006–07 to 2013–14 15
Maps Map 1 Reporting regions, Murray–Darling Basin 1
Map 2 Rice farm survey areas, 2006–07 to 2013–14, Murray–Darling Basin 3
Boxes Box 1 Survey methodology 2
Box 2 Water allocations and entitlements 5

Rice farms in the Murray–Darling Basin ABARES
v
Summary This report presents data from the ABARES Murray–Darling Basin Irrigation Survey from 2006–07 to 2014–15, with a focus on 2012–13 to 2014–15. ABARES provides key financial performance measures for rice-growing farms and data on water use and irrigation technology and water trading. This report focuses on rice farms in the southern Murray–Darling Basin. Almost all of Australia’s rice is produced in the southern Basin.
Rice production in the southern Basin relies on irrigation water. During periods of low water availability, rice growers usually receive lower seasonal allocations because most rice is grown by irrigators with lower reliability general security licences.
The total area planted to rice trended upwards from the late 1980s until the early 2000s. Low water availability depressed rice plantings in most years between 2002–03 and 2009–10. Improved seasonal conditions in the second half of 2009–10 increased water availability and allowed higher plantings in the following three years (2010–11 to 2012–13). In 2013–14 and 2014–15, rice areas again declined because of drier seasonal conditions.
Farm financial performance The financial performance of rice farms had two distinct phases in the survey period. During the drought-affected survey years from 2006–07 to 2009–10, rice farm incomes were relatively low. In the following period, 2010–11 to 2014–15, greater water availability and higher crop output contributed to a significant improvement in farm financial performance.
Rice farms tend to be diverse operations with income sourced from a variety of crop and livestock activities. In drier years, cropping was a major source of income for rice growers, and dryland crops became increasingly important.
As seasonal conditions and water availability improved, rice returned to being the major source of receipts for rice growers. Some rice growers have also received income from cotton crops in recent years.
Water use and irrigation technology From 2006–07 to 2009–10, temporary water allocations for rice growers were very low or zero. As a consequence, the area planted to rice declined, dryland crop areas increased and the limited available water was used on crops other than rice or on pasture for livestock production.
All rice growers in the survey used flood irrigation for rice. A small number of growers used a range of other irrigation technologies for irrigating crops other than rice.
Water trading In most years from 2006–07 to 2013–14, a majority rice growers did not buy or sell irrigation water. Those that did trade water were mostly sellers, particularly during the drier years 2007–08 to 2009–10.

Rice farms in the Murray–Darling Basin ABARES
1
Introduction ABARES has conducted surveys of irrigation farms in selected industries and regions in the Murray–Darling Basin since 2006–07. The ABARES Murray–Darling Basin Irrigation Survey (MDBIS) provides broad information on the economic performance of farm business units in the Basin’s irrigated rural sector. The Murray–Darling Basin Authority (MDBA) funded the 2012–13 and 2013–14 surveys.
The MDBA is gathering information to better understand and assess the effect of Murray–Darling Basin Plan water reforms on Basin industries and communities. ABARES irrigation farm data will assist the MDBA with its assessments.
Some changes in farm businesses occur relatively quickly in response to movements in commodity prices, farm input prices, seasonal conditions, water allocations and other factors. Other changes occur slowly because of past investment decisions, the fixed nature of many farm assets and the time it takes to realise a return on a new investment.
ABARES has prepared a series of reports based on MDBIS data for the major irrigated agricultural industries (cotton, dairy, horticulture, rice and wine grapes). This report focuses on broadacre farms that usually grow rice in the Murrumbidgee and Murray regions in the southern Murray–Darling Basin (Map 1). These regions are a subset of the regions in the CSIRO Murray–Darling Basin Sustainable Yields Project (CSIRO 2007). See Box 1 for a brief explanation of ABARES survey methodology.
ABARES provided input to an MDBA workshop held with rice growers at Finley in New South Wales in March 2016, where the survey results and other issues were discussed.
Map 1 Reporting regions, Murray–Darling Basin
Source: ABARES
Rice farms in the Murray–Darling Basin ABARES
2
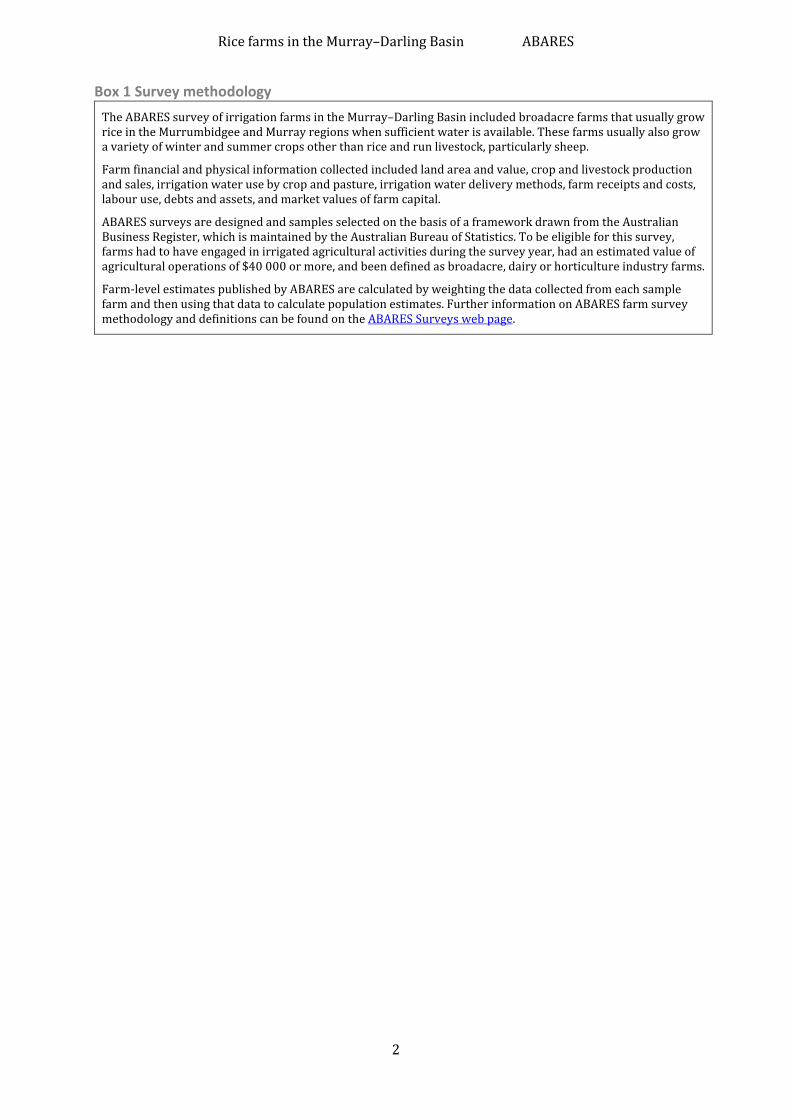
Box 1 Survey methodology The ABARES survey of irrigation farms in the Murray–Darling Basin included broadacre farms that usually grow rice in the Murrumbidgee and Murray regions when sufficient water is available. These farms usually also grow a variety of winter and summer crops other than rice and run livestock, particularly sheep.
Farm financial and physical information collected included land area and value, crop and livestock production and sales, irrigation water use by crop and pasture, irrigation water delivery methods, farm receipts and costs, labour use, debts and assets, and market values of farm capital.
ABARES surveys are designed and samples selected on the basis of a framework drawn from the Australian Business Register, which is maintained by the Australian Bureau of Statistics. To be eligible for this survey, farms had to have engaged in irrigated agricultural activities during the survey year, had an estimated value of agricultural operations of $40 000 or more, and been defined as broadacre, dairy or horticulture industry farms.
Farm-level estimates published by ABARES are calculated by weighting the data collected from each sample farm and then using that data to calculate population estimates. Further information on ABARES farm survey methodology and definitions can be found on the ABARES Surveys web page.
Rice farms in the Murray–Darling Basin ABARES
3
1 Rice production in the Murray–Darling Basin
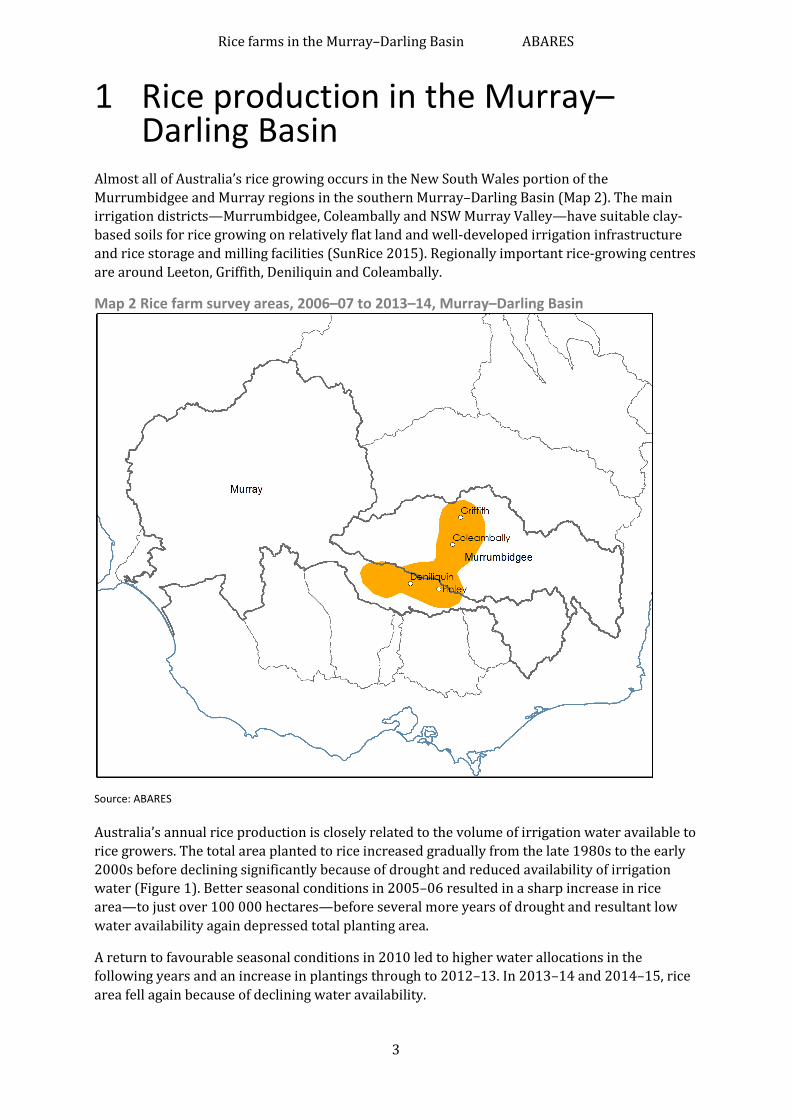
Almost all of Australia’s rice growing occurs in the New South Wales portion of the Murrumbidgee and Murray regions in the southern Murray–Darling Basin (Map 2). The main irrigation districts—Murrumbidgee, Coleambally and NSW Murray Valley—have suitable clay-based soils for rice growing on relatively flat land and well-developed irrigation infrastructure and rice storage and milling facilities (SunRice 2015). Regionally important rice-growing centres are around Leeton, Griffith, Deniliquin and Coleambally.
Map 2 Rice farm survey areas, 2006–07 to 2013–14, Murray–Darling Basin
Source: ABARES
Australia’s annual rice production is closely related to the volume of irrigation water available to rice growers. The total area planted to rice increased gradually from the late 1980s to the early 2000s before declining significantly because of drought and reduced availability of irrigation water (Figure 1). Better seasonal conditions in 2005–06 resulted in a sharp increase in rice area—to just over 100 000 hectares—before several more years of drought and resultant low water availability again depressed total planting area.
A return to favourable seasonal conditions in 2010 led to higher water allocations in the following years and an increase in plantings through to 2012–13. In 2013–14 and 2014–15, rice area fell again because of declining water availability.

Rice farms in the Murray–Darling Basin ABARES
4
Figure 1 Rice area and price indicator, Australia, 1988–89 to 2014–15
Sources: ABARES 2015a, 2015b
The main water licence held by rice growers in New South Wales is a general security licence. Because it is a lower reliability water licence, rice growers receive less water when allocations are low. Reliability is the frequency with which water allocated under a water access entitlement can be supplied in full (NSW Department of Primary Industries Water 2016). Holders of higher-reliability entitlements have priority to irrigation water over lower-reliability entitlement holders. See Box 2 for more detailed information on water rights.
The main rice types grown in Australia are Japonica types. Japonica rice is a niche commodity grown in Australia, Japan, California, China and Egypt (Ricegrowers’ Association of Australia 2012).
All rice grown in New South Wales is vested in (legally owned by) the Rice Marketing Board of New South Wales under the Rice Marketing Act 1983 (NSW). The Rice Marketing Board issues licences to approved entities—called authorised buyers—to purchase rice from growers. The granting of a licence is conditional on the rice being destined solely for the Australian domestic market (Rice Marketing Board New South Wales 2016).
Consistent with the Rice Marketing Board’s purpose, Ricegrowers Limited (trading as SunRice) has been issued with a sole licence to export rice. Sunrice is also an authorised buyer. Under a related but separate agreement with SunRice, the board has agreed that it will not issue any other export licences (Rice Marketing Board New South Wales 2013; NSW Department of Trade and Investment 2012). SunRice therefore operates as a single-desk seller of export rice from New South Wales. SunRice operates a rice pool that gives all participants a share in the returns from rice sales. Growers receive periodic payments as the pool is progressively sold.
$/t
200
400
600
'000 ha
100
200
300
1988
–89
1990
–91
1992
–93
1994
–95
1996
–97
1998
–99
2000
–01
2002
–03
2004
–05
2006
–07
2008
–09
2010
–11
2012
–13
2014
–15
Rice area ('000 ha)Price indicator ($/t)
ABARES irrigation survey commenced (2006–07)

Rice farms in the Murray–Darling Basin ABARES
5
Box 2 Water allocations and entitlements Legal rights to take and use water throughout Australia centre on related concepts, generically referred to as entitlements and allocations. Each state and territory in Australia uses different terms to describe these rights. Morey, Grinlinton and Hughes (2015) use the following definitions:
• water access entitlement—a perpetual or ongoing entitlement to exclusive access to a share of water from a specified consumptive pool as defined in the relevant water plan
• water allocation—the specific volume of water allocated to water access entitlements in a given season, defined according to rules established in the relevant water plan.
An entitlement is an ongoing legal right (sometimes called a licence) to an amount of water each year subject to water availability and any other specified conditions. An allocation, often expressed as a percentage, is the amount of water that can actually be supplied to an entitlement holder in any given year. For example, suppose an entitlement is for 10 megalitres. If the allocation percentage is 80 per cent for a particular year, then only 8 megalitres of water can be supplied to the entitlement holder in that year.
In New South Wales, water access licences are the equivalent of water access entitlements and include conveyance, general security, high security, local water utility, major utility, stock and domestic, and supplementary licences (Morey, Grinlinton &Hughes 2015).
Water is allocated in priority order according to water access licence type. Local water utility (town water supplies), major utility, and domestic and stock licence holders have highest priority. Irrigators with high security licences take priority over those with low security licences (NSW Department of Primary Industries Water 2016).
Rice farms in the Murray–Darling Basin ABARES
6
2 Farm financial performance Farm financial performance is a key driver of change in the structure of the rice-growing industry. The two main measures of farm financial performance used in this report are farm cash income and rate of return.
Farm cash income is defined as total cash receipts minus total cash costs. It is a short-term measure of the cash surplus available to a farm business for reinvestment or drawing family income after costs have been taken into account. Total cash receipts are the cash revenues received by a farm business. In most cases, sales of rice, other broadacre crops, livestock and livestock products are the largest receipt items. Other (usually minor) items include allocation water sales, contracting and government assistance payments.
Total cash costs are payments made for materials and services and for administration, crop-related expenses, interest, and permanent and casual labour. Capital and household expenses are not included in total cash costs.
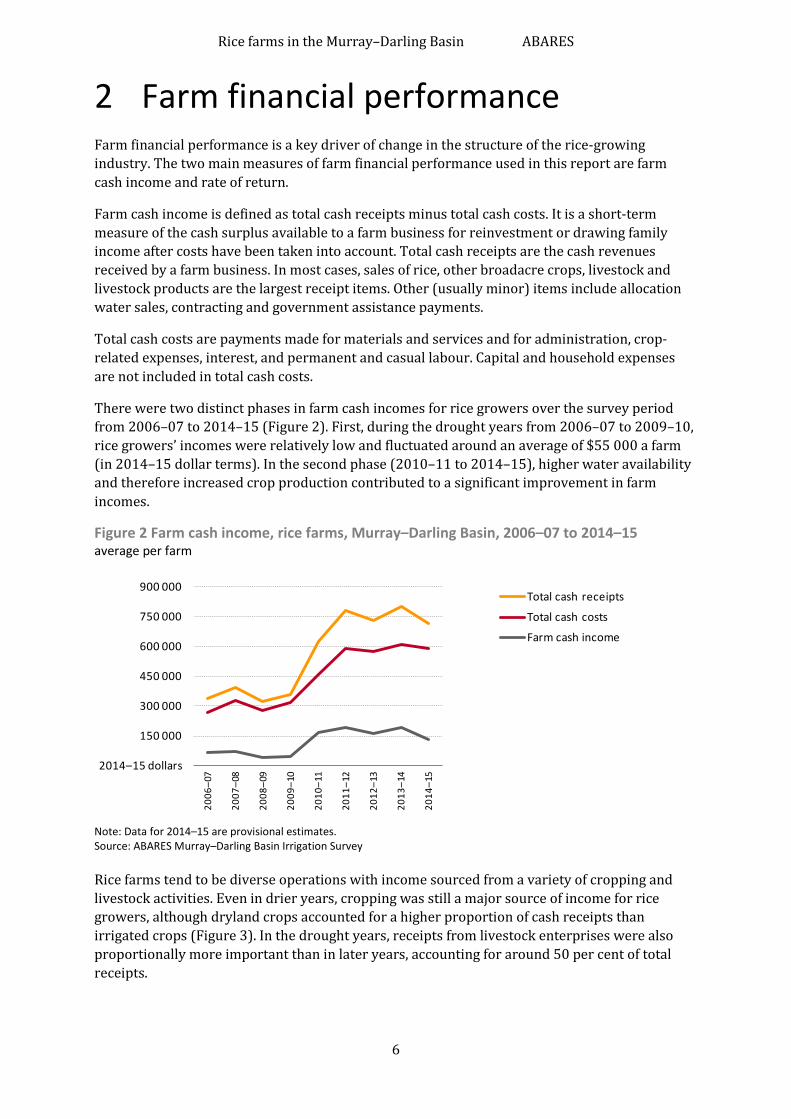
There were two distinct phases in farm cash incomes for rice growers over the survey period from 2006–07 to 2014–15 (Figure 2). First, during the drought years from 2006–07 to 2009–10, rice growers’ incomes were relatively low and fluctuated around an average of $55 000 a farm (in 2014–15 dollar terms). In the second phase (2010–11 to 2014–15), higher water availability and therefore increased crop production contributed to a significant improvement in farm incomes.
Figure 2 Farm cash income, rice farms, Murray–Darling Basin, 2006–07 to 2014–15 average per farm
Note: Data for 2014–15 are provisional estimates. Source: ABARES Murray–Darling Basin Irrigation Survey
Rice farms tend to be diverse operations with income sourced from a variety of cropping and livestock activities. Even in drier years, cropping was still a major source of income for rice growers, although dryland crops accounted for a higher proportion of cash receipts than irrigated crops (Figure 3). In the drought years, receipts from livestock enterprises were also proportionally more important than in later years, accounting for around 50 per cent of total receipts.
2014–15 dollars
150 000
300 000
450 000
600 000
750 000
900 000
2006
–07
2007
–08
2008
–09
2009
–10
2010
–11
2011
–12
2012
–13
2013
–14
2014
–15
Total cash receipts
Total cash costs
Farm cash income
Rice farms in the Murray–Darling Basin ABARES
7
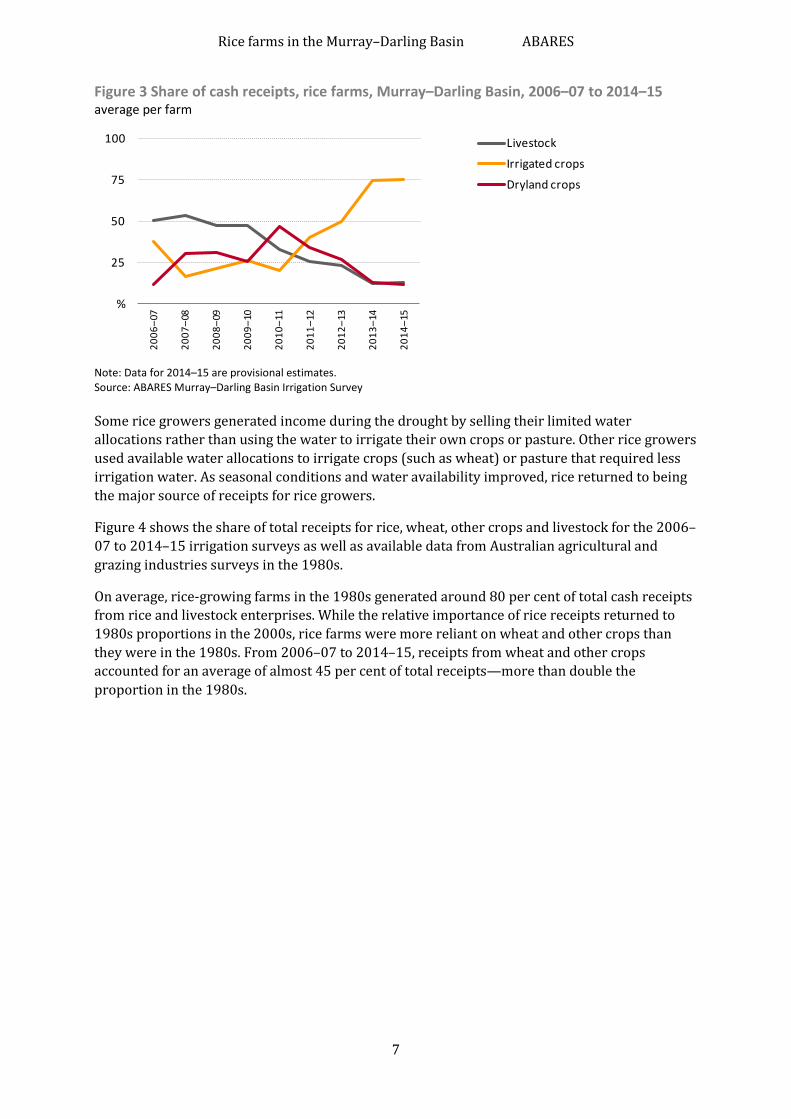
Figure 3 Share of cash receipts, rice farms, Murray–Darling Basin, 2006–07 to 2014–15 average per farm
Note: Data for 2014–15 are provisional estimates. Source: ABARES Murray–Darling Basin Irrigation Survey
Some rice growers generated income during the drought by selling their limited water allocations rather than using the water to irrigate their own crops or pasture. Other rice growers used available water allocations to irrigate crops (such as wheat) or pasture that required less irrigation water. As seasonal conditions and water availability improved, rice returned to being the major source of receipts for rice growers.
Figure 4 shows the share of total receipts for rice, wheat, other crops and livestock for the 2006–07 to 2014–15 irrigation surveys as well as available data from Australian agricultural and grazing industries surveys in the 1980s.
On average, rice-growing farms in the 1980s generated around 80 per cent of total cash receipts from rice and livestock enterprises. While the relative importance of rice receipts returned to 1980s proportions in the 2000s, rice farms were more reliant on wheat and other crops than they were in the 1980s. From 2006–07 to 2014–15, receipts from wheat and other crops accounted for an average of almost 45 per cent of total receipts—more than double the proportion in the 1980s.
%
25
50
75
10020
06–0
7
2007
–08
2008
–09
2009
–10
2010
–11
2011
–12
2012
–13
2013
–14
2014
–15
Livestock
Irrigated crops
Dryland crops

Rice farms in the Murray–Darling Basin ABARES
8
Figure 4 Proportion of receipts by enterprise type, rice farms, Murray–Darling Basin, 1983–84 to 1988–89 and 2006–07 to 2014–15 average per farm
Note: Data for 2014–15 are provisional estimates. Sources: ABARES Murray–Darling Basin Irrigation Survey; ABARES Australian Agricultural and Grazing Industries Survey
Farm cash incomes of rice growers are also affected by changes in total cash costs. Many rice farm costs are directly related to cropping activities and therefore tend to change in proportion to changes in cropping areas. When averaged over all survey years, four of these types of costs (fertiliser, fuel, repairs and maintenance, and chemicals) were among the top five cash costs incurred on rice farms (Figure 5). Purchases of temporary allocation water averaged 8 per cent of total costs over the same period, with a range of 5 per cent in 2010–11 to 12 per cent in 2013–14 (Figure 6).
Figure 5 Proportion of total cash costs, rice farms, Murray–Darling Basin, 2006–07 to 2014–15 average per farm
Note: Data for 2014–15 are provisional estimates. Source: ABARES Murray–Darling Basin Irrigation Survey
Rice Wheat Other crops Livestock
%
20
40
60
80
%
20
40
60
80
1983
–84
1984
–85
1985
–86
1986
–87
1988
–89
2006
–07
2007
–08
2008
–09
2009
–10
2010
–11
2011
–12
2012
–13
2013
–14
2014
–15
1983
–84
1984
–85
1985
–86
1986
–87
1988
–89
2006
–07
2007
–08
2008
–09
2009
–10
2010
–11
2011
–12
2012
–13
2013
–14
2014
–15
1983
–84
1984
–85
1985
–86
1986
–87
1988
–89
2006
–07
2007
–08
2008
–09
2009
–10
2010
–11
2011
–12
2012
–13
2013
–14
2014
–15
1983
–84
1984
–85
1985
–86
1986
–87
1988
–89
2006
–07
2007
–08
2008
–09
2009
–10
2010
–11
2011
–12
2012
–13
2013
–14
2014
–15
% 3 6 9 12 15
SeedElectricity
FreightHired labour
ContractsWater
ChemicalsRepairs and maintenance
FuelInterest
Fertiliser

Rice farms in the Murray–Darling Basin ABARES
9
Figure 6 Purchases of temporary allocation water as a proportion of total cash costs, rice farms, Murray–Darling Basin, 2006–07 to 2014–15 average per farm
Note: Data for 2014–15 are provisional estimates. Source: ABARES Murray–Darling Basin Irrigation Survey
Figure 7 shows the average annual rate of return to capital (excluding capital appreciation) for rice farms. Rate of return is a measure of the annual profit generated by a business, expressed as a percentage of the value of the capital used to generate that profit. Because it is expressed as a ratio, the rate of return for rice farms can be compared with the rate of return for other farm types or other potential investments. For example, the average rate of return for broadacre farms in both 2013–14 and 2014–15 was 1.4 per cent (Martin 2016).
The average rate of return from 1983–84 to 1989–90 was 2.2 per cent, with a range of 0.5 per cent to 4.9 per cent. The comparable figures for the current survey period (2006–07 to 2014–15) were an average of 1.3 per cent and a range of –0.6 per cent to 3.1 per cent. Returns were mostly negative during the drought years (2006–07 to 2009–10). From 2010–11 to 2014–15, the average rate of return was significantly higher than in the early part of the 1980s, fluctuating around an average of 2.9 per cent.
Figure 7 Rate of return, rice farms, Murray–Darling Basin, 1983–84 to 1989–90 and 2006–07 to 2014–15 average per farm
Notes: Data for 2014–15 are provisional estimates. Rate of return does not include capital appreciation. Sources: ABARES Murray–Darling Basin Irrigation Survey; ABARES Australian Agricultural and Grazing Industries Survey
%
5
10
1520
06–0
7
2007
–08
2008
–09
2009
–10
2010
–11
2011
–12
2012
–13
2013
–14
2014
–15
- 1
1
2
3
4
5
1983
–84
1984
–85
1985
–86
1986
–87
1987
–88
1988
–89
1989
–90
2006
–07
2007
–08
2008
–09
2009
–10
2010
–11
2011
–12
2012
–13
2013
–14
2014
–15
%

Rice farms in the Murray–Darling Basin ABARES
10
Average farm business debt for rice growers in the Murray–Darling Basin mostly increased in real terms over the survey period (Figure 8). Most of this increase was associated with working capital to plant larger crop areas as seasonal conditions and water availability improved.
The ability of farm businesses to service debts from their revenue streams is an important aspect of farm viability. The debt servicing ratio is the ratio of interest payments to total farm cash receipts. Despite the increase in average farm business debt, the average debt servicing ratio for rice growers declined from 2008–09 to 2014–15 (Figure 8). This decline resulted from a combination of falling interest rates and total cash receipts increasing proportionally more than interest costs.
Figure 8 Farm business debt and debt servicing ratio, rice farms, Murray–Darling Basin, 2006–07 to 2013–14 average per farm
Note: Farm business debt is at 30 June. Debt data are not available for 2012–13. Source: ABARES Murray–Darling Basin Irrigation Survey
%
4
8
12
16
2014–15 dollars
300 000
600 000
900 000
1200 000
2006
–07
2007
–08
2008
–09
2009
–10
2010
–11
2011
–12
2013
–14
Farm debt ($)
Debt servicing ratio (%)
Rice farms in the Murray–Darling Basin ABARES
11
3 Water use and irrigation technology Rice growers make decisions each season about the areas of rice and other annual crops to be planted based on the availability of irrigation water (allocations), the price of water on the temporary market, expected crop prices and other factors. For rice, water availability is a key determinant of planting area.
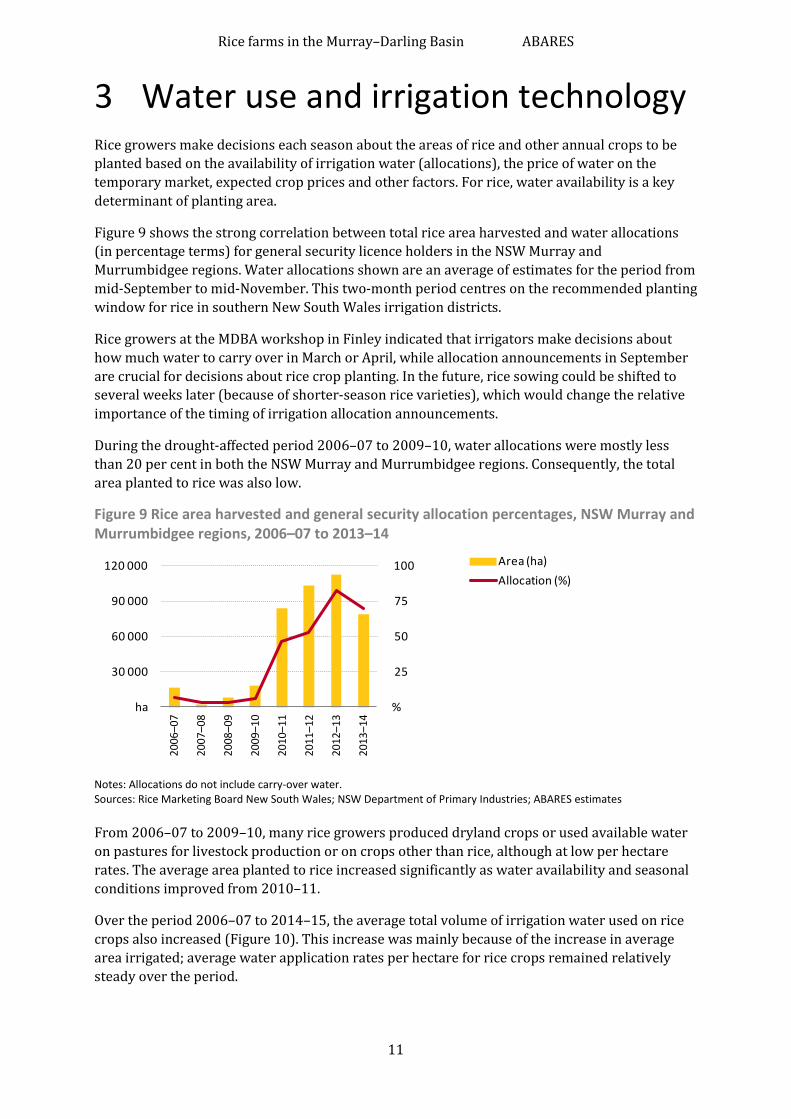
Figure 9 shows the strong correlation between total rice area harvested and water allocations (in percentage terms) for general security licence holders in the NSW Murray and Murrumbidgee regions. Water allocations shown are an average of estimates for the period from mid-September to mid-November. This two-month period centres on the recommended planting window for rice in southern New South Wales irrigation districts.
Rice growers at the MDBA workshop in Finley indicated that irrigators make decisions about how much water to carry over in March or April, while allocation announcements in September are crucial for decisions about rice crop planting. In the future, rice sowing could be shifted to several weeks later (because of shorter-season rice varieties), which would change the relative importance of the timing of irrigation allocation announcements.
During the drought-affected period 2006–07 to 2009–10, water allocations were mostly less than 20 per cent in both the NSW Murray and Murrumbidgee regions. Consequently, the total area planted to rice was also low.
Figure 9 Rice area harvested and general security allocation percentages, NSW Murray and Murrumbidgee regions, 2006–07 to 2013–14
Notes: Allocations do not include carry-over water. Sources: Rice Marketing Board New South Wales; NSW Department of Primary Industries; ABARES estimates
From 2006–07 to 2009–10, many rice growers produced dryland crops or used available water on pastures for livestock production or on crops other than rice, although at low per hectare rates. The average area planted to rice increased significantly as water availability and seasonal conditions improved from 2010–11.
Over the period 2006–07 to 2014–15, the average total volume of irrigation water used on rice crops also increased (Figure 10). This increase was mainly because of the increase in average area irrigated; average water application rates per hectare for rice crops remained relatively steady over the period.
%
25
50
75
100
ha
30 000
60 000
90 000
120 000
2006
–07
2007
–08
2008
–09
2009
–10
2010
–11
2011
–12
2012
–13
2013
–14
Area (ha)Allocation (%)

Rice farms in the Murray–Darling Basin ABARES
12
Figure 10 Rice area and water use, rice growers, Murray–Darling Basin, 2006–07 to 2014–15 average per farm
Note: Data for 2014–15 are provisional estimates. Source: ABARES Murray–Darling Basin Irrigation Survey
Rice growers have limited opportunities to change irrigation methods because of the need to apply large volumes of water to rice crops at high flow rates. For example, the recommended flow rate into a four-hectare rice bay should be at least 16 megalitres a day (Dunn et al. 2015). Consequently, all rice growers in the survey used flood irrigation for rice.
ML/ha or ha
25
50
75
100
ML
600
1 200
1 800
2 40020
06–0
7
2007
–08
2008
–09
2009
–10
2010
–11
2011
–12
2012
–13
2013
–14
2014
–15
Rice area (ha)
Water applicationrate (ML/ha)
Water use (ML)

Rice farms in the Murray–Darling Basin ABARES
13
4 Water trading The Murray–Darling Basin, particularly the southern Basin, is Australia’s main water market. In 2012–13 the Basin accounted for around 94 per cent of the total volume of permanent entitlement and allocation trade in Australia (National Water Commission 2014). The southern Basin contains several hydrologically connected water systems that cross the borders of New South Wales, Victoria and South Australia. With around 80 per cent of the Basin’s total water storage capacity and a mature market for interstate trading, the southern Basin accounts for more than 80 per cent of total Basin water trading (BOM 2011; National Water Commission 2014).
The indicator price for allocation water in the southern connected Murray–Darling Basin fell from around $925 a megalitre in 2007 to around $25 a megalitre in 2011 (Morey, Grinlinton & Hughes 2015). Prices thereafter gradually increased to around $130 a megalitre in 2014 as water availability declined (Figure 11). Factors affecting supply and demand in water markets include weather conditions (particularly rainfall amount and distribution), prices for irrigated commodities, physical and hydrological constraints to water supplies, and jurisdictional water policies and water market administration (National Water Commission 2014).
Figure 11 Allocation water indicator price, southern Basin, 2007 to 2014
Note: Prices are as at December each year. Source: Morey, Grinlinton & Hughes 2015
In most years of the survey period, a majority of rice growers did not trade allocation water (either buying or selling water) (Figure 12). Of those that did trade water, there were more net sellers than buyers. From 2006–07 to 2013–14, the average proportions of buyers, sellers and non-traders were 14 per cent, 27 per cent and 59 per cent, respectively.
$/ML
200
400
600
800
1 000
2007 2008 2009 2010 2011 2012 2013 2014

Rice farms in the Murray–Darling Basin ABARES
14
Figure 12 Proportion of rice farms by allocation water trade group, Murray–Darling Basin, 2006–07 to 2013–14 proportion of farms
Note: Net buyers/sellers are farms that bought/sold more water than they sold/bought. Data are not available for 2013–14. Source: ABARES Murray–Darling Basin Irrigation Survey
Selected variables for the three trade groups are shown in Figure 13. Over the period 2006–07 to 2013–14, net buyers irrigated larger average areas and held higher-volume water licences than both net sellers and non-traders. The average equity ratio was slightly lower for net buyers than for the other two groups, while the average rate of return (excluding capital appreciation) for net buyers was between the rates recorded by net sellers and non-traders.
The net sellers group recorded the highest average rate of return over the period 2006–07 to 2013–14 at 1.7 per cent. This group also had the least year-to-year variation in average rate of return. Both net buyers and non-sellers reported much higher yearly variations. The net buyers group recorded both the highest (4.7 per cent) and lowest (–1.7 per cent) rates of return over the survey period.
Figure 13 Averages for selected variables by allocation water trade group, Murray–Darling Basin, 2006–07 to 2013–14 average per farm
Note: Net buyers/sellers are farms that bought/sold more water than they sold/bought. Source: ABARES Murray–Darling Basin Irrigation Survey
Net buyers of water tended to grow larger areas of both irrigated and dryland crops than net sellers (Figure 14). Consequently, net buyers had higher crop receipts, and net sellers had higher receipts from the sale of water allocations.
%
25
50
75
100
2006
–07
2007
–08
2008
–09
2009
–10
2010
–11
2011
–12
2013
–14
2006
–07
2007
–08
2008
–09
2009
–10
2010
–11
2011
–12
2013
–14
2006
–07
2007
–08
2008
–09
2009
–10
2010
–11
2011
–12
2013
–14
Net buyers Net sellers Non-traders
ha 100 200 300 400
Net buyer
Net seller
Non-trader
Irrigated area
ML 1 000 2 000 3 000 4 000
Licence volume
% 25 50 75 100
Equity ratio
% 1 2 3 4
Rate of return

Rice farms in the Murray–Darling Basin ABARES
15
Figure 14 Area of crops by allocation water trade group, Murray–Darling Basin, 2006–07 to 2013–14 average per farm
i Irrigated. d Dryland. Note: Net buyers/sellers are farms that bought/sold more water than they sold/bought. Source: ABARES Murray–Darling Basin Irrigation Survey
In addition to the allocation water market, the market for permanent access water entitlements has also provided rice growers with a tool for managing their farm businesses. On average, around 3 per cent of rice growers sold part or all of their entitlements in each year of the survey period, ranging from a low of less than 1 per cent in 2006–07 to more than 8 per cent in 2009–10 (Figure 15). The yearly proportion of farms selling followed a similar trend in Australian Government purchases of general security water licences in the NSW Murray and Murrumbidgee regions.
Figure 15 Proportion of farms selling water entitlements and Australian Government purchases of entitlements, Murray–Darling Basin, 2006–07 to 2013–14
Note: Data on selling are not available for 2013–14. Data for 2014–15 are provisional estimates. The Australian Government made no water purchases in 2006–07. Source: ABARES Murray–Darling Basin Irrigation Survey
Whe
at
i
Whe
at d
Oat
s/ba
rley
Rice
Cano
la
Hay/
luce
rne
Lupi
ns/f
ield
peas
Net buyers
Net sellers
Non-traders
150
150
ha
ha
ha
150
i d
%
2
4
6
8
10
ML
30 000
60 000
90 000
120 000
150 000
2006
–07
2007
–08
2008
–09
2009
–10
2010
–11
2011
–12
2012
–13
2013
–14
Proportion selling (%)
Government purchases (ML)
Rice farms in the Murray–Darling Basin ABARES
16
References Unless otherwise indicated, ABARES publications listed here are available at agriculture.gov.au/abares/publications.
ABARES 2015a, Agricultural commodities: December quarter 2015, Australian Bureau of Agricultural and Resource Economics and Sciences, Canberra.
—— 2015b, Agricultural commodity statistics 2015, Australian Bureau of Agricultural and Resource Economics and Sciences, Canberra.
BOM 2011, National Water Account 2011, Bureau of Meteorology, Melbourne, available at bom.gov.au/water/nwa/2011.
CSIRO 2007, ‘The Murray–Darling Basin Sustainable Yields Project’, Canberra, clw.csiro.au/publications/waterforahealthycountry/mdbsy.
Dunn, B, Fowler, J, North, S, Smith, A, Hoogers, R, Snell, P, Ovendon, B, Taylor, M, Stevens, M, Watson, A, Whitlock, A, Hedditch, M, Ford, R, Troldahl, D, Plunkett, G, Mauger, T, Garnett, L, Lacy, J & Lewin, L 2015, Rice growing guide 2015–16, NSW Department of Primary Industries, available at dpi.nsw.gov.au/rice-growing-guide-2015-16.
Martin, P 2016, ‘Farm performance: broadacre and dairy farms, 2013–14 to 2015–16’, in Agricultural commodities: March quarter 2016, vol. 6, no. 1, pp. 168–214, Australian Bureau of Agricultural and Resource Economics and Sciences, Canberra.
Morey, K, Grinlinton, M & Hughes, N 2015, Australian water markets report 2013–14, ABARES report prepared for the Department of Agriculture and Water Resources, Canberra.
National Water Commission 2014, Australian water markets: trends and drivers 2007–08 to 2012–13, National Water Commission, Canberra, available at nwc.gov.au/Australian water markets trends and drivers 2007-08 to 2012-13.
NSW Department of Primary Industries Water, How water is allocated, NSW Department of Primary Industries Water, available at water.nsw.gov.au/how water is allocated.
NSW Department of Trade and Investment 2012, Review of rice vesting by the Rice Marketing Board under the NSW Rice Marketing Act 1983, report prepared for the NSW Minister for Primary Industries, the Hon. Katrina Hodgkinson MP, NSW Department of Trade and Investment, available at rmbnsw.org.au/review of rice vesting.
Ricegrowers’ Association of Australia 2012, Submission to the review of rice vesting proclamation (NSW Rice Marketing Act 1983), Ricegrowers’ Association of Australia, August, available at rga.org.au/rice vesting review.
Rice Marketing Board New South Wales 2016, Application package for authorised buyer’s licence, Rice Marketing Board New South Wales, available at rmbnsw.org.au/application package.
—— 2015, Statistical summary, Rice Marketing Board New South Wales, available at rmbnsw.org.au/statistical-summary.
—— 2013, Report to NSW rice growers, Rice Marketing Board New South Wales, June, available at rga.org.au/report to rice growers.

Rice farms in the Murray–Darling Basin ABARES
17
SunRice 2015, The rice growing and production process, fact sheet, available at sunrice.com.au/rice_growing_production_process.