rhode island infrastructure bank decisional 2 … · we have audited the accompanying financial...
TRANSCRIPT

RHODE ISLAND INFRASTRUCTURE BANK
A Component Unit of the State of Rhode Island and Providence Plantations
Basic Financial Report June 30, 2019

Table of Contents
Independent auditor’s report ............................................................................................................ 1 - 3 Management’s discussion and analysis (unaudited) ....................................................................... 4 - 9 Financial statements Statements of net position ................................................................................................................10 Statements of revenues, expenses and changes in net position .....................................................11 Statements of cash flows .................................................................................................................12 Notes to financial statements ................................................................................................... 13 - 38 Supplementary information Combining schedules of net position ....................................................................................... 39 - 40 Combining schedules of revenues, expenses and changes in net position ............................ 41 - 42 Schedule of Municipal Road and Bridge Revolving Fund - by borrower .........................................43 State supplementary schedules ............................................................................................... 44 - 50

1
Independent Auditors’ Report
To the Board of Directors Rhode Island Infrastructure Bank Providence, Rhode Island
Report on the Financial Statements
We have audited the accompanying financial statements of the Rhode Island Infrastructure Bank (the Bank), a component unit of the State of Rhode Island, as of and for the year ended June 30, 2019, and the related notes to the financial statements, which collectively comprise the Rhode Island Infrastructure Bank’s basic financial statements as listed in the table of contents.
Management’s Responsibility for the Financial Statements
Management is responsible for the preparation and fair presentation of these financial statements in accordance with accounting principles generally accepted in the United States of America; this includes the design, implementation and maintenance of internal control relevant to the preparation and fair presentation of financial statements that are free from material misstatement, whether due to fraud or error.
Auditors’ Responsibility
Our responsibility is to express opinions on these financial statements based on our audit. We conducted our audit in accordance with auditing standards generally accepted in the United States of America and the standards applicable to financial audits contained in Government Auditing Standards, issued by the Comptroller General of the United States. Those standards require that we plan and perform the audit to obtain reasonable assurance about whether the financial statements are free from material misstatement.
An audit involves performing procedures to obtain audit evidence about the amounts and disclosures in the financial statements. The procedures selected depend on the auditors’ judgment, including the assessment of the risks of material misstatement of the financial statements, whether due to fraud or error. In making those risk assessments, the auditors consider internal control relevant to the entity’s preparation and fair presentation of the financial statements in order to design audit procedures that are appropriate in the circumstances, but not for the purpose of expressing an opinion on the effectiveness of the entity’s internal control. Accordingly, we express no such opinion. An audit also includes evaluating the appropriateness of accounting policies used and the reasonableness of significant accounting estimates made by management, as well as evaluating the overall presentation of the financial statements.
We believe that the audit evidence we have obtained is sufficient and appropriate to provide a basis for our audit opinions.

2
Opinions
In our opinion, the financial statements referred to above present fairly, in all material respects, the respective financial position of the Rhode Island Infrastructure Bank as of June 30, 2019 and the respective changes in financial position and cash flows thereof for the year then ended in accordance with accounting principles generally accepted in the United States of America.
Prior Year Financial Statements
The financial statements of the Rhode Island Infrastructure Bank as of June 30, 2018 were audited by other auditors whose opinion dated September 26, 2018 expressed an unmodified opinion on those statements.
Other Matters
Required Supplementary Information
Accounting principles generally accepted in the United States of America require that the management’s discussion and analysis on pages 4-9 be presented to supplement the basic financial statements. Such information, although not a part of the basic financial statements, is required by the Governmental Accounting Standards Board, who considers it to be an essential part of financial reporting for placing the basic financial statements in an appropriate operational, economic or historical context. We have applied certain limited procedures to the required supplementary information in accordance with auditing standards generally accepted in the United States of America, which consisted of inquiries of management about the methods of preparing the information and comparing the information for consistency with management’s responses to our inquiries, the basic financial statements and other knowledge we obtained during our audit of the basic financial statements. We do not express an opinion or provide any assurance on the information because the limited procedures do not provide us with sufficient evidence to express an opinion or provide any assurance.
Other Information
Our audit was conducted for the purpose of forming opinions on the financial statements that collectively comprise the Rhode Island Infrastructure Bank’s basic financial statements. The supplementary information contained on pages 39-50 is presented for purposes of additional analysis and is not a required part of the basic financial statements.
The supplementary information for the year ended June 30, 2019 is the responsibility of management and was derived from and relates directly to the underlying accounting and other records used to prepare the basic financial statements. Such information has been subjected to the auditing procedures applied in the audit of the basic financial statements and certain additional procedures, including comparing and reconciling such information directly to the underlying accounting and other records used to prepare the basic financial statements or to the basic financial statements themselves, and other additional procedures in accordance with auditing standards generally accepted in the United States of America. In our opinion, the supplementary information schedules for the year ended June 30, 2019 are fairly stated, in all material respects, in relation to the basic financial statements as a whole.
The supplementary information schedules for the year ended June 30, 2018, which are the responsibility of management, were included in the prior period financial statements audited by other auditors who stated such information was fairly stated, in all material respects, in relation to the 2018 basic financial statements as a whole.

3
Other Reporting Required by Government Auditing Standards
In accordance with Government Auditing Standards, we have also issued our report dated September 20, 2019 on our consideration of the Rhode Island Infrastructure Bank’s internal control over financial reporting and on our tests of its compliance with certain provisions of laws, regulations, contracts and grant agreements and other matters. The purpose of that report is solely to describe the scope of our testing of internal control over financial reporting and compliance and the results of that testing, and not to provide an opinion on the effectiveness of Rhode Island Infrastructure Bank’s internal control over financial reporting or on compliance. That report is an integral part of an audit performed in accordance with Government Auditing Standards in considering the Rhode Island Infrastructure Bank’s internal control over financial reporting and compliance.
Cranston, Rhode Island September 20, 2019

Management’s Discussion and Analysis
4
INTRODUCTION The following is Management’s discussion and analysis of the financial condition and results of operations of Rhode Island Infrastructure Bank (the “Bank”) as of June 30, 2019. This discussion should be read in conjunction with the Bank’s Financial Report including the companion Notes to financial statements for the fiscal years ending June 30, 2019 and June 30, 2018. As outlined in greater detail in the financial statements, the Bank was established in 1989 as a quasi-public corporation. The Bank is governed by a Board of Directors consisting of five members, four of whom are members of the public appointed by the Governor, with the advice and consent of the State Senate. The Rhode Island State General Treasurer, or such officer’s designee, who shall be a subordinate within the General Treasurer’s department, serves as an ex-officio member. Consistent with the Bank’s mission of serving as Rhode Island’s central hub for financing infrastructure improvements for municipalities, businesses, and homeowners, the Board and Management are focused on delivering innovative financing for an array of infrastructure-based projects. In addition to the Bank’s legacy clean water (and its companion residential-based lending for the community septic system loan program and the sewer tie-in loan fund), drinking water, and municipal road and bridge programs, the Bank also supports energy efficiency and renewable energy, brownfield remediation and water quality protection financing. Together, these programs improve the State’s infrastructure, create jobs, promote economic development and enhance the environment. OVERVIEW OF THE FINANCIAL STATEMENTS As noted above, Management’s discussion and analysis is intended to serve as an introduction to the Bank’s financial statements. The Bank’s three financial statements include:
1. Statement of Net Position: The statement of net position presents information on the Bank’s assets (plus deferred outflows) and liabilities (plus deferred inflows), with the difference between the two amounts as net position. Over time, increases or decreases in the Bank’s net position can serve as a broad indicator of whether the financial position of the Bank is improving or deteriorating.
2. Statement of Revenues, Expenses and Changes in Net Position: This statement presents the Bank’s
operating revenues and expenses, nonoperating revenues and expenses, and changes in net position for the fiscal year.
3. Statement of Cash Flows: The Bank’s statement of cash flows is presented on the direct method of
reporting, which reflects cash flows from operating activities, capital and related financing, non-capital financing activities, and investing activities.
Consistent with the flow of financial resources measurement focus (which considers whether the financial resources obtained during the accounting period are enough to cover all claims during the same period) and the accrual basis of accounting for governmental agencies, all assets and liabilities and changes in net position are reported upon the occurrence of the underlying event giving rise to that asset or liability and resulting change in net position regardless of the timing of when the cash is received or paid. Consequently, certain revenues and expenses reported in the statement of revenues, expenses and changes in net position will result in cash flows in future periods.

Management’s Discussion and Analysis
5
FINANCIAL HIGHLIGHTS Statement of Net Position – Condensed 2019 2018 2017 Current assets $ 486,813,954 $ 465,005,699 $ 438,464,582 Noncurrent assets 1,252,646,608 1,201,190,665 1,212,284,770 Total assets 1,739,460,562 1,666,196,364 1,650,749,352
Deferred outflows of resources (a) 5,378,818 6,489,463 8,086,130 Current liabilities 255,931,433 247,018,749 248,943,343 Non-current liabilities 776,046,506 771,214,463 796,553,519 Total liabilities 1,031,977,939 1,018,233,212 1,045,496,862
Deferred inflows of resources (a) 734,416 716,253 996,065
Net investment in capital assets 269,647 384,721 294,011 Restricted for program purposes 662,135,008 603,540,701 558,830,618 Unrestricted 49,722,370 49,810,940 53,217,926 Total net position $ 712,127,025 $ 653,736,362 $ 612,342,555
(a) In conjunction with refunding certain above-market rate bonds, the difference between the
reacquisition price and the net carrying amount of the refunded bond(s) is(are) recorded as an amount deferred on refunding – either as an outflow or inflow. Please see Note 1, “Summary of Significant Accounting Policies” for more information.
Statement of Net Position – as of fiscal period ended June 30, 2019 and June 30, 2018
Total assets for the period ending June 30, 2019 amounted to $1.739 billion, an increase of $73.3 million, or 4.4%, from the previous year end when total assets amounted to $1.666 billion. The main driver in the increase was growth in loans outstanding, which increased $58.0 million in 2019.
Total investments amounted to $84.3 million, up $8.4 million from $75.9 million at the end of the
previous period. The market continued to present significant challenges for fixed income investors, especially in the second half of the fiscal year when the market rallied sending yields lower and the curve inverted. Against that backdrop, Management was able to selectively enter the market to make strategic purchases that provided yield enhancements above overnight funds.
Loan originations amounted to a robust $149.1 million in fiscal year 2019 up from $79.3 million in
the prior year (excluding C-PACE loans of $2.6 million and $1.7 million in 2019 and 2018, respectively). Originations were well dispersed across all our lending programs. Net of return of principal on existing loans, which equaled $86.6 million, loans outstanding increased 4.5% from $1.286 billion at June 30, 2018 to $1.344 billion at June 30, 2019.
Net investment in capital assets decreased to $269,647 from $384,721 at June 30, 2018, a net
decline of 30%, as depreciation amounted to $141,377 and new capital assets were a modest $26,301 during 2019.
In response to the increase in loan originations described above, project costs payable (which are
committed loan proceeds that have yet to be disbursed and shown in current liabilities) increased $24.3 million and amounted to $176.5 million at June 30, 2019 compared to $152.2 million at the prior year-end.

Management’s Discussion and Analysis
6
Bonds payable amounted to $846.0 million at year-end 2019, an increase of $12.9 million from $833.1 million at the prior year-end. The modest increase, compared to loan originations, emanates from our strategically conserving capital in anticipation of greater loan demand, some of which did not materialize as anticipated as one of our borrowers utilized the Environmental Protection Agency’s (EPA) new Water Infrastructure Finance and Innovation Act (WIFIA) program to fund the initial stages of a significant infrastructure project. Combining existing sources of capital with $10 million in available State Water Pollution Abatement funds, we met 2019 clean water loan demand of $51.1 million without issuing bonds.
With the inaugural Efficient Buildings Fund (EBF) bond issue of $18.3 million and other program
capital, the Bank paid down $23.3 million in bond anticipation notes (BANs) that were outstanding at year-end June 30, 2018.
In conjunction with the EBF bond issue, the Bank terminated the interest rate cap hedging
transaction that was purchased in 2017 to limit the Bank’s exposure to an increase in long-term interest rates during the time the BANs were outstanding. The net proceeds of unwinding the interest rate cap transaction amounted to $1.2 million. These proceeds were utilized by the Bank to increase EBF program capital and served to offset interest expense resulting from an increase in interest rates.
In addition, late in the fiscal year the Bank refinanced approximately $10.2 million of Drinking Water
State Revolving Fund bonds as part of a strategic effort to take advantage of low interest rates and provide financial savings to borrowers. Over the last five years, the Bank has provided $25 million in savings to borrowers by refinancing existing debt at lower interest rates.
As a result of a required $4.0 million transfer to the State, unrestricted net position was essentially
unchanged from the prior year and amounted to $49.7 million. The prior fiscal year also contained a $3.5 million transfer to the State. As noted in the Bank’s Financial Report (see Subsequent Events), the Bank is obligated to transfer another $4.0 million to the State by June 30, 2020.
Overall, the Bank’s financial position improved in 2019 as the total net position amounted to $712.1
million at fiscal year-end 2019, an increase of $58.4 million compared to $653.7 million at June 30, 2018. For the fiscal year-end 2018, the net position increased $41.4 million from fiscal year 2017, which amounted to $612.3 million, and as noted above amounted to $653.7 million at the end of fiscal year 2018. The increase was substantially related to non-operating grant income which is the capital used for certain lending programs.

Management’s Discussion and Analysis
7
Statement of Revenues, Expenses and Changes in Net Position – Condensed
2019 2018 2017 Interest income – loans $ 24,640,810 $ 24,698,553 $ 23,595,347 Interest income – investments 9,084,762 5,493,509 1,893,511 Other operating income 6,996,449 6,286,730 6,309,227 Grant income – operating 2,582,228 2,471,194 2,593,311 Total operating revenues 43,304,249 38,949,986 34,391,396
Interest expense 22,244,946 22,915,654 21,812,018
Other operating expenses: Principal forgiveness 2,133,647 1,909,903 1,546,296 Consulting fees to partner agencies 4,118,416 2,121,685 3,410,220 General administrative 3,608,355 3,244,014 3,568,234 Professional fees 1,150,832 1,150,249 582,430 Total operating expenses 33,256,196 31,341,505 30,919,198
Operating income 10,048,053 7,608,481 3,472,198
Grant income – non-operating 52,342,610 37,285,326 21,093,042
Less; intergovernmental transactions 4,000,000 3,500,000 -
Change in net position 58,390,663 41,393,807 24,565,240
Net position, beginning of year 653,736,362 612,342,555 587,777,315
Net position, end of year $ 712,127,025 $ 653,736,362 $ 612,342,555 Statement of Revenues, Expenses and Changes in Net Position – for the fiscal years ending June 30, 2019 and June 30, 2018
The Bank’s operating revenues amounted to $43.3 million for 2019, an increase of $4.4 million, or 11%, from $38.9 million for 2018. As noted below, investment income was the main driver for the increase. While interest income on loans was essentially unchanged from the prior year, other operating income, which consists of loan origination and servicing fees, increased $709,719 and amounted to $7.0 million in fiscal year 2019 compared to $6.3 million a year earlier.
Owing to generally higher yields on the short-end of the curve (the Fed made four 25 basis point
tightening moves in calendar year 2018), together with our continued execution of a more rigorous investment strategy meant to better match the duration of investments to the expected duration of disbursements, investment income increased by $3.6 million in 2019 and amounted to $9.1 million compared to $5.5 million in 2018.
Grant income – operating, which represents drinking water capital grant drawdowns from EPA for
further payment to the partner agency for their oversight of the program, increased $111,034 in 2019 and amounted to $2.6 million in fiscal year 2019.
Interest expense, net of premium amortization, decreased $670,708 and amounted to $22.2 million
compared to $22.9 million in the prior year. The decrease was attributed to both lower average bonds outstanding (of approximately $6 million) and the benefit from prior refundings.
Principal forgiveness increased $224,000 as capital grants from EPA (which have a principal
forgiveness component) increased appreciably in 2018.

Management’s Discussion and Analysis
8
Consulting fees to partner agencies increased $2.0 million and amounted to $4.1 million compared to $2.1 in 2018. Most of the increase was related to a $1.7 million drawdown from EPA made in the prior year and paid in fiscal year 2019.
The Banks general administrative expenses increased $364,341 and amounted to $3.6 million
compared to $3.2 million in the prior fiscal year. Reflecting increased staffing to support the Bank’s expanded mission, compensation and benefit expense represented roughly half of the increase in fiscal year 2019.
Professional fees amounted to $1.2 million in 2019, essentially unchanged from the prior year.
Grant income – non-operating amounted to $52.3 million in 2019 compared to $37.3 million for the
prior fiscal year. Capital grant drawdowns from EPA are recorded under this caption and make up most of such income. In addition to an increase in capitalization grants received from EPA, the Bank also received $10 million in State Water Pollution Abatement funds and $12.5 million in capital for the Municipal Road and Bridge program.
LENDING ACTIVITY As shown in the table below, during fiscal year 2019 the Bank originated almost $152 million in new loans (inclusive of C-PACE lending), including Narragansett Bay Commission ($45 million), City of Woonsocket ($42.8 million), Westerly ($15 million), Providence Water Company ($15.7 million), Bristol County Water Authority ($3.9 million), Barrington ($6.0 million), Portsmouth Water & Fire District ($3.1 million), and Harrisville Fire District ($2.9 million), among others. The Harrisville loan utilized full-principal forgiveness financing for a major water distribution improvement in the Burrillville villages of Harrisville and Oakland to replace a well-based system which has been impacted by contamination. In addition to this loan, the Bank also originated full-principal forgiveness financing for a small system in Tiverton. Overall, originations were well diversified by lending program and funded a variety of important infrastructure-based projects. 2019 originations were up sharply across all programs, except for clean energy-related lending, compared to 2018. While the lending pipeline for clean energy-related projects remains robust, regulatory matters impacting the borrowers have delayed certain projects from closing. Management anticipates that these projects will be funded in the coming fiscal year.
Sector 2019 2018 2017 Clean Water $ 51,065,000 $ 31,086,500 $ 42,873,000 Drinking Water 70,642,496 20,050,000 19,272,095 Municipal Road and Bridge 24,000,000 17,449,000 8,000,000 Clean Energy* 6,053,584 12,452,503 18,903,685
Total $ 151,761,080 $ 81,038,003 $ 89,048,780
*Included in the caption are C-PACE loans which utilize third-party capital providers. Such lending amounted to $2.6 million, $1.7 million, and $1.7 million in 2019, 2018, and 2017, respectively.

Management’s Discussion and Analysis
9
The charts below summarize originations for 2019 and outstanding loans at June 30, 2019 – each by program:
REQUEST FOR INFORMATION This financial report is designed to provide a general overview of the Bank’s financial activity. If you have questions about this report or need additional financial information, please contact us at: 235 Promenade Street, Suite 119, Providence, Rhode Island 02908, telephone number (401) 453-4430 or email us at [email protected].

10
Rhode Island Infrastructure Bank (A Component Unit of the State of Rhode Island and Providence Plantations)
Statements of Net Position – June 30, 2019 and 2018 2019 2018
Assets Current assets: Unrestricted: Cash, cash equivalents and investments $ 26,196,135 $ 26,872,936
Restricted: Cash and cash equivalents 271,145,536 263,218,580 Investments 84,299,052 75,894,887 Total restricted cash, cash equivalents and investments 355,444,588 339,113,467
Other current assets: Unrestricted: Prepaid expenses, other assets and other receivables 215,576 164,373
Restricted: Prepaid expenses, other assets and receivables 2,786 1,205,268 Service fees receivable 1,839,608 1,848,329 Loans receivable 91,665,408 85,282,047 Accrued interest receivable: Loans 8,514,703 8,375,045 Investments 2,935,150 2,144,234 Total current assets 486,813,954 465,005,699
Noncurrent assets: Unrestricted: Loans receivable 90,710,006 95,441,005 Capital assets - property and equipment, net 269,647 384,721 Total unrestricted noncurrent assets 90,979,653 96,825,726
Restricted: Loans receivable 1,161,666,955 1,105,364,939 Total noncurrent assets: 1,252,646,608 1,201,190,665 Total assets 1,739,460,562 1,666,196,364
Deferred Outflows of Resources 5,378,818 6,489,463
Liabilities Current liabilities: Project costs payable 176,468,877 152,184,256 Bonds payable 71,161,672 62,946,251 Notes payable - 23,345,000 Accrued interest payable 7,302,390 7,568,460 Accounts payable and accrued expenses 611,922 842,760 Accrued arbitrage rebate 386,572 132,022 Total current liabilities 255,931,433 247,018,749
Noncurrent liabilities: Bonds payable 774,797,831 770,125,014 Accrued arbitrage rebate 1,248,675 1,089,449 Total noncurrent liabilities 776,046,506 771,214,463 Total liabilities 1,031,977,939 1,018,233,212
Deferred Inflows of Resources 734,416 716,253
Net position Net investments in capital assets 269,647 384,721 Restricted for program purposes 662,135,008 603,540,701 Unrestricted 49,722,370 49,810,940 Total net position $ 712,127,025 $ 653,736,362 See notes to financial statements.

11
Rhode Island Infrastructure Bank (A Component Unit of the State of Rhode Island and Providence Plantations)
Statements of Revenue, Expenses and Changes in Net Position – Years Ended June 30, 2019 and 2018 2019 2018
Operating revenues: Interest income - loans $ 24,640,810 $ 24,698,553 Interest income - Investments 9,084,762 5,493,509 Loan servicing fees 5,506,824 5,455,415 Loan origination fees 1,489,625 831,315 Grant income - program administration 2,582,228 2,471,194 Total operating revenues 43,304,249 38,949,986 Operating expenses: Interest expense, net of premium amortization 22,244,946 22,915,654 Program administration, partner agencies 4,118,416 2,121,685 Principal forgiveness 2,133,647 1,909,903 Compensation and benefits 1,660,530 1,446,083 Debt issuance 1,302,147 1,144,944 Professional services 534,625 475,060 Legal 247,323 240,129 Correspondent and trustee 245,518 277,970 Information technology 147,619 201,262 Marketing 123,891 107,090 Audit and accounting 71,533 101,820 Financial advisory 51,833 55,270 Occupancy and office expense 170,727 171,164 Depreciation 141,377 99,700 Insurance 31,778 29,405 Business and travel 19,367 26,247 Dues and subscriptions 6,731 17,364 Seminars 4,188 755 Total operating expenses 33,256,196 31,341,505 Operating income 10,048,053 7,608,481 Non-operating revenue: Grant income and other contributed capital 52,342,610 37,285,326 Non-operating expenses: Intergovernmental transactions 4,000,000 3,500,000 Change in net position 58,390,663 41,393,807 Net position, beginning of the year 653,736,362 612,342,555 Net position, end of the year $ 712,127,025 $ 653,736,362 See notes to financial statements.

12
Rhode Island Infrastructure Bank (A Component Unit of the State of Rhode Island and Providence Plantations)
Statements of Cash Flows – Years Ended June 30, 2019 and 2018 2019 2018
Cash flows from operating activities: Loan repayments $ 86,623,322 $ 81,429,099 Operating grants 2,582,228 2,471,194 Origination fees 1,489,625 831,315 Loan servicing fees 5,515,545 5,381,764 Investment income 8,293,846 4,673,745 Loan disbursements (129,536,395) (99,914,093) Payments for goods and services (5,255,778) (4,285,115) Bond issuance costs (1,302,147) (595,467) Payments for personnel-related costs (1,257,857) (1,535,725) Net cash used for operating activities (32,847,611) (11,543,283)
Cash flows from capital and related financing activities: Purchases of property and equipment (34,879) (190,410)
Cash flows from noncapital financing activities: Bond issuance 91,696,938 38,789,015 Repayment of bond principal (70,279,410) (48,885,000) Proceeds from (payments on) notes payable (23,345,000) 6,000,000 Non-operating grants 52,342,602 37,284,669 Intergovernmental transactions (4,000,000) (3,500,000) Interest paid on bonds (22,511,017) (22,565,321) Proceeds from termination of interest rate cap 1,215,000 - Net cash provided by noncapital financing activities 25,119,113 7,123,363
Cash flows from investing activities: Interest income - loans 24,501,152 24,050,852 Arbitrage rebate paid to U.S. Treasury (92,395) (1,024,042) Proceeds from (purchases of) investments, net (9,395,225) 28,269,993 Net cash provided by investing activities 15,013,532 51,296,803
Cash and cash equivalents, beginning of the year 290,091,516 243,405,043
Cash and cash equivalents, end of the year $ 297,341,671 $ 290,091,516
Reconciliation of operating income to net cash used for operating activities: Operating income $ 10,048,053 $ 7,609,138 Adjustments: Depreciation 141,377 99,700 Amortization of bond premiums and discounts, net 8,529,289 8,514,773 Increase in investment receivable (790,916) (1,038,138) Interest income - loans (24,640,810) (24,698,553) Interest expense 13,715,615 14,618,589 Loan principal forgiveness 2,133,647 1,909,903 Increase in loans receivable, net (42,913,074) (18,484,994) (Increase) decrease in prepaid expenses 1,151,280 (200,269) Increase (decrease) in accounts payable (230,795) 200,219 (Increase) decrease in accounts receivable - service fees 8,722 (73,651) Net cash used for operating activities $ (32,847,612) $ (11,543,283)
Supplementary cash flow information: Noncash transactions: Increase in loans receivable issued related to project costs payable $ 15,041,303 $ 23,001,709
Increase in fair value of investments $ 3,166,031 $ 4,127,438 See notes to financial statements.

Notes to Financial Statements
13
Note 1. Summary of Significant Accounting Policies Organization: Rhode Island Infrastructure Bank (Bank) was established in 1989 by the State of Rhode Island (State) General Assembly, under Chapter 46-12.2 of the Rhode Island General Laws (1986) as amended. While the Bank is a body politic and corporate and public instrumentality of the State, it has a distinct legal existence separate from the State and is not considered a department of State government. For financial reporting purposes, the Bank is considered a component unit of the State.
In accordance with the requirements of Governmental Accounting Standards Board (GASB) Statement No.14, The Financial Reporting Entity, GASB Statement No. 39, Determining Whether Certain Organizations Are Component Units – an Amendment of GASB Statement 14, and GASB Statement No. 61, the Financial Reporting Entity: Omnibus – an amendment of GASB Statements No. 14 and No. 34, the financial statements must present the Bank and its component units, which, for the periods included here, there were none in existence. As noted above, however, the Bank is considered a component unit of the State and, accordingly, its financial statements are incorporated with and into the financial statements of the State.
The Bank is governed by a Board of Directors (Board) consisting of five members, four of whom are members of the public appointed by the Governor, with the advice and consent of the state senate. The General Treasurer, or such officer’s designee, who shall be a subordinate within the General Treasurer’s department, shall serve as an ex-officio member. While it appoints a voting majority of the Bank’s governing board, the state bears no responsibility for the Bank’s debt.
Description of business: The Bank is the central hub for financing infrastructure improvements for municipalities, businesses, and homeowners in the State. The Bank manages programs that finance infrastructure projects including clean water, drinking water, transportation, energy efficiency and renewable energy, brownfield remediation, and stormwater and climate resiliency. The Bank actively supports and finances infrastructure investments through the origination of loans and mobilization of public and private capital. Projects financed through the Bank serve to help build and maintain a strong system of infrastructure which boosts economic productivity in both the short- and long-term while enhancing the state’s environment.
Pursuant to an operating agreement between the Environmental Protection Agency (EPA) and the Bank, the Bank manages the state’s Clean Water and Drinking Water State Revolving Fund (SRF) programs, CWSRF and DWSRF, respectively. The SRF programs, which were authorized by Federal legislation (the Water Quality Act of 1987 for the CWSRF and the Safe Drinking Water Act of 1996 for the DWSRF), were established to provide a perpetual source of capital for water infrastructure that protects public health and the environment. SRFs provide eligible borrowers with below market loans and other forms of low-cost financing to build, repair and improve wastewater (e.g., sewage treatment and stormwater management) and drinking water infrastructure.
The SRF programs are “revolving” in nature because the revenue received by the Bank from borrower debt service payments is greater than the debt service the Bank owes on its bonds and these excess funds, together with residual amounts released from reserve funds as the Bank’s debt is retired, are used to originate new loans to borrowers that are pledged as a source of payment and security, for new SRF bonds or for other eligible purposes.
In addition, since the SRFs were established, Congress has provided an annual federal grant, called a “capitalization grant,” to add to the available capital of the SRFs. States are required to match 20% of the capitalization grant with state funds. Federal and state contributions, as well as revolved funds, are limited to specific uses by laws and regulations, the operating agreement noted above, and a capitalization grant agreement with the EPA. Because of these limitations on use, these funds are classified as “restricted” on the statements of net position.
The Bank’s SRF programs are leveraged by issuing bonds to provide additional funds to finance program-eligible projects. Federal and state grants and other monies available to the Bank are pledged to secure the bonds by either funding reserves or financing loans pledged to the bonds. Earnings on these pledged

Notes to Financial Statements
14
Note 1. Summary of Significant Accounting Policies (continued) assets are used to pay a portion of the debt service on the related bonds, thereby allowing for a reduction in the borrowers’ loan repayment obligation. Generally, the Bank lends to borrowers at 67% and 75% of the current market rate for the CWSRF and DWSRF, respectively. In addition to providing low-cost financing, including interim financing, for eligible projects, the Bank’s SRF programs primary activities include the issuance of debt, the investment of program funds, and the management and coordination of the programs. Through June 30, 2019, the Bank has originated approximately $1.354 billion and $538.6 million in CWSRF and DWSRF loans, respectively.
In addition to the CWSRF and DWSRF, the Bank also manages the following programs:
Program Summary
Brownfields Revolving Loan Fund (Brownfields RLF)
The Fund provides financing for the remediation of properties contaminated with hazardous substances. The Rhode Island Department of Environmental Management (DEM), in partnership with the Rhode Island Commerce Corporation (RICC), is responsible for producing a project priority list (PPL) of eligible sites for the Bank to provide financing. In June 2016, the Bank was awarded an initial grant of $820,000 from the EPA.
Clean Water and Stormwater Infrastructure Fund (CWSWIF)
The Fund provides financial assistance to eligible borrowers to develop water pollution control abatement projects. In addition, the CWSWIF provides upfront capital to municipalities and organizations who have received reimbursement grants for design and construction of green stormwater infrastructure projects. To date, the Bank has originated $10.3 million in CWSWIF loans.
Commercial – Property Assessed Clean Energy (C-PACE)
C-PACE provides financing for a broad array of energy efficiency and renewable energy projects (and related improvements) in commercial and industrial properties. As the Bank does not directly provide financing for C-PACE loans, property owners are free to arrange financing directly with one of the Bank’s third-party capital providers. The program produced its first round of loans during the spring of 2017 and has now issued $6.1 million in C-PACE loans for a variety of projects.
Community Septic System Loan Program (CSSLP)
Included in the CWSRF program, CSSLP provides discounted financing to communities to address nonpoint source pollution abatement issues with end loans being offered to residents with cesspools or substandard septic systems. The DEM is responsible for producing a PPL of eligible communities for the Bank to provide financing. Revolved capital from CWSRF provides funding for this program. Since the inception of the program, the Bank has originated $19.1 million in CSSLP loans.

Notes to Financial Statements
15
Note 1. Summary of Significant Accounting Policies (continued)
Program Summary
Efficient Buildings Fund (EBF)
The Fund provides financing to municipalities and quasi-public agencies for renewable energy and energy efficiency improvements. The Rhode Island Office of Energy Resources is responsible for producing a PPL of eligible projects for the Bank to provide financing. Bank capital is supplemented by allocated rate-payer funds and Regional Greenhouse Gas Initiative (RGGI) proceeds. To date, the Bank has funded $31.3 million in EBF projects.
Municipal Road and Bridge Revolving Fund (MRB)
The Fund provides financing to municipalities for transportation-based infrastructure projects. The Rhode Island Department of Transportation is responsible for producing a PPL of eligible projects for the Bank to provide financing. Funding for the program is provided by the State through legislative appropriations and premiums received on state bond issuances. To date, the Bank has originated $74.7 million in MRB loans.
Rhode Island Water Pollution Control Revolving Fund (including the Facility Plan Loan Program (FPLP) and the Sewer Tie-In Loan Fund (STILF))
The Fund provides discounted financing for water pollution abatement projects that do not meet the requirements of the CWSRF. In addition, under the FPLP, the Fund also provides financing to municipalities for the completion of water pollution abatement project facility plans, and amendments or updates to such plans. The Fund also supports the STILF program which, like CSSLP, allows communities to borrow funds to address nonpoint source wastewater pollution abatement issues with end loans being offered to residents to connect to the local sewer systems. These programs are funded through capitalization grants from state general obligation bond issues. Between the two programs, the Bank has originated $59 million in such loans.
Water Quality Protection Charge (WQPC) Fund
The WQPC Fund provides financing for the protection of watershed lands to help ensure water quality. This Fund accounts for water quality protection charges received from various Rhode Island water suppliers. The WQPC provides funding to water suppliers for watershed protection land acquisition, water pipe replacement, and other related projects.
The Bank does not possess the power to raise or collect taxes of any kind or to establish any generally applicable fees and charges, other than loan origination and servicing fees charged directly to those borrowers that receive financing from the Bank. The Bank, at its discretion, may also charge cost of issuance fees to borrowers. Basis of accounting: The accompanying basic financial statements of the Bank have been prepared in conformance with generally accepted accounting principles (GAAP) as prescribed by the GASB. GASB is the accepted standard setting body for establishing governmental accounting and financial reporting principles. The Bank is engaged only in “business-type” activities and its operations are financed and operated in a manner like a non-governmental business, where the intent is that the costs of providing services is financed through user charges. The financial statements of the Bank are prepared using the

Notes to Financial Statements
16
Note 1. Summary of Significant Accounting Policies (continued) flow of financial resources measurement focus (which shows the extent to which financial resources obtained during a period are sufficient to cover expenses incurred during that period against financial resources) and the accrual basis of accounting as specified by the GASB requirements for a special purpose entity engaged solely in business-type activities. Revenue recognition: Operating income emanates through the origination and servicing of loans to eligible borrowers and includes revenues (i.e., interest income on loans and related investments) and expenses incurred in loan-related business activities and other program management expenses. All other revenues and expenses are reported as nonoperating revenues and expenses. Funding from Federal capitalization grants and state matching grants are reported as nonoperating revenue. Federal capitalization grant revenue is recognized in accordance with funding availability schedules contained within the individual grant agreements. Revenue recognition associated with these grants is based on the standard principles of eligibility, including timing requirements. The Bank recognizes grant revenue upon acceptance of its request for drawdowns by the grantor agency (EPA) and satisfaction of qualifying commitments and all other grant requirements. The Bank’s Federal capitalization grants, beginning with the American Recovery and Reinvestment Act of 2009 (ARRA) grant, required that a portion of the grant funds be provided as additional subsidization in the form of principal forgiveness, grants, or negative interest loans. The Bank provides the additional subsidization in the form of principal forgiveness, which is recorded as an operating expense. Fund accounting: To ensure compliance with the limitations and restrictions placed on the use of resources available to the Bank, the accounts of the Bank are maintained in individual funds – essentially by program as described above. For the presentation of the Bank’s financial position and results of operations, these funds are presented on a consolidated basis. Cash and cash equivalents: The Bank’s cash equivalents include cash deposits at financial institutions and institutional money market accounts. The Bank’s policy is to treat all highly liquid investments with original maturities of three months or less when purchased as cash and cash equivalents. Investments: Investments with maturity dates of greater than one year at the time of purchase are reported at fair value using quoted market prices. Fair value is defined by GASB Statement No. 72, Fair Value Measurement and Application (GASB 72), as the price that would be received to sell an asset or paid to transfer a liability in an orderly transaction between market participants at the measurement date. As more fully disclosed in Footnote 3 “Investments,” the Bank’s investments as of June 30, 2019 and 2018 consisted of U.S. Treasury obligations, U.S. agency obligations (e.g., FannieMae, FreddieMac, and the Federal Home Loan Bank), municipal bonds, and GICs. The Bank’s various indentures or depository and administrative payment agreements (DAPAs) governing its outstanding bond issues restrict the Bank’s ability to invest the proceeds of bonds issued. In addition to those listed above, permitted investments under either an indenture or DAPA, include, for example, repurchase agreements, certificates of deposit, money market funds, and commercial paper – each subject to specific ratings and/or other restrictions. Management actively manages its investment portfolio with a focus on asset allocation, diversification, and duration within the parameters of the permitted investments. In accordance with Section 35-10.1-7 of the General Laws of the State, dealing with the collateralization of public deposits, all certificates of deposits with maturities of greater than 60 days and all deposits in institutions that do not meet its minimum capital standards as required by its Federal regulator must be collateralized. The Bank did not have any deposits in fiscal year 2019 and 2018 which required collateralization.

Notes to Financial Statements
17
Note 1. Summary of Significant Accounting Policies (continued) Investment income: All investment income, including changes in the fair value of investments, is reported as revenue in the accompanying statements of revenue, expenses and changes in net position except for the guaranteed investment contracts (GIC) that is reported at contract value. Contract value represents contributions made under the contract plus earnings, less withdrawals and administrative expense. Property and equipment: Property and equipment are stated at cost. The Bank’s threshold for capitalizing any individual item is $5,000. Depreciation is determined using a straight-line basis over the estimated useful life of the asset per the following schedule:
Asset Category Estimated Useful Life Computer equipment and software 3 years Equipment, furniture, and fixtures 3 – 5 years Leasehold improvements 7 – 20 years
Bond issuance costs: Bond issuance costs are recorded as operating expenses as incurred. Allowance for loan losses: Management reviews loan receivable balances and borrowers on a continual basis for possible uncollectible amounts. In the event management determines a specific need for an allowance, provision for loss will then be provided. Should a borrower default on a loan, potential remedies are contained in the loan agreement which is backed by the full taxing power of the borrowing municipality in the form of a general obligation pledge or in the full revenue collecting ability of the Bank’s revenue borrowers. Further, the Indenture of Trust (Indenture) as it relates to the Local Interest Subsidy Trust (LIST) serves as a debt service reserve fund. An allowance for loan losses has not been established at either June 30, 2019 or June 30, 2018 since historical collection experience has shown amounts to be fully collectible when due. Deferred inflows and outflows of resources: A deferred inflow of resources is an acquisition of net position that is applicable to a future reporting period and a deferred outflow of resources is a consumption of net position that is applicable to a future reporting period. Both deferred inflows and outflows are reported in the statement of net position but are not recognized in the financial statements as revenues and expenses until the period to which they relate. Deferred inflows and outflows of resources of the Bank consist entirely of deferred refunding costs. The Bank has refunded certain bond obligations which had the effect of reducing aggregate debt service. The difference between the reacquisition price and the net carrying amount of the refunded bonds is recorded as an amount deferred on refunding. The deferred amount on refunding is amortized over the remaining life of the refunded bonds, or the life of the new bonds, whichever is shorter. The amortization amount is a component of interest expense. Accrued arbitrage rebate: The Bank has bonds outstanding which are subject to arbitrage limitations. The term “arbitrage rebate” refers to the required payment to the U.S. Treasury Department (Treasury) of earnings received on applicable tax-exempt bond proceeds that are invested at a higher yield than the yield of the tax-exempt bond issue. The Bank’s ultimate rebate of arbitrage earnings on these issues is contingent on numerous factors, but principally yields on invested proceeds. The amount the Bank will be required to remit to the Treasury could differ materially from the estimated liability – even in the near term. Based on calculations that were performed as of June 30, 2019 and 2018, the Bank had accrued arbitrage rebate liabilities totaling $1,635,247 and $1,221,471, respectively. During 2019 and 2018, the Bank paid to the Treasury $92,395 and $1,024,042, respectively. The rebate obligations are generally computed and adjusted, as applicable, on an annual basis in accordance with regulations promulgated by the Treasury. Required rebates are generally due and payable in five-year intervals during the life of debt issues, with rebates due no later than 60 days after the retirement of the debt issues. Actual calculation and payment

Notes to Financial Statements
18
Note 1. Summary of Significant Accounting Policies (continued) dates may be accelerated as a result of refundings/defeasances. Arbitrage rebate expense is recorded as a reduction in interest income – investments. Loan origination fees: The Bank assesses loan origination fees at the time of loan closing and recognizes such revenue in the period received. Project costs payable: Project costs payable represents the liability of amounts loaned to borrowers that have not been requisitioned. At June 30, 2019 and 2018, these undrawn funds amounted to $176,468,877 and $152,184,256, respectively. Included in these amounts is $38,726,640 and $16,408,599 related to Narragansett Bay Commission (NBC), the Bank’s largest borrower, at June 30, 2019 and 2018, respectively. Bond premium: Bond premiums, included in long-term debt, are amortized using the effective interest method over the respective life of the associated bond issues. Amortization of bond premiums, which are credited to interest expense, amounted to $8,378,636 and $8,209,983 for fiscal years 2019 and 2018, respectively. Compensated absences: The Bank had a policy, which allowed employees to accumulate unused vacation and sick leave benefits up to a certain maximum number of days. That policy was revised in 2018 to pay unused time annually. Compensated absences are recognized as current salary costs when incurred and are recorded in accounts payable and accrued expenses in the statement of net position. The liability at both period ends were di minimis and as such not recognized. Net position: Net investment in capital assets represents capital assets, net of accumulated depreciation. Net position of the Bank is classified as restricted when external constraints are imposed by debt agreements, grantors, contributors, or laws or regulations of governments or constraints imposed by law through constitutional provisions or enabling legislation. The Bank’s net position is restricted by debt covenants and grantor restrictions. Unrestricted net position has no external restrictions and is available for the operations of the Bank. Unrestricted net position may be designated by actions of the Board. Operating revenues and expenses: Substantially all revenues and expenses, including interest received on investments and loans and interest paid on bonds, are considered operating items since the Bank issues bonds to finance loans for specific projects. All other revenues and expenses not meeting these criteria are reported as nonoperating revenue and expenses. In accordance with GASB Statement No. 34, Basic Financial Statements—and Management’s Discussion and Analysis—for State and Local Governments, federal EPA capitalization grants and state grants are shown below operating income (loss) on the statements of revenue, expenses and changes in net position. Restricted assets: Restricted assets of the Bank consist of cash and cash equivalents, investments designated primarily for borrower construction drawdowns (and any interest earned on such investments), borrower interest rate subsidies, and arbitrage rebate liabilities. In each instance the preceding relates to the CWSRF, DWSRF, CWSWIF, Rhode Island Water Pollution Control Revolving Fund, EBF (including rate payer funds and RGGI proceeds), C-PACE, MRB, WQPC, and the Brownfields RLF programs. Certain loans receivable in the CWSRF and DWSRF provide security for the related bonds. Loan payments received are restricted for payment of bond debt service. Intergovernmental transactions: Such amounts represent compulsory payments made to the State as part of the its budget requirements. Resource use: When both restricted and unrestricted resources are available for use, it is the Bank’s policy to use restricted resources first, then unrestricted resources as they are needed.

Notes to Financial Statements
19
Note 1. Summary of Significant Accounting Policies (continued) Recent pronouncements: The GASB has issued the following standards that were effective during the current reporting period or will be effective in future periods: In June 2015, the GASB issued GASB No. 75, Accounting and Financial Reporting for Postemployment Benefits Other Than Pensions. The Statement replaces the requirements of GASB Statement No. 45, Accounting and Financial Reporting by Employers for Postemployment Benefits Other Than Pensions (OPEB). Among other things, Statement No. 75 requires governments to report a liability on the face of the financial statements for the OPEB that they provide and requires governments in all types of OPEB plans to present more extensive note disclosures and required supplementary information about their OPEB liabilities. This Statement is effective for fiscal years beginning after June 15, 2018 and was implemented in the year ended June 30, 2018 and had no impact on the financial statements. In March, 2016, the GASB issued GASB No. 81 Irrevocable Split-Interest Agreements. The Statement requires that a government that receives resources pursuant to an irrevocable split-interest agreement recognize assets, liabilities, and deferred inflows of resources at the inception of the agreement. Furthermore, this Statement requires that a government recognize assets representing its beneficial interests in irrevocable split-interest agreements that are administered by a third party, if the government controls the present service capacity of the beneficial interests. GASB 81 requires that a government recognize revenue when the resources become applicable to the reporting period. This Statement was effective for financial statement periods beginning after December 15, 2016 and was implemented in the year ended June 30, 2018 and had no impact on the financial statements. In November 2016, the GASB issued Statement No. 83, Certain Asset Retirement Obligations. This Statement addresses accounting and financial reporting for certain asset retirement obligations (AROs). An ARO is a legally enforceable liability associated with the retirement of a tangible capital asset. A government that has legal obligations to perform future asset retirement activities related to its tangible capital assets should recognize a liability based on the guidance in this Statement. While the Statement was effective for reporting periods beginning after June 15, 2018, it had no effect on the Bank’s financial statements. In January 2018, the GASB issued Statement No. 84, Fiduciary Activities. This Statement is designed to improve guidance regarding the identification of fiduciary activities for accounting and financial reporting purposes and how those activities should be reported. This Statement was effective for reporting periods beginning after December 15, 2018 and had no impact on the Bank’s financial statements. In March 2018, the GASB issued Statement No. 85, Omnibus 2017. This Statement addresses practice issues that have been identified during implementation and application of certain GASB Statements and includes a variety of topics including issues related to blending component units, goodwill, fair value measurement and application, and postemployment benefits. This Statement is effective for reporting periods beginning after June 15, 2017 and was implemented in the year ended June 30, 2018 and had no impact on the Bank’s financial statements. In May 2017, the GASB issued Statement No. 86, Certain Debt Extinguishment Issues. This Statement improves consistency in accounting and financial reporting for in-substance defeasance of debt by providing guidance for transactions in which cash and other monetary assets acquired with only existing resources—resources other than the proceeds of refunding debt—are placed in an irrevocable trust for the sole purpose of extinguishing debt. This Statement also improves accounting and financial reporting for prepaid insurance on debt that is extinguished and notes to financial statements for debt that is defeased in substance. The requirements of this Statement became effective for reporting periods beginning after June 15, 2017 and was implemented in the year ended June 30, 2018 and had no impact on the Bank’s financial statements. In June 2017, the GASB issued Statement No. 87, Leases. This Statement was established to better meet the information needs of financial statement users by improving accounting and financial reporting for

Notes to Financial Statements
20
Note 1. Summary of Significant Accounting Policies (continued) leases by governments. This Statement increases the usefulness of governments’ financial statements by requiring recognition of certain lease assets and liabilities for leases that previously were classified as operating leases and recognized as inflows of resources or outflows of resources based on the payment provisions of the contract. It establishes a single model for lease accounting based on the foundational principle that leases are financings of the right to use an underlying asset. Under this Statement, a lessee is required to recognize a lease liability and an intangible right-to-use lease asset, and a lessor is required to recognize a lease receivable and a deferred inflow of resources, thereby enhancing the relevance and consistency of information about governments’ leasing activities. While the requirements of this Statement became effective for reporting periods beginning after December 15, 2019, the applicability to the Bank’s financial statements is de minimus and as such a lease liability was not recorded. Please refer to Note 9 for further information on the Bank’s operating lease. In March 2018, the GASB issued Statement No. 88, Certain Disclosures Related to Debt, including Direct Borrowings and Direct Placements. This statement’s primary objective is to improve the information that is disclosed in notes to government financial statements related to debt, including direct borrowings and direct placements. It also clarifies which liabilities governments should include when disclosing information related to debt. This Statement defines debt for purposes of disclosure in notes to financial statements as a liability that arises from a contractual obligation to pay cash (or other assets that may be used in lieu of cash) in one or more payments to settle an amount that is fixed at the date the contractual obligation is established. This Statement requires that additional essential information related to debt be disclosed in notes to financial statements, including unused lines of credit; assets pledged as collateral for the debt; and terms specified in debt agreements related to significant events of default with finance-related consequences, significant termination events with finance-related consequences, and significant subjective acceleration clauses. For notes to financial statements related to debt, this Statement also requires that existing and additional information be provided for direct borrowings and direct placements of debt separately from other debt. The requirements of this Statement became effective for reporting periods beginning after June 15, 2018 and had no impact on the Bank’s financial statements. In June 2018, GASB issued Statement No. 89 Accounting for Interest Cost Incurred before the End of a Construction Period. The objectives of this Statement are (1) to enhance the relevance and comparability of information about capital assets and the cost of borrowing for a reporting period and (2) to simplify accounting for interest cost incurred before the end of a construction period. This Statement establishes accounting requirements for interest cost incurred before the end of a construction period. Such interest cost includes all interest that previously was accounted for in accordance with the requirements of paragraphs 5−22 of Statement No. 62, Codification of Accounting and Financial Reporting Guidance Contained in Pre-November 30, 1989 FASB and AICPA Pronouncements, which are superseded by this Statement. This Statement requires that interest cost incurred before the end of a construction period be recognized as an expense in the period in which the cost is incurred for financial statements prepared using the economic resources measurement focus. As a result, interest cost incurred before the end of a construction period will not be included in the historical cost of a capital asset reported in a business-type activity or enterprise fund. This Statement also reiterates that in financial statements prepared using the current financial resources measurement focus, interest cost incurred before the end of a construction period should be recognized as an expenditure on a basis consistent with governmental fund accounting principles. The requirements of this Statement became effective for reporting periods beginning after December 15, 2019 and had no impact on the Bank’s financial statements. In August 2018, GASB issued Statement No. 90 Majority Equity Interests. The primary objective of this Statement is to improve the consistency and comparability of reporting a government’s majority equity interest in a legally separate organization and to improve the relevance of financial statement information for certain component units. It defines a majority equity interest and specifies that a majority equity interest in a legally separate organization should be reported as an investment. A majority equity interest that meets the definition of an investment should be measured using the equity method, unless it is held by a special-

Notes to Financial Statements
21
Note 1. Summary of Significant Accounting Policies (continued) purpose government engaged only in fiduciary activities, a fiduciary fund, or an endowment (including permanent and term endowments) or permanent fund. Those governments and funds should measure the majority equity interest at fair value. For all other holdings of a majority equity interest in a legally separate organization, a government should report the legally separate organization as a component unit, and the government or fund that holds the equity interest should report an asset related to the majority equity interest using the equity method. This Statement establishes that ownership of a majority equity interest in a legally separate organization results in the government being financially accountable for the legally separate organization and, therefore, the government should report that organization as a component unit. This statement also requires that a component unit in which a government has a 100 percent equity interest account for its assets, deferred outflows of resources, liabilities, and deferred inflows of resources at acquisition value at the date the government acquired a 100 percent equity interest in the component unit. Transaction presented in flows statements of the component unit in that circumstance will include only transactions that occurred subsequent to the acquisition. The requirements of this Statement became effective for reporting periods beginning after December 15, 2018 and had no impact on the financial statements. In May 2019, GASB issued Statement No. 91 – Conduit Debt Obligations. Once effective, GASB 91 will improve existing standards for government issuers by eliminating diversity in practice associated by providing a single method to report conduit debt obligations and related commitments. The GASB’s existing standards, Interpretation No. 2, Disclosure of Conduit Debt Obligations, which allowed government issuers either to recognize conduit debt obligations as their own debt or to disclose them, which adversely affects the comparability of financial statement information. While with the adoption of Statement 91 government issuers will no longer report conduit debt obligations as liabilities, issuers will be required to disclose general information about their conduit debt obligations, organized by type of commitment, including the aggregate outstanding principal amount of the issuers’ conduit debt obligations and a description of each type of commitment. Certain issuers may need to recognize a liability related to commitments they make or voluntarily provide associated with conduit debt if qualitative factors indicate that it is more likely than not that it will support one or more debt service payments for a conduit debt obligation. Irrespective, the issuer is required to disclose the same general information as noted above. The requirements of this Statement are effective for reporting periods beginning after December 15, 2020 and GASB encourages earlier application. Management is currently evaluating the impact this Statement will have on the Bank’s financial statements. Use of estimates: The preparation of financial statements in conformity with accounting principles generally accepted in the United States of America requires management to make estimates and assumptions that affect certain reported amounts and disclosures. Accordingly, actual results could differ from those estimates. Income tax: The Bank is a component unit of the State and is therefore, generally exempt from Federal income taxes under Section 115 of the Internal Revenue Code. Reclassification of prior year presentation: Certain prior year amounts have been reclassified for consistency with the current period presentation. These reclassifications had no effect on the reported results of operations. Note 2. Cash and Cash Equivalents At June 30, 2019 and 2018, the carrying amount of the Bank’s cash deposits was $44,905,357 and $26,872,836, respectively, of which $250,000 was covered by the Federal Depository Insurance Corporation and $44,655,357 and $26,622,836, respectively, was uninsured and collateralized by securities held by the pledging institution in the Bank’s name. The difference between the carrying amount and the

Notes to Financial Statements
22
Note 2. Cash and Cash Equivalents (continued) depository balance is attributable to outstanding reconciling items (primarily outstanding checks) at year-end. Pursuant to GASB 79, Certain External Investment Pools and Pool Participants, the Bank’s institutional money market accounts represent qualifying external investment pools that measures for financial reporting purposes all its investments at amortized cost. Cash and cash equivalents, including restricted amounts, consisted of the following at year-end: Description 2019 2018 Cash on hand $ - $ 100 Deposits with financial institutions 44,905,357 26,872,836 Institutional money market accounts – government portfolio 252,436,314 263,218,580
$ 297,341,671 $ 290,091,516 Description 2019 2018 Unrestricted: Cash on hand $ - $ 100 Deposits with financial institutions 9,599,861 4,748,796 Institutional money market accounts – government portfolio 16,596,274 22,124,040
$ 26,196,135 $ 26,872,936 Restricted: Deposits with financial institutions $ 35,305,496 $ 18,981,031 Institutional money market accounts – government portfolio 235,840,040 244,237,449
271,145,536 263,218,580
$ 297,341,671 $ 290,091,516 Unrestricted cash: Cash and cash equivalents of $26,196,135 and $26,872,936 as of June 30, 2019 and 2018, respectively are classified as unrestricted. While classified as unrestricted, those assets are subject to use only within the proper purpose of the Bank as established through its enabling legislation discussed in Note 1 and the directives and programs approved by the Board. Custodial credit risk - Cash and Cash Equivalents: Custodial credit risk is the risk that in the event of insolvency, the Bank’s deposits may not be returned in full. The Bank does not have a formal deposit policy for custodial credit risk and therefore, does not limit the amount of its deposits with its depositories. The Bank mitigates custodial credit risk by (i) ensuring that cash deposits that exceed federal depository insurance are collateralized and (ii) investing in institutional money market accounts – government portfolio that are “AAA” rated. For fiscal year end 2019 and 2018, institutional money market accounts consisted of the following: Issuer 2019 2018 Ocean State Investment Pool $ 15,619,916 $ 14,243,223 First American Funds – Government Obligations 236,816,398 248,975,357 Total $ 252,436,314 $ 263,218,580 At June 30, 2019 and 2018, funds with Ocean State Investment Pool (OSIP) investments amounted to 6.19% and 5.41%, respectively, with the balance of funds in First American Funds. The OSIP is offered by The State of Rhode Island and managed by FIAM LLC (FIAM) a Fidelity Investments company. While OSIP is unrated, investments are required to be invested in only the “highest quality securities” defined as being rated in one of the highest categories by at least two Nationally Recognized Statistical Rating Organizations. Credit quality represents ratings assigned at the security level or ratings assigned to the entities that issue the securities. OSIP uses ratings from Moody’s Investors Services, Inc.

Notes to Financial Statements
23
Note 2. Cash and Cash Equivalents (continued) Where Moody’s ratings are not available, S&P ratings have been used. If a security has two ratings, the security is considered to be in the lower category. If a security has more than two ratings, the security is considered to be in the highest category of ratings as determined by at least two ratings. Repurchase Agreements have been classified by FIAM and approved by the Rhode Island State General Treasurer as “P1.” There are no participant withdrawal limitations. First American Funds was assigned the highest credit ratings by Standard & Poor’s, Moody’s and Fitch. Note 3. Investments The Bank’s investments consisted of the following at June 30, 2019:
Description Amount Maturity Date(s) Interest Rate(s)
Credit Ratings Moody’s/S&P
US agency and Treasury securities: Federal Farm Credit Banks $ 1,300,043 2019 2.27% AAA/AA+ Federal National Mortgage Association 3,725,914 2019 – 2026 1.79% - 2.21% AAA/AA+ Federal Home Loan Mortgage Corp 12,551,502 2019 – 2028 1.75% - 2.35% AAA/AA+ Federal Home Loan Bank 8,073,632 2019 – 2023 1.79% - 2.11% AAA/AA+ Treasury Bonds and Notes 22,493,777 2019 – 2022 1.71% - 2.32% AAA/AAA
Subtotal 48,144,868 Municipal bonds:
Oregon State 5,088,494 2020 – 2023 2.58% - 4.91% AA2/AA Guaranteed investment contracts:
Bayern LB (a) 2,601,228 2020 5.33% A2/NR Bayern LB (a) 1,242,512 2020 3.75% A2/NR FSA Capital Management (b) 4,167,338 2024 4.71% A2/AA FSA Capital Management (b) 6,469,703 2025 4.67% A2/AA FSA Capital Management (b) 3,685,236 2027 4.79% A2/AA FSA Capital Management (b) 553,599 2028 5.06% A2/AA Citigroup Financial Products (c) 8,042,682 2027 4.81% A3/BBB+ Mass Mutual Life Insurance Company 4,303,392 2029 4.50% Aa3/AA+
Subtotal 31,065,690
Total investments $ 84,299,052
(a) Guaranteed by the Free State of Bavaria which is rated AAA/AAA. (b) Guaranteed by Assured Guaranty Municipal Corporation. (c) Guaranteed by Citigroup, Inc. As of June 30, 2019, Citigroup’s rating remains below the minimum
rating requirements as disclosed in Note 1 “Summary of Significant Accounting Policies”. Management has determined that the current ratings and outlook do not warrant subsequent action.

Notes to Financial Statements
24
Note 3. Investments (continued) The Bank’s investments consisted of the following at June 30, 2018:
Description Amount Maturity Date(s) Interest Rate(s)
Credit Ratings Moody’s/S&P
US agency and Treasury securities: Federal Farm Credit Banks $ 1,299,142 2019 2.41% AAA/AA+ Federal National Mortgage Association 5,305,498 2019 – 2026 1.16% - 3.26% AAA/AA+ Federal Home Loan Mortgage Corp 12,632,725 2019 – 2028 0.25% - 3.07% AAA/AA+ Federal Home Loan Bank 10,287,539 2019 – 2023 1.62% - 2.81% AAA/AA+ Treasury Bonds and Notes 5,900,788 2019 – 2021 1.57% - 2.68% AAA/AAA
Subtotal 35,425,692 Municipal bonds:
Washington State 760,914 2019 1.56 - 1.82% AA2/N/R Oregon State 6,412,489 2019 – 2023 2.58% - 4.91% AA2/AA
Subtotal 7,173,403 Guaranteed investment contracts:
Bayern LB (a) 2,601,228 2020 5.33% A2/NR Bayern LB (a) 1,242,512 2020 3.75% A2/NR FSA Capital Management (b) 4,845,306 2024 4.71% A2/AA FSA Capital Management (b) 7,585,683 2025 4.67% A2/AA FSA Capital Management (b) 4,072,251 2027 4.79% A2/AA FSA Capital Management (b) 602,740 2028 5.06% A2/AA Citigroup Financial Products (c) 8,042,680 2027 4.81% Baa1/A Mass Mutual Life Insurance Company 4,303,392 2029 4.50% Aa2/AA+
Subtotal 33,295,792
Total investments $ 75,894,887
(a) Guaranteed by the Free State of Bavaria which was rated AAA/AAA. (b) Guaranteed by Assured Guaranty Municipal Corporation. (c) Guaranteed by Citigroup, Inc. Rating was below the minimum rating – see disclosure for 2019.
Custodial credit risk - Investments: Custodial credit risk for investments is the risk that, in the event of a failure of the counterparty, the Bank will not be able to recover the value of the investment or collateral securities that are in the possession of an outside party. The Bank requires that all investment agreements be collateralized either upon execution of such agreement or upon the happening of certain events, and always thereafter, by securities or other obligations issued or guaranteed by the United States, by certain Federal agencies having a market value of not less than 100% of the amount currently on deposit or in accordance with their respective agreement. The Bank has a policy which requires the monthly monitoring of custodial credit risk, including the review of institutional credit ratings. Credit risk: Credit risk is the risk that an issuer or counterparty to an investment will not fulfill its obligations. The risk is evidenced by a rating issued by a nationally recognized statistical rating organization, which regularly rate such obligations. Most of the Bank’s investments are in Treasury, agency securities, municipals, or GICs. Securities issued by the U.S. Treasury are all backed by the full faith and credit of the Federal government. The Bank has GICs with multiple providers who maintain the contributed investments. GIC providers must meet the following ratings from S&P and Moody’s: domestic banks rated at least AA/Aa2; U.S. branches of foreign banks rated at least AA/Aa2; insurance companies (or corporations whose obligations are guaranteed by an insurance company, in the form of an insurance policy, or by an insurance holding company) rated AAA/Aaa. As discussed in Note 1, the GICs are reported at contract value. The providers

Notes to Financial Statements
25
Note 3. Investments (continued) are contractually obligated to repay the principal and a specified interest rate that is guaranteed to the Bank. In accordance with GASB 72, the fair value of these investments is measured at such contract value outside of the fair value hierarchy. The Bank’s GICs totaled $31,065,690 and $33,295,792 as of June 30, 2019 and June 30, 2018, respectively. There are no reserves against contract value for credit risk of the provider or otherwise. The crediting interest rates are based on a formula agreed upon by each provider. Interest rate risk: Interest rate risk is the risk that an investment’s value will change due to a change in the absolute level of interest rates, in the spread between two rates, in the shape of the yield curve, or in any other interest rate relationship. Such changes usually affect securities market value inversely. The Bank manages its exposure to interest rate risk by matching the duration of its investments to anticipated obligations. At June 30, 2019 and 2018, maturities of the Bank’s investment by sector were as follows: Total Fair More than Sector – 2019 Value Less than 1 1 - 5 6 - 10 10 U.S. agency securities $ 25,651,091 $ 9,953,934 $ 9,692,451 $ 6,004,706 $ - U.S. Treasury securities 22,493,776 19,577,517 2,916,259 - - Municipal bonds 5,088,495 1,408,248 3,680,247 - - Guaranteed investment contracts 31,065,690 - 3,843,739 22,364,961 4,856,990
$ 84,299,052 $ 30,939,699 $ 20,132,696 $ 28,369,667 $ 4,856,990
Total Fair More than Sector – 2018 Value Less than 1 1 - 5 6 - 10 10 U.S. agency securities $ 29,524,904 $ 4,308,293 $ 19,198,031 $ 5,495,199 $ 523,381 U.S. Treasury securities 5,900,788 3,955,663 1,945,125 - - Municipal bonds 7,173,403 2,096,429 5,076,974 - - Guaranteed investment contracts 33,295,792 - 3,843,739 24,545,922 4,906,131
$ 75,894,887 $ 10,360,385 $ 30,063,869 $ 30,041,121 $ 5,429,512
Fair value measurement: The Bank’s investments are recorded at fair value as of June 30, 2019 and 2018, pursuant to the provisions of GASB No. 31, Certain Investments and External Investment Pools (GASB 31), and GASB 72. GASB 31 established accounting and financial reporting standards for certain investments to be reported at fair value and for external investment pools. GASB No. 72 addresses accounting and financial reporting issues related to fair value measurements. The Statement establishes a hierarchy of inputs to valuation techniques used to measure fair value. A financial instrument’s level within the fair value hierarchy is based on the lowest level of any input that is significant to the fair value measurement. The following describes the hierarchy of inputs used to measure fair value and the primary valuation methodologies used for financial instruments measured at fair value on a recurring basis:
Level 1: Investments whose values are based on quoted prices (unadjusted) for identical assets in active markets that the Bank can access at the measurement date.
Level 2: Investments with inputs, other than quoted prices included in Level 1, that are observable for
an asset, either directly or indirectly. Level 3: Investments classified as Level 3 have unobservable inputs for an asset and may require a
degree of professional judgment.

Notes to Financial Statements
26
Note 3. Investments (continued) The Bank’s investments within the fair value hierarchy (which do not include the GICs) are summarized below as of June 30,
2019 Quotes Prices in Active Significant Markets for Other Identical Observable Total Assets Inputs Fair Investment Sector (Level 1) (Level 2) Value
U.S. agency securities $ - $ 25,651,091 $ 25,651,091 U.S. Treasury securities 22,493,776 - 22,493,776 Municipal bonds - 5,088,495 5,088,495
Total investments $ 22,493,776 $ 30,739,586 $ 53,233,362
2018 Quotes Prices in Active Significant Markets for Other Identical Observable Total Assets Inputs Fair Investment Sector (Level 1) (Level 2) Value
U.S. agency securities $ - $ 29,524,904 $ 29,524,904 U.S. Treasury securities 5,900,788 - 5,900,788 Municipal bonds - 7,173,403 7,173,403
Total investments $ 5,900,788 $ 36,698,307 $ 42,599,095
The Bank had no investments that were categorized as Level 3 at either June 30, 2019 or June 30, 2018 and therefore that information is not presented in the above tables. Certain investments that are measured at fair value using the net asset value (NAV) per share as a practical expedient have not been classified in the fair value hierarchy. Concentration of credit risk: Concentration of credit risk is the risk of loss attributed to the magnitude of the Bank’s investment in a single issuer. Excluding U.S. Treasury securities, the issuers where investments exceeded 5% of the Bank’s total investments at either period end are:
Percentage of Total Investments Issuer 2019 2018 FSA Capital Management 18% 23% Federal Home Loan Mortgage Corp 15% 17% Federal Home Loan Bank 10% 14% Citigroup Financial Products 10% 11% Oregon State 6% 8% Federal National Mortgage Association 4% 7% Mass Mutual Life Insurance Company 5% 6% Bayern LB 5% 5%

Notes to Financial Statements
27
Note 4. Loans Receivable At June 30, 2019 and 2018, the Bank had loans outstanding of $1,344,042,369 and $1,286,087,991, respectively, including all unused outstanding loan commitments (project costs payable). Borrowers are obligated to repay the full balance of loan agreements; however, funds are disbursed by the Bank in accordance with the loan agreements as costs are incurred for the projects for which the loans are intended. The Bank disburses funds to the borrowers and/or vendors after receipt of a request for disbursement, which is accompanied by supporting documentation. The Bank is obligated to disburse funds only up to the value of the loan agreement and is not responsible for any excess costs incurred by the borrower. The borrower, in turn, is obligated to make principal and interest payments in accordance with the repayment schedules per the loan agreement even if funds have not been fully disbursed by the Bank at the time of first payment. Loan terms and conditions do vary but loans are generally repaid over 20 years with either level principal or level total payments. Loan amounts may include capitalized interest expense incurred by the borrower during the construction period.
As noted in the “Allowance for loan losses” caption in Note 1, the Bank has various LIST funds, which are restricted by the indenture between the trustee and the Bank and may be used to make the required bond payments in the event of default by a borrower.
At June 30, 2019, the Bank’s top three borrowers had loans receivable of $621,633,700 representing approximately 46% of total loans receivable, compared to 48% of total loans receivable at June 30, 2018. Principal forgiveness loans: The Bank has received ARRA and non-ARRA capitalization grants which can be used to originate loans with some of its principal forgiven. The Bank’s historical capitalization grants available for principal forgiveness loans for CWSRF are summarized below:
Principal Principal
Forgiveness Capitalization Capitalization Forgiveness Loans Issued
Grant Grant Award Component as of FY2019 2009 (ARRA) $ 26,314,600 $ 13,157,300 $ 13,157,300
2010 13,681,000 2,048,980 2,048,980 2011 9,915,000 918,782 918,782 2012 9,486,000 527,198 527,198 2013 8,955,000 500,000 500,000 2014 9,410,000 512,070 512,070 2015 9,361,000 - - 2016 8,962,000 896,200 896,200 2017 8,892,000 889,200 889,200 2018 10,777,000 1,000,000 1,000,000
$ 115,753,600 $ 20,449,730 $ 20,449,730 The above schedule includes $12,396,592 in principal forgiveness loans issued to NBC.

Notes to Financial Statements
28
Note 4. Loans Receivable (continued) The Bank’s historical capitalization grants available for principal forgiveness loans for DWSRF are summarized below:
Principal Principal
Forgiveness Capitalization Capitalization Forgiveness Loans Issued
Grant Grant Award Component as of FY2019 2009 (ARRA) $ 19,500,000 $ 9,750,000 $ 9,750,000
2010 13,573,000 4,071,900 4,071,900 2011 9,418,000 2,825,400 2,825,400 2012 8,975,000 1,795,000 1,795,000 2013 8,421,000 1,684,200 1,684,200 2014 8,845,000 1,769,000 1,769,000 2015 8,787,000 1,757,400 1,757,400 2016 8,312,000 1,662,400 831,423 2017 8,241,000 1,648,200 1,648,200 2018 11,107,000 2,221,400 370,824
$ 105,179,000 $ 29,184,900 $ 26,503,347 Loans made to eligible borrowers under the CWSRF and DWSRF programs may be forgiven if certain continuing criteria are met, including that the borrower continues to make debt service payments, continues to operate the project in compliance with laws and regulations, and does not dispose of or discontinue the project. For purposes of the basic financial statements, the Bank recognizes principal forgiveness expense as the related loans are repaid. The total amount forgiven under these programs in fiscal years 2019 and 2018 was $2,133,647 and $1,909,903 respectively. The amounts are included in loan principal forgiveness in the statements of revenues, expenses, and changes in net position. Note 5. Bonds Payable Since its inception, the Bank has issued revenue bonds to investors to finance infrastructure projects. The bonds are limited obligations of the Bank and repayment is made by a combination of revenue from the loans, debt service funds, and recycled capital. In addition, from time to time the Bank issues conduit bonds. The term conduit bonds refers to certain limited-obligation revenue bonds issued by the Bank for the express purpose of providing capital financing for a specific third party. Although conduit debt obligations bear the name of the Bank and are included in its financial statements, it has no obligation for the debt beyond the resources provided by a loan with the third party on whose behalf the conduit bonds are issued. As of June 30, 2019 and 2018, there were seven series of conduit bonds outstanding, with an aggregate principal amount payable of $70,146,000 and $73,729,000 respectively. The Bank had the following revenue bonds outstanding at June 30, Clean Water Program 2019 2018 1999 Series A Bonds, dated January 1, 1999, with serial bonds of $19,590,000 at rates varying from 3.7% to 5.25% due annually from October 1, 2002 through October 1, 2016 and term bonds of $3,765,000 at 4.75% due October 1, 2018 and $2,470,000 at 4.75% due October 1, 2020. On May 6, 2010, the Bank advance refunded $4,990,000 of the outstanding bonds. $ 2,470,000 $ 3,295,000

Notes to Financial Statements
29
Note 5. Bonds Payable (continued) 1999 Series C Bonds, dated August 1, 1999, with serial bonds of $24,010,000 at rates varying from 4.15% to 5.50% due annually from October 1, 2001 through October 1, 2019. On May 6, 2010, the Bank advance refunded $4,985,000 of the outstanding bonds.
865,000
1,720,000
2000 Series A Bonds, dated December 1, 2000 with serial bonds of $26,550,000 at rates varying from 4.50% to 5.125% due annually from October 1, 2001 through October 1, 2020. On May 6, 2010, the Bank advance refunded $7,430,000 of the outstanding bonds.
1,945,000
2,355,000
2002 Series A Bonds, dated April 1, 2002 with serial bonds of $29,305,000 at rates varying from 3.00% to 5.50% due annually from October 1, 2002 through October 1, 2022. On May 6, 2010, the Bank advance refunded $7,505,000 of the outstanding bonds.
3,790,000
5,375,000
2002 Series B Bonds, dated October 1, 2002, with serial bonds of $76,035,000 at rates varying from 2.0% to 5.0% due annually from October 1, 2004 through October 1, 2022. On May 6, 2010, the Bank advance refunded $25,260,000 of the outstanding bonds.
8,090,000
8,825,000
2006 Series A Bonds, dated December 21, 2006, with serial bonds of $57,795,000 at rates varying from 3.40% to 5.00% due annually from October 1, 2007 through October 1, 2027. On October 6, 2015, the Bank advance refunded $27,085,000 of the outstanding bonds.
6,595,000
7,325,000
2009 Series A Bonds, dated October 6, 2009, with serial bonds of $41,555,000 at rates varying from 2.00% to 5.00% due annually from October 1, 2011 through October 1, 2030.
2,540,000
4,260,000
2010 Series A Refunding Bonds, dated May 6, 2010, with serial bonds of $77,140,000 at rates varying from 2.00% to 5.00% due annually from October 1, 2010 through October 1, 2023.
26,320,000
34,650,000
2010 Series B Bonds, dated June 24, 2010, with serial bonds of $30,145,000 at rates varying from 3.00% to 5.00% due annually from October 1, 2012 through October 1, 2030. On June 28, 2017, the Bank advance refunded $17,480,000 of the outstanding bonds. The remaining bonds are due October 1, 2017 through October 1, 2030.
4,705,000
6,770,000
2011 Series A Bonds, dated March 29, 2011, with serial bonds of $40,200,000 at rates varying from 2.00% to 5.00% due annually from October 1, 2012 through October 1, 2032. On June 28, 2017, the Bank advance refunded $27,105,000 of the outstanding bonds. The remaining bonds are due October 1, 2017 through October 1, 2020.
3,280,000
4,815,000
2012 Series A Bonds, dated June 28, 2012, with serial bonds of $25,620,000 at rates varying from 2.00% to 5.00% due annually from October 1, 2014 through October 1, 2033.
19,725,000
21,005,000
2012 Series B Refunding Bonds, dated November 8, 2012, with serial bonds of $65,860,000 at rates varying from 2.00% to 5.00% due annually from October 1, 2013 through October 1, 2025.
36,665,000
42,305,000
2013 Series A Bonds, dated June 6, 2013, with serial bonds of $52,070,000 at rates varying from 1.50% to 5.00% due annually from October 1, 2015 through October 1, 2034.
47,790,000
49,045,000

Notes to Financial Statements
30
Note 5. Bonds Payable (continued) 2014 Series A Bonds, dated February 20, 2014, with serial bonds of $55,925,000 at rates varying from 2.00% to 5.00% due annually from October 1, 2015 through October 1, 2034. 48,185,000 50,290,000 2015 Series A Bonds, dated July 30, 2015, with serial bonds of $56,275,000 at rates varying from 3% to 5% due annually from October 1, 2017 through October 1, 2044.
53,135,000
54,740,000
2015 Series B and 2015 Series C Refunding Bonds, dated October 6, 2015, with serial bonds of $24,345,000 at rates varying from 2% to 5% due annually from October 1, 2016 through October 1, 2026; and serial bonds of $23,355,000 at rates varying from 1.75% to 5% due annually from October 1, 2018 through October 1, 2027, respectively. The Bank’s defeasance of the 2005A and 2006A bonds resulted in economic present value savings of $5,259,859 or 10%. 36,905,000 41,245,000
2016 Series A Refunding Bonds, dated June 2, 2016, with serial bonds of $49,060,000 at rates varying from 1.75% to 5% due annually from October 1, 2018 through October 1, 2030. The Bank’s defeasance of the 2007A and 2009A bonds resulted in economic present value savings of $6,074,803 or 11%. 47,265,000 49,060,000
2016 Series B Bonds, dated June 2, 2016, with serial bonds of $18,790,000 at rates varying from 2% to 5% due annually from October 1, 2017 through October 1, 2037. 18,040,000 18,685,000
2017 Series A Bonds, dated April 13, 2017, with serial bonds of $28,130,000 at rates varying from 3% to 5% due annually from October 1, 2018 through October 1, 2036. 26,035,000
28,130,000
2017 Series B Bonds, dated June 28, 2017, with serial bonds of $41,120,000 at rates varying from 3% to 5% due annually from October 1, 2021 through October 1, 2032. The Bank’s defeasance of the 2010B and 2011A bonds resulted in economic present value savings of $4,655,796 or 10%. 41,120,000
41,120,000
2018 Series A Bonds, dated April 25, 2018, with serial bonds of $17,715,000 at rates varying from 3% to 4% due annually from October 1, 2025 through October 1, 2037. 17,715,000 17,715,000 Drinking Water Program 2019 2018 2005 Series A Bonds, dated March 23, 2005, with serial bonds of $42,960,000 at rates varying from 3.00% to 5.00% due annually from October 1, 2006 through October 1, 2027. On June 26, 2013, the Bank advance refunded $17,280,000 of the outstanding bonds. The remaining bonds were due October 1, 2013 through October 1, 2015 and October 1, 2025 through October 1, 2027. On June 27, 2019, the Bank advance refunded $5,620,000 of the outstanding bonds. - 5,620,000
2007 Series A Bonds, dated March 7, 2007, with serial bonds of $5,135,000 at rates varying from 4.00% to 4.125% due annually from October 1, 2008 through October 1, 2019.
525,000
1,095,000
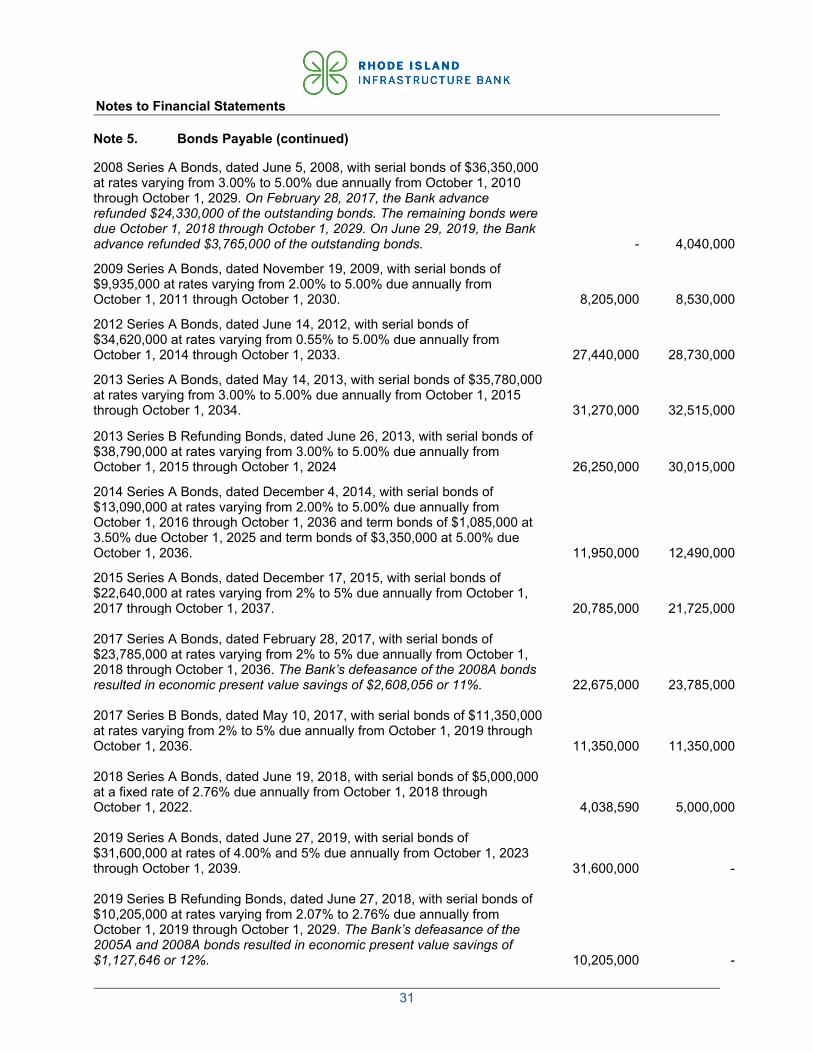
Notes to Financial Statements
31
Note 5. Bonds Payable (continued) 2008 Series A Bonds, dated June 5, 2008, with serial bonds of $36,350,000 at rates varying from 3.00% to 5.00% due annually from October 1, 2010 through October 1, 2029. On February 28, 2017, the Bank advance refunded $24,330,000 of the outstanding bonds. The remaining bonds were due October 1, 2018 through October 1, 2029. On June 29, 2019, the Bank advance refunded $3,765,000 of the outstanding bonds. -
4,040,000
2009 Series A Bonds, dated November 19, 2009, with serial bonds of $9,935,000 at rates varying from 2.00% to 5.00% due annually from October 1, 2011 through October 1, 2030. 8,205,000 8,530,000
2012 Series A Bonds, dated June 14, 2012, with serial bonds of $34,620,000 at rates varying from 0.55% to 5.00% due annually from October 1, 2014 through October 1, 2033.
27,440,000
28,730,000
2013 Series A Bonds, dated May 14, 2013, with serial bonds of $35,780,000 at rates varying from 3.00% to 5.00% due annually from October 1, 2015 through October 1, 2034.
31,270,000
32,515,000
2013 Series B Refunding Bonds, dated June 26, 2013, with serial bonds of $38,790,000 at rates varying from 3.00% to 5.00% due annually from October 1, 2015 through October 1, 2024
26,250,000
30,015,000
2014 Series A Bonds, dated December 4, 2014, with serial bonds of $13,090,000 at rates varying from 2.00% to 5.00% due annually from October 1, 2016 through October 1, 2036 and term bonds of $1,085,000 at 3.50% due October 1, 2025 and term bonds of $3,350,000 at 5.00% due October 1, 2036.
11,950,000
12,490,000
2015 Series A Bonds, dated December 17, 2015, with serial bonds of $22,640,000 at rates varying from 2% to 5% due annually from October 1, 2017 through October 1, 2037.
20,785,000
21,725,000
2017 Series A Bonds, dated February 28, 2017, with serial bonds of $23,785,000 at rates varying from 2% to 5% due annually from October 1, 2018 through October 1, 2036. The Bank’s defeasance of the 2008A bonds resulted in economic present value savings of $2,608,056 or 11%.
22,675,000
23,785,000
2017 Series B Bonds, dated May 10, 2017, with serial bonds of $11,350,000 at rates varying from 2% to 5% due annually from October 1, 2019 through October 1, 2036.
11,350,000
11,350,000
2018 Series A Bonds, dated June 19, 2018, with serial bonds of $5,000,000 at a fixed rate of 2.76% due annually from October 1, 2018 through October 1, 2022. 4,038,590 5,000,000 2019 Series A Bonds, dated June 27, 2019, with serial bonds of $31,600,000 at rates of 4.00% and 5% due annually from October 1, 2023 through October 1, 2039. 31,600,000 - 2019 Series B Refunding Bonds, dated June 27, 2018, with serial bonds of $10,205,000 at rates varying from 2.07% to 2.76% due annually from October 1, 2019 through October 1, 2029. The Bank’s defeasance of the 2005A and 2008A bonds resulted in economic present value savings of $1,127,646 or 12%. 10,205,000 -

Notes to Financial Statements
32
Note 5. Bonds Payable (continued) Municipal Road & Bridge 2019 2018 2018 Series A Bonds, dated June 20, 2018, with serial bonds of $13,965,000 at rates varying from 2% to 5% due annually from October 1, 2019 through October 1, 2037. 13,965,000 13,965,000 2019 Series A Bonds, dated May 2, 2019, with serial bonds of $15,440,000 at rates of 4% to 5% due annually from October 1, 2019 through October 1, 2035. 15,440,000 - Efficient Buildings Fund 2019 2018 2018 Series A Bonds, dated November 29, 2018, with serial bonds of $18,310,000 at rates varying from 3% to 5% due annually from October 1, 2019 through October 1, 2033. 18,310,000 - Conduit Bonds 2019 2018 2008 Wastewater Revenue Bonds (City of Warwick), dated April 30, 2008, with serial bonds of $4,000,000 at 4.85% due annually from March 1, 2009 through March 1, 2028
2,255,000
2,455,000
2011 Series A Bonds, (City of Newport), dated March 31, 2011 with serial bonds of $10,345,000 at 4.30% due annually from September 1, 2011 through September 1, 2026
6,360,000
7,005,000
2012 Series A Bonds (City of Warwick), dated June 26, 2012, with serial bonds of $2,400,000 at 3.285% due annually from August 1, 2012 through August 1, 2022.
1,051,000
1,294,000
2013 Series A Revenue Bonds (Town of Coventry), dated September 3, 2013 with serial bonds of $8,225,000 at 4.25% due annually from September 1, 2014 through September 1, 2028. The Bank’s defeasance of the 2013 bonds did not result in economic savings to the Town of Coventry. -
6,505,000
2011 Series A Bonds, (City of Newport), dated September 30, 2011 with serial bonds of $6,640,000 at 3.4% due annually from September 1, 2012 through September 1, 2027. 4,185,000 4,575,000
2015 Series Refunding Bonds (City of Pawtucket), dated December 18, 2015, with serial bonds of $24,265,000 at rates varying from 3.5% to 5% due annually from October 1, 2025 through October 1, 2035. The Bank’s defeasance of the 2003A and 2003B bonds resulted in economic present value savings of $4,237,086 or 16%. 24,265,000 24,265,000
2017 Series Bonds (Cranston-Triton), dated January 31, 2017 with serial bonds of $27,705,000 at 4.30% due annually from September 1, 2018 through September 1, 2022. The Bank’s defeasance of the 1997 bonds resulted in economic present value savings of $1,127,085 or 4%. 25,290,000 27,630,000
2018 Series A Refunding Revenue Bonds (Town of Coventry), dated August 30, 2018 with serial bonds of $6,740,000 at 4.250% due annually from September 1, 2018 through September 1, 2028. 6,740,000 -
Subtotal 777,334,590 765,319,000
Bond premium, net of amortization 68,624,913 67,752,265
Total bonds payable $845,959,503 $833,071,265

Notes to Financial Statements
33
Note 5. Bonds Payable (continued) Long-term liability activity for the year ended June 30, was as follows: Amounts Beginning Ending Due Within 2019 Balance Additions Reductions Balance One Year Long term debt:
Revenue bonds $ 765,319,000 $ 82,295,000 $ 70,279,410 $ 777,334,590 $ 62,780,213 Plus bond premium,
net of amortization 67,752,265 9,401,937 8,529,289 68,624,913 8,381,459 Total long-term debt $ 833,071,265 $91,696,937 $ 78,808,699 $ 845,959,503 $ 70,041,672
Amounts Beginning Ending Due Within 2018 Balance Additions Reductions Balance One Year Long term debt:
Revenue bonds $ 777,524,000 $ 36,680,000 $ 48,885,000 $ 765,319,000 $ 54,864,410 Plus bond premium,
net of amortization 74,158,023 2,109,015 8,514,773 67,752,265 8,081,841 Total long-term debt $ 851,682,023 $38,789,015 $ 57,399,773 $ 833,071,265 $ 62,946,251
Annual principal and interest requirements are as follows for the year ending June 30, 2019:
Years Principal Interest Total 2020 $ 55,553,213 $ 29,330,211 $ 84,883,424 2021 54,788,866 27,382,935 82,171,801 2022 53,356,500 25,131,534 78,488,034 2023 54,205,011 22,822,617 77,027,628 2024 47,880,000 20,498,052 68,378,052 2025 - 2029 209,485,000 71,411,034 280,896,034 2030 - 2034 161,510,000 29,419,788 190,929,788 2035 - 2039 57,135,000 6,128,634 63,263,634 2040 - 2044 1,700,000 1,102,600 2,802,600 2045 11,575,000 32,850 11,607,850 Subtotal 707,188,590 233,260,255 940,448,845 Conduit Bonds 70,146,000 18,402,786 88,548,786
Total $ 777,334,590 $ 251,663,041 $ 1,028,997,631 Advanced refunding of debt: As described in Note 1 (please see “Deferred inflows and outflows of resources”), the Bank will occasionally refund bonds if market conditions are amenable to reducing the aggregate debt service. When a bond is refunded, the Bank deposits bond proceeds from refunding bonds with an escrow agent to provide resources for all future debt service payments on the refunded bonds. As a result, the bonds are defeased and the liability is no longer included in the Bank’s financial statements. In prior years, the Bank defeased certain bonds in the same manner as described above. At June 30, 2019 and 2018, the Bank had $83,515,000 and $123,200,000 of bonds outstanding are considered defeased, respectively. Deferred outflows and inflows of resources: When the Bank refunds or advance refunds its bonds, it calculates the difference between the reacquisition price and the net carrying amount of the old debt. The resulting accounting gain or loss is then amortized over the life of the refunding bonds or remaining life of the defeased bonds, whichever is lesser. The excess of the reacquisition price over the carrying value of

Notes to Financial Statements
34
Note 5. Bonds Payable (continued) the defeased bonds is recorded as deferred outflows of resources on the statement of net position. The excess of the carrying value of the defeased bond over the reacquisition price is recorded as deferred inflows of resources on the same. The deferred outflows were as follows at June 30:
Deferred Deferred Outflows of Inflows of Resources Resources Beginning balance – June 30, 2017 $ 8,086,130 $ 996,065
Additions - - Reductions (1,596,667) (279,812)
Ending balance – June 30, 2018 6,489,463 716,253
Additions - 116,742 Reductions (1,110,645) (98,579)
Ending balance – June 30, 2019 $ 5,378,818 $ 734,416 Note 6. Notes Payable From time to time, the Bank utilizes short-term borrowing to provide interim financing to borrowers. On July 8, 2016, the Bank issued a short-term revenue bond anticipation note to Webster Bank, N.A. for $17,345,000. The original note, which had a maturity date of December 1, 2017, was extended on November 22, 2017 to December 1, 2018. In addition, on December 13, 2017, the Bank issued a short-term revenue bond anticipation note to Webster Public Finance Corporation for $6,000,000 with a maturity date of November 30, 2018. In each case, the notes were issued to fund EBF loans originated at the same time and to allow the Bank to combine other projects into one larger issue in a future bond issue. That inaugural EBF bond issue (2018 Series A Bonds), as described in Note 5 closed on November 29, 2018, the proceeds of which were utilized to pay off both notes. In conjunction with issuing the $17,345,000 note, the Bank purchased an interest rate cap (Cap) from the Bank of America (BOA) with a notional amount of $28,158,000. The purpose of the Cap was to limit the Bank’s exposure to long-term interest rates for the period between the execution date of the cap and when the Bank can sell bonds to reimburse itself for the note. The cap was terminated in conjunction with the bond issue and $1,215,000 of the proceeds was utilized by the Bank to contribute capital into the transaction. For the prior period, changes in fair value of the Cap were recorded in the income statement. The interest rate cap had a positive fair value at June 30, 2018, and was recorded in prepaid expenses, other assets and other receivables on the statement of net position. Note 7. Capitalization Grants Under Title VI of the Federal Clean Water Act of 1972, as amended by the Federal Water Quality Act of 1987 and subsequent regulations, the General Assembly of the State enacted the Clean Water Act, which established the CWSRF to be managed by the Bank. Under the CWSRF, the DEM promulgates rules and regulations pertaining to applications by borrowers seeking financial assistance for water pollution abatement projects. No project is eligible for financing by the Bank until the DEM has issued its Certificate of Approval. The Certificate of Approval specifies, among other things, the estimated project costs that are eligible for financial assistance and other terms and conditions relating to the construction and operation of projects. The DEM and the Bank operate under a Memorandum of Understanding pursuant to which the DEM has programmatic responsibilities while the Bank has financial and operational responsibilities for the

Notes to Financial Statements
35
Note 7. Capitalization Grants (Continued) CWSRF including the determination of the type and extent of financial assistance to be provided to borrowers. The Bank receives capitalization grants from the EPA for the CWSRF. These grants are used to fund the Bank’s lending activities and to reimburse the DEM for up to 4% of the capitalization grant for expenses incurred for services they provide the Bank related to these lending activities. To obtain the Federal monies, the Bank must also obtain a commitment for state matching funds of 20% of the Federal award. The following is a table of the federal and state matching funds awarded to the Bank and the balances remaining for drawdown as of June 30:
Balance Remaining for Grant Year Award Drawdown 2017:
Federal award $ 8,892,000 $ 2,080,794 State match $ 1,778,400 $ -
2018:
Federal award $ 10,777,000 $ 9,682,540 State match $ 2,155,400 $ -
For 2019, the Bank has applied and been approved for a Federal award of $10,669,000. In 1996, Congress amended the Safe Drinking Water Act of 1974 to provide financial support for improving the nation’s public water systems. As required by the amendment, the General Assembly of the State enacted the Water Projects Revolving Loan Fund which established the DWSRF. Under the DWSRF, the Department of Health (DOH) promulgates rules and regulations pertaining to applications by borrowers seeking financial assistance for drinking water projects. No project is eligible for financing by the Bank until the DOH has issued its Certificate of Approval. The Certificate of Approval specifies, among other things, the estimated project costs that are eligible for financial assistance and other terms and conditions relating to the construction and operation of projects. The DOH and the Bank operate under a Memorandum of Understanding pursuant to which the DOH has programmatic responsibilities while the Bank has financial and operational responsibilities of the DWSRF including the determination of the type and extent of financial assistance to be provided to borrowers. The Bank also receives capitalization grants from the EPA for the DWSRF. These grants are used to fund the Bank’s lending activities and to provide funding for various improvement programs administered by the DOH – ostensibly to support water supplier’s efforts to meet the minimum standards for quality outlined in the Federal Act. To obtain the Federal monies, the Bank must commit 20% of the Federal award in the form of State matching funds. The DWSRF allows the DOH to set-aside up to 31% of the annual capitalization grants in four accounts as follows: 1) 4% for program administration which is to be split between the DOH and the Bank, 2) up to 2% for technical assistance, 3) up to 10% for state program management, and 4) up to 15% for local assistance.

Notes to Financial Statements
36
Note 7. Capitalization Grants (Continued) The following is a table of the Federal and state matching funds awarded to the Bank and the balances remaining for drawdown as of June 30:
Balance Remaining for Grant Year Award Drawdown 2017:
Federal award $ 8,241,000 $ 1,231,164 State match $ 1,648,200 $ -
2018:
Federal award $ 11,107,000 $ 9,809,426 State match $ 2,221,400 $ 2,110,577
For 2019, the Bank has applied and been approved for a Federal award of $11,004,000. In 2002, Congress approved the Small Business Liability Relief and Brownfields Revitalization Act which created financial assistance for brownfields revitalization, including grants to capitalize Brownfields RLF. In 2015, the General Assembly of the State enacted the Brownfields RLF. Under the Brownfields RLF, the DEM, in consultation with the RICC, is to develop project evaluation criteria used to rank eligible projects on a project priority list. After enactment of the Brownfields RLF, the Bank promulgated rules and regulations establishing the parameters under which project financing is provided through the program. The Bank received a capitalization grant from the EPA for the Brownfields RLF. This grant was used to fund the Bank’s lending activities. To obtain the Federal monies, the Bank must also obtain a commitment for state matching funds of 20% of the Federal award. The following is a table of the Federal awards to the Bank and the balances remaining for drawdown as of June 30:
Balance Remaining for Grant Year Award Drawdown 2016:
Federal award $ 820,000 $ 820,000 Note 8. Deferred Compensation The Bank sponsors a deferred compensation plan for the benefit of its employees, known as the “Rhode Island Infrastructure Bank Deferred Compensation Plan” (Plan) and created in accordance with Internal Revenue Code Section 457. The Plan, available to all Bank employees – after certain tenure requirements are met – permits them to defer a portion of their salary until future years. The deferred compensation is not available to employees until termination, retirement, death, or unforeseeable emergency. The Board is responsible for establishing or amending the Plan’s provisions and establishing or amending contribution requirements. The Bank has an obligation to provide for the prudent management of these monies and has contracted with Voya Retirement Insurance and Annuity Company to serve as the Plan administrator. The Bank implemented the Governmental Accounting Standards Board, Statement No. 32, Accounting and Financial Reporting for Internal Revenue Code Section 457 Deferred Compensation Plans. All assets and income of the Plan are held in trust for the exclusive benefit of the participants and their beneficiaries. As a result, deferred compensation investments and the respective liability are not included in the Bank’s financial statements for the years ended June 30, 2019 and 2018.
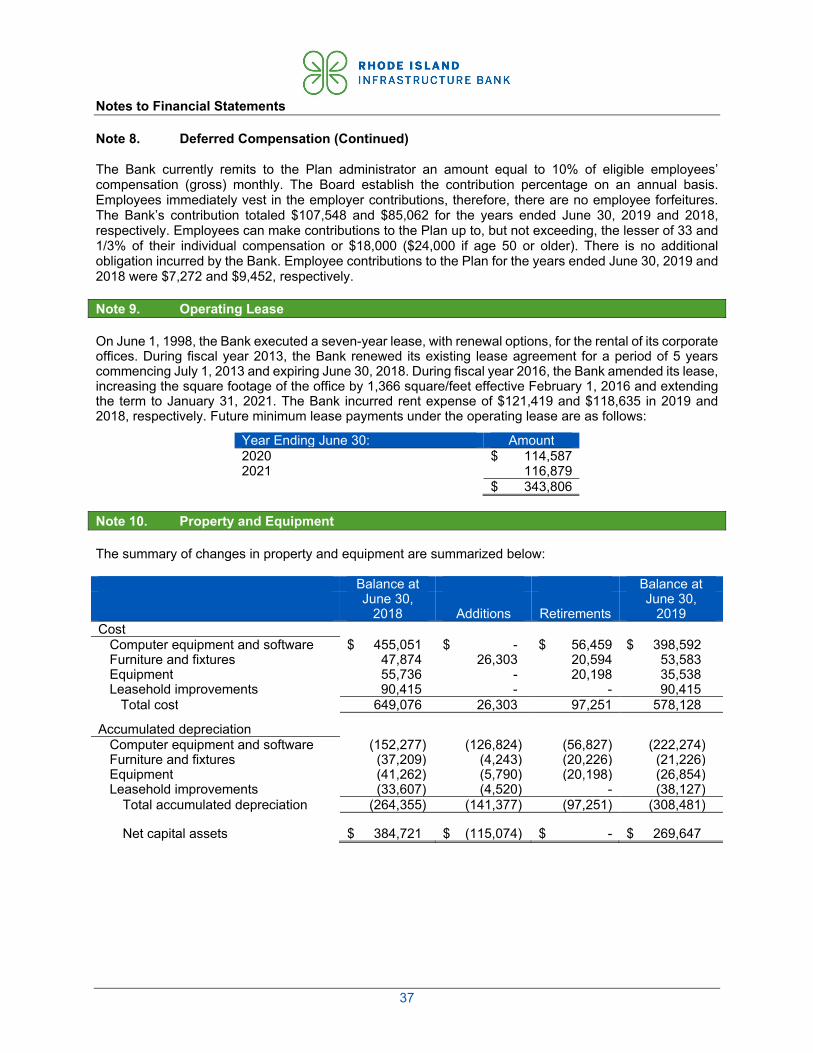
Notes to Financial Statements
37
Note 8. Deferred Compensation (Continued) The Bank currently remits to the Plan administrator an amount equal to 10% of eligible employees’ compensation (gross) monthly. The Board establish the contribution percentage on an annual basis. Employees immediately vest in the employer contributions, therefore, there are no employee forfeitures. The Bank’s contribution totaled $107,548 and $85,062 for the years ended June 30, 2019 and 2018, respectively. Employees can make contributions to the Plan up to, but not exceeding, the lesser of 33 and 1/3% of their individual compensation or $18,000 ($24,000 if age 50 or older). There is no additional obligation incurred by the Bank. Employee contributions to the Plan for the years ended June 30, 2019 and 2018 were $7,272 and $9,452, respectively. Note 9. Operating Lease On June 1, 1998, the Bank executed a seven-year lease, with renewal options, for the rental of its corporate offices. During fiscal year 2013, the Bank renewed its existing lease agreement for a period of 5 years commencing July 1, 2013 and expiring June 30, 2018. During fiscal year 2016, the Bank amended its lease, increasing the square footage of the office by 1,366 square/feet effective February 1, 2016 and extending the term to January 31, 2021. The Bank incurred rent expense of $121,419 and $118,635 in 2019 and 2018, respectively. Future minimum lease payments under the operating lease are as follows:
Year Ending June 30: Amount 2020 $ 114,587 2021 116,879
$ 343,806 Note 10. Property and Equipment The summary of changes in property and equipment are summarized below: Balance at Balance at June 30, June 30, 2018 Additions Retirements 2019 Cost
Computer equipment and software $ 455,051 $ - $ 56,459 $ 398,592 Furniture and fixtures 47,874 26,303 20,594 53,583 Equipment 55,736 - 20,198 35,538 Leasehold improvements 90,415 - - 90,415
Total cost 649,076 26,303 97,251 578,128
Accumulated depreciation Computer equipment and software (152,277) (126,824) (56,827) (222,274) Furniture and fixtures (37,209) (4,243) (20,226) (21,226) Equipment (41,262) (5,790) (20,198) (26,854) Leasehold improvements (33,607) (4,520) - (38,127)
Total accumulated depreciation (264,355) (141,377) (97,251) (308,481)
Net capital assets $ 384,721 $ (115,074) $ - $ 269,647

Notes to Financial Statements
38
Note 10. Property and Equipment (Continued) Balance at Balance at June 30, June 30, 2017 Additions Retirements 2018Cost
Computer equipment and software $ 264,641 $ 190,410 $ - $ 455,051Furniture and fixtures 47,874 - - 47,874Equipment 55,736 - - 55,736Leasehold improvements 90,415 - - 90,415
Total cost 458,666 190,410 - 649,076
Accumulated depreciation Computer equipment and software (67,316) (84,960) - (152,277)Furniture and fixtures (32,780) (4,430) - (37,209)Equipment (35,472) (5,790) - (41,262)Leasehold improvements (29,087) (4,520) - (33,607)
Total accumulated depreciation (164,655) (99,700) - (264,355)
Net capital assets $ 294,011 $ 90,710 $ - $ 384,721 Note 11. Commitments and Contingencies The Bank receives grants from the EPA and the State to fund its loan program activities. These amounts are subject to audit and adjustment by the Federal government. Any disallowed claims, including amounts already collected may constitute a liability of the Bank. The EPA conducts annual fiscal and regulatory compliance reviews to determine that Bank activities follow EPA regulations. As of June 30, 2019 and 2018, no expenditures of the Bank have been disallowed. Management do not believe that any future disallowance of expenditures would be material. Like other areas of the country, some Rhode Island communities continue to experience budget challenges. The impact of these economic conditions on the Bank’s borrowers and their ability to continue to make timely loan repayments is difficult to determine; however, the loans are secured predominantly by revenues from essential water and sewer services. Some communities, particularly smaller communities, may generally be more vulnerable to the effects of downturns in the economy. The Bank continues to monitor the financial status of its borrowers as part of an overall loan portfolio monitoring process. Note 12. Risk Management The Bank is exposed to various risks of loss related to tort; theft of, damage to, or destruction of assets; errors or omissions and injuries to employees. The Bank has purchased commercial insurance to protect itself from potential liabilities from losses or claims. To date, the Bank has not incurred any claims or losses. There were no significant reductions in insurance coverage from the prior year, and there have been no settlements that exceed the Bank’s insurance coverage during the past five years. Note 13. Subsequent Events Management has evaluated potential subsequent events through September 20, 2019, the date the financial statements were issued, the following event is noted: As part of the fiscal year 2020 budget passed by the General Assembly, and signed by the Governor
on July 5, 2019, the Bank is obligated to transfer to the State Controller $4.0 million by June 30, 2020. There were no additional items requiring adjustment of the financial statements or additional disclosure.

RHODE ISLAND INFRASTRUCTURE BANK(A COMPONENT UNIT OF THE STATE OF RHODE ISLAND AND PROVIDENCE PLANTATIONS)COMBINING SCHEDULE OF NET POSITIONJUNE 30, 2019 Bank Clean Water RIWPCRF DWSRF MRBRF WQPCF EBF Total Assets Current assets: Cash, cash equivalents and investments Unrestricted: Cash and cash equivalents $ 26,196,135 $ - $ - $ - $ - $ - $ - $ 26,196,135
Restricted: Cash and cash equivalents 806,766 114,555,623 16,613,405 69,231,804 48,311,628 4,095,892 17,530,418 271,145,536 Investments - 54,549,485 - 17,051,111 8,471,449 - 4,227,007 84,299,052 Total restricted cash, cash equivalents and investments 806,766 169,105,108 16,613,405 86,282,915 56,783,077 4,095,892 21,757,425 355,444,588 Other current assets: Unrestricted: Prepaid expenses, other assets and other receivables 215,576 - - - - - - 215,576
Restricted: Prepaid expenses, other assets and receivables - 10,735,839 (10,735,839) 1,786 1,000 - - 2,786 Service fees receivable 1,768,730 - - - 70,878 - - 1,839,608 Loans receivable 1,148,000 61,368,322 2,750,000 21,275,086 2,992,000 - 2,132,000 91,665,408 Accrued interest receivable: Loans 189,518 4,829,659 89,403 2,919,044 287,872 - 199,207 8,514,703 Investments (7,404) 1,293,500 15,616 1,299,829 229,665 - 103,944 2,935,150 Total current assets 30,317,321 247,332,428 8,732,585 111,778,660 60,364,492 4,095,892 24,192,576 486,813,954
Noncurrent assets: Unrestricted: Loans receivable 90,710,006 - - - - - - 90,710,006 Capital assets - property and equipment, net 269,647 - - - - - - 269,647 Total unrestricted noncurrent assets 90,979,653 - - - - - - 90,979,653 Restricted: Loans receivable - 686,834,724 16,091,733 365,083,941 65,777,557 - 27,879,000 1,161,666,955 Total noncurrent assets 90,979,653 686,834,724 16,091,733 365,083,941 65,777,557 - 27,879,000 1,252,646,608 Total assets 121,296,974 934,167,152 24,824,318 476,862,601 126,142,049 4,095,892 52,071,576 1,739,460,562
Deferred Outflows of Resources - 4,333,880 - 1,044,938 - - - 5,378,818
Liabilities Current liabilities Project costs payable 900,680 67,233,075 7,874,146 55,932,122 36,671,937 - 7,856,917 176,468,877 Bonds payable 7,227,000 46,858,150 14,235,190 1,612,004 1,229,328 71,161,672 Accrued interest payable - 5,113,028 - 1,723,339 257,660 - 208,363 7,302,390 Accounts payable and accrued expenses 258,277 71,538 3,232 267,335 9,991 - 1,549 611,922 Accrued arbitrage rebate 386,572 386,572 Total current liabilities 8,385,957 119,662,363 7,877,378 72,157,986 38,551,592 - 9,296,157 255,931,433 Noncurrent liabilities: Bonds payable 62,919,000 452,350,216 - 209,944,278 30,802,686 - 18,781,651 774,797,831 Accrued arbitrage rebate - 1,154,700 - 93,975 - - - 1,248,675 Total noncurrent liabilities 62,919,000 453,504,916 - 210,038,253 30,802,686 - 18,781,651 776,046,506
Total liabilities 71,304,957 573,167,279 7,877,378 282,196,239 69,354,278 - 28,077,808 1,031,977,939
Deferred Inflows of Resources - 617,674 - 116,742 - - - 734,416 Net Position Net investments in capital assets 269,647 - - - - - - 269,647 Restricted for program purposes - 364,716,079 16,946,940 195,594,558 56,787,771 4,095,892 23,993,768 662,135,008 Unrestricted 49,722,370 - - - - - - 49,722,370 Total net position $ 49,992,017 $ 364,716,079 $ 16,946,940 $ 195,594,558 $ 56,787,771 $ 4,095,892 $ 23,993,768 $ 712,127,025
39

RHODE ISLAND INFRASTRUCTURE BANK (A COMPONENT UNIT OF THE STATE OF RHODE ISLAND AND PROVIDENCE PLANTATIONS) COMBINING SCHEDULE OF NET POSITION JUNE 30, 2018
Bank Clean Water RIWPCRF DWSRF MRBRF WQPCF EBF Total Assets Current assets: Cash, cash equivalents and investments Unrestricted: Cash and cash equivalents $ 26,872,936 $ - $ - $ - $ - $ - $ - $ 26,872,936
Restricted: Cash and cash equivalents 61,763 146,803,170 6,282,026 56,474,289 34,538,194 3,062,603 15,996,535 263,218,580 Investments 62 58,483,497 - 17,411,328 - - - 75,894,887
Total restricted cash, cash equivalents and investments 61,825 205,286,667 6,282,026 73,885,617 34,538,194 3,062,603 15,996,535 339,113,467
Other current assets: Unrestricted: Prepaid expenses, other assets and other receivables 164,373 - - - - - - 164,373
Restricted: Prepaid expenses, other assets and receivables - 7,380,587 (7,380,587) 1,786 - - 1,203,482 1,205,268 Service fees receivable 1,790,598 - - 10,276 47,455 - - 1,848,329 Loans receivable 1,127,000 59,605,362 2,700,000 19,612,685 2,237,000 - - 85,282,047 Accrued interest receivable: Loans 194,908 4,958,012 97,492 2,755,309 189,746 - 179,578 8,375,045 Investments (4,097) 1,447,541 452 679,597 23,576 - (2,835) 2,144,234
Total current assets 30,207,543 278,678,169 1,699,383 96,945,270 37,035,971 3,062,603 17,376,760 465,005,699
Noncurrent assets: Unrestricted: Loans receivable 95,441,005 - - - - - - 95,441,005 Capital assets - property and equipment, net 384,721 - - - - - - 384,721 Total unrestricted noncurrent assets 95,825,726 - - - - - - 95,825,726
Restricted: Loans receivable - 706,884,988 9,165,916 316,725,717 44,760,315 - 27,828,000 1,105,364,936 Total noncurrent assets 95,825,726 706,884,988 9,165,916 316,725,717 44,760,315 - 27,828,000 1,201,190,662
Total assets 126,033,269 985,563,157 10,865,299 413,670,987 81,796,286 3,062,603 45,204,760 1,666,196,361
Deferred Outflows of Resources - 5,260,676 - 1,228,787 - - - 6,489,463
Liabilities Current liabilities Project costs payable 1,820,506 91,275,163 595,417 27,567,891 23,277,652 - 7,647,627 152,184,256 Bonds payable 4,293,000 45,778,853 - 12,823,107 51,291 - 62,946,251 Notes payable - - - - - - 23,345,000 23,345,000 Accrued interest payable - 5,508,930 - 1,889,418 16,618 - 153,494 7,568,460 Accounts payable and accrued expenses 288,099 76,370 - 246,584 226,112 - 5,592 842,757 Accrued arbitrage rebate - 132,022 - - - - - 132,022 Total current liabilities 6,401,605 142,771,338 595,417 42,527,000 23,571,673 - 31,151,713 247,018,746 Noncurrent liabilities: Bonds payable 69,436,000 499,241,797 - 186,150,599 15,296,618 - - 770,125,014 Accrued arbitrage rebate - 1,014,652 - 74,797 - - - 1,089,449 Total noncurrent liabilities 69,436,000 500,256,449 - 186,225,396 15,296,618 - - 771,214,463
Total liabilities 75,837,605 643,027,787 595,417 228,752,396 38,868,291 - 31,151,713 1,018,233,209
Deferred Inflows of Resources - 716,253 - - - - - 716,253 Net Position Net investments in capital assets 384,721 - - - - - - 384,721 Restricted for program purposes - 347,079,793 10,269,882 186,147,378 42,927,995 3,062,603 14,053,047 603,540,698 Unrestricted 49,810,943 - - - - - - 49,810,943 Total net position $ 50,195,664 $ 347,079,793 $ 10,269,882 $ 186,147,378 $ 42,927,995 $ 3,062,603 $ 14,053,047 $ 653,736,362
40

RHODE ISLAND INFRASTRUCTURE BANK(A COMPONENT UNIT OF THE STATE OF RHODE ISLAND AND PROVIDENCE PLANTATIONS)COMBINING SCHEDULE OF REVENUES, EXPENSES AND CHANGES IN NET POSITIONYEAR ENDED JUNE 30, 2019
Bank Clean Water RIWPCRF DWSRF MRBRF WQPCF EBF Total
Operating revenues:
Interest income - loans $ 571,254 $ 14,032,748 $ 248,559 $ 8,450,875 $ 759,111 $ - $ 578,263 $ 24,640,810 Interest income - Investments 585,231 4,985,782 125,565 2,004,248 920,795 21,921 441,220 9,084,762 Loan servicing fees 5,319,693 - - - 187,131 - - 5,506,824 Loan origination fees 494,500 392,650 100,000 245,500 240,000 - 16,975 1,489,625 Grant income - program administration - - - 2,582,228 - - - 2,582,228 Total operating revenues 6,970,678 19,411,180 474,124 13,282,851 2,107,037 21,921 1,036,458 43,304,249 Operating expenses: Interest expense, net - 15,445,861 - 5,824,506 490,107 - 484,472 22,244,946 Program administration, partner agencies - 349,663 - 3,768,753 - - - 4,118,416 Principal forgiveness - 959,023 - 1,174,624 - - - 2,133,647 Personnel 1,660,530 - - - - - - 1,660,530 Debt issuance 15,545 54,317 25,000 546,131 274,232 - 386,922 1,302,147 Professional services 496,407 - - - - - 38,218 534,625 Legal 247,323 - - - - - - 247,323 Correspondent and trustee 245,514 - - 4 - - - 245,518 Information technology 147,619 - - - - - - 147,619 Marketing 123,891 - - - - - - 123,891 Audit and accounting 71,533 - - - - - - 71,533 Financial advisory 48,333 - - 3,500 - - - 51,833 Office expense 170,727 - - - - - - 170,727 Depreciation 141,377 - - - - - - 141,377 Insurance 31,778 - - - - - - 31,778 Business and travel 19,367 - - - - - - 19,367 Dues and subscriptions 6,731 - - - - - - 6,731 Seminars 4,188 - - - - - - 4,188 Total operating expenses 3,430,863 16,808,864 25,000 11,317,518 764,339 - 909,612 33,256,196
Operating income 3,539,815 2,602,316 449,124 1,965,333 1,342,698 21,921 126,846 10,048,053 Non-operating revenue:
Grant Income and other contributed capital 833,476 11,302,072 10,000,009 6,678,603 12,517,078 1,011,368 10,000,004 52,342,610
Non-operating expenses:
Intergovernmental transactions 4,000,000 - - - - - - 4,000,000
Change in net position 373,291 13,904,388 10,449,133 8,643,936 13,859,776 1,033,289 10,126,850 58,390,663 Transfer from (to) other funds (576,938) 3,731,898 (3,772,075) 803,244 - - (186,129) - Net position, beginning of the year 50,195,664 347,079,793 10,269,882 186,147,378 42,927,995 3,062,603 14,053,047 653,736,362 Net position, end of the year $ 49,992,017 $ 364,716,079 $ 16,946,940 $ 195,594,558 $ 56,787,771 $ 4,095,892 $ 23,993,768 $ 712,127,025
41

RHODE ISLAND INFRASTRUCTURE BANK (A COMPONENT UNIT OF THE STATE OF RHODE ISLAND AND PROVIDENCE PLANTATIONS) COMBINING SCHEDULE OF REVENUES, EXPENSES AND CHANGES IN NET POSITION YEAR ENDED JUNE 30, 2018 Bank Clean Water RIWPCRF DWSRF MRBRF WQPCF EBF Total Operating revenues: Interest income - loans $ 846,657 $ 14,442,981 $ 304,478 $ 8,125,671 $ 544,181 $ - $ 434,585 $ 24,698,553 Interest income - Investments 273,313 3,595,299 10,906 1,264,620 219,512 - 129,859 5,493,509 Loan servicing fees 5,813,816 - - - (358,401) - - 5,455,415 Loan origination fees 106,450 284,365 - 190,500 250,000 - - 831,315 Grant income - program administration 950,606 - - 1,520,588 - - - 2,471,194 Total operating revenues 7,990,842 18,322,645 315,384 11,101,379 655,292 - 564,444 38,949,986 Operating expenses: Interest expense, net (711,040) 17,151,829 - 6,194,061 123,907 - 156,897 22,915,654 Program administration, partner agencies 399,039 795,950 - 926,696 - - - 2,121,685 Principal forgiveness - 1,010,487 - 899,416 - - - 1,909,903 Personnel 1,446,083 - - - - - - 1,446,083 Debt issuance 80,744 335,608 - 173,386 420,046 - 135,160 1,144,944 Professional services 429,662 - - - - - 45,398 475,060 Legal 240,129 - - - - - - 240,129 Correspondent and trustee 277,970 - - - - - - 277,970 Information technology 201,262 - - - - - - 201,262 Marketing 107,090 - - - - - - 107,090 Audit and accounting 101,820 - - - - - - 101,820 Financial advisory 55,270 - - - - - - 55,270 Office expense 171,164 - - - - - - 171,164 Depreciation 99,700 - - - - - - 99,700 Insurance 29,405 - - - - - - 29,405 Business and travel 26,247 - - - - - - 26,247 Dues and subscriptions 17,364 - - - - - - 17,364 Seminars 755 - - - - - - 755 Total operating expenses 2,972,664 19,293,874 - 8,193,559 543,953 - 337,455 31,341,505 Operating income 5,018,178 (971,229) 315,384 2,907,820 111,339 - 226,989 7,608,481 Non-operating revenue:
Grant Income and other contributed capital 88,939 15,632,110 - 9,128,279 6,545,997 890,001 5,000,000 37,285,326 Non-operating expenses:
Intergovernmental transactions 3,500,000 - - - - - - 3,500,000 Change in net position 1,607,117 14,660,881 315,384 12,036,099 6,657,336 890,001 5,226,989 41,393,807 Transfer from (to) other funds (4,923,390) 4,713,908 (2,764,529) 1,235,286 518,967 39,852 1,179,906 - Net position, beginning of the year 53,511,937 327,705,004 12,719,027 172,875,993 35,751,692 2,132,750 7,646,152 612,342,555 Net position, end of the year $ 50,195,664 $ 347,079,793 $ 10,269,882 $ 186,147,378 $ 42,927,995 $ 3,062,603 $ 14,053,047 $ 653,736,362
42

BorrowerTotal Loans Receivable
Project Costs
Disbursed
Project Costs
Payable
Barrington $ 3,500,000 $ 50,000 $ 3,450,000 Bristol 1,469,000 1,469,000 - Burrillville 476,000 211,774 264,226 Central Falls 1,500,000 15,000 1,485,000 Coventry 937,000 924,576 12,424 Cranston 1,597,000 1,597,000 - Cumberland 466,042 272,941 193,101 East Greenwich 6,141,000 4,914,197 1,226,803 East Providence 761,000 761,000 - Hopkinton 171,000 103,104 67,896 Middletown 5,000,000 3,730,811 1,269,189 New Shoreham 892,000 810,708 81,292 Newport 925,000 925,000 - Pawtucket 16,901,000 13,953,674 2,947,326 Providence Public Building Authority 9,596,000 270,162 9,325,838 Warwick 1,335,000 1,102,608 232,392 Warren 2,000,000 - 2,000,000 Westerly 15,000,000 883,548 14,116,452 West Warwick 102,515 102,515 -
Total $ 68,769,557 $ 32,097,618 $ 36,671,939
RHODE ISLAND INFRASTRUCTURE BANK (A COMPONENT UNIT OF THE STATE OF RHODE ISLAND AND PROVIDENCE PLANTATIONS) SCHEDULE OF MUNICIPAL ROAD AND BRIDGE REVOLVING FUND - OUTSTANDING LOAN BALANCES BY COMMUNITY YEAR ENDED JUNE 30, 2019
43

RHODE ISLAND INFRASTRUCTURE BANK (A COMPONENT UNIT OF THE STATE OF RHODE ISLAND AND PROVIDENCE PLANTATIONS) STATE REQUIRED STATEMENTS OF NET POSITION JUNE 30, 2019 AND 2018
2019 2018
AssetsCurrent assets:
Cash and cash equivalents $ 26,196,135 $ 26,872,936 Investments - - Receivables (net) 13,289,461 12,367,608 Restricted assets:
Cash and cash equivalents 271,145,536 263,218,580 Investments 84,299,052 75,894,887 Receivables (net) 91,665,408 85,282,047 Other assets 218,362 1,369,641
Due from primary government - - Due from other component units - - Due from other governments - - Inventories - - Other assets - -
Total current assets 486,813,954 465,005,699
Noncurrent assets:Investments - - Receivables (net) 90,710,006 95,441,005 Restricted assets:
Cash and cash equivalents - - Investments - - Receivables (net) 1,161,666,955 1,105,364,939 Other assets - -
Due from other component units - - Capital assets - nondepreciable - - Capital assets - depreciable (net) 269,647 384,721 Other assets, net of amortization - -
Total noncurrent assets 1,252,646,608 1,201,190,665
Total assets 1,739,460,562 1,666,196,364
Deferred Outflows of ResourcesHedging instruments - - Deferred loss on refunding of debt 5,378,818 6,489,463 Deferred pension amounts - - Other deferred outflows of resources - -
Total deferred outflows of resources 5,378,818 6,489,463
44

RHODE ISLAND INFRASTRUCTURE BANK (A COMPONENT UNIT OF THE STATE OF RHODE ISLAND AND PROVIDENCE PLANTATIONS) STATE REQUIRED STATEMENTS OF NET POSITION (CONTINUED) JUNE 30, 2019 AND 2018
2019 2018
Liabilities Current liabilities:
Cash overdraft $ - $ - Accounts payable 611,922 842,760 Due to primary government - - Due to other component units - - Due to other governments - - Unearned revenue - - Other current liabilities 184,157,839 183,229,738 Current portion of long-term debt 71,161,672 62,946,251
Total current liabilities 255,931,433 247,018,749
Noncurrent liabilities:Due to primary government - -
- - Due to other governments - - Net pension liability - - Net OPEB obligation - - Unearned revenue - - Notes payable - - Loans payable - - Obligations under capital leases - - Compensated absences - - Bonds payable 774,797,831 770,125,014 Other liabilities 1,248,675 1,089,449
Total noncurrent liabilities 776,046,506 771,214,463
Total liabilities 1,031,977,939 1,018,233,212
Deferred Inflows of ResourcesDeferred gain on refunding of debt 734,416 716,253 Deferred pension amounts - -
Total deferred inflows of resources 734,416 716,253
Net PositionNet investment in capital assets 269,647 384,721 Restricted for:
Debt - - Other 662,135,008 603,540,701
Unrestricted 49,722,370 49,810,940
Total net position $ 712,127,025 $ 653,736,362
Due to other component units
45

RHODE ISLAND INFRASTRUCTURE BANK (A COMPONENT UNIT OF THE STATE OF RHODE ISLAND AND PROVIDENCE PLANTATIONS) STATE REQUIRED STATEMENT OF ACTIVITIES YEARS ENDED JUNE 30, 2019 AND 2018
2019 2018
Expenses $ 37,256,196 $ 34,841,505
Program RevenuesCharges for services 6,996,449 6,286,730 Operating grants and contributions 2,582,228 2,471,194 Capital grants and contributions 52,342,610 37,285,326
Total program revenues 61,921,287 46,043,250
Net (expenses) revenues 24,665,091 11,201,745
General RevenuesInterest and investment earnings 33,725,572 30,192,062 Miscellaneous revenue - -
Total general revenues 33,725,572 30,192,062
Special items - - Extraordinary items - -
Change in net position 58,390,663 41,393,807
Total net position - beginning 653,736,362 612,342,555
Total net position - ending $ 712,127,025 $ 653,736,362
46

RHODE ISLAND INFRASTRUCTURE BANK (A COMPONENT UNIT OF THE STATE OF RHODE ISLAND AND PROVIDENCE PLANTATIONS) STATE REQUIRED SCHEDULE OF DEBT SERVICE TO MATURITY (BONDS ONLY) LONG TERM DEBT
Principal Interest
$ 62,780,213 $ 31,873,443 62,397,866 29,661,906 60,976,500 27,144,976 64,010,011 24,516,841 49,865,000 22,043,401
225,460,000 77,024,327 176,200,000 31,924,166
62,370,000 6,338,531 1,700,000 1,102,600
11,575,000 32,850
$ 777,334,590 $ 251,663,041
Long Term DebtEndingFiscal Year
2025-20292030-20342035-20392040-2044
2045
30-Jun
2024
2020202120222023
47

RHODE ISLAND INFRASTRUCTURE BANK (A COMPONENT UNIT OF THE STATE OF RHODE ISLAND AND PROVIDENCE PLANTATIONS) STATE REQUIRED SCHEDULE OF CHANGES IN LONG-TERM DEBT YEAR ENDED JUNE 30, 2019
Beginning Ending Due Within DueBalance Additions Reductions Balance One Year Thereafter
Bonds and leases payable, restricted $ 765,319,000 $ 82,295,000 $ 70,279,410 $ 777,334,590 $ 62,780,213 $ 714,554,377 Net unamortized premium / discount 67,752,265 9,401,937 8,529,289 68,624,913 8,381,459 60,243,454
Bonds payable 833,071,265 91,696,937 78,808,699 845,959,503 71,161,672 774,797,831
Notes payable - - - - - - Loans payable - - - - - - Obligations under capital leases - - - - - - Net OPEB liability - - - - - - Net pension obligation - - - - - - Due to primary government - - - - - - Due to component units - - - - - - Due to other governments and agencies - - - - - - Unearned revenue - - - - - - Compensated absences - - - - - -
Reported as other liabilitiesArbitrage rebate 1,221,471 413,776 - 1,635,247 386,572 1,248,675 Pollution remediation - - - - - - Items not listed above - - - - - -
Other liabilities 1,221,471 413,776 - 1,635,247 386,572 1,248,675
$ 834,292,736 $ 92,110,713 $ 78,808,699 $ 847,594,750 $ 71,548,244 $ 776,046,506
48

RHODE ISLAND INFRASTRUCTURE BANK (A COMPONENT UNIT OF THE STATE OF RHODE ISLAND AND PROVIDENCE PLANTATIONS) STATE REQUIRED SCHEDULE OF CHANGES IN LONG-TERM DEBT YEAR ENDED JUNE 30, 2018
Beginning Ending Due Within DueBalance Additions Reductions Balance One Year Thereafter
Bonds and leases payable, restricted $ 777,524,000 $ 36,680,000 $ 48,885,000 $ 765,319,000 $ 54,864,410 $ 710,454,590 Net unamortized premium / discount 74,158,023 2,109,015 8,514,773 67,752,265 8,081,841 59,670,424
Bonds payable 851,682,023 38,789,015 57,399,773 833,071,265 62,946,251 770,125,014
Notes payable - - - - - - Loans payable - - - - - - Obligations under capital leases - - - - - - Net OPEB liability - - - - - - Net pension obligation - - - - - - Due to primary government - - - - - - Due to component units - - - - - - Due to other governments and agencies - - - - - - Unearned revenue - - - - - - Compensated absences - - - - - -
Reported as other liabilitiesArbitrage rebate 1,821,831 423,682 1,024,042 1,221,471 132,022 1,089,449 Pollution remediation - - - - - - Items not listed above - - - - - -
Other liabilities 1,821,831 423,682 1,024,042 1,221,471 132,022 1,089,449
$ 853,503,854 $ 39,212,697 $ 58,423,815 $ 834,292,736 $ 63,078,273 $ 771,214,463
49

RHODE ISLAND INFRASTRUCTURE BANK(A COMPONENT UNIT OF THE STATE OF RHODE ISLAND AND PROVIDENCE PLANTATIONS)STATE REQUIRED SCHEDULE OF TRAVEL AND ENTERTAINMENTYEAR ENDED JUNE 30, 2019
Traveler(s) Date(s) Location Amount Purpose
Executive Director July 9 - 11, 2019 Washington, DC $ 455.60 Green Bank Summit (for travel in FY2020)
Executive Director
July 16 - 17, 2019 New York, NY 794.25 UN SDG 13 event - banker meeting (for travel in FY2020)
Executive DirectorSeptember 24, 2018 New York, NY 226.00 HSBC Sustainability Conference, Environmental
Finance Conference (Speaker Engagement)Executive Director, Chief Operating Officer, and Director, Program Operations
November 6 - 9, 2018 Albuquerque, NM 3,222.11 CIFA Conference
Executive Director November 8 - 9, 2018 Dallas, TX 1,248.44 CDFA Conference
Executive Director November 26 - 30, 2018 Shanghai, China 829.91 Green Bank Congress
Various December 20, 2018 Providence, RI 304.77 Lunch meeting
Director, Stormwater and Resiliency March 20 - 22, 2019 Baltimore, MD 458.06 Climate Leadership Conference
Executive Director April 3 - 5, 2019 Austin, TX 1,233.20 PACENation SummitExecutive Director April 22 - 25, 2019 Washington, DC 1,298.16 CIFA - Water Infrastructure Investment Conference
10,070.50
Other incidental travel and entertainment 3,319.50
Total $ 13,390.00
50