rhine and guadiana basins - newater final.pdf · authors stefano barchiesi, katharine cross, mark...
TRANSCRIPT

INVENTORY OF CLIMATE AND MANAGEMENT SCENARIOS
Rhine and Guadiana Basins Report of the NeWater project - New Approaches to Adaptive Water Management under Uncertainty www.newater.info

Title Inventory of Climate and Management Scenarios for the Rhine and Guadiana Basins
Purpose To provide a set of relevant scenarios for different trajectories related to climate, infrastructure development and land use. Scenarios will be used to test a model intended to compare alternate strategies for adaptive management of water storage and buffering of river flows provided by reservoirs and groundwater.
Filename NW D154 final
Authors Stefano Barchiesi, Katharine Cross, Mark Smith
Document history
Current version.
Changes to previous version.
Date 30.06.08
Status Final
Target readership
General readership
Correct reference
IUCN
June 2008
Prepared under contract from the European Commission
Contract no 511179 (GOCE) Integrated Project in PRIORITY 6.3 Global Change and Ecosystems in the 6th EU framework programme
Deliverable title: Report on Inventory of Climate and Management Scenarios
for the Rhine and Guadiana Basins Deliverable no. : D 1.5.4 Due date of deliverable: Month 42 Actual submission date: 30.06.2008 Start of the project: 01.01.2005 Duration: 4 years

Policy Brief
Overview of the problem
NeWater is concerned with the transition towards more integrated, adaptive approaches in water management. Progress is supported by application of climate, hydrological and water resources assessment models. More comprehensive vulnerability assessments can then build on patterns observed from past and current hydrological cycles to provide insight into the implications of future water resources availability for adaptive management.
Scenario analysis is a crucial tool for policy design. It assists in identifying uncertainties and in finding strategies that perform well under different possible future developments. A better understanding of the key elements and dynamics of water management regimes is needed to evaluate and compare alternative strategies. With this understanding, the transition towards adaptive management can be implemented and supported more effectively. The report contributes to building the realistic models developed by WP 1.5 partners and improving the understanding of buffering capacity. In particular, it has found the water and land use management options that are plausible for the Rhine and Guadiana Basins under three different sets of climate and socioeconomic conditions.
Critique of current water management
A well-known issue in climate change and weather modelling is the feedback between different physical characteristics of river basins. Feedback caused by anthropogenic influences on hydro-geological processes such as irrigation, water storage facilities like dams, and agricultural land use changes and management are not adequately considered within current climate models. Socio-economic factors such as institutional capacity, transaction costs of policies, or the willingness to pay for water rights, also are not well incorporated into models. This often results in a limited representation of the hydrological cycle, and especially of possible future options for water management.
This study was concerned with addressing how system interactions influence future choices for basin management in the Rhine and Guadiana Basins. The aim was to examine realistic simulations of system components and describe broader processes in more detail for future basin scenarios. Scenarios that contained unreasonable combinations of variables were discarded from the analysis.
Under three different IPCC climate and socioeconomic scenarios, 2001-2050 storylines of alternative water management were developed for the Rhine and Guadiana Basins. The management of low flows in the Rhine Basin can be maximised by groundwater withdrawals in the driest conditions, and by reservoir storage under conditions of low evaporation. The management of the Mancha Occidental aquifer in the Upper Guadiana Basin can be maximised through groundwater withdrawals for water-intensive species in wet conditions, and by modified cropping patterns in favour of less water-intensive species in the driest conditions. The management of the Caia reservoir in response to multiple water users in the Lower Guadiana Basin can be maximised through a lower degree of allocation following conflict resolution in the driest conditions, and further development of water supply in the wettest conditions.
Policy recommendations
Water management and land use practiced under current conditions is not necessarily optimal for buffering capacity in a changing climate. The associated hydrological regime and rate of water demand would tend to steer the system towards a more stable state. New water policy and management should be put in place to recover any lost smoothing capacity of the buffer. Moreover, stream flows, reservoirs, and aquifers do not seem to act as an early warning mechanism due to delaying effects. The wider the buffer the higher the capacity, but warnings of extreme events such as floods and droughts are later. Therefore, a higher buffering capacity does not only lessen the need for
iii

government intervention in terms of post-event relief. When water demand and policy-making react to changing natural conditions, more attention should be paid to preparedness and prediction.
No linear correlation has been observed between the most adverse climate conditions, the poorest hydrological regime and the weakest demand of water. At the European and national levels, this may result in increasing efforts to integrate water, agriculture, and energy policies. At catchment scale, it may imply difficulties in identifying appropriate shares and priorities for allocating water among users. The delay in the feedback loops does not allow for snapshot evaluations of the buffering capacity of hydrological systems. Further modelling is recommended to estimate temporal thresholds and associate probability values to the single scenarios that are described in this report. In each case, it seems reasonable to develop a combination of the proposed strategies.
The outputs from Deliverable 1.5.4 combined with the work being carried out by WP 1.5 partners can be used to aid river basin stakeholders and decision-makers to understand the possible consequences of management options put in place under different climate, land use and water abstraction scenarios. The information is important to guide decision makers towards making better informed management decisions in a timely manner and avoiding inconsistent provisions. Adaptive water management is a complex problem which is normally difficult to grasp from the various angles. The reasonable alternatives have been simplified and made more accessible by the scenario analysis.
iv
Executive Summary
Overview This report comprises Deliverable 1.5.4 of the New Approaches to Adaptive Water Management Under Uncertainty (NeWater) project. The overall objective of the study was to provide a set of relevant scenarios for different trajectories related to climate, infrastructure development and land use in the Rhine and Guadiana basins. Scenarios are used to test a model that compares alternate strategies for adaptive management through water storage and buffering of river flows provided by reservoirs and groundwater. How this report relates to other Work Package 1.5 deliverables is briefly explained in the introduction (Chapter 1).
A model for developing climate and management scenarios Chapter 2 introduces the analytical framework used to construct the scenarios. First, the method of Formative Scenario Analysis (FSA) is presented and the application of the theory to the study is explained. Secondly, the chosen IPCC climate change scenarios are described and the impact variables of the river basin system defined. Thirdly, a step-by-step overview of the model assumptions is provided. Finally, the concept of buffering capacity as envisaged by the Work Package partners is adapted to the Rhine and Guadiana case studies.
Chapter 3 reports the model results for six different modules: Climate, Hydrology, Water Demand, Water Policy, Water and Land Use Management, Buffering Capacity. The results are ranges of values for each of the impact variables identified. Values were determined according to three sets of bounded conditions determined from the chosen IPCC scenarios. These ranges represent three possible levels that each variable can have and their extremes have been quantified through relevant indicators such as the Aridity Index for Climate or deficits of mean annual discharge for Hydrology.
Climate and Management Scenarios for the Rhine and Guadiana Basin
The results of the different combination of variables in Chapter 4 show the various storylines stemming from alternative management strategies for water storage and buffering of river flows. Each scenario depicts the most plausible levels of climate, hydrology, water demand, water policy, and buffering capacity under a given water or land use management regime. Chapter 5 discusses how the management of low flows in the Rhine Basin can be maximised by groundwater withdrawals in the driest conditions, and by reservoir storage under conditions of low evaporation. Using groundwater storage to supplement low flows is a management option in an intermediate climate that favours towards wetter conditions. The management of the Mancha Occidental aquifer in the Upper Guadiana Basin can be maximised through groundwater withdrawals for water-intensive species in wet conditions. Under the driest conditions, the solution would be to have modified cropping patterns in favour of less water-intensive species. Better irrigation techniques and prevailing drip-irrigated crops can occur in an intermediate situation where the climate conditions are similar to the present. The management of the Caia reservoir in response to multiple water users in the Lower Guadiana Basin can be maximised through a lower degree of allocation following conflict resolution in the driest conditions, and further development of water supply in the wettest conditions. Water conservation following efficiency measures can occur in an intermediate situation where the climate conditions are similar to the present.
The storylines described enable river basin stakeholders and decision-makers to concentrate on the possible consequences of each management option and allow them to define their negotiation criteria.
v

Table of contents .................................................................................................................................... 9 1 Introduction
................................................................................................................... 10 2 Analytical framework
2.1 ............................................................................................... 10 Formative Scenario Analysis
2.2 .............................................. 10 Climate change scenarios and water management storylines
2.3 .......................................................................................... 13 Overview of model assumptions
2.4 ................................................................................................................ 17 Buffering capacity
................................................................................................................................ 19 3 Model results
3.1 .................................................................................................................................... 19 Rhine
3.2 ................................................................................................................... 25 Upper Guadiana
3.3 ................................................................................................................... 31 Lower Guadiana
............................................................................................ 33 4 Climate and Management Scenarios
4.1 .................................................................................................................................... 34 Rhine
4.2 ................................................................................................................... 34 Upper Guadiana
4.3 ................................................................................................................... 35 Lower Guadiana
..................................................................................................................................... 36 5 Discussion
.................................................................................................................................. 42 6 Conclusions
................................................................................................................................... 44 List of references
................................................................. 46 Annex I: frequency of low flow events for the Rhine Basin
.................................................................... 48 Annex II: return flows for the Rhine and Guadiana Basin
List of Tables
...................................... 13 Table 1 Ranges of the 3 possible levels for the 6 (+1) variables of the model
........ 14 Table 2 Datasets of variables downloaded from the ENSEMBLE climate modeling experiment
.................................................................... 18 Table 3 Criteria to define buffering capacity components
Table 4 Climate Moisture Index for the Rhine Basin under the B1, A1B and A2 climate change scenarios ....................................................................................................................... 19 Table 5 Changes in the Coefficient of Variation of the monthly mean precipitation and PET for the Rhine under the B1 climate change scenario ............................................................................. 20 Table 6 Changes in the Coefficient of Variation of the monthly mean precipitation and PET for the Rhine under the A1B climate change scenario .......................................................................... 20 Table 7 Changes in the Coefficient of Variation of the monthly mean precipitation and PET for the Rhine under the A2 climate change scenario............................................................................. 21 Table 8 Frequency of monthly discharge deficits for the Rhine Basin under the B1, A1B and A2 climate change scenarios ....................................................................................................................... 21 Table 9 Buffering capacity for the Rhine Basin under the B1, A1B and A2 climate change scenarios ....................................................................................................................... 23
vi

Table 10 Proportion (%) of 30.4-day periods that the Rhine discharge is below a certain threshold under the B1, A1B and A2 climate change scenarios ........................................................................... 23
... 23 Table 11 Water use ratio for the Rhine Basin under the B1, A1B and A2 climate change scenarios
... 24 Table 12 Evolution of water use ratio in the Rhine river basin at different stages of the time series
............................................................................. 24 Table 13 Water policy options for the Rhine region
Table 14 Aridity Index for the Guadiana Basin under the B1, A1B and A2 climate change scenarios ....................................................................................................................... 25 Table 15 Changes in the Coefficient of Variation of the monthly mean precipitation and PET for the Guadiana Basin under the B1 climate change scenario ............................................................. 25 Table 16 Changes in the Coefficient of Variation of the monthly mean precipitation and PET for the Guadiana Basin under the A1B climate change scenario .......................................................... 26 Table 17 Changes in the Coefficient of Variation of the monthly mean precipitation and PET for the Guadiana Basin under the A2 climate change scenario ............................................................. 27 Table 18 Frequency of monthly discharge deficits the Guadiana Basin under the B1, A1B and A2 climate change scenarios ....................................................................................................................... 27 Table 19 Buffering capacity for the Upper Guadiana Basin under the B1, A1B and A2 climate change scenarios ....................................................................................................................... 29 Table 20 Changes in water withdrawal from the Rhine Basin under the B1, A1B and A2 climate change scenarios ....................................................................................................................... 29 Table 21 Evolution of the water use ratio in the Upper Guadiana Basin at different stages of the time series under the B1, A1B and A2 climate change scenarios ............................................... 30
............................................................ 30 Table 22 Water policy options for the Upper Guadiana region
Table 23 Buffering capacity for the Lower Guadiana Basin under the B1, A1B and A2 climate change scenarios ....................................................................................................................... 31 Table 24 Changes in water withdrawal from the Lower Guadiana Basin under the B1, A1B and A2 climate change scenarios ....................................................................................................................... 31 Table 25 Evolution of water use ratio in the Lower Guadiana at different stages of the time series under the B1, A1B and A2 climate change scenarios ............................................... 32
............................................................ 32 Table 26 Water policy options for the Lower Guadiana region
Table 27 Impact variables and corresponding levels for the three River Basins................................... 33 .................................................................. 34 Table 28 Water Management options for the Rhine region
.................................................. 34 Table 29 Water Management options for the Upper Guadiana region
............................................ 35 Table 30 Land Use Management options for the Upper Guadiana region
................................................. 35 Table 31 Water Management options for the Lower Guadiana region
............................................................................................... 37 Table 32 Scenario ranking for the Rhine
.............................................................................. 39 Table 33 Scenario ranking for the Upper Guadiana
............................................................................. 41 Table 34 Scenario ranking for the Lower Guadiana
vii

List of Figures Figure 1 Graphical model representing the set of 6 (+1) variables analysed and their causal interdependencies. ................................................................................................................................. 12
............................................................................ 15 Figure 2 Schematic of the GR2M river basin model.
.................................................. 19 Figure 3 Evolution of climate in the Rhine Basin for the B1 scenario
............................................... 20 Figure 4 Evolution of climate in the Rhine Basin for the A1B scenario
................................................. 21 Figure 5 Evolution of climate in the Rhine Basin for the A2 scenario
................ 22 Figure 6 Evolution of the hydrological regime of the Rhine catchment for the B1 scenario
............. 22 Figure 7 Evolution of the hydrological regime of the Rhine catchment for the A1B scenario
................ 23 Figure 8 Evolution of the hydrological regime of the Rhine catchment for the A2 scenario
..................................... 25 Figure 9 Evolution of climate in the Guadiana catchment for the B1 scenario
................................ 26 Figure 10 Evolution of climate in the Guadiana catchment for the A1B scenario
.................................. 27 Figure 11 Evolution of climate in the Guadiana catchment for the A2 scenario
....... 28 Figure 12 Evolution of the hydrological regime of the Guadiana catchment for the B1 scenario.
..... 28 Figure 13 Evolution of the hydrological regime of the Guadiana catchment for the A1B scenario
........ 29 Figure 14 Evolution of the hydrological regime of the Guadiana catchment for the A2 scenario
viii

Introduction
9
1 Introduction Work Package 1.5 requires partners to focus on the concept of “buffering capacity” as a management means “…to reduce uncertainties in water supply, and buffer natural as well as anthropogenic variability, in particular in extreme events”. The concept has been developed inline with the more general goal of the NeWater Project, which is to address the transition from current water management regimes to adaptive water management. One of the specific tasks of deliverable 1.5.4 is to identify climate change scenarios for the Rhine and Guadiana case studies. This has been done by translating the results from Work Block 2 “Vulnerability and adaptive management in river basins” into input data for the models developed by other Work Package 1.5 partners. In particular, the existing climate change scenarios compiled in Work Package 2.2 “Understanding the consequences of climate hazards and climate change” were reviewed to produce similar IPCC scenario-based time-series regarding modification of hydrological regimes and water demand. The overall objective of the study was to provide a set of relevant scenarios that can be used in testing a model of storage and buffering capacity in river basins. This has been done by collating data on rainfall statistics, reservoir level time-series and groundwater withdrawals, among others. Further modelling will compare alternate strategies for adaptive management of water storage and buffering of river flows provided by reservoirs and aquifers in the Rhine and Guadiana Basins. Developing the model has involved selecting a set of scenarios for different future trajectories related to climate, infrastructure development and land use. The 50-year time series for both the Rhine and Guadiana Basin was retrieved from a climate modelling experiment. Modified stream discharges were calculated by means of a monthly-step rainfall-runoff model. The projected distribution of rainfall and potential evapotranspiration were identified as appropriate climate variables to match the parameters of this hydrological model. Future water demand was estimated through population and economic growth projections under the chosen IPCC emission scenarios. Water policy options were based upon the agronomic and structural characteristics of the two studied regions. The buffering elements within the hydrological systems comprise of reservoir management scenarios that apply to the Rhine and Lower Guadiana, while groundwater abstraction and land-use scenarios are relevant to the Upper Guadiana. The results of combining different variables outlined in the preceding paragraph show the different storylines stemming from alternative management strategies for water storage and buffering of river flows. As it is virtually impossible to foresee the exact development of climate and land use for a 50 year horizon, scenarios will be used to assess several possible future outcomes of managing hydraulic systems. Each scenario depicts the most plausible levels of climate, hydrology, water demand, water policy, and buffering capacity under a given water or land use management regime. In this way, river basin stakeholders will be able to concentrate on the consequences outlined in each management option.

Analytical framework
10
2 Analytical framework Climate change adaptation policy in general and water resources management in particular are undergoing a transition process which incorporates sustainable development concepts. An analytical framework is required to assess the effectiveness of policy benefits and thus accommodate the often loosely-defined, society-relevant and real-world nature of such an environmental problem (Wiek, Binder & Scholz, 2006).
In business as in policy, decision support tools that aid understanding of uncertainty in complex systems can strengthen strategic decision-making. Adaptive management is needed to navigate through the complexity of sustainability-oriented regulatory intervention. The concept of transition management as an intentional influence over the development of organisational and societal systems has been developed in linkage to a variety of approaches e.g. integrated planning, complex problem solving, and decision-making (Lessard, 1998, Ravetz, 2000, Rotmans, van Asselt & Vellinga, 2000; DeTombe, 2001, Mingers & Rosenhead, 2004; Scholz & Tieje, 2002; Bell & Morse, 2003; in Wiek, Binder, & Scholz, 2006). Scenario construction has been recognized as a valid tool that can help unravel complexity due to its broad spectrum of applications including for example behaviours of companies, cities, regions, energy systems and countries (Scholz & Tietje, 2002 in Barchiesi, 2006).
2.1 Formative Scenario Analysis
The main methodological approach in this deliverable is scenario analysis. Unlike most traditional approaches to forecasting, it provides a qualitative, contextual description of how the present will evolve into the future, rather than adding numerical precision. Multiple futures are usually described through a set of alternatives, each of which represents a possible state of the system under consideration. Since future occurrences may be plausible but never assured, no probabilities are assigned to scenarios as they may convey a sense of precision that is not warranted. Nevertheless, the accuracy of the assumptions is more important than the method of construction itself. “To guarantee meaningfulness, scenarios should be based on a coherent, internally consistent, reproducible and plausible set of assumptions and/or theories of the key relationships and driving forces of change” (IPCC, 2000 in Menzel et al., 2007, p.7).
“The term formative scenario analysis (FSA) was introduced by Scholz (1996) in order to distinguish construction of future states of a system based on impact scenarios from intuitively and less transparently defined scenario constructions” (Spielmann et al., 2005, p. 326). FSA is a tool that addresses disturbance variables, i.e. only those aspects of the system under consideration which are known and bring about fundamental change to the behaviour of the whole system. Unknown variables might also bring about change, this change is not immediately apparent. For example, climate change, socio-economic development and water management policies are known to have an influence on hydrological regimes However, knowledge of their interactions is insufficient to allow for the formulation of quantitative relationships. In the absence of quantitative relationships among variables, conventional sensitivity analysis based on both fixed model structure and thorough quantifications of a model is not applicable. Therefore, FSA may be considered as a type of structured sensitivity analysis for cases characterised by a fixed model structure in terms of variables, but partly unknown quantitative relationships among the model variables (Spielmann et al., 2005). In this sense, the application of FSA to the storage and buffering capacity of river basins can be justified.
2.2 Climate change scenarios and water management storylines
A storyline is a narrative description of a scenario (or a family of scenarios), highlighting the main scenario characteristics and dynamics, and the relationships between key driving forces. Starting from three IPCC emission scenarios, 50-year catchment-scale storylines have been described based on the analysis of the most relevant water management alternatives.

Analytical framework
11
2.2.1 IPCC Special Report on Emission Scenarios (SRES)
The IPCC defines scenarios as ‘‘plausible descriptions of how the future may develop, based on a coherent and internally consistent set of assumptions about key relationships and driving forces’’ (IPCC, 2000b in Millennium Ecosystem Assessment, 2005, p. 147). The IPCC B1, A1B and B2 scenarios were considered in the current analysis, ranging from optimistic to pessimistic respectively. The well accepted and commonly known IPCC storylines describe a demographic, political-economic, societal and technological future. The related scenarios explore global energy, industry and other developments and their implications for greenhouse gas emissions. Therefore, data on population growth, GDP, electricity production, and irrigated area can be used to estimate future water demand along with climate change projections.
The letters A and B describe the economic dimension of the global development. The A scenarios exhibit a stronger economic growth and the B scenarios are more oriented towards sustainability and ecologic protection. The numbers 1 and 2 indicate the level of international cooperation. One stands for a diverse world focusing on local and regional alliances whereas two means a strong international cooperation and exchange of technologies. Several global circulation models have been simulated based upon these four families of climate scenarios.
The B1 scenario describes a storyline with rapid change in economic structures toward a service and information economy, with reductions in material intensity and the introduction of clean and resource-efficient technologies. The B1 storyline implies a relatively smooth transition to alternative energy systems as conventional oil and gas resources decline. There is extensive use of conventional and unconventional gas as the cleanest fossil resource during the transition, but the major push is toward post-fossil technologies, driven in large part by environmental concerns.
The A1B marker scenario is part of the A1 family which assumes a balanced mix of technologies and supply sources, with technology improvements and resource assumptions such that no single source of energy is overly dominant. All in all, this development is characterised by very rapid economic growth against low population growth, rapid introduction of effective new technologies, and substantial reductions in regional differences in per capita income.
The A2 scenario describes economic development which is primarily regionally oriented and where technological change is more fragmented and slower than in the other SRES storylines. Regions with abundant energy and mineral resources evolve more resource-intensive economies, while those poor in resources place a very high priority on minimizing import dependence through technological innovation to improve resource efficiency and make use of substitute inputs. The fuel mix in different regions is determined primarily by resource availability. High-income but resource-poor regions shift toward advanced post-fossil technologies (renewables or nuclear), while low-income resource-rich regions generally rely on older fossil technologies.
It is noteworthy that alternative combinations of driving forces can lead to similar levels and structure of energy and land-use patterns. Therefore, identical or similar combinations of driving forces may emerge from more than one given scenario. Nevertheless, components of each IPCC scenarios such as driving forces and emissions scenarios should not be mixed in order to avoid internal inconsistencies.
2.2.2 Impact variables and interlinkages
Scenario development for this study incorporated both water system dynamics and feedbacks based on the approach introduced by the Millennium Ecosystem Assessment (2005, p. 147). The arrows in Figure 1 provide an insight into the relative importance and mutual relationships of the main variables. The direct impact that each and every variable has on another must be considered to accurately forecast where and how the system will be affected when management or policies change. Quantitative modelling of the impacts of hydrology and climate change has been combined with qualitative storyline development. The storylines cover many complex aspects of the river basin that are difficult to quantify, such as policy and management alternatives. The models helped ensure the consistency of the global storylines within basin-specific water uses and provided important numerical information where quantification was possible.
Analytical framework
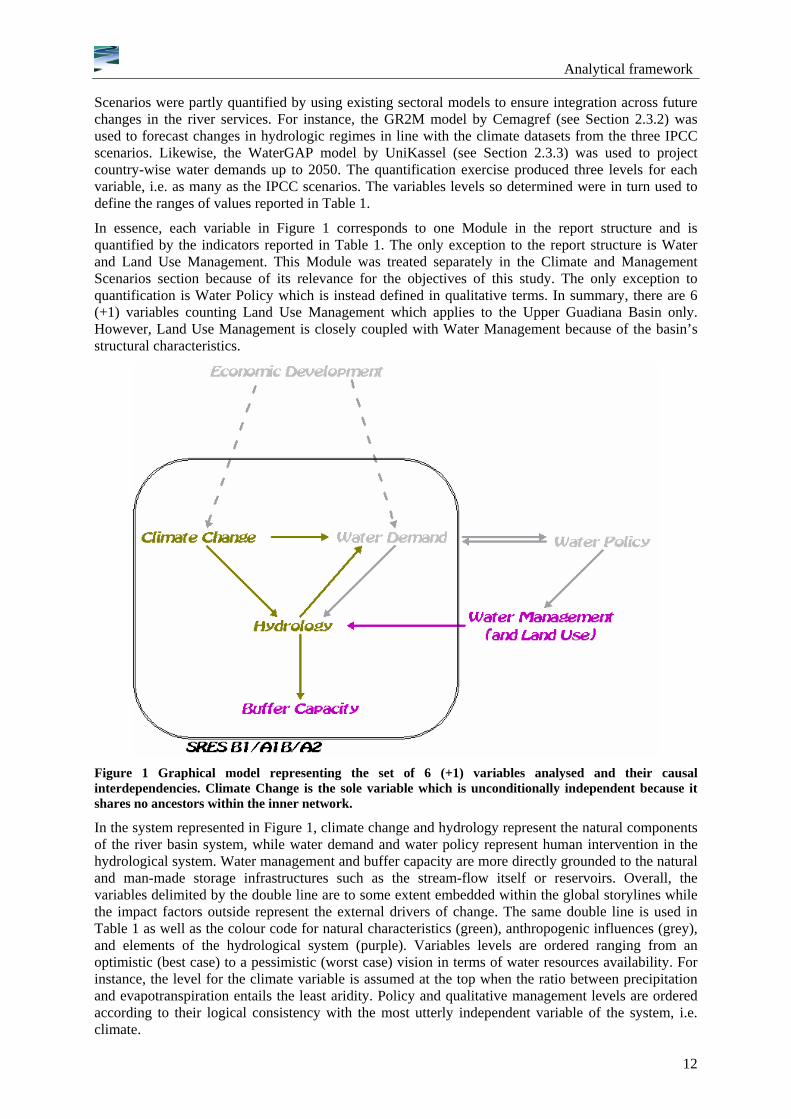
Scenarios were partly quantified by using existing sectoral models to ensure integration across future changes in the river services. For instance, the GR2M model by Cemagref (see Section 2.3.2) was used to forecast changes in hydrologic regimes in line with the climate datasets from the three IPCC scenarios. Likewise, the WaterGAP model by UniKassel (see Section 2.3.3) was used to project country-wise water demands up to 2050. The quantification exercise produced three levels for each variable, i.e. as many as the IPCC scenarios. The variables levels so determined were in turn used to define the ranges of values reported in Table 1.
In essence, each variable in Figure 1 corresponds to one Module in the report structure and is quantified by the indicators reported in Table 1. The only exception to the report structure is Water and Land Use Management. This Module was treated separately in the Climate and Management Scenarios section because of its relevance for the objectives of this study. The only exception to quantification is Water Policy which is instead defined in qualitative terms. In summary, there are 6 (+1) variables counting Land Use Management which applies to the Upper Guadiana Basin only. However, Land Use Management is closely coupled with Water Management because of the basin’s structural characteristics.
Figure 1 Graphical model representing the set of 6 (+1) variables analysed and their causal interdependencies. Climate Change is the sole variable which is unconditionally independent because it shares no ancestors within the inner network.
In the system represented in Figure 1, climate change and hydrology represent the natural components of the river basin system, while water demand and water policy represent human intervention in the hydrological system. Water management and buffer capacity are more directly grounded to the natural and man-made storage infrastructures such as the stream-flow itself or reservoirs. Overall, the variables delimited by the double line are to some extent embedded within the global storylines while the impact factors outside represent the external drivers of change. The same double line is used in Table 1 as well as the colour code for natural characteristics (green), anthropogenic influences (grey), and elements of the hydrological system (purple). Variables levels are ordered ranging from an optimistic (best case) to a pessimistic (worst case) vision in terms of water resources availability. For instance, the level for the climate variable is assumed at the top when the ratio between precipitation and evapotranspiration entails the least aridity. Policy and qualitative management levels are ordered according to their logical consistency with the most utterly independent variable of the system, i.e. climate.
12

Analytical framework
13
Table 1 Ranges of the 3 possible levels for the 6 (+1) variables of the model
Rhine best-case < > worst case
Climate Moisture Index (1-PET/P) > 0.30 0.28 - 0.30 < 0.28
Frequency of monthly deficits (%) < 20% 20 – 22% > 22%
Water use ratio (%) > 4.5% 4.0 - 4.5% < 4.0%
Water policy WFD-supportive CAP reform
WFD-detrimental CAP reform
GPCC (energy crops)
Water management (streamflow withdrawal)
groundwater withdrawals
reservoir storage
groundwater storage
Buffer capacity (accumulated streamflow filling deficit, Mm3/month) > 1200 800 - 1200 < 800
Upper Guadiana best-case < > worst case
Aridity index (P/PET) > 0.51 0.45 - 0.51 < 0.45
Frequency of monthly deficits (%) < 60% 60 – 61% > 61%
Groundwater consumption (m3/ha) < 500 500 - 1000 > 1000
Water policy Agenda 2000 w/o CC AEP Agenda 2000 w CC
Water management (groundwater withdrawal Mm3) < 400 400-600 > 600
Land use management (water intensive + drip-irrigated crops) < 50% 50 – 70% > 70%
Buffer capacity (change in aquifer level, m/y) > 2 0-2 < 0
Lower Guadiana best-case < > worst case
Aridity index (P/PET) > 0.51 0.45 - 0.51 < 0.45
Frequency of monthly deficits (%) < 60% 60 - 61% > 61%
Water use ratio (%) < 6% 6 - 15% > 15%
Water policy Water supply Water Pricing Integrated Approach
Water management higher water allocation
lower water allocation
no water allocation
Buffer capacity (accumulated streamflow filling deficit, m/month) > 63 63 - 125 < 125
2.3 Overview of model assumptions
This section specifies the sources of all data and illustrates how different information was used as input into the model. The results of this exercise are presented in section 3.
2.3.1 Climate
Climate is the driver of the water cycle. It determines how much water is available for supply and how much water is demanded in the short and long term. Climate modelling experiments detailed in Table 2 were used to provide the input climate datasets, to ensure consistency with the locations and spatial coverage of data on economic development. Data were sourced from the World Data Center for Climate (CERA) at the Max Planck Institut für Meteorologie (MPI-M) in Hamburg, Germany.

Analytical framework
14
ENSEMBLES is a project aimed at producing seasonal to decadal hindcasts and emission scenarios that were mostly calculated for the IPCC Fourth Assessment Report (AR4). The experiments satisfied the geographical scope of the two case studies (Rhine and Guadiana) and the temporal span required for the NeWater task. In addition, the ENSEMBLES project had completed runs of data representing monthly averaged values of both precipitation and potential evapotranspiration, so there was no need to determine the latter from temperature values. While a spatial resolution of 0.088 degrees was available for the Rhine basin through the regional climate model REMO, no such downscaling was likewise found for the Guadiana basin. Table 2 Datasets of variables downloaded from the ENSEMBLE climate modeling experiment
NAME OF EXPERIMENT1
OUTPUT INTERVAL
INTERVAL OF MEAN VALUES
PERIOD DESCRIPTION
ENSEMBLES EGMAM SRESB1 RUN No. 2 [pr + evspsbl]
6 hourly monthly 2001-2200 SRES Scenario: B1
ENSEMBLES EGMAM SRESA1B RUN No. 2 [pr + evspsbl]
6 hourly monthly 2001-2200 SRES Scenario: A1B
ENSEMBLES EGMAM SRESA2 RUN No. 2 [pr + evspsbl]
6 hourly monthly 2001-2200 SRES Scenario: A2
These datasets were downloaded in ASCII format and subsequently converted on a MS Excel spreadsheet. The relevant geographical selections were extracted by means of latitude and longitude coordinates. However, regional effects of weather on the hydrological cycle are not properly simulated in global climate models (Millán in Moren-Abat et al, 2007). Therefore, data for mean monthly precipitation values was compared against the REMO UBA project to test the significance of differences between the two sets of projections. The mean difference across the whole 50-year time-series ranges between 17 and 18% for all the three IPCC scenarios.
2.3.1.1 Rainfall and potential evapotranspiration (PET)
Both precipitation flux and PET values were converted from Kg m-2 s-1 to millimetres per month. Seasonal and annual averages were also calculated. The 50-year values were compared against the mean annual data of a historical time series from 1975 to 1990 (Lerat et al., 2006c). Coefficients of variation (CV) were used as a measure of variability in monthly precipitation and PET and hence seasonal fluctuations in water availability for each region.
As synthetic indicators of both precipitation and PET, the Climate Moisture Index (CMI=1-PET/P) and the Aridity Index (AI=P/PET) were chosen for the Rhine and Guadiana basins, respectively. The Climate Moisture Index was deemed more appropriate for the Rhine region because climate is not dry enough in the basin to be measured by the aridity classification according to UNEP’s World Atlas of Desertification. Although negative CMI values are able to show when PET is in excess of precipitation, CMI classes are less discrete than AI classes. Since CMI values entail a degree of aridity when negative, the lower the index the drier the climate. Likewise, lower AI values mean an increasingly drier climate.
2.3.1.2 Precipitation deficits
One measure of drought frequency is the distribution of precipitation deficits, i.e. the difference between annual precipitation and annual PET (Beersma & Buishand, 2004). Whole numbers are used in the Guadiana Basins where local droughts are associated with negative values for precipitation deficit (see Section 2.2.2.2).
1 FUBEMA: Freie Universitaet Berlin / EGMAM (=ECHO-G with Middle Atmosphere and Messy)

Analytical framework
2.3.2 Hydrology
A two-parameter water-balance model with monthly inputs was chosen for this study: the GR2M (Mouelhi et al., 2006). The choice of the time-step was dictated by data availability. Although rainfall data are available on a daily basis, other variables such as discharge and water use were only available on a monthly basis, thus a monthly time-step was used.
The GR2M model is a simple lumped rainfall-runoff model developed by Cemagref for applications in water resources assessment and management. It was tested in various climatic and hydrological conditions and found to perform comparably to other models despite its limited data requirements. It basically simulates the monthly rainfall–discharge process by using average estimations in a basin (Lerat et al., 2006d).
Since the Rhine is foreseen to shift from a combined snowmelt-rainfall river to a rain-fed river under climate change, no snow module was included in the GR2M model for this basin. Snow influence is predominant only in the Alpine part of the catchment (less than 20%), and models including a snow module proved not to perform better than the basic version (Lerat et al., 2006c).
Figure 2 Schematic of the GR2M river basin model, where E is potential evapotranspiration; P is rainfall; Q is streamflow; and X1 and X2 are model parameters. The other symbols are internal state variables (Source: Lerat et al., 2006d).
The model structure (see Figure 2) is based on a production function (Equations 1 to 7) and a transfer function (Equation 8). The production function uses a soil moisture accounting (S) store and a water exchange function (Equation 7) to account for exchanges with the outside of the catchment. The transfer function uses a quadratic routing store with fixed capacity equal to 126 and 60 mm for the Rhine and Guadiana rivers, respectively. (Lerat et al, 2006c, 2006d)
The model has only two parameters to calibrate: X1 is the capacity of the soil moisture accounting store (SMA, mm), and X2 is the groundwater exchange coefficient (dimensionless). In addition, observed monthly time series of catchment areal rainfall and observed monthly time series of potential evapotranspiration are the only inputs strictly required by the model. Observed stream-flow time series are only needed for model parameter calibration, and X1 (size of SMA store) and X2 (groundwater losses) were sourced from the literature (Lerat et al, 2006c, p. 20, 2006d, p. 33). Values have been identified by Lerat et al. for the Rhine (2006c, p. 20) and the Guadiana (2006d, p. 33), which are deemed realistic and reliable by the authors.
15

Analytical framework
16
2.3.2.1 Discharge
Precipitation and PET values from the climate change module were fed into the GR2M model in order to yield monthly mean runoff values for the overall catchment area. The model outputs were calibrated by running an averaged 12-month cycle for the production store based on the climate data reported by Lerat et al. (2006c) for the period 1975-1990.
2.3.2.2 Frequency of monthly deficits
The second measure of drought frequency is the distribution of discharge deficits, i.e. the number of months when the river discharge is below a certain threshold. The probability of this kind of extreme event is the result of combined rainfall and runoff deficits (Beesma & Buishand, 2004). Their occurrence for each IPCC scenario is illustrated by comparing the downward-bending of the curves presented in the Climate Modules (section 3.1.1 for the Rhine and section 3.2.1 for the Guadiana) and Hydrology Modules (section 3.1.2 for the Rhine and section 0 for the Guadiana).
2.3.3 Water demand
The combined effects of climate change and socio-economic driving forces on future water demand were analysed in analogy with the global water model WaterGap by Alcamo et al. (2007, in Menel et al., 2007). Baseline water availability is calculated using the GR2M hydrological model from total river discharge and groundwater recharge. Resulting water withdrawals are subtracted from the amount of water available every year. The consumption of water is in turn dependent on economic development factors such as population growth, income levels, electricity production, irrigated area, and technology change as a means of increased water efficiency in sectors such as irrigated agriculture. These factors are all underlying causes of growth in demand for water.
Water withdrawals were estimated from spreadsheets sourced in the database of Work Package 2.6 “IWRM Scenarios” The first step was to retrieve country data for population, GDP/capita, total electricity production, and area equipped for irrigation. Only the countries involved in either the Rhine or the Guadiana catchment were singled out and figures weighted based on their area distribution of the river basin (with Austria and Italy excluded from this procedure for the Rhine due to negligible area). Being the only dataset available, the A2 and B2 scenario provided reference also for B1 and A1B. Projections were drawn through the interpolation of SRES final data for OECD countries from key years (i.e. 1995, 2025 and 2055).
2.3.3.1 Water use ratio
Discharges in m3/s were converted into million m3/year in order to allow subtraction of water withdrawals. As a result, the water use ratio was attained along with the return flows time series. It is noteworthy that the return flows from the Upper Guadiana were used to calculate the water use ratio for the Lower Guadiana, as the river flows from Spain into Portugal. However, water inputs were later adjusted to account for the second domain model built in the Guadiana basin for the lower part of the catchment. The buffering element associated to this sub-catchment is the Caia reservoir.
2.3.3.2 Groundwater withdrawal
Water withdrawals for the Upper Guadiana Basin were additionally broken down into surface and groundwater consumption (8 and 92%), respectively. This figure was triangulated from data on irrigated surface, water consumption per crop and pumping estimates (Llamos & Martinez-Santos, 2005). The breakdown of water use figures into groundwater withdrawals was necessary to produce states of water demand which were specific to the prevailing conditions in the Upper Guadiana. Extraction of groundwater at higher rates than recharge is currently lowering the water table in this basin. This may eventually cause detrimental effects such as wells drying up and result in a reduction in the usable groundwater supply.
2.3.4 Water Policy and Management
Socioeconomic factors are the solely qualitative variables in the model as they were not thoroughly estimated in quantitative terms. However, it was possible to use quantitative information for the Upper Guadiana Basin for which data on climate, land use, groundwater abstraction and aquifer recharge are

Analytical framework
17
available in literature (Burke & Mulligan, 1999). Therefore, management alternatives were quantified based on irrigated land area per crop type and water consumption per hectare. Uncertainties on the most relevant storylines have been solved by treating policy and management alternatives as the dependent variable, i.e. they are the values that change in relationship to the IPCC scenarios. As such, they will be discussed directly in the Climate and Management Scenarios (section 4).
2.3.4.1 Water Policy
Water policy alternatives were selected according to the agronomic and structural characteristics of the studied region. For instance, policy options for the Rhine have included the potential development of crops for biofuels in light of the current energy policy on renewable energy in Europe. In fact, “by 2050 energy crops [are forecast to] show a northward expansion in potential cropping area but a reduction in suitability in Southern Europe” (Schröter et al., 2005 in Moren-Abat et al., 2007, p. 82). Nevertheless, the Water Framework Directive is the most important piece of legislation in this exercise as it rules over catchment-wide areas such as the Rhine and the Upper Guadiana. However, more locally tailored measures were envisioned for the Caia sub-catchment in the Lower Guadiana Basin.
2.3.4.2 Water and Land Use Management
Water management alternatives were selected according to their regional and local relevance. This included:
• Management of low flows in response to drought for the Rhine;
• Management of groundwater abstraction for the Upper Guadiana;
• Management of reservoirs for the Lower Guadiana.
In defining different management strategies for river basin components, the no-change option was adopted as the reference scenario, which included:
• Reservoir storage for the Rhine Basin;
• Groundwater abstraction for the Upper Guadiana Basin;
• Water supply through reservoirs and transfers for the Lower Guadiana Basin.
Furthermore, different land uses in terms of cropping pattern were investigated for the Upper Guadiana. Estimating the future land use of a basin is associated with much more uncertainty than the future climate because it depends on a multitude of local factors. Burke & Mulligan (1999) have shown that “there is clearly a complex land use-dependent pattern of climate change impacts on aquifer recharge” and “the differences in recharge between different land uses are very often greater than the differences produced by these extreme climatic scenarios.
2.4 Buffering capacity
In assessing the buffering capacity of the Rhine and Guadiana river basins, the methodology used by Lerat et al. (2005) was applied. Furthermore, criteria to define buffering capacity components (i.e. beneficiaries, driving forces, temporal reference, etc) were adapted from Lerat et al., (2006d) and are outlined in Table 3. The first objective was to estimate the natural characteristics of the hydrological systems. This goal was pursued through the outcomes of the Climate and Hydrology Modules (section 3.1.1 and 3.1.2 for the Rhine and 0 for the Guadiana, respectively). The natural characteristics have been integrated in the associated management strategies as constants. The second objective was to describe the behaviour of systems under anthropogenic influence such as reservoir infrastructure and groundwater abstraction. The hypothesized interactions and linkages between key variables related to the water system and human management have been examined in the Water Demand Modules (section 3.1.4 for the Rhine, 3.2.4 for the Upper Guadiana, and 3.3.2 for the Lower Guadiana) and Water Policy Modules (section 3.1.5 for the Rhine, 3.2.5 for the Upper Guadiana, and 3.3.3 for the Lower Guadiana). In order for groundwater abstraction and reservoir management strategies to be better-informed and effective, the definition of the Water Policy variable was made compliant with the beneficiaries of the buffer as described in Table 3.

Table 3 Criteria to define buffering capacity components (adapted from Lerat et al., 2006d)
Buffering capacity component Rhine (low flows)
Upper Guadiana (Mancha Occidental aquifer)
Lower Guadiana (Caia dam)
Objective of buffering capacity assessment Reduce uncertainties in the management of low flows in response to drought
Evaluate the long-term impact of groundwater management for the environment and the society
Reduce uncertainties in reservoir management by short- to medium-term anticipation of drought conditions
River Rhine and tributaries’ channel Mancha Occidental aquifer (UH04.04) Caia reservoir (Portugal) Nature of the buffer
and buffering effects Temporary storage of water Temporary storage of water Temporary storage of water
Temporal reference (time step of analysis) Month Year Month
Spatial reference River Rhine catchment as a whole (185 300 km²)
Guadiana basin upstream of El Vicario dam (16 000 km²)
Caia reservoir catchment (571 km²)
Beneficiary • Drinking water (domestic use) • Process water (industrial use) • Irrigation (agricultural use) • Hydropower • Fisheries, Amenity & Recreation • Navigation
• Irrigation (agricultural use) • Wetlands • Future generations by preserving an
exploitable groundwater resource
• Irrigation (agricultural use) • Municipal water supply (domestic use) • Hydropower • Caia River hydrosystem
Driving forces • Rainfall and evapotranspiration patterns across the different parts of the Rhine catchment (esp. Alps)
• Flows management
• Rainfall on the Upper Guadiana • Evapotranspiration on the area • Transfer from the Tajo-Segura canal • Groundwater withdrawals rates
• Rainfall on the Caia catchment • Evapotranspiration on the area • Caia reservoir release and withdrawals
management
Associated water management strategies Water storage in the hydrosystem: • Reservoir storage • Groundwater storage
Reduction of groundwater withdrawals: • Modification of cropping patterns • Improvement of irrigation techniques
Anticipation of water crisis: • Discussion with users to lower water
allocations, • Increased storage to compensate for
low inflows
Quantitative or qualitative nature of assessment methods
Qualitative & quantitative, based on Formative Scenario Analysis and hydrological models output
Qualitative, based on Formative Scenario Analysis
Qualitative & quantitative, based on Formative Scenario Analysis and hydrological models output

Model results
3 Model results The purpose of the model was to produce ranges of values for each of the 6 variables (plus Land Use Management for the Upper Guadiana Basin) identified. Values were determined according to the 3 sets of bounded conditions determined from the chosen IPCC scenarios. These ranges represent the 3 possible levels that each variable can take and their extremes have been quantified in Table 1 through the respective indicators.
3.1 Rhine
3.1.1 Climate Module Table 4 Climate Moisture Index for the Rhine Basin under the B1, A1B and A2 climate change scenarios
Rhine B1 A1B A2
Climate Moisture Index (1-PET/P) 0.29 0.31 0.27
Table 4 shows the values of the CMI for the Rhine under the 3 IPCC scenarios. The levels for CMI are then defined as follows: > 0.30; 0.28 - 0.30; < 0.28. The mean annual temperature is forecast by other climate change scenarios to increase over the whole area, with the largest increase being in the Alps where there is a 5.8°C average warming in winter and 4.7°C in summer (Shabolova et al., 2003). Also changes in precipitation show broader fluctuations in the Alps, with less rain in the summer and more frequent rainfall in autumn.
3.1.1.1 Changes in precipitation and PET over the Rhine Basin under the B1 climate change scenario
The modification in mean annual PET from the period 2001-2007 to the period 2001-2050 is less than 1 mm (+2%) on average. In winter PET increases by 3 mm (+6%) while in summer the decrease is very little (-0.3%). The basin annual mean precipitation increases slightly (+4%). However, the change in precipitation varies considerably with season. In summer precipitation increases by 4%, while in winter rainfall decreases slightly (-0.3%). In autumn and spring, precipitation increases on average by 3 and 25%, respectively.
Figure 3 Evolution of climate in the Rhine Basin for the B1 scenario (the shift in CMI is shown on the right side of the figure)
As shown in Figure 3, because of changes in PET and precipitation, the climate is projected to be 7% wetter in the Rhine Basin under B1 conditions. Changes in the variability of monthly rainfall are small, but largest in summer and autumn (Table 5).
19

Model results
Table 5 Changes in the Coefficient of Variation (CV) of the monthly mean precipitation (P) and PET for the Rhine under the B1 climate change scenario
Dec/Jan/Feb Mar/Apr/May Jun/Jul/Aug Sep/Oct/Nov
0.29 0.29 CV P Present 0.24 0.26
0.33 0.32 CV P B1 0.24 0.25
CV ET Present 0.18 0.15 0.22 0.18
CV ET B1 0.19 0.14 0.20 0.20
3.1.1.2 Changes in precipitation and PET over the Rhine Basin under the A1B climate change scenario
Figure 4 shows that the modification in mean annual PET from the period 2001-2007 to the period 2001-2050 is little more than 1 mm (+2%) on average. In winter PET increases by 5 mm (+5%) while in summer the decrease is 3%. The basin annual mean precipitation increases slightly (+6%) and the change in precipitation does not vary with season. In summer and autumn, precipitation increases by 5-10%. In winter and spring, precipitation increases on average by 6 and 12%, respectively.
Figure 4 Evolution of climate in the Rhine Basin for the A1B scenario (the shift in CMI is shown on the right side of the figure)
As a result of changes in PET and precipitation, the climate is projected to be 8% wetter in the Rhine Basin under A1B conditions (Figure 4). Precipitation will become more variable in autumn and winter while in spring and summer the amount of rainfall will be increasingly regular (Table 6). Table 6 Changes in the Coefficient of Variation (CV) of the monthly mean precipitation (P) and PET for the Rhine under the A1B climate change scenario
Dec/Jan/Feb Mar/Apr/May Jun/Jul/Aug Sep/Oct/Nov
0.26 0.30 0.32 0.26 CV P Present
0.31 0.27 0.28 0.31 CV P A1B
0.14 CV ET Present 0.18 0.15 0.23
0.21 CV ET A1B 0.16 0.14 0.21
3.1.1.3 Changes in precipitation and PET over the Rhine Basin under the A2 climate change scenario
The modification in mean annual PET from the period 2001-2007 to the period 2001-2050 is less than 2 mm (+3%) on average. In winter PET increases by almost 2 mm (3%) while in summer the increase is 1%. The basin annual average precipitation increases only slightly (<1%). However, the
20

Model results
precipitation anomaly varies significantly with season. In winter and spring precipitation increases by 5 and 14% respectively, while in summer precipitation decreases by 10% (Figure 5).
Figure 5 Evolution of climate in the Rhine Basin for the A2 scenario (the shift in CMI is shown on the right side of the figure)
As a result of changes in PET and precipitation, the climate is projected to be 8% drier under A2 conditions in the Rhine basin (Figure 5). The largest increase in the variability of monthly rainfall occurs in autumn (Table 7). Table 7 Changes in the Coefficient of Variation (CV) of the monthly mean precipitation (P) and PET for the Rhine under the A2 climate change scenario
Dec/Jan/Feb Mar/Apr/May Jun/Jul/Aug Sep/Oct/Nov
0.23 CV P Present 0.25 0.26 0.30
0.33 CV P A2 0.28 0.30 0.29
0.14 CV ET Present 0.21 0.15 0.17
0.24 CV ET A2 0.19 0.16 0.22
3.1.2 Hydrology Module Table 8 Frequency of monthly discharge deficits for the Rhine Basin under the B1, A1B and A2 climate change scenarios
Rhine B1 A1B A2
Frequency of monthly discharge deficits (%) 19.00% 20.33% 22.33%
Table 8 shows the values of the frequency of monthly discharge deficits resulting from the combined ENSEMBLES projections for the 3 IPCC scenarios under analysis and the GR2M hydrological model. The levels for the frequency of monthly deficits are defined as follows: > 20%; 20–22%; < 22%; in terms of proportion of 30-day periods that the discharge is below the 1200-m3/s threshold. As for the hydrological baseline conditions of the river Rhine, Lerat et al. (2006c), and Krysanova et al. (2006) found that in drought conditions, low flows in the downstream Rhine are exacerbated because of buffering in the upper Alpine parts of the basin upstream. This is due to:
• a decrease in precipitation storage (snow), resulting in discharge increasing more in winter than in summer (the B1 scenario being the only exception);
• low-flow periods during summer are expected to occur more frequently and last longer, with increasing values from scenario B1 to A2;
• there would be an average accumulated deficit after water withdrawal of 207 million m3 per month for a 2,782 Mm3
21
threshold, and 251 million m3 per month for a 1 855 Mm3 threshold.
Model results
These observations were also found when combining the IPCC scenarios and GR2M model.
3.1.2.1 Changes in the hydrological regime of the Rhine Basin under the B1climate change scenario
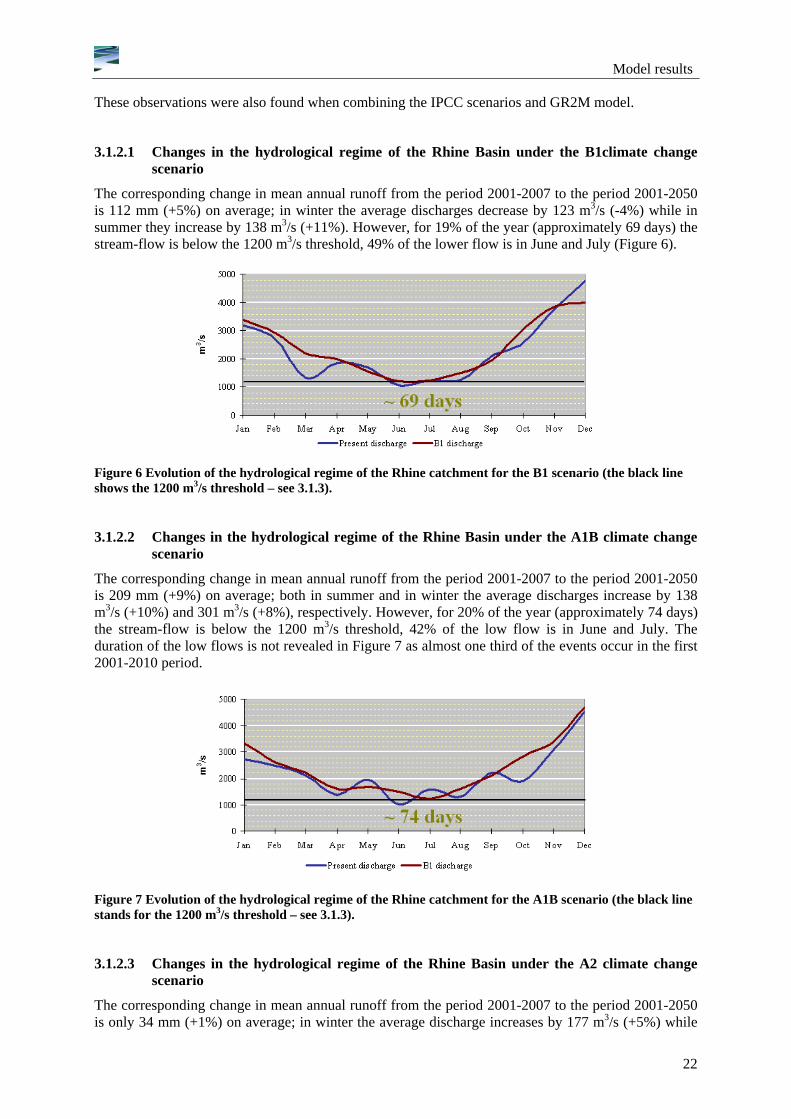
The corresponding change in mean annual runoff from the period 2001-2007 to the period 2001-2050 is 112 mm (+5%) on average; in winter the average discharges decrease by 123 m3/s (-4%) while in summer they increase by 138 m3/s (+11%). However, for 19% of the year (approximately 69 days) the stream-flow is below the 1200 m3/s threshold, 49% of the lower flow is in June and July (Figure 6).
Figure 6 Evolution of the hydrological regime of the Rhine catchment for the B1 scenario (the black line shows the 1200 m3/s threshold – see 3.1.3).
3.1.2.2 Changes in the hydrological regime of the Rhine Basin under the A1B climate change scenario
The corresponding change in mean annual runoff from the period 2001-2007 to the period 2001-2050 is 209 mm (+9%) on average; both in summer and in winter the average discharges increase by 138 m3/s (+10%) and 301 m3/s (+8%), respectively. However, for 20% of the year (approximately 74 days) the stream-flow is below the 1200 m3/s threshold, 42% of the low flow is in June and July. The duration of the low flows is not revealed in Figure 7 as almost one third of the events occur in the first 2001-2010 period.
Figure 7 Evolution of the hydrological regime of the Rhine catchment for the A1B scenario (the black line stands for the 1200 m3/s threshold – see 3.1.3).
3.1.2.3 Changes in the hydrological regime of the Rhine Basin under the A2 climate change scenario
The corresponding change in mean annual runoff from the period 2001-2007 to the period 2001-2050 is only 34 mm (+1%) on average; in winter the average discharge increases by 177 m3/s (+5%) while
22

Model results
in summer they decrease by 180 m3/s (-14%). However, for 22% of the year (approximately 81 days) the stream-flow is below the 1200 m3/s threshold, 41% of the lower-flow is in June and July (Figure 8).
Figure 8 Evolution of the hydrological regime of the Rhine catchment for the A2 scenario (the black line stands for the 1200 m3/s threshold – see 3.1.3).
3.1.3 Buffering Capacity Module Table 9 Buffering capacity for the Rhine Basin under the B1, A1B and A2 climate change scenarios
Rhine B1 A1B A2
Buffering capacity (Mm3/month) 196 184 242
Table 9 shows the values of the buffering capacity of the Rhine catchment resulting from the ENSEMBLES projections for the 3 IPCC scenarios under analysis. The levels for buffering capacity are defined as follows: > 1200; 800-1200; < 800; in terms of accumulated stream-flow filling deficit (m3/s). The values were determined from observations by van Lanen in Lerat et al. (2006a): “If the flow drops below 1250 m3/s […] then limitations for navigation will start and costs will steeply rise". They are based on the thresholds provided in Table 10. The number of low flow events is reported in Annex I.
23
Table 10 Proportion (%) of 30.4-day periods that the Rhine discharge is below a certain threshold (m3 s-1) under the B1, A1B and A2 climate change scenarios
Threshold B1 A1B A2
1200 19 20 22
800 7 7 10
3.1.4 Water Demand Module Table 11 Water use ratio for the Rhine Basin under the B1, A1B and A2 climate change scenarios
Rhine B1 A1B A2
Water use ratio (%) 3.65% 4.13% 4.88%
Table 11 shows the values of water use ratio resulting from the WaterGAP projections for the 3 IPCC scenarios under analysis. The levels for the water use ratio are defined as follows: > 4.5%; 4.0-4.5%; < 4.0%. With more than 50 million people and major industrial areas in the basin, the Rhine is important for the supply of water to several socio-economic sectors. The river is one of the world’s most intensively navigated inland waterways as well as a water source for irrigated agriculture and
Model results
24
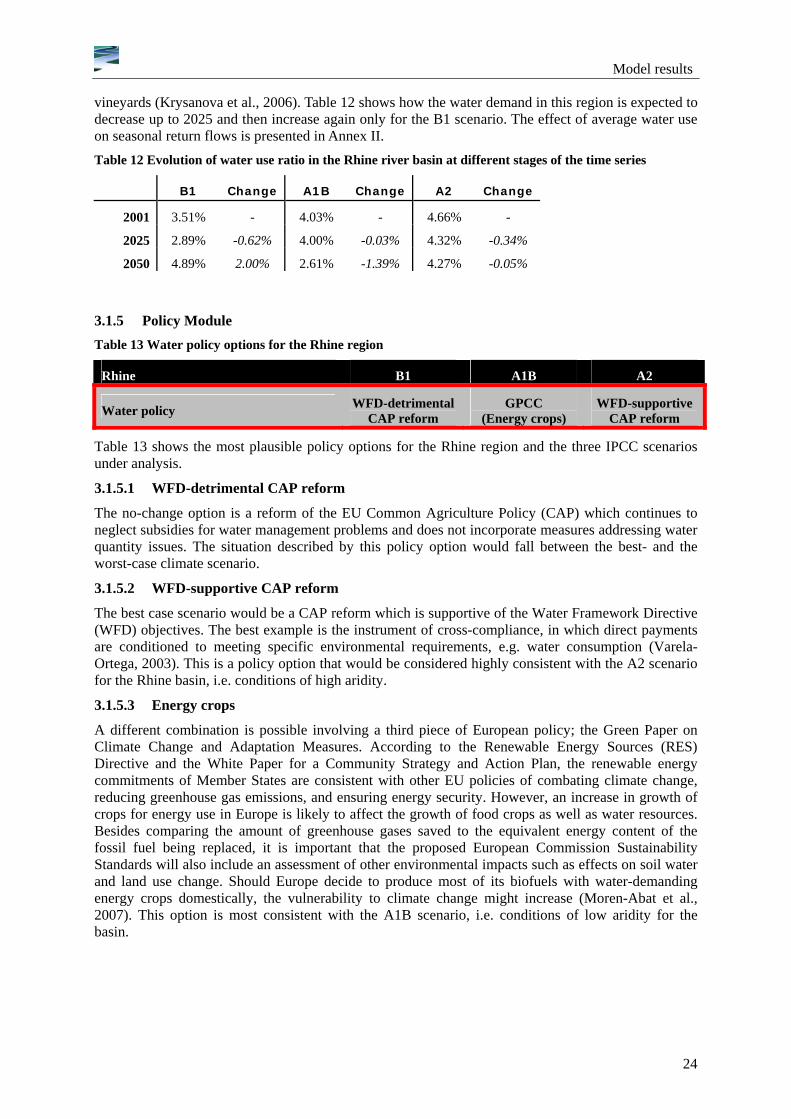
vineyards (Krysanova et al., 2006). Table 12 shows how the water demand in this region is expected to decrease up to 2025 and then increase again only for the B1 scenario. The effect of average water use on seasonal return flows is presented in Annex II. Table 12 Evolution of water use ratio in the Rhine river basin at different stages of the time series
B1 Change A1B Change A2 Change
2001 3.51% - 4.03% - 4.66% -
2025 2.89% -0.62% 4.00% -0.03% 4.32% -0.34%
2050 4.89% 2.00% 2.61% -1.39% 4.27% -0.05%
3.1.5 Policy Module Table 13 Water policy options for the Rhine region
Rhine B1 A1B A2
Water policy WFD-detrimentalCAP reform
GPCC (Energy crops)
WFD-supportiveCAP reform
Table 13 shows the most plausible policy options for the Rhine region and the three IPCC scenarios under analysis.
3.1.5.1 WFD-detrimental CAP reform
The no-change option is a reform of the EU Common Agriculture Policy (CAP) which continues to neglect subsidies for water management problems and does not incorporate measures addressing water quantity issues. The situation described by this policy option would fall between the best- and the worst-case climate scenario.
3.1.5.2 WFD-supportive CAP reform
The best case scenario would be a CAP reform which is supportive of the Water Framework Directive (WFD) objectives. The best example is the instrument of cross-compliance, in which direct payments are conditioned to meeting specific environmental requirements, e.g. water consumption (Varela-Ortega, 2003). This is a policy option that would be considered highly consistent with the A2 scenario for the Rhine basin, i.e. conditions of high aridity.
3.1.5.3 Energy crops
A different combination is possible involving a third piece of European policy; the Green Paper on Climate Change and Adaptation Measures. According to the Renewable Energy Sources (RES) Directive and the White Paper for a Community Strategy and Action Plan, the renewable energy commitments of Member States are consistent with other EU policies of combating climate change, reducing greenhouse gas emissions, and ensuring energy security. However, an increase in growth of crops for energy use in Europe is likely to affect the growth of food crops as well as water resources. Besides comparing the amount of greenhouse gases saved to the equivalent energy content of the fossil fuel being replaced, it is important that the proposed European Commission Sustainability Standards will also include an assessment of other environmental impacts such as effects on soil water and land use change. Should Europe decide to produce most of its biofuels with water-demanding energy crops domestically, the vulnerability to climate change might increase (Moren-Abat et al., 2007). This option is most consistent with the A1B scenario, i.e. conditions of low aridity for the basin.

Model results
3.2 Upper Guadiana
3.2.1 Climate Module Table 14 Aridity Index for the Guadiana Basin under the B1, A1B and A2 climate change scenarios
Upper/Lower Guadiana B1 A1B A2
Aridity index (P/PET) 0.475 0.482 0.467
Table 14 shows values of the Aridity Index for the Guadiana calculated using data from the ENSEMBLES projections for the 3 IPCC scenarios under analysis. The levels for the aridity index are defined as follows: > 0.48; 0.47 – 0.48; and < 0.47, with 0.50 being the threshold between sub-humid and semi-arid climates.
3.2.1.1 Changes in precipitation and PET over the Guadiana Basin under the B1 climate change scenario
The modification in mean annual PET from the period 2001-2007 to the period 2001-2050 is 0.4 mm (+1%) on average; in winter PET decreases by 5 mm (-14%) while in summer it decreases by 0.80 mm (+4%). Mean annual precipitation for the basin increases considerably (+26%). However, the precipitation anomaly varies tremendously with season: summer precipitation decreases by 47% while autumn precipitation decreases by 11%. In winter and spring precipitation increases on average by 40 and 31%, respectively (Figure 9).
Figure 9 Evolution of climate in the Guadiana catchment for the B1 scenario (the shift in AI is shown on the right side of the figure)
As a result of the trend for PET and precipitation, the climate is projected to be 15% drier in the Guadiana catchment under B1 conditions (Figure 9). While the variability of monthly rainfall and PET generally increases in winter and spring, it dwindles in summer and autumn (Table 15). Table 15 Changes in the Coefficient of Variation (CV) of the monthly mean precipitation (P) and PET for the Guadiana Basin under the B1 climate change scenario
Dec/Jan/Feb Mar/Apr/May Jun/Jul/Aug Sep/Oct/Nov
0.72 CV P Present 0.41 0.87 0.74
0.63 CV P B1 0.49 0.87 0.68
0.35 CV ET Present 0.22 0.30 0.26
0.24 CV ET B1 0.25 0.36 0.26
25

Model results
3.2.1.2 Changes in precipitation and PET over the Guadiana Basin under the A1B climate change scenario
The modification in mean annual PET from the period 2001-2007 to the period 2001-2050 is 0.5 mm (+1%) on average; in winter PET remains almost unchanged (+0.4%) while in summer it increases by 1.18 mm (+6%). The basin averaged annual precipitation decreases only slightly (-4%). However, the precipitation anomaly varies significantly with season: in summer precipitation increases only by 1% while in winter precipitation decreases by 13% (Figure 10).
Figure 10 Evolution of climate in the Guadiana catchment for the A1B scenario (the shift in AI is shown on the right side of the figure)
As a result of the trend for PET and precipitation, aridity of the climate is projected to be almost unchanged (-0.03%) in the Guadiana catchment under A1B conditions (Figure 10). However, the variability of monthly rainfall declines significantly in spring and summer, while the variability of monthly PET declines mainly in spring (Table 16). Table 16 Changes in the Coefficient of Variation (CV) of the monthly mean precipitation (P) and PET for the Guadiana Basin under the A1B climate change scenario
DJF MAM JJA SON
0.91 0.58 CV P Present 0.53 0.57
0.82 0.70 CV P A1B 0.54 0.59
0.42 CV ET Present 0.16 0.25 0.24
0.37 CV ET A1B 0.23 0.27 0.24
3.2.1.3 Changes in precipitation and PET over the Guadiana Basin under the A2 climate change scenario
The modification in mean annual PET from the period 2001-2007 to the period 2001-2050 is 0.8 mm (+2%) on average; in winter PET increases only by 0.5 mm (+1%) while in summer it increases by 1.8 mm (+9%). The basin annual average precipitation decreases only slightly (-3%). However, the precipitation anomaly varies significantly with season: in summer precipitation increases by 4% while in winter and spring precipitation decreases by 5 and 13%, respectively (Figure 11).
26

Model results
Figure 11 Evolution of climate in the Guadiana catchment for the A2 scenario (the shift in AI is shown on the right side of the figure)
As a result of the trends for PET and precipitation, the climate is projected to be 3% drier in the Guadiana basin under A2 conditions (Figure 11). The variability of monthly rainfall and PET decreases the most in autumn (Table 17). Table 17 Changes in the Coefficient of Variation (CV) of the monthly mean precipitation (P) and PET for the Guadiana Basin under the A2 climate change scenario
Dec/Jan/Feb Mar/Apr/May Jun/Jul/Aug Sep/Oct/Nov
0.76 CV P Present 0.57 0.89 0.63
0.62 CV P A2 0.55 0.87 0.61
0.31 CV ET Present 0.32 0.31 0.32
0.23 CV ET A2 0.26 0.37 0.30
3.2.2 Hydrology Module Table 18 Frequency of monthly discharge deficits the Guadiana Basin under the B1, A1B and A2 climate change scenarios
Upper/Lower Guadiana B1 A1B A2
Frequency of monthly discharge deficits (%) 61.00% 60.33% 60.00%
Table 18 shows the values of the frequency of monthly discharge deficits resulting from the combined ENSEMBLES projections for the 3 IPCC scenarios under analysis and the GR2M hydrological model. The levels for the frequency of monthly deficits are then defined as follows: > 61%; 60-61%; < 60%. The hydrological baseline conditions of the river Guadiana were determined from Lerat et al. (2006b) and Krysanova et al. (2006) and include the following conditions:
• the area remains naturally drought-prone, with average accumulated deficits after water withdrawal of 204 million m3
27
per month for a 909 Mm3 threshold, and 36 million m3 per month for a 304 Mm3 threshold;
• the months of July and August appear as the driest and nearly zero rainfall during these months leads to long-lasting water scarcity on average (7 to 8 months);
• the existing gradient of rainfall between the upstream and downstream part of the catchment is here not revealed by the overall data on the region.
These observations were also found when combining the IPCC scenarios and GR2M model.

Model results
3.2.2.1 Changes in the hydrological regime of the Guadiana Basin under the B1climate change scenario
The corresponding change in mean annual runoff is limited (< -1%) on average; in summer the average discharges decrease by 16 m3/s (-6%) while in autumn they increase by 35 m3/s (+6%). As a result, for 61% of the year (approximately 223 days) the stream-flow is below the 392 m3/s threshold, 27% of the lower stream-flow is in July and August (Figure 12).
Figure 12 Evolution of the hydrological regime of the Guadiana catchment for the B1 scenario (the black line stands for the 600 Mm3 threshold - see 3.2.3).
3.2.2.2 Changes in the hydrological regime of the Guadiana Basin under the A1B climate change scenario
The corresponding change in mean annual runoff is only 3 mm (+2%) on average. In fact, in winter the average discharges decrease by 18 m3/s (-6%) while in autumn they increase by 39 m3/s (+6%). However, for 60.3% of the year (approximately 220 days) the stream-flow is below the 392 m3/s threshold, 27% of the lower flow is in July and August (Figure 13).
Figure 13 Evolution of the hydrological regime of the Guadiana catchment for the A1B scenario (the black line stands for the 600 Mm3 threshold - see 3.2.3).
3.2.2.3 Changes in the hydrological regime of the Guadiana Basin under the A2 climate change scenario
The corresponding change in mean annual runoff is only 2 mm (< -1%) on average. In winter the average discharge increases by 15 m3/s (+2%) while in summer it decreases by 33 m3/s (+6%). However, for 60% of the year (approximately 219 days) the stream-flow is below the 392 m3/s threshold, 28% of the lower flow is in July and August (Figure 14).
28

Model results
Figure 14 Evolution of the hydrological regime of the Guadiana catchment for the A2 scenario (the black line stands for the 600 Mm3 threshold – see 3.2.3).
3.2.3 Buffering Capacity Module Table 19 Buffering capacity for the Upper Guadiana Basin under the B1, A1B and A2 climate change scenarios
Upper Guadiana B1 A1B A2
Buffering capacity as 15-20 20-25 0 wetland recovery (# years)
Table 19 shows the values of the buffering capacity resulting from the ENSEMBLES projections for the 3 IPCC scenarios under analysis with regards to the Upper Guadiana. Buffering capacity is measured as number of years for wetland recovery and defined as follows: > 2 m; 0-2 m; < 0 m; in terms of change in La Mancha Occidental aquifer level. The values were based upon the 3 possible states proposed by Lerat et al. on the basis that Las Tablas de Daimel wetlands are dependent on water table drawdowns (2006d, pp. 7, 17, 19). For a 2 metres increase in the aquifer level, the associated wetlands would recover in 15-20 years. For a 1.84 metre increase in the aquifer level, the associated wetlands would recover in 20-25 years. For any reduction in the water level, the associated wetlands would never recover.
3.2.4 Water Demand Module Table 20 Changes in water withdrawal from the Rhine Basin under the B1, A1B and A2 climate change scenarios
Upper Guadiana B1 A1B A2
3Groundwater consumption (m /ha) 567 420 1463
Table 20 shows the values of the groundwater consumption resulting from the WaterGAP projections for the 3 IPCC scenarios under analysis. The levels for groundwater consumption are defined as follows: < 500 m /ha; 500-1000 m /ha; > 1000 m3 3 3/ha. The Spanish part of the Guadiana catchment occupies 83% of the whole basin with 230 000 inhabitants. The annual demand is 2.37 m3/ha, equal to 81% of total withdrawals (Olay et al., 2003). Given the current land use of the Upper Guadiana basin, “… urban and industrial water supply account for less than 5% of demand while irrigation accounts for the rest” (Llamas & Martinez-Santos, 2005).
Table 21 shows how the water demand in this region is expected to increase up to 2025 and then decrease slightly, except for the B1 scenario. The effect of average water use on seasonal return flows is presented in Annex II.
29

Model results
30
Table 21 Evolution of the water use ratio in the Upper Guadiana Basin at different stages of the time series under the B1, A1B and A2 climate change scenarios
B1 Change A1B Change A2 Change
2001 5.28% - 6.56% - 10.75% -
2025 5.18% -0.10% 11.33% 4.77% 16.42% 5.67%
2050 6.99% 1.81% 7.13% -4.20% 16.03% -0.39%
3.2.5 Policy Module Table 22 Water policy options for the Upper Guadiana region
Upper Guadiana B1 A1B A2
Water policy AEP Agenda 2000 w/o CC
Agenda 2000 w/ CC
Table 22 shows the most plausible policy options for the Upper Guadiana region and the three IPCC scenarios under analysis.
3.2.5.1 Agenda 2000 without Cross-Compliance
“The CAP contains several tools, under both the 1st and 2nd pillar, which can contribute to the WFD objectives. Further tools have been introduced through the 2003 CAP reform that makes an important step towards the integration of environmental concerns by including, inter alia, the following element: decoupling direct payments for EU farmers from the production, which is expected to further reduce incentives for intensive production and also make land-use change easier” (Herbke, Dworak & Karaczun, 2005). If this instrument was implemented, the policy option at issue would correspond to the Agenda 2000 reform to crop direct payments and support prices without integration of any environmental objectives. As such, this policy option falls very short in achieving any water-use reduction. However, market liberalisation or a decrease in crop prices may reduce water use to an extent equivalent to cross-compliance (Varela-Ortega, 2003). “… EU’ preferential agreements with Magreb countries or a hypothetical entrance of Turkey on the EU…” are reported as instances of uncertainty in that sense (Llamas & Martinez-Santos, 2005). This option is the worst case policy scenario for the Upper Guadiana basin and it is highly consistent with the A1B scenario, i.e. conditions of low aridity.
3.2.5.2 Agri-Environmental Payments (AEP)
This policy corresponds to the area-based CAP direct payments and income compensation payments of the formerly in-place Agri-Environmental Programme of 1992-1997. In fact, water use for irrigation is heavily subsidised in Spain and water charges are usually paid on an area basis. Despite the positive socio-economic effects of this programme in terms of regional development, negative environmental consequences caused the over-abstraction of the aquifer and the degradation of the associated wetlands. Without volumetric charges, current Spanish policies seem to fail in providing price incentives for water conservation in irrigated agriculture. By integrating environmental objectives, this instrument is potentially efficient in achieving water use reduction and hence wetland recovery, yet not cost-effectively. Farmers’ incomes could not be raised without a high level of public expenditure. Hence, social acceptance would be low in spite of sufficient achievements in wetland conservation and limited monitoring costs (Varela-Ortega, 2003). This is a policy scenario that would maintain the status quo and it is most consistent with the B1 scenario, i.e. intermediate conditions of aridity.
3.2.5.3 Agenda 2000 with Cross-Compliance
A second element of the CAP reform which can represent a further step forward compared to the previous approach is “… making the full payment of the direct payments conditional on the respect of statutory environmental requirements and minimum standards of good agricultural and environmental

Model results
31
condition” (Herbke, Dworak & Karaczun, 2005). Under these circumstances, cross-compliance would involve limitations on water extraction. The balanced integration of environmental and social objectives in water-saving programmes has shown to be more effectively achieved by this policy option than the previous ones. In fact, substantial reduction in water consumption could be achieved with a moderate decrease in farm income at a low public cost (Varela-Ortega, 2003). The policy option described would be considered the worst case scenario for the basin. It is most consistent with the A2 scenario, i.e. conditions of high aridity.
3.3 Lower Guadiana
The same Climate Module and Hydrology Module apply for both the Upper Guadiana and the Lower Guadiana.
3.3.1 Buffering Capacity Module Table 23 Buffering capacity for the Lower Guadiana Basin under the B1, A1B and A2 climate change scenarios
Lower Guadiana B1 A1B A2
Buffering capacity as monthly change in reservoir level (m) -169 -156 -145
Table 23 shows the values of the buffering capacity resulting from the ENSEMBLES projections for the 3 IPCC scenarios under analysis with regards to the Lower Guadiana. The levels for the buffering capacity as monthly changes in reservoir level are then defined as follows: > 63; 63 to 125; < 125 m/month, in terms of the water volume deficit of the Caia reservoir. This deficit is in turn defined “… in reference to normal values expected for the current month [against] expected hydrological conditions for the coming month” (Lerat et al., 2006d, p. 10). The values were derived from the model proposed to simulate monthly stored volumes in the Caia reservoir (Lerat et al., 2006d, p. 26). The results are in line with the assumption by Kilsby et al. (2007), for a notional transboundary agreement, that the annual flow across the Spanish-Portuguese frontier should never go below 600 Mm3. Dead storage, useful storage levels and areas for the calculations were retrieved from Brandão & Rodrigues (2000).
3.3.2 Water Demand Module Table 24 Changes in water withdrawal from the Lower Guadiana Basin under the B1, A1B and A2 climate change scenarios
Lower Guadiana B1 A1B A2
Water use ratio (%) 5.80% 10.14% 15.04%
Table 24 shows the values of the water use ratio resulting from the WaterGAP projections for the 3 IPCC scenarios under analysis. The levels for water use variable are defined as follows: < 6%; 6-15%; > 15%. The Portuguese part of the Guadiana catchment occupies 17% of the whole basin with 1 670 000 inhabitants. The annual demand is 0.56 Km3/year, equal to 19% of total withdrawals (Olay et al., 2003). Portuguese use is similar to Spanish as agriculture is the main water user in the basin, accounting for 88% of the total consumption (Krysanova et al., 2006). Nevertheless, the Caia sub-catchment provides a slightly different breakdown of services. In fact, “the dam is devoted mainly to irrigation with 43% of annual uses [while] energy production is the second use with 26% of consumption”, urban water supply accounts for 4%, and the remainder is released (Lerat et al., 2006b)
Table 25 shows that no general trend can be identified for the water demand in this region as it will be rather dependant on each scenario development.

Model results
32
Table 25 Evolution of water use ratio in the Lower Guadiana at different stages of the time series under the B1, A1B and A2 climate change scenarios
B1 Change A1B Change A2 Change
2001 30.96% - 38.50% - 63.29% -
2025 28.96% -2.00% 39.33% 0.83% 48.43% -14.86%
2050 39.63% 10.67% 29.37% -9.96% 48.35% -0.08%
3.3.3 Water Policy Module Table 26 Water policy options for the Lower Guadiana region
Lower Guadiana B1 A1B A2
Water policy water pricing water supply integrated approach
Table 26 shows the most plausible policy options for the Lower Guadiana region and the three IPCC scenarios under analysis.
3.3.3.1 ‘Water supply only’ option
Positive short-term impacts on the economy have already resulted in the development of activities in the area surrounding the dam. There have been direct short-term impacts on society as the reservoir provides public water supply, generates electricity, and new jobs have been created as a result of the development of irrigated agriculture in the area. However, future planning may require changes in the distribution and payment for the current water allocation which could give rise to social and political conflicts between different water users. A longer-term assessment of the impacts of current use would probably reveal a negative cost-benefit ratio for the economy, the society and the environment (EC, 2007). Therefore, this option delivers the worst case scenario in terms of consistency between the different EU policies on climate, water, agriculture and energy, among others.
3.3.3.2 ‘Water pricing only’ option
The implementation of water pricing for agriculture usually leads to more efficient use of land. However, current prices are often well below the range according to which water savings can be considered financially necessary for farmers. As a result, water pricing is a rather neutral policy instrument when it comes to both the timescale and socio-economic impacts. In fact, social impacts may depend on the level of water pricing considered and could prove even negative for some economic sectors or some social classes of the population. Moreover, positive impacts on the economy and the environment are usually expected when effective water pricing policies and cost recovery for water services are introduced (EC, 2007). This may be difficult to achieve in Spain and Portugal where pumping of groundwater from illegal wells is relatively common (Llamas & Martinez-Santos, 2005). All in all, this option delivers average results in terms of consistency between EU policies.
3.3.3.3 Water savings and water efficiency potential
An assessment of the water saving potential resulting from the implementation of appropriate water conservation measures in the water system of the Caia reservoir would probably show that a considerable amount of water can be saved from leakages and inefficient use. Not only could water demand management through reduction of wastage make more sense economically than increasing supply, but it would also deliver some buffering capacity back to the hydrological system. A more integrated approach which includes water savings and efficiency potential would deliver results gradually. Compared to the other options, it generates the greatest benefits and best case scenario for the environment. This option also brings about conditions in which the consistency between EU policies is improved. Once water quantity is preserved, water allocation would then become less of an equity issue.

Climate and Management Scenarios
33
4 Climate and Management Scenarios As described in section 2.2.2, 6 (+1) impact variables were identified for the Rhine and Guadiana Basins: Climate Change; Hydrology; Water Demand; Water Policy; Water Management; Land Use Management (only for the Upper Guadiana); Buffer Capacity. The levels for each variable under the three IPCC scenarios were defined through the model results in section 3. Hence, three ranges of values have been produced for each variable (Table 27). Each scenario is a mathematical vector expressing a certain combination of the three possible levels of the 6 (+1) impact variables below.
Table 27 Impact variables and corresponding levels for the three River Basins (R stands for Rhine, G for Guadiana, UP for Upper Guadiana, LG for Lower Guadiana)
Variable (River Basin) best-case < > worst case
Climate Change (R) CMI = > 0.30 0.28 < CMI < 0.30 CMI < 0.28
Climate Change (G) AI < 0.47 0.47 < AI < 0.48 AI > 0.48
Hydrology (R) deficits < 20% year 20 < deficits < 22% year deficits > 22% year
Hydrology (G) deficits < 60% year 60 < deficits < 61% year deficits > 60% year
Water Demand (R) water use ratio < 4.0% 4.0 < water use ratio < 4.5% water use ratio < 4.5%
Water Demand (UG) groundwater consumption< 500 m3/ha
500< groundwater consumption <1000 m3/ha
groundwater consumption> 1000 m3/ha
Water Demand (LG) water use ratio < 6% 6 < water use ratio < 15% water use ratio < 15%
Water Policy (R) WFD-supportive CAP reform
GPCC (energy crops)
WFD-detrimental CAP reform
Water Policy (UG) Agenda 2000 w/CC AEP Agenda 2000 w/o CC
Water Policy (LG) Integrated Approach Water Pricing only Water Supply only
Water Mgmt (R) groundwater storage groundwater withdrawals reservoir storage
Water Mgmt (UG) groundwater withdrawal < 400 Mm3
400 < groundwater withdrawal < 600 Mm3
groundwater withdrawal > 600 Mm3
Land use Mgmt `(UG) water intensive crops < 50%
50 < water intensive crops < 70%
water intensive crops > 70%
Water Mgmt (LG) water conservation
water use conflict resolution
water supply augmentation
Buffer Capacity (R) low flows > 1200 m3/s 800 < low flows < 1200 m3/s low flows < 800 m3/s
Buffer Capacity (UG) aquifer recharge > 2 m/y
0 < aquifer recharge < 2 m/y
aquifer recharge < 0 m/y
Buffer Capacity (LG) reservoir level > -63 m/month
-63 < reservoir level < -125 m/month
reservoir level < -125 m/month
A crucial step in scenario construction is consistency analysis. The procedure was intended to clean up the full set of 729 scenarios from discrepancies, and has produced 9 specific combinations of levels which are logically consistent for each river basin. During consistency analysis, no attempt is made to go beyond the assessment of the logical possibility of a hypothetical future state of the system. Consistency is a necessary, but not sufficient, prerequisite for the actual likelihood of the constructed scenarios. Pure probability calculations for the case are not appropriate for the scenario-analytic approach adopted here. For instance, considerations on the probability of each combination are left to Bayesian network studies. Consistency values are attributed taking into account the principle of d-

Climate and Management Scenarios
34
interdependence. Nevertheless, constructing scenarios equals assigning an intelligible meaning to all the formally assessed sequences of numbers. Hence, the interactions between variables become a plausible picture of the future.
All pairs of impact variables were rated according to a 4-value scale: • 3 = complete consistency, the levels of the impact variables are coherent and support each other
(i.e. scenarios including several of these combinations are highly likely); the levels assigned this rating stem from identical conditions under the same IPCC scenario;
• 1 = partial or weak consistency (i.e. scenarios including several of these combinations of levels are less likely); the levels assigned this rating stem from similar conditions under different IPCC scenarios;
• 0 = inconsistency (i.e. scenarios including these combinations of levels are unlikely); the levels assigned this rating stem from different conditions under different IPCC scenarios;
• -45 strong inconsistency (i.e. scenarios including these combinations of logically contradictory levels of impact variables are not thinkable, or more simply, impossible); the levels assigned this rating depend on no conditions other than a specific IPCC scenario.2
In order to allow river basin stakeholders to concentrate on the possible consequences entailed by each management option, plausible scenarios have been grouped in three storylines.
4.1 Rhine
4.1.1 Management of low flows in response to drought Table 28 Water Management options for the Rhine region
Rhine best case < > worst case
Water Management groundwater
storage groundwater withdrawals
reservoir storage
Table 28 shows the alternative options considered for the Rhine Basin in order to manage low flows in response to drought concerns. Groundwater withdrawals ranks higher than reservoir storage because, compared to abstractions directly from the river, establishment of boreholes or wells to minimize reductions in baseflow may in fact enhance water supply and reduce impacts on rivers and wetlands at the same time. Large-scale groundwater storage projects consist of diverting water from streams for recharge into holding basins such as dry ponds, dry creek beds, or other appropriate sites (Lerat et al., 2005).
4.2 Upper Guadiana
4.2.1 Groundwater abstraction Table 29 Water Management options for the Upper Guadiana region
Upper Guadiana best case < > worst case
Water Management modification of cropping patterns
improvement of irrigation techniques
groundwater withdrawals
Table 29 shows the alternative options considered for the Upper Guadiana Basin in order to manage groundwater abstractions in response to aquifer drifting. Groundwater withdrawals would be prevailing for rates of abstraction higher than 600 Mm3. Improvements in the irrigation techniques
2 -45 as opposed to +45, i.e. the highest score attainable by summing up all combinations rated 3.

Climate and Management Scenarios
35
would lower groundwater abstractions between 400 and 600 Mm3. A more radical modification in the cropping pattern would drive consumption below 400 Mm3.
4.2.2 Land use change Table 30 Land Use Management options for the Upper Guadiana region
Upper Guadiana best case < > worst case
Land Use Management cereals, oilseeds and fallow
drip-irrigated crops
water-intensive crops
Table 30 shows the alternative options considered for the Upper Guadiana Basin in order to manage land use change and groundwater demand accordingly. Over 70% of land devoted to water-intensive crops (maize, sugar beet, fodder, olive groves, rice, etc.) and drip-irrigated crops (vineyards, melons, etc.) corresponds to increasing groundwater withdrawals (> 600 Mm3). 50-70% of land devoted to these two types of crops corresponds to improvements in irrigation techniques so that groundwater abstractions decrease between 400 and 600 Mm3. 50% or below of land devoted to these two types of crops corresponds to a more radical modification in the cropping pattern, i.e. less water-intensive crops (cereals and sunflowers), fallow and set-aside land (< 400 Mm3). In the latter case, drip-irrigated crops would be the main water-intensive agriculture remaining.
4.3 Lower Guadiana
4.3.1 Reservoir management Table 31 Water Management options for the Lower Guadiana region
Upper Guadiana best case < > worst case
Water Management water
conservation water use conflict
resolution water supply augmentation
Table 31 shows the alternative options considered for the Lower Guadiana Basin in order to manage the Caia reservoir in response to multiple water users. Dam operating rules reveal low buffering capacity during summer dry periods, i.e. when uses for agriculture and hydropower mainly occur (starting in May or June). Although the downstream release is quite important (23%) in winter, the dam may have serious impacts on the freshwater ecosystem within the Guadiana river basin (Lerat et al., 2005, 2006b). Therefore, three different levels of water allocation are considered for the case. The first one involves efficiency measures to increase water availability, reduce demand through water conservation programmes, and thus allow higher water allocations. The second one relies on discussing with users to lower water allocation in case of shortages. The third one aims at increasing storage to compensate for low inflows in the reservoir.

Discussion
36
5 Discussion The narrative storylines of water management options are outlined in tables 32 to 34. They can be used by local stakeholders and decision makers to gain an insight into their preferences and negotiation criteria.
The letters X, Y, and Z stand for the various water management storylines. The numbers 1, 2, and 3 stand for the individual scenario ranking in terms of consistency. When scenarios from different storylines share the same consistency ranking (and thus are equally plausible), they are divided by a dashed line in the tables. When two scenarios with the same ranking belong to the same storyline, they are additionally identified by the same letter and number.
Table 32 shows the ranking of scenarios for the Rhine Basin in descending order of consistency: the higher the scenario, the more plausible the conditions composing it.
The groundwater storage storyline and scenario family (# X1, X2, X3) entails a future for the Rhine Basin where: • low flows are moderately frequent (74 days/year); • water demand increases (4.0-4.5% of water availability) while the current mix of uses remains
chiefly unchanged in terms of shares; • land use changes in favour of energy crops which replace less profitable food crops as a result of
the promotion of the use of biofuels for transport in the EU and of consistent action in agriculture by the Green Paper on Climate Change and Adaptation;
• the climate evolves towards relatively humid conditions (7% wetter than the present).
Under such combination of natural characteristics and anthropogenic influences, buffering capacity is more plausible when at the lowest value, i.e. smaller than 800 m3/s (scenario # X1). When the mean annual discharge is less than 184 Mm3/month, the accumulated stream flow deficit lingers below the 800 m3/s threshold and nearly all navigation becomes impossible.
The groundwater withdrawals storyline and scenario family (# Y1, Y2) entails a future for the Rhine Basin where: • low flows are rather frequent (81 days/year); • water demand increases only slightly (< 4.0% of water availability) as irrigation agriculture gains
some shares over industry; • land use change mirrors the allocation of agricultural subsidies to those who meet water-quantity
standards (i.e. according to a WFD-supportive CAP Reform); • the climate evolves towards the relatively driest conditions (8% drier than the present).
Under such combination of natural characteristics and anthropogenic influences, buffering capacity is equally plausible whether at the largest or the smallest values (scenarios # Y1).
The reservoir storage storyline and scenario family (# Z1, Z2, Z3) entails a future for the Rhine Basin where: • low flows are less frequent (69 days/year); • water demand increases considerably (> 4.5% of water availability) as consumption for domestic
uses becomes greater than agriculture, • land use change mirrors the lack of incentives for farmers (i.e. the CAP reform is detrimental to
the WFD); • the climate evolves towards the relatively wettest conditions (8% wetter than the present).
Under such combination of natural characteristics and anthropogenic influences, buffering capacity is more plausible when at the highest value, i.e. greater than 1200 m3/s (scenario # Z1). When the mean annual discharge is more than 242 Mm3/month, the accumulated stream flow deficit remains above the 1200 m3/s threshold and no limitations are imposed to navigation.

Table 32 Scenario ranking for the Rhine (in red are the management options that maximise buffering capacity under the different conditions; in the leftmost column the water management storyline and the individual scenario ranking in terms of consistency is indicated)
# Water mgmt Buffering capacity Climate change Hydrology Water demand Water policy
X1 Groundwater storage
No navigation (deficit < 800 m3/s)
7% wetter (0.28 < CMI < 0.30)
74 days of low flows (20 < deficit < 22% year)
Present mix unchanged 4.0 < water use ratio < 4.5%
WFD-supportive CAP reform
Y1 Groundwater withdrawals
Free navigation (deficit > 1200 m3/s)
8% drier (0.28 < CMI)
81 days of low flows (deficit > 22% year)
- irrigation, + domestic water use ratio > 4.5%
GPCC (energy crops)
Y1 Groundwater withdrawals
No navigation (deficit < 800 m3/s)
8% drier (0.28 < CMI)
81 days of low flows (deficit > 22% year)
- irrigation, + domestic (water use ratio > 4.5%)
GPCC (energy crops)
X2 Groundwater storage
Restricted navigation (800 < deficit< 1200 m3/s)
7% wetter (0.28 < CMI < 0.30)
74 days of low flows (20 < deficit < 22% year)
Present mix unchanged 4.0 < water use ratio < 4.5%
WFD-supportive CAP reform
Y2 Groundwater withdrawals
Restricted navigation (800 < deficit< 1200 m3/s)
8% drier (0.28 < CMI)
81 days of low flows (deficit > 22% year)
- irrigation, + domestic (water use ratio > 4.5%)
GPCC (energy crops)
Z1 Reservoir storage
Free navigation (deficit > 1200 m3/s)
8% wetter (CMI > 0.30)
69 days of low flows (deficit < 20% year)
+ irrigation, - industry water use ratio < 4.0%
WFD-detrimentalCAP reform
X3 Groundwater storage
Free navigation (deficit > 1200 m3/s)
7% wetter (0.28 < CMI < 0.30)
74 days of low flows (20 < deficit < 22% year)
Present mix unchanged 4.0 < water use ratio < 4.5%
WFD-supportive CAP reform
Z2 Reservoir storage
Restricted navigation (800 < deficit < 1200 m3/s)
8% wetter (CMI > 0.30)
69 days of low flows (deficit < 20% year)
+ irrigation, - industry water use ratio < 4.0%
WFD-detrimental CAP reform
Z3 Reservoir storage
No navigation (deficit < 800 m3/s)
8% wetter (CMI > 0.30)
69 days of low flows (deficit < 20% year)
+ irrigation, - industry water use ratio < 4.0%
WFD-detrimental CAP reform

Discussion
38
Table 33 shows the ranking of scenarios for the Upper Guadiana Basin in descending order of consistency: the higher the scenario, the more plausible the conditions composing it.
The groundwater withdrawals and water-intensive crops storyline and scenario family (# X1, X2) entails a future for the Upper Guadiana Basin where: • low flows are moderately frequent (220 days/year); • the overall consumption of groundwater increases (> 1000 m3/ha) as water-intensive and drip-
irrigated crops are grown on more than 70% of the total irrigated area; • land use change mirrors the lack of incentives for intensive production due to decoupling of direct
payments, but not for water-use reductions (CAP reform without Cross-Compliance); • the climate evolves towards the relatively wettest conditions (15% wetter than the present).
Under such combination of natural characteristics and anthropogenic influences, buffering capacity is more plausible for a relatively slow wetland recovery (20-25 years), equal to a rate of aquifer recharge between 0 and 2 m/y (scenario # X1).
The more efficient irrigation techniques and drip-irrigated crops mainly storyline and scenario family (# Y1, Y2, Y3) entails a future for the Upper Guadiana Basin where: • low flows are less frequent (219 days/year), • the overall consumption of groundwater increases only slightly (< 500 m3/ha) as drip-irrigated
crops become more profitable than other water-intensive species (the total irrigated area being reduced down to 50% and below);
• land use change mirrors the deployment of perverse subsidies to reduce water consumption (policy instrument equivalent to Agri-Environmental Payments);
• the climate is not so different than today’s prevailing conditions (<1% wetter than the present).
Under such combination of natural characteristics and anthropogenic influences, buffering capacity is more plausible at the highest value, i.e. rate of aquifer recharge > 2 m/y (scenario # Y1). When the aquifer is recharged at this rate, the associated wetlands can recover in about 15-20 years.
The modified cropping pattern and less water-intensive crops storyline and scenario family (# Z1, Z2, Z3) entails a future for the Upper Guadiana Basin where: • low flows are rather frequent (223 days/year); • the overall consumption of groundwater increases moderately (500-1000 m3/ha) as 30-50% of the
total irrigated area is taken over by cereals, sunflowers or fallow; • land use change mirrors the deployment of subsidies which are conditional on the respect of
certain water-extraction standards (CAP reform with Cross-Compliance); • the climate evolves towards the relatively driest conditions (3% drier than the present).
Under such combination of natural characteristics and anthropogenic influences, buffering capacity is more plausible at the lowest value, i.e. negative rates of aquifer recharge (scenario # Z1). When abstraction exceeds aquifer recharge, no recovery of wetlands can reasonably occur.

Table 33 Scenario ranking for the Upper Guadiana (in red the management options that maximise buffering capacity under the different conditions; in the leftmost column the water management storyline and the individual scenario ranking in terms of consistency is indicated)
# Water/land use mgmt Buffer capacity Climate change Hydrology Groundwater demand Water policy
X1 Groundwater withdrawal + water-intensive crop
Slow wetland recovery (0 <aquifer recharge< 2m/y)
15% wetter (> 0.48)
220 days of low flows (60 < deficit < 61%)
Overall consumption > 1000 m3/ha (withdrawal > 600 Mm3 /y) (water-intensive crops > 70% area)
CAP reform w/o Cross Compliance
X2 Groundwater withdrawal+ water-intensive crops
Fast wetland recovery (aquifer recharge > 2 m/y)
15% wetter (> 0.48)
220 days of low flows (60 < deficit < 61%)
Overall consumption > 1000 m3/ha(withdrawal > 600 Mm3 /y) (water-intensive crops > 70% area)
CAP reform w/o Cross Compliance
X2 Groundwater withdrawal + water-intensive crop
No wetland recovery (aquifer recharge < 0 m/y)
15% wetter (> 0.48)
220 days of low flows (60 < deficit < 61%)
Overall consumption > 1000 m3/ha (withdrawal > 600 Mm3 /y) (water-intensive crops > 70% area
CAP reform w/o Cross Compliance
Y1 Irrigation techniques + drip-irrigated crops mainly
Fast wetland recovery (aquifer recharge > 2 m/y)
< 1% wetter (0.47 < AI < 0.48)
219 days of low flows (deficit < 60%)
Overall consumption < 500 m3/ha (400 < withdrawal < 600 Mm3 /y) (water-intensive crops <50% area)
Agro-Environmental Programme
Z1 Modified cropping pattern + less water-intense crops
No wetland recovery (aquifer recharge < 0 m/y)
3% drier (AI < 0.47)
223 days of low flows (deficit > 61%)
500 < overall consumption < 1000 m3/ha (withdrawal > 600 Mm3 /y) (50< water-intensive crops <70% area)
CAP reform w/ Cross Compliance
Y2 Irrigation techniques + drip-irrigated crops mainly
Slow wetland recovery (0 <aquifer recharge< 2m/y)
< 1% wetter (0.47 < AI < 0.48)
219 days of low flows (deficit < 60%)
Overall consumption < 500 m3/ha (400 < withdrawal < 600 Mm3 /y) (water-intensive crops <50% area)
Agro- Environmental Programme
Z2 Mod. cropping pattern + less water-intensive crops
Fast wetland recovery (aquifer recharge > 2 m/y)
3% drier (AI < 0.47)
223 days of low flows (deficit > 61%
500 < overall consumption < 1000 m3/ha (withdrawal > 600 Mm3 /y) (50< water-intensive crops <70% area)
CAP reform w/ Cross Compliance
Z2 Modified cropping pattern + less water-intense crops
S Slow wetland recovery (0 <aquifer recharge< 2m/y)
3% drier (AI < 0.47)
223 days of low flows (deficit > 61%
500 < overall consumption < 1000 m3/ha (withdrawal > 600 Mm3 /y) (50< water-intensive crops <70% area)
CAP reform w/ Cross Compliance
Y3 Irrigation techniques + drip-irrigated crops mainly
No wetland recovery (aquifer recharge < 0 m/y)
< 1% wetter (0.47 < AI < 0.48)
219 days of low flows (deficit < 60%)
Overall consumption < 500 m3/ha (400 < withdrawal < 600 Mm3 /y) (water-intensive crops <50% area)
Agro- Environmental Programme

Discussion
40
Table 34 shows the ranking of scenarios for the Lower Guadiana Basin in descending order of consistency: the higher the scenario, the more plausible the conditions composing it.
The lower water allocations storyline and scenario family (# X1, X2, X3) entails a future for the Lower Guadiana Basin where: • low flows are less frequent (219 days/year); • water demand increases only slightly (< 6% of water availability) as both domestic and
agricultural uses decrease; • land use change mirrors water-conflict resolution measures which protects other users such as
electricity generators or the freshwater ecosystem in the event of low inflows to the Caia reservoir; • the climate evolves towards the relatively driest conditions (3% drier than the present).
Under such combination of natural characteristics and anthropogenic influences, buffering capacity is more plausible at the lowest value, i.e. filling deficit > 125 m/month (scenario # X1). When the reservoir level is below -169 m, the water volume is under dead storage regime.
The no water allocations storyline and scenario family (# Y1, Y2, Y3) entails a future for the Lower Guadiana Basin where: • low flows are moderately frequent (220 days/year), • water demand increases (6-15% of water availability) as consumption for domestic uses becomes
greater than agriculture; • land use change mirrors water-supply augmentation measures which address flood periods to
compensate for low inflows to the Caia reservoir; • the climate evolves towards the relatively wettest conditions (15% wetter than the present).
Also under such combination of natural characteristics and anthropogenic influences, buffering capacity is more plausible at the lowest value i.e. filling deficit > 125 m/month (scenario # Y1).
The higher water allocations storyline and scenario family (# Z1, Z2, Z3) entails a future for the Lower Guadiana Basin where: • low flows are rather frequent (223 days/year); • water demand increases considerably (> 15% of water availability) as both irrigation and
hydropower requirements increase; • land use change mirrors water conservation programmes which include water savings and
efficiency to tackle low inflows to the Caia reservoir;
• the climate is not so different than today’s prevailing conditions (<1% wetter than the present).
Under such combination of natural characteristics and anthropogenic influences, buffering capacity is more plausible at the greatest value, i.e. filling deficit < 63 m/month (scenario # Z1). When the reservoir level is above -145 m, the water volume is under flood storage regime.

Table 34 Scenario ranking for the Lower Guadiana (in red the management options that maximise buffering capacity under the different conditions; in the leftmost column the water management storyline and the individual scenario ranking in terms of consistency is indicated)
# Water mgmt Buffer capacity Climate change Hydrology Water demand Water policy
X1 Lower water allocations
Dead storage (level < -125 m/month)
3% drier (AI < 0.47)
219 days of low flows (deficit < 60%)
- irrigation, - domestic (water use ratio < 6%)
Water Pricing only option
Y1 No water allocations
Dead storage (level < -125 m/month)
15% wetter (> 0.48)
220 days of low flows (60 < deficit < 61%)
+ domestic, - irrigation (6 < water use ratio < 15%)
Water Supply only option
Y2 No water allocations
Useful storage (-63 < level < -125 m/month)
15% wetter (> 0.48)
220 days of low flows (60 < deficit < 61%)
+ domestic, - irrigation (6 < water use ratio < 15%)
Water Supply only option
Z1 Higher water allocations
Flood storage (level > -63 m /month)
< 1% wetter (0.47 < AI < 0.48)
223 days of low flows (deficit > 61%)
+ irrigation + domestic (water use ratio > 15%)
Integrated Approach
Y3 No water allocations
Flood storage (level > -63 m /month)
15% wetter (> 0.48)
220 days of low flows (60 < deficit < 61%)
+ domestic, - irrigation (6 < water use ratio < 15%)
Water Supply only option
X2 Lower water allocations
Useful storage (-63 < level < -125 m/month)
3% drier (AI < 0.47)
219 days of low flows (deficit < 60%)
- irrigation, - domestic (water use ratio < 6%)
Water Pricing only option
X3 Lower water allocations
Flood storage (level > -63 m /month)
3% drier (AI < 0.47)
219 days of low flows (deficit < 60%)
- irrigation - domestic (water use ratio < 6%)
Water Pricing only option
Z2 Higher water allocations
Useful storage (-63 < level < -125 m/month)
< 1% wetter (0.47 < AI < 0.48)
223 days of low flows (deficit > 61%)
+ irrigation, + hydropower (water use ratio > 15%)
Integrated Approach
Z3 Higher water allocations
Dead storage (level < -125 m/month)
< 1% wetter (0.47 < AI < 0.48)
223 days of low flows (deficit > 61%)
+ irrigation, + hydropower (water use ratio > 15%)
Integrated Approach

Conclusions
42
6 Conclusions The scenario development and analysis produced in this report will be used by WP 1.5 partners in NeWater to test models of storage and buffering capacity in river basins. The means to assess optimal strategies for the management of storage and buffering capacity under present conditions had already been identified by specific models. This report presents an inventory of climate and management scenarios that test those models. In particular, the gap between optimal practices in present conditions and more robust strategies under long-term uncertainties has been quantified to some extent. The concept of buffering capacity has been adapted to the case studies of the Rhine and Guadiana Basins. The scenarios used information from collated data on rainfall statistics, stream flows and reservoir level time-series and groundwater withdrawals, among others. Further modelling compared alternate strategies for adaptive management of water storage and buffering of river flows provided by reservoirs and aquifers in the two river basins.
The natural characteristics of the river basins such as climate and hydrology reveal that the variability of aridity indices and discharge deficits is narrow across the three different IPCC scenarios analysed. As a consequence of the combined trends in precipitation and temperature, the A2 emission scenario is projected to bring about the driest conditions to both regions. On the contrary, B1 entails a much greater increase in rainfall for the Guadiana than for the Rhine. There, the change in the moisture index under A1B is only slightly greater than under B1. At any rate, the differences between climate change scenarios are wider for the Guadiana Basin. However, there is no apparent correlation between climate and hydrology indicators, i.e. the largest precipitation deficit does not necessarily correspond to the largest discharge deficit.
The anthropogenic influences associated with the natural characteristics of the two river basins show that precise interlinkages and feedback loops exist between the impact variables of the catchments’ systems. In particular, the buffering capacity of reservoirs and aquifers is clearly affected when certain water and land use management is put in place. Water policies are in turn implemented as a reaction to the modified water demand and hydrological regimes due to climate change.
Previous observations by other WP 1.5 partners have been supported by further evidence on buffering capacity. In particular, buffering capacity is higher with large reservoir storages. The marginal increase in reservoir capacity for the Rhine Basin as a whole is greater than for the Caia reservoir in the Lower Guadiana Basin. However, the rates of groundwater recharge in the Upper Guadiana seem to confirm that buffering capacity is also higher in aquifers than in rivers e.g. the Rhine. There, response to withdrawal is more immediate. As a result of these two factors together, buffering capacity proves higher in the Guadiana than in the Rhine. Despite the greater variability in rainfall patterns, duration of drought periods, and degree of human pressure, hydrological variations such as discharge deficits are more limited in the Guadiana Basin.
Under the three different sets of climate and socioeconomic conditions, 2001-2050 storylines of alternative water management were developed for the Rhine and Guadiana Basin:
• The management of low flows in the Rhine Basin is maximised by groundwater withdrawals in the driest conditions, and by reservoir storage in the wettest conditions. Groundwater storage describes an intermediate situation, though closer to a highly wet climate;
• The management of the Mancha Occidental aquifer in the Upper Guadiana Basin can be maximised through modified cropping patterns in favour of less water-intensive species in the driest conditions, and by groundwater withdrawals for water-intensive species in the wettest conditions. Better irrigation techniques and prevailing drip-irrigated crops describe an intermediate situation where the climate conditions are similar to the present;

Conclusions
43
• The management of the Caia reservoir in response to multiple water users in the Lower Guadiana Basin is maximised by a lower degree of allocation following conflict resolution in the driest conditions, and by further development of water supply in the wettest conditions. Water conservation following efficiency measures describes an intermediate situation where the climate conditions are similar to the present.
The outputs from Deliverable 1.5.4 combined with the work being carried out by WP 1.5 partners can be used to aid river basin stakeholders and decision-makers to understand the possible consequences of management options put in place under different climate, land use and water abstraction scenarios. The information is important to guide decision makers towards making better informed management decisions in a timely manner and avoiding inconsistent provisions. Adaptive water management is a complex problem which is normally difficult to grasp from the various angles. The reasonable alternatives have been simplified and made more accessible by the scenario analysis.

List of references
44
List of references Barchiesi, S. (2006). On whether vegetation could contribute to major climate change mitigation
efforts: Forestry for carbon credits or carbon credits for forestry? A multi-criteria decision support model for forest carbon offsets. On-line document: http://theses.lub.lu.se/archive/ 2008/02/02/1201947034-27030-204/07_Stefano_Barchiesi.pdf last access: June 2006
Beersma, J. J., and T. A. Buishand (2004), Joint probability of precipitation and discharge deficits in
the Netherlands. Water Resour. Res., 40, W12508, doi:10.1029/2004WR003265. On-line doucment: http://www.knmi.nl/publications/fulltexts/ beersma_buishand_2004wr003265_copy1.pdf last access: June 2006
Brandão, C., Rodrigues, R. (2000). Hydrological Simulation of the International Catchment of
Guadiana River. Phy. Chem. Earth, 25(3), 329-339. European Commission. (2007) Communication from the Commission to the European Parliament and
the Council addressing the challenge of water scarcity and droughts in the European Union. Summary of the impact assessment. On-line document: http://ec.europa.eu/environment/ water/quantity/pdf/comm_droughts/ia_summary_en.pdf last access: June 2006
Fast, I. (2006). ENSEMBLES EGMAM SRESA1B run2, monthly mean values. World Data Center for
Climate. CERA-DB "ENSEMBLES_FUBEMA_SRA1B_2_MM" On-line database: http://cera-ww.dkrz.de/WDCC/ui/ Compact.jsp?acronym=ENSEMBLES_FUBEMA_SRA1B_2_MM last access: May 2006
Fast, I. (2006). ENSEMBLES EGMAM SRESA2 run2, monthly mean values. World Data Center for
Climate. CERA-DB "ENSEMBLES_FUBEMA_SRA2_2_MM" On-line database: http://cera-ww.dkrz.de/WDCC/ui/ Compact.jsp?acronym=ENSEMBLES_FUBEMA_SRA2_2_MM last access: May 2006
Fast, I. (2006). ENSEMBLES EGMAM SRESB1 run2, monthly mean values. World Data Center for
Climate. CERA-DB "ENSEMBLES_FUBEMA_SRB1_2_MM" On-line database: http://cera-ww.dkrz.de/WDCC/ui/ Compact.jsp?acronym=ENSEMBLES_FUBEMA_SRB1_2_MM last access: May 2006
Herbke, N., Dworak, T., and Karczun, Z. M. (2005) WFD and Agriculture – Analysis of the pressures
and impacts. Broaden the problem’s scope. Deliverable 2.2 Water Framework Directive meets Common Agricultural Policy - Opportunities for the Future. On-line document: http:// www.ecologic.de/download/projekte/1950-1999/1966/1966_deliverable_2-2.pdf last access: May 2006
Kilsby, C. G., Tellier, S. S., Fowler, H. J., and Howels, T. R. (2007). Hydrological impacts of climate
change on the Tejo and Guadiana Rivers. Hydrology & Earth Systems Science, 11(3), 1175-1189.
Krysanova, V., Buitevald, H., Haase, D., Martinez-Santos, P., van Kierk, K., Roest, K., and Schlüter,
M. (2006) Existing practices and lessons learned in coping with climatic hazards (floods and droughts) at river basin scale. Task 2.2.2, NeWater Report Series.
Llamos, R. and Martinez-Santos, P. (2005) Baseline Condition Report (Upper Guadiana Basin).
Deliverable 3.4.1, NeWater Report Series. Lerat, J., Andreassian, V., and Hendriksen, H.-J. (2005) Criteria to define and assess basin-scale
nufferiing capacity. Deliverable 1.5.1, NeWater Report Series. Lerat, J., Abadie, B., Andreassian, V., and Perrin, C. (2006) Case study basin database (Rhine basin).
Deliverable 1.5.2a, NeWater Report Series

List of references
45
Lerat, J., Abadie, B., Andreassian, V., and Perrin, C. (2006) Case study basin database (Guadiana
basin). Deliverable 1.5.2b, NeWater Report Series. Lerat, J., Abadie, B., Andreassian, V., and Perrin, C. (2006). Catchment scale domain models (Rhine
basin). Deliverable 1.5.3a, NeWater Report Series. Lerat, J., Rasmussen, P., Henriksen, H.-J., Andreassian, V., Perrin, C., Payan, J.-L., and Barlebo, H.
(2006). Catchment scale domain models (Guadiana basin). Deliverable 1.5.3b, NeWater Report Series.
Menzel, L., Flörke, M., Matovelle, A., Alcamo, J. (2007). Impact of socio-economic development and
climate change on water resources and water stress. In: CAIWA 2007 - 1st International Conference on Adaptive and Integrated Water Management, Basel, 12.-15. November On-line document: http://www.usf.uni-kassel.de/cesr/ index.php?option=com_remository&Itemid=141&func=download&id=119&chk=1b2644d15504a0761457ce763c7c96d5 last access: May 2006
Millennium Ecosystem Assessment and World Resource Institute. (2005). Ecosystems and Human
Well-Being: Scenarios. Findings of the Scenarios Working Group. Island Press: On-line document: http://www.millenniumassessment.org/documents/document.330.aspx.pdf last access: March 2006
Moren-Abat, M., Quevauviller, P.. Feyen, L., Heiskanen, A.-S., Noges, P., Lyche Solheim, A. and
Lipiatou, E. (2007) Climate Change Impacts on the Water Cycle, Resources and Quality. Proceedings of the European Commission’s International Workshop, 25 - 26 September 2006, Scientific and policy report. EUR 22422. On-line document: http://ec.europa.eu/research/ environment/pdf/kina22422ens_web_water_and_cc.pdf last access: June 2006
Mouelhi, S., Michel, C., Perrin, C., and Andreassian, V. (2006) Stepwise development of a two-
parameter monthly water balance model. Journal of Hydrology, 318(1-4), 200-214. Mulligan, M., and Burke, S. (1999). Modelling the future of groundwater resources in central Spain.
Environmental Management and Health, 10(1), 41-51. Olay, A,. Cosme, N., Sousa, S., Estrela, M.A., Álvarez, R., and Loredo, J. (2003). Environmental data
on a case study from the Transboundary Catchment of Guadiana River. On-line document: http://idbdocs.iadb.org/wsdocs/getdocument.aspx?docnum=966885 last access: June 2006
Shabalova, M. V., van Deursen, W. P. A., and Buishand, T. A. (2003). Assessing future discharge pf
the rive Rhine using regional climate model integrations and a hydrological model. Climate Research, 23, 233-246. On-line document: http://www.int-res.com.ludwig.lub.lu.se/ articles/cr2003/23/c023p233.pdf last access: June 2006
Spielmann, M., Scholz, R. W. ,Tietje, O., and de Haan, P. (2005). Scenario Modelling in Prospective
LCA of Transport Systems: Application of Formative Scenario Analysis. International Journal of LCA, 10(5), 325-335.
Varela-Ortega, C. (2003). Assessment of agricultural policy options for sustainable ground-water
management: a case study of wetland conservation in Spain. Options Méditerranéennes, Sér A/ n. 52. On-line document: http://ressources.ciheam.org/om/pdf/a52/03400064.pdf last access: June 2006
Wiek, A., Binder, C., and Scholz, R. W. (2006) Functions of scenarios in transition processes.
Futures, 38(7), 740-766.

Annex I
46
Annex I: frequency of low flow events for the Rhine Basin

Annex I
47

Annex II
48
Annex II: return flows for the Rhine and Guadiana Basin

Annex II
49