rhb goldenlife funds interim report 2019
TRANSCRIPT

RHB GOLDENLIFE FUNDS
INTERIM REPORT 2019
For the financial period ended 31 August 2019

1
GENERAL INFORMATION ABOUT THE FUND
Sub-Fund Name, Category and Type
Sub-Fund Name - RHB GoldenLife Today (“GL Today”)
Period of Trust - Subject to occurrence of any events as stated under
Clause 11.37 of the Securities Commission
Malaysia’s Guidelines on Unit Trust Funds,
however, upon maturity of RHB GoldenLife 2010*,
RHB GoldenLife 2020 and RHB GoldenLife 2030,
these Funds will be merged into GL Today Sub-Fund Category - Bond
Sub-Fund Type - Income
Sub-Fund Name - RHB GoldenLife 2020 (“GL 2020”)
Tenure / Maturity Date 15 years 8 days / The date on which the GL 2020
will automatically terminate and merge into GL
Today on 29.02.2020 Sub-Fund Category - Balanced
Sub-Fund Type - Capital growth and income
Sub-Fund Name - RHB GoldenLife 2030 (“GL 2030”)
Tenure / Maturity Date 25 years 7 days / The date on which the GL 2030
will automatically terminate and merge into GL
Today on 28.02.2030 Sub-Fund Category - Equity
Sub-Fund Type - Capital growth
Note: * RHB GoldenLife 2010 matured on 28 February 2010. It was automatically
terminated and merged into RHB GoldenLife Today on 28 February 2010.

2
Investment Objective, Policy and Strategy
Objective of the Funds
RHB GoldenLife Today
To provide retired investors or investors who are retiring in the very near future a
steady income stream in planning for their financial needs upon retirement.
RHB GoldenLife 2020
To provide investors planning to retire in the year 2020, a wealth accumulation
vehicle for meeting their financial needs upon retirement.
RHB GoldenLife 2030
To provide investors planning to retire in the year 2030, a wealth accumulation
vehicle for meeting their financial needs upon retirement.
Strategy
RHB GoldenLife Today
The GL Today will place more emphasis on fixed income securities in Malaysia
in view that it is a conservative fund.
RHB GoldenLife 2020
The GL 2020 will invest in equities and fixed income securities in Malaysia and in
accordance with an asset allocation that will become increasingly conservative as
the year 2020 approaches.
RHB GoldenLife 2030
The GL 2030 will invest in equities and fixed income securities in Malaysia and in
accordance with an asset allocation that will become increasingly conservative as
the year 2030 approaches.

3
Performance Benchmark
RHB GoldenLife Today
Weighted average of FTSE Bursa Malaysia Kuala Lumpur Composite Index
(“FBM KLCI”) (10%) and Maybank’s 12-Months Fixed Deposit Rate (90%).
RHB GoldenLife 2020
Weighted average of FBM KLCI (55%) and Maybank’s 12-Months Fixed Deposit
Rate (45%).
RHB GoldenLife 2030
Weighted average of FBM KLCI (85%) and Maybank’s 12-Months Fixed Deposit
Rate (15%).
Permitted Investments
The Funds may invest in securities of companies listed on Bursa Malaysia;
unlisted securities including securities not listed or quoted on a stock exchange but
have been approved by the relevant regulatory authority for such listing or
quotation and are offered directly to the Funds by the issuer; financial derivatives;
collective investment schemes; structured products and warrants that carry the
right in respect of a security traded in or under the rules of an eligible market;
securities listed on foreign stock exchange, subject to the approval of the relevant
authorities; Malaysian Government Securities, Treasury Bills, Bank Negara
Malaysia Certificates and Government Investment Certificate; Malaysian currency
balance in hand, Malaysian currency deposits with commercial bank, finance
companies, merchant banks, Bank Islam Malaysia Berhad including Negotiable
Certificate of Deposits; Bankers’ Acceptance and placements of money at call
with discount houses; Cagamas bonds, unlisted loan stocks and corporate bonds
and private debt securities; and any other investments permitted by the Securities
Commission Malaysia from time to time.
Distribution Policy
RHB GoldenLife Today
Income, if any, will be distributed during the financial year.
RHB GoldenLife 2020 and RHB GoldenLife 2030
Subject to the availability of income at the end of the financial year.

4
MANAGER’S REPORT
MARKET REVIEW
Equity
Equity markets end the month of March 2019 on a strong note. Global equity
markets edged up 1.0% in March 2019 (year to date (“YTD”): 11.6%). The
turnaround since the sharp correction in December 2018 has largely been driven
by the capitulation of central banks, led by the United States (“US”) Federal
Reserve (“Fed”), as they fretted over weak global growth. US rose 1.7%, while
Europe (0.2%), Japan (-0.3%) and Australia (-0.1%) all stayed flat. Meanwhile,
Brent Crude (3.6%) continued on its uptrend on the back of supply cuts by The
Organization of the Petroleum Exporting Countries (“OPEC”). Asia ex-Japan was
up 1.6% in March 2019 (YTD: 11.2%) primarily driven by China (2.4%) and India
(9.1%). ASEAN (-0.7%) underperformed, dragged down by Malaysia (-3.6%) and
Thailand (-2.2%). Index heavyweight banks (-6.2%) lagged in Malaysia on
concerns over a potential windfall tax, while an inconclusive election followed by
a weak earnings season in Thailand dampened market sentiment.
The Kuala Lumpur Composite Index (“KLCI”) fell 3.8% month on month
(“MoM”) (or 64 points) and 2.8% in first quarter of year 2019 to close at 1,643
points at the end of March 2019. We believe the decline in the market was driven
by concerns over potential earnings risks for banks due to a possible Overnight
Policy Rate (“OPR”) rate cut and corporate earnings due to slower global growth
prospects. This has resulted in net foreign outflow doubling from RM0.8billion
(“bn”) in February 2019 to RM1.6bn in March 2019. In March 2019, KLCI
underperformed the The Financial Times Stock Exchange (“FTSE”) Bursa Emas
or the broader market, and small-cap sector. Instead, FTSE Bursa Malaysia
(“FBM”) Small Cap index was up by 1.32% MoM.
FBMKLCI was the worst performing market among MIST (Malaysia, Indonesia,
Singapore and Thailand) with a loss of 3.8%, underperforming its peers that
registered -0.9% to +0.4% MoM returns in March 2019. Materials (led by Press
Metal) outperformed on potential slowdown in aluminium supply growth. Telcos
(led by Telekom) outperformed, on potential asset sale to unlock value. Industrials
(led by IJM) outperformed on potential East Coast Rail Link revival.
Underperformers were consumer discretionary (led by Genting Group), financials,
and utilities.

5
On domestic economy, February 2019 Consumer Price Index (“CPI”) declined
0.4% year on year (“YoY”) while up 0.2% MoM. The rise in pump prices
contributed the bulk of the rise in sequential inflation while other components
remained benign. Malaysia Nikkei Purchasing Managers’ Index (“PMI”)
deteriorated to 47.6 points in February 2019 vs. 47.9 points in January 2019. As
widely expected, Bank Negara Malaysia’s (“BNM”) Monetary Policy Committee
(“MPC”) maintained the OPR at 3.25% for the seventh consecutive meeting. The
decision was well anticipated by us and all analysts surveyed by Bloomberg.
Global markets climbed in April 2019, with the Morgan Stanley Capital
International (“MSCI”) World rising 3.2% for the month and extending YTD
returns to 15.2%. A sharp bounce in the Deutscher Aktienindex (“DAX”) (+7.1%)
alongside yet another strong US performance saw the MSCI Developed Market
gain 3.4%, well ahead of the 2.0% advance registered in Emerging Market. Prior
flexibility of central banks yielded signs of growth stabilization/recovery. Global
equity investor sentiment remained upbeat, signaling an embracing of risk, with
the futures market anticipating a benign policy outlook. Asia ex-Japan added 1.8%
in April 2019, taking YTD returns to 13.3%. China (2.2% in April 2019, 20.3%
YTD) extended its rally, almost completely recuperating its year 2018 losses,
backed by the bottoming out of activity in response to prior policy easing. ASEAN
(2.1%) outperformance was driven by Singapore (6.0%), while political
uncertainty gripped Indonesia (0.6%) and Thailand (1.4%) as they await election
results. The upswing in Singapore was underpinned by a rally in banking stocks,
partly due to the first quarter of year 2019 earnings beat by DBS.
The KLCI was flat in April 2019, with KLCI underperforming Asia Pacific Ex
Japan by almost 2.0%. Foreign investors net sold RM1.5bn, adding to fourth
month of year 2019 net sell of RM2.9bn. 10Y Malaysian Government Securities
(“MGS”) rose 2 basis points (“bps”) MoM to 3.79%, while Malaysia Ringgit
(“MYR”) depreciated 1.3% MoM on fears of likely Malaysia debt exclusion from
FTSE Russell World Global Bond Index. Industrials outperformed on revival of
the downsized East Coast Rail Line (“ECRL”) and Bandar Malaysia project;
followed by consumer discretionary (Genting Bhd-led), and healthcare (Glove
Manufacturers-led). Telecommunications underperformed (mainly Telekom-led),
followed by Financials (mainly Public Bank-led). The surge in Brent Crude on
supply concerns intensified following the US decision to end waivers on Iranian
oil imports. Brent Crude climbed 9.0% intra-month, before softening 2.4% due to
rising US stockpiles, to end the month 6.4% higher.
Again, as announcement on ECRL and Bandar Malaysia stimulated the good
sentiment on industrial or construction stocks which in turn provided the FBM
Small Cap index with a high return of 7.16% MoM.

6
March 2019 CPI rose 0.2% YoY and MoM, likely driven by higher energy-related
costs, in particular transport prices which were up 2.6% MoM. Market expects
headline CPI to turn up in the coming months, particularly if crude oil prices
continue to trend higher. Nonetheless, headline inflation will likely remain
historically low, averaging 0.9% YoY in year 2019. February 2019 trade slows,
with bulk of the slowdown owed to weak non-electronics exports. Malaysia Nikkei
PMI deteriorated to a three month low of 47.2 in March 2019. March 2019 vehicle
sales grew 9.6% YoY, 37% quarter on quarter (“QoQ”) to 54,776 units. This
brings third month of year 2019 vehicle sales to 143,064 units, +5.9% YoY.
World equity markets tumbled in the month of May 2019, down 6.2% due to re-
escalation of US-China trade war tension. The consequent rise in near-term
uncertainty caused the US yield curve (10-year minus 3-month) to invert again
within the space of two months, leading the futures market to anticipate two rate
cuts by year end. The risk-off sentiment caused Emerging Markets declined by
7.5% in May 2019 to underperform Developed Markets (-6.1% in May 2019).
Among the developed markets, US declined 6.5%, Europe -6.3%, and Japan -
4.0%.
Similarly, Asia ex-Japan suffered from the global sell down (-8.9% in May 2019).
China (-13.5% in May 2019) suffered from the cessation of trade talks with the
US, as the imposition of additional tariffs and the ban of select tech firms
threatened to derail the nascent growth recovery. Korea (-9.3%) and Taiwan (-
7.8%) were collateral damages given the high weightage of the tech sector in their
benchmark indices as well as their high sensitivity to global trade. India (+0.1% in
May 2018) ended flat after recovering intra-month losses, led by financials
following the victory of the ruling Bharatiya Janata Party (“BJP”) in the general
elections, ensuring policy continuity. ASEAN equity markets fare relatively better
(-4.8% in May 2019), was dragged down by Singapore (-10.4%).
FBM KLCI went against the odds with a 0.5% monthly gain. This is mainly
underpinned by the solid gains in the telecommunication sector. The news of the
proposed mega merger between Axiata and DiGi has significantly re-rated both
heavyweights by 18% and 8%, respectively, in May 2019. Maxis also gained 3.4%
due to the positive sentiment for the telecommunication sector. Meanwhile, the
positive performance of blue chips such as Tenaga also helped to support the
KLCI index during May 2019.
Risk off mode prevail and profit taking started to kick in on the FBM Small cap
index, the index washed out all the gain in April 2019 and was down by 7.89%
month on month in May 2019.

7
Global equity markets made a strong comeback advancing 6.4% during the month
of June 2019 and extending YTD returns to 14.9%. United States Dollar (“USD”)
weakened as market participants price in three rate cuts by the Fed in 2019,
starting in July 2019. A basket of emerging market (“EM”) currencies gained 2.0%
against the USD in June 2019, with the Pakistan Rupee being the only EM
currency to depreciate (-7.5%). Asia ex-Japan equities inched up 6.1% in June
2019 (YTD: 9.4%) driven by strong recovery in China (7.3% in June 2019). Tele
conversation between President Xi and President Trump raised expectations of a
phasedown in the US-China trade tensions, coupled with some consumption
stimulus. Korea (8.5%) and Taiwan (4.2%) partially recuperated their losses from
the prior month, with the former being driven by the strong gains in the tech
hardware sector (13.6%). ASEAN registered positive return of 6.8% was driven by
Singapore (10.3%) and Thailand (9.6%). Singapore reflected firmer banking stock
prices while foreign equity inflows propelled Thailand on the back of receding
political noise.
The KLCI rose 1.3% MoM (or 21.4 points (“pts”)) but fell 1.1% in first half of
year 2019 to close at 1,672 pts at the end of June 2019. The market rebound was
driven by optimism over potential rate cuts in the US and easing US-China trade
tensions. In June 2019, KLCI underperformed the FTSE Bursa Emas or the
broader market, and small-cap sector. It also underperformed the MSCI Asia
Pacific ex-Japan Index (“MXASJ”).
FBM Small cap index increased by 3.58% with improved market sentiment.
On the economic front, Malaysia registered a 3.1% YoY increase in approved
investments in first quarter of year 2019 on the back of robust manufacturing
sector, in which 54.4% of RM53.9bn were foreign investments. Malaysia Nikkei
PMI fell to 48.8 in May 2019 versus the seven-month high of 49.4 in Apr 2019.
There were slew of corporate news in the month of June 2019. Gamuda has
received takeover offers from the government for all of its highway concessions
for RM2.36bn which the market believe is a fair price. Meanwhile, Malaysian
Aviation Commission (“MAVCOM”) has released its Second Consultation Paper,
proposing a weighted average cost of capital (“WACC”) of 10.88% while
Malaysia Airports Holdings Berhad (“MAHB”) is seeking 12.7%. Aabar
Investments has ceased to a substantial shareholder of RHB Bank after disposing
around 231 million shares to institutional investors. The Domestic Trade and
Consumer Affairs Minister has intervened to prevent a 40%-50% hike in cement
price hike, citing cement is a controlled item.

8
Global equity markets stayed flat in July 2019, up marginally by 0.2%. Asia ex-
Japan slid 2.2% in July 2019, dragging YTD returns to 7.0%. Growth headwinds
continue to persist in China (-0.9%), prompting calls for a lot more robust
domestic monetary reflation than the modest improvement seen in second quarter
of year 2019. India was one of the worst performing market (-5.5%) wiped out
bulk of its YTD gains as foreign investors sold following a disappointing budget
that was devoid of any meaningful stimulus to address slackening growth, but
instead spelled out higher taxes. Korea (-6.2%) suffered from the deepening rift
with Japan over the issue of forced wartime labour compensations that has hence
grown into a trade conflict with the implementation of export restrictions of key
products by Japan. The Bank of Korea cut rates by 25bps to cushion the adverse
impacts on the export-oriented economy. Taiwan was up 1.6% reflected the rise in
foundries, while Indonesia (1.3%) helped ASEAN (-1.2%) to relatively outperform
the region on the back of a 25 bps rate cut by Bank Indonesia.
KLCI retracted -2.23% in July 19 to 1,635 points. Petronas names Petronas
Chemical (-10.8%), Petronas Dagangan (-7.5%) and Petronas Gas (-7.4%) led the
decline, while Genting Malaysia (+19.4%) and Dialog (+5.8%) were the top
performers on positive newsflow and oil prices. On a YTD basis, KLCI declined -
3.30%, led by Hartalega, Petronas Chemical, Top Glove (macro/industry issues)
while top gainers were Genting Malaysia, Axiata, Genting Berhad, Digi
(newsflow-driven).
BNM has maintained the OPR rate at 3% following the MPC meeting and said that
the monetary policy remains accommodative. In fifth month of year 2019, the
government has reduced its fiscal deficit by 39% YoY to RM21.4bn, on track to
achieve fiscal deficit target of 3.4% of gross domestic products (“GDP”) in year
2019. Malaysia Nikkei PMI fell to 47.8 in June 2019 versus 48.8 in May 2019.
Meanwhile, the Industrial Production Index (“IPI”) increased 4% YoY in May
2019, above consensus' expectation of 3.5%. June 2019 CPI rose to a 13-month
high of 1.5% YoY (versus May 2019’s 0.2%) on the back of a low base effect due
to the removal of Goods and Services Tax (“GST”) in June last year.
On the corporate front, Genting Malaysia Berhad (“GENM”)’s outdoor theme park
is back on track after GENM entered into a settlement agreement with Disney and
Fox. RHB has received approval from BNM to commence negotiations for the
disposal of its 94.7% stake in RHB Insurance to Tokio Marine. Tenaga announced
that it is undergoing internal restructuring and plans to place its domestic power
generation and electricity retail businesses into two new wholly owned
subsidiaries ahead of the electricity reforms.

9
Global equities receded 2.6% in August 2019 but YTD returns is still
commendable, up 12.1%. The inversion of the 2year-10year US Treasury (“UST”)
yield curve and another round of escalation in the US-China trade war caused
panic selling among investors. Investors were worried over coming recession and
start to take refuge in safe havens, sending precious metals higher (Gold: 7.5%,
Silver: 13.0%, Platinum: 8.0%). Asia Ex-Japan slid 4.6% in August 2019,
curtailing YTD returns to 2.1% only. China (-4.3%) was dragged down by the
worst monthly depreciation of the Yuan (-3.8%) since January 1994, that led the
US to label the former a "currency manipulator". Hong Kong (-8.6%) was roiled
by the ongoing protests, evoking concerns of a recession and prolong economic
slowdown. Dwindling exports, worsening relations with Japan, and a weak second
quarter of year 2019 earnings season spelled further downside for Korean equities
(-5.0%). ASEAN fell 4.5% in August 2019, despite 25bps rate cuts in Thailand (-
3.0%) while Indonesia (-3.7%) and the Philippines were down 3.7% and 3.5%
respectively.
The KLCI declined 1.4% MoM to end at 1,612 points in August 2019. August
2019 recorded the highest net equity outflow of RM2.6bn for the year, bringing
eighth month of year 2019 net outflows to RM7.3bn. Exporters like rubber gloves
(Top Glove and Hartalega) and Plantations (Sime Darby Plantations)
outperformed on the back of the weaker MYR, which led to outperformance of the
Healthcare/Consumer Staples sector. Meanwhile, the Genting group of companies
underperformed due to the acquisition of cash-strapped US casino operator Empire
Resorts.
Malaysia’s GDP growth expanded 4.9% YoY in second quarter of year 2019,
marginally above market expectations of 4.7% YoY. The strong pick-up in the
economy is generally driven by continuous strong private consumption and
recovery in commodity-based sectors. From expenditure side, private consumption
and net exports contributed by 4.4% and 1.4% respectively. Meanwhile, July
2019’s vehicle sales fell 26% YoY to 50,853 units due to absence of a three-month
tax holiday period. However, overall sales of new vehicles rose 20% MoM to
8,327 in July 2019 due to longer working month.
On the corporate front, Gamuda and Ministry of Finance have extended the
conclusion date for negotiations for toll concessions sale from 30 August 2019 to
31 October 2019. Several proposals on proposed toll concessions acquisition have
been submitted to the government, which include Khazanah’s proposed takeover
of PLUS Expressways.

10
Bond
During the period under review, March 2019 witnessed a quarter-end buying
benefited local bond market. The yields remained supported until the first quarter
of the year 2019 where 10-year MGS seen navigated down further and close the
quarter below 3.80%. However, in April 2019, a knee-jerk sell-off triggered by
news of FTSE Russell putting Malaysia on its watch list for a potential
disqualification from its flagship World Government Bond Index. Local bond
market turned cautious and yields spiked higher by 15bps to 20bps across the 5-
year to 15-year tenors. Notwithstanding that, yields once again being supported
after BNM delivered a widely anticipated 25bps cut in OPR from 3.25% to 3% on
7 May 2019, the initial price actions saw yields fell 5bps-10bps lower and steeper,
but profit takers emerged to realise gains, yields subsequently retraced to end
unchanged in the belly and longer and more than 10bps lower in the very short
end. Post the initial knee jerk reaction, yields have largely been confined in a range
as the market had fully priced in the rate cut since last month, with the benchmark
10y MGS yield trading in the 3.80%-3.85% range throughout the month despite
the rally in developed bond markets.
For the period of June 2019 until August 2019, local bond yields have seen a one
way direction to the bottom. With uncertainty of trade war progress being played
out, lower and dovish policy rates by central banks globally has resulted in 10-year
UST rallied by more than 60 bps during the period. With lower rates globally, we
have seen foreign inflows into local bond market adding stocks and push the
sovereign rates even lower at the back of favourable local supply and dynamic
profile and higher market liquidity. Local bond market saw ultra-long end MGS
and Government Investment Issue (“GII”) yields down sharply by as much as 38
bps in the 30-year tenor as the 10-year benchmark MGS tested new low of below
3.20% during the month. Towards the final week of the month, both MGS and GII
were sold off slightly on the back of profit taking interests with yields rose back up
to 20 bps and the 10-year MGS yield went higher to 3.35%. However, still was a
good rally on a monthly basis for the local government bonds in August 2019. We
think that this strong momentum of rally was triggered by conducive global rates
environment and aided by positive domestic bond supply profile.
Overall, the curve has bull-flattened during the period with longer-tenor of MGS
rallying more across the tenor. All in all, the 3-, 5-, 7-, 10-, 15-, 20- and 30-year
MGS were traded at 3.15% (March 2019: 3.38%), 3.23% (3.53%), 3.28% (3.72%),
3.32% (3.77%), 3.48% (4.09%), 3.56% (4.29%) and 3.78% (4.58%) respectively.

11
Economic
On the local economic front, CPI rose 1.4% in July 2019 to 121.5 as against 119.8
in the same month of preceding year. The increase in the overall index was driven
by the index of Furnishings, Household Equipment & Routine Household
Maintenance (3.3%), Food & Non-Alcoholic Beverages (2.4%), Recreation,
Services & Culture (2.4%), Alcoholic Beverages & Tobacco
(2.3%) and Communication (2.1%). The abolishment of GST to zero-rated on 1
June 2018 led to the increase in some of the index of the main groups. Meanwhile,
the CPI for the period of January 2019 to July 2019 increased 0.3% compared with
the same period last year. Accordingly, economists expect inflation to inch up
gradually towards year-end as the favourable low base effects should fully fade by
September 2019. Forecasted year 2019 inflation to be around 1.0% to 1.4% is in
line with BNM projection of 0.7% to 1.7%. The downside risk to the forecasted
inflation number is if the targeted fuel subsidy (with price caps on RON95 lifted
concurrently) could be delayed. In the scenario where the RON95 prices remain to
be capped at RM2.08/liter through year 2019, full year inflation could instead
come in closer to 0.8% to 1.0% accordingly.
On the other economic data, latest Price Producer Index (“PPI”) for local
production in July 2019 decreased 2.2% after 1.8% contraction in June 2019.
Mining index showed the highest decline at 9.9% followed by agriculture, forestry
and fishing (-6.5%), water supply (-2.8%) and manufacturing (-0.9%). This latest
PPI number suggested that Malaysia’s headline inflation would stay low for the
second half of year 2019. Recently published trade numbers has also shown some
weakness as trade surplus widens while imports fell more sharply than exports. In
MYR term, June 2019 exports surprisingly fell by -3.1% while imports fell more
than -9.2%. Consequently, trade surplus widened to MYR10.2bn. Electrical &
Electronic (“E&E) products fell sequentially for the second straight month and
going forward, the fluidity of supply chain-related developments could be a source
of volatility in the exports’ numbers. With the re-escalation of the trade war
expected to be renewed, the risk for monetary easing has seen to increase guided
by BNM estimate that further tariff on remaining US-China trade could shave off
another 40 bps off projected growth.

12
MARKET OUTLOOK AND STRATEGY
Equity
Macro headwinds particularly US-China trade tensions and slower global
economic growth remain the key dampener for the Malaysian market. Although
Malaysia chalked better than expected second quarter of year 2019 GDP growth,
corporate earnings still disappoint as can be seen from the recent second quarter of
year 2019 results season. More companies ended up missing earnings expectations
and with slower PMI numbers, we believe that market performance will be cap by
weak earnings number going forward. Our strategy is to accumulate on
weaknesses as the market still lack of catalysts.
Bond
In the local fixed income market, while local supply and demand dynamic profile
has so far played a part this year, the relentless rally in the global bond market
where negative-yielding debts has increased (closed to USD17 trillion), further
adding attractiveness in carry-trade theme in the local bond market. Inflows have
accelerated for the past couple of months and drove the local bond yields at near
historical low. Although foreign positioning at this juncture still considered low
(below 40% of outstanding MGS) and the outlook is still towards easing bias and
low policy rates globally, the swift compression in yields locally have somehow
increase the cautiousness of domestic investors. We foresee more issuers are
attracted to issue bonds to lock in medium to longer term funding as the rates
becoming more attractive and this may gradually turning more balanced to the
domestic supply and demand dynamic. Therefore, we remain positioned to capture
any opportunities as volatility is expected to surface due to the uncertainty at the
time where tightening pricing could turn less favourable in term of risk-reward
perspective. Consequently, in a low rates environment where there is always
component of reinvestment risk attached to it, we advocate an active management
strategy where we will be deploying cash into undervalued government bonds and
selective credits where we are comfortable at with higher secondary trading and
liquidity potential for the flexibility of the portfolios.

13
PERFORMANCE REVIEW
RHB GoldenLife Today
For the period under review, the RHB Goldenlife Today Fund registered a return
of 0.67%* against its benchmark return of 0.76%*.
The underperformance of the Fund was due to performance of a particular bond
which was being downgraded in the month June 2019.
The investment strategy and policy employed during the period under review were
in line with the investment strategy and policy as stated in the prospectus.
The Fund is able to provide growth during the period under review.
RHB GoldenLife 2020
For the period under review, the RHB Goldenlife 2020 Fund registered a negative
return of 0.12%* against its benchmark return of negative -2.68%*.
The outperformance was due to stock and sector selection. The Fund exposed to
the securities which benefited from easing monetary policy and reduced exposure
on cyclical as economy is weakening.
The investment strategy and policy employed during the period under review were
in line with the investment strategy and policy as stated in the prospectus.
The Fund is not able to provide growth despite outperformed the benchmark as
overall benchmark return is negative.
RHB GoldenLife 2030
For the period under review, the RHB Goldenlife 2030 Fund registered a negative
return of 3.22%* against its benchmark return of -4.67%*.
The outperformance was due to stock and sector selection. The Fund exposed to
the securities which benefited from easing monetary policy and reduced exposure
on cyclical as economy is weakening.
The investment strategy and policy employed during the period under review were
in line with the investment strategy and policy as stated in the prospectus.
The Fund is not able to provide growth despite outperformed the benchmark as
overall benchmark return is negative.
* Source: Lipper Investment Management (“Lipper IM”), 5 September 2019

14
PERFORMANCE DATA
RHB GoldenLife Today
Annual Total Returns
28.02.2019- Financial Year Ended 28/29 February
31.08.2019
%
2019
%
2018
%
2017
%
2016
%
2015
%
RHB GoldenLife Today
- Capital Return 0.67 (0.18) (1.09) 0.45 (5.01) 5.75
- Income Return - - 4.18 3.64 10.84 -
- Total Return 0.67 (0.18) 3.04 4.11 5.29 5.75
10% FBM KLCI + 90%
Maybank’s 12-Month
Fixed Deposit Rate 0.76 1.91 3.96 3.11 1.60 2.65
Average Annual Returns
1 Year
31.08.2018-
31.08.2019
%
3 Years
31.08.2016-
31.08.2019
%
5 Years
31.08.2014-
31.08.2019
%
10 Years
31.08.2009-
31.08.2019
%
RHB GoldenLife Today (0.17) 2.19 2.97 4.46
10% FBM KLCI + 90%
Maybank’s 12-Month
Fixed Deposit Rate 1.42 2.66 2.44 3.13

15
Performance of RHB GoldenLife Today
for the period from 31 August 2009 to 31 August 2019
Cumulative Return over the period (%)
Source: Lipper IM, 5 September 2019
The abovementioned performance figures are indicative returns based on daily Net
Asset Value of a unit (as per Lipper Database) since inception.
The calculation of the above returns is based on computation methods of Lipper.
Note : Past performance is not necessarily indicative of future performance
and unit prices and investment returns may go down, as well as up.
The abovementioned performance computations have been adjusted to
reflect distribution payments and unit splits wherever applicable.

16
As At As At
31 August 28 February
Fund Size 2019 2019 2018 2017
Net Asset Value (RM million) 11.61 11.95 13.25* 32.41*
Units In Circulation (million) 19.28 19.97 22.11 53.51
Net Asset Value Per Unit (RM) 0.6021 0.5981 0.5992* 0.6058*
Historical Data
Financial Year Ended
01.03.2019- 28 February
31.08.2019 2019 2018 2017
Unit Prices
NAV - Highest (RM) 0.6095 0.6042 0.6256* 0.6251*
- Lowest (RM) 0.5894 0.5867 0.5984* 0.5990*
Distribution and Unit Split
Gross Distribution Per Unit (sen) - - 2.5000 2.2000
Net Distribution Per Unit (sen) - - 2.5000 2.2000
Distribution Date - - 21.02.2018 20.02.2017
NAV before distribution (cum) - - 0.6229 0.6254
NAV after distribution (ex) - - 0.5984 0.6034
Unit Split - - - -
Others
Management Expense Ratio
(MER) (%) #
0.71 1.43 1.44 1.42
Portfolio Turnover Ratio
(PTR) (times) ##
- 0.21 0.93 0.20
* The figures quoted are ex-distribution
# The MER for the financial period was lower compared to previous financial
period due to lower expenses incurred for the financial period under review
(refer to Note 11).
## The PTR for the financial period was lower compared to previous financial
period due to lesser investment activities for the financial period under
review (refer to Note 12).

17
RHB GoldenLife 2020
Annual Total Returns
28.02.2019- Financial Year Ended 28/29 February
31.08.2019
%
2019
%
2018
%
2017
%
2016
%
2015
%
RHB GoldenLife 2020
- Capital Return (0.12) (8.88) (10.79) (11.50) (12.41) 4.17
- Income Return - - 4.57 9.65 16.03 -
- Total Return (0.12) (8.88) (6.71) (2.96) 1.63 4.17
55% FBM KLCI + 45%
Maybank’s 12-Month
Fixed Deposit Rate (2.68) (3.70) 7.08 2.69 (4.65) 0.62
Average Annual Returns
1 Year
31.08.2018-
31.08.2019
%
3 Years
31.08.2016-
31.08.2019
%
5 Years
31.08.2014-
31.08.2019
%
10 Years
31.08.2009-
31.08.2019
%
RHB GoldenLife 2020 (3.13) (4.14) (3.65) 2.99
55% FBM KLCI + 45%
Maybank’s 12-Month
Fixed Deposit Rate (5.74) 0.49 (0.56) 3.18

18
Performance of RHB GoldenLife 2020
for the period from 31 August 2009 to 31 August 2019
Cumulative Return over the period (%)
Source: Lipper IM, 5 September 2019
The abovementioned performance figures are indicative returns based on daily Net
Asset Value of a unit (as per Lipper Database) since inception.
The calculation of the above returns is based on computation methods of Lipper.
Note : Past performance is not necessarily indicative of future performance
and unit prices and investment returns may go down, as well as up.
The abovementioned performance computations have been adjusted to
reflect distribution payments and unit splits wherever applicable.

19
As At As At
31 August 28 February
Fund Size 2019 2019 2018 2017
Net Asset Value (RM million) 4.50 4.60 5.82* 7.62*
Units In Circulation (million) 8.93 9.11 10.52 12.28
Net Asset Value Per Unit (RM) 0.5041 0.5047 0.5539* 0.6209*
Historical Data
Financial Year Ended
01.03.2019- 28 February
31.08.2019 2019 2018 2017
Unit Prices
NAV - Highest (RM) 0.5075 0.5508 0.6492* 0.7184*
- Lowest (RM) 0.4941 0.4957 0.5539* 0.6209*
Distribution and Unit Split
Gross Distribution Per Unit (sen) - - 2.5500 6.0000
Net Distribution Per Unit (sen) - - 2.5500 6.0000
Distribution Date - - 21.02.2018 20.02.2017
NAV before distribution (cum) - - 0.5802 0.6818
NAV after distribution (ex) - - 0.5580 0.6218
Unit Split - - - -
Others
Management Expense Ratio
(MER) (%) #
0.92 1.88 1.82 1.76
Portfolio Turnover Ratio
(PTR) (times) ##
0.51 0.64 0.41 1.08
* The figures quoted are ex-distribution
# The MER for the financial period was lower compared to previous financial
period due to lower expenses incurred for the financial period under review
(refer to Note 11).
## The PTR for the financial period was higher compared to previous financial
period due to more investments activities for the financial period under
review (refer to Note 12).

20
RHB GoldenLife 2030
Annual Total Returns
28.02.2019- Financial Year Ended 28/29 February
31.08.2019
%
2019
%
2018
%
2017
%
2016
%
2015
%
RHB GoldenLife 2030
- Capital Return (3.22) (13.69) (8.61) (7.55) (15.69) 3.25
- Income Return - - 3.77 4.56 18.73 -
- Total Return (3.22) (13.69) (5.16) (3.33) 0.10 3.25
85% FBM KLCI + 15%
Maybank’s 12-Month
Fixed Deposit Rate (4.67) (6.68) 8.81 2.46 (7.79) (0.37)
Average Annual Returns
1 Year
31.08.2018-
31.08.2019
%
3 Years
31.08.2016-
31.08.2019
%
5 Years
31.08.2014-
31.08.2019
%
10 Years
31.08.2009-
31.08.2019
%
RHB GoldenLife 2030 (11.25) (6.32) (5.89) 3.54
85% FBM KLCI + 15%
Maybank’s 12-Month
Fixed Deposit Rate (9.65) (0.76) (2.17) 3.20

21
Performance of RHB GoldenLife 2030
for the period from 31 August 2009 to 31 August 2019
Cumulative Return over the period (%)
Source: Lipper IM, 5 September 2019
The abovementioned performance figures are indicative returns based on daily Net
Asset Value of a unit (as per Lipper Database) since inception.
The calculation of the above returns is based on computation methods of Lipper.
Note : Past performance is not necessarily indicative of future performance
and unit prices and investment returns may go down, as well as up.
The abovementioned performance computations have been adjusted to
reflect distribution payments and unit splits wherever applicable.

22
As At As At
31 August 28 February
Fund Size 2019 2019 2018 2017
Net Asset Value (RM million) 3.89 4.10 5.05* 17.60*
Units In Circulation (million) 6.67 6.81 7.23 23.03
Net Asset Value Per Unit (RM) 0.5835 0.6029 0.6985* 0.7643*
Historical Data
Financial Year Ended
01.03.2019- 28 February
31.08.2019 2019 2018 2017
Unit Prices
NAV - Highest (RM) 0.6041 0.6956 0.8265* 0.8625*
- Lowest (RM) 0.5790 0.5895 0.6985* 0.7528*
Distribution and Unit Split
Gross Distribution Per Unit (sen) - - 2.6500 3.5000
Net Distribution Per Unit (sen) - - 2.6500 3.5000
Distribution Date - - 21.02.2018 20.02.2017
NAV before distribution (cum) - - 0.7262 0.8020
NAV after distribution (ex) - - 0.7028 0.7670
Unit Split - - - -
Others
Management Expense Ratio
(MER) (%) #
0.95 1.93 1.74 1.71
Portfolio Turnover Ratio
(PTR) (times) ##
0.92 0.93 1.04 0.43
* The figures quoted are ex-distribution
# The MER for the financial period was lower compared to previous financial
period due to lower expenses incurred for the financial period under review
(refer to Note 11).
## The PTR for the financial period was higher compared to previous financial
period due to more investments activities for the financial period under
review (refer to Note 12).

23
DISTRIBUTION
For the financial period under review, no distribution has been proposed by the
Funds.
PORTFOLIO STRUCTURE
RHB GoldenLife Today
The asset allocations of the Fund as at reporting date were as follows:
As at
31 August As at 28 February
2019 2019 2018 2017
Sectors % % % %
Equities
Consumer Products 1.02 1.52 2.71 4.42
Energy 1.17 1.05 - -
Finance 6.71 7.50 4.47 0.45
Healthcare 1.43 1.33 - -
Industrial Products - - 1.04 8.01
Infrastructure Project Companies - - 2.21 -
Plantation - - - 2.03
Telecommunications & Media 1.23 0.99 - -
Trading/Services - - 2.07 2.15
Utilities 2.10 1.97 - -
13.66 14.36 12.50 17.06
Unquoted Fixed Income Securities 79.50 77.08 73.90 70.16
Liquid assets and other net current assets 6.84 8.56 13.60 12.78
100.00 100.00 100.00 100.00
The asset allocation was reflective of the Manager’s stance to risk manage its
portfolio in an environment of volatile markets.
24
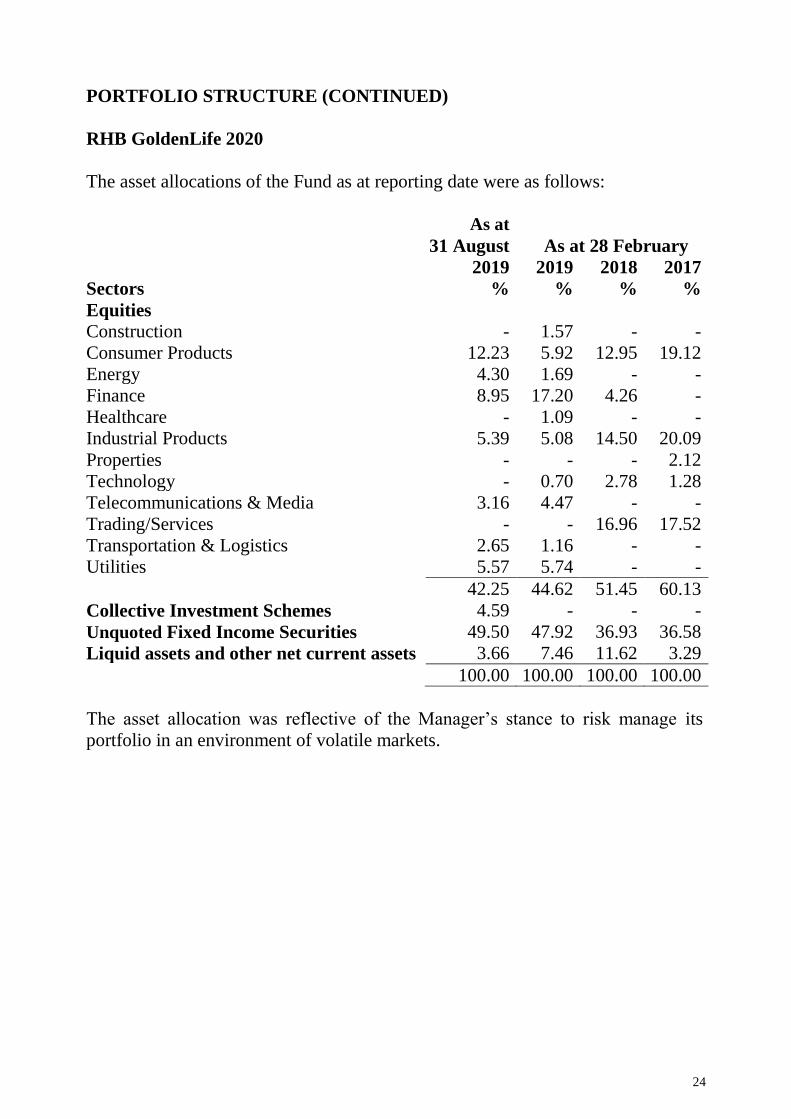
PORTFOLIO STRUCTURE (CONTINUED)
RHB GoldenLife 2020
The asset allocations of the Fund as at reporting date were as follows:
As at
31 August As at 28 February
2019 2019 2018 2017
Sectors % % % %
Equities
Construction - 1.57 - -
Consumer Products 12.23 5.92 12.95 19.12
Energy 4.30 1.69 - -
Finance 8.95 17.20 4.26 -
Healthcare - 1.09 - -
Industrial Products 5.39 5.08 14.50 20.09
Properties - - - 2.12
Technology - 0.70 2.78 1.28
Telecommunications & Media 3.16 4.47 - -
Trading/Services - - 16.96 17.52
Transportation & Logistics 2.65 1.16 - -
Utilities 5.57 5.74 - -
42.25 44.62 51.45 60.13
Collective Investment Schemes 4.59 - - -
Unquoted Fixed Income Securities 49.50 47.92 36.93 36.58
Liquid assets and other net current assets 3.66 7.46 11.62 3.29
100.00 100.00 100.00 100.00
The asset allocation was reflective of the Manager’s stance to risk manage its
portfolio in an environment of volatile markets.
25
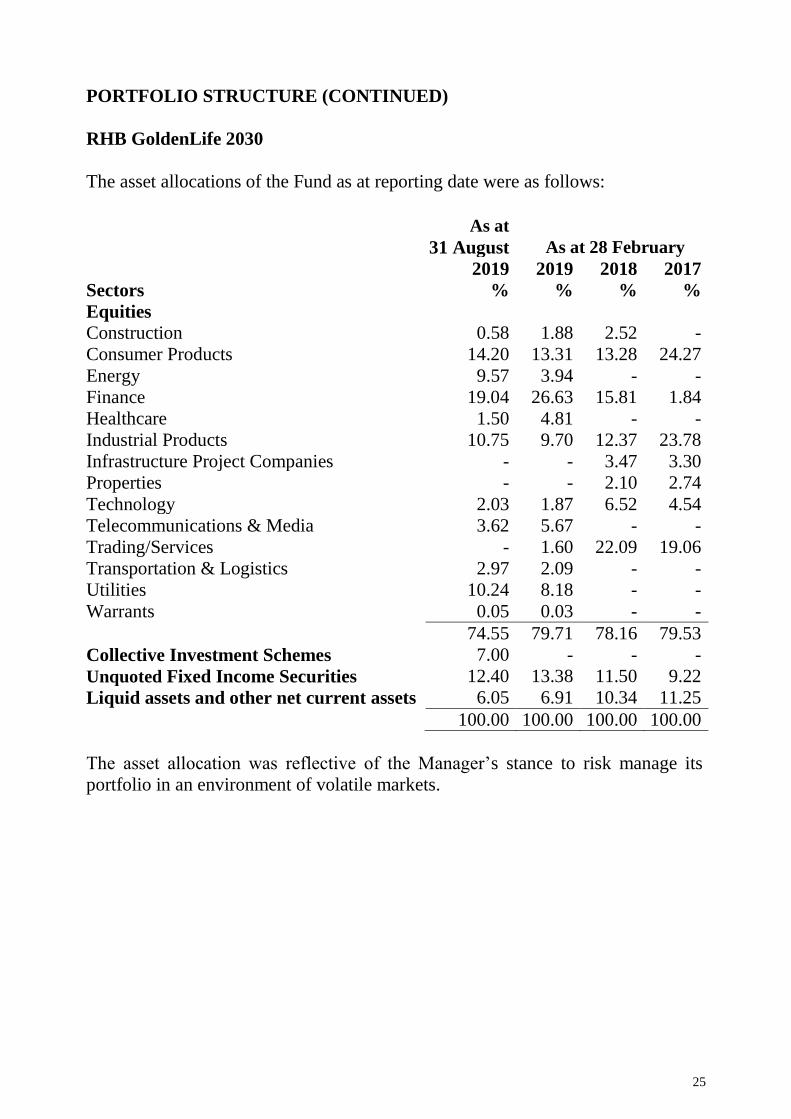
PORTFOLIO STRUCTURE (CONTINUED)
RHB GoldenLife 2030
The asset allocations of the Fund as at reporting date were as follows:
As at
31 August As at 28 February
2019 2019 2018 2017
Sectors % % % %
Equities
Construction 0.58 1.88 2.52 -
Consumer Products 14.20 13.31 13.28 24.27
Energy 9.57 3.94 - -
Finance 19.04 26.63 15.81 1.84
Healthcare 1.50 4.81 - -
Industrial Products 10.75 9.70 12.37 23.78
Infrastructure Project Companies - - 3.47 3.30
Properties - - 2.10 2.74
Technology 2.03 1.87 6.52 4.54
Telecommunications & Media 3.62 5.67 - -
Trading/Services - 1.60 22.09 19.06
Transportation & Logistics 2.97 2.09 - -
Utilities 10.24 8.18 - -
Warrants 0.05 0.03 - -
74.55 79.71 78.16 79.53
Collective Investment Schemes 7.00 - - -
Unquoted Fixed Income Securities 12.40 13.38 11.50 9.22
Liquid assets and other net current assets 6.05 6.91 10.34 11.25
100.00 100.00 100.00 100.00
The asset allocation was reflective of the Manager’s stance to risk manage its
portfolio in an environment of volatile markets.

26
BREAKDOWN OF UNIT HOLDINGS BY SIZE
RHB GoldenLife Today
Account Holders No. Of Units Held*
Size of Holdings No. % (‘000) %
5,000 and below 62 27.31 124 0.64
5,001 to 10,000 25 11.01 175 0.91
10,001 to 50,000 104 45.82 2,264 11.75
50,001 to 500,000 32 14.10 3,989 20.69
500,001 and above 4 1.76 12,725 66.01
Total 227 100.00 19,277 100.00
RHB GoldenLife 2020
Account Holders No. Of Units Held*
Size of Holdings No. % (‘000) %
5,000 and below 50 23.26 135 1.51
5,001 to 10,000 34 15.81 267 2.99
10,001 to 50,000 105 48.84 2,489 27.88
50,001 to 500,000 25 11.63 3,219 36.05
500,001 and above 1 0.46 2,819 31.57
Total 215 100.00 8,929 100.00
RHB GoldenLife 2030
Account Holders No. Of Units Held*
Size of Holdings No. % (‘000) %
5,000 and below 90 32.03 225 3.38
5,001 to 10,000 69 24.55 472 7.08
10,001 to 50,000 105 37.37 2,311 34.69
50,001 to 500,000 14 4.98 1,390 20.86
500,001 and above 3 1.07 2,265 33.99
Total 281 100.00 6,663 100.00
* Excluding Manager’s stock

27
SOFT COMMISSION
The Fund Manager may only receive soft commission in the form of research and
advisory services that assist in the decision-making process relating to the Fund’s
investments.
During the financial period under review, the soft commission received from the
brokers had been retained by the Manager as the goods and services provided are
of demonstrable benefit to the unitholders.

28
RHB GOLDENLIFE FUNDS
UNAUDITED STATEMENTS OF FINANCIAL POSITION
AS AT 31 AUGUST 2019
31.08.2019
RHB RHB RHB
GoldenLife GoldenLife GoldenLife
Note Today 2020 2030
RM RM RM
ASSETS
Investments 5 10,816,806 4,338,770 3,655,786
Deposits with licensed
financial institutions 6 772,630 132,032 204,282
Bank balances 6 50,060 51,736 51,902
Dividend receivable 4,440 6,621 9,427
Tax recoverable - 188 257 ─────────── ─────────── ───────────
TOTAL ASSETS 11,643,936 4,529,347 3,921,654 ─────────── ─────────── ───────────
LIABILITIES Amount due to Manager 7,827 7,029 12,837
Accrued management fee 12,310 5,698 4,960
Amount due to Trustee 591 228 198
Other payables and accruals 12,609 12,567 12,600 ─────────── ─────────── ─────────── TOTAL LIABILITIES 33,337 25,522 30,595 ─────────── ─────────── ─────────── NET ASSET VALUE 11,610,599 4,503,825 3,891,059 ═══════════ ═══════════ ═══════════
EQUITY
Unitholders’ capital 10,271,679 5,118,253 5,053,647
Retained earnings/(accumulated losses) 1,338,920 (614,428) (1,162,588) ─────────── ─────────── ─────────── 11,610,599 4,503,825 3,891,059 ═══════════ ═══════════ ═══════════
UNITS IN CIRCULATION
(UNITS) 7 19,282,566 8,933,605 6,669,109 ═══════════ ═══════════ ═══════════
NET ASSET VALUE PER UNIT
(RM) 0.6021 0.5041 0.5835 ═══════════ ═══════════ ═══════════
The accompanying notes are an integral part of the financial statements.

29
RHB GOLDENLIFE FUNDS
UNAUDITED STATEMENTS OF FINANCIAL POSITION
AS AT 31 AUGUST 2019 (CONTINUED)
28.02.2019
RHB RHB RHB
GoldenLife GoldenLife GoldenLife
Note Today 2020 2030
RM RM RM
ASSETS
Investments 5 10,923,402 4,254,068 3,820,050
Deposits with licensed
financial institutions 6 1,044,168 410,208 389,511
Bank balances 6 3,783 13,858 2,588
Dividend receivable 144 384 1,008
Tax recoverable - 929 - ─────────── ─────────── ───────────
TOTAL ASSETS 11,971,497 4,679,447 4,213,157 ─────────── ─────────── ───────────
LIABILITIES Amount due to stockbrokers - 57,019 91,231
Amount due to Manager - 6,078 -
Accrued management fee 11,433 5,595 4,727
Amount due to Trustee 549 224 189
Other payables and accruals 13,566 13,496 13,515 ─────────── ─────────── ─────────── TOTAL LIABILITIES 25,548 82,412 109,662 ─────────── ─────────── ─────────── NET ASSET VALUE 11,945,949 4,597,035 4,103,495 ═══════════ ═══════════ ═══════════
EQUITY
Unitholders’ capital 10,684,772 5,205,462 5,134,980
Retained earnings/(accumulated losses) 1,261,177 (608,427) (1,031,485) ─────────── ─────────── ─────────── 11,945,949 4,597,035 4,103,495 ═══════════ ═══════════ ═══════════
UNITS IN CIRCULATION (UNITS) 7 19,971,566 9,107,605 6,806,109 ═══════════ ═══════════ ═══════════
NET ASSET VALUE PER UNIT (RM) 0.5981 0.5047 0.6029 ═══════════ ═══════════ ═══════════
The accompanying notes are an integral part of the financial statements.
30
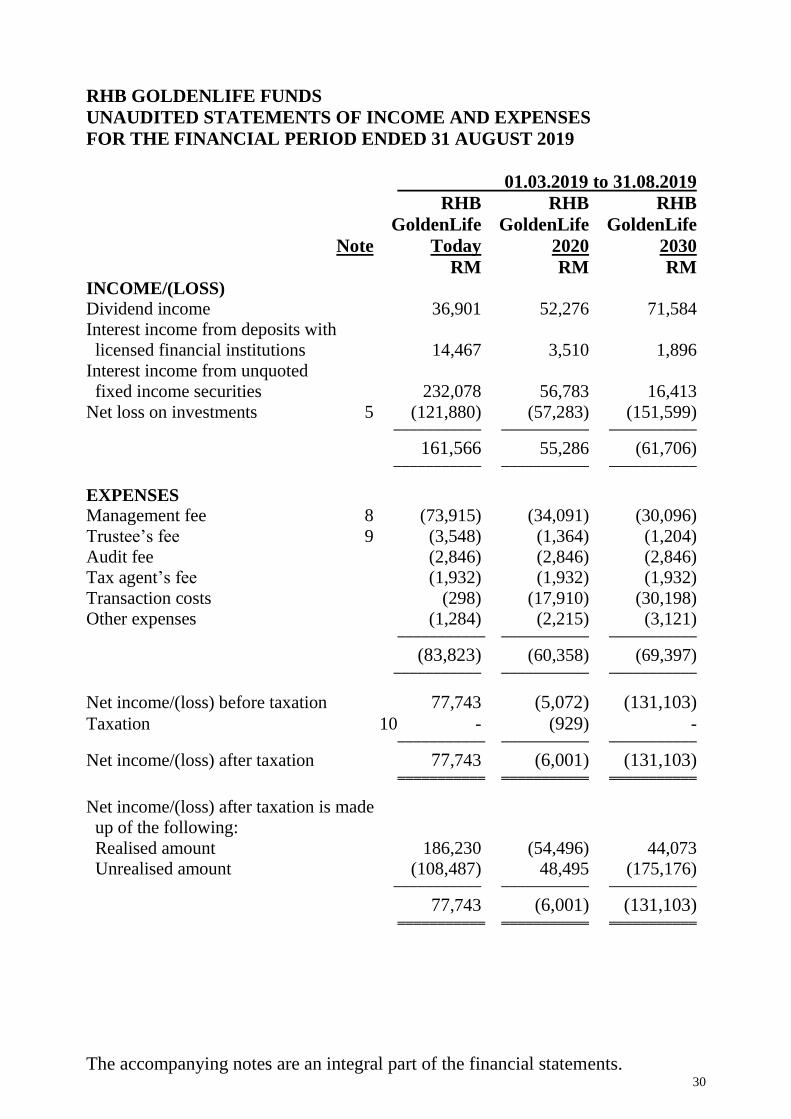
RHB GOLDENLIFE FUNDS
UNAUDITED STATEMENTS OF INCOME AND EXPENSES
FOR THE FINANCIAL PERIOD ENDED 31 AUGUST 2019
01.03.2019 to 31.08.2019
RHB RHB RHB
GoldenLife GoldenLife GoldenLife
Note Today 2020 2030
RM RM RM
INCOME/(LOSS)
Dividend income 36,901 52,276 71,584
Interest income from deposits with
licensed financial institutions 14,467 3,510 1,896
Interest income from unquoted
fixed income securities 232,078 56,783 16,413
Net loss on investments 5 (121,880) (57,283) (151,599) ─────────── ─────────── ───────────
161,566 55,286 (61,706) ─────────── ─────────── ───────────
EXPENSES Management fee 8 (73,915) (34,091) (30,096)
Trustee’s fee 9 (3,548) (1,364) (1,204)
Audit fee (2,846) (2,846) (2,846)
Tax agent’s fee (1,932) (1,932) (1,932)
Transaction costs (298) (17,910) (30,198)
Other expenses (1,284) (2,215) (3,121) ─────────── ─────────── ───────────
(83,823) (60,358) (69,397) ─────────── ─────────── ───────────
Net income/(loss) before taxation 77,743 (5,072) (131,103)
Taxation 10 - (929) - ─────────── ─────────── ───────────
Net income/(loss) after taxation 77,743 (6,001) (131,103) ═══════════ ═══════════ ═══════════
Net income/(loss) after taxation is made
up of the following:
Realised amount 186,230 (54,496) 44,073
Unrealised amount (108,487) 48,495 (175,176) ─────────── ─────────── ───────────
77,743 (6,001) (131,103) ═══════════ ═══════════ ═══════════
The accompanying notes are an integral part of the financial statements.

31
RHB GOLDENLIFE FUNDS
UNAUDITED STATEMENTS OF INCOME AND EXPENSES
FOR THE FINANCIAL PERIOD ENDED 31 AUGUST 2019 (CONTINUED)
01.03.2018 to 31.08.2018
RHB RHB RHB
GoldenLife GoldenLife GoldenLife
Note Today 2020 2030
RM RM RM
INCOME/(LOSS)
Dividend income 33,672 44,054 74,374
Interest income from deposits with
licensed financial institutions 26,676 11,154 9,783
Interest income from unquoted
fixed income securities 247,592 57,807 16,220
Net loss on investments 5 (129,351) (410,688) (328,511) ─────────── ─────────── ───────────
178,589 (297,673) (228,134) ─────────── ─────────── ───────────
EXPENSES Management fee 8 (81,802) (39,952) (36,664)
Trustee’s fee 9 (3,927) (1,598) (1,467)
Audit fee (2,823) (2,823) (2,823)
Tax agent’s fee (1,915) (1,915) (1,915)
Transaction costs (6,503) (12,485) (22,652)
Other expenses (4,808) (6,380) (7,284) ─────────── ─────────── ───────────
(101,778) (65,153) (72,805) ─────────── ─────────── ───────────
Net income/(loss) before taxation 76,811 (362,826) (300,939)
Taxation 10 - - - ─────────── ─────────── ───────────
Net income/(loss) after taxation 76,811 (362,826) (300,939) ═══════════ ═══════════ ═══════════
Net income/(loss) after taxation is
made up of the following:
Realised amount 92,168 (1,082,425) (819,187)
Unrealised amount (15,357) 719,599 518,248 ─────────── ─────────── ───────────
76,811 (362,826) (300,939) ═══════════ ═══════════ ═══════════
The accompanying notes are an integral part of the financial statements.

32
RHB GOLDENLIFE FUNDS
UNAUDITED STATEMENTS OF CHANGES IN NET ASSET VALUE
FOR THE FINANCIAL PERIOD ENDED 31 AUGUST 2019
RHB GoldenLife Today
Unitholders’ Retained Total net
capital earnings asset value
RM RM RM
Balance as at 1 March 2018 11,954,792 1,292,611 13,247,403
Movement in net asset value:
Net income after taxation - 76,811 76,811
Creation of units arising
from distribution 540,457 - 540,457
Creation of units arising
from applications 75,575 - 75,575
Cancellation of units (1,162,950) - (1,162,950) ───────── ───────── ─────────
Balance as at 31 August 2018 11,407,874 1,369,422 12,777,296 ═════════ ═════════ ═════════
Balance as at 1 March 2019 10,684,772 1,261,177 11,945,949
Movement in net asset value:
Net income after taxation - 77,743 77,743
Creation of units arising
from applications 94,516 - 94,516
Cancellation of units (507,609) - (507,609) ───────── ───────── ─────────
Balance as at 31 August 2019 10,271,679 1,338,920 11,610,599 ═════════ ═════════ ═════════
The accompanying notes are an integral part of the financial statements.

33
RHB GOLDENLIFE FUNDS
UNAUDITED STATEMENTS OF CHANGES IN NET ASSET VALUE
FOR THE FINANCIAL PERIOD ENDED 31 AUGUST 2019 (CONTINUED)
RHB GoldenLife 2020
Unitholders’ Accumulated Total net
capital losses asset value
RM RM RM
Balance as at 1 March 2018 5,919,338 (94,804) 5,824,534
Movement in net asset value:
Net loss after taxation - (362,826) (362,826)
Creation of units arising
from distribution 274,582 - 274,582
Creation of units arising
from applications 22,130 - 22,130
Cancellation of units (655,213) - (655,213) ───────── ───────── ─────────
Balance as at 31 August 2018 5,560,837 (457,630) 5,103,207 ═════════ ═════════ ═════════
Balance as at 1 March 2019 5,205,462 (608,427) 4,597,035
Movement in net asset value:
Net loss after taxation - (6,001) (6,001)
Creation of units arising
from applications 6,024 - 6,024
Cancellation of units (93,233) - (93,233) ───────── ───────── ─────────
Balance as at 31 August 2019 5,118,253 (614,428) 4,503,825 ═════════ ═════════ ═════════
The accompanying notes are an integral part of the financial statements.

34
RHB GOLDENLIFE FUNDS
UNAUDITED STATEMENTS OF CHANGES IN NET ASSET VALUE
FOR THE FINANCIAL PERIOD ENDED 31 AUGUST 2019 (CONTINUED)
RHB GoldenLife 2030
Unitholders’ Accumulated Total net
capital losses asset value
RM RM RM
Balance as at 1 March 2018 5,389,559 (338,352) 5,051,207
Movement in net asset value:
Net loss after taxation - (300,939) (300,939)
Creation of units arising
from distribution 174,711 - 174,711
Creation of units arising
from applications 138,976 - 138,976
Cancellation of units (231,683) - (231,683) ───────── ───────── ─────────
Balance as at 31 August 2018 5,471,563 (639,291) 4,832,272 ═════════ ═════════ ═════════
Balance as at 1 March 2019 5,134,980 (1,031,485) 4,103,495
Movement in net asset value:
Net loss after taxation - (131,103) (131,103)
Creation of units arising
from applications 14,794 - 14,794
Cancellation of units (96,127) - (96,127) ───────── ───────── ─────────
Balance as at 31 August 2019 5,053,647 (1,162,588) 3,891,059 ═════════ ═════════ ═════════
The accompanying notes are an integral part of the financial statements.

35
RHB GOLDENLIFE FUNDS
UNAUDITED STATEMENTS OF CASH FLOWS
FOR THE FINANCIAL PERIOD ENDED 31 AUGUST 2019
01.03.2019 to 31.08.2019
RHB RHB RHB
GoldenLife GoldenLife GoldenLife
Today 2020 2030
RM RM RM
CASH FLOWS FROM
OPERATING ACTIVITIES
Proceeds from sale of investments 22,535 2,154,531 3,686,742
Purchase of investments (22,553) (2,366,119) (3,788,477)
Dividends received 27,927 43,044 59,478
Interest received from deposits
with licensed financial institutions 14,467 3,510 1,896
Interest received from unquoted
fixed income securities 221,192 54,452 13,071
Management fee paid (73,038) (33,988) (29,863)
Trustee’s fee paid (3,506) (1,360) (1,195)
Payment for other expenses (7,019) (7,922) (8,814)
Tax paid - (188) (257) ──────── ──────── ──────── Net cash generated from/(used in)
operating activities 180,005 (154,040) (67,419) ──────── ──────── ──────── CASH FLOWS FROM
FINANCING ACTIVITIES
Cash proceeds from units created 94,516 6,024 14,794
Cash paid for units cancelled (499,782) (92,282) (83,290) ──────── ──────── ──────── Net cash used in financing activities (405,266) (86,258) (68,496) ──────── ──────── ────────
Net decrease in cash and
cash equivalents (225,261) (240,298) (135,915)
Cash and cash equivalents at the
beginning of the financial period 1,047,951 424,066 392,099 ──────── ──────── ──────── Cash and cash equivalents at the
end of the financial period 822,690 183,768 256,184 ════════ ════════ ════════
The accompanying notes are an integral part of the financial statements.

36
RHB GOLDENLIFE FUNDS
UNAUDITED STATEMENTS OF CASH FLOWS
FOR THE FINANCIAL PERIOD ENDED 31 AUGUST 2019 (CONTINUED)
01.03.2018 to 31.08.2018
RHB RHB RHB
GoldenLife GoldenLife GoldenLife
Today 2020 2030
RM RM RM
CASH FLOWS FROM
OPERATING ACTIVITIES
Proceeds from sale of investments 2,017,904 2,538,384 3,154,121
Purchase of investments (2,270,808) (1,962,593) (3,206,141)
Dividends received 33,133 38,694 69,166
Interest received from deposits
with licensed financial institutions 26,676 11,154 9,783
Interest received from unquoted
fixed income securities 245,428 53,941 16,035
Management fee paid (82,209) (41,005) (36,875)
Trustee’s fee paid (3,947) (1,641) (1,475)
Payment for other expenses (11,316) (10,964) (11,487) ──────── ──────── ──────── Net cash (used in)/generated from
operating activities (45,139) 625,970 (6,873) ──────── ──────── ──────── CASH FLOWS FROM
FINANCING ACTIVITIES
Cash proceeds from units created 75,575 23,890 139,681
Cash paid for units cancelled (1,160,540) (851,108) (231,683)
Payment for income distribution (14,844) (359) (17,043) ──────── ──────── ──────── Net cash used in financing activities (1,099,809) (827,577) (109,045) ──────── ──────── ────────
Net decrease in cash and
cash equivalents (1,144,948) (201,607) (115,918)
Cash and cash equivalents at the
beginning of the financial period 2,279,187 839,362 733,910 ──────── ──────── ──────── Cash and cash equivalents at the
end of the financial period 1,134,239 637,755 617,992 ════════ ════════ ════════
The accompanying notes are an integral part of the financial statements.
37
RHB GOLDENLIFE FUNDS
NOTES TO UNAUDITED THE FINANCIAL STATEMENTS
FOR THE FINANCIAL PERIOD ENDED 31 AUGUST 2019
1 THE FUND, THE MANAGER AND THEIR PRINCIPAL ACTIVITIES
The RHB GoldenLife Funds (hereinafter referred to as “the Fund”) which
comprises four separate and distinct sub-funds, namely RHB GoldenLife Today,
RHB GoldenLife 2010, RHB GoldenLife 2020 and RHB GoldenLife 2030 (“sub-
fund”) pursuant to the execution of a Master deed (umbrella funds) dated 12 June
2008 as amended via its first supplemental master deed (umbrella funds) dated 25
August 2008, second supplemental master deed (umbrella funds) dated 19 June
2009, third supplemental master deed (umbrella funds) dated 30 April 2013, fourth
supplemental master deed (umbrella funds) dated 24 September 2013, fifth
supplemental master deed (umbrella funds) dated 2 March 2015 and sixth
supplemental master deed (umbrella funds) dated 20 May 2015 (collectively
referred to as “the Deeds”) between RHB Asset Management Sdn Bhd (“the
Manager”) and HSBC (Malaysia) Trustee Berhad (“the Trustee”).
The Fund was launched on 21 February 2005 and will continue its operations until
terminated according to the conditions in the Deeds. As at 28 February 2010, RHB
GoldenLife 2010 (“GL 2010”) matured in accordance with the Deeds. On the
maturity date (28 February 2010), GL 2010 automatically terminated and merged
into RHB GoldenLife Today. RHB GoldenLife 2020 (“GL 2020”) will mature on
29 February 2020 in accordance with the Deeds. On the maturity date (29 February
2020), GL 2020 will be automatically terminated and merged into RHB GoldenLife
Today.
The principal activity of the Fund is to invest in ‘Permitted Investments’ as defined
in the Master Deed, which comprises securities of companies listed on the Bursa
Malaysia Securities Berhad (“Bursa Malaysia”), unlisted securities in Malaysia, all
types of collective investment schemes, derivative instruments and any other form
of investments as may be approved by the relevant authorities from time to time.
All investments will be subject to the Securities Commission Malaysia’s (“SC”)
Guidelines on Unit Trust Funds, SC requirements, the Deeds, except where
exemptions or variations have been approved by the SC, internal policies and
procedures and objective of the Fund.

38
1 THE FUND, THE MANAGER AND THEIR PRINCIPAL ACTIVITIES
(CONTINUED)
The objectives of the Fund are:
(a) RHB GoldenLife Today - to provide retired investors or investors who are
retiring in the very near future a steady income stream in planning for their
financial needs upon retirement.
(b) RHB GoldenLife 2020 (“GL 2020”) - to provide investors planning to retire in
the year 2020, a wealth accumulation vehicle for meeting their financial needs
upon retirement.
(c) RHB GoldenLife 2030 (“GL 2030”) - to provide investors planning to retire in
the year 2030, a wealth accumulation vehicle for meeting their financial needs
upon retirement.
The Manager, a company incorporated in Malaysia, is a wholly-owned subsidiary
of RHB Investment Bank Berhad, effective 6 January 2003. Its principal activities
include rendering of investment management services, management of unit trust
funds and private retirement schemes and provision of investment advisory
services.
These financial statements were authorised for issue by the Manager on 22 October
2019.
2 SUMMARY OF SIGNIFICANT ACCOUNTING POLICIES
2.1 Basis of preparation of the financial statements
The financial statements have been prepared under the historical cost convention, as
modified by financial assets and financial liabilities (including derivative
instruments) at fair value through profit or loss, except as disclosed in this summary
of significant accounting policies, and in accordance with Malaysian Financial
Reporting Standards (“MFRS”) and International Financial Reporting Standards
(“IFRS”).
The preparation of financial statements in conformity with MFRS and IFRS
requires the use of certain critical accounting estimates and assumptions that affect
the reported amounts of assets and liabilities and disclosure of contingent assets and
liabilities at the date of the financial statements, and the reported amounts of
revenues and expenses during the financial period. It also requires the Manager to
exercise its judgement in the process of applying the Fund’s accounting policies.
Although these estimates and judgement are based on the Manager’s best
knowledge of current events and actions, actual results may differ.

39
2 SUMMARY OF SIGNIFICANT ACCOUNTING POLICIES
(CONTINUED)
2.1 Basis of preparation of the financial statements (continued)
GL 2020 will be terminated on 29 February 2020 according to the conditions
provided in the Deeds. As such, the going concern assumption can no longer be
used for the preparation of financial statements of GL 2020. The financial
statements of GL 2020 have therefore been prepared using a liquidation basis.
(a) The Fund has applied the following standard and interpretation to the
existing standard for the first time for the financial period beginning on 1
March 2019:
IC Interpretation 23 ‘Uncertainty over Income Tax Treatments’
(effective 1 January 2019) provides guidance on how to recognise and
measure deferred and current income tax assets and liabilities where
there is uncertainty over a tax treatment.
If an entity concludes that it is not probable that the tax treatment will be
accepted by the tax authority, the effect of the tax uncertainty should be
included in the period when such determination is made. An entity shall
measure the effect of uncertainty using the method which best predicts
the resolution of the uncertainty.
IC Interpretation 23 will be applied retrospectively.
Annual Improvements to MFRSs 2015 – 2017 Cycle: Amendments to
MFRS 112 ‘Income Taxes’ (effective from 1 January 2019) clarify that
where income tax consequences of dividends on financial instruments
classified as equity is recognised (either in profit or loss, other
comprehensive income or equity) depends on where the past transactions
that generated distributable profits were recognised. Accordingly, the tax
consequences are recognised in profit or loss when an entity determines
payments on such instruments are distribution of profits (that is,
dividends). Tax on dividend should not be recognised in equity merely
on the basis that it is related to a distribution to owners.
The adoption of the amendments to published standard and interpretation to
existing standard do not give rise to any material impact on the financial
statements of the Fund.

40
2 SUMMARY OF SIGNIFICANT ACCOUNTING POLICIES
(CONTINUED)
2.2 Financial assets
Classification
The Fund classifies its financial assets in the following measurement categories:
those to be measured subsequently at fair value through profit or loss, and
those to be measured at amortised cost
The Fund classifies its investments based on both the Fund’s business model for
managing those financial assets and the contractual cash flow characteristics of the
financial assets. The portfolio of financial assets is managed and performance is
evaluated on a fair value basis. The Fund is primarily focused on fair value
information and uses that information to assess the assets’ performance and to
make decisions. The Fund has not taken the option to irrevocably designate any
equity securities as fair value through other comprehensive income. The
contractual cash flows of the Fund’s debt securities are solely principal and profit,
however, these securities are neither held for the purpose of collecting contractual
cash flows nor held both for collecting contractual cash flows and for sale. The
collection of contractual cash flows is only incidental to achieving the Fund’s
business model’s objective. Consequently, all investments are measured at fair
value through profit or loss.
The Fund classifies cash and cash equivalents and dividend receivable at amortised
cost as these financial assets are held to collect contractual cash flows consisting of
the amount outstanding.
The Fund designates its investments in quoted investments, collective investment
schemes and unquoted fixed income securities as financial assets at fair value
through profit or loss at inception.

41
2 SUMMARY OF SIGNIFICANT ACCOUNTING POLICIES
(CONTINUED)
2.2 Financial assets (continued)
Recognition and measurement
Regular purchases and sales of financial assets are recognised on the trade date - the
date on which the Fund commits to purchase or sell the asset. Financial assets and
financial liabilities at fair value through profit or loss are initially recognised at fair
value. Transaction costs are expensed as incurred in the statement of income and
expenses.
Financial assets are de-recognised when the rights to receive cash flows from the
investments have expired or the Fund has transferred substantially all risks and
rewards of ownership.
Subsequent to initial recognition, all financial assets at fair value through profit or
loss are measured at fair value. Gains or losses arising from changes in the fair
value of the ‘financial assets at fair value through profit or loss’ category are
presented in statement of income and expenses in the period which they arise.
Dividend from financial assets at fair value through profit or loss is recognised in
the statement of income and expenses within dividend income from investments
when the Fund’s right to receive payments is established.
Interest on debt securities at fair value through profit or loss is recognised in the
statement of income and expenses.
Quoted investments and collective investment schemes are initially recognised at
fair value and subsequently re-measured at fair value based on the market price
quoted on the relevant stock exchanges at the close of the business on the valuation
day, where the close price falls within the bid-ask spread. In circumstances where
the close price is not within the bid-ask spread, the Manager will determine the
point within the bid-ask spread that is most representative of the fair value.
If a valuation based on the market price does not represent the fair value of the
securities, for example during abnormal market conditions or when no market price
is available, including in the event of a suspension in the quotation of the securities
for a period exceeding 14 days, or such shorter period as agreed by the Trustee, then
the securities are valued as determined in good faith by the Manager, based on the
methods or bases approved by the Trustee after appropriate technical consultation.

42
2 SUMMARY OF SIGNIFICANT ACCOUNTING POLICIES
(CONTINUED)
2.2 Financial assets (continued)
Recognition and measurement (continued)
Unquoted fixed income securities denominated in Ringgit Malaysia are revalued on
a daily basis based on fair value prices quoted by a bond pricing agency (“BPA”)
registered with the SC as per the SC Guidelines on Unit Trust Funds.
Where such quotations are not available or where the Manager is of the view that
the price quoted by the BPA for a specific unquoted fixed income security differs
from the market price by more than 20 basis points, the Manager may use the
market price, provided that the Manager:
(i) Records its basis for using a non-BPA price;
(ii) Obtains necessary internal approvals to use the non-BPA price; and
(iii) Keeps an audit trail of all decisions and basis for adopting the market price.
Deposits with licensed financial institutions are stated at cost plus accrued interest
calculated on the effective interest method over the period from the date of
placement to the date of maturity of the respective deposits, which is a reasonable
estimate of fair value due to the short-term nature of the deposits.
Financial assets at amortised cost are subsequently carried at amortised cost using
the effective interest method.
Impairment of financial assets
The Fund measures credit risk and expected credit losses using probability of
default, exposure at default and loss given default. Management considers both
historical analysis and forward looking information in determining any expected
credit loss. Management considers the probability of default to be close to zero as
these instruments have a low risk of default and the counterparties have a strong
capacity to meet their contractual obligations in the near term. As a result, no loss
allowance has been recognised based on 12-month expected credit losses as any
such impairment would be wholly insignificant to the Fund.

43
2 SUMMARY OF SIGNIFICANT ACCOUNTING POLICIES
(CONTINUED)
2.2 Financial assets (continued)
Significant increase in credit risk
A significant increase in credit risk is defined by management as any contractual
payment which is more than 30 days past due or a counterparty credit rating which
has fallen below BBB/Baa.
Definition of default and credit-impaired financial assets
Any contractual payment which is more than 90 days past due is considered credit
impaired.
Write-off
The Fund write off financial assets, in whole or in part, when it has exhausted all
practical recovery efforts and has concluded there is no reasonable expectation of
recovery. The assessment of no reasonable expectation of recovery is based on
unavailability of debtor’s sources of income or assets to generate sufficient future
cash flows to repay the amount. The Fund may write-off financial assets that are still
subject to enforcement activity. Subsequent recoveries of amounts previously
written off will result in impairment gains. There are no write-offs/recoveries during
the financial period.
2.3 Financial liabilities
Financial liabilities are classified according to the substance of the contractual
arrangements entered into and the definitions of a financial liability.
Financial liabilities, within the scope of MFRS 9 are recognised in the statement of
financial position when, and only when, the Fund becomes a party to the contractual
provisions of the financial instrument.
The Fund’s financial liabilities which include amount due to stockbrokers, amount
due to Manager, accrued management fee, amount due to Trustee and other
payables and accruals are recognised initially at fair value and subsequently
measured at amortised cost using the effective interest method.
A financial liability is de-recognised when the obligation under the liability is
extinguished. Gains and losses are recognised in profit or loss when the liabilities
are de-recognised, and through the amortisation process.
44
2 SUMMARY OF SIGNIFICANT ACCOUNTING POLICIES
(CONTINUED)
2.4 Unitholders’ capital
The unitholders’ contributions to the Fund meet the criteria of the definition of
puttable instruments to be classified as equity instruments under MFRS 132
“Financial Instruments: Presentation”. Those criteria include:
the units entitle the holder to a proportionate share of the Fund’s net assets
value;
the units are the most subordinated class and class features are identical;
there is no contractual obligations to deliver cash or another financial asset other
than the obligation on the Fund to repurchase; and
the total expected cash flows from the units over its life are based substantially
on the profit or loss of the Fund.
The outstanding units are carried at the redemption amount that is payable at each
financial period if unitholder exercises the right to put the unit back to the Fund.
Units are created and cancelled at prices based on the Fund’s net asset value per
unit at the time of creation or cancellation. The Fund’s net asset value per unit is
calculated by dividing the net assets attributable to unitholders with the total
number of outstanding units.
2.5 Income recognition
Dividend income from quoted investments and collective investment schemes are
recognised when the Fund’s right to receive payment is established. Dividend
income is received from financial assets measured at FVTPL.
Interest income from deposits with licensed financial institutions and unquoted
fixed income securities are recognised on an accrual basis using the effective
interest method.
Interest income is calculated by applying the effective interest rate to the gross
carrying amount of a financial asset except for financial assets that subsequently
become credit-impaired. For credit-impaired financial assets the effective interest
rate is applied to the net carrying amount of the financial assets (after deduction of
the loss allowance).

45
2 SUMMARY OF SIGNIFICANT ACCOUNTING POLICIES
(CONTINUED)
2.5 Income recognition (continued)
Realised gain or loss on sale of quoted investments and collective investment
schemes are arrived at after accounting for cost of investments, determined on the
weighted average cost method.
Realised gain and loss on sale of unquoted fixed income securities is measured by
the difference between the net disposal proceeds and the carrying amounts of the
investments (adjusted for accretion of discount or amortisation of premium).
Net income or loss is the total of income less expenses.
2.6 Taxation
Current tax expense is determined according to Malaysian tax laws and includes all
taxes based upon the taxable income earned during the financial period.
2.7 Cash and cash equivalents
For the purpose of the statement of cash flows, cash and cash equivalents comprise
bank balances and deposits with licensed financial institutions which are subject to
an insignificant risk of changes in value.
2.8 Presentation and functional currency
Items included in the financial statements of the Fund are measured using the
currency of the primary economic environment in which the Fund operates (the
“functional currency”). The financial statements are presented in Ringgit Malaysia,
which is the Fund’s presentation and functional currency.
2.9 Segmental information
Operating segments are reported in a manner consistent with the internal reporting
used by the chief operating decision-maker. The operating results are regularly
reviewed by the Manager and the Investment Committee. The Investment
Committee assumes the role of chief operating decision maker, for performance
assessment purposes and to make decisions about resources allocated to the
investment segment based on the recommendation by the Investment & Security
Selection Committee.
46
3 FINANCIAL RISK MANAGEMENT OBJECTIVES AND POLICIES
The Fund is exposed to a variety of risks, which include market risk, price risk,
interest rate risk, liquidity risk, credit risk and capital risk.
Financial risk management is carried out through internal control processes adopted
by the Manager and adherence to the investment restrictions as stipulated in the SC
Guidelines on Unit Trust Funds.
Market risk
Securities may decline in value due to factors affecting securities markets generally
or particular industries represented in the securities markets. The value of a security
may decline due to general market conditions which are not specifically related to a
particular company, such as real or perceived adverse economic conditions, changes
in the general outlook for corporate earnings, changes in interest or currency rates
or adverse investors’ sentiment generally. They may also decline due to factors that
affect a particular industry or industries, such as labour shortages or increased
production costs and competitive conditions within an industry. Equity securities
generally have greater price volatility than fixed income securities. The market
price of securities owned by a unit trust fund might go down or up, sometimes
rapidly or unpredictably.

47
3 FINANCIAL RISK MANAGEMENT OBJECTIVES AND POLICIES
(CONTINUED)
Price risk
Price risk is the risk that the fair value of an investment of the Fund will fluctuate
because of changes in market prices (other than those arising from interest rate
risk).
The Fund is exposed to price risk arising from interest rate risk in relation to its
investments in unquoted fixed income securities as follows:
31.08.2019 28.02.2019
RM RM
RHB GoldenLife Today 9,230,404 9,207,745 ═════════ ═════════
RHB GoldenLife 2020 2,229,190 2,202,953 ═════════ ═════════
RHB GoldenLife 2030 482,472 549,097 ═════════ ═════════
The Fund’s exposure to price risk arising from interest rate risk and the related
sensitivity analysis are disclosed in “Interest rate risk” below.
The Fund is also exposed to quoted equity security and collective investment
schemes price risk (other than those arising from interest rate risk) as follows:
31.08.2019 28.02.2019
RM RM
RHB GoldenLife Today 1,586,402 1,715,657 ═════════ ═════════
RHB GoldenLife 2020 2,109,580 2,051,115 ═════════ ═════════
RHB GoldenLife 2030 3,173,314 3,270,953 ═════════ ═════════

48
3 FINANCIAL RISK MANAGEMENT OBJECTIVES AND POLICIES
(CONTINUED)
Price risk (continued)
The sensitivity analysis is based on the assumption that the price of the quoted
equity security and collective investment schemes fluctuates by +/(-) 5% with all
other variables held constant, the impact on profit or loss and net asset value are as
follows:
31.08.2019 28.02.2019
RM RM
RHB GoldenLife Today 79,320 85,783 ═════════ ═════════
RHB GoldenLife 2020 105,479 102,556 ═════════ ═════════
RHB GoldenLife 2030 158,666 163,548 ═════════ ═════════
Interest rate risk
In general, when interest rates rise, unquoted fixed income securities prices will
tend to fall and vice versa. Therefore, the net asset value of the Fund may also tend
to fall when interest rates rise or are expected to rise. In order to mitigate interest
rates exposure of the Fund, the Manager will manage the duration of the portfolio
via shorter or longer tenured assets depending on the view of the future interest rate
trend of the Manager, which is based on its continuous fundamental research and
analysis.
This risk is crucial since bond portfolio management depends on forecasting
interest rate movements. Bonds with longer maturity and lower yield coupon rates
are more susceptible to interest rate movements.
Investors should note that fixed income securities (such as the bonds held by the
Fund) and money market instruments are subject to interest rate fluctuations. Such
investments may be subject to unanticipated rise in interest rates which may impair
the ability of the issuers to make payments of interest and principal, especially if the
issuers are highly leveraged. An increase in interest rates may therefore increase the
potential for default by an issuer.

49
3 FINANCIAL RISK MANAGEMENT OBJECTIVES AND POLICIES
(CONTINUED)
Interest rate risk (continued)
The sensitivity analysis is based on the assumption that the interest rate fluctuates
by +/(-) 1%, with all other variables held constant, the impact on profit or loss and
net asset value are as follows:
% Change in interest rate
Impact on profit or loss
and net asset value
31.08.2019 28.02.2019
RM RM
RHB GoldenLife Today
+ 1% (23,748) (29,671)
- 1% 23,838 29,820
═════════ ═════════
RHB GoldenLife 2020
+ 1% (7,402) (8,168)
- 1% 7,441 8,214
═════════ ═════════
RHB GoldenLife 2030
+ 1% (2,902) (3,027)
- 1% 2,930 3,049
═════════ ═════════
Fund’s exposure to interest rate risk arises from short term deposits with approved
licensed financial institutions is expected to be minimal as the deposits are mainly
maintained on a short term basis.
Liquidity risk
Liquidity risk is the risk that the Fund will encounter difficulty in meeting its
financial obligations.
Liquidity risk exists when particular investments are difficult to sell, possibly
preventing a unit trust fund from selling such illiquid investments at an
advantageous time or price. Unit trust funds with principal investment strategies
that involve securities or securities with substantial market and/or credit risk tend to
have the greater exposure to liquidity risk. As part of its risk management, the
Manager will attempt to manage the liquidity of the Fund through asset allocation
and diversification strategies within the portfolio. The Manager will also conduct
constant fundamental research and analysis to forecast future liquidity of its
investments.

50
3 FINANCIAL RISK MANAGEMENT OBJECTIVES AND POLICIES
(CONTINUED)
Liquidity risk (continued)
The table below summarises the Fund’s financial liabilities into relevant maturity
groupings based on the remaining period from the statement of financial position
date to the contractual maturity date. The amounts in the table are the contractual
undiscounted cash flows.
Between
Less than 1 month
1 month to 1 year
RM RM
31.08.2019
RHB GoldenLife Today
Amount due to Manager 7,827 -
Accrued management fee 12,310 -
Amount due to Trustee 591 -
Other payables and accruals - 12,609 ───────── ─────────
20,728 12,609 ═════════ ═════════
RHB GoldenLife 2020
Amount due to Manager 7,029 -
Accrued management fee 5,698 -
Amount due to Trustee 228 -
Other payables and accruals - 12,567 ───────── ─────────
12,955 12,567 ═════════ ═════════
RHB GoldenLife 2030
Amount due to Manager 12,837 -
Accrued management fee 4,960 -
Amount due to Trustee 198 -
Other payables and accruals - 12,600 ───────── ─────────
17,995 12,600 ═════════ ═════════
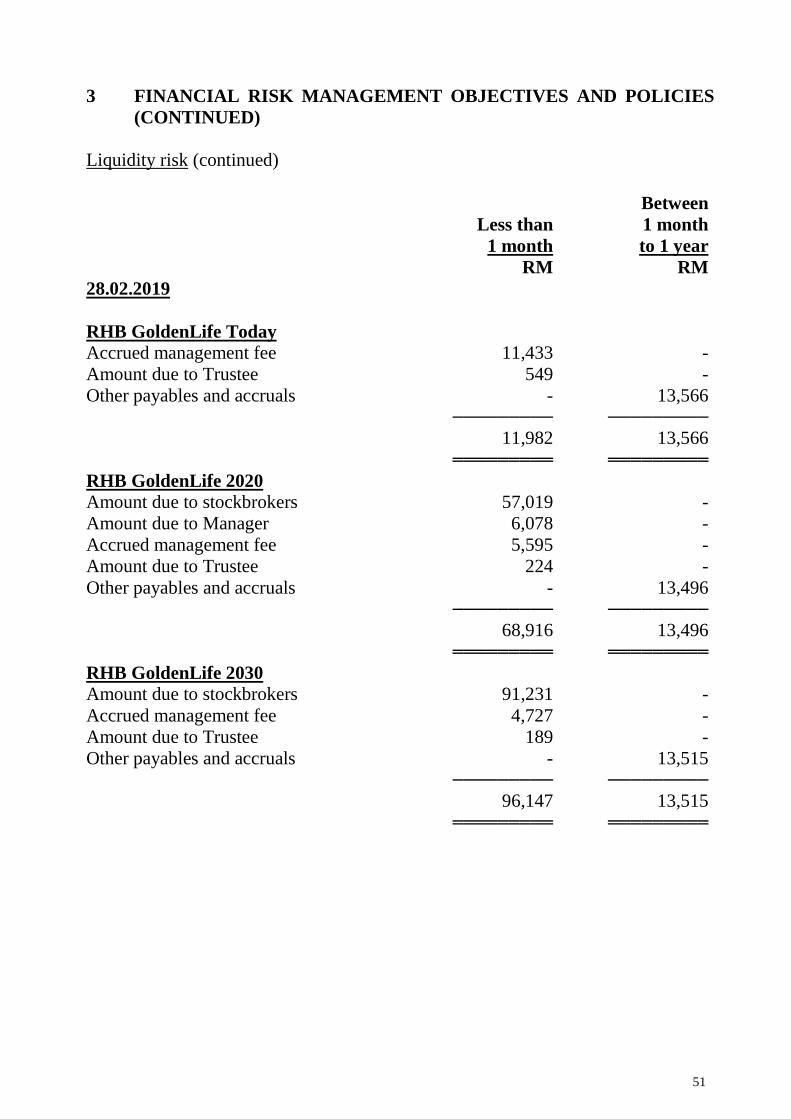
51
3 FINANCIAL RISK MANAGEMENT OBJECTIVES AND POLICIES
(CONTINUED)
Liquidity risk (continued)
Between
Less than 1 month
1 month to 1 year
RM RM
28.02.2019
RHB GoldenLife Today Accrued management fee 11,433 -
Amount due to Trustee 549 -
Other payables and accruals - 13,566 ───────── ─────────
11,982 13,566 ═════════ ═════════
RHB GoldenLife 2020
Amount due to stockbrokers 57,019 -
Amount due to Manager 6,078 -
Accrued management fee 5,595 -
Amount due to Trustee 224 -
Other payables and accruals - 13,496 ───────── ─────────
68,916 13,496 ═════════ ═════════
RHB GoldenLife 2030
Amount due to stockbrokers 91,231 -
Accrued management fee 4,727 -
Amount due to Trustee 189 -
Other payables and accruals - 13,515 ───────── ─────────
96,147 13,515 ═════════ ═════════

52
3 FINANCIAL RISK MANAGEMENT OBJECTIVES AND POLICIES
(CONTINUED)
Credit risk
Credit risk refers to the ability of an issuer or a counter party to make timely
payments of interest, principal and proceeds from realisation of investments. For
investments in fixed income securities, risk is minimised by spreading its maturity
profile. The risk arising from placements of deposits in licensed financial
institutions is managed by ensuring that the Fund will only place deposits in
reputable licensed financial institutions. For amount due from stockbrokers, the
settlement terms are governed by the relevant rules and regulations as prescribed by
the Bursa Malaysia Securities Berhad (“Bursa Malaysia”). The settlement terms of
the proceeds from the creation of units receivable from the Manager are governed
by the SC Guidelines on Unit Trust Funds.
The following table sets out the credit risk concentrations of the Fund:
Unquoted
fixed
income
securities
RM
Cash and
cash
equivalents
RM
Other
financial
assets*
RM
Total
RM
31.08.2019
RHB GoldenLife Today
Financial institutions:
AAA (S) 2,215,689 50,060 - 2,265,749
AA1 523,141 - - 523,141
AA2 559,805 - - 559,805
AA3 3,107,599 772,630 - 3,880,229
AA- IS 2,193,314 - - 2,193,314
BB1 630,856 - - 630,856
Others - - 4,440 4,440
9,230,404 822,690 4,440 10,057,534

53
3 FINANCIAL RISK MANAGEMENT OBJECTIVES AND POLICIES
(CONTINUED)
Credit risk (continued)
Unquoted
fixed
income
securities
RM
Cash and
cash
equivalents
RM
Other
financial
assets*
RM
Total
RM
31.08.2019
RHB GoldenLife 2020
Financial institutions:
AAA (S) 317,516 183,768 - 501,284
AA3 612,789 - - 612,789
AA- IS 735,038 - - 735,038
BB1 135,183 - - 135,183
Non-rated 428,664 - - 428,664
Others - - 6,621 6,621
2,229,190 183,768 6,621 2,419,579
RHB GoldenLife 2030
Financial institutions:
AAA - 256,184 - 256,184
AA3 33,424 - - 33,424
AA- IS 288,475 - - 288,475
BB1 160,573 - - 160,573
Others - - 9,427 9,427
482,472 256,184 9,427 748,083

54
3 FINANCIAL RISK MANAGEMENT OBJECTIVES AND POLICIES
(CONTINUED)
Credit risk (continued)
Unquoted
fixed
income
securities
RM
Cash and
cash
equivalents
RM
Other
financial
assets*
RM
Total
RM
28.02.2019
RHB GoldenLife Today
Financial institutions:
AAA 2,074,263 3,783 - 2,078,046
AA1 508,447 - - 508,447
AA2 529,400 - - 529,400
AA3 3,036,262 1,044,168 - 4,080,430
AA- 2,128,379 - - 2,128,379
A1 930,994 - - 930,994
Others - - 144 144
9,207,745 1,047,951 144 10,255,840
RHB GoldenLife 2020
Financial institutions:
AAA 310,263 424,066 - 734,329
AA3 581,972 - - 581,972
AA- 701,392 - - 701,392
A1 199,499 - - 199,499
Non-rated 409,827 - - 409,827
Others - - 384 384
2,202,953 424,066 384 2,627,403

55
3 FINANCIAL RISK MANAGEMENT OBJECTIVES AND POLICIES
(CONTINUED)
Credit risk (continued)
Unquoted
fixed
income
securities
RM
Cash and
cash
equivalents
RM
Other
financial
assets*
RM
Total
RM
28.02.2019
RHB GoldenLife 2030
Financial institutions:
AAA - 392,099 - 392,099
AA3 33,215 - - 33,215
AA- 272,451 - - 272,451
A1 243,431 - - 243,431
Others - - 1,008 1,008
549,097 392,099 1,008 942,204
* Comprise dividend receivable.
The financial assets of the Fund are neither past due nor impaired.
Capital risk
The capital of the Fund is represented by equity consisting of unitholders’ capital
and retained earnings/(accumulated losses) as follow:
Unitholders’ capital
Retained earnings/
(accumulated losses)
31.08.2019 28.02.2019 31.08.2019 28.02.2019
RM RM RM RM
RHB GoldenLife Today 10,271,679 10,684,772 1,338,920 1,261,177
RHB GoldenLife 2020 5,118,253 5,205,462 (614,428) (608,427)
RHB GoldenLife 2030 5,053,647 5,134,980 (1,162,588) (1,031,485)
The amount of equity can change significantly on a daily basis as the Fund is
subject to daily subscriptions and redemptions at the discretion of unitholders. The
Fund’s objective when managing capital is to safeguard the Fund’s ability to
continue as a going concern in order to provide returns for unitholders and benefits
for other stakeholders and to maintain a strong capital base to support the
development of the investment activities of the Fund.

56
4 FAIR VALUE ESTIMATION
Fair value is defined as the price that would be received to sell an asset or paid to
transfer a liability in an orderly transaction between market participants at the
measurement date (i.e. an exit price).
The fair value of financial assets traded in active market (such as publicly traded
derivatives and trading securities) are based on quoted market prices at the close of
trading on the financial period end date.
An active market is a market in which transactions for the assets or liabilities take
place with sufficient frequency and volume to provide pricing information on an
ongoing basis.
The fair value of financial assets that are not traded in an active market is
determined by using valuation techniques. The Fund uses a variety of methods and
makes assumptions that are based on market conditions existing at each financial
period end date. Valuation techniques used for non-standardised financial
instruments such as options, currency swaps and other over-the-counter derivatives,
include the use of comparable recent transactions, reference to other instruments
that are substantially the same, discounted cash flow analysis, option pricing
models and other valuation techniques commonly used by market participants
making the maximum use of market inputs and relying as little as possible on
entity-specific inputs.
The fair values are based on the following methodologies and assumptions:
(i) For bank balances and deposits with licensed financial institutions with
maturities less than 1 year, the carrying value is a reasonable estimate of fair
value.
(ii) The carrying value of receivables and payables are assumed to approximate
their fair values due to their short term nature.
Fair value hierarchy
The Fund adopted MFRS 13 “Fair Value Measurement” in respect of disclosures
about the degree of reliability of fair value measurement. This requires the Fund to
classify fair value measurements using a fair value hierarchy that reflects the
significance of the inputs used in making the measurements. The fair value
hierarchy has the following levels:

57
4 FAIR VALUE ESTIMATION (CONTINUED)
Fair value hierarchy (continued)
Level 1: Quoted prices (unadjusted) in active market for identical assets or
liabilities
Level 2: Inputs other than quoted prices included within level 1 that are
observable for the asset or liability, either directly (that is, as prices) or
indirectly (that is, derived from prices)
Level 3: Inputs for the asset and liability that are not based on observable
market data (that is, unobservable inputs)
The following table analyses within the fair value hierarchy the Fund’s financial
assets at fair value through profit or loss (by class) measured at fair value:
Level 1 Level 2 Level 3 Total
RM RM RM RM
31.08.2019
RHB GoldenLife Today
Investments:
- Quoted investments 1,586,402 - - 1,586,402
- Unquoted fixed income
securities - 9,230,404 - 9,230,404 ──────── ──────── ────── ─────────
1,586,402 9,230,404 - 10,816,806 ════════ ════════ ══════ ═════════
RHB GoldenLife 2020
Investments:
- Collective investment
schemes 206,800 - - 206,800
- Quoted investments 1,902,780 - - 1,902,780
- Unquoted fixed income
securities - 2,229,190 - 2,229,190 ──────── ──────── ────── ─────────
2,109,580 2,229,190 - 4,338,770 ════════ ════════ ══════ ═════════

58
4 FAIR VALUE ESTIMATION (CONTINUED)
Fair value hierarchy (continued)
Level 1 Level 2 Level 3 Total
RM RM RM RM
31.08.2019 (continued)
RHB GoldenLife 2030
Investments:
- Collective investment
schemes 272,400 - - 272,400
- Quoted investments 2,900,914 - - 2,900,914
- Unquoted fixed income
securities - 482,472 - 482,472 ──────── ──────── ────── ─────────
3,173,314 482,472 - 3,655,786 ════════ ════════ ══════ ═════════
28.02.2019
RHB GoldenLife Today
Investments:
- Quoted investments 1,715,657 - - 1,715,657
- Unquoted fixed income
securities - 9,207,745 - 9,207,745 ──────── ──────── ────── ─────────
1,715,657 9,207,745 - 10,923,402 ════════ ════════ ══════ ═════════
RHB GoldenLife 2020
Investments:
- Quoted investments 2,051,115 - - 2,051,115
- Unquoted fixed income
securities - 2,202,953 - 2,202,953 ──────── ──────── ────── ─────────
2,051,115 2,202,953 - 4,254,068 ════════ ════════ ══════ ═════════
RHB GoldenLife 2030
Investments:
- Quoted investments 3,270,953 - - 3,270,953
- Unquoted fixed income
securities - 549,097 - 549,097 ──────── ──────── ────── ─────────
3,270,953 549,097 - 3,820,050 ════════ ════════ ══════ ═════════

59
4 FAIR VALUE ESTIMATION (CONTINUED)
Fair value hierarchy (continued)
Investments in active listed equities, i.e. quoted investments and collective
investment schemes whose values are based on quoted market prices in active
markets are classified within Level 1. The Fund does not adjust the quoted prices
for these instruments. The Fund’s policies on valuation of these financial assets
are stated in Note 2.2.
Financial instruments that trade in markets that are considered to be active but are
valued based on quoted market prices, dealer quotations or alternative pricing
sources supported by observable inputs are classified within Level 2. Level 2
instruments include unquoted fixed income securities. As Level 2 instruments
include positions that are not traded in active markets and/or are subject to
transfer restrictions, valuations may be adjusted to reflect illiquidity and/or non-
transferability, which are generally based on available market information. The
Fund’s policies on valuation of these financial assets are stated in Note 2.2.
5 INVESTMENTS
31.08.2019
RHB RHB RHB
GoldenLife GoldenLife GoldenLife
Today 2020 2030
RM RM RM
Investments:
- Collective investment schemes - 206,800 272,400
- Quoted investments 1,586,402 1,902,780 2,900,914
- Unquoted fixed income securities 9,230,404 2,229,190 482,472 ──────── ──────── ────────
10,816,806 4,338,770 3,655,786 ════════ ════════ ════════
28.02.2019
RHB RHB RHB
GoldenLife GoldenLife GoldenLife
Today 2020 2030
RM RM RM
Investments:
- Quoted investments 1,715,657 2,051,115 3,270,953
- Unquoted fixed income securities 9,207,745 2,202,953 549,097 ──────── ──────── ────────
10,923,402 4,254,068 3,820,050 ════════ ════════ ════════
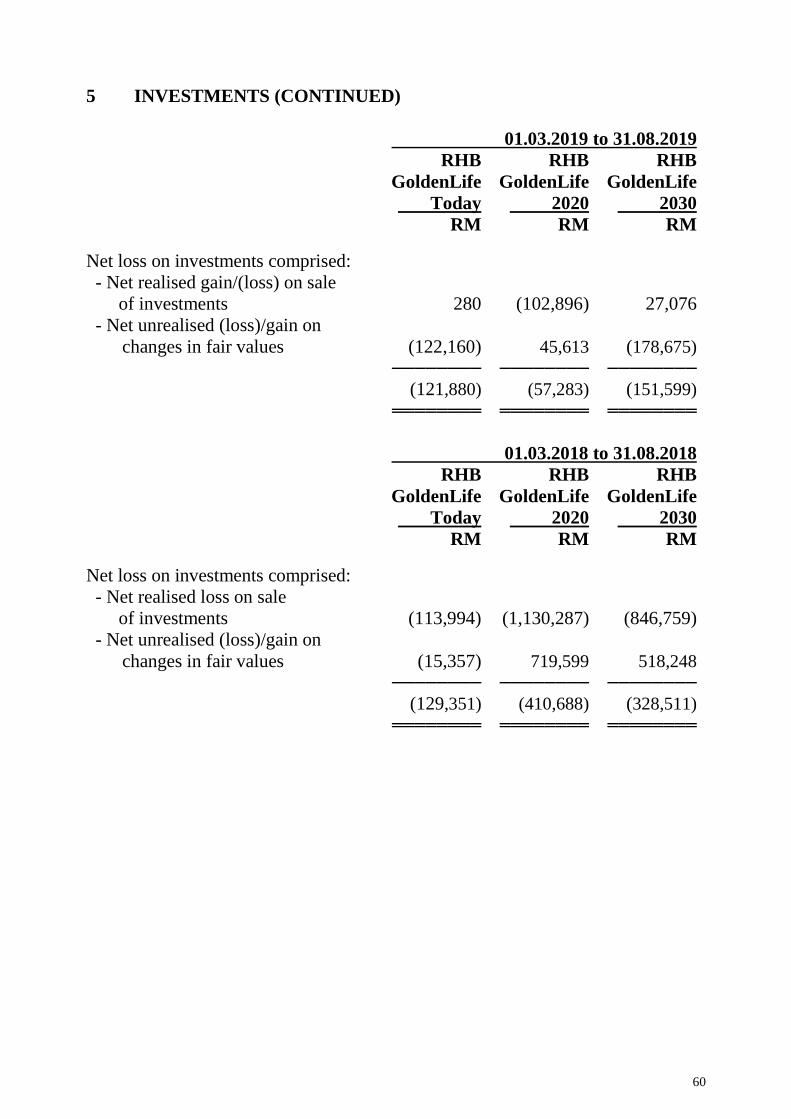
60
5 INVESTMENTS (CONTINUED)
01.03.2019 to 31.08.2019
RHB RHB RHB
GoldenLife GoldenLife GoldenLife
Today 2020 2030
RM RM RM
Net loss on investments comprised:
- Net realised gain/(loss) on sale
of investments 280 (102,896) 27,076
- Net unrealised (loss)/gain on
changes in fair values (122,160) 45,613 (178,675) ──────── ──────── ────────
(121,880) (57,283) (151,599) ════════ ════════ ════════
01.03.2018 to 31.08.2018
RHB RHB RHB
GoldenLife GoldenLife GoldenLife
Today 2020 2030
RM RM RM
Net loss on investments comprised:
- Net realised loss on sale
of investments (113,994) (1,130,287) (846,759)
- Net unrealised (loss)/gain on
changes in fair values (15,357) 719,599 518,248 ──────── ──────── ────────
(129,351) (410,688) (328,511) ════════ ════════ ════════
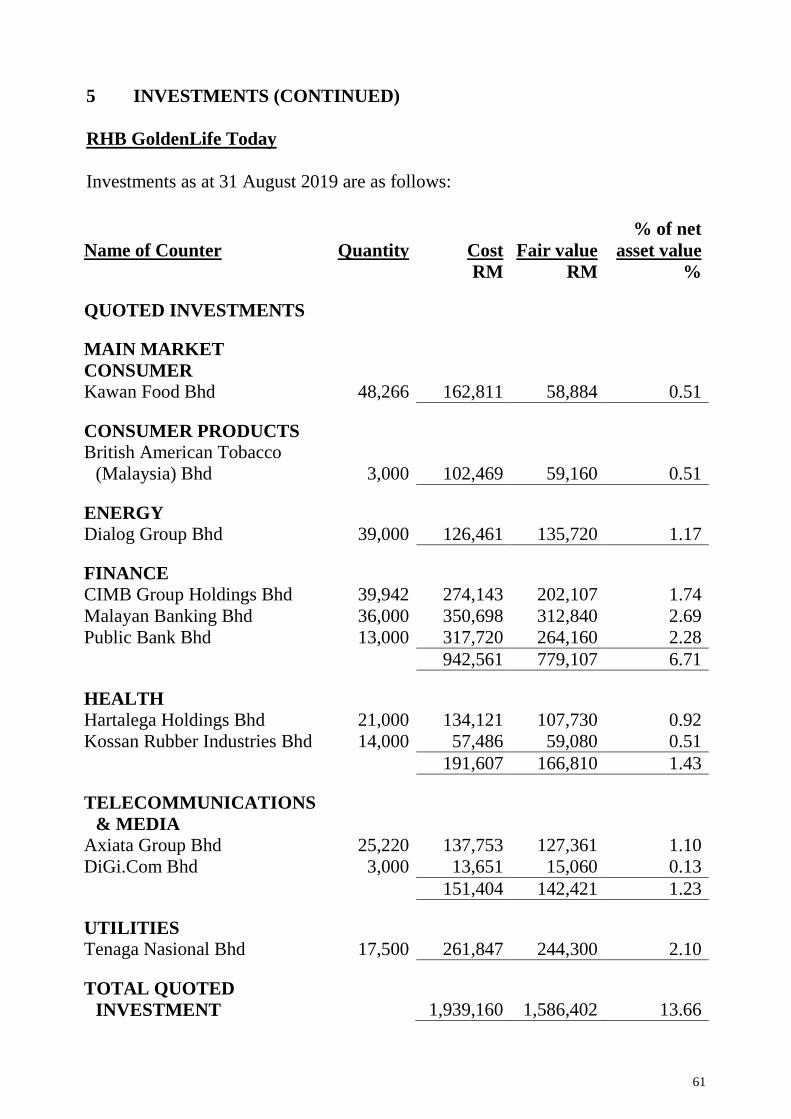
61
5 INVESTMENTS (CONTINUED)
RHB GoldenLife Today
Investments as at 31 August 2019 are as follows:
Name of Counter Quantity Cost Fair value
% of net
asset value
RM RM %
QUOTED INVESTMENTS
MAIN MARKET
CONSUMER
Kawan Food Bhd 48,266 162,811 58,884 0.51
CONSUMER PRODUCTS
British American Tobacco
(Malaysia) Bhd 3,000 102,469 59,160 0.51
ENERGY
Dialog Group Bhd 39,000 126,461 135,720 1.17
FINANCE
CIMB Group Holdings Bhd 39,942 274,143 202,107 1.74
Malayan Banking Bhd 36,000 350,698 312,840 2.69
Public Bank Bhd 13,000 317,720 264,160 2.28
942,561 779,107 6.71
HEALTH
Hartalega Holdings Bhd 21,000 134,121 107,730 0.92
Kossan Rubber Industries Bhd 14,000 57,486 59,080 0.51
191,607 166,810 1.43
TELECOMMUNICATIONS
& MEDIA
Axiata Group Bhd 25,220 137,753 127,361 1.10
DiGi.Com Bhd 3,000 13,651 15,060 0.13
151,404 142,421 1.23
UTILITIES
Tenaga Nasional Bhd 17,500 261,847 244,300 2.10
TOTAL QUOTED
INVESTMENT
1,939,160 1,586,402 13.66

62
5 INVESTMENTS (CONTINUED)
RHB GoldenLife Today (continued)
Investments as at 31 August 2019 are as follows: (continued)
Name of Counter
Nominal
value Cost Fair value
% of net
asset value RM RM %
UNQUOTED FIXED
INCOME SECURITIES
5.15% Alpha Circle Sdn Bhd
19/11/2019 AA- IS 1,000,000 1,014,352 1,016,263 8.75
7.10% BGSM Management
Sdn Bhd 28/12/2022 AA3 150,000 161,455 167,118 1.44
2.50% Bright Focus Bhd
IMTN 24/01/2030 BB1 1,400,000 1,009,461 630,856 5.43
4.98% Genm Capital
31/03/2027 AAA(S) 2,000,000 2,042,569 2,215,689 19.08
4.50% Hong Leong Assurance
Bhd 07/02/2025 AA3 1,400,000 1,404,315 1,407,885 12.13
5.29% Konsortium ProHAWK
Sdn Bhd 26/12/2031 AA2 500,000 517,870 559,805 4.82
6.40% Maju Expressway Sdn
Bhd 28/04/2034 AA- IS 500,000 522,359 603,014 5.19
5.45% SPG IMTN 31/10/2033
AA- IS 500,000 509,257 574,037 4.95
5.85% Tanjung Bin Energy
Issuer Berhad 15/09/2028
AA3 1,100,000 1,199,357 1,287,480 11.09

63
5 INVESTMENTS (CONTINUED)
RHB GoldenLife Today (continued)
Investments as at 31 August 2019 are as follows: (continued)
Name of Counter
Nominal
value Cost Fair value
% of net
asset value RM RM %
UNQUOTED FIXED
INCOME SECURITIES
(CONTINUED)
6.15% Tanjung Bin Energy
Issuer Berhad 15/09/2031
AA3 200,000 222,468 245,116 2.11
4.49% YTL Power
International Bhd
24/03/2023 AA1 500,000 511,289 523,141 4.51
TOTAL UNQUOTED
FIXED INCOME SECURITIES 9,114,752 9,230,404 79.50
TOTAL
INVESTMENTS 11,053,912 10,816,806 93.16

64
5 INVESTMENTS (CONTINUED)
RHB GoldenLife Today (continued)
Investments as at 28 February 2019 are as follows:
Name of Counter Quantity Cost Fair value
% of net
asset value
RM RM %
QUOTED INVESTMENTS
MAIN MARKET
CONSUMER PRODUCTS
British American Tobacco
(Malaysia) Bhd 3,000 102,469 101,100 0.85
Kawan Food Bhd 48,266 162,811 79,639 0.67
265,280 180,739 1.52
ENERGY
Dialog Group Bhd 39,000 126,461 125,970 1.05
FINANCE
CIMB Group Holdings Bhd 38,997 269,465 228,133 1.91
Malayan Banking Bhd 36,000 350,698 343,080 2.87
Public Bank Bhd 13,000 317,720 325,000 2.72
937,883 896,213 7.50
HEALTHCARE
Hartalega Holdings Bhd 21,000 134,121 105,000 0.88
Kossan Rubber Industries Bhd 14,000 57,486 54,320 0.45
191,607 159,320 1.33
TELECOMMUNICATIONS &
MEDIA
Axiata Group Bhd 25,220 137,753 104,915 0.88
DiGi.Com Bhd 3,000 13,651 13,650 0.11
151,404 118,565 0.99
UTILITIES
Tenaga Nasional Berhad 17,500 261,847 234,850 1.97
TOTAL QUOTED
INVESTMENTS
1,934,482 1,715,657 14.36

65
5 INVESTMENTS (CONTINUED)
RHB GoldenLife Today (continued)
Investments as at 28 February 2019 are as follows: (continued)
Name of Counter
Nominal
value Cost Fair value
% of net
asset value RM RM %
UNQUOTED FIXED
INCOME SECURITIES
5.15% Alpha Circle Sdn
Bhd 19/11/2019 AA-
1,000,000
1,013,983
1,016,682
8.51
7.10% BGSM
Management Sdn Bhd
28/12/2022 AA3
150,000
162,716
166,076
1.39
2.50% Bright Focus
Bhd IMTN 24/01/2030
A1
1,400,000
995,728
930,994
7.79
4.98% GENM Capital
31/03/2027 AAA
2,000,000
2,042,023
2,074,263
17.36
4.50% Hong Leong
Assurance Bhd
07/02/2025 AA3
1,400,000
1,403,797
1,404,875
11.76
5.29% Konsortium
ProHAWK Sdn Bhd
26/12/2031 AA2
500,000
518,114
529,400
4.43
6.40% Maju
Expressway Sdn Bhd
28/04/2034 AA-
500,000
522,424
569,449
4.77

66
5 INVESTMENTS (CONTINUED)
RHB GoldenLife Today (continued)
Investments as at 28 February 2019 are as follows: (continued)
Name of Counter
Nominal
value Cost Fair value
% of net
asset value RM RM %
UNQUOTED FIXED
INCOME SECURITIES
(CONTINUED)
5.45% SPG IMTN
31/10/2033 AA- 500,000 509,034 542,248 4.54
5.85% Tanjung Bin
Energy Issuer Bhd
15/09/2028 AA3 1,100,000 1,201,884 1,232,522 10.32
6.15% Tanjung Bin
Energy Issuer Bhd
15/09/2031 AA3 200,000 222,870 232,789 1.95
4.49% YTL Power
International Bhd
24/03/2023 AA1 500,000 511,293 508,447 4.26
TOTAL UNQUOTED
FIXED INCOME SECURITIES
9,103,866
9,207,745
77.08
TOTAL
INVESTMENTS 11,038,348 10,923,402 91.44

67
5 INVESTMENTS (CONTINUED)
RHB GoldenLife 2020
Investments as at 31 August 2019 are as follows:
Name of Counter Quantity Cost
Fair
value
% of net
asset
value
RM RM %
QUOTED INVESTMENTS
MAIN MARKET
CONSUMER PRODUCTS &
SERVICES
Bermaz Auto Bhd 35,000 94,699 79,800 1.77
Carlsberg Brewery Malaysia
Bhd 3,700 90,624 95,830 2.12
Heineken Malaysia Bhd 4,000 97,196 98,000 2.18
Petronas Dagangan Bhd 3,800 89,276 86,944 1.93
PPB Group Bhd 5,000 93,200 93,300 2.07
QL Resources Bhd 14,000 96,018 97,160 2.16
561,013 551,034 12.23
ENERGY
Dialog Group Bhd 24,000 74,374 83,520 1.86
Serba Dinamik Holdings Bhd 25,000 100,773 110,000 2.44
175,147 193,520 4.30
FINANCIAL SERVICES
Alliance Bank Malaysia Bhd 13,000 54,729 39,000 0.86
AMMB Holdings Bhd 11,000 46,720 46,200 1.03
CIMB Group Holdings Bhd 9,579 61,312 48,470 1.08
Malayan Banking Bhd 16,000 164,907 139,040 3.09
Public Bank Bhd 6,400 151,193 130,048 2.89
478,861 402,758 8.95
INDUSTRIAL PRODUCTS &
SERVICES
Cahya Mata Sarawak Bhd 7,700 24,409 18,095 0.40
Petronas Chemicals Group Bhd 20,500 179,111 142,065 3.16
Sunway Bhd 50,000 83,115 82,500 1.83
286,635 242,660 5.39

68
5 INVESTMENTS (CONTINUED)
RHB GoldenLife 2020 (continued)
Investments as at 31 August 2019 are as follows: (continued)
Name of Counter Quantity Cost
Fair
value
% of net
asset value
RM RM %
QUOTED INVESTMENTS
(CONTINUED)
MAIN MARKET
TELECOMMUNICATIONS
& MEDIA
Axiata Group Bhd 28,224 146,036 142,531 3.16
TRANSPORTATION &
LOGISTICS
Bintulu Port Holdings Bhd 9,500 40,280 37,145 0.82
Malaysia Airports Holdings
Bhd 10,000 87,019 82,300 1.83
127,299 119,445 2.65
Utilities
Malakoff Corp Bhd 100,000 86,800 87,500 1.94
Tenaga Nasional Bhd 11,700 165,770 163,332 3.63
252,570 250,832 5.57
TOTAL QUOTED
INVESTMENTS
2,027,561 1,902,780 42.25
COLLECTIVE
INVESTMENT SCHEMES
Axis Real Estate Investment
Trust 37,000 64,525 70,300 1.56
Sunway Real Estate Investment
Trust 70,000 133,380 136,500 3.03
TOTAL COLLECTIVE
INVESTMENT SCHEMES
197,905 206,800 4.59

69
5 INVESTMENTS (CONTINUED)
RHB GoldenLife 2020 (continued)
Investments as at 31 August 2019 are as follows: (continued)
Name of Counter
Nominal
value Cost Fair value
% of net
asset value RM RM %
UNQUOTED FIXED
INCOME SECURITIES
5.00% ACSB IMTN
21/11/2019 AA-IS 130,000 131,834 132,024 2.93
4.92% Aquasar Capital Sdn
Bhd 18/07/2023 AAA(S) 300,000 303,485 317,516 7.05
2.50% Bright Focus Bhd IMTN
24/01/2030 BB1 300,000 216,276 135,183 3.00
6.40% Maju Expressway Sdn
Bhd 28/04/2034 AA-IS 500,000 522,403 603,014 13.39
4.53% Perbadanan Tabung
Pendidikan Tinggi National
27/08/2026 400,000 400,248 428,664 9.52
6.15% Tanjung Bin Energy
Issuer Berhad 15/09/2031
AA3 500,000 544,977 612,789 13.61
TOTAL UNQUOTED
FIXED INCOME SECURITIES 2,119,223 2,229,190 49.50
TOTAL INVESTMENTS 4,344,689 4,338,770 96.34

70
5 INVESTMENTS (CONTINUED)
RHB GoldenLife 2020 (continued)
Investments as at 28 February 2019 are as follows:
Name of Counter Quantity Cost Fair value
% of net
asset value
RM RM %
QUOTED INVESTMENTS
MAIN MARKET
CONSTRUCTION
IJM Corp Bhd 40,000 72,356 72,000 1.57
CONSUMER PRODUCTS
Ajinomoto (M) Bhd 6,800 160,069 126,752 2.76
British American Tobacco
(Malaysia) Bhd 3,000 85,466 101,100 2.20
Genting Bhd 6,000 39,360 44,220 0.96
284,895 272,072 5.92
ENERGY
Dialog Group Bhd 24,000 74,374 77,520 1.69
FINANCE
Alliance Bank Malaysia Bhd 13,000 54,729 51,480 1.12
CIMB Group Holdings Bhd 24,974 160,727 146,098 3.18
Malayan Banking Bhd 36,000 371,040 343,080 7.46
Public Bank Bhd 10,000 236,240 250,000 5.44
822,736 790,658 17.20
HEALTHCARE
Hartalega Holdings Bhd 10,000 59,470 50,000 1.09
INDUSTRIAL PRODUCTS &
SERVICES
Petronas Chemical Group Bhd 17,500 155,500 161,350 3.51
P.I.E. Industrial Bhd 36,000 79,225 58,320 1.27
Rohas Technic Bhd 22,700 33,058 13,733 0.30
267,783 233,403 5.08

71
5 INVESTMENTS (CONTINUED)
RHB GoldenLife 2020 (continued)
Investments as at 28 February 2019 are as follows: (continued)
Name of Counter Quantity Cost Fair value
% of net
asset value
RM RM %
QUOTED INVESTMENTS (CONTINUED)
MAIN MARKET (CONTINUED)
TECHNOLOGY
Elsoft Research Bhd 31,200 35,065 32,136 0.70
TELECOMMUNICATIONS &
MEDIA
Astro Malaysia Holdings
Bhd 38,000 60,477 62,320 1.35
Axiata Group Bhd 25,724 137,139 107,012 2.33
DiGi.Com Bhd 8,000 36,402 36,400 0.79
234,018 205,732 4.47
TRANSPORTATION &
LOGISTICS
MMC Corp Bhd 50,000 56,775 53,500 1.16
UTILITIES
Malakoff Corp Bhd 60,000 58,791 53,400 1.16
Tenaga Nasional Bhd 15,700 222,444 210,694 4.58
281,235 264,094 5.74
TOTAL QUOTED
INVESTMENTS
2,188,707
2,051,115
44.62

72
5 INVESTMENTS (CONTINUED)
RHB GoldenLife 2020 (continued)
Investments as at 28 February 2019 are as follows: (continued)
Name of Counter
Nominal
value Cost Fair value
% of net
asset value
RM RM %
UNQUOTED FIXED
INCOME SECURITIES
5.00% Alpha Circle Sdn
Bhd 21/11/2019 AA-
130,000
131,781
131,943
2.87
4.92% Aquasar Capital
Sdn Bhd
18/07/2023 AAA
300,000
303,562
310,263
6.75
2.50% Bright Focus Bhd
IMTN 24/01/2030 A1
300,000
213,333
199,499
4.34
6.40% Maju Expressway
Sdn Bhd 28/04/2034 AA-
500,000
522,469
569,449
12.39
4.53% Perbadanan
Tabung Pendidikan
Tinggi Nasional
27/08/2026 NR
400,000
400,099
409,827
8.91
6.15% Tanjung Bin
Energy Issuer Bhd
15/09/2031 AA3
500,000
545,649
581,972
12.66
TOTAL UNQUOTED
FIXED INCOME SECURITIES
2,116,893
2,202,953
47.92
TOTAL
INVESTMENTS 4,305,600 4,254,068 92.54

73
5 INVESTMENTS (CONTINUED)
RHB GoldenLife 2030
Investments as at 31 August 2019 are as follows:
Name of Counter Quantity Cost Fair value
% of net
asset value
RM RM %
QUOTED INVESTMENTS
MAIN MARKET
CONSTRUCTION
Gabungan AQRS Bhd 18,360 25,725 22,583 0.58
CONSUMER PRODUCTS &
SERVICES
Bermaz Auto Bhd 30,000 81,270 68,400 1.76
Carlsberg Brewery Malaysia Bhd 3,500 89,148 90,650 2.32
Heineken Malaysia Bhd 4,000 91,898 98,000 2.52
Mynews Holdings Bhd 30,000 44,400 41,400 1.06
Petronas Dagangan Bhd 3,500 82,228 80,080 2.06
PPB Group Bhd 4,500 83,880 83,970 2.16
QL Resources Bhd 13,000 89,159 90,220 2.32
561,983 552,720 14.20
ENERGY
Dialog Group Bhd 50,000 149,318 174,000 4.47
Hibiscus Petroleum Bhd 73,400 77,914 66,427 1.71
Serba Dinamik Holdings Bhd 30,000 122,277 132,000 3.39
349,509 372,427 9.57
FINANCIAL SERVICES
Alliance Bank Malaysia Bhd 16,300 68,407 48,900 1.25
AMMB Holdings Bhd 20,000 84,866 84,000 2.16
BIMB Holdings Bhd 14,500 66,698 58,725 1.51
CIMB Group Holdings Bhd 15,789 106,054 79,892 2.05
Hong Leong Bank Bhd 3,500 66,360 58,100 1.49
Malayan Banking Bhd 25,600 244,487 222,464 5.72
Public Bank Bhd 9,300 212,204 188,976 4.86
849,076 741,057 19.04

74
5 INVESTMENTS (CONTINUED)
RHB GoldenLife 2030 (continued)
Investments as at 31 August 2019 are as follows: (continued)
Name of Counter Quantity Cost
Fair
value
% of net
asset value
RM RM %
QUOTED INVESTMENTS
(CONTINUED)
MAIN MARKET
HEALTH CARE
KPJ Healthcare Bhd 64,000 72,230 58,240 1.50
INDUSTRIAL PRODUCTS &
SERVICES
Cahya Mata Sarawak Bhd 11,000 33,863 25,850 0.66
HSS Engineers Bhd 60,000 70,170 48,300 1.24
Petronas Chemicals Group Bhd 30,550 257,701 211,712 5.44
Scientex Bhd 6,000 51,540 50,040 1.29
Sunway Bhd 50,000 83,000 82,500 2.12
496,274 418,402 10.75
TECHNOLOGY
Inari Amertron Bhd 48,400 91,627 78,892 2.03
TELECOMMUNICATIONS &
MEDIA
Axiata Group Bhd 27,926 147,660 141,026 3.62

75
5 INVESTMENTS (CONTINUED)
RHB GoldenLife 2030 (continued)
Investments as at 31 August 2019 are as follows: (continued)
Name of Counter Quantity Cost Fair value
% of net
asset value
RM RM %
QUOTED INVESTMENTS
(CONTINUED)
MAIN MARKET
TRANSPORTATION &
LOGISTICS
Bintulu Port Holdings Bhd 8,500 36,040 33,235 0.85
Malaysia Airports Holdings Bhd 10,000 87,019 82,300 2.12
123,059 115,535 2.97
TSR / WARRANTS / CALL
WARRANTS
Gabungan AQRS Bhd 4,500 - 1,755 0.05
UTILITIES
Malakoff Corp Bhd 95,000 82,650 83,125 2.14
Taliworks Corp Bhd 100,000 93,880 89,000 2.29
Tenaga Nasional Bhd 16,200 236,959 226,152 5.81
413,489 398,277 10.24
TOTAL QUOTED
INVESTMENTS
3,130,632 2,900,914 74.55
COLLECTIVE INVESTMENT
SCHEMES
Axis Real Estate Investment Trust 51,000 88,799 96,900 2.49
Sunway Real Estate Investment
Trust 90,000 172,332 175,500 4.51
TOTAL COLLECTIVE
INVESTMENT SCHEMES 261,131 272,400 7.00

76
5 INVESTMENTS (CONTINUED)
RHB GoldenLife 2030 (continued)
Investments as at 31 August 2019 are as follows: (continued)
Name of Counter
Nominal
value Cost Fair value
% of net
asset value RM RM %
UNQUOTED FIXED
INCOME SECURITIES
7.10% BGSM Management
Sdn Bhd 28/12/2022 AA3 30,000 32,346 33,424 0.86
2.50% Bright Focus Bhd
IMTN 24/01/2030 BB1 60,000 43,280 27,037 0.70
2.50% Bright Focus Bhd
IMTN 22/01/2031 BB1 320,000 223,220 133,536 3.43
6.40% Maju Expressway Sdn
Bhd 28/04/2034 AA-IS 144,000 150,446 173,668 4.46
5.45% SPG IMTN 31/10/2033
AA-IS 100,000 101,852 114,807 2.95
TOTAL UNQUOTED FIXED
INCOME SECURITIES
551,144 482,472 12.40
TOTAL INVESTMENTS 3,942,907 3,655,786 93.95

77
5 INVESTMENTS (CONTINUED)
RHB GoldenLife 2030 (continued)
Investments as at 28 February 2019 are as follows:
Name of Counter Quantity Cost Fair value
% of net
asset value
RM RM %
QUOTED INVESTMENTS
MAIN MARKET
CONSTRUCTION
Gabungan AQRS Bhd 18,000 25,725 19,800 0.48
IJM Corp Bhd 32,000 57,668 57,600 1.40
83,393 77,400 1.88
CONSUMER PRODUCTS &
SERVICES
Ajinomoto (M) Bhd 1,900 18,408 35,416 0.86
British American Tobacco
(Malaysia) Bhd
4,000
120,342
134,800
3.28
DRB-Hicom Bhd 41,000 93,156 75,850 1.85
Genting Bhd 8,000 52,480 58,960 1.44
Kawan Food Bhd 15,000 29,055 24,750 0.60
Lii Hen Industries Bhd 26,000 71,550 73,580 1.79
Mynews Holdings Bhd 30,000 44,400 40,800 0.99
Padini Holdings Bhd 14,300 75,338 55,055 1.34
Sime Darby Berhad 22,000 57,200 47,740 1.16
561,929 546,951 13.31
ENERGY
Dialog Group Bhd 50,000 149,318 161,500 3.94
FINANCE
Alliance Bank Malaysia Bhd 27,300 114,571 108,108 2.63
AMMB Holdings Bhd 11,000 43,052 49,170 1.20
CIMB Group Holdings Bhd 30,744 207,823 179,853 4.38
Malayan Banking Bhd 38,100 371,407 363,093 8.85
Public Bank Bhd 15,700 354,396 392,500 9.57
1,091,249 1,092,724 26.63

78
5 INVESTMENTS (CONTINUED)
RHB GoldenLife 2030 (continued)
Investments as at 28 February 2019 are as follows: (continued)
Name of Counter Quantity Cost Fair value
% of net
asset value
RM RM %
QUOTED INVESTMENTS (CONTINUED)
MAIN MARKET (CONTINUED)
HEALTHCARE
Hartalega Holdings Bhd 9,000 54,095 45,000 1.10
Kossan Rubber Industries Bhd 22,500 96,999 87,300 2.13
KPJ Healthcare Bhd 64,000 72,230 64,640 1.58
223,324 196,940 4.81
INDUSTRIAL PRODUCTS &
SERVICES
Kelington Group Bhd 40,000 48,400 49,200 1.20
Petronas Chemicals Group Bhd 21,550 177,339 198,691 4.84
P.I.E. Industrial Bhd 30,000 67,096 48,600 1.18
Press Metal Aluminium
Holdings Bhd
12,000
53,386
50,760
1.24
Uchi Technologies Bhd 18,000 47,237 50,760 1.24
393,458 398,011 9.70
TECHNOLOGY
Elsoft Research Bhd 34,320 42,278 35,350 0.86
Inari Amertron Bhd 26,400 57,088 41,448 1.01
99,366 76,798 1.87
TELECOMMUNICATIONS
& MEDIA
Axiata Group Bhd 32,926 178,498 136,972 3.34
DiGi.Com Bhd 21,000 97,387 95,550 2.33
275,885 232,522 5.67
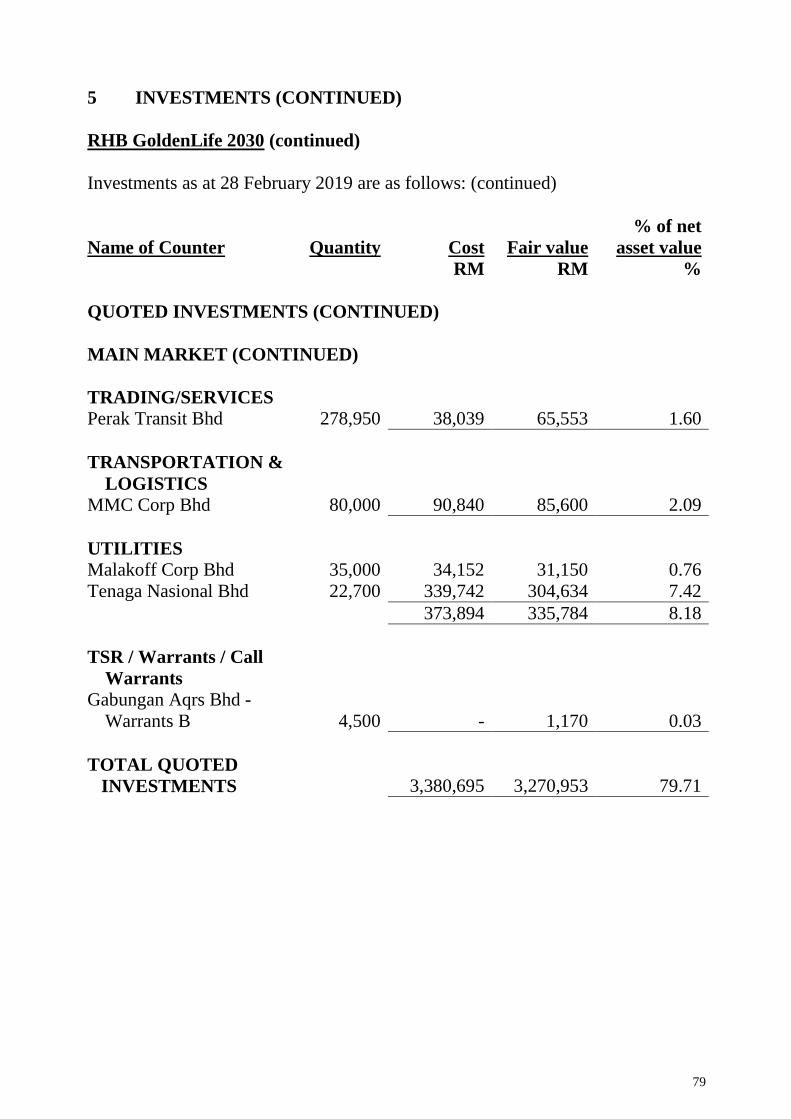
79
5 INVESTMENTS (CONTINUED)
RHB GoldenLife 2030 (continued)
Investments as at 28 February 2019 are as follows: (continued)
Name of Counter Quantity Cost Fair value
% of net
asset value
RM RM %
QUOTED INVESTMENTS (CONTINUED)
MAIN MARKET (CONTINUED)
TRADING/SERVICES
Perak Transit Bhd 278,950 38,039 65,553 1.60
TRANSPORTATION &
LOGISTICS
MMC Corp Bhd 80,000 90,840 85,600 2.09
UTILITIES
Malakoff Corp Bhd 35,000 34,152 31,150 0.76
Tenaga Nasional Bhd 22,700 339,742 304,634 7.42
373,894 335,784 8.18
TSR / Warrants / Call
Warrants
Gabungan Aqrs Bhd -
Warrants B
4,500
-
1,170
0.03
TOTAL QUOTED
INVESTMENTS
3,380,695
3,270,953
79.71

80
5 INVESTMENTS (CONTINUED)
RHB GoldenLife 2030 (continued)
Investments as at 28 February 2019 are as follows: (continued)
Name of Counter
Nominal
value Cost Fair value
% of net
asset value
RM RM %
UNQUOTED FIXED
INCOME SECURITIES
7.10% BGSM
Management Sdn Bhd
28/12/2022 AA3
30,000
32,607
33,215
0.81
2.50% Bright Focus Bhd
IMTN 24/01/2030 A1
60,000
42,692
39,900
0.97
2.50% Bright Focus Bhd
IMTN 22/01/2031 A1
320,000
220,230
203,531
4.96
6.40% Maju Expressway
Sdn Bhd 28/04/2034 AA- 144,000
150,465
164,001
4.00
5.45% SPG IMTN
31/10/2033 AA-
100,000
101,807
108,450
2.64
TOTAL UNQUOTED
FIXED INCOME SECURITIES
547,801
549,097
13.38
TOTAL
INVESTMENTS 3,928,496 3,820,050 93.09

81
6 CASH AND CASH EQUIVALENTS
Cash and cash equivalents comprise:
31.08.2019
RHB RHB RHB
GoldenLife GoldenLife GoldenLife
Today 2020 2030
RM RM RM
Deposits with licensed
financial institutions 772,630 132,032 204,282
Bank balances 50,060 51,736 51,902 ──────── ──────── ────────
822,690 183,768 256,184 ════════ ════════ ════════
28.02.2019
RHB RHB RHB
GoldenLife GoldenLife GoldenLife
Today 2020 2030
RM RM RM
Deposits with licensed
financial institutions 1,044,168 410,208 389,511
Bank balances 3,783 13,858 2,588 ──────── ──────── ────────
1,047,951 424,066 392,099 ════════ ════════ ════════
7 UNITS IN CIRCULATION
RHB GoldenLife Today
31.08.2019 28.02.2019
Units Units
At the beginning of the financial period/year 19,971,566 22,107,000
Creation of units during the financial period/year:
Arising from distribution - 902,566
Arising from applications 158,000 253,000
Cancellation of units during the
financial period/year (847,000) (3,291,000) ──────── ──────── At the end of the financial period/year 19,282,566 19,971,566 ════════ ════════

82
7 UNITS IN CIRCULATION (CONTINUED)
RHB GoldenLife 2020
31.08.2019 28.02.2019
Units Units
At the beginning of the financial period/year 9,107,605 10,516,000
Creation of units during the financial period/year:
Arising from distribution - 500,605
Arising from applications 12,000 630,000
Cancellation of units during
the financial period/year (186,000) (2,539,000) ──────── ──────── At the end of the financial period/year 8,933,605 9,107,605 ════════ ════════
RHB GoldenLife 2030
31.08.2019 28.02.2019
Units Units
At the beginning of the financial period/year 6,806,109 7,232,000
Creation of units during the financial period/year:
Arising from distribution - 252,109
Arising from applications 25,000 239,000
Cancellation of units during
the financial period/year (162,000) (917,000) ──────── ──────── At the end of the financial period/year 6,669,109 6,806,109 ════════ ════════

83
8 MANAGEMENT FEE
In accordance with the Prospectus, the management fee provided in the financial
statements is 1.25% (01.03.2018-31.08.2018: 1.25%) per annum for RHB
GoldenLife Today and 1.50% (01.03.2018-31.08.2018: 1.50%) per annum for RHB
GoldenLife 2020 and RHB GoldenLife 2030 based on the net asset value of the
Fund, calculated on a daily basis for the financial period.
9 TRUSTEE’S FEE
In accordance with the Prospectus, the Trustee’s fee provided in the financial
statements is 0.06% (01.03.2018-31.08.2018: 0.06%) per annum based on the net
asset value of the Funds, calculated on a daily basis for the financial period.
10 TAXATION
(a) Tax charge for the financial period
01.03.2019 to 31.08.2019
RHB RHB RHB
GoldenLife GoldenLife GoldenLife
Today 2020 2030
RM RM RM
Current taxation - - -
Over provision of tax in prior year - (929) - ──────── ──────── ────────
- (929) - ════════ ════════ ════════
01.03.2018 to 31.08.2018
RHB RHB RHB
GoldenLife GoldenLife GoldenLife
Today 2020 2030
RM RM RM
Current taxation - - - ════════ ════════ ════════
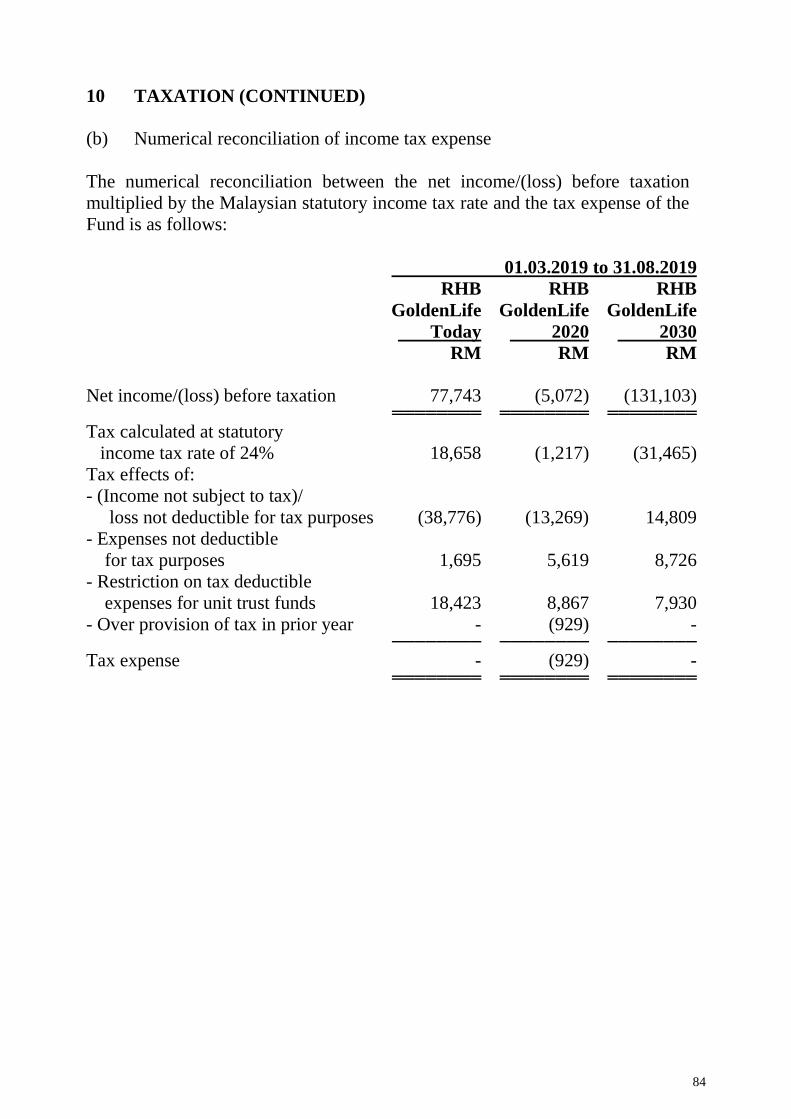
84
10 TAXATION (CONTINUED)
(b) Numerical reconciliation of income tax expense
The numerical reconciliation between the net income/(loss) before taxation
multiplied by the Malaysian statutory income tax rate and the tax expense of the
Fund is as follows:
01.03.2019 to 31.08.2019
RHB RHB RHB
GoldenLife GoldenLife GoldenLife
Today 2020 2030
RM RM RM
Net income/(loss) before taxation 77,743 (5,072) (131,103) ════════ ════════ ════════
Tax calculated at statutory
income tax rate of 24% 18,658 (1,217) (31,465)
Tax effects of:
- (Income not subject to tax)/
loss not deductible for tax purposes (38,776) (13,269) 14,809
- Expenses not deductible
for tax purposes 1,695 5,619 8,726
- Restriction on tax deductible
expenses for unit trust funds 18,423 8,867 7,930
- Over provision of tax in prior year - (929) - ──────── ──────── ────────
Tax expense - (929) - ════════ ════════ ════════

85
10 TAXATION (CONTINUED)
(b) Numerical reconciliation of income tax expense (continued)
The numerical reconciliation between the net income/(loss) before taxation
multiplied by the Malaysian statutory income tax rate and the tax expense of the
Fund is as follows: (continued)
01.03.2018 to 31.08.2018
RHB RHB RHB
GoldenLife GoldenLife GoldenLife
Today 2020 2030
RM RM RM
Net income/(loss) before taxation 76,811 (362,826) (300,939) ════════ ════════ ════════
Tax calculated at statutory
income tax rate of 24% 18,435 (87,078) (72,225)
Tax effects of:
- (Income not subject to tax)/
loss not deductible for tax purposes (42,861) 71,442 54,752
- Expenses not deductible
for tax purposes 3,342 4,982 7,532
- Restriction on tax deductible
expenses for unit trust funds 21,084 10,654 9,941 ──────── ──────── ────────
Tax expense - - - ════════ ════════ ════════

86
11 MANAGEMENT EXPENSE RATIO (“MER”)
01.03.2019 to 31.08.2019
RHB RHB RHB
GoldenLife GoldenLife GoldenLife
Today 2020 2030
MER (%) 0.71 0.92 0.95 ════════ ════════ ════════
01.03.2018 to 31.08.2018
RHB RHB RHB
GoldenLife GoldenLife GoldenLife
Today 2020 2030
MER (%) 0.73 0.99 1.02 ════════ ════════ ════════
The MER ratio is calculated based on total expenses excluding investment
transaction related costs of the Fund to the average net asset value of the Fund
calculated on a daily basis.
12 PORTFOLIO TURNOVER RATIO (“PTR”)
01.03.2019 to 31.08.2019
RHB RHB RHB
GoldenLife GoldenLife GoldenLife
Today 2020 2030
PTR (times) - 0.51 0.92 ════════ ════════ ════════
01.03.2018 to 31.08.2018
RHB RHB RHB
GoldenLife GoldenLife GoldenLife
Today 2020 2030
PTR (times) 0.17 0.50 0.75 ════════ ════════ ════════
The PTR ratio is calculated based on average of acquisition and disposals of the
Fund for the financial period to the average net asset value of the Fund calculated
on a daily basis.

87
13 UNITS HELD BY THE MANAGER AND PARTIES RELATED TO
THE MANAGER
The number of units held by the Manager is as follows:
31.08.2019 28.02.2019
Units RM Units RM
The Manager
RHB GoldenLife Today 5,765 3,471 5,062 3,028
RHB GoldenLife 2020 5,030 2,536 5,007 2,527
RHB GoldenLife 2030 5,910 3,448 5,383 3,245 ═══════ ═══════ ══════ ══════
The units are held beneficially by the Manager for booking purposes. The
Manager is of the opinion that all transactions with the related parties have been
entered into in the normal course of business at agreed terms between the related
parties.
Other than the above, there were no units held by Directors or parties related to the
Manager.
The holding company and the ultimate holding company of the Manager is RHB
Investment Bank Berhad and RHB Bank Berhad respectively. The Manager treats
RHB Bank Berhad group of companies including RHB Investment Bank Berhad
and its subsidiaries as related parties.

88
14 TRANSACTIONS BY THE FUND
RHB GoldenLife Today
Details of transactions by the Fund for the financial period ended 31 August 2019
are as follows:
Details of transactions by the Fund for the financial year ended 28 February 2019
are as follows:
Brokers/
financial institutions
Value of
trades
Percentage
of total
trades
Brokerage
fees
Percentage
of total
brokerage
fees
RM % RM %
Credit Suisse
Securities (Malaysia)
Sdn Bhd 22,610 50.31 45 16.84
RHB Investment
Bank Bhd* 22,330 49.69 224 83.16
44,940 100.00 269 100.00
Brokers/
financial institutions
Value of
trades
Percentage
of total
trades
Brokerage
fees
Percentage
of total
brokerage
fees
RM % RM %
Affin Hwang
Investment Bank Bhd 2,380,070 46.29 - -
RHB Investment
Bank Bhd* 1,062,351 20.66 2,801 47.01
Alliance Bank Bhd 523,750 10.18 - -
Maybank Investment
Bank Bhd 491,451 9.56 1,474 24.74
CIMB Investment
Bank Bhd 314,761 6.12 944 15.85
Public Investment
Bank Bhd 209,630 4.08 419 7.03
Alliance Investment
Bank Bhd 160,002 3.11 320 5.37
5,142,015 100.00 5,958 100.00

89
14 TRANSACTIONS BY THE FUND (CONTINUED)
RHB GoldenLife 2020
Details of transactions by the Fund for the financial period ended 31 August 2019
as follows:
Brokers/
financial institutions
Value of
trades
Percentage
of total
trades
Brokerage
fees
Percentage
of total
brokerage
fees
RM % RM %
RHB Investment Bank
Berhad* 1,533,108 34.35 4,779 38.37
Macquarie Capital
Securities (Malaysia)
Sdn Bhd 724,293 16.23 1,449 11.63
Maybank Investment
Bank Berhad 695,048 15.57 2,085 16.74
CIMB Investment
Bank berhad 484,466 10.85 1,453 11.67
Affin Hwang
Investment Bank
Berhad 358,737 8.04 1,076 8.64
KAF-Seagroatt &
Campbell Securities
Sdn Bhd 278,180 6.23 835 6.70
Credit Suisse
Securities (Malaysia)
Sdn Bhd 203,399 4.56 407 3.26
CLSA Securities
Malaysia Sdn Bhd 185,996 4.17 372 2.99
4,463,227 100.00 12,456 100.00

90
14 TRANSACTIONS BY THE FUND (CONTINUED)
RHB GoldenLife 2020 (continued)
Details of transactions by the Fund for the financial year ended 28 February 2019
as follows:
Brokers/
financial institutions
Value of
trades
Percentage
of total
trades
Brokerage
fees
Percentage
of total
brokerage
fees
RM % RM %
RHB Investment Bank
Bhd* 1,971,448
38.89 4,968
42.25
CIMB Investment
Bank Bhd 680,127
13.42 2,145
18.24
Affin Hwang
Investment Bank Bhd 550,160
10.86
- -
Maybank Investment
Bank Bhd 477,375
9.42 1,575
13.40
Kenanga Investment
Bank Bhd 447,053
8.82 894
7.60
Alliance Investment
Bank Bhd 343,918
6.79 688
5.85
MIDF Amanah
Investment Bank Bhd 277,035
5.47 673
5.72
Public Investment
Bank Bhd 118,969
2.35 242
2.06
Macquarie Capital
Securities (Malaysia)
Sdn Bhd 72,731
1.43 187
1.59
Hong Leong Investment
Bank Bhd 39,117
0.77 78
0.66
Others 90,295 1.78 309 2.63
5,068,228 100.00 11,759 100.00

91
14 TRANSACTIONS BY THE FUND (CONTINUED)
RHB GoldenLife 2030
Details of transactions by the Fund for the financial period ended 31 August 2019
are as follows:
Brokers/
financial institutions
Value of
trades
Percentage
of total
trades
Brokerage
fees
Percentage
of total
brokerage
fees
RM % RM %
RHB Investment Bank
Bhd* 3,160,614 42.80 9,709 44.58
CIMB Investment
Bank Bhd 1,613,906 21.86 4,842 22.23
Maybank Investment
Bank Bhd 1,168,551 15.83 3,506 16.10
KAF-Seagroatt &
Campbell Securities
Sdn Bhd 427,886 5.79 1,283 5.89
Affin Hwang
Investment Bank
Berhad 413,412 5.60 1,240 5.70
Credit Suisse
Securities (Malaysia)
Sdn Bhd 251,909 3.41 504 2.31
JPMorgan Securities
(Malaysia) Sdn Bhd 181,046 2.45 362 1.66
Macquarie Capital
Securities (Malaysia)
Sdn Bhd 166,508 2.26 333 1.53
7,383,832 100.00 21,779 100.00

92
14 TRANSACTIONS BY THE FUND (CONTINUED)
RHB GoldenLife 2030 (continued)
Details of transactions by the Fund for the financial year ended 28 February 2019
are as follows:
* Included in transactions by the Fund are trades with the holding company of
the Manager, RHB Investment Bank Berhad. The Manager is of the opinion
that all transactions with the related company have been entered into in the
normal course of business at agreed terms between the related parties.
Brokers/
financial institutions
Value of
trades
Percentage
of total
trades
Brokerage
fees
Percentage
of total
brokerage
fees
RM % RM %
RHB Investment Bank
Bhd*
3,013,330
40.09
8,358
42.80
CIMB Investment
Bank Bhd
1,643,492
21.87
4,664
23.89
Maybank Investment
Bank Bhd
862,565
11.48
2,172
11.12
MIDF Amanah
Investment Bank Bhd
380,666
5.06
889
4.55
Affin Hwang
Investment Bank Bhd
358,141
4.77
742
3.80
Kenanga Investment
Bank Bhd
352,030
4.68
745
3.82
Alliance Investment
Bank Bhd
277,121
3.69
612
3.13
Macquarie Capital
Securities (Malaysia)
Sdn Bhd
227,872
3.03
493
2.52
KAF-Seagroatt &
Campbell Securities
Sdn Bhd
174,691
2.32
359
1.84
Credit Suisse
Securities (Malaysia)
Sdn Bhd
104,747
1.39
212
1.09
Others 121,331 1.62 280 1.44
7,515,986 100.00 19,526 100.00

93
15 FINANCIAL INSTRUMENTS BY CATEGORIES
31.08.2019
RHB RHB RHB
GoldenLife GoldenLife GoldenLife
Today 2020 2030
RM
RM RM
Financial assets
Financial assets at fair value
through profit or loss (‘FVTPL’)
• Collective investment schemes - 206,800 272,400
• Quoted investments 1,586,402 1,902,780 2,900,914
• Unquoted fixed income
securities
9,230,404 2,229,190
482,472
Financial assets at amortised cost
• Deposit with licensed financial
institutions
772,630 132,032
204,282
• Bank balances 50,060 51,735 51,902
• Dividend receivable 4,440 6,621 9,427
11,643,936 4,529,158 3,921,397
Financial liabilities
Financial liabilities at
amortised cost
• Amount due to Manager 7,827 7,029 12,837
• Accrued management fee 12,310 5,698 4,960
• Amount due to Trustee 591
228 198
• Other payables and accruals 12,609 12,567 12,600
33,337 25,522 30,595

94
15 FINANCIAL INSTRUMENTS BY CATEGORIES (CONTINUED)
28.02.2019
RHB RHB RHB
GoldenLife GoldenLife GoldenLife
Today 2020 2030
RM
RM RM
Financial assets
Financial assets at fair value
through profit or loss (‘FVTPL’)
• Quoted investments 1,715,657 2,051,115 3,270,953
• Unquoted fixed income
securities
9,207,745 2,202,953
549,097
Financial assets at amortised cost
• Deposit with licensed financial
institutions
1,044,168 410,208
389,511
• Bank balances 3,783 13,858 2,588
• Dividend receivable 144 384 1,008
11,971,497 4,678,518 4,213,157
Financial liabilities
Financial liabilities at
amortised cost
• Amount due to stockbrokers - 57,019 91,231
• Amount due to Manager - 6,078 -
• Accrued management fee 11,433 5,595 4,727
• Amount due to Trustee 549
224 189
• Other payables and accruals 13,566 13,496 13,515
25,548 82,412 109,662

95
16 SEGMENT INFORMATION
The Investment & Security Selection Committee of the Manager recommends
strategic resource allocations of the Fund to the Investment Committee of the
Manager (collectively referred to as “Committee”).
The internal reporting provided to the Committee for the Fund’s assets, liabilities
and performance is prepared on a consistent basis with the measurement and
recognition principles of MFRS and IFRS. The Committee considers the business
from both a geographic and investment perspective. Geographically, the Committee
considers the performance of investment in overall basis.
The reportable operating segments derive their income by seeking investments to
achieve investments objective commensurate with an acceptable level of risk within
each portfolio. These returns consist of interest, dividends and gains on the
appreciation in the value of investments which are derived from Malaysia.
There were no changes in the reportable segments during the financial period.

96
STATEMENT BY MANAGER
We, Sharifatu Laila Syed Ali and Ong Yin Suen, two of the Directors of RHB
Asset Management Sdn Bhd, do hereby state that in the opinion of the Directors
of the Manager, the accompanying unaudited statements of financial position,
unaudited statements of income and expenses, unaudited statements of changes in
net asset value, unaudited statements of cash flows and the accompanying notes,
are drawn up in accordance with Malaysian Financial Reporting Standards and
International Financial Reporting Standards so as to give a true and fair view of
the financial position of the Fund as of 31 August 2019 and of its financial
performance and cash flows for the financial period then ended and comply with
the provisions of the Deeds.
On behalf of the Manager
SHARIFATU LAILA SYED ALI ONG YIN SUEN
Director Director
22 October 2019

97
TRUSTEE’S REPORT TO THE UNITHOLDERS OF
RHB GOLDENLIFE FUNDS
We have acted as Trustee of RHB GoldenLife Funds (“the Fund”) for the
financial period ended 31 August 2019. To the best of our knowledge, RHB Asset
Management Sdn Bhd (“the Management Company”), has operated and managed
the Fund in accordance with the following:
(a) limitations imposed on the investment powers of the Management Company
and the Trustee under the Deeds, the Securities Commission’s Guidelines on
Unit Trust Funds, the Capital Markets and Services Act 2007 and other
applicable laws;
(b) valuation/pricing is carried out in accordance with the Deeds and any
regulatory requirements; and
(c) creation and cancellation of units are carried out in accordance with the
Deeds and any regulatory requirements.
For HSBC (Malaysia) Trustee Berhad
Tan Bee Nie
Manager, Investment Compliance Monitoring
Kuala Lumpur
22 October 2019

98
CORPORATE INFORMATION
MANAGER
RHB Asset Management Sdn Bhd
REGISTERED OFFICE
Level 10, Tower One, RHB Centre, Jalan Tun Razak, 50400 Kuala Lumpur
PRINCIPAL AND BUSINESS OFFICE
Level 8, Tower Two & Three, RHB Centre, Jalan Tun Razak, 50400 Kuala Lumpur
Email address: [email protected]
Tel: 03-9205 8000
Fax: 03-9205 8100
Website: www.rhbgroup.com
BOARD OF DIRECTORS Mr Yap Chee Meng (Independent Non-Executive Chairman)
Mr Chin Yoong Kheong (Senior Independent Non-Executive Director)
Dr. Ngo Get Ping (Independent Non-Executive Director)
Puan Sharifatu Laila Syed Ali (Independent Non-Executive Chairman)
Ms Ong Yin Suen (Managing Director/Chief Executive Officer)
INVESTMENT COMMITTEE MEMBERS Mr Yap Chee Meng (Independent Chairman)
YBhg Dato’ Darawati Hussain
Puan Sharifatu Laila Syed Ali
CHIEF EXECUTIVE OFFICER Ms Ong Yin Suen
SECRETARY
Encik Azman Shah Md Yaman (LS No. 0006901)

99
BRANCH OFFICE Kuala Lumpur Office B-9-6, Megan Avenue 1
No. 189, Jalan Tun Razak
50400 Kuala Lumpur
Tel: 03-2171 2755/ 03-2166 7011
Fax: 03-2770 0022
Sri Petaling Office Level 1 & 2, No 53 Jalan Radin Tengah
Bandar Baru Seri Petaling
57000 Kuala Lumpur
Tel: 03-9054 2470 Fax: 03-9054 0934
Batu Pahat Office 53, 53-A and 53-B Jalan Sultanah
83000 Batu Pahat, Johor
Tel: 07-438 0271/ 07-438 0988
Fax: 07-438 0277
Ipoh Office No.7A, Persiaran Greentown 9,
Pusat Perdagangan Greentown,
30450 Ipoh, Perak
Tel: 05-242 4311
Fax: 05-242 4312
Johor Bahru Office No 34 Jalan Kebun Teh 1
Pusat Perdagangan Kebun Teh
80250 Johor Bahru, Johor
Tel: 07-221 0129 Fax: 07-221 0291
2nd Floor, 21 & 23
Jalan Molek 1/30, Taman Molek
81100 Johor Bahru, Johor
Tel: 07-358 3587 Fax: 07-358 3581
Kuantan Office B 32-34, 2nd Floor, Lorong Tun Ismail 8
Sri Dagangan II
25000 Kuantan, Pahang
Tel: 09-517 3611 Fax: 09-517 3612
Kuching Office Lot 133, Section 20, Sublot 2 & 3,
1st Floor, Jalan Tun Ahmad Zaidi Adruce,
93200 Kuching, Sarawak
Tel: 082-550 838 Fax: 082-550 508

100
Kuching Office Lot 172, Section 49, K.T.L.D,
Jalan Chan Chin Ann,
93100 Kuching, Sarawak
Tel: 082-245 611 Fax: 082-242 712
Kota Bharu Office Ground Floor, No 3486-G,
Jalan Sultan Ibrahim,
15050 Kota Bharu, Kelantan
Tel: 09-740 6891 Fax: 09-740 6890
Kota Kinabalu Office Lot No. C-02-04, 2nd Floor
Block C, Warisan Square
Jalan Tun Fuad Stephens,
88000 Kota Kinabalu,
Sabah
Tel: 088-528 686 Fax: 088-528 685
Melaka Office 581B, Taman Melaka Raya
75000 Melaka
Tel: 06-284 4211/ 06-281 4110
Fax: 06-292 2212
Miri Office Lot 1268 & 1269, Second Floor
Centre Point Commercial Centre
Jalan Melayu
98000 Miri, Sarawak
Tel: 085-422 788 Fax: 085- 415 243
Penang Office 3rd Floor, 44 Lebuh Pantai
10300 Georgetown, Penang
Tel: 04-264 5639 Fax: 04-264 5640
Prai Office First Floor, No. 1797-1-04,
Kompleks Auto World,
Jalan Perusahaan, Juru Interchange,
13600 Perai, Penang.
Tel: 04-506 2116/ 04-506 0216
Fax: 04-505 9996

101
TRUSTEE HSBC (Malaysia) Trustee Berhad
BANKER RHB Bank Berhad
AUDITORS PricewaterhouseCoopers PLT
TAX ADVISER PricewaterhouseCoopers Taxation Services Sdn Bhd
DISTRIBUTORS Areca Capital Sdn Bhd
CIMB Investment Bank Berhad
Genexus Advisory Sdn Bhd
Hong Leong Bank Berhad
iFast Capital Sdn Bhd
OCBC Bank (Malaysia) Berhad
Phillip Mutual Berhad
RHB Bank Berhad
RHB Investment Bank Berhad
Standard Chartered Bank (M) Berhad
Standard Financial Adviser Sdn Bhd
RHB Asset Management Unit Trust Consultants
