reward management 2014–15 - cipd · the cipd is the professional body for hr and people ......
TRANSCRIPT

ANNUAL SURVEY REPORT
RewardManagement
2014–15

The CIPD is the professional body for HR and people development. The not-for-profit organisation champions better work and working lives and has been setting the benchmark for excellence in people and organisation development for more than 100 years. It has more than 135,000 members across the world, provides thought leadership through independent research on the world of work, and offers professional training and accreditation for those working in HR and learning and development.

1 | cipd.co.uk/rewardmanagementsurvey
ContentsForeword 2
Summary of key findings 4
1 UK base and variable pay policies 8
2 Pay management and communication 19
3 Benefits and pensions 26
Conclusions and implications for reward management 32
Background to the report 35
Reward managementAnnual survey report 2014–15

2 | Reward management survey 2014–15
Foreword
Welcome to the CIPD’s thirteenth annual Reward Management survey. As ever, we try to provide you with useful insights into reward trends and developments and highlight possible implications for practice and public policy.
On a personal note, four figures stand out for me from this year’s reward management survey. The first is 19%. That’s the proportion of employers that were able to supply us with data about the spread of pay within their organisation. The rest admitted that they did not collect earnings data about the lowest median and highest-paid employees within their organisation.
One explanation for the low proportion is that while most employers do actually collect the data, they are unable to provide it in the way that we want it, namely for managerial and non-managerial staff. That said, I would have thought that providing earnings data by employee type shouldn’t have been that difficult. Similarly, employers may have the pay data but are not able to report on it in the way that we asked (we wanted total cash earnings, covering fixed and variable pay as well as any other direct cash payments).
Alternatively, the explanation is that our respondents don’t collect this information because they feel that there is no business interest or need, perhaps that they don’t know how to bring the data together from across the various parts of the organisation, or if they do know where the data is, they don’t know how to analyse and
interpret what the information is telling them in a meaningful way.
This throws up a number of concerns. The first is how easy will it be for employers to report their gender pay gap, which they will have to do from 2016? What happens if we follow practice in the USA and large firms are required to disclose the pay ratio between the c-suite and the rest of the workforce?
Secondly, it makes me question how employers are able to work out the effectiveness of their reward spend if they are unable to provide basic pay data? At a parochial level, without this and similar reward intelligence, how is the reward function going to be able to demonstrate itself as a strategic function that adds value for the business, rather than as an administrative department dealing with the day-to-day issues, most of which will end up being done by software and robots in the near future? At a strategic level, who will want to invest in a company that doesn’t have the curiosity and the ability to collect and analyse the data that’ll allow it to assess the effectiveness of its reward spend in increasing productivity?
The second figure is 41%. That is the proportion of respondents that agree that they make pay as transparent as possible, while 48% do not agree with this approach. Despite research showing the importance of pay transparency in helping employees feel that they are treated fairly, many employers (56%) prefer not to go beyond the statutory minimum when it comes to explaining their pay policy.
Our recent report on behavioural science and reward shows that transparency over pay decisions impacts on how employees regard the fairness of the process and its eventual outcome. The CIPD’s winter 2014/15 Employee Outlook: Focus on pay and pensions has found that those employees who report that their employer explained the rationale behind the outcome of the annual pay review are more satisfied with the decision than those who say that they have received no explanation.
This throws up two challenges. The first is, how can employers be transparent over organisational pay practices when they are unable to collect basic earnings data? The second is, what happens to those organisations that prefer confidentiality, when the truth will out about how they reward their employees?
It doesn’t matter how fair the actual pay deal is. Employees will not be able to judge whether their reward matches their contribution if they don’t understand why they’re being paid what they’re being paid, why others are getting what they’re getting and what they need to do to increase their earnings.
Of course, it’s not just openness per se that is important but the quality of that conversation. If employers are simply not very good at communicating to employees about their pay, it may be easier to not go beyond what is legally required. For instance, if an employer does not believe that its line managers have the skills or the willingness to communicate to

3 | cipd.co.uk/rewardmanagementsurvey
their employees what the business values and what it doesn’t, it may be simpler to centralise communication and keep it to a minimum rather than invest money in developing line management communication skills.
I’m not saying that pay transparency is simple. The reality of managing pay transparency is far from straightforward. You can’t just dump a load of pay data on people’s desks and hope they will create the appropriate narrative. For it to work, HR needs to write the organisational story that helps employees understand what’s being rewarded and recognised, why and how.
The third is 74%. That is the proportion of employers that use individual performance as a criteria to move someone through their pay band. While this is still the most popular factor used, others such as competencies, skills and market rates are not too far behind. This indicates that employers are taking into account more than what has been achieved when looking to progress someone along their pay band.
Related to this, my fourth figure is 49%. That’s the proportion that have a performance-related reward, incentive or recognition scheme, either for individual, or groups of, employees. Interestingly, this is down on the 65% that reported the same back in 2012. However, this drop hides a number of interesting developments, such as a move away from individual variable pay towards schemes where the award depends on a
mix of individual, group and/or organisational performance or the successful outcome of a specific project.
Part of this may have been the bad rap that individual bonuses and sales commission have received in the wake of the Great Recession. In the finance sector, in some instances, variable pay has been incorporated into salaries, while in others it has become less reliant on individual achievements and more on how the organisation as a whole has performed. Similarly, in the retail sector, high street stores have been looking at whether individual bonuses and sales commission still make sense as their business model adapts to online shopping.
In summary, my recommendations from this report are that employers recognise the importance of using reward data to help create value for the business as well as storytelling to create organisational meaning. In addition, as the world of work and our workforce changes, we will see more employers becoming knowledge- or innovation-based organisations. This means that we need to think about how we can better reward and recognise collaborative success. Not only that, we need an approach that is nimble and resilient enough to adapt quickly as the business and workforce context changes. I accept that this is not simple or easy and requires time and effort to achieve. However, if we are going to be successful, we need to aspire to win, rather than aspire not to come last.
‘HR needs to write the organisational story that helps employees understand what’s being rewarded and recognised, why and how.’

4 | Reward management survey 2014–15
Summary of key findings
The thirteenth annual survey of UK reward management is based on responses received from 525 organisations, across private, public and third sectors. The main aim of the research is to provide readers with a benchmarking and information resource in respect of current and emerging practice in UK reward management.
Base and variable pay policies • Half of all employers questioned
use individual arrangements or spot salaries to manage base pay. Narrow grades and pay spines remain common pay structures and there is no evidence of a move towards broad-banding (see Table 1).
• Ability to pay is considered the most important factor in determining base pay levels by nearly half of survey respondents, compared with fewer than one in ten who consider collective bargaining the most important factor.
• The most common criteria to manage individual base pay progression are individual performance, competencies and market rates.
• The top three factors determining the size of the 2014–15 pay review for all employees are: the organisation’s ability to pay, the ‘going rate’ of competitors’ pay rises and recruitment and retention issues, revealing two
opposing pressures on pay increases: financial affordability and the attraction and retention of talent.
• Just under half of organisations operate one or more performance-related reward, incentive or recognition scheme, which is less than in previous years, particularly in the private sector.
• Individual bonuses and merit pay rises are the most common individual performance-related reward schemes among organisations offering such schemes, while the most common group of performance-related plans are goal-sharing and profit-sharing.
Table 1: Summary of findings – base and variable pay policies
Reward approaches % of respondents using
Base pay structures Individual rates/ranges/spot salaries 50
Narrow graded 32
Pay spines/service-related 31
Job family 29
Broad-banded 26
Base pay determination Ability to pay 46
Market rates (with JE) 30
Market rates (without JE) 18
Collective bargaining 7
Base pay progression criteria Individual performance 74
Competencies 64
Market rates 61
Skills 60
Employee potential/value/ retention 52
Length of service 35

5 | cipd.co.uk/rewardmanagementsurvey
Pay management and communication • Table 2 shows most
organisations are positioning total cash earnings at or close to the median. However, private sector companies are more likely to position pay at the top of the market while public and voluntary sector organisations are more likely to position pay towards the lower end.
• Positioning in the upper quartile does not appear to have increased despite improved economic conditions.
• One in five organisations collect pay dispersion data (data on the spread/range of pay across the workforce).
• The ratio between the lowest median earnings for non-management employees and the highest median
earnings for management and professionals is 1:8. The widest range can be found in the public services sector.
• Most organisations favour pay confidentiality over transparency, with over half of our respondents agreeing that their organisation believes pay should be a private matter and only revealed when required by legislation.
Reward approaches % of respondents using
Base pay review factors Ability to pay 78
Going rate 46
Recruitment/retention issues 45
Inflation 41
Movement in market rates 40
Government funding/pay guidelines 30
Economic confidence 26
National Minimum Wage pressures 23
Union/staff pressures 21
Living Wage pressures 20
Shareholder views 14
Employers offering a performance-related reward scheme
49
Individual performance-related schemes
Individual bonuses 57*
Merit pay rises 51*
Combination schemes 46*
Individual non-monetary recognition awards 31*
Sales commissions 29*
Ad hoc/project-based schemes 24*
Other individual-based cash incentives 22*
Individual non-monetary incentive awards 16*
Piece rates 3*
Group performance-related schemes Goal-sharing 53+
Profit-sharing 40+
Group or team-based non-monetary recognition 30+
Gain-sharing 21+
Group or team-based non-monetary incentives 17+
*% of respondents indicating they operate an individual performance-related reward scheme.+ % of respondents indicating they operate a group performance-related reward scheme.
6 | Reward management survey 2014–15
Benefits and pensions • The most common benefits
offered to all employees are paid leave for bereavement, training and career development and a pension scheme, according to Table 3.
• Just under two-thirds of employers auto-enrol qualifying employees into a defined contribution scheme.
• The most common pension schemes open to new entrants are defined contribution, contribution to personal pension plans and defined benefit.
• On average employers contribute 5.8% of base pay to defined contribution schemes and employees contribute 4.0%.
• Just over a quarter of organisations are intending to make changes to their pensions arrangements this year; the most common intended changes are to comply with auto-enrolment requirements and introduce salary sacrifice.
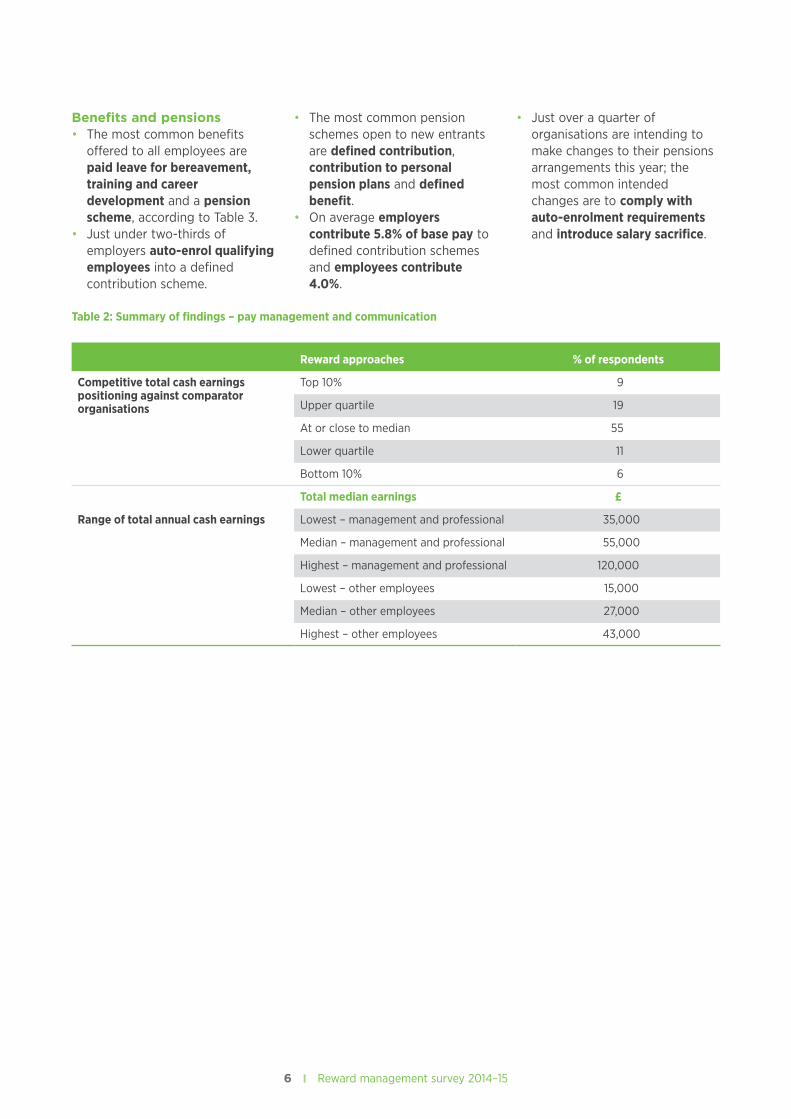
Table 2: Summary of findings – pay management and communication
Reward approaches % of respondents
Competitive total cash earnings positioning against comparator organisations
Top 10% 9
Upper quartile 19
At or close to median 55
Lower quartile 11
Bottom 10% 6
Total median earnings £
Range of total annual cash earnings Lowest – management and professional 35,000
Median – management and professional 55,000
Highest – management and professional 120,000
Lowest – other employees 15,000
Median – other employees 27,000
Highest – other employees 43,000
7 | cipd.co.uk/rewardmanagementsurvey
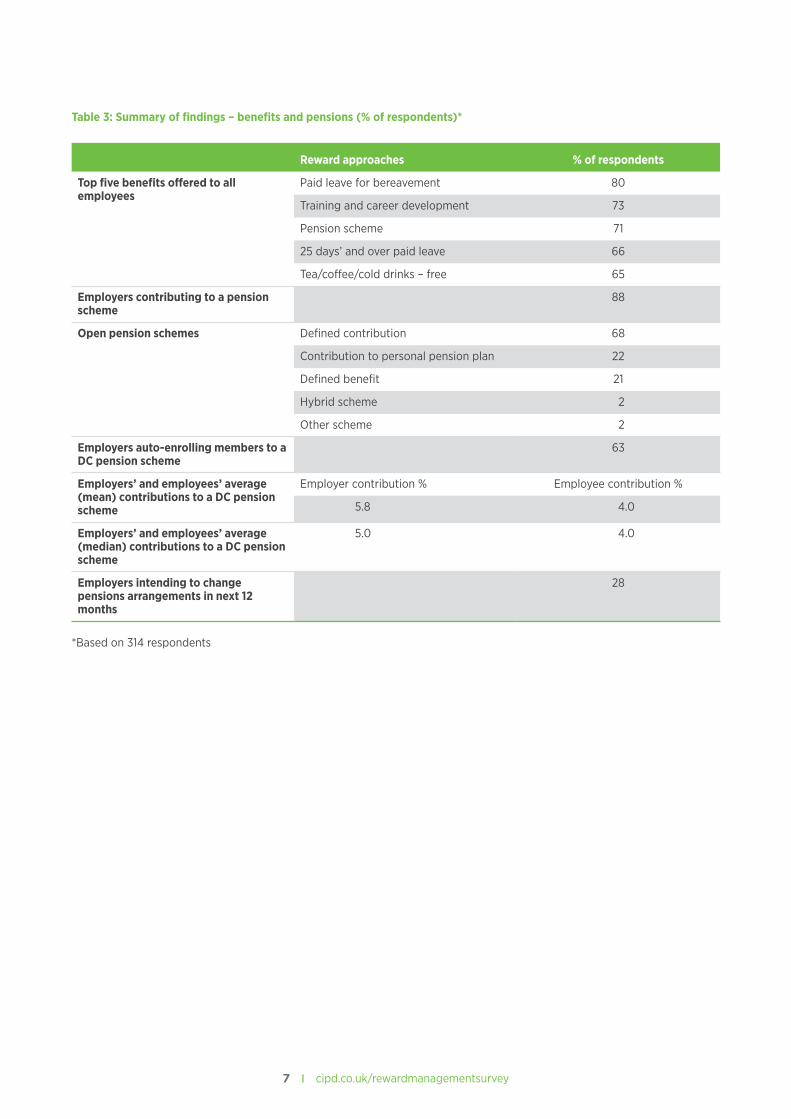
Table 3: Summary of findings – benefits and pensions (% of respondents)*
Reward approaches % of respondents
Top five benefits offered to all employees
Paid leave for bereavement 80
Training and career development 73
Pension scheme 71
25 days’ and over paid leave 66
Tea/coffee/cold drinks – free 65
Employers contributing to a pension scheme
88
Open pension schemes Defined contribution 68
Contribution to personal pension plan 22
Defined benefit 21
Hybrid scheme 2
Other scheme 2
Employers auto-enrolling members to a DC pension scheme
63
Employers’ and employees’ average (mean) contributions to a DC pension scheme
Employer contribution % Employee contribution %
5.8 4.0
Employers’ and employees’ average (median) contributions to a DC pension scheme
5.0 4.0
Employers intending to change pensions arrangements in next 12 months
28
*Based on 314 respondents

8 | Reward management survey 2014–15
1 UK base and variable pay policies
Our findings show organisations responding to competing contextual pressures through their reward practices as they balance the requirements of recruitment and retention with affordability. Trends towards paying for competencies and skills have been observed along with an apparent fall in use of performance-related reward schemes.
Base pay structuresTable 4 shows that individual base pay arrangements are the most widespread method of managing base pay, with just over half of organisations in our survey
using individual rates, ranges or spot salaries. The data shows that this figure has not changed significantly in the past few years and the proportions of different pay structures too have remained broadly similar. Certainly we do not appear to see any evidence of the much discussed decline of narrow-grading and pay spines in favour of more flexible forms of base pay management such as broad-banding.
However, as in previous years there is a marked difference in approach between industrial sectors. The private sector (both manufacturing
and services) favours individual pay arrangements and pay spines do not feature widely. In contrast, pay spines dominate in the public sector while broad-banding is least common. For the voluntary sector the picture is more mixed, with similar rates of pay spines and individual/spot salaries and far less use of job families and broad-banding.
When we look at pay structures in different sizes of organisation, we see that both small and large favour individual pay arrangements, while the very large
Table 4: Base pay structures (% of respondents)
Individual rates/spot salaries Narrow-graded
Pay spines/ service- related Job family Broad-banded
2014* 50 32 31 29 26
2013* 49 37 32 30 29
2012* 47 29 29 25 27
2011* 53 21 30 28 35
By sector*
Manufacturing and production 64 30 10 38 35
Private sector services 62 31 20 31 29
Public services 26 32 63 26 20
Voluntary, community and not-for-profit
37 34 39 18 19
By size*
SME (<250) 54 27 25 28 22
Large (250–9,999) 47 36 39 31 30
Very large (10,000+) 39 47 44 22 42
By employee category
Management/professional 44 23 24 21 23
Other employees 33 25 28 24 15
*% of respondents selecting for either employee category or both employee categories.
9 | cipd.co.uk/rewardmanagementsurvey
organisations tend to use both narrow grades and pay spines.
In general, these results are indicative of both a level of stability in base pay management over the past few years and a clear preference for differentiation according to size and sector. With a new parliamentary cycle just beginning and public sector pay set to remain a political issue, it
will be interesting to see if this picture changes in forthcoming survey reports.
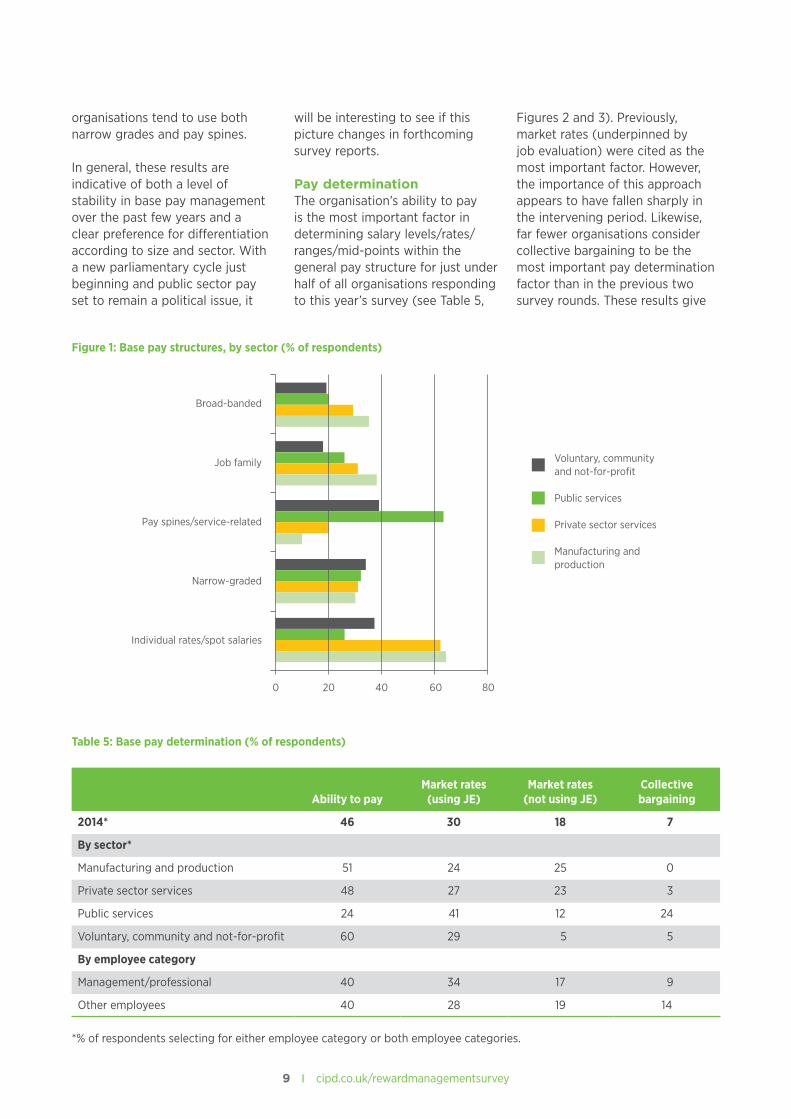
Pay determinationThe organisation’s ability to pay is the most important factor in determining salary levels/rates/ranges/mid-points within the general pay structure for just under half of all organisations responding to this year’s survey (see Table 5,
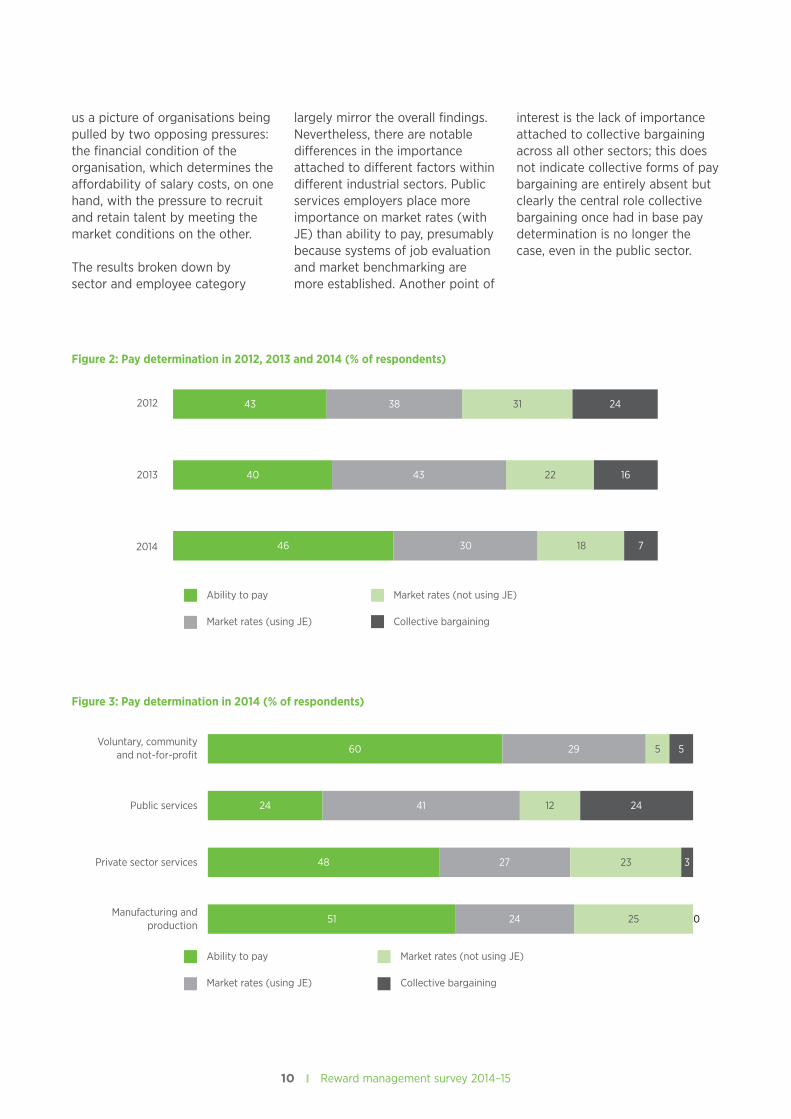
Figures 2 and 3). Previously, market rates (underpinned by job evaluation) were cited as the most important factor. However, the importance of this approach appears to have fallen sharply in the intervening period. Likewise, far fewer organisations consider collective bargaining to be the most important pay determination factor than in the previous two survey rounds. These results give
Table 5: Base pay determination (% of respondents)
Ability to payMarket rates
(using JE)Market rates
(not using JE)Collective bargaining
2014* 46 30 18 7
By sector*
Manufacturing and production 51 24 25 0
Private sector services 48 27 23 3
Public services 24 41 12 24
Voluntary, community and not-for-profit 60 29 5 5
By employee category
Management/professional 40 34 17 9
Other employees 40 28 19 14
*% of respondents selecting for either employee category or both employee categories.
Figure 1: Base pay structures, by sector (% of respondents)
Broad-banded
Job family
Pay spines/service-related
Narrow-graded
Individual rates/spot salaries
Voluntary, community and not-for-profit
Public services
Private sector services
Manufacturing and production
0 20 40 60 80
10 | Reward management survey 2014–15
us a picture of organisations being pulled by two opposing pressures: the financial condition of the organisation, which determines the affordability of salary costs, on one hand, with the pressure to recruit and retain talent by meeting the market conditions on the other.
The results broken down by sector and employee category
largely mirror the overall findings. Nevertheless, there are notable differences in the importance attached to different factors within different industrial sectors. Public services employers place more importance on market rates (with JE) than ability to pay, presumably because systems of job evaluation and market benchmarking are more established. Another point of
interest is the lack of importance attached to collective bargaining across all other sectors; this does not indicate collective forms of pay bargaining are entirely absent but clearly the central role collective bargaining once had in base pay determination is no longer the case, even in the public sector.
Figure 3: Pay determination in 2014 (% of respondents)
Figure 2: Pay determination in 2012, 2013 and 2014 (% of respondents)
2012
2013
2014
Ability to pay
Market rates (using JE)
Market rates (not using JE)
Collective bargaining
43 38 31 24
40 43 22 16
46 30 18 7
Voluntary, communityand not-for-profit
Public services
Private sector services
Manufacturing and production
Ability to pay
Market rates (using JE)
Market rates (not using JE)
Collective bargaining
60 29 5 5
24 41 12 24
48 27 23 3
51 24 25 0
11 | cipd.co.uk/rewardmanagementsurvey
Pay progressionTable 6 and Figure 4 show a number of developments in the management of individual base pay progression over the last few years. The use of all pay progression criteria has apparently increased or remained steady. As respondents to this question are asked to indicate all criteria that apply within their organisations, this signals that more-focused forms of assessment are being employed to decide on individuals’ progression through their base pay grades/scales. For example, whereas an organisation may have previously used length of service or market rates alone to determine pay progression, they may now be using other parallel criteria such
as performance or competencies. Alternatively, organisations may be using different pay progression criteria for different groups of employees – a more tailored and plural approach than ‘one size fits all’. We see some evidence for this in the different treatment of our two broad employee groups where skills and employee potential/value are used as criteria for progressing pay far more often for management and professional employees.
The second notable finding is the marked increase over the period in use of both competencies and skills as pay progression criteria, whereas use of individual performance and market rates
have remained largely steady. We can speculate that as the economy and market remain uncertain, employers have turned towards employee inputs (knowledge, skills and abilities) alongside their outputs (performance) and market conditions to determine aspects of a reward proposition that may well attract desired talent into the organisation. For more discussion on these issues see Box 2.
Table 7 shows the most common combination of factors used by our respondent organisations in pay progression by sector. There is a clear split between public/third sector and private sector in evidence here, although similar treatment between management
Our panel of reward experts (see ‘Background to the report’ for full panel details) discussed what ‘ability to pay’ really means for organisations. It is a term used in a number of the reward survey questions and, as results demonstrate, it is a dominant feature of decision-making in both setting pay levels and salary ranges as well as informing pay reviews.
In essence, it means asking the questions – what can we afford to pay for this role? And what increase, if anything, can we afford to pay this year?
There was some discussion among the panel regarding the constraints of budget-setting, which may be done far ahead of time and also at a distance by overseas parent companies who may have limited understanding of the realities of the UK labour market. So when the budget says, ‘you can spend this much,’ what options are there?
One consideration is viewing the total budget including benefits, not just pay. Reducing benefits to address pay may be an appealing option to attract new talent, who may not need/value them, but changing benefits wholesale may not fit with organisational values. For others, making pay decisions is a highly iterative process with a combination of drivers, from rates of inflation to the National Minimum Wage and, of course, individual performance.
Using a performance distribution curve as a guide for pay awards within an overall budget, that is, giving more at the top end and reducing rewards at the bottom, is one solution. However, this system relies heavily on line managers’ ratings and, in the experience of our panel, managers not only find it difficult to differentiate between team members but they are also unwilling to do so. Our panel questioned whether the time and effort spent across the organisation for minimal differences of 1 or 2% that might have a limited impact was really worth it. An alternative approach where there are ranges of performance might be to focus on development and coaching for poor performers while substantially recognising the exemplary.
One thing, however, was clear from the discussion: an organisation’s ‘ability to pay’ encompasses a complex set of competing demands to be managed by HR and reward practitioners.
Box 1: Discussion point – ‘Ability to pay’

12 | Reward management survey 2014–15
Table 6: Base pay progression (% of respondents)
Individual performance Competencies Market rates Skills
Employee potential/value/retention
Length of service
2014* 74 64 61 60 52 35
2013* 72 65 64 58 51 31
2012* 79 49 57 44 48 29
2011* 74 50 63 44 46 25
By sector*
Manufacturing and production
84 75 72 83 73 20
Private sector services 84 68 70 64 66 33
Public services 56 57 37 45 27 53
Voluntary, community and not-for-profit
60 56 54 46 28 30
By employee category
Management/professional 70 62 54 50 49 28
Other employees 60 51 53 35 36 30
*% of respondents selecting for either employee category or both employee categories.
Figure 4: Pay progression criteria, by year, 2011–14 (% of respondents)
2011
2012
2013
2014
Individual performance
Competencies
Market rates
Skills
Employee potential / value / retention
Length of service
74 50 63 44 46 25
79 49 57 44 48 29
72 65 64 58 51 31
74 64 61 60 52 35
and other employee groups. Another notable finding is that rates of combination appear far less common in both the voluntary and to a lesser extent in the public sector, presumably where single criterion pay progression is more prevalent.
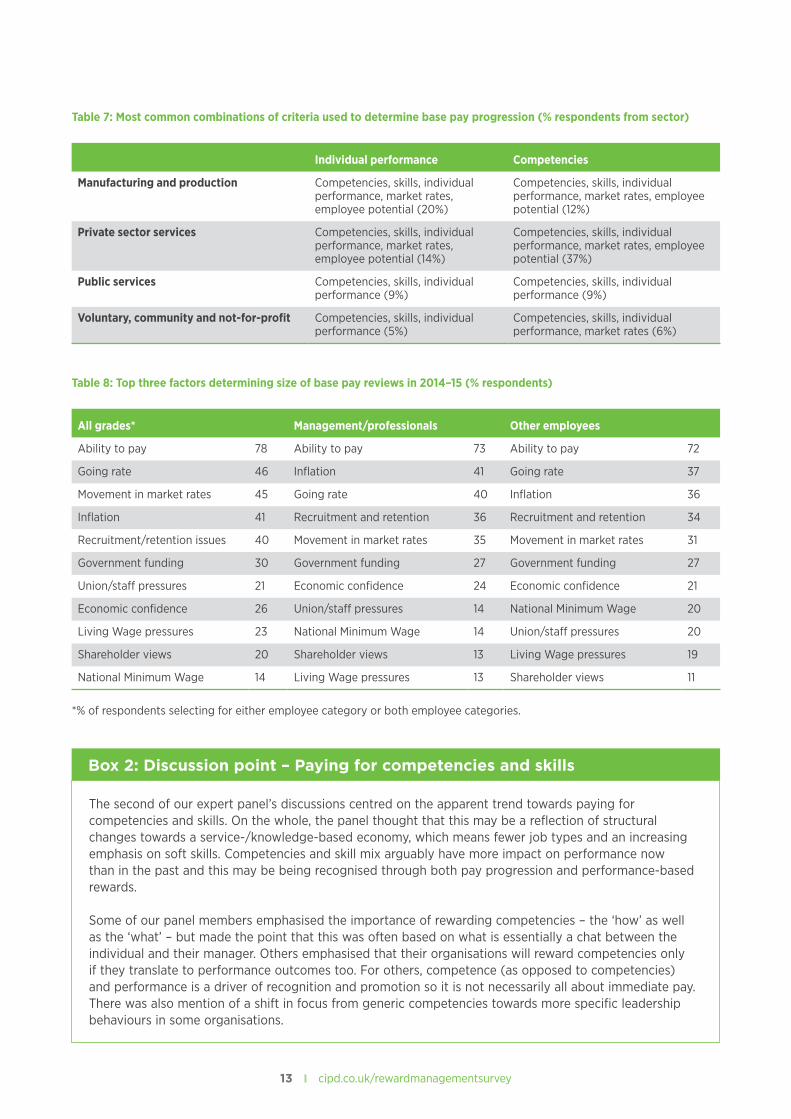
2014–15 pay reviewsTable 8 shows that the top three factors determining the size of the 2014–15 pay review for all employees were the organisation’s ability to pay, the ‘going rate’ of competitors’ pay rises and movement in market rates. This
clearly indicates that organisations continue to walk the line between awarding pay rises to keep competitive with the market while ultimately being constrained by what is affordable.
13 | cipd.co.uk/rewardmanagementsurvey
Table 8: Top three factors determining size of base pay reviews in 2014–15 (% respondents)
All grades* Management/professionals Other employees
Ability to pay 78 Ability to pay 73 Ability to pay 72
Going rate 46 Inflation 41 Going rate 37
Movement in market rates 45 Going rate 40 Inflation 36
Inflation 41 Recruitment and retention 36 Recruitment and retention 34
Recruitment/retention issues 40 Movement in market rates 35 Movement in market rates 31
Government funding 30 Government funding 27 Government funding 27
Union/staff pressures 21 Economic confidence 24 Economic confidence 21
Economic confidence 26 Union/staff pressures 14 National Minimum Wage 20
Living Wage pressures 23 National Minimum Wage 14 Union/staff pressures 20
Shareholder views 20 Shareholder views 13 Living Wage pressures 19
National Minimum Wage 14 Living Wage pressures 13 Shareholder views 11
*% of respondents selecting for either employee category or both employee categories.
Table 7: Most common combinations of criteria used to determine base pay progression (% respondents from sector)
Individual performance Competencies
Manufacturing and production Competencies, skills, individual performance, market rates, employee potential (20%)
Competencies, skills, individual performance, market rates, employee potential (12%)
Private sector services Competencies, skills, individual performance, market rates, employee potential (14%)
Competencies, skills, individual performance, market rates, employee potential (37%)
Public services Competencies, skills, individual performance (9%)
Competencies, skills, individual performance (9%)
Voluntary, community and not-for-profit Competencies, skills, individual performance (5%)
Competencies, skills, individual performance, market rates (6%)
The second of our expert panel’s discussions centred on the apparent trend towards paying for competencies and skills. On the whole, the panel thought that this may be a reflection of structural changes towards a service-/knowledge-based economy, which means fewer job types and an increasing emphasis on soft skills. Competencies and skill mix arguably have more impact on performance now than in the past and this may be being recognised through both pay progression and performance-based rewards.
Some of our panel members emphasised the importance of rewarding competencies – the ‘how’ as well as the ‘what’ – but made the point that this was often based on what is essentially a chat between the individual and their manager. Others emphasised that their organisations will reward competencies only if they translate to performance outcomes too. For others, competence (as opposed to competencies) and performance is a driver of recognition and promotion so it is not necessarily all about immediate pay. There was also mention of a shift in focus from generic competencies towards more specific leadership behaviours in some organisations.
Box 2: Discussion point – Paying for competencies and skills
14 | Reward management survey 2014–15
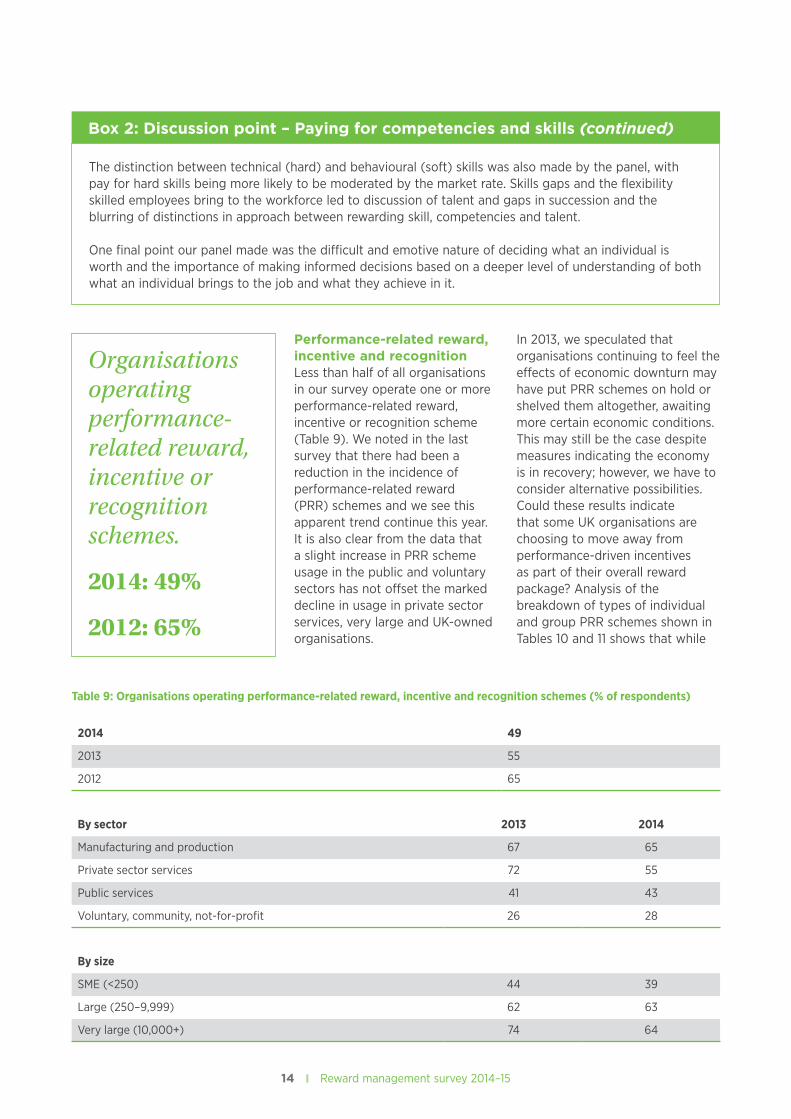
Performance-related reward, incentive and recognitionLess than half of all organisations in our survey operate one or more performance-related reward, incentive or recognition scheme (Table 9). We noted in the last survey that there had been a reduction in the incidence of performance-related reward (PRR) schemes and we see this apparent trend continue this year. It is also clear from the data that a slight increase in PRR scheme usage in the public and voluntary sectors has not offset the marked decline in usage in private sector services, very large and UK-owned organisations.
In 2013, we speculated that organisations continuing to feel the effects of economic downturn may have put PRR schemes on hold or shelved them altogether, awaiting more certain economic conditions. This may still be the case despite measures indicating the economy is in recovery; however, we have to consider alternative possibilities. Could these results indicate that some UK organisations are choosing to move away from performance-driven incentives as part of their overall reward package? Analysis of the breakdown of types of individual and group PRR schemes shown in Tables 10 and 11 shows that while
Organisations operating performance-related reward, incentive or recognition schemes.
2014: 49%
2012: 65%
The distinction between technical (hard) and behavioural (soft) skills was also made by the panel, with pay for hard skills being more likely to be moderated by the market rate. Skills gaps and the flexibility skilled employees bring to the workforce led to discussion of talent and gaps in succession and the blurring of distinctions in approach between rewarding skill, competencies and talent.
One final point our panel made was the difficult and emotive nature of deciding what an individual is worth and the importance of making informed decisions based on a deeper level of understanding of both what an individual brings to the job and what they achieve in it.
Box 2: Discussion point – Paying for competencies and skills (continued)
Table 9: Organisations operating performance-related reward, incentive and recognition schemes (% of respondents)
2014 49
2013 55
2012 65
By sector 2013 2014
Manufacturing and production 67 65
Private sector services 72 55
Public services 41 43
Voluntary, community, not-for-profit 26 28
By size
SME (<250) 44 39
Large (250–9,999) 62 63
Very large (10,000+) 74 64

15 | cipd.co.uk/rewardmanagementsurvey
individual bonuses remain the most common form of individual PRR scheme, incidence has declined since 2012 while usage of combination and project-based schemes has increased. We may well be seeing a shift away from individual variable pay towards schemes where the award depends on a mix of individual, group and/or organisational performance or the successful outcome of a specific project, perhaps indicating unwillingness to risk paying out unless overall organisational performance is strong.
There are clear sectoral differences in approach to individual PRR;
combination schemes are most common in manufacturing/production companies, whereas private sector services use individual bonuses to a greater extent than other sectors. Sales commissions are most common in private sector services where the type of work can be best suited to this form of performance-related incentive. Merit pay rises are most common in the public sector, whereas non-monetary recognition is used most often in the voluntary sector.
We also see a difference in approach depending on employee category. Management and
professionals are more likely to receive financial performance-based rewards of nearly every type than other employees. This could indicate a more ‘talent management’ oriented approach to this group, while non-monetary recognition is perhaps more suited to the broad base of employees.
Group-based performance-related reward schemes remain less common than individual-based schemes, reflecting the largely individualised nature of UK reward management. Of the organisations in the survey stating they operate PRR schemes, 99% operate individual-based schemes whereas
By geographic ownership
Mainly UK-owned organisation 48 43
Division of mainly UK-owned organisation 75 62
Division of internationally owned organisation 74 74
Table 10: Individual performance-related reward schemes (% of respondents operating an individual PRR scheme)
Individual bonuses
Merit pay rises
Combi schemes
Individual non-
monetary recognition
Sales commission
Ad hoc/project-based
Other individual
cash incentives
Individual non-
monetary incentives
Piece rates
2014* 57 51 46 31 29 24 22 16 3
2013* 60 56 49 35 37 20 17 – 0
2012* 67 57 40 34 37 18 26 – 2
By sector*
Manufacturing and production
55 41 61 35 45 29 33 16 10
Private sector services
64 50 53 32 35 26 22 18 2
Public services 48 61 20 20 2 26 11 15 0
Voluntary, community and not-for-profit
46 54 31 39 15 8 19 4 0
By employee category
Management/professional
53 47 45 26 20 20 16 11 1
Other employees 45 45 34 32 20 16 20 16 3
*% of respondents selecting for either employee category or both employee categories.

16 | Reward management survey 2014–15
Figure 5: Individual performance-related schemes in past three years (% of respondents operating an individual PRR scheme)
2012
2013
2014
Piece rates
Individual non-monetary incentives
Other individual cash incentives
Ad hoc / project-based
Sales commission
Individual non-monetary recognition
Combi schemes
Merit pay rises
Individual bonuses
0 20 40 60 80%
Table 11: Group performance-related reward schemes (% of respondents operating a group PRR scheme)
Goal-sharing Profit-sharing
Group or team-based
non-monetary recognition
Gain-sharing
Group or team-based
non-monetary incentives
2014* 53 40 30 20 17
2013* 50 40 35 12 21
2012* 48 38 27 22 19
By sector*
Manufacturing and production 44 50 32 18 18
Private sector services 51 46 28 25 17
Public services 67 10 29 14 19
Voluntary, community, not-for-profit
78 0 44 11 0
By employee category
Management/professional 50 39 23 21 11
Other employees 44 32 30 14 17
*% of respondents selecting for either employee category or both employee categories.
only 60% operate group-based schemes, showing that many organisations will be operating hybrid group/individual schemes. However, the apparent trend noted in previous surveys towards a shift in approach towards more collective reward systems seems
to continue with another increase this year in nearly all group-based schemes.
Goal-sharing (group bonuses based on group/team achievement of specific objectives) is the most common form of group
PRR across the sectors, although profit-sharing is commonly used in the private sector whereas the voluntary sector is far more likely to use non-monetary recognition schemes. The difference in approach between employee groups can also be seen here;

17 | cipd.co.uk/rewardmanagementsurvey
once again management and professionals are more likely to be included in monetary schemes while other employees are more likely to be included in non-monetary schemes.
Figures 7 and 8 show the proportions of employees eligible for performance-related bonus and incentive schemes. Overall results show that where such
schemes are in operation, the majority of employees are eligible to receive a bonus or incentive payment. This is particularly the case for the management and professional category of employees. Looking at the sectoral breakdown, it is apparent that where these schemes operate in the public sector, they are much less widespread across the workforce, indicating that the
schemes are targeted at certain employee groups. The voluntary, community and not-for-profit sector has the largest proportion of non-eligibility of all sectors, again indicating a targeted rather than widespread approach. By contrast, performance-related bonus and incentive schemes are far more extensive across both employee categories in the private sector (both manufacturing and services).
Group non-monetary incentives
Gain-sharing
Group non-monetary recognition
Profit-sharing
Goal-sharing
Voluntary, community and not-for-profit
Public services
Private sector services
Manufacturing and production
0 20 40 60 80 100%
Figure 6: Group performance-related schemes, by sector (% of respondents operating a group PRR scheme)
Figure 7: Proportion of management/professional and other employees covered by performance-related bonus and incentive schemes (% of respondents operating bonus and incentive schemes)
All other employees
All management / professional
None
Minority
About half
Majority
Don’t know / don’t collect
17 13 9 259
8 15 5 370

18 | Reward management survey 2014–15
Figure 8: Proportion of management/professional and other employees covered by performance-related bonus and incentive schemes, by sector (% of respondents operating schemes)
None
Minority
About half
Voluntary – other
Voluntary – management
Public services – other
Public services – management
Private sector services – other
Majority
Don’t know / don’t collect
Manufacturing & production –management
Manufacturing & production –other
Private sector services – management
38 4 4 0
0
0
0
54
28 12 4 56
30 15 4 744
15 20 4 952
9 13 11 265
3 11 6 277
15 17 10 58
2 20 4 74
19 | cipd.co.uk/rewardmanagementsurvey
2 Pay management and communication
Survey results suggest that organisations are not positioning pay competitively at the top of the market despite improved economic conditions. The majority of organisations prefer pay confidentiality over transparency and only one fifth actively collects data on the spread/range of pay across the organisation.
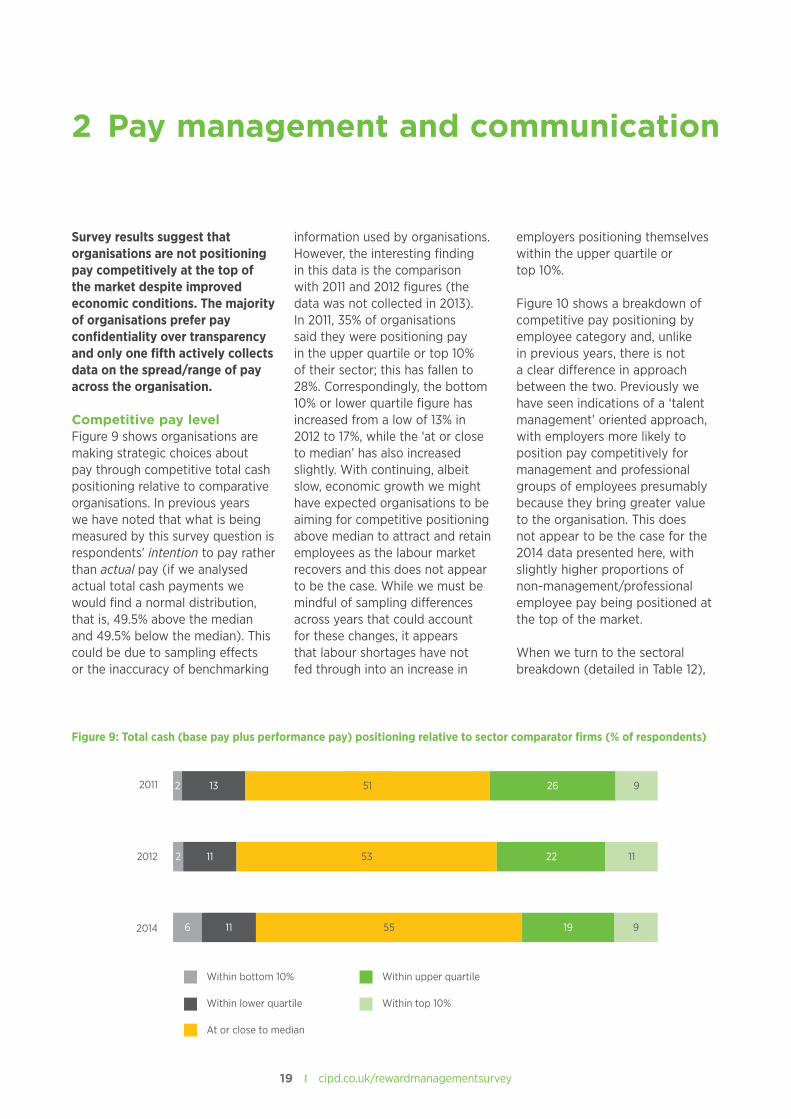
Competitive pay levelFigure 9 shows organisations are making strategic choices about pay through competitive total cash positioning relative to comparative organisations. In previous years we have noted that what is being measured by this survey question is respondents’ intention to pay rather than actual pay (if we analysed actual total cash payments we would find a normal distribution, that is, 49.5% above the median and 49.5% below the median). This could be due to sampling effects or the inaccuracy of benchmarking
information used by organisations. However, the interesting finding in this data is the comparison with 2011 and 2012 figures (the data was not collected in 2013). In 2011, 35% of organisations said they were positioning pay in the upper quartile or top 10% of their sector; this has fallen to 28%. Correspondingly, the bottom 10% or lower quartile figure has increased from a low of 13% in 2012 to 17%, while the ‘at or close to median’ has also increased slightly. With continuing, albeit slow, economic growth we might have expected organisations to be aiming for competitive positioning above median to attract and retain employees as the labour market recovers and this does not appear to be the case. While we must be mindful of sampling differences across years that could account for these changes, it appears that labour shortages have not fed through into an increase in
employers positioning themselves within the upper quartile or top 10%.
Figure 10 shows a breakdown of competitive pay positioning by employee category and, unlike in previous years, there is not a clear difference in approach between the two. Previously we have seen indications of a ‘talent management’ oriented approach, with employers more likely to position pay competitively for management and professional groups of employees presumably because they bring greater value to the organisation. This does not appear to be the case for the 2014 data presented here, with slightly higher proportions of non-management/professional employee pay being positioned at the top of the market.
When we turn to the sectoral breakdown (detailed in Table 12),
2011
2012
2014
Within bottom 10%
Within lower quartile
At or close to median
Within upper quartile
Within top 10%
2 13 51 26 9
2
6
11 53 22 11
11 55 19 9
Figure 9: Total cash (base pay plus performance pay) positioning relative to sector comparator firms (% of respondents)

20 | Reward management survey 2014–15
we see manufacturing and production and private sector services more likely to position pay in the upper part of the market than the other sectors, and conversely, the voluntary, community and not-for-profit sector along with public services
more likely to fall in the bottom 10% bracket. The impact of public sector pay freezes and continued budget cuts may well be responsible for the choices these organisations are making about how they position pay levels.
Other
Management & professional
Within bottom 10%
Within lower quartile
At or close to median
Within upper quartile
Within top 10%
7 17 61 511
9 19 59 59
Figure 10: Total cash (base pay plus performance pay) positioning relative to sector comparator firms, by employee category (% of respondents)
Table 12: Competitive pay positioning (% of responses)
Within top 10%Within upper
quartileAt or close to
median
Within lower
quartileWithin bottom
10%
2014 9 19 55 11 6
2012 11 22 53 11 2
2011 9 26 51 13 2
By sector
Manufacturing and production 13 24 49 10 4
Private sector services 9 21 54 11 4
Public services 8 17 56 10 9
Voluntary, community, not-for-profit
5 12 65 11 8
By size
SME (<250) 9 19 53 13 6
Large (250–9,999) 7 20 59 9 5
Very large (10,000+) 13 13 53 13 7
By employee category
Management/professional 9 19 59 9 5
Other employees 7 17 61 11 5

21 | cipd.co.uk/rewardmanagementsurvey
Pay dispersionTo determine levels of pay dispersion (‘spread’), respondents were asked for actual highest, lowest and median total annual cash earnings (base pay, performance pay and any other direct cash payments) for our two groups of employees: managers/professional staff and other employees. Survey respondents were asked if their organisations collected such data: only 19% said they did and this figure was not significantly different across sectors, sizes of organisation or where there were higher proportions of female employees.
Among this sample, the overall median earnings for each group are £55,000 for management and professionals, £27,000 for other employees. Tables 13 and 14 show the breakdown of results by sector and size of organisation for each employee category as well as ratios between the lowest and highest medians. The ratios show a greater range of pay within the management and professional category, where the highest median earnings are 3.4 times higher than the lowest median
earnings, than among other employee groups, where the ratio is 1 to 2.9.
Both the private sector services and public services sectors have wider pay dispersion for management and professional employees than either manufacturing and production or voluntary, community and not-for-profit organisations. This is largely due to the significantly higher medians at the top of the pay range in both private and public services. Ratios for management and professionals by size of organisation also show that as organisations get larger, so the ratio between lowest and highest paid appears to increase, from a ratio of 1:2.5 in SMEs to 1:4.9 in very large organisations, presumably due to the wider range of job roles present in big organisations. However, for other, non-management/professional employees, there does not seem to be the same increased dispersion as organisation size increases. Among this category the widest dispersion can be found in private sector services, where the highest median earnings are 3.3 times the
‘19% of organisations are collecting data on pay.’
Table 13: Pay dispersion – management/professional employees (£)
Lowest earnings* Median earnings* Highest earnings*Ratio between lowest/highest
All 35,000 55,000 120,000 1:3.4
By sector
Manufacturing and production 35,000 45,254 96,000 1:2.7
Private sector services 36,000 60,000 150,000 1:4.2
Public services 30,382 35,000 125,000 1:4.1
Voluntary, community, not-for-profit 29,250 36,550 60,000 1:2
By size
SME (<250) 30,000 42,000 75,000 1:2.5
Large (250–9,999) 33,500 45,254 145,000 1:4.3
Very large (10,000+) 30,764 50,600 150,000 1:4.9
* All figures are medians.

22 | Reward management survey 2014–15
lowest; again this appears to be due to higher top-end earnings in this group.
If we look at both groups together, the overall ratio is 1:8 between the lowest median earnings for
non-management employees and the highest median earnings for management and professionals. The widest range can be found in the public services sector, where the ratio between lowest and highest is 1:8.9, whereas the
narrowest range is in the voluntary sector with a ratio of just 1:3.3 between the lowest and highest median earnings across employee categories.
Table 14: Pay dispersion – other employees (£)
Lowest earnings* Median earnings* Highest earnings*Ratio between lowest/highest
All 15,000 27,000 43,000 1:2.9
By sector
Manufacturing and production 16,125 26,000 40,000 1:2.5
Private sector services 15,000 29,127 49,180 1:3.3
Public services 14,022 23,250 35,500 1:2.5
Voluntary, community, not-for-profit 18,000 23,800 28,500 1:1.6
By size
SME (<250) 15,000 25,750 35,304 1:2.4
Large (250–9,999) 18,500 25,750 42,000 1:2.3
Very large (10,000+) 14,043 26,150 37,964 1:2.7
* All figures are medians.
Figure 11: Median annual cash earnings for management/professional employees, by sector (£)
Median
Highest
Lowest
Voluntary, community and not-for-profit
Public services
Private sector services
Manufacturing and production
0 50,000 100,000 150,000 200,000£

23 | cipd.co.uk/rewardmanagementsurvey
Pay transparencyRespondents were asked about the extent to which their organisations are prepared to disclose information to employees about pay and how different individuals or groups of employees are treated. Figure 13 shows that overall, it seems organisations favour pay confidentiality over transparency. Fifty-six per cent of respondents agree or strongly agree with the statement that reflects the least transparent approach to pay – they are compliant with legislation but very much prefer to keep pay information as confidential as possible. This compares with 41% who agree or strongly agree with the most transparent approach – they actively publicise pay information and intend to be as transparent as possible. These figures have hardly changed since the last time the reward survey asked respondents this question in 2012, indicating that pay transparency does not seem to be increasing in the UK.
We analysed the results by sector by comparing the mean scores (1 being most transparent, 5 being most secretive). The overall mean score for all organisations was 3.3. Figure 14 shows the mean scores by sector, with public services the most transparent in disclosing pay information to employees, while private sector services and manufacturing and production are the most secretive about pay. This perhaps reflects the individualised pay arrangements evident in manufacturing and the private sector more generally, where it may be thought undesirable to share individual pay information, whereas the public sector has far more collective arrangements, such as pay spines, which are openly published within the organisation. Similarly, Figure 15 shows pay transparency/secrecy mean scores by size of organisation and indicates that transparency is greater in larger organisations. This may be the sectoral effect (public sector organisations are also the largest in our survey) or may well
reflect the more standardised nature of pay in big organisations which therefore have ‘nothing to hide’ compared with smaller firms, where pay differences may cause bad feeling. For more discussion on these issues see Box 3 – Pay transparency.
Figure 12: Median annual cash earnings for other employees, by sector (£)
Median
Highest
Lowest
Voluntary, community and not-for-profit
Public services
Private sector services
Manufacturing and production
0 10,000 20,000 30,000 40,000 50,000 60,000£
Med
ian
annu
al c
ash
earn
ings
– o
ther
em
ploy
ees

24 | Reward management survey 2014–15
Figure 13: Respondents’ views on pay transparency in their organisations (% of responses)
As transparent as possible
Transparent for all but senior grades
Does not actively promote disclosure
Prefers confidentiality
A private matter unless legally compelled
Strongly disagree
Somewhat disagree
Neither
Somewhat agree
Strongly agree
30 18 12 23 18
18 10 16 25 31
31 15 15 23 16
26 17 19 28 10
16 17 15 35 16
Voluntary, community and not-for-profit
Public services
Private sector services
Manufacturing and production
3
2.5
3.6
3.9
Figure 14: Pay transparency/secrecy mean scores (1=most transparent, 5=most secretive), by sector
Very large (10,000+)
Large (250–9,999)
SME (<250)
2.7
3.1
3.5
Figure 15: Pay transparency/secrecy mean scores (1=most transparent, 5=most secretive), by size of organisation

25 | cipd.co.uk/rewardmanagementsurvey
Some strong opinions on pay transparency were evident among our panel, with a clear view that greater transparency may be morally desirable but the reality of managing it is far from straightforward. There was acknowledgement that concealment of pay information can create mistrust so, at least in theory, if good pay decisions are being made, it should be possible to treat employees as grown-ups and explain them. Our previous surveys have found a relationship between greater pay transparency and more positive employee relations climates. There has also been governmental pressure in the form of the Equality Act 2010 for less secrecy around pay in an attempt to address the persistent gender pay gap.
While our panel were positive about this aspiration, they sounded doubts over the process of reaching it. One of the panel explained that their organisation is very transparent; everyone knows where they are on pay, but the challenge they face is how to explain why people are where they are in comparison with others and that can be uncomfortable. Another organisation publishes salary ranges and has a great deal of scrutiny around annual pay review guidelines, but have found that outside the cycle there is a rush for market reviews and ad hoc salary increases with the potential to cause equity discrepancies, which in the past have not been scrutinised to the same extent.
The overall view was that while many organisations have internal equity issues, this is largely due to the human factor; people make decisions so they will not be perfect. Even with systems such as job evaluation in place, pay is based on human judgement. There was also a view that greater pay transparency could lead to employee confusion and anxiety. Panel members who have experienced transparency in their organisations suggested that it may not reassure people. However, most of the panel recognised the rationale for greater transparency, particularly with regards to senior pay, and believe that the direction of travel is towards more transparency in the longer term. They also suggested that greater transparency could drive simplification of pay structures and reduce complexity, which was seen as a positive development. In conclusion, the success of greater pay transparency in organisations depends on better employee understanding of how decisions are made and for this there has to be a narrative that people understand – not a smoke screen.
Box 3: Discussion point – Pay transparency

26 | Reward management survey 2014–15
3 Benefits and pensions
This year’s results show the provision of benefits continues to be widespread, although there are indications that the incidence of some benefits might be declining. Sectoral differences in pension arrangements remain marked and pension reform compliance continues to dominate pension changes.
(Note: this section of the report is based on responses from a sample of 314 survey participants only. See ‘Background to the report’ section.)
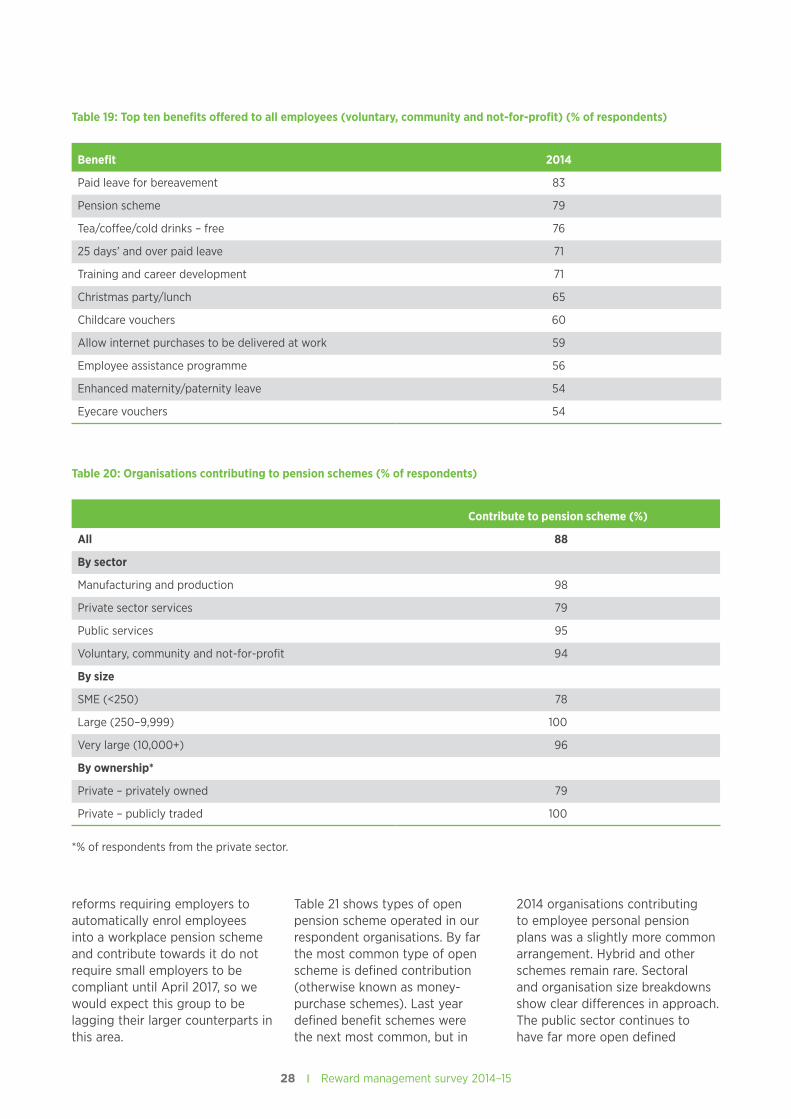
BenefitsTable 15 shows the most common benefits offered to all employees irrespective of grade or benefit scheme. The list shows different types of benefits, with leave, career development, financial benefits and social benefits all featuring strongly in the top ten. Results for 2014 in comparison with 2013 show broadly similar rates of provision of universal
benefits, although it appears the incidence of many benefits has fallen year to year. This needs to be treated with caution as it may well be due to sampling differences in different surveys, but could indicate that some organisations are rationalising their benefit offerings either to focus on pay or to concentrate resource on benefits that are most attractive to staff.
Tables 16–19 show the breakdown of benefits by sector. Many benefits, such as paid leave for bereavement and pension schemes, are common to all sectors, although their extent varies. Others are more sector-specific; on-site car parking, for example, only appears in the private sector lists, whereas employee assistance programmes only appear in the voluntary sector’s top ten. The public sector is markedly different from the other three sectors, being far more ‘welfare’ oriented in its provision of leave and family-friendly benefits.
It is also apparent that benefits funded by the taxpayer have to conform to certain expectations from the public, hence the absence of free drinks or Christmas parties for public sector workers.
Pension schemesEighty-eight per cent of organisations in our survey contribute to a pension scheme for employees. In previous years this figure has been slightly higher, but this difference is likely to be down to sampling differences across survey rounds rather than an indication that organisations have been withdrawing contributions. Table 20 shows the breakdown by sector, size and (in the private sector) by ownership. Contribution to pension schemes by employers is most common in the manufacturing and production sector, in very large organisations and in public traded companies, whereas it is less common among private sector services, SMEs and privately owned firms. Pension
Table 15: Top ten benefits offered to all employees (all organisations) (% of respondents)
Benefit 2014 2013
Paid leave for bereavement 80 93
Training and career development 73 83
Pension scheme 71 84
25 days’ and over paid leave 66 73
Tea/coffee/cold drinks – free 65 67
Christmas party/lunch 62 67
Death in service/life assurance 60 69
Childcare vouchers 56 63
Allow internet purchases to be delivered at work 55 60
On-site car parking (free/subsidised) 54 60

27 | cipd.co.uk/rewardmanagementsurvey
Table 16: Top ten benefits offered to all employees (manufacturing and production) (% of respondents)
Benefit 2014
Pension scheme 92
Paid leave for bereavement 83
Tea/coffee/cold drinks – free 75
Training and career development 71
On-site car parking (free/subsidised) 71
Death in service/life assurance 69
25 days’ and over paid leave 67
Childcare vouchers 65
Christmas party/lunch 65
Allow internet purchases to be delivered at work 60
Table 17: Top ten benefits offered to all employees (private sector services) (% of respondents)
Benefit 2014
Training and career development 77
Christmas party/lunch 77
Paid leave for bereavement 74
Tea/coffee/cold drinks – free 74
Pension scheme 59
Death in service/life assurance 59
Allow internet purchases to be delivered at work 59
On-site car parking (free/subsidised) 56
25 days’ and over paid leave 56
Eyecare vouchers 50
Table 18: Top ten benefits offered to all employees (public services) (% of respondents)
Benefit 2014
Paid leave for bereavement 92
25 days’ and over paid leave 83
Pension scheme 77
Paid leave for military reserve activities 74
Training and career development 72
Death in service/life assurance 68
Enhanced maternity/paternity leave 66
Childcare vouchers 63
Cycle-to-work scheme loan 58
Debt advice/counselling/guidance 57
28 | Reward management survey 2014–15
reforms requiring employers to automatically enrol employees into a workplace pension scheme and contribute towards it do not require small employers to be compliant until April 2017, so we would expect this group to be lagging their larger counterparts in this area.
Table 21 shows types of open pension scheme operated in our respondent organisations. By far the most common type of open scheme is defined contribution (otherwise known as money-purchase schemes). Last year defined benefit schemes were the next most common, but in
2014 organisations contributing to employee personal pension plans was a slightly more common arrangement. Hybrid and other schemes remain rare. Sectoral and organisation size breakdowns show clear differences in approach. The public sector continues to have far more open defined
Table 19: Top ten benefits offered to all employees (voluntary, community and not-for-profit) (% of respondents)
Benefit 2014
Paid leave for bereavement 83
Pension scheme 79
Tea/coffee/cold drinks – free 76
25 days’ and over paid leave 71
Training and career development 71
Christmas party/lunch 65
Childcare vouchers 60
Allow internet purchases to be delivered at work 59
Employee assistance programme 56
Enhanced maternity/paternity leave 54
Eyecare vouchers 54
Table 20: Organisations contributing to pension schemes (% of respondents)
Contribute to pension scheme (%)
All 88
By sector
Manufacturing and production 98
Private sector services 79
Public services 95
Voluntary, community and not-for-profit 94
By size
SME (<250) 78
Large (250–9,999) 100
Very large (10,000+) 96
By ownership*
Private – privately owned 79
Private – publicly traded 100
*% of respondents from the private sector.

29 | cipd.co.uk/rewardmanagementsurvey
benefit schemes, while defined contribution schemes dominate in every other sector.
Auto-enrolment of qualifying employees into workplace pension schemes has been a
pre-occupation in the reward sector since pension reforms were introduced a few years ago. Table 22 shows the progress of auto-enrolment into defined contribution schemes since 2013. In nearly every area we see rates have
increased dramatically, presumably as organisations have reached staging dates when, according to size of organisation, they need to comply with the regulations. The only anomaly is public services, as the rate of auto-enrolment appears
Table 21: Types of open pension scheme (% of respondents operating a pension scheme)
Defined contribution
Contribution to personal
pension Defined benefit Hybrid Other
2014 68 22 21 2 2
2013 55 25 28 3 5
By sector
Manufacturing and production 86 30 2 0 0
Private sector services 73 31 7 3 2
Public services 35 11 66 4 0
Voluntary, community and not-for-profit
76 11 16 0 4
By size
SME (<250) 65 27 14 2 2
Large (250–9,999) 70 16 24 2 2
Very large (10,000+) 73 23 36 9 0
Table 22: Organisations auto-enrolling members to DC pension schemes (% of respondents with an open DC scheme)
2014Auto-enrol to pension scheme (%)
2013Auto-enrol to pension scheme (%)
All 63 34
By sector
Manufacturing and production 76 28
Private sector services 70 27
Public services 52 61
Voluntary, community and not-for-profit 53 20
By size
SME (<250) 58 27
Large (250–9,999) 68 36
Very large (10,000+) 65 61
By ownership*
Private – privately owned 66
Private – publicly traded 84
*% of respondents from the private sector.
30 | Reward management survey 2014–15
to have fallen. Although this may be down to sampling differences, we also need to remember that the majority of public sector organisations will be meeting the pensions requirements through their defined benefits schemes rather than defined contribution.
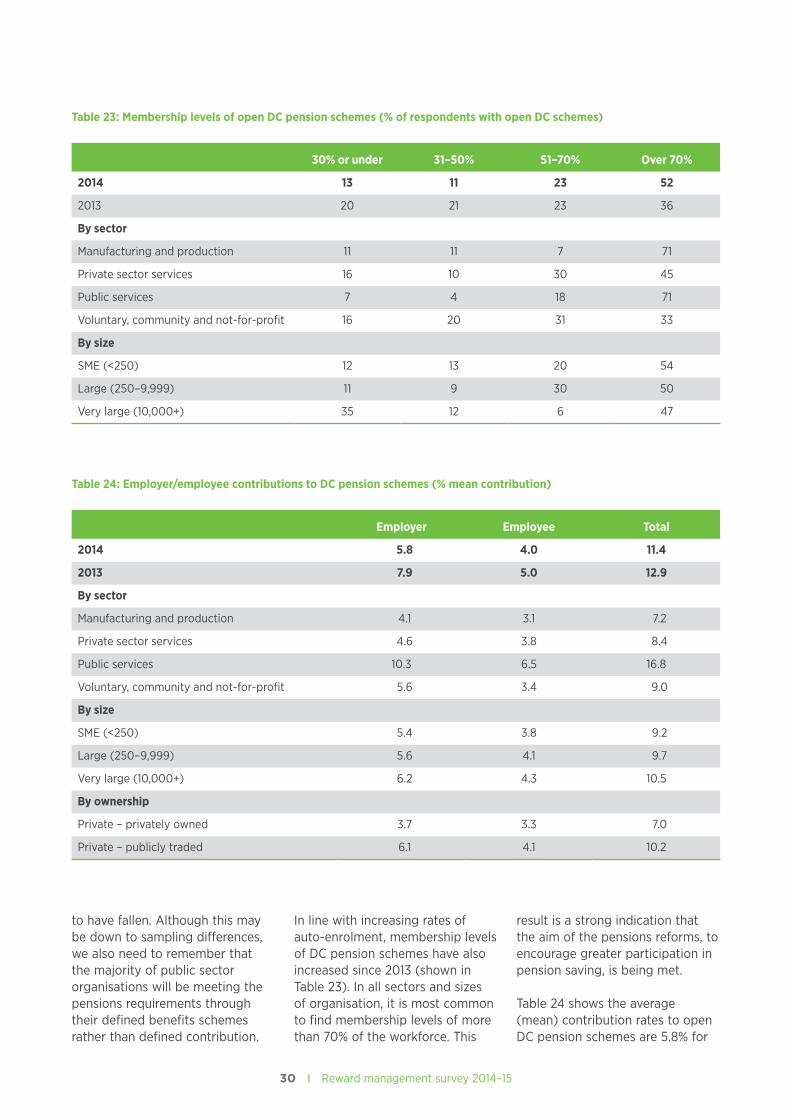
In line with increasing rates of auto-enrolment, membership levels of DC pension schemes have also increased since 2013 (shown in Table 23). In all sectors and sizes of organisation, it is most common to find membership levels of more than 70% of the workforce. This
result is a strong indication that the aim of the pensions reforms, to encourage greater participation in pension saving, is being met.
Table 24 shows the average (mean) contribution rates to open DC pension schemes are 5.8% for
Table 23: Membership levels of open DC pension schemes (% of respondents with open DC schemes)
30% or under 31–50% 51–70% Over 70%
2014 13 11 23 52
2013 20 21 23 36
By sector
Manufacturing and production 11 11 7 71
Private sector services 16 10 30 45
Public services 7 4 18 71
Voluntary, community and not-for-profit 16 20 31 33
By size
SME (<250) 12 13 20 54
Large (250–9,999) 11 9 30 50
Very large (10,000+) 35 12 6 47
Table 24: Employer/employee contributions to DC pension schemes (% mean contribution)
Employer Employee Total
2014 5.8 4.0 11.4
2013 7.9 5.0 12.9
By sector
Manufacturing and production 4.1 3.1 7.2
Private sector services 4.6 3.8 8.4
Public services 10.3 6.5 16.8
Voluntary, community and not-for-profit 5.6 3.4 9.0
By size
SME (<250) 5.4 3.8 9.2
Large (250–9,999) 5.6 4.1 9.7
Very large (10,000+) 6.2 4.3 10.5
By ownership
Private – privately owned 3.7 3.3 7.0
Private – publicly traded 6.1 4.1 10.2
31 | cipd.co.uk/rewardmanagementsurvey
employers and 4.0% for employees. In comparison with 2013, it seems contributions have fallen for both employers and employees, which is what we would expect to see as greater numbers of employers are auto-enrolling employees into pension schemes at the minimum contribution rates. It also appears that total contributions are lower overall. Employer contributions are highest in the public services sector, in very large organisations and in PLCs; employee contributions tend to be higher here too and therefore total levels of contribution are highest in these areas. Lowest levels are in
manufacturing and production and privately held companies.
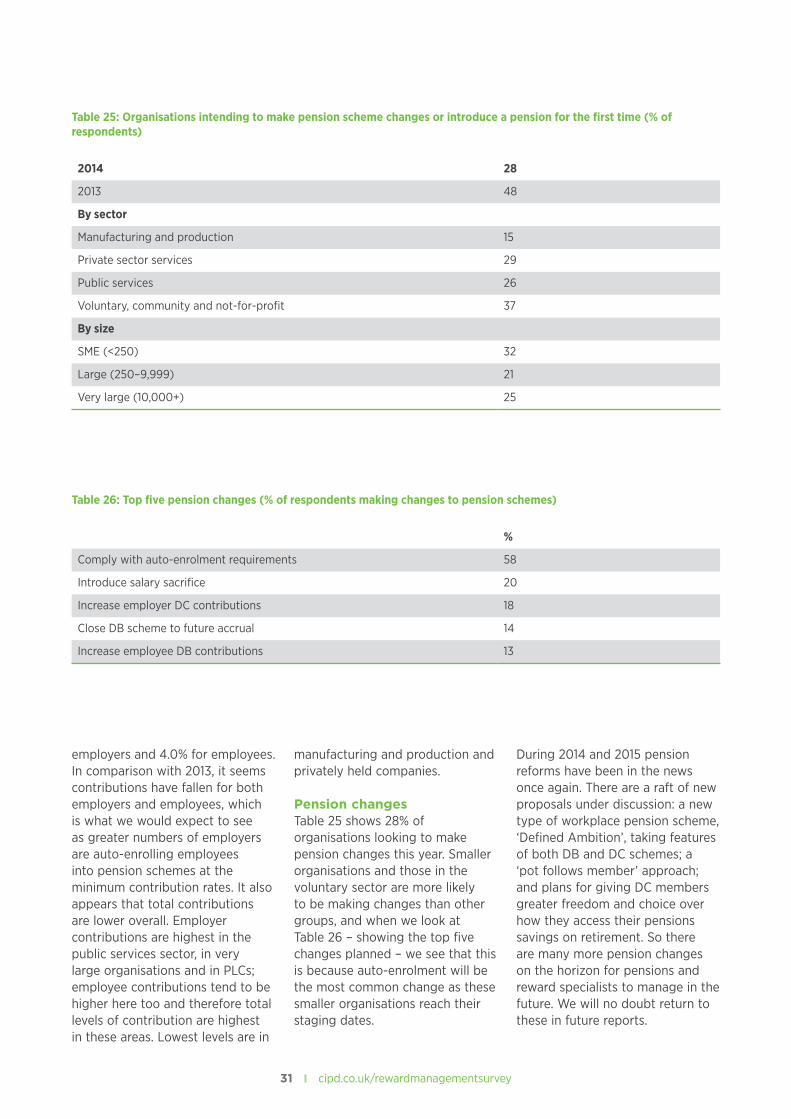
Pension changesTable 25 shows 28% of organisations looking to make pension changes this year. Smaller organisations and those in the voluntary sector are more likely to be making changes than other groups, and when we look at Table 26 – showing the top five changes planned – we see that this is because auto-enrolment will be the most common change as these smaller organisations reach their staging dates.
During 2014 and 2015 pension reforms have been in the news once again. There are a raft of new proposals under discussion: a new type of workplace pension scheme, ‘Defined Ambition’, taking features of both DB and DC schemes; a ‘pot follows member’ approach; and plans for giving DC members greater freedom and choice over how they access their pensions savings on retirement. So there are many more pension changes on the horizon for pensions and reward specialists to manage in the future. We will no doubt return to these in future reports.
Table 25: Organisations intending to make pension scheme changes or introduce a pension for the first time (% of respondents)
2014 28
2013 48
By sector
Manufacturing and production 15
Private sector services 29
Public services 26
Voluntary, community and not-for-profit 37
By size
SME (<250) 32
Large (250–9,999) 21
Very large (10,000+) 25
Table 26: Top five pension changes (% of respondents making changes to pension schemes)
%
Comply with auto-enrolment requirements 58
Introduce salary sacrifice 20
Increase employer DC contributions 18
Close DB scheme to future accrual 14
Increase employee DB contributions 13

32 | Reward management survey 2014–15
Conclusions and implications for reward management
In this final section of the report, Stephen Perkins and John Shields draw together some of the key themes emerging from the survey data and reflect on the implications for reward management.
Little innovation is visible in the ways pay is managed at its most basic level. Approaches to setting salaries and wages reported in the survey findings reflect employment sector above all – and the pattern has not shown signs of altering over the past several years of conducting this survey.
Most likely, this reflects the clear delineation between where trade union influence remains concentrated – that is, the public service sector – and where collective bargaining around pay has ceased to have a marked impact. In the private sector – whether or not the organisations are large or small – salaries and wages reflect more individualised approaches. Within the third or voluntary services sector a variety of approaches is reported, and one might speculate that practice reflects the heterogeneous predilections of charity body trustees.
The survey findings do show considerable complexity, brought to life by the expert practitioner panel debate on the initial findings. The reported increasing influence of ‘ability to pay’ seems to raise more questions than answers and indicates the need for HR professionals to play an important role in guiding managerial action
in an area where line managers appear to feel exposed. Efforts to manage pay budgets in somewhat prescriptive ways are challenged when, in a low inflation environment, movements between awards to individuals are in general minimal.
While the symbolism of differentiating between individual employees may be something that pay commentators have highlighted over the past few decades, in practical terms the question stands to be answered: ‘Is it worth the fuss?’ More importantly, are there risks to organisational cohesion when teamwork has become ever more important in a knowledge economy such as the UK’s and where interdependencies are key elements in managing to secure organisational effectiveness?
Perceptions of a lack of organisational justice on the part of large numbers of employees risk frustrating managerial efforts to secure the collective efforts of work teams in competitive conditions. This is likely to be the case whether or not the ‘justice’ anchors are policy, distributional, procedural or interpersonal. Further, HR guidance may wish to accent securing overall productivity – a factor that has been highlighted as a matter for concern across the UK economy, as growth and jobs have returned.
In terms of dialogue between individuals and their managers, closer attention may be called for in interpreting the survey findings
that point to the widening of criteria against which increases are made to an employee’s pay. In particular, greater account may have to be taken of what the individual brings to the role as well as what they do in applying their skills and competencies. A focus on how the individual performs as much as what they contribute to organisational effectiveness chimes with the foregoing observations on the decline in prescriptive pay management, and more stress on what is achieved collectively (rather than what is negotiated collectively), linked with judgement on what can be afforded – or rather the expected return on investment in pay, within overall budgetary considerations.
Here again sector divergences are marked, with single criterion pay progression still evident in the public and third sectors compared with private sector settings. Where more sophisticated judgements are being called for in pay management, of course, HR professionals advising their organisations should be highlighting the need for developing managerial capacity to act in ways that are credible and perceived as fair – as well as delivering the intended pay investment returns as part of overall value-based management demanded by organisational principals (for example shareholders and trustees). Also, keeping an eye on remaining attractive is particularly important to employers in a market where demand for expertise across the spectrum, from technical
33 | cipd.co.uk/rewardmanagementsurvey
innovation to securing front-line customer satisfaction, keeps the so-called war for talent alive.
Over-generalisation should, of course, be avoided: practice varies not just between sectors but among levels and other forms of segmenting the population being reported on. For example, it is likely that the greater skill needed to lead groups of employees under the conditions described will continue to imply premium rates of pay to attract and secure such talent. Whether pay management can be relied on to orientate the behaviour of such leaders once employed is an empirical question beyond the scope of this report.
Turning to performance-related pay, the theme of risk and sophistication continues. Rather than have the excuse of ‘wait and see’ for economic upturn enabling bonus-type payments to be on offer, the survey results raise the possibility, while not over-generalising from one cycle, that straight incentive and performance recognition payment arrangements are being downplayed in favour of the more sophisticated pay management of ‘base’ salaries for the reasons already described. Brown and Armstrong’s 1999 discourse on ‘paying for contribution’ may be worth revisiting – where first-generation individual PRP was examined and found wanting if more holistic reward management was desired to support aims of achieving overall organisational effectiveness.
Again, we may speculate that some of the interpretations of the so-called ‘new pay’ which emerged in the early 1990s are being set aside or at least tempered by contemporary operating conditions. Whatever is going on, HR professionals need to be ready to guide their management
colleagues in combining varieties of payment forms, not neglecting market competitiveness or value-for-money considerations, but finding ways of matching actions to particular organisational circumstances and the needs and expectations of employee segments. Skilful HR advice will be much in demand.
Despite the greater accent on project working, and apparent recognition of avoiding the use of pay schemes that may frustrate team co-operation to secure organisational value-creation and/or value-for-money goals, longstanding prescriptions in the HR literature around team-based pay do not seem to have gained traction in practice. The overwhelming focus remains on pay determination at the level of the individual employee – even where pay continues to be subject to collective bargaining and more rigid salary progression systems. Balancing this where profit-share and similar pay-based recognition processes apply, individualised pay-setting may be complemented by ‘bonuses’ distributed across the workforce at the corporate level (for example, the kind of annual partners’ rewards linked to corporate performance in the John Lewis Partnership).
Communication around pay and other employment rewards remains both managerially challenging and controversial. First of all, there is the question of where organisations seek to position themselves and the various employee segments in relation to drivers of pay determination and its review. As noted already, the sense of what can be afforded is reported as tempering what organisations aspire to in establishing and revising their reward management architecture. More qualitatively derived insights suggest a fair amount of iteration
‘Communication around pay and other employment rewards remains both managerially challenging and controversial.’
34 | Reward management survey 2014–15
as the interest groups making up organisations and those they account to and interact more widely with are factored in. Here again, HR professionals are required to exercise considerable skill in balancing various views while enabling corporate management to account to their principals in reward investment return terms.
Secondly, as our expert panel debated, especially with controversy continuing to rage around pay at the top of organisations and in sectors such as banking and finance, while the morality of transparency in pay determination is self-evidently viewed as significant, in practice organisations sometimes continue to apply ‘black box’ approaches. This despite the increasing efforts to regulate pay and enforce disclosure in the interest of politically sensitive corporate governance considerations. As the analysis towards the end of the report indicates, an increasing area of concern in many organisations is that of ‘engagement’: ties between workforce members and those employing them do appear to be weakening. Pay management is shown as requiring attention to a broader set of influencers; the most effective organisations, it may be reasoned, will be those which can overcome the adverse consequences of disengagement – or at least strike an instrumental bargain where employees commit to deliver what the organisation needs in return for more explicit guarantees on reward outcomes, provided these can be fully accounted for.
Finally, and perhaps unsurprisingly, findings on the range of questions around employment-related benefits confirm that attention is being given to dealing with continuing changes in the application and administration of occupational pension schemes. While sounding a note of caution on sampling variances, the results suggest that, as with the shifting emphasis in pay to more basic aspects, a greater rationalisation is under way in non-pay benefits – giving rise to the need for more effective scope for dialogue around employee choices and trade-offs while securing cost-effectiveness from an organisational standpoint. This is a further area where HR professionals involved in pay and benefits management may invest systemic time and attention.
Overall, then, the latest survey findings inform another interesting review of the UK reward management scene. At one level, innovation in technique appears low, while, on the other hand, we perceive innovation in managing the sensitivities around ‘getting pay right’ – the definitional anchors for deciding what is ‘right’ and the capacity managerially to account for it without adverse impacts on motivation across a multiplicity of stakeholders becoming increasingly diverse. In short, the HR community involved in advising their organisations in managing reward has a significant role to play, provided its members display high levels of expertise linked with political nous.
‘Innovation in technique appears low, while, on the other hand, we perceive innovation in managing the sensitivities around ‘‘getting pay right’’.’

35 | cipd.co.uk/rewardmanagementsurvey
Background to the report
This is the thirteenth survey of reward management by the CIPD. The main aims of the survey are to:
• inform the work of the CIPD on reward management
• provide readers with an information and benchmarking resource in respect of current and emerging practice in UK reward management.
The research was carried out between July 2014 and February 2015. The survey was sent out to senior reward/HR practitioners in the public, private and voluntary sectors. The number of respondents to this survey was 314. In order to increase the response rate, YouGov collected data from a further 211 respondents, bringing the final total to 525.
The following figures provide a breakdown of percentage of respondents by sector, by ownership and by size of organisation (number of employees).
Figure 16: Survey respondents, by sector (%)
Private sector services
Public services
Voluntary, community and not-for-profit
Manufacturing and production
47
14
18
20
Figure 17: Survey respondents, by geographic ownership (%)
Mainly UK-owned organisation
Division of internationally owned organisation
Division of mainly UK-owned organisation
78
17
5

36 | Reward management survey 2014–15
Figure 19: Survey respondents, by organisation size (number of employees) (%)
Figure 18: Survey respondents, by structural ownership (%)
Private sector – privately held
Private sector – publicly traded
81
19
SMEs (<250)
Large (250–9,999)
Very large (10,000+)59
7
34

37 | cipd.co.uk/rewardmanagementsurvey
Contributors
The team that helped to design the questionnaire, carry out the analysis and write the report were: Sarah Jones from the University of Bedfordshire, Liz Marriot, Stephen Perkins and Sue Shortland from London Metropolitan University and John Shields from the University of Sydney.
Our expert panel met on 17 April 2015 at the Guildhall Faculty of Business and Law, London Metropolitan University, and comprised: Neal Blackshire (Reward Manager, McDonald’s
Restaurants), Andrew Bridges (Reward Manager, John Lewis Partnership), Sylvia Doyle (Director, Reward First ® People Consulting), Mark Goodlake (Senior Director – Reward, Astellas), Richard Hortop (Director of Reward, BSkyB) and Bruce Sayers (Associate Consultant, Only People).
We would like to thank all the reward professionals who helped inform the questionnaire and report and especially members of the panel, who all gave up their valuable time to contribute.

Chartered Institute of Personnel and Development151 The Broadway London SW19 1JQ United KingdomT +44 (0)20 8612 6200 F +44 (0)20 8612 6201E [email protected] W cipd.co.ukIncorporated by Royal CharterRegistered as a charity in England and Wales (1079797) and Scotland (SC045154)
Issued: July 2015 Reference: 7042 © CIPD 2015