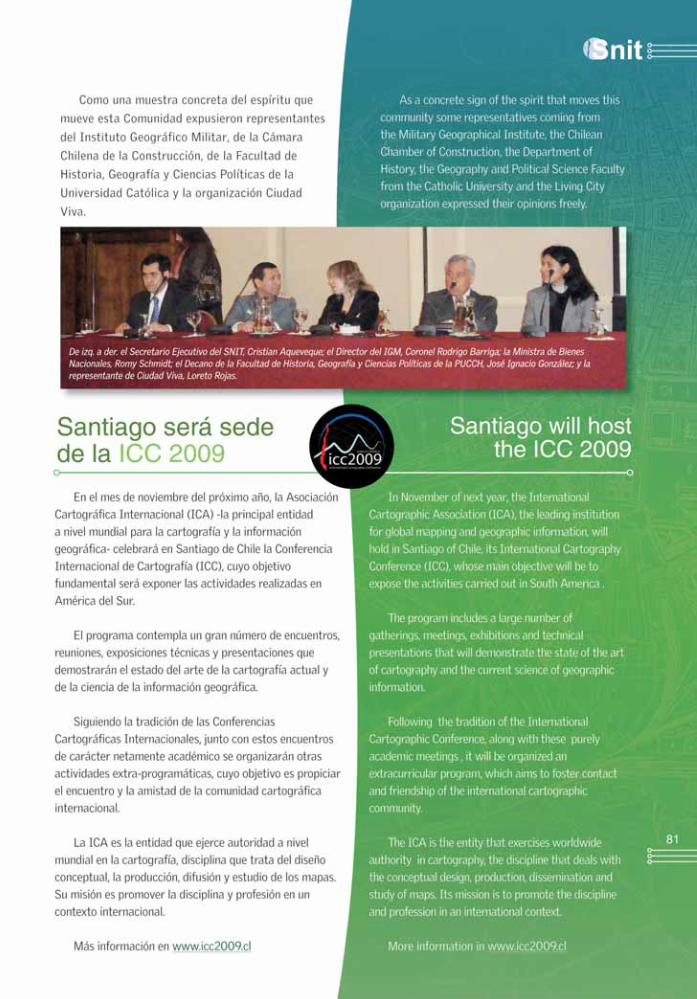
revista snit 2008
DESCRIPTION
Información TerritorialTRANSCRIPT


Índice
EDITORIAL. ROMY SCHMIDT CRNOSIJAMinistra de Bienes Nacionales, Presidenta del Consejo de Ministros de la Información TerritorialMinister of National Goods. President of the Council of Ministers of Territorial Information
SISTEMA NACIONAL DE COORDINACIÓN DE INFORMACIÓN TERRITORIAL (SNIT)Avances 2008 - Desafíos 2009Progress 2008 - Challenge 2009
EUROPEAN UMBRELLA ORGANISATION FOR GEOGRAPHIC INFORMATION (EUROGI)Cómo evaluar y controlar IDE. Estudio del caso del proyecto ESDI-NETHow to evaluate monitor assess SDIs. The case study of ESDI-NET project
INSTITUTO GEOGRÁFICO MILITAR (IGM)Información Territorial Básica: una necesidad urgente para el desarrollo del paísTerritorial Basic Information: an urgent need for development of the country
SERVICIO HIDROGRÁFICO Y OCEANOGRÁFICO DE LA ARMADA DE CHILE (SHOA)Proyecto CITSU del SHOA. Mitigando los efectos de un tsunami • CITSU Project from the Navy Hydrographic and Oceanographic Service. Mitigating the effects of a tsunami
SERVICIO AEROFOTOGRAMÉTRICO DE LA FUERZA AÉREA DE CHILE (SAF)Servicio Aerofotogramétrico de la FACH presenta nueva estación terrena satelitalAerophotogrametric Service Air Force introduces new satellite Ground Station
SECRETARÍA EJECUTVA SNITGeoportal de Chile: una novedosa herramienta para publicar datos espacialesGeoportal of Chile: a novel tool for publishing spatial data
PROGRAMA NACIONAL DE FISCALIZACIÓN DE TRANSPORTECentro Estratégico de Fiscalización de Transportes: Integrando la Informacion TerritorialGeorreferenciada a los procesos de fiscalización • Center for Strategic Survey of Transport: Integrating the Georeferenced Territorial Information to the control process
SERVICIO NACIONAL DE TURISMO (SERNATUR)Exitosa incorporacion de SIG a la Planificación y Gestión TurísticaSuccesful incorporation of planning and tourism management
CIUDAD VIVAUna experiencia de mapeo participativoAn experience of participatory mapping
CÁMARA CHILENA DE LA CONSTRUCCIÓNUso eficiente de los datos geoespaciales en la Gestión Privada y decisión de InversiónEfficient use of geospatial data in the Private Management and Investment decision
INSTITUTO DE GEOGRAFÍA DE LA PONTIFICIA UNIVERSIDAD CATÓLICA DE CHILEInformación territorial: Investigación, nuevos conocimientos y aplicaciones en el paísRegional information: Research, new knowledge and applications in the country
NOTICIASNews
2
4
13
18
22
30
34
44
51
58
64
72
78
1
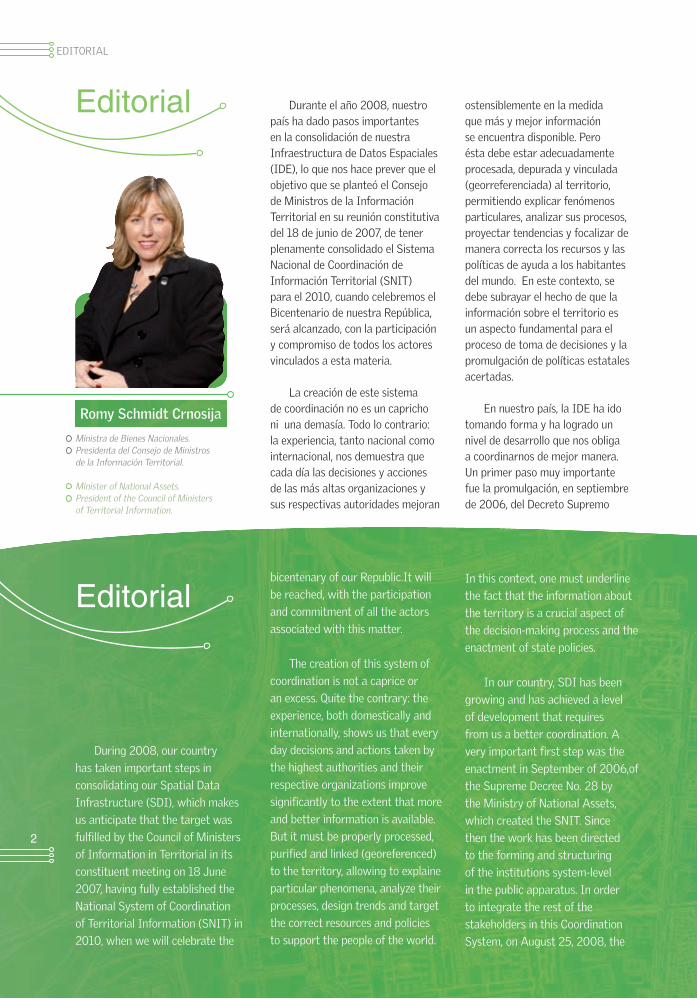
Romy Schmidt Crnosija
Ministra de Bienes Nacionales.Presidenta del Consejo de Ministros de la Información Territorial.
Minister of National Assets.President of the Council of Ministers of Territorial Information.
Durante el año 2008, nuestro país ha dado pasos importantes en la consolidación de nuestra Infraestructura de Datos Espaciales (IDE), lo que nos hace prever que el objetivo que se planteó el Consejo de Ministros de la Información Territorial en su reunión constitutiva del 18 de junio de 2007, de tener plenamente consolidado el Sistema Nacional de Coordinación de Información Territorial (SNIT) para el 2010, cuando celebremos el Bicentenario de nuestra República, será alcanzado, con la participación y compromiso de todos los actores vinculados a esta materia.
La creación de este sistema de coordinación no es un capricho ni una demasía. Todo lo contrario: la experiencia, tanto nacional como internacional, nos demuestra que cada día las decisiones y acciones de las más altas organizaciones y sus respectivas autoridades mejoran
Editorial
Editorial
During 2008, our country
has taken important steps in
consolidating our Spatial Data
Infrastructure (SDI), which makes
us anticipate that the target was
fulfilled by the Council of Ministers
of Information in Territorial in its
constituent meeting on 18 June
2007, having fully established the
National System of Coordination
of Territorial Information (SNIT) in
2010, when we will celebrate the
bicentenary of our Republic.It will
be reached, with the participation
and commitment of all the actors
associated with this matter.
The creation of this system of
coordination is not a caprice or
an excess. Quite the contrary: the
experience, both domestically and
internationally, shows us that every
day decisions and actions taken by
the highest authorities and their
respective organizations improve
significantly to the extent that more
and better information is available.
But it must be properly processed,
purified and linked (georeferenced)
to the territory, allowing to explaine
particular phenomena, analyze their
processes, design trends and target
the correct resources and policies
to support the people of the world.
In this context, one must underline
the fact that the information about
the territory is a crucial aspect of
the decision-making process and the
enactment of state policies.
In our country, SDI has been
growing and has achieved a level
of development that requires
from us a better coordination. A
very important first step was the
enactment in September of 2006,of
the Supreme Decree No. 28 by
the Ministry of National Assets,
which created the SNIT. Since
then the work has been directed
to the forming and structuring
of the institutions system-level
in the public apparatus. In order
to integrate the rest of the
stakeholders in this Coordination
System, on August 25, 2008, the
EDITORIAL
ostensiblemente en la medida que más y mejor información se encuentra disponible. Pero ésta debe estar adecuadamente procesada, depurada y vinculada (georreferenciada) al territorio, permitiendo explicar fenómenos particulares, analizar sus procesos, proyectar tendencias y focalizar de manera correcta los recursos y las políticas de ayuda a los habitantes del mundo. En este contexto, se debe subrayar el hecho de que la información sobre el territorio es un aspecto fundamental para el proceso de toma de decisiones y la promulgación de políticas estatales acertadas.
En nuestro país, la IDE ha ido tomando forma y ha logrado un nivel de desarrollo que nos obliga a coordinarnos de mejor manera. Un primer paso muy importante fue la promulgación, en septiembre de 2006, del Decreto Supremo
2

N°28 del Ministerio de Bienes Nacionales, que creó el SNIT. Desde ese momento el trabajo se ha orientado a la conformación y estructuración del sistema a nivel de las instituciones del aparato público. Con el fin de integrar al resto de los actores sociales a este Sistema de Coordinación, el 25 de agosto de 2008 se realizó el lanzamiento de la Comunidad Nacional de la Información Territorial, instancia de interacción entre el sector público y el privado, la academia y las organizaciones civiles, para que en conjunto desarrollemos la IDE de Chile.
Podremos discutir y acordar normas de representación cartográfica y sistemas de referencia, entre otros variados temas. Se abrirá el Catálogo de Metadatos de la Información Territorial al sector privado y académico para que puedan dar a
conocer la información geoespacial que están generando. También, será posible conocer las demandas por servicios, productos e información que los organismos del Estado requieren año a año. Además, las empresas proveedoras podrán informar sobre las características de sus ofertas de servicios y productos en materia de geomática. Toda esta interacción se realizará a través de la página Web del SNIT.
Lo anterior nos debe hacer destacar y recalcar más que nunca el rol que cumple la geo-información en la contribución del bienestar de la humanidad. La identificación de problemas -en medio ambiente, educación, salud, infraestructura, etc.-, la adecuada asignación de los recursos y el seguimiento y monitoreo de las soluciones que se implementen se facilita cuando existe una Infraestructura Nacional de Datos Geoespaciales que
organice la información, favorezca el desarrollo del recurso humano y permita la generación y/o adhesión a normas internacionales.
Este año 2008 también ha sido provechoso en el ámbito de la difusión, en el traspaso de experiencias, buenas prácticas y capacitación. A lo largo de estos meses se desarrollaron diversos seminarios, talleres, reuniones técnicas y cursos, orientados fundamentalmente, pero no exclusivamente, a profesionales del sector privado.
Una mención especial amerita el reconocimiento que en octubre se hizo, por parte del presidente de Environmental Systems Research Institute, al Sistema Nacional de Coordinación de Información Territorial, por su aporte al desarrollo de los Sistemas de Información Geográfica y a las Infraestructuras de Datos Espaciales.
Community National Territorial
Information was launched, which is
an instance of interaction between
the public and private sectors,the
academy and civil organizations, to
jointly develop the SDI of Chile.
We can discuss and agree on
rules for mapping and reference
systems, among other varied
topics. This opens the Metadata
Catalog of the Territorial
Information to the private
sector and academy in order
to raise the awareness of the
geospatial information. Also,
it will be possible to meet the
demands for the services, products
and information that state
agencies require year to year. In
addition,the firms may report
on the characteristics of their
products and service offerings in
geomatics. All this interaction will
be conducted through the website
of SNIT.
Then, we must highlight and
stress more than ever the role
of geo-information on the
contribution of the human welfare.
The identification of problems
in the environment, education,
health, infrastructure, etc .- The
appropriate allocation of resources
, tracking and monitoring
solutions which are implemented
is easier when there is a National
Geospatial Data Infrastructure
that organizes the information ,
favors the development of human
resources and allow the generation
and / or adherence to international
standards.
This year, 2008, has also been
beneficial in the dissemination
, the transfer of experiences
and the best practices and
training. Throughout these
months various seminars,
workshops, technical meetings
and workshops were conducted,
aimed primarily but not
exclusively to private sector
professionals.
Special mention highlights the
recognition that in October
was made by the President of
Environmental Systems Research
Institute, to National System
of Coordination of Territorial
Information, for its contribution
to the development of
Geographic Information Systems
and Spatial Data Infrastructures.
3

La construcción de
Infraestructura de Datos Espaciales
de Chile (IDE) ha tenido dos hitos
fundamentales en los últimos
años: la publicación en septiembre
de 2006 del Decreto Supremo
N°28, del Ministerio de Bienes
Nacionales (MBN), que creó el
Sistema Nacional de Coordinación
de Información Territorial (SNIT); y,
junio de 2007, cuando se constituyó
el Consejo de Ministros de la
Información Territorial, órgano
superior de esta institucionalidad
que abarca todas las entidades
de la administración del Estado
que generan o usan información
geoespacial pública.
En el presente año 2008,
del conjunto de actividades
desarrolladas, algunas de las más
relevantes fueron el lanzamiento
CristianAqueveque Iglesias
Secretario Ejecutivo SNITSNIT Executive Secretary
de la Comunidad Nacional de la
Información Territorial, evento
que se realizó el 25 de agosto,
y cuyo objetivo es sentar las
bases de lo que deberá ser
una alianza para que distintos
sectores de la sociedad trabajen
complementariamente en la
consolidación de una potente
Infraestructura de Datos
Geoespaciales en Chile.
La actividad fue encabezada por
la Ministra de Bienes Nacionales,
Romy Schmidt, en su calidad de
presidenta del Consejo de Ministros
de la Información Territorial, y
contó con la participación de unas
300 personas, entre representantes
de los sectores público, privado
y académico, además de
organizaciones ciudadanas. Otro
hecho importante, ocurrido en la
Sistema Nacional de Coordinación de Información Territorial
SISTEMA NACIONAL DE COORDINACIÓN DE INFORMACIÓN TERRITORIAL
Avances 2008 - Desafíos 2009
The construction of Spatial Data
Infrastructure of Chile (SDI), has
had two key milestones in recent
years: the publication in September
2006 of the Supreme Decree
No. 28, the Ministry of National
Assets (MBN), which created the
Coordination National System of
Territorial Information (SNIT)
and, in June 2007, the formation
of the Council of Ministers of the
Territorial Information,a superior
of what it should be an alliance for
the different sectors of the society
so as to work in a complementary
association and a powerful
Geospatial Data Infrastructure in
Chile.
The activity was led by the
Minister of National Assets,
Romy Schmidt, in her capacity
as chairwoman of the Council
of Ministers of the Territorial
body of the institution which
involves all the entities of the state
administration which generate or
use geospatial information service.
In the year 2008, a set of
activities were developed, some of
the most relevant were the launch
of the National Community of the
Territorial Information, an event
that took place on August 25, and
whose goal is to set the guidelines
National System of Coordination of Territorial InformationProgress 2008 - Challenge 2009
4

misma ocasión, fue la publicación en Internet del Portal de
Mapas de Chile (Geoportal.cl), una herramienta que permite
acceder de manera descentralizada a la cartografía que
diferentes instituciones del Estado tienen disponible en la Web
para integrarla a través de un visualizador de mapas.
Sin perjuicio de lo señalado anteriormente, no debemos
olvidar que entre los objetivos principales del SNIT se
encuentran el coordinar la acción del Estado en cuanto a
la gestión de la información territorial pública, garantizar
el acceso ciudadano a este tipo de información y otorgar
a las autoridades herramientas para la toma de decisiones
e implementación de políticas públicas. Estos objetivos se
enmarcan en los conceptos de modernización del Estado,
fortalecimiento de la democracia, transparencia activa y
gobierno cercano a la gente.
Lo indicado en los párrafos anteriores describe claramente
los dos ámbitos de acción a los que debe enfocarse la
Secretaría Ejecutiva del SNIT: uno técnico, tendiente a
desarrollar acuerdos y medios tecnológicos que apoyen el
desarrollo de la IDE; y otro político, orientado a generar y
mantener la institucionalidad que permita dar continuidad y
permanencia al trabajo de coordinación nacional, abriendo los
espacios necesarios para la discusión, acuerdos y normalización
del trabajo con información territorial. Así, el Plan de
Trabajo del SNIT, definido por el Consejo de Ministros de la
Información Territorial, da cuenta de las siguientes tareas
fundamentales:
ÁMBITO POLÍTICO O INSTITUCIONAL
Coordinación Nacional
El plan de trabajo que aprobó el Consejo de Ministros del
SNIT, contempla una serie de actividades orientadas a nivelar
el estado de avance de cada Coordinación Regional y Área
Temática. Los principales objetivos son: sancionar los datos
fundamentales para el país, adoptar y sancionar acuerdos
acerca de la responsabilidad institucional sobre los datos,
elaborar nuevos productos al servicio de la gestión y generar
condiciones de interoperabilidad de la información territorial.
En este contexto, las actividades a realizar en las distintas
instancias de coordinación están orientadas a consolidar la
oferta o la base de información territorial en cada uno de
ellos, y preparar los diversos productos para que queden en
condiciones de interoperar unos con otros.
Information, and it was attended by about
300 people, including representatives from
the public, private and academic sectors,
in addition to civic organizations. Another
important fact, occurred on the same
occasion, was the publication on the Internet
of Mapswebsite of Chile (Geoportal.cl), a
tool that allows the access in a decentralized
way to the cartography of different state
institutions , available on the Web so as to
integrate them through a display of maps.
Notwithstanding the paragraph above,
we must not forget that among the main
objectives of the SNIT are the coordination
of the action of the State in the management
of land information service, ensuring public
access to such information and giving the
authorities tools for decision making and
implementation of public policies. These goals
are within the concepts of modernization,
strengthening democracy, transparency and
an active government closer to people.
As indicated in the preceding paragraphs,
it clearly describes the two areas of action to
be approached the Executive Secretariat of
the SNIT: a technician, designed to develop
agreements and technological means to
support the development of SDI, and other
political goal, aimed at generating and
maintain the institutions which would enable
continuity and permanence to the work of
national coordination, opening up spaces for
discussion, agreement and work to normalize
the land information. Thus, the work plan of
the SNIT, defined by the Council of Ministers
of the Territorial Information, gives an
account of the following key tasks:
FIELD OR POLITICAL INSTITUTIONS
National Coordination
The work plan approved by the Council of
Ministers of SNIT, were a series of activities
aimed at leveling the progress of each
Regional Coordination and Thematic Area.
5

Para lograr llevar adelante esas tareas es fundamental el
compromiso de cada autoridad regional y ministerial, las que han
delegado en representantes la adecuada coordinación y gestión
de cada mesa regional o área temática. A la fecha, los avances
han sido disímiles, destacando el trabajo desarrollado por el Área
de Recursos Naturales, a cargo de la Ministra de Agricultura,
quien ha delegado en el Centro de Investigación de Recursos
Naturales (CIREN) la tarea de coordinar esta área. El detalle de los
encargados de las coordinaciones se puede apreciar en www.snit.cl,
en el vínculo “¿Qué es el SNIT?” y luego, en “Quiénes somos”.
En las Tablas N°1 y N°2, se aprecia el estado de las entregas
de los productos comprometidos en la primera etapa del Plan de
Trabajo, para las Coordinaciones Regionales y Áreas Temáticas.
Se espera que al iniciar el año 2009, la totalidad de las mesas de
trabajo tengan cumplida esta tarea.
Comunidad Nacional de la Información Territorial
La coordinación del SNIT, de acuerdo a lo que establece el
Decreto Supremo Nº28/2006, del MBN, abarca a las instituciones
que forman parte del Poder Ejecutivo, vale decir todos los
ministerios con sus correspondientes organismos dependientes
y expresiones regionales que generan o utilizan información
territorial. Prácticamente todas las funciones y obligaciones que
establece dicho cuerpo legal, están focalizadas en este conjunto de
instancias y no son extensibles al resto de la comunidad nacional.
No obstante, el mismo cuerpo legal establece que este sistema de
Tabla N°1: Coordinaciones Regionales.
REGIÓN ENTREGA PRODUCTOS 1ra ETAPA
Arica y Parinacota --
Tarapacá --
Antofagasta
Atacama
Coquimbo --
Valparaíso
Metropolitana de Santiago
Libertador General Bernardo O’Higgins --
Maule
Bío Bío
La Araucanía
Los Ríos Enero 2009
Los Lagos Diciembre 2008
Aysén del General Carlos Ibáñez del Campo
Magallanes y la Antártica Chilena
SISTEMA NACIONAL DE COORDINACIÓN DE INFORMACIÓN TERRITORIAL
The main objectives are: to punish the basic
data for the country, adopt and sanction
agreements on institutional responsibility
on the data, develop new products in
the service of management and create
conditions for interoperability of territorial
information.
In this context, the activities to be
carried out in different levels of coordination,
are aimed at consolidating the offer or the
territorial base of information on each of
them and prepare them for the various
products that are able to interoperate with
each other.
To accomplish these tasks is
fundamental to carry out a commitment
of each regional and ministerial
authority, which have delegated some
representatives in the proper coordination
and management of each regional bureau
or subject area. So far ,the progress has
been different, highlighting the work done
by the Department of Natural Resources,
headed by the Minister of Agriculture, who
has delegated to the Center for Research
on Natural Resources (CIREN) with the
task of coordinating this area. The detail of
those in charge of coordination can be seen
in www.snit.cl, the link “What is the SNIT?”
And then on “About Us”.
Tables No. 1 and No. 2 show the status
of deliveries of the products involved in the
first phase of the work plan for the Regional
Coordination and Themes. It is hoped that
by starting the year 2009, all the work
tables have accomplished this task.
National Community of the Territorial
Information
The coordination of SNIT, according
to the provisions of Supreme Decree No.
28/2006 of MBN, covering institutions that
are part of the executive branch, that is all
ministries with their dependent agencies and Table N°1: Regional Coordinator.
6

coordinación, debe asesorar en
la promoción de la comunidad
nacional de la Información
Territorial, y que al Consejo de
Ministros corresponde, entre
otras, proponer las acciones
necesarias para generar dicha
comunidad.
Es bajo esas premisas que
para este año, el Consejo de
Ministros de la Información
Territorial fijó como una de las
tareas relevantes el conformar
la Comunidad Nacional de la
Información Territorial, como
instancia de interacción entre
el sector público y el privado,
la academia, los municipios,
las organizaciones sociales y
la ciudadanía en general, con
el claro objetivo de avanzar de
manera conjunta y coordinada en
la consolidación de nuestra IDE.
SUBCOMUNIDADES MINISTERIO QUE COORDINA
Información Territorial Básica Defensa Nacional
Infraestructura Obras Públicas
Recursos Naturales Agricultura
Propiedad Hacienda
Planificación Territorial Vivienda y Urbanismo
Patrimonio Educación
Social Planificación
Tabla N°3: Ministerios encargados de coordinar Subcomunidades.Table N°3: Ministries in charge of coordinating subcommunities.
ACTIVIDADES RESPONSABLE COORDINACIÓN PLAZO
Abrir el Catálogo de Metadatos al sector privado y centros académicos para que publiquen e integren sus propios datos.
Secretaría Ejecutiva SNIT. 31 / 12 / 2008.
Revisión de perfiles y categorías del Catálogo de Metadatos.
Secretaría Ejecutiva SNIT – Coordinadores Subcomunidades.
31 / 12 / 2008.
Implementar un sistema de foros para el intercambio de ideas y discusión de aspectos
técnicos, en la página Web del SNIT.Secretaría Ejecutiva SNIT. 31 / 12/ 2008.
Elaborar recomendaciones técnicas para la publicación de cartografía en Web (servicios
de mapas).
Grupo de trabajo intersectorial específico, coordinado por Área de Información
Territorial Básica. 31 / 12 / 2008.
Elaborar estándares, recomendaciones y oficializar normas para el levantamiento, administración, representación de datos
fundamentales y temáticos.
Coordinadores Subcomunidades.
Primera etapa: Convocatoria a inscritos en Subcomunidades y definición de tareas,
objetivos, productos (recomendaciones técnicas, estándares y normas a elaborar).
Fecha tope: 31/ 03 / 2009.
Segunda etapa: Elaboración de estándares, recomendaciones y preparar oficialización de
normas, según corresponda.Fecha tope: 31 / 08 / 2009.
Elaborar propuesta de Ley de Información Territorial u otro mecanismo legal.
Secretaría Ejecutiva – Representantes Ministros en COMIT
31 / 08 / 2009.
Table N°4: Work Program of the National Community of the territorial Information.
Tabla N°4: Programa de Trabajo Comunidad Nacional de la Información Territorial.
Tabla N°2: Áreas Temáticas.
ÁREAS TEMÁTICAS ENTREGA PRODUCTOS 1ra ETAPA
Información Territorial
Infraestructura
Recursos Naturales
Propiedad
Planificación Territorial --
Patrimonio
Social
Table N°2: Themes.
7

Para permitir la participación
de todas las instituciones y
personas interesadas en estas
materias, se ha propuesto la
conformación de subcomunidades,
replicando a las Áreas Temáticas
del SNIT. Por lo anterior, se han
generado siete grupos de trabajo,
a cargo de los mismos ministros
responsables de la coordinación de
las áreas temáticas del SNIT (Ver
Tabla N°3).
Asimismo, el programa de
trabajo que se propone se ha
estructurado con actividades
mínimas y generales para las
subcomunidades (Ver Tabla N°4).
Como se puede apreciar, se
pretende avanzar de manera
conjunta y coordinada, aunando los
criterios y la experticia de diversos
actores en torno a la definición de
aspectos referidos a la información
territorial. Entre ellos destacan
el acceso, uso, certificación,
actualización permanente, costos,
propiedad intelectual, inventario, y
estandarización, sin dejar de lado
temas referidos a la capacitación,
financiamiento y difusión de
alternativas académicas, la
transparencia en las demandas y
ofertas de productos y servicios de
información territorial, por parte
de los organismos del Estado,
empresas privadas, universidades y
otras organizaciones.
Como se indica en la tabla
anterior, se privilegiará la
coordinación y la discusión a
través de la página Web del SNIT,
a la cual se le están realizando las
actualizaciones necesarias para ello.
Apoyo en las Regiones
Con el objetivo de apoyar
y reforzar las labores de los
Coordinadores Regionales, la
Secretaría Ejecutiva del SNIT
desarrolla una serie de actividades
en las distintas regiones del país,
que van desde la conformación
de las mesas regionales de
coordinación respectivas, a la
transferencia de capacidades
a nivel de usuarios y quienes
toman decisiones, con el fin de
optimizar el uso de la información
territorial. Ejemplos de lo anterior
son la capacitación para publicar
información en el Catálogo de
Metadatos, en los sistemas
de información geográfica y
publicación de cartografía en Web,
talleres con experiencias exitosas,
avances y buenas prácticas en la
SISTEMA NACIONAL DE COORDINACIÓN DE INFORMACIÓN TERRITORIAL
regional expressions that generate
or use territorial information.
Virtually all the duties and
obligations created by this body
of law, are targeted in this set of
instances and not be extended to
the rest of the national community.
However, the same body of law
establishes that this system
of coordination, should advise
the promotion of the national
community of Planning and
Information, which corresponds
to the Council of Ministers, among
others, proposing actions which
are necessary to create such a
community.
It is under these assumptions
for this year, that the Council
of Ministers of the Territorial
Information,set as relevant tasks
to form the National Community
of Territorial Information, as the
interaction between the public and
with the private sector, academia,
municipalities, social organizations
and citizens in general, with the
clear aim of moving forward on a
joint and coordinated manner in
the consolidation of our SDI.
To allow the participation of
all institutions and individuals
involved in these matters, the
formation of subcommunities,
replicating the Areas of SNIT has
been proposed. Therefore, it has
created seven groups of work, by
the same ministers responsible for
the coordination of the thematic
areas of the SNIT, see Table No. 3.
Likewise, the work program
is proposed,and it has been
structured with minimal activity
and for general subcommunities.
Table No. 4.
As you can see, we intend
to move forward on a joint and
coordinated approaches and
pooling the expertise of various
actors around the definition
of aspects related to land
information. These include access,
use, certification, updating, costs,
intellectual property, inventory, and
standardization; without neglecting
issues relating to training, funding
and dissemination of academic
alternatives, transparency in
claims , product offerings and land
information services, on the part of
state agencies, private companies,
universities and other organizations.
As shown in the table above,
the coordination and discussion
8

gestión de información territorial,
entre otras.
Para el desarrollo de estas
actividades y su éxito en cuanto
a instituciones y profesionales
participantes, se requiere primero
del concurso y compromiso de
quienes han sido delegados por
el intendente respectivo, como
encargados de la coordinación
regional. En la página www.snit.cl,
en los vínculos “¿Quiénes somos? y,
luego, “Coordinaciones Regionales”,
se entrega el detalle de cada uno
de los responsables del SNIT en
regiones.
Las actividades desarrolladas
en cada región dependen de lo
realizado en los dos años anteriores.
Durante el presente año, las
actividades han ido variado, siendo
las más destacadas la presentación
del SNIT a los gabinetes regionales
de las dos nuevas regiones,
operando desde octubre de 2007;
la capacitación en la publicación
de información en el Catálogo
de Metadatos, capacitación
en la coordinación virtual para
la Comunidad Nacional de la
Información Territorial, difusión del
Geoportal de Mapas, y talleres sobre
sistemas de información geográfica,
entre otras.
EN EL ÁMBITO TÉCNICO O DE LAS APLICACIONES
El Decreto Supremo
Nº28/2006, del MBN, señala
que el SNIT debe garantizar
a todos los ciudadanos la
posibilidad de conocer la
información territorial pública
que existe en los organismos
de la Administración del
Estado, así como aquélla que
éstas construyen, gestionan y
REGIÓN FECHAS DE ACTIVIDADES
Arica y Parinacota 05 al 07 de noviembre.
Tarapacá 13 y 14 de agosto.
Antofagasta 01 y 02 de septiembre.
Atacama 11 de agosto.
Coquimbo --
Valparaíso 29 de octubre.
Metropolitana de Santiago
12 y 27 de junio / 10 de julio / 18 de agosto / 02 de septiembre / 02 de
octubre.
Libertador General Bernardo O’Higgins 05 de febrero / 27 de noviembre.
Maule --
Bío Bío 24 y 25 de septiembre.
La Araucanía 11 y 12 de octubre.
Los Ríos 09 y 10 de junio.
Los Lagos 08 y 09 de septiembre.
Aysén del General Carlos Ibáñez del Campo 03 y 04 de abril.
Magallanes y la Antártica Chilena 12 y 13 de junio.
Table N°5: Activities of the SNIT Executive Secretariat in Regions - 2008. Tabla N°5: Actividades Presenciales Secretaría Ejecutiva SNIT en Regiones – 2008.
through the website of SNIT
will be priviliged, The necessary
updates are being made for that
purpose.
Support in Regions
With the objective to support
and strengthen the work of
the Regional Coordinators, the
Executive Secretary of SNIT
develops a series of activities in
different regions of the country,
ranging from the creation of
regional tables and their respective
coordination, the transfer of
skills at users level and decision
makers in order to optimize the
use of land information. Examples
of previous training are the
publishing of information in the
metadata catalog, in geographical
information systems and Web
mapping publishing, workshops
with successful experiences,
progress and good practices in the
management of land information,
among others.
For the development of
these activities and their success
in terms of institutions and
professionals involved, it requires
first of the competition and
commitment of those who have
been delegated by the respective
governor, as responsible for
regional coordination. On page
www.snit.cl the links “Who
are we? and then “Regional
Coordination”, shows the detail of
each of those responsible for the
SNIT in Regions.
9
administran, y las condiciones para su acceso. Para este
cumplir este objetivo, se han construido, y se encuentran
en desarrollo, un conjunto de soluciones, tales como:
el Portal Web SNIT; el Catálogo de Metadatos; el
Atlas Nacional SNIT (Geoportal de Mapas), y el nodo
proveedor estándar o Geonodo, creado con el objetivo de
implementar Sistema de Información Territorial (SIT) de
carácter regional o sectorial, entre otros.
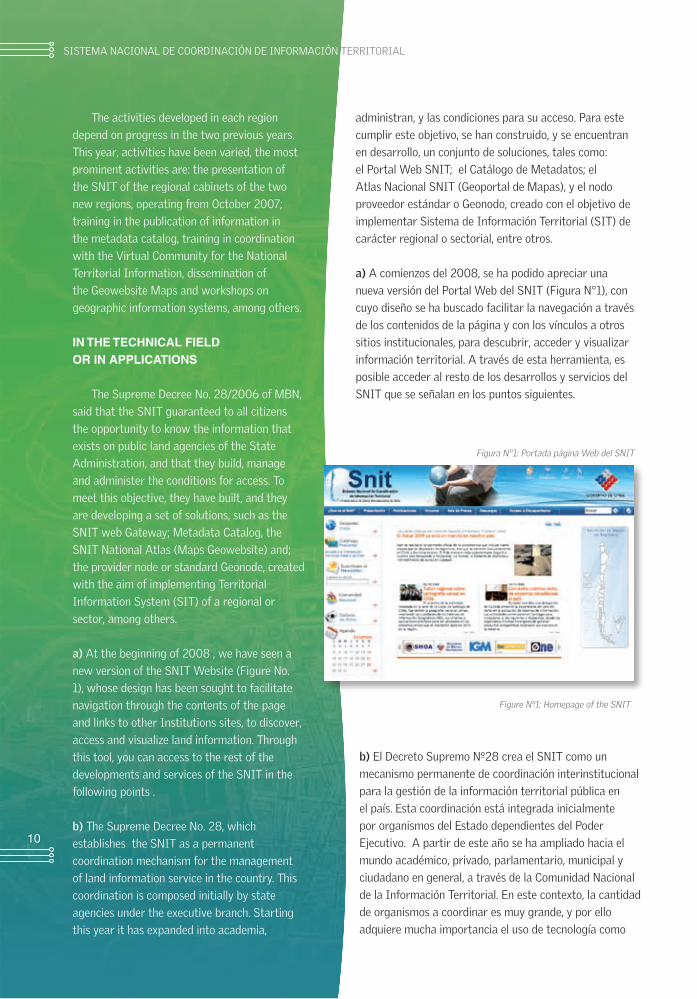
a) A comienzos del 2008, se ha podido apreciar una
nueva versión del Portal Web del SNIT (Figura N°1), con
cuyo diseño se ha buscado facilitar la navegación a través
de los contenidos de la página y con los vínculos a otros
sitios institucionales, para descubrir, acceder y visualizar
información territorial. A través de esta herramienta, es
posible acceder al resto de los desarrollos y servicios del
SNIT que se señalan en los puntos siguientes.
b) El Decreto Supremo Nº28 crea el SNIT como un
mecanismo permanente de coordinación interinstitucional
para la gestión de la información territorial pública en
el país. Esta coordinación está integrada inicialmente
por organismos del Estado dependientes del Poder
Ejecutivo. A partir de este año se ha ampliado hacia el
mundo académico, privado, parlamentario, municipal y
ciudadano en general, a través de la Comunidad Nacional
de la Información Territorial. En este contexto, la cantidad
de organismos a coordinar es muy grande, y por ello
adquiere mucha importancia el uso de tecnología como
Figura N°1: Portada página Web del SNIT
SISTEMA NACIONAL DE COORDINACIÓN DE INFORMACIÓN TERRITORIAL
The activities developed in each region
depend on progress in the two previous years.
This year, activities have been varied, the most
prominent activities are: the presentation of
the SNIT of the regional cabinets of the two
new regions, operating from October 2007;
training in the publication of information in
the metadata catalog, training in coordination
with the Virtual Community for the National
Territorial Information, dissemination of
the Geowebsite Maps and workshops on
geographic information systems, among others.
IN THE TECHNICAL FIELDOR IN APPLICATIONS
The Supreme Decree No. 28/2006 of MBN,
said that the SNIT guaranteed to all citizens
the opportunity to know the information that
exists on public land agencies of the State
Administration, and that they build, manage
and administer the conditions for access. To
meet this objective, they have built, and they
are developing a set of solutions, such as the
SNIT web Gateway; Metadata Catalog, the
SNIT National Atlas (Maps Geowebsite) and;
the provider node or standard Geonode, created
with the aim of implementing Territorial
Information System (SIT) of a regional or
sector, among others.
a) At the beginning of 2008 , we have seen a
new version of the SNIT Website (Figure No.
1), whose design has been sought to facilitate
navigation through the contents of the page
and links to other Institutions sites, to discover,
access and visualize land information. Through
this tool, you can access to the rest of the
developments and services of the SNIT in the
following points .
b) The Supreme Decree No. 28, which
establishes the SNIT as a permanent
coordination mechanism for the management
of land information service in the country. This
coordination is composed initially by state
agencies under the executive branch. Starting
this year it has expanded into academia,
Figure Nº1: Homepage of the SNIT
10

INSTITUCIÓN FICHAS PUBLICADAS
Corporación Nacional Forestal 3.086
Instituto Geográfico Militar 1.916
Ministerio de Bienes Nacionales 961
Ministerio de Vivienda y Urbanismo 482
Instituto Nacional de Estadísticas 378
Comisión Nacional de Riego 264
Gobierno Regional Metropolitano de Santiago 263
Servicio Nacional de Geología y Minería 179
Servicio Hidrográfico y Oceanográfico de la Armada de Chile 153
Centro de Información de Recursos Naturales 128
Instituto de Investigaciones Agropecuarias 128
apoyo a las tareas de coordinación. En la Figura
N°1, es posible apreciar que se ha generado una
Comunidad Virtual, orientada a facilitar dicha
coordinación, propiciando la creación de grupos de
interés y foros de discusión.
c) Durante el presente año, se ha puesto a
disposición una nueva versión del Catálogo de
Matadatos de la Información Territorial (Figura
N°2), buscando hacer más fácil la navegación,
creación, publicación y búsqueda multicriterio de las
fichas de metadatos.
Al cierre de la presente edición de la Revista
SNIT 2008, existen 8.500 fichas en el catálogo,
generadas por 36 servicios públicos. Las 10
instituciones con mayor cantidad de productos
publicados se presentan en la Tabla N°6.
d) Se encuentra operando y disponible en
Internet, desde agosto de 2008, el Portal de
Mapas del SNIT (www.geoportal.cl), el cual apunta
a la posibilidad de realizar análisis conjunto de
información que reside en distintas instituciones
y de manera dispersa en el territorio en forma
digital y automatizada a través de Internet, con
miras a facilitar la eficiente toma de decisiones.
Tiene la forma de un sistema distribuido basado en
Figura N°2: Interfaz de búsqueda avanzada del Catálogo de Metadatos, accesible a través de: www.snit.cl
Figure N°2: Interface of advanced search of the metadata catalog , accessible through: www.snit.cl
Tabla Nº6: Instituciones del Estado con más fichas publicadas. *
Table Nº6: Institutions of the State with more cards issued. *
* Information in late October 2008.
* Información a fines de octubre de 2008.
private, parliamentary, municipal and general public,
through the “ National Community of Territorial
Information.” In this context, the number of agencies
to coordinate is very large, and therefore becomes
very important the use of technology to support the
coordination. In Figure 1, you may notice that there
has been a “Virtual Community”, aimed at facilitating
such coordination, advocating the creation of interest
groups and discussion forums.
11

la alimentación (Nodos Proveedores)
de un portal único de mapas (Nodo
Central), a través de servicios de mapas
(Web Map Services), (ver Figura N°3).
Más detalles de esta herramienta se
entregan en esta misma Edición de la
Revista SNIT 2008.
e) Finalmente, se deben mencionar dos
nuevos desarrollos que, en el presente
año 2008, están en proceso de
construcción: uno de ellos es el Nodo
Proveedor Estándar o Geonodo, cuyo
objetivo es generar una herramienta
con códigos abiertos, que permita
publicar cartografía digital a través
de la Web, y que será entregada a
diversas instituciones del Estado.
La otra herramienta en
construcción es el Módulo de
Difusión Educativa (MDE), que
apunta a generar una aplicación en
Internet, orientada al ciudadano
común, que no necesariamente
puede interactuar fácilmente con las
herramientas que habitualmente se
encuentran disponibles en la Web. Los
contenidos de este módulo se están
organizando de manera de seguir los
planes educaciones del Ministerio de
Educación de Chile y, en el transcurso
del año 2009, se pretende avanzar
en la generación masiva de sus
contenidos.
Figura N°3: Página de inicio del Geoportal de mapas, accesible a través de: www.snit.cl
SISTEMA NACIONAL DE COORDINACIÓN DE INFORMACIÓN TERRITORIAL
c) During this year, a new version of the Matadata Catalog of
Territorial Information has been available (Figure No. 2), in order
to make easier the navigation , the creation,the publishing and the
search of metadata multi-chip.
At the close of this snit journal edition 2008, there were 8500
chips in the catalog, generated by 36 utilities. The 10 institutions
with the largest number of published products are presented in
Table No. 6.
d) It is operating and available on the Internet since August 2008,
the SNIT Map Website (www.geoportal.cl), which suggests the
possibility of undertaking joint analysis of information residing in
different institutions and dispersed in the territory in digital form
and automated via the Internet, to facilitate an efficient decision-
making. It has the shape of a system based on the distributed food
(Providers Node) from a single website for maps (Central Node),
via mapping services (Web Map Services), (see Figure No. 3). More
details of this tool are delivered in the same edition of the SNIT
Journal 2008.
e) Finally, we should mention two new developments which, in the
year 2008, are under construction: one of them is the Standard
Provider Node or Geonode, whose goal is to generate a tool with
open source codes, allowing the publishing of digital maps through
the Web, and which will be delivered to various state institutions.
The other tool under construction is Broadcast Education
Module (MDE), which aims to create an application on the
Internet, targeting ordinary people, who can not interact easily
with the tools which are routinely available on the Web. The
contents of this module, are being organized so as to continue with
the educational plans of the Ministry of Education of Chile and, in
the year 2009, aims to advance in the massive generation of its
contents.
Figure N°3: Home of the Geowebsite of maps, accessible through: www.snit.cl
12

mejor posibilidad en la promoción
del diálogo transfronterizo y el
intercambio de buenas prácticas en
materia de Infraestructuras de Datos
Espaciales (IDE) en este continente.
La propuesta se ha presentado
en una convocatoria lanzada por
la Comisión Europea, y el proyecto
eSDI-NET (www.esdinetplus.eu) se
ha financiado y se comenzó hace un
año atrás.
El proyecto tiene como objetivo
reunir a los principales interesados
de IDE de Europa con el objetivo
de realizar una plataforma para la
comunicación y el intercambio de
conocimientos en todos los niveles,
abracando desde lo local a lo global.
Compartir los conocimientos y la
información es crucial para fomentar
las buenas prácticas y que éstas
sean asimiladas por todos los socios.
En la actualidad, la red incluye
Cómo evaluar y controlar la Infraestructura de Datos Espaciales
Estudio del caso del proyecto eSDI-NET
Mauro Salvemini
Profesor en la Universidadde la Sapienza de RomaPresidente de EUROGI
Professor at SapienzaUniversity of Rome President of EUROGI
Same years ago during an
European Conference about
geographic information I poroposed
and discussed with the Secretary
general of EUROGI at that time Mr.
Bino Marchesini and with the director
of the GIS of the Piemonte Region
Mr. Luigi Garretti the opportunity to
investigate how different regions of
European nations could contribute
to exchange spatial information for
the benefit of the European citizens
How to evaluate and monitor assess SDIsThe case study of eSDI-NET project
Años atrás, durante una
Conferencia Europea sobre
información geográfica propuse y
discutí con el Secretario General
de EUROGI en ese momento, Bino
Marchesini, y con el director del
SIG de la Región Piemonte, Luigi
Garretti, la conveniencia de investigar
la forma en que diferentes regiones
de las naciones europeas podrían
contribuir para el intercambio de la
información espacial para el beneficio
de los ciudadanos y para tener la
and for having the best possibility for
promotion of cross border dialogue
and exchange of best practices on
Spatial Data Infrastructures (SDI’s)
throughout Europe.
The proposal has been presented
in a call launched by the European
Commission and the project eSDI-
NET (www.esdinetplus.eu) has been
financed and started about one year
ago.
The aim is to bring together all stakeholders in order to realize an SDI platform for communication and exchange of knowledge throughout Europe.
EUROPEAN UMBRELLA ORGANISATION FOR GEOGRAPHIC INFORMATION
El objetivo es reunir a todos los interesados IDE para concretar una plataforma para la comunicación y el intercambio del conocimiento en Europa.
13

21 participantes de toda Europa entre asociaciones,
institutos, universidades y empresas privadas cuya
labor está relacionada con la información geográfica,
promoviendo el diálogo entre todos ellos.
El objetivo principal de esta red temática es la
promoción al más alto nivel de decisiones y discusiones
técnicas, con el fin de aumentar la conciencia de la
importancia de la IDE. Los Sistemas de Información
Geográfica (SIG) han cambiado la forma como se
maneja la información espacial, representando un euro
multibillion de la industria. Sin embargo, esta tecnología
sólo alcanzará su pleno potencial cuando los gobiernos
se decidan a aprovechar al máximo el acceso a la los
Ssitemas de Información Geográfica a través de los IDE.
La Infraestructura de Datos Espaciales desempeña un
papel fundamental en el enriquecimiento y la reutilización
de la información geográfica. El IDE es definido por la
Directiva INSPIRE (http://inspire.jrc.ec.europa.eu/) como
el conjunto de “metadatos, espaciales y de servicios de
datos espaciales; de tecnologías de red; de acuerdos
sobre puesta en común, el acceso y la utilización; la
coordinación y supervisión de mecanismos, procesos
y procedimientos establecidos, gestionados o puestos
a disposición“. Ellos proporcionan una completa base
The project is aiming to bring together key
stakeholders of European SDIs and to realise a
platform for communication and exchange of
knowledge at all levels, from local to global. Share
knowledge and information is crucial to foster
best practices and assimilate them by all partners.
Currently the network involves 21 participants all
over Europe and includes Associations, Institutes,
Universities, Private Companies whose work is
related with Geographic Information, and promotes
dialogue between them.
The main objective of this Thematic network
is to promote high-level decisions and technical
discussions, in order to raise awareness of the
SDI’s importance. Geographic Information Systems
(GIS) have changed the way spatial information
is handled, and they represent a multibillion euro
industry. Nevertheless, this technology will only
reach it’s full potential when governments decide to
maximise access to GI through SDI’s.
Spatial Data Infrastructures play a key
role in the enrichment and reuse of Geographic
Information. SDI is defined by INSPIRE Directive
(http://inspire.jrc.ec.europa.eu/) as “ metadata,
Fig 1. Arquitectura Técnica de un SDI (proveniente del Proyecto INSPIRE de normas de aplicación del Reglamento).
Fig 1. Tecnical architecture of an SDI(from INSPIRE Draft Implementing Rules).
APLICACIÓN Y GEOPORTALES
Servicio de Bus
Capas GeoRMCapa deServicio
TWG TWG TWG
Fuentede Datos Registros
Set deDatos
Espaciales
Ser
vici
o de
Met
adat
os
Set
de
Dat
osM
etad
atos
Serviciode Registro
Servicio deDescubrimiento
Serviciode Vista
DSTemático
Estructurapara armonizar
el DS
Serviciode Bajada
Servicio deTransferencia
Servicio deInvocación SD
EUROPEAN UMBRELLA ORGANISATION FOR GEOGRAPHIC INFORMATION
DT DTMD DS
DT
NS
14

para el descubrimiento, evaluación y aplicación de datos
espaciales.
La gran diversidad y variedad de aplicaciones
que tienen los SIG los hace potencialmente enormes,
sin embargo, sólo tendrán un impacto positivo si se
aplican en los distintos niveles: locales, nacionales y
transnacionales.
Se estableció que los datos y los recursos deben
mantenerse en el nivel más adecuado estableciendo
para ello una estructura que los distribuye, con el fin de
garantizar un amplio acceso a los datos (Figura 1).
Trabajar en un contexto Europeo que transcienda las
fronteras, significa hacer frente a temas multiculturales
y multilingües, y también abracar temas como la
interoperabilidad, el uso de normas, el acceso, la
explotación, el uso y la reutilización de los SIG.
Inmediatamente después de la reunión de lanzamiento
del proyecto eSDI-NET, en septiembre de 2007 y
después de la ejecución de algunos talleres, ha quedado
absolutamente claro la necesidad de establecer una
metodología para identificar y comparar las iniciativas
IDE, basada en soluciones técnicas existentes.
Con el fin de analizar la reutilización y la interoperabilidad
de las soluciones para las respectivas IDE, se aplicarán
los siguientes indicadores:
• Evaluación de IDE
• Creación de redes de evaluación de personas
• Análisis social del impacto económico
• Evaluación de capacidades organizacionales
• Hacer frente a los aspectos jurídicos
• Funcionalidades, servicios y componentes técnicos
spatial data sets and spatial data services;
network services and technologies; agreements
on sharing, access and use; coordination
and monitoring mechanisms, processes and
procedures, established, operated or made
available”; SDI provides a basis for spatial data
discovery, evaluation, and application.
Since the range and diversity of GIS
applications is tremendous the full potential of
this positive impact of GIS can only be realised
if the necessary SDIs are implemented at the
respective local, national, and transnational levels.
The Directive states that data and resources
should be maintained at the most appropriate
level; an architecture, as it possible to see in Fig.
1, distributes them, in order to guarantee a wide
access to data. Working in a European and cross
border context means to tackle multicultural
and multilingual issues, and also afford themes
like the interoperability, the use of standards, the
access, exploitation, use and reuse of GI.
Immediately after the kick-off meeting of the
eSDI-NET project in September 2007 and after
running some workshops , it has been absolutely
clear that a methodology was needed to identify
and compare existing SDI initiatives, according to
the state of the art of technical solutions.
In order to analyse the reusability and
interoperability solutions of the respective
SDIs the following indicators will be applied to
measure and identify best-practice:
• SDI usage assessment
• Networking people assessment
• Socio-economic impact analysis
• Organisational assessment
• Coping with legal aspects
• Technical functionalities/facilities/components.
The indicators and the detailed parameters
have been proposed by some partners of
the consortium principally by the Sapienza
University of Rome (www.labsita.org) LABSITA -
Laboratorio di Sistemi Informativi Territoriali ed
15

Los indicadores y parámetros han
sido propuestas por algunos socios
del consorcio, principalmente por la
Universidad Sapienza de Roma, el
Laboratorio di Sistemi Informativi
Territoriali ed Ambientali de la
Universidad Sapienza de Roma,
(www.labsita.org) LABSITA . La
investigación ha sido presentada
en la Conferencia AGILE 2008
y se publica en el link. (http://
nettuno.arc.uniroma1.it/wordpress/
wp-content/uploads/2008/05/
mercadante-evaluation-of-italian-
regional-geoportals-agile-2008.
pdf), y por la asociación paneuropea
EUROGI (www.eurogi.org) a través
de la participación de sus miembros
provenientes de los Estados
miembros de la Unión Europea.
La metodología utilizada en el
análisis se basa en una definición
Toda la información acerca de
los geoportales se ha recogido a
través de Internet, no intranet o
una red interna que necesita de
una contraseña, porque el límite
de acceso impide que un usuario
común acceda a la consulta de
datos.
Junto con esta metodología,
también se ha utilizado un enfoque
INSPIRE. Por esta razón, los
geoportales han sido estudiados
y comparados sobre la base de
algunas características comunes,
Ambientali- of the Sapienza University of Rome; the
research has been presented at the AGILE Conference
2008 and is published at the following link (http://
nettuno.arc.uniroma1.it/wordpress/wp-content/
uploads/2008/05/mercadante-evaluation-of-italian-
regional-geoportals-agile-2008.pdf) and by the pan
European association EUROGI (www.eurogi.org)
through the participation of the his national members
coming from the member states of the European
Union.
The methodology used in the analysis is based
on a progressive definition of Criteria- Parameters
–Measure (the so called CIM method); the parameter
used are defined as SMART (Simple- Measurable,
Attainable, Reliable, Time bounding).
The report is based on the analysis of regional
web sites from the point of view of an external
user - who may be a citizen and/or another public
administration officer - who faces for the first time a
regional geowebsite.
All the information about the geowebsites have
been collected through internet; no intranet or internal
net that needs a password has been taken into
account, because the limit of access that prevent a
common user from consulting data.
Together with this approach, also an INSPIRE
approach has been used, to analyse the impact of
the Directive. For this reason the geowebsites have
been studied and compared on the base of some
features, that are the basic elements of a Spatial Data
Infrastructure: “metadata, spatial data sets and spatial
data services; network services and technologies;
agreements on sharing, access and use; and
coordination and monitoring mechanisms, processes
and procedures”. (EC, 2007). This approach is based on
parameters studied also by INSPIRE working groups.
progresiva usando el método CIM
(Criterio- Parámetro-Medida);
mientras que el parámetro utilizado
es el conocido como SMART
(Simple-Medible, Accesible- Fiable-
Permanente en el tiempo).
El informe se basa en el análisis
de los sitios web regionales desde
el punto de vista de un usuario
externo -que puede ser cualquier
persona y/o un funcionario de la
administración pública- que se
enfrenta por primera vez a un
Geoportal regional o local.
EUROPEAN UMBRELLA ORGANISATION FOR GEOGRAPHIC INFORMATION
16
is continuing since some analysis have been already
finalised in countries such as Italy , Czeck Republik,
Hungary and some other workshops and findings
are going to be obtained within the first quarter
of 2009 in Benelux; Scandinavia; UK/Ireland;
Germany/Austria/ Switzerland; Spain/Portugal and
France.
It is wise to note that SDIs are quite complicate
infrastructures to be realised and that they need a
continuous maintenance and monitoring in order to
guarantee the services which they offer and to be
ready to support the governance of the territory.
After my visit at IGM Chile and the SNIT on
the beginning of this year and being aware of the
impressive progresses which are achieved day after
day by the SNIT I am sure that results of the eSDI-
NET project might be very useful even for Chile and
for other Nations of Southern America.
que son elementos básicos de
una IDE: “metadatos, conjuntos
de datos espaciales y servicios
de datos espaciales; servicios y
tecnologías de red; los acuerdos
de intercambio, el acceso y el uso
y mecanismos de coordinación
y vigilancia, procesos y
procedimientos”, (CE, 2007). Este
enfoque se basa en los parámetros
estudiados también por los grupos
de trabajo INSPIRE.
El análisis abarcó dos dominios
principales: el uso del Geoportal
y las funcionalidades técnicas
ofrecidas por los geoportales.
Desde el punto de vista del
usuario común, las características
fundamentales que han sido
consideradas son la visibilidad, la
accesibilidad y la coherencia de
la terminología para definir los
instrumentos y el análisis de la
interfaz de usuario.
Los servicios más importantes
considerados son la presencia de
metadatos, el cumplimiento de las
normas de metadatos, la presencia
del catálogo de metadatos,
características de los servicios, la
presencia de servicios de descarga
y la posibilidad de descargar los
servicios.
De esta manera, los datos y la
información en relación a la
IDE se ha recolectado por toda
Europa, a nivel regional, nacional
y continental. El proceso es
continuo, ya que algunos análisis
han finalizado en países como
Italia, República Checa, Hungría
y algunos otros talleres y las
conclusiones se obtendrán en el
primer trimestre de 2009 en el
Benelux, Escandinavia, Reino
Unido, Irlanda, Alemania, Austria,
Suiza, España, Portugal y Francia.
Es prudente señalar que las IDE
son infraestructuras bastante
complicadas y que necesitan
un continuo mantenimiento y
vigilancia, con el fin de garantizar
los servicios que ofrecen para
estar dispuestos a apoyar la
gestión del territorio.
Después de mi visita al IGM y al
SNIT en Chile, a comienzos de
este año, he quedado gratamente
sorprendido de los progresos
que se logran día a día en estas
instituciones. Por eso, estoy
seguro de que los resultados del
proyecto eSDI-NET podrán ser
de utilidad tanto para Chile como
para otras naciones de América
del Sur.
The analysis assessed two domain mainly: use of
geowebsites and technical functionalities offered by
geowebsites.
Starting from the user point of view, the key
characteristics that have been considered are the
visibility, the accessibility and the consistency of
terminology to define the instruments used by
common user, the analysis of user interface.
The most important services considered have
been: the presence of metadata, the compliance of
metadata with standards, the presence of catalogue
for metadata, view services characteristics, presence
of download services and possibility to download
services.
In this way, data and information have been
gathered already about SDIs spread all over Europe,
at regional, national and European level. The process
17

Hoy en día ningún país puede avanzar y desarrollarse plenamente, sin un conocimiento real de su territorio o espacio físico donde sus habitantes realizan sus actividades. El territorio constituye un bien fundamental que se debe conocer, cuidar y administrar para el bienestar de los seres humanos que viven y se desarrollan en él.
Luego, el conocimiento real del territorio de un país adquiere un rol fundamental para su desarrollo, para su soberanía y la correcta toma de decisiones. Soluciones a problemas de defensa, medioambientales, de delincuencia, de ubicación de polos de desarrollo, de planificaciones y estrategias militares, de usos y explotación de suelos, desarrollo empresarial, ubicación de centros urbanos, de estudios después de desastres y otras tantas,
Este proyecto satisface en un período de seis años este requerimiento al contemplar la generación de Información Territorial Base de aproximadamente 146 centros urbanos y de los sectores rurales de mayor importanciadel país.
Instituto Geográfico Militar presenta su proyecto Cono Sur
Información Territorial Básica: una necesidad urgente para el desarrollo del país
Today no country can move
forward and develop fully, with no
real knowledge of their territory
or physical space where the
inhabitants perform their activities.
The territory is a fundamental
good, to be known, to care for and
manage for the welfare of human
beings who live and develop their
activities.
Then the real knowledge of the
territory of one country acquires
a fundamental role for its
Military Geographical Institute introduces its Southern Cone project
Territorial Basic Information: an urgent need for development of the country
This project will meet in a period of six years this ITB generation requirement in approximately 146 urban centers and rural areas of greatest importance in the country.
INSTITUTO GEOGRÁFICO MILITAR
InstitutoGeográfico Militar
18

son sólo un ejemplo de algunas de las muchas áreas que requieren de una clara información del terreno y más aún, no es posible tomar decisiones sin el conocimiento real y oportuno de la realidad de territorio y su entorno.
En este contexto, la cartografía se instaura como la herramienta donde se representa la realidad del territorio y constituye la base georreferenciada donde los diferentes actores de un país pueden volcar su información, compartirla, complementarla y definir acciones documentadas e informadas para tomar decisiones.
La cartografía que existe en el medio nacional, tanto en los organismos del Estado como en los particulares, tiene características básicas distintas que no la hacen apropiada para ser utilizada como una información con una base sólida y bien estructurada. Se encuentra en diferentes formatos,
con precisiones desconocidas, con diferentes sistemas de referencia geodésicos, obtenida por diversos medios de compilación, sectores levantados por diferentes organismos.
No obstante, también existe cartografía oficial, generada por los organismos dispuestos por Ley para cumplir con esta obligación, que son el Instituto Geográfico Militar, en el ámbito terrestre, el Servicio
Aerofotogramétrico en el ámbito aéreo, y el Servicio Hidrográfico y Oceanográfico de la Armada en el ámbito marítimo. Estos generan cartografía a nivel nacional pero no de detalle.
El avance tecnológico, la gran variedad y cantidad de información que se requiere conocer y la necesidad de cruzarla entre los diferentes ministerios y áreas del quehacer nacional, hace
Cartografía Urbana. Urban Cartography.
development, for its sovereignty and the proper decision-
making. Solutions to problems of defense, environment,
crime, the location of poles of development, planning
and military strategies,the use and exploitation of soil,
business development, location of urban studies after
disasters and the like, are only a sampling of some of
the many areas that require clear information from the
field and even more , it is not possible to make decisions
without the knowledge of the real and timely reality of
the territory and its surroundings.
In this context, cartography is a mapping tool which
represents the reality of the territory and constitutes the
georeferenced basis where the different participants
from one country can transmit , share , and complement
the information taking documented and informed
action for the decision-making.
National Cartography , both in private and the
state organisms, has some features which make
it unappropriate to be used as a strong and well
structured information base. It is found in different
formats, with unknown details , with different
geodetic reference systems, obtained through various
compilation means , sections taken from different
agencies with different basic characteristics.
But there is also an official mapping, generated by
the agencies which are mandated by law to comply
with this obligation such as the Military Geographical
Institute, in the land, the Airphotogrametric Service
in the aviation sector and the Hydrographic and
Oceanographic Service from the Navy in the maritime
sector, which generates mapping at the national level
but not in detail.
The Technological advance, the large variety and quantity of information that is required to know and the need to cross this among the various ministries and areas of national affairs, requires a detailed
19

necesaria una cartografía de detalle que muestre en los sectores urbanos, las casas y propiedades, las calles, las avenidas y los pasajes, en la que se pueda trabajar, asociar otro tipo de información, su información puntual y otra, ocurriendo lo mismo en el sector rural.
El Proyecto Información Territorial Básica del País “Cono Sur”, generado y presentado por el Instituto Geográfico Militar, satisface en un período de seis años esta necesidad nacional al contemplar la generación de Información Territorial Básica (ITB) a escala 1:1.000 de aproximadamente 146 centros urbanos y cartografía a escala 1:10.000 de los sectores rurales de mayor importancia del país.
Para avanzar de manera ordenada y estructurada en la materialización del proyecto, se ha conformado una orgánica al amparo del SNIT, de manera que las gestiones para su financiamento y materialización se realicen de manera organizada y estructurada, ante lo cual se ha constituido la siguiente distribución (Fig. 1):
En el mes de julio 2008 la Secretaría Técnica del SNIT, a través de la Presidenta del Comité de Ministros de la Información y el Territorio, remitió el proyecto al Ministerio de Hacienda para asignación de presupuesto para su financiamiento.
Desde el punto de vista técnico, se contempla dar cumplimiento al Proyecto en un tiempo máximo de seis años y avanzar paralelamente con la cartografía urbana y rural de acuerdo a las siguientes prioridades:
mapping showing the houses and properties, streets, the avenues, passages in urban areas, which can be worked ,and the association of other on time information, which is taking place in the rural sector at that time.
The Country Basic Territorial Information Project “Southern Cone”, produced and introduced by the Military Geographical Institute, will fulfill in a period of six years, this national need to contemplate the creation of Basic Spatial Information ,ITB,at scale of 1:1,000 approximately in 146 urban centers and cartography at 1:10,000 scale for rural areas of greatest importance in the country. To move forward on an orderly and structured manner in the implementation of the project, an organic structire has been formed under SNIT basis, so that the efforts for its materialization and financing are conducted in an organized and structured way, and the following distribution has been implemented (Fig. 1)
In July 2008, the Technical Secretary of the SNIT through the President’s Committee of Ministers of Information and the Territory, referred the project to the Ministry of Finance to budget allocation for funding. From the technical point of view,it is planning to implement the project in the next six years and move forward in parallel with the mapping of urban and rural according to the following priorities (Fig. 2).
In order to implement the project within a period of 6 years, the job involved will be competed , where the private and public sector will have an important participation. It is the responsibility of the Technical Unit which is coordinated and directed by the Head of the Project to generate technical specifications for the developments and control of the work. IGM as the official state agency will exercise the role of a controller and certifier, thus helping to achieve
the creation of a well structured and uniform ITB for
all users in the country.
Directorio ProyectoCono Sur
Jefe de Proyecto(IGM)
UnidadTécnica
• EMDN (Presidente)• SECRT. SNIT (Secretario)• IGM• SAF• SHOA• CIREN• ACE
• IGM• SAF• SHOA• CIREN• ACE • SECRT. SNIT
Figura Nº1.
INSTITUTO GEOGRÁFICO MILITAR
20

In general the workflow to get this basic
Territorial information is specified in the
following chart (Fig. 3).
The ITB availability for national
development is an urgent need of the
country. The integration of information
generated by agencies of the state on
a common basis would avoid waste of
resources and will allow the performance
of effective analysis and efforts.
The availability of this base for all
users will cause an integrating effect,
developing measures to solve problems
required by the country and making
use of uniform information to be used in
various development projects.
Based on its relevance and the need
of having this information at the
national level in a short term of time,
the SNIT and the Council of Ministers
of Information and the Territory and
each of its members, is supporting
and recommending its funding to the
Ministry of Finance.
Imagen Satelitaly/o Fotografía Aérea
Restitución Ortoimagen
Base de Datos
ApoyoTerreno
EdiciónTopónimos
Para dar cumplimiento al proyecto en el plazo de 6 años, los trabajos serán licitados, por lo que el sector privado y particular tendrá una importante participación.
Será responsabilidad de la Unidad Técnica coordinada y dirigida por el Jefe del Proyecto, generar las especificaciones técnicas para la materialización y control de los trabajos.
El IGM, como organismo oficial del Estado, ejercerá el rol de controlador y certificador, contribuyendo con ello a lograr la creación de una ITB bien estructurada y uniforme para todos los usuarios del país.
En líneas generales, el flujo de trabajo para obtener esta Información Territorial Básica se indica en el siguiente esquema (Fig. 3).
Disponer de esta ITB para fines de desarrollo nacional es una necesidad urgente del país. La integración de la información generada por los organismos del Estado sobre una base común evitaría dispendio de recursos y permitirá realizar análisis y gestiones efectivas.
La disponibilidad de esta base para todos los usuarios provocará un efecto integrador, desarrollando acciones que permitan solucionar problemas que requiere el país haciendo uso de información homogénea para ser utilizada en diversos proyectos de desarrollo.
Dada su relevancia y la necesidad de disponer de esta información a nivel nacional a la brevedad, el SNIT y el Consejo de Ministros de la Información Territorial y cada uno de sus integrantes lo está apoyando y recomendando su financiamiento ante el Ministerio de Hacienda.
Figura Nº3
AÑO REGIÓN
1 Arica y Pararinacota, Atacama , Antofagasta
2Los Ríos, Los Lagos, Araucanía, Aysén y
Magallanes
3 O´Higgins, Maule
4 Bio Bío
5 Atacama, Coquimbo
6 Valparaíso, Metropolitana
Figura Nº2.
2121
Un tsunami es una de las fuerzas de la
naturaleza más imponentes del mundo. Se expresa
como una serie de ondas largas en el mar, capaces
de desplazarse a través de un océano completo a
grandes velocidades y afectar significativamente
a las zonas costeras. El océano Pacífico presenta
una alta recurrencia en el registro de desastres
originados por este tipo de eventos.
En Chile, el Servicio Hidrográfico y
Oceanográfico de la Armada (SHOA) es el
organismo técnico, permanente y oficial del
Estado responsable del funcionamiento, operación
y mantención del Sistema Nacional de Alarma de
Maremotos (SNAM), creado mediante Decreto
Supremo Nº 26 de fecha 11 de enero de 1966.
Bajo este contexto, el SHOA ha propiciado
el desarrollo sistemático de la investigación
geofísica del fenómeno “tsunami”, y desde el año
1997 ejecuta un proyecto de carácter operativo
orientado a la protección civil, denominado Cartas
de Inundación por Tsunami (CITSU).
Las Cartas de Inundación por Tsunami constituyen una herramienta cartográfica fundamental que muestra los niveles máximos de inundación esperados en zonas urbanas y portuarias de la costa chilena, ayudando en la planificación territorial y en los planes de evacuación y protección civil.
Proyecto del Servicio Hidrográfico y Oceanográfico de la Armada
Mitigando los efectos de un tsunami
ServicioHidrográfico y Oceanográfico de la Armada de Chile
A tsunami is one of the most imposing forces
of the nature in the world. It is expressed as a
series of long waves in the sea, able to navigate
through an ocean full of high speeds affecting
significantly the coastal areas. The Pacific Ocean
has a high recurrence in the register of disasters
caused by such events.
In Chile, the Hydrographic and Oceanographic
Service of the Chilean Navy (SHOA) is the
technical, permanent and official agency of the
State, responsible for the operation, maintenance
The Tsunami flooding charts are an essential mapping tool which show the maximum expected levels of flooding in urban areas and ports of the chilean coast, helping the territorial planning, the evacuation plans and the civil protection.
Mitigating theeffects of a tsunami
CITSU Project from the Chilean Navy Hydrographic and Oceanographic Service
SERVICIO HIDROGRÁFICO Y OCEANOGRÁFICO DE LA ARMADA DE CHILE
22

Para realizar este proyecto, el SHOA cuenta con la
capacidad técnico-científica y computacional necesaria
para la modelación numérica de escenarios sísmicos
tsunamigénicos y eventos potenciales asociados a
deslizamientos o remociones en masa, como fue el
acontecido en el fiordo Aysén el 21 de abril de 2007.
De este modo, el proyecto CITSU constituye una
herramienta cartográfica que define los niveles máximos
de inundación esperados en las principales zonas urbanas
y portuarias de la costa de Chile.
En el ámbito de la prevención y mitigación del
impacto de tsunamis, las cartas de inundación tienen una
aplicación directa en la planificación urbana, territorial
y en la elaboración de los planes de evacuación y
protección civil, tareas que ejecuta la autoridad municipal
y supervisa la Oficina Nacional de Emergencia del
Ministerio del Interior (ONEMI), mediante las acciones
realizadas por las respectivas Oficinas Regionales de
Protección Civil y Emergencia (OREMI) y los Comités
Locales de Protección Civil y Emergencia.
En el marco del proyecto, este Servicio ha elaborado
y entregado a las autoridades nacionales y locales
competentes, las Cartas de Inundación correspondientes
a 30 localidades (Tabla 2).
OBJETIVOS
Objetivo General:
Apoyar a la autoridad civil en la prevención o
mitigación del riesgo de tsunami, elaborando Cartas
de Inundación que muestran las áreas urbanas
potencialmente amenazadas de los principales puertos de
la costa de Chile.
Objetivos Específicos:
• Aplicar técnicas de modelación numérica para simular
eventos sísmicos tsunamigénicos históricos y remociones
en masa, de ocurrencia más probable para una región
determinada.
• Analizar la propagación de ondas de tsunami de
campo cercano y/o lejano hacia zonas de aguas someras,
estudiar su impacto en el borde costero y describir sus
efectos en los puertos o bahías de interés.
and operation of the Tsunami National
Warning (SNAM), created by the Supreme
Decree No. 26 dated on January 11, 1966.
Under this context, the SHOA has led to the
systematic development of the geophysical
research of the “tsunami”phenomenon and
since 1997 to a project of an operational-
oriented civil protection, called Tsunami flood
charts (CITSU).
To carry out this project, the SHOA
has the necessary technical,scientific and
computational capacity for the numerical
modeling of the tsunamigenic seismic
scenarios and potential events associated
to landslides or mass removals,such as the
Aysen fjord on April 21, 2007 . Thus, the
CITSU project , is a mapping tool that defines
the maximum levels of flooding expected in
major urban and port zones on the coast of
Chile.
In the area of prevention and mitigation
of the impact of tsunamis, the flood charts
have a direct application in urban planning,
land and the development of the evacuation
plans and civil protection tasks which are
run by the municipal authority and which
are supervised by the Emergency National
Office of the Interior Ministry (ONEMI),
through activities undertaken by the
respective Regional Offices of Civil Protection
and Emergency (OREMI) and the Local
Committees of Civil Defense and Emergency.
Under the project, the Service has
developed and delivered to the national
authorities and local authorities, the flooding
charts for 30 locations (Table 2).
OBJECTIVES
General Objective:
Support the civil authority in the prevention
or mitigation of risk of tsunami, preparing
Flood Charts showing urban areas potentially
at risk of major ports on the coast of Chile.
23

Table 2: List of Tsunami Flood Charts developed by SHOA. Tabla 2: Lista de Cartas de Inundación por Tsunami desarrolladas por el SHOA.
LOCALIDADCARTA CITSU
AÑO EDICIÓN
EVENTO(S) DE REFERENCIAMagnitud Richter ( )
COTAS MÁXIMAS DEINUNDACIÓNComputadas (*)(valores c/r al NMM)
Arica 1997 1868 (8,5) – 1877 (8,3) 12 – 15 metros (*)
Iquique 1997 1868 (8,5) – 1877 (8,3) 15 – 18 metros (*)
Tocopilla 1999 1868 (8,5) – 1877 (8,3) 10 – 15 metros (*)
Mejillones 1998 1868 (8,5) – 1877 (8,3) 15 – 18 metros (*)
Antofagasta 1998 1868 (8,5) – 1877 (8,3) 7 – 10 metros (*)
Taltal 2001 1877 (8,5) – 1922 (8,3) 5 – 7 metros (*)
Chañaral 2000 1922 (8,3) 5 – 6 metros (*)
Caldera 1999 1922 (8,3) 6 – 7 metros (*)
Huasco 2003 1922 (8,3) 7 – 10 metros (*)
CoquimboLa Serena
20012001
1922 (8,3) 1922 (8,3)
5 – 6 metros (*)6 – 7 metros (*)
Los Vilos 2002 1906 (8,6) 3 – 5 metros (*)
Papudo 2003 1906 (8,6) 5 – 6 metros (*)
Quintero 2003 1906 (8,6) 6 – 7 metros (*)
ValparaísoViña del Mar
19991999
1906 (8,6)1906 (8,6)
5 – 6 metros (*)
6 – 7 metros (*)
San AntonioAlgarrobo
20002000
1906 (8,6)1906 (8,6)
7 – 8 metros (*)5 – 6 metros (*)
Constitución 2002 1906 (8,6) 6 – 7 metros (*)
TalcahuanoPencoToméLirquén
2000200020002000
1835 (8,2)1835 (8,2) 1835 (8,2)1835 (8,2)
7 – 8 metros (*)8 metros (*)7 – 8 metros (*)8 metros (*)
San Vicente 2004 1835 (8,2) 7 – 8 metros (*)
Coronel 2002 1835 (8,2) 10 – 12 metros (*)
Lebu 2002 1835 (8,2) 10 – 12 metros (*)
Corral 2000 1837 (8,5) 10 – 12 metros (*)
Ancud 2004 1837 (8,5) 8 – 10 metros (*)
I. de Pascua 2006 1960 (9,5) 3 – 8 metros (*)
Pto. Aysén 2007 2007 (6,2) 5 – 8 metros (*)
SERVICIO HIDROGRÁFICO Y OCEANOGRÁFICO DE LA ARMADA DE CHILE
24

• Determinar la extensión
horizontal de inundación y
distribución probable de altura de
olas en la costa.
• Difundir la información,
entregando las Cartas de
Inundación por Tsunami a las
autoridades civiles y/o navales
correspondientes.
METODOLOGÍAS
Para la estimación de los
efectos potenciales ante el riesgo
de tsunami de origen tectónico
y la ocurrencia de eventos
asociados a deslizamientos o
remociones en masa en las áreas
costeras e insulares de Chile, se
han ejecutado diversos estudios
interdisciplinarios que involucran
aspectos geológicos, sismológicos
y de geofísica marina, que incluyen
la recopilación de antecedentes
topobatimétricos, la revisión de
las fuentes de tsunamis históricos
y la calibración de la simulación
numérica con eventos modernos
que poseen registros in situ,
por ejemplo, Valparaíso (1985);
Antofagasta (1995); y Aysén
(2007).
Los factores hidrodinámicos
asociados a la simulación numérica
de tsunamis históricos o más
probables, en conjunto con los
antecedentes topográficos,
batimétricos y morfológicos
específicos de cada región, otorgan
a estos estudios un carácter
probabilístico y modelan el factor
amenaza involucrado en el análisis
del riesgo.
Dentro de este contexto, la
simulación numérica permite
discriminar entre los diferentes
escenarios posibles que pueden
Specific Goals:
• Apply numerical modeling
techniques to simulate seismic
events and historical tsunamigenic
mass removals, which may occur in a
given region.
• Analyze the spread of tsunami
waves near a field and / or to distant
areas of shallow waters, to study
its impact on the coastal edge and
describe its impact on the ports or
bays of interest.
• Determine the extent of flooding
and horizontal distribution of
probable height of waves on the
coast.
• Disseminate information, delivering
the Tsunami Flood Charts to civil
authorities and / or naval authorities
concerned.
METHODOLOGIES
To estimate the potential effects
of tsunami due to the risk of tectonic
origin and occurrence of events
associated with landslides or mass
removals in coastal areas and islands
of Chile. Various inter-disciplinary
studies have been implemented
which involve geological,
seismological and marine geophysics
aspects, which include the collection
of topobatimetric background, the
revision of the historical sources
of tsunamis and the calibration
of the numerical simulation with
modern events which have records
in situ such as Valparaiso (1985),
Antofagasta (1995); and Aysen
(2007).
The factors associated with
the hydrodynamic numerical
simulation of historical tsunamis
or more likely, in conjunction with
the topographical, bathymetric and
morphological background which
are specific to each region, give a
probabilistic model and the threat
factor involved in the risk analysis.
In this area, the numerical
simulation allows to discriminate
afectar a una región, en función de
la localización de la fuente: campo
cercano y lejano, los parámetros
sismotectónicos, los mecanismos
de ruptura y la generación de
tsunamis.
Los modelos de simulación
numérica que se han aplicado para
ejecutar el proyecto CITSU, son:
a) TUNAMI-N: Proyecto TIME
(Tsunami Inundation Modelling
Exchange) perteneciente a
la Comisión Oceanográfica
Intergubernamental (COI). Modelo
diseñado por el Dr. Nuobo Shuto
del Centro de Investigación
y Control de Desastres de la
Universidad de Tohoku, Japón
(IUGG/COI, 1997).
b) TSUNAWI: Modelo de
elementos finitos utilizado para
simular escenarios de campo
25

lejano, donde se incluye el factor Coriolis. El modelo
fue desarrollado por el Alfred Wegener Institute,
Bremerhaven, Alemania.
c) GEOWAVE: Sistema de modelación compuesto por
dos modelos: TOPICS (Tsunami Open and Progressive
Initial Conditions System), que genera las condiciones
iniciales basado en seis tipos de fuentes, incluyendo
remociones en masa, y FUNWAVE, un modelo de
propagación de ondas largas que utiliza la aproximación
de Boussinesq e incluye la física del rompimiento de las
ondas y la simulación del run-up al ingresar a tierra. El
Figura 1: Generación y anidación de grillastopobatimétricas utilizando TUNAMI - N
Figure 1: Generation and nesting of topobatimetric grids using TUNAMI - N.
Figura 2: Grillas triangulares de tamaño variable.Método de elementos finitos utilizando TSUNAWI.
Figure 2: triangular grid of variable size.Finite element method using TSUNAWI.
between the different scenarios that may affect
a region, depending on the location of the source:
near or far from the field , the seismotectonic
parameters, the mechanisms of rupture and the
generation of tsunamis.
The numerical simulation models which have been
applied to run the Citsu project are as follows :
a) TUNAMI-N: TIME Project (Tsunami
Inundation Modeling Exchange) belonging to the
Intergovernmental Oceanographic Commission
(COI). Model designed by Dr. Nuobo Shuto
from the Research Center for Disasters Control,
University of Tohoku, Japan (IUGG / IOC, 1997).
b) TSUNAWI: finite element model used to
simulate far field scenarios , which includes the
Coriolis factor. The model was developed by the
Alfred Wegener Institute, Bremerhaven, Germany.
C) GEOWAVES: Modeling System which consists
of two models: TOPICS (Tsunami Open and
Progressive Initial Conditions System), which
generates the initial conditions based on six
types of sources, including mass removals and
FUNWAVE, a model of the spread of long waves
which uses the Boussinesq approximation and
SERVICIO HIDROGRÁFICO Y OCEANOGRÁFICO DE LA ARMADA DE CHILE
26

includes the physics of breaking waves and the
simulation of the run-up when entering into the
land. The model was developed by Dr. Phillips
Watts from the Applied Fluids Engineering
Institute, California, USA.
Once the urban area to be studied has been
identified and the historical , bathymetrical,
topographical and, seismotectonical backgrounds
together with the aerophotogrametric refunds of
the place of interest have been collected , then the
topobatimetric grids are generated using some of
the models mentioned above (Fig. 1 and 2).
In a second stage ,the numerical modeling is
run based on the seismotectonic parameters
modelo ha sido desarrollado por el Dr. Phillips Watts
del Applied Fluids Engineering Institute, California,
USA.
Una vez que se ha identificado el área urbana
que se pretende estudiar y se han recopilado los
antecedentes históricos, batimétricos, topográficos,
sismotectónicos, y se cuenta con las restituciones
aerofotogramétricas del lugar de interés, se generan
las grillas topobatimétricas utilizando algunos de los
modelos antes señalados (Fig. 1 y 2).
En una segunda etapa se ejecuta la modelación
numérica en base a los parámetros sismotectónicos
seleccionados. Así por ejemplo, la figura 3 muestra
la modelación numérica efectuada en la bahía de
PARÁMETROS SISMOTECTÓNICOS TSUNAMI 1868 TSUNAMI 1877
Origen 19° Lat. S –71° Long.W 23° Lat. S -71° Long.W
Dislocación 12 m. 12 m.
Largo 500 Km. 490 Km.
Ancho 150 Km. 150 Km.
Rumbo 300° 359°
Buzamiento 18° 19°
Profundidad 10 Km. 10 Km.
Ángulo Desplazamiento 90° 90°
Tabla 1: Parámetros sismotectónicos utilizadosen la modelación de bahía de Arica.
Table 1: Seismotectonic parameters used in modeling the Bay of Arica
Figura 3: Áreas de inundación de la bahía de Aricapara los tsunamis de 1868 (izquierda) y 1877 (derecha).
Figure 3: Areas of flooding in the Bay of Arica for tsunamis of 1868 (left) and 1877 (right).
27

Arica utilizando dos eventos sísmicos diferentes,
los tsunami de 1868 y de 1877, cuyos parámetros
sismotectónicos se detallan en la Tabla 1.
RESULTADOS
Con los resultados obtenidos es posible elaborar
una Carta de Inundación para el evento extremo
o más probable, de acuerdo a la estimación de los
períodos de recurrencia de grandes terremotos
costeros en cada región del país.
La citada carta contiene la información
necesaria para que la autoridad civil elabore sus
planes de emergencia, con el objeto de implementar
la señalética relativa a los tsunami en las calles
afectadas por la inundación y demarcar las vías de
evacuación. Las figuras 4 y 5 muestran las Cartas
selected. For example, Figure 3 shows the
numerical modeling conducted in the Bay
of Arica using 2 different seismic events,
the 1868 and 1877 tsunami whose
seismotectonic parameters are detailed in
Table 1.
RESULTS
With the results, it is possible to
draw up a chart for the event of extreme
flooding or more likely, according to the
estimate of the periods of recurrence of
large earthquakes in coastal regions of the
country.
The chart contains the information
needed by the civilian authorities so as to
develop their emergency plans, in order to
implement the signage on the tsunami in
the streets affected by the flooding and
demarcate the escape routes. Figures 4
and 5, are the charts for Tsunami Flood
of Antofagasta and Iquique, where
contingency plans have recently been
de Inundación por Tsunami de Antofagasta e Iquique,
ciudades donde recientemente se han elaborado planes
de emergencia en base a la información proporcionada
por el SHOA. Por otra parte, la Tabla 2 entrega una lista
con la relación de cartas producidas y distribuidas a la
fecha por este Servicio.
APORTE A LA COMUNIDADY ENTIDADES REGIONALES DE GOBIERNO
El Proyecto CITSU ha consolidado al SHOA como una institución de servicio, siendo claramente identificada a nivel nacional, dentro de la Armada y la comunidad en general, como un organismo de gran relevancia científica y tecnológica.
La población que habita dentro o en las proximidades de los sectores costeros reconocidos como zonas de
Figura 4: Carta de Inundación por Tsunami de Antofagasta.Figure 4: Tsunami Flood Chart of Antofagasta.
SERVICIO HIDROGRÁFICO Y OCEANOGRÁFICO DE LA ARMADA DE CHILE
28

drawn up by the cities on the basis of information provided
by the SHOA. On the other hand, Table 2 presents a list of the
relationship charts produced and distributed by this Service.
CONTRIBUTION TO THE COMMUNITYAND REGIONAL GOVERNMENT
The CITSU project has consolidated the SHOA as an
institution of service, clearly identified at the national level,
within the navy and the community in general , as a large body
of scientific and technological relevance..
The population living within or near coastal areas recognized
as Tsunami high flood risk places, have benefited since the local
authorities in coordination with the ONEMI, are implementing a
series of activities to report on the risk and planning designed
for each port. Notable examples are the cities of Arica and
Antofagasta, which have developed a series of drills and
implemented signage of tsunami in areas identified by the
CITSU SHOA charts. In addition, local initiatives have emerged
to provide early warning systems to the cities of Arica and
Antofagasta, which consist of a series of coordinated sirens that
emit specific sounds to alert the population to the proximity of
a tsunami.
alto riesgo de inundación por
tsunami, se ha visto beneficiada,
dado que las autoridades locales,
en coordinación con la ONEMI, se
encuentran ejecutando una serie de
actividades con el objeto de informar
sobre el riesgo y la planificación
diseñada para cada puerto. Ejemplos
destacables en este sentido son las
ciudades de Arica y Antofagasta,
las que han desarrollado una serie
de simulacros e implementado
señalética de tsunami en las áreas
identificadas por las cartas CITSU
del SHOA. Además, han surgido
iniciativas locales para dotar de
sistemas de alerta temprana a
estas ciudades, las que consisten
en una serie de sirenas coordinadas
que emiten sonidos específicos
para alertar a la población ante la
proximidad de un tsunami.
Figura 5: Carta de Inundación por Tsunami de Iquique.
Figure 5: Tsunami Flood Chart of Iquique.
29

ServicioAerofotogramétricode la FACH
El Servicio Aerofotogramétrico de la Fuerza
Aérea de Chile (SAF) recientemente inauguró una
de las herramientas tecnológicas más avanzadas a
nivel científico-técnico, en el campo de estudio de la
percepción remota. Ésta consiste en una Estación Terrena
Satelital (ETS), producto del programa de cooperación
industrial derivado de la compra de sistemas de armas
avanzados.
Esta nueva tecnología tiene la capacidad de
capturar información espacial proveniente de satélites
ópticos, que a través de procesadores especialmente
diseñados, hace posible la generación de una imagen
digital de cualquier zona de interés en nuestro país. La
estructura y funcionamiento de esta Estación es compleja
en términos informáticos. Involucra la utilización de
herramientas computacionales como servidores y redes
interconectados con una antena de recepción satelital.
Sin embargo, el punto de este artículo no es el detalle
técnico de la Estación, sino más bien el especificar por
qué Chile como país necesita de este tipo de tecnologías
para lograr su posicionamiento en el ámbito de las
ciencias espaciales para el estudio del territorio y las
interacciones con el hombre.
Servicio Aerofotogramétrico de la FACH presenta nueva estación terrena satelital
Con variadas utilidades para el estudio del territorio y las interacciones con el hombre
Esta nueva infraestructura permite capturar información espacial proveniente de satélites ópticos, generando imágenes digitales de cualquier zona de interés del país para un nuevo y práctico servicio geográfico que no se utilizaba en Chile.
The Chilean Air Force Aerophotogrametric Service , has
recently opened one of the most advanced technological
tools at the scientific- technical level , in the field of study
of remote sensing. This is a Satellite Ground Station
(ETS), a product of the benefits gained from the industrial
cooperation program on the purchase of advanced weapons
systems.
This new technology has the ability to capture spatial
information from optical satellites, which through specially
designed processors, enables the creation of a digital image
of any area of interest in our country. The structure and
operation of this station is complex in terms of software. It
This new infrastructure allows the capture of spatial information from optical satellites, generating digital images from any area of interest of the country to a new and convenient geographic service which was not used in Chile before.
Fach Aerophotogrametric Service introduces new satellite Ground Station
With various utilities for the study of the territory and interactions with men
SERVICIO AEROFOTOGRAMÉTRICO DE LA FACH
30

Dentro de las capacidades actuales de la ETS, destaca la
recepción de imágenes MODIS (Moderate Resolution Imaging
Spectroradiometer). Las características de esta imagen son
conocidas en el ámbito de la percepción remota, destacándose
principalmente su capacidad multiespectral, contando con
36 bandas, las que van desde el espectro visible, hasta el
infrarrojo cercano y el termal, permitiendo la realización de
diversos estudios en medio ambiente, abarcando fenómenos
meteorológicos, oceánicos, terrestres y de vegetación. Sin
embargo, el factor que más ha impulsado el uso de éstas
por parte de la comunidad científica, es que son de acceso
y distribución gratuita y fácil adquisición a través del sitio
de la NASA destinado para tal efecto. Bajo este contexto,
han surgido interrogantes de por qué invertir en tecnología
para obtener un producto que es gratuito en Internet.
Teniendo en consideración que la recepción de imágenes
MODIS no es el único objetivo de la Estación, existe una
diferencia marcada entre solicitar una imagen para un estudio
específico, y contar con la capacidad de capturar cada pasada
del sensor MODIS sobre el territorio chileno. La primera
situación permite a profesores y estudiantes de universidades
contar con las herramientas necesarias para efectuar sus
investigaciones, que muchas veces son de carácter reactivo a
una contingencia en particular de desastre, o temático frente
a posibles situaciones. Sin embargo, estos estudios muchas
veces carecen de la continuidad de datos actualizados para
que realmente tengan un efecto en el medio y se logren los
objetivos en pos del desarrollo de la comunidad. Sumado
a esto, el satélite sólo tiene una memoria limitada para
la captura de imágenes fuera de su cono de recepción, la
Estación Terrena Satelital proporciona un potencial uso para
mitigar estas falencias mencionadas anteriormente.
Considerando esta perspectiva de uso, el hecho de poseer
una estación fija no dependiente, permite la generación de un
servicio geográfico que actualmente es algo que no se utiliza
en el país. Para definir mejor este planteamiento, tomemos
como ejemplo un sistema de detección de incendios a través
de imágenes MODIS. La detección de focos de calor, por parte
de las bandas termales del sensor, es una capacidad utilizada
en muchos países, llegando a detectar incendios en zonas
remotas sin acceso. La buena gestión del control de estos
eventos recae en la capacidad temporal que se desea analizar
dependiendo del satélite. A través de Terra y Aqua, satélites
en los cuales se encuentra el sensor MODIS, podemos obtener
actualizaciones en promedio tres veces diarias, permitiendo
con esto el monitoreo continuo de las zonas más afectadas
por incendios. Generar un servicio como este, hace necesaria
involves the use of computational tools such
as servers and networks interconnected with
a satellite receiving antenna. However, the
point of this article is not the technicality of
the station, but rather,to specify why Chile,
as a country , needs this kind of technology
to secure their position in this field of
space science for the study of territory and
interactions with men
Within the current capabilities of
the ETS, is the reception of MODIS
images (Moderate Resolution Imaging
Spectroradiometer). The characteristics of
this image are known in the field of remote
sensing, highlighting their multispectral skills
primarily, with 36 bands, ranging from the
visible, near infrared and thermal spectrum,
allowing the realization of various studies
on environment, including weather, ocean,
land and vegetation studies. However, the
factor that has driven the use of them by the
scientific community is that their access and
distribution is free, easy to purchase through
the Nasa site intended for that purpose.
Imagen MODIS sobre el territorio chileno.Capturada el 11.Jun.08
MODIS image taken in the chilean territory on June 11, 2008.
31

la capacidad de captura de los datos
en forma directa, donde solamente
se requiere unir los diferentes flujos
de datos, desde el bruto (o nivel
0), hasta la notificación de un foco
de calor respectivo. Generar una
infraestructura de datos de este
tipo es necesario para crear este
servicio geográfico, y con el tiempo
se podrán medir los beneficios a
mediano plazo, con una connotación
económica para el país, y los de
largo plazo, referentes a políticas
de mitigación, monitoreo y cuidado
de zonas propensas a incendios,
aportando con esto un beneficio
permanente, y aún más importante,
con una continuidad en el tiempo,
que permita entregar un servicio
más que un producto específico
como respuesta a un fenómeno en
particular.
Este ejemplo no es sólo para el
caso de los incendios, eventualmente
y con ayuda del potencial científico-
académico del país, se podrían
diseñar diferentes servicios con los
más variados fines, desde detección
de niveles de clorofila del océano,
relevante para empresas pesqueras,
hasta índices NDVI (Normalised
Difference Vegetation Index), muy
utilizados para medir los cambios
producidos en la vigorosidad de la
vegetación.
Como se ha mencionado
anteriormente, la obtención de
imágenes MODIS no es la única
funcionalidad de la estación. A
mediados del próximo año, se
incluirán las capacidades de captura
y procesamiento de imágenes de
otros satélites con mayor resolución
espacial, entre los cuales se
encuentra el SPOT-4. Este satélite
es de origen francés, con una
resolución espacial media, apta
para la confección de cartografía a escalas 1:100.000 y aplicaciones
Under this context, some questions have arisen concerning
why to invest in technology to produce a product that is
free on the Internet. Taking into consideration that the
reception of MODIS imagery is not the sole objective of
the station, there is a marked difference in seeking an
image for a specific study, which has the ability to catch
every last MODIS sensor on Chilean territory. The first
allows teachers and students of universities, with the
necessary tools to carry out their investigations, which are
often from a reactive nature to particular contingency
disasters, or thematic against possible situations. However,
these studies often have a lack of continuity of current
data to a real effect on the environment and achieve
the objectives for development of the community. In
addition, the satellite has only a limited memory for
capturing images out of the cone of reception, the Satellite
Ground Station provides a potential use to alleviate these
shortcomings mentioned above.
Considering the prospect of use, the fact of having a
fixed station, which is not dependent, allows the creation
of a geographic service, which currently is something
that is not used in the country. To refine this approach,
let us take the example of a fire detection system
through MODIS images. The detection of outbreaks of
heat from the thermal sensor bands, is a capacity used
in many countries, which rise to detect fires in remote
areas without access. The sound of fire control, lies in
the temporarily ability to be analyzed depending on the
satellite. Through Terra and Aqua satellites , where the
MODIS sensor is located on board , so as to get updates
three times a day average, allowing consequently, the
continuous monitoring of the areas most affected by
fires. To create a service like this, requires the ability
to capture the data directly, which is required only to
unite the different streams of data, from the level 0,
until the notification of an outbreak of respective heat.
To build an infrastructure of such data, it is necessary to
create this service geographically, which over time can
measure profits in the medium term, with an economic
connotation for the country, and in the long term, referring
to mitigation policies, monitoring and care in areas prone Radomo de la Estación Terrena SatelitalRadome of the Satellite Ground Station
SERVICIO AEROFOTOGRAMÉTRICO DE LA FACH
32

multiespectrales, al contar con bandas que van desde el espectro visible al infrarrojo cercano-medio. Además, incorpora una banda especialmente diseñada para estudios globales de vegetación, que potenciará las aplicaciones de MODIS ya disponibles. Por otra parte, estará disponible un segundo satélite de alta resolución, que permite la identificación de objetos con tamaños inferiores a un metro, siendo esto importante en aplicaciones para estudios más específicos, donde la información precisa y detallada juega un papel cada vez más preponderante en el control y planificación de políticas reguladoras en zonas urbanas.
La importancia de tener una estación satelital, también recae en el proceso de transferencia tecnológica que involucra un proyecto de este tipo, permitiendo entender el know how en relación a la operación de las mismas, generando masa crítica para enfrentar futuros proyectos de esta índole. En este sentido, las
puertas a las universidades están abiertas para atender los más variados requerimientos de intercambio en conocimientos, con el propósito de hacer más eficiente este proceso de transferencia tecnológica.
Durante éste último tiempo, el SAF ha invertido en la adquisición de sensores para la captura de datos, los cuales tienen que ser validados mediante la generación de un trabajo riguroso que concluya con aportes reales y concretos para el desarrollo de la sociedad en general. En este contexto, contar con una Estación Terrena Satelital le da al país una nueva herramienta para generar estas soluciones, aportando información útil a todos los niveles, y sobre todo al nivel decisional, que a través del uso de esta tecnología puede generar proyectos, políticas, planes y programas acordes con la realidad del país, favoreciendo el desarrollo y la calidad de vida.
to fires, bringing with it a permanent
benefit, and more importantly, with
a continuity over time, allowing the
delivery of a service rather than a
specific product in response to a
phenomenon in particular.
This example is not only in the
event of fires, and possibly with the
help of scientific-academic potential
in the country, different services
could be designed with the most
varied purposes. Since detection of
ocean chlorophyll levels, relevant to
fishing companies, up NDVI indexes
(Normalized Difference Vegetation
Index), widely used to measure
changes in the force of vegetation.
As mentioned above, obtaining
MODIS imagery is not the only
feature of the station. In the middle
of next year, the capability of
capturing and processing images
will be included from other satellites
with higher spatial resolution, one
of them is SPOT-4. This satellite
is of French origin, with a spatial
resolution media, suitable clothing
for mapping at scales of 1:100,000
and multispectral applications, to
have bands ranging from visible
to near infrared-half spectrum .
In addition, it incorporates a band
specially designed for studies of
global vegetation, which will enhance
the applications of MODIS already
available. On the other hand, it will
be available a second high-resolution
satellite, which enables identification
of objects with sizes of less than
one meter,which is important in
the applications for more specific
studies, where precise and detailed
information is playing an increasingly
dominant role in control and
regulatory policy planning in urban
areas.
The importance of having a
satellite station, also lies in the
process of technology transfer
involved in a project of this type,
allowing to understand the Know
How in relation to the operation of
the same kind, creating critical mass
to cope with future projects of this
nature. In this regard, the doors
are open to universities to meet
the most varied requirements in
exchange knowledge with the aim of
making this process a more efficient
technology transfer.
During this last time, the
Aerophotogrametric Service of
the Air Force, has invested in the
acquisition of sensors to capture
data, which must be validated
by generating a rigorous work
and finally to conclude with real
and concrete contributions to the
developing society in general. In this
context, to have a Satellite Ground
Station, gives the country a new
tool for generating these solutions,
providing useful information to
all areas , and above all,to the
decisional level, which can generate
projects through the use of this
technology ,together with policies,
plans and programs on line with the
reality of the country, encouraging
the development and the quality of
life.
33

Para nadie es desconocido el importante desarrollo
que han tenido las tecnologías relacionadas con el
manejo de información territorial. La masificación
del uso del Sistema de Posicionamiento Global (GPS)
principalmente en países desarrollados, el aumento de
aplicaciones para dispositivos móviles, la creación de
importantes plataformas como Google Earth y el avance
de tecnologías de Sistemas de Información Geográfica
(SIG) para la planificación, toma de dediciones y control
de iniciativas, han generado necesidades relacionadas con
la gestión e interoperabilidad de la información y de las
aplicaciones informáticas.
En nuestro país, estos nuevos requerimientos se están
enfrentando a partir de la creación del Sistema Nacional
de Coordinación de Información Territorial, SNIT, cuyo
enfoque técnico está asociado a un concepto mundial
denominado “Infraestructura de Datos Espaciales” (IDE).
La definición que nos entrega la enciclopedia colaborativa
Wikipedia acerca de IDE es “Tecnología, políticas,
estándares, recursos humanos y actividades necesarias
para adquirir, procesar, distribuir, usar, mantener y
conservar datos espaciales”.
La necesidad de visualizar y realizar análisis conjuntos de información de las más variadas instituciones del país en forma digital y automatizada a través de Internet, es el desafío que la construcción del Geoportal de Chile pretende resolver.
SNIT desarrolló software para visualización de cartografía vía Internet
Geoportal de Chile: una novedosa herramienta para publicar datos espaciales
Iván Lienlaf N.Ingeniero Civil Industrial SNITIndustrial Civil Engineer SNIT
It is not unknown the significant development
that the technologies related to the management of
land information. have developed theses days. The
mass use of Global Positioning System (GPS) mostly
in developed countries, the increase in applications
for mobile devices, creating major platforms such
as Google Earth and the advance of technology of
Geographic Information Systems (GIS) for planning,
decisions-making and control initiatives have created
new needs related to management and interoperability
of information and computer applications.
In our country, these new requirements are
facing some challenges starting from the creation
The SNIT developed a software for the display of cartography via Internet
The need to visualize and analyze sets of information from the most diverse institutions in the country in digital and automated form via Internet, is the challenge that the construction of the Geoportal of Chile seeks to solve.
Geoportal of Chile: a novel tool for publishing spatial data
SECRETARÍA EJECUTIVA SNIT
34

De acuerdo con ésta y otras definiciones, la tecnología
es un punto de gran relevancia en el proceso de creación
del SNIT. Hemos querido destacar este aspecto ya que
se relaciona directamente con el continuo desarrollo de
herramientas informáticas, cuyo objetivo apunta a dar soporte
y acompañamiento a la creación de la IDE Chile.
Qué información territorial ya existe en el país, cómo y para
qué fue construida, son las preguntas más importantes que
la aplicación “Catálogo Nacional de Información Territorial”
pretende responder en el sitio de internet www.snit.cl. La idea
es que las instituciones del país puedan documentar de forma
estandarizada, a través de Fichas de Metadatos, la información
que producen y mantienen, para así publicar dicha existencia
en forma transparente y democrática. Dicho de otra forma,
el Catálogo es un buscador de información geoespacial, que
permite obtener listados de resultados y descripciones técnicas
acerca de productos de información territorial. Además, si la
información se encuentra disponible vía internet, podremos
acceder a ella por medio de hipervínculos.
Si bien el Catálogo permite acceder a la información
disponible en línea, este acceso se da en las condiciones que
cada institución dispone de forma separada, producto por
producto y en ventanas de navegación diferentes.
La necesidad de visualizar y realizar análisis conjuntos de
información cartográfica que reside en instituciones dispersas
en el territorio, en forma digital y automatizada a través de
Internet, es el desafío que la construcción del Geoportal de
Chile pretende resolver.
DEFINICIÓN Y ARQUITECTURA DEL GEOPORTAL
Desde un punto de vista práctico, el Geoportal es una
aplicación informática que permite la visualización de
cartografía vía internet, y esto es todo lo que un usuario
del sistema requiere conocer y entender. El resto de las
complejidades asociadas deben ser transparentes para él.
En los siguientes párrafos explicamos algunos puntos
relevantes de dichas complejidades del sistema, que permitirán
conocer cómo funciona el Geoportal internamente o “detrás de
la cara visible”.
Como hemos dicho, la herramienta apunta a resolver
la problemática de visualización y análisis integrado de la
información residente en las distintas instituciones del país,
of the National Coordination of Territorial
Information, SNIT, whose technical approach is
associated with a global concept called “spatial
data infrastructure (SDI). The definition given
by the collaborative encyclopaedia Wikipedia
in relation to IDE is as follows: “technology,
policies, standards, human resources and
actions needed to acquire, process, distribute,
use, maintain and preserve spatial data.”
Based on this and other definitions,
technology is a point of great significance in
the process of creating the SNIT. We wanted
to highlight this aspect because it is directly
related to the continued development of
software tools, which aims to give support and
accompaniment to the creation of the IDE in
Chile.
To be able to know the Territorial
information which already exists in the
country, how and what it was built, are the
most important questions that the “Catalog of
National Territorial Information” is intended
to respond on the website of www.snit.cl. The
idea is that the institutions of the country can
document in a standardized form, through
sheets of Metadata, the information produced
and maintained so as to publish its existence
in a transparent and democratic way. In other
words, the catalog is a seeker of geospatial
information, giving lists of results and technical
descriptions of products on land information.
Furthermore, if the information is available
via internet, we can access it through
hyperlinks.
While the catalog provides access to
information available online, this access is given
under certain conditions that each institution
has in a separate form,product by product and
in different browser windows.
The need to visualize and analyze the
sets of mapping information which resides
in institutions scattered over the territory, in
digital and automated form via internet, is the
35

lo que implica pensar en dos requerimientos muy importantes:
el primero, es que debemos tener un lugar especial donde la
visualización y el análisis integrado ocurra; y el segundo, es que la
información se encuentre distribuida, por lo tanto debe ser enviada
o provista hacia el lugar donde ocurre la visualización.
A partir de estas dos condiciones, podemos señalar que se trata
de un sistema distribuido, y para poder definir las características
de cada uno de sus componentes, se ha utilizado el concepto de
Nodo. Cuando hablamos de disponer de un lugar único donde
ocurre la visualización, estamos hablando de una parte del sistema
que permite centralizar y desplegar en Internet los contenidos del
Geoportal. Esta parte del sistema, o mejor dicho este subsistema
lo hemos denominado Nodo Central. En relación a los diversos
subsistemas existentes en las instituciones donde reside la
información, los hemos llamado Nodos Proveedores.
Existe una tercera condición que tiene relación con la
información. Cuando describimos el Catálogo Nacional de
Información Territorial, hemos hecho referencia a “Productos
de Información Geoespacial”. Sin embargo, cuando se trata del
Geoportal, la atención la centraremos en un subconjunto de
productos, en particular en aquellos que corresponden a cartografía
digital publicada en internet como servicios de mapas.
Por último, una cuarta condición dice relación con la forma
en que la información es publicada. Utilizando como analogía una
conversación telefónica, podemos decir que no basta con que dos
personas puedan hablar a través de una línea que los comunique,
se necesita además de un idioma común para que la comunicación
realmente exista. En nuestro caso, el idioma común es el estándar
NODO CENTRAL = VENTANA ÚNICA
MBN
MINVU
IGM SAP SHOA
SERNAGEOMIN
GORE
UCT
CNR
NODOS PROVEEDORES = INSTITUCIONES
SUBSISTEMAS
Figura 1: Diagramainterconexión Nodos Geoportal.
Figure 1: Geoportal node interconnection Diagram.
challenge that the construction of the
Geoportal of Chile seeks to solve.
DEFINITION ANDARCHITECTURE OFTHE GEOPORTAL
From a practical point of view the
Geoportal is a software application
that allows the display of maps via
Internet, and this is all what a system
user requires to know and understand.
The rest of the complexities associated
must be transparent for the user.
The following paragraphs explain
some relevant points of those
complexities of the system, which
allow to know how the Geoportral
works internally or “behind the visible
face.”
As we have said, the tool aims
to solve the problem of visualization
and an integrated analysis of the
information residing in different
institutions in the country, which
means thinking in two very important
requirements: first, we must have a
special place where the display and
the integrated analysis will occur; and
the second is that the information
is distributed, so it must be sent or
supplied to the place where the display
occurs.
From these two conditions, we
can say that this is a distributed
system, and in order to define
the characteristics of each of its
components, the concept of “node” has
been used. When we speak of having
a unique place where the display
occurs, we are talking about a system
that allows the centralization and
deployment in the internet of the
contents of the Geoportal. This part
of the system, or in other words, this
SECRETARÍA EJECUTIVA SNIT
36

WMS (Web Map Service) del Open
Geospatial Consortium (OGC).
En resumen, tenemos muchos
Nodos Proveedores que envían
información publicada como
servicios de mapa WMS hacia
el Nodo Central, utilizando como
medio de comunicación internet
(Figura 1).
EL NODO CENTRAL
El subsistema Nodo Central,
está asociado al nombre de
fantasía “Geoportal de Chile”,
principalmente debido a que
constituye la cara visible
del sistema. Su acceso está
disponible como vínculo desde
la portada del sitio web SNIT
www.snit.cl o directamente a
través de www.geoportal.cl.
Este subsistema ha sido
construido pensando en entregar
una herramienta que permita
acceder a información cartográfica
de Chile y superponerla en un
visualizador de mapas. Una
característica relevante es que
la información no se presenta
procesada por un administrador
central, sino que se entrega el
poder al usuario que hace uso del
sistema. El supuesto utilizado es
que cada persona que ingresa al
Geoportal es diferente, por lo que
la herramienta ha sido diseñada
para que cada persona defina
qué datos son de su interés, y
finalmente construya sus propios
mapas.
La herramienta es un apoyo
para facilitar la toma de decisiones
informada tanto a directivos como
profesionales y ciudadanos en
general.
El Geoportal presenta en
su página de inicio una interfaz
simple, con muy poca información
y funcionalidades (Figura 2). La
idea es presentar sólo contenidos
destacados, en la actualidad seis,
Figura 2: Portada o página de inicio del Geoportal.
Figure 2: Homepageof the Geoportal.
subsystem is called “Central Node”.
In relation to the various existing
subsystems within the institutions,
we have called them “Providers
nodes
There is a third condition
that is related to the information.
When we described the National
Territorial Information Catalog,
we referred to “Geospatial
Information Products.” But when
it comes to the Geoportal , the
attention will focus on a subset of
products, particularly those that
are published in digital mapping
services such as internet maps.
Finally, a fourth condition
relates to how the information
is published. Using an analogy
of a telephone conversation, we
can say that it is not enough that
two people can talk through a
line that communicates, you need
besides a common language so
that communication really happens.
In our case the common language
is the standard WMS (Web Map
Service) of the Open Geospatial
Consortium (OGC).
In short, we have many
providers nodes sending
information which are published as
WMS map services to the Central
Node, using the internet as a means
of communication (Figure 1).
37
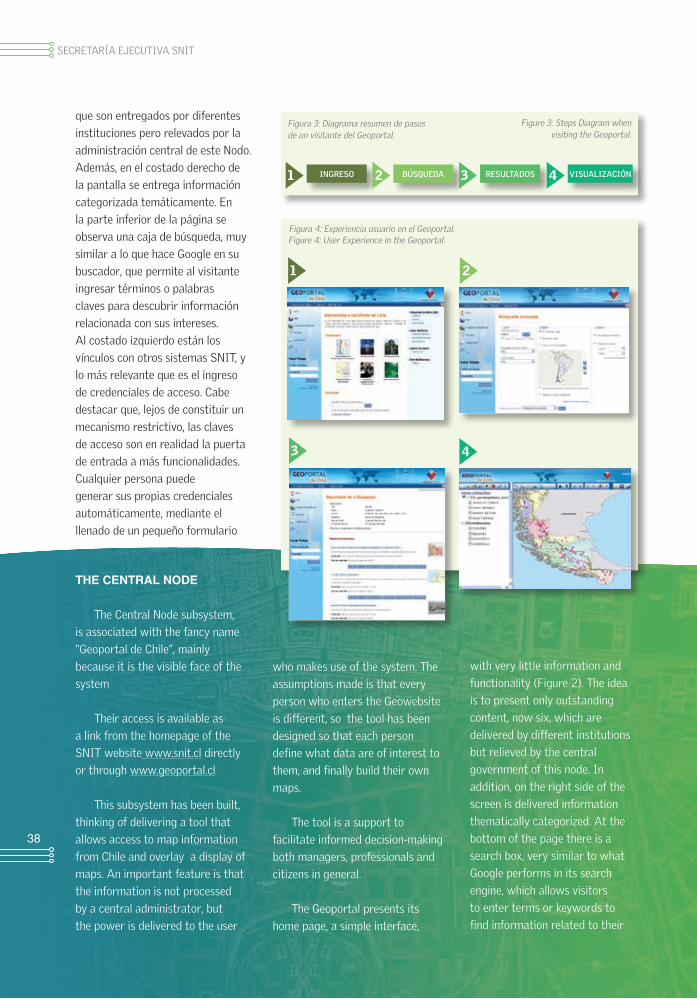
que son entregados por diferentes
instituciones pero relevados por la
administración central de este Nodo.
Además, en el costado derecho de
la pantalla se entrega información
categorizada temáticamente. En
la parte inferior de la página se
observa una caja de búsqueda, muy
similar a lo que hace Google en su
buscador, que permite al visitante
ingresar términos o palabras
claves para descubrir información
relacionada con sus intereses.
Al costado izquierdo están los
vínculos con otros sistemas SNIT, y
lo más relevante que es el ingreso
de credenciales de acceso. Cabe
destacar que, lejos de constituir un
mecanismo restrictivo, las claves
de acceso son en realidad la puerta
de entrada a más funcionalidades.
Cualquier persona puede
generar sus propias credenciales
automáticamente, mediante el
llenado de un pequeño formulario
THE CENTRAL NODE
The Central Node subsystem,
is associated with the fancy name
“Geoportal de Chile”, mainly
because it is the visible face of the
system
Their access is available as
a link from the homepage of the
SNIT website www.snit.cl directly
or through www.geoportal.cl
This subsystem has been built,
thinking of delivering a tool that
allows access to map information
from Chile and overlay a display of
maps. An important feature is that
the information is not processed
by a central administrator, but
the power is delivered to the user
who makes use of the system. The
assumptions made is that every
person who enters the Geowebsite
is different, so the tool has been
designed so that each person
define what data are of interest to
them, and finally build their own
maps.
The tool is a support to
facilitate informed decision-making
both managers, professionals and
citizens in general.
The Geoportal presents its
home page, a simple interface,
with very little information and
functionality (Figure 2). The idea
is to present only outstanding
content, now six, which are
delivered by different institutions
but relieved by the central
government of this node. In
addition, on the right side of the
screen is delivered information
thematically categorized. At the
bottom of the page there is a
search box, very similar to what
Google performs in its search
engine, which allows visitors
to enter terms or keywords to
find information related to their
1 2
3 4
Figura 4: Experiencia usuario en el Geoportal.
1 2 3 4INGRESO BÚSQUEDA RESULTADOS VISUALIZACIÓN
Figura 3: Diagrama resumen de pasosde un visitante del Geoportal.
Figure 3: Steps Diagram whenvisiting the Geoportal.
Figure 4: User Experience in the Geoportal.
SECRETARÍA EJECUTIVA SNIT
38

que le permitirá guardar las
búsquedas que ha realizado en
el sistema y los mapas que ha
construido en el Geoportal para
visitarlos cuantas veces quiera en
el futuro, sin tener que volver a
realizar esta operación.
Ya mencionamos que es posible
realizar búsquedas en el sistema,
y en este punto cabe preguntarse:
¿cómo sabe el Geoportal qué
información existe en las distintas
instituciones del país y sabe dónde
acceder a ella? El Geoportal se
alimenta de Fichas de Metadatos,
es decir, es también un Catálogo de
Información Territorial, pero más
reducido que el Catálogo Nacional,
ya que se enfoca principalmente
a productos de cartografía digital
publicada en internet a partir de
servicios de mapas.
La experiencia de un usuario
que visita el sistema debiera tener
la siguiente secuencia lógica:
ingreso al sistema, búsqueda de
información de interés, el sistema
le presenta una lista con resultados
relacionados y finalmente la
persona solicita al Geoportal que
cargue o muestre los productos
de información de su interés
particular (Figura 3).
La misma secuencia en la
práctica se ve en la Figura 4.
interests. On the left side, there are links connecting
other SNIT systems , and the most relevant is the
entry of access credentials. It should be noted
that, far from constituting a restrictive mechanism,
the access codes are really the gateway to more
features. Anyone can generate their own credentials
automatically, by filling out a simple form that lets the
user save searches he has made to the system and
the maps he has built in the Geoportal. To visit them
as often as he wants in the future, without having to
go back to perform this operation.
We mentioned that it is possible to search the
system, and at this point the question arises: How
does the Geoportal know what information exists
in the various institutions of the country and where
to access it?. The Geoportal feeds Metadata Files,
ie it is also a Territorial Information Catalog, but
smaller than the National List, as it focuses mainly
Cartographic digital products on the Internet from
mapping services.
The experience of a user who visits the system should
have the following sequence: enter into the system,
search for information of interest, a list of results will be
displayed and finally the person requests the Geoportal to
load or display products Information of particular interest
(Figure 3).
The same sequence in practice is similar to Figure 4.
The place where the information is viewed completely,
is located in a window or page that is called “Map
Viewer”. This map viewer has some common tools for this
type of applications such as Zoom, Symbols View, Identify,
Print, Save, among others (Figure 5).
THE PROVIDERS NODES
To describe the providers Nodes and their
characteristics, we must refer first to the leveling or
technological capabilities of the different institutions of
the country.
El lugar donde la
información es visualizada
de manera conjunta, es una
ventana o página que recibe
el nombre de “Visualizador
de Mapas”. Este visualizador
cartográfico posee algunas
herramientas comunes a
este tipo de aplicativos como
Acercar, Alejar, Ver Simbología,
Identificar, Imprimir, Guardar,
entre otros (Figura 5).
Figura 5: Visualizador de mapas del Geoportal.Figure 5: Geoportal maps display.
39
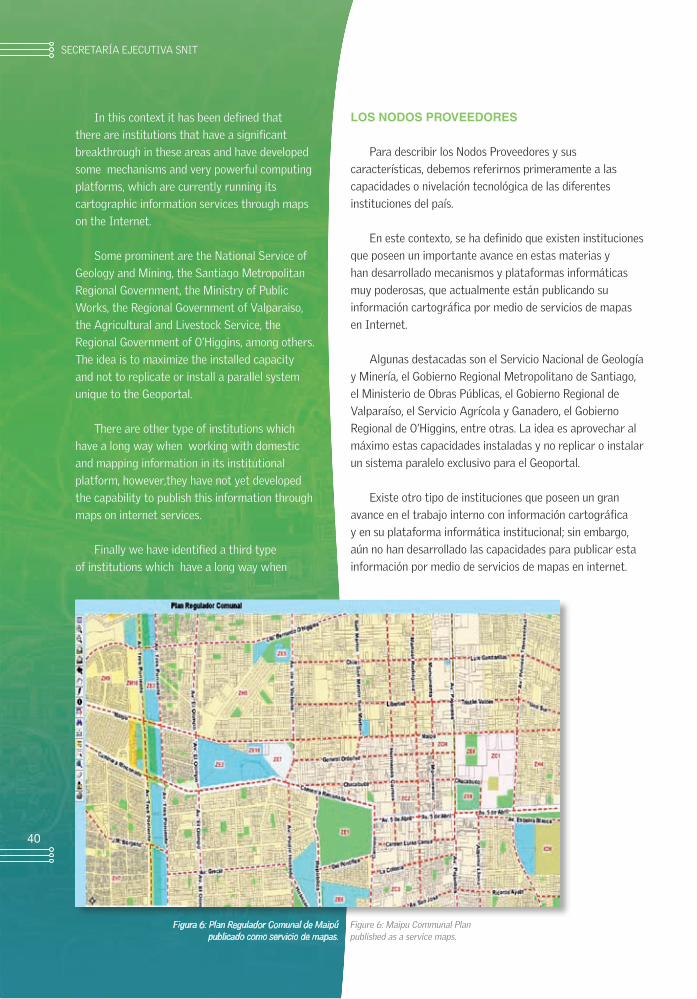
LOS NODOS PROVEEDORES
Para describir los Nodos Proveedores y sus
características, debemos referirnos primeramente a las
capacidades o nivelación tecnológica de las diferentes
instituciones del país.
En este contexto, se ha definido que existen instituciones
que poseen un importante avance en estas materias y
han desarrollado mecanismos y plataformas informáticas
muy poderosas, que actualmente están publicando su
información cartográfica por medio de servicios de mapas
en Internet.
Algunas destacadas son el Servicio Nacional de Geología
y Minería, el Gobierno Regional Metropolitano de Santiago,
el Ministerio de Obras Públicas, el Gobierno Regional de
Valparaíso, el Servicio Agrícola y Ganadero, el Gobierno
Regional de O’Higgins, entre otras. La idea es aprovechar al
máximo estas capacidades instaladas y no replicar o instalar
un sistema paralelo exclusivo para el Geoportal.
Existe otro tipo de instituciones que poseen un gran
avance en el trabajo interno con información cartográfica
y en su plataforma informática institucional; sin embargo,
aún no han desarrollado las capacidades para publicar esta
información por medio de servicios de mapas en internet.
In this context it has been defined that
there are institutions that have a significant
breakthrough in these areas and have developed
some mechanisms and very powerful computing
platforms, which are currently running its
cartographic information services through maps
on the Internet.
Some prominent are the National Service of
Geology and Mining, the Santiago Metropolitan
Regional Government, the Ministry of Public
Works, the Regional Government of Valparaiso,
the Agricultural and Livestock Service, the
Regional Government of O’Higgins, among others.
The idea is to maximize the installed capacity
and not to replicate or install a parallel system
unique to the Geoportal.
There are other type of institutions which
have a long way when working with domestic
and mapping information in its institutional
platform, however,they have not yet developed
the capability to publish this information through
maps on internet services.
Finally we have identified a third type
of institutions which have a long way when
Figura 6: Plan Regulador Comunal de Maipúpublicado como servicio de mapas.
Figure 6: Maipu Communal Planpublished as a service maps.
SECRETARÍA EJECUTIVA SNIT
40

Por último se ha identificado
un tercer tipo de instituciones
que posee un gran avance en el
trabajo interno con información
cartográfica; sin embargo, desde
el punto de vista informático
no están las capacidades
institucionales para generar
servicios digitales en la institución,
por definiciones en sus servidores.
Debido a que existen estos tres
tipos de Nodos Proveedores, y para
considerar una cobertura completa
en el espectro de instituciones
del país, hemos definido tres
estrategias de integración: Para el
primer tipo de instituciones -que
ya poseen capacidades instaladas-
sólo se requiere habilitar la
publicación de servicios de mapas
en WMS, no importando la
plataforma de software instalada
(Figura 6).
Hoy en día, todos los
servidores de mapas más
populares, poseen la capacidad
de publicar servicios WMS,
por lo tanto la institución sólo
debe decidir qué información
es relevante para ser enviada
al Geoportal, habilitar el
correspondiente servicio de
mapa y confeccionar la Ficha de
Metadatos correspondiente. La
elaboración de la ficha ocurre
en el ambiente del Catálogo
Nacional de Información
Territorial, y la comunicación
entre dicho Catálogo y el
Geoportal es automática y
transparente para usuarios y
administradores (Figura 7).
Para el segundo tipo de
instituciones -que poseen un
importante trabajo interno pero
working with internal mapping
information, but from the
computing point of view they
are not institutional capacities to
generate digital services in the
institution, for definitions on their
servers.
Because there are three types
of Providers nodes, and to consider
full coverage in the spectrum of
institutions in the country, we
have identified three integration
strategies: For the first type of
institutions which already have an
installed-capacity the publication
of maps in WMS services is
only required, regardless of the
software platform which has been
installed (Figure 6).
Today, all the most popular
interactive maps, have the ability
to publish WMS services , so the
institution only has to decide
what information is relevant
to be sent to the Geoportal,
enabling the corresponding
service and making up of the
corresponding Metadata chips.
The development of the card
occurs in the environment of the
Catálogo Nacional de Información
Territorial and the communication
between the catalog and the
Geoportal is automatic and
transparent to the users and
administrators (Figure 7).
For the second type of
institutions which have an
important internal work but which
have not yet been published on
the Internet, we are finishing the
development of a small application
called “Standard Provider Node
Geoportal”. This tool is built on
open platforms and has free
distribution, so that any institution
which wants to use it can do it
without costs.
The software allows them to
store information in a geographic
Figure 7: Environment for creating chips on Catálogo Nacional de Información Territorial. Figura 7: Ambiente de creación de fichas en Catálogo Nacional de Información Territorial.
41

que aún no han publicado en Internet- estamos
terminando el desarrollo de un pequeño aplicativo
llamado Nodo Proveedor Estándar del Geoportal.
Esta herramienta está construida bajo plataformas
abiertas y de libre distribución, con la finalidad de
que toda institución que desee utilizarla lo haga sin
costos de licenciamiento. El software les permite
almacenar la información en una base de datos
geográfica, crear composiciones cartográficas y
publicarlas por medio de servicios de mapas WMS
hacia el Geoportal y también hacia cualquier otro
Nodo de la red. El nombre de fantasía del aplicativo
es “Geonodo” y le permitirá comunicarse con
el Geoportal mediante fichas de Metadatos vía
cosechas y GeoRSS (Figura 8).
Finalmente, para el tercer tipo de instituciones,
que no poseen las capacidades propias para publicar
su información ni para implementar el Geonodo,
se dispone de un servicio de hosting o alojamiento
en los servidores centrales del Geoportal, donde
es factible mantener una copia de la información,
la cual es publicada mediante servicios de mapas.
Para ello hemos realizado desarrollos internos en
conjunto con las Coordinaciones de las Regiones de
Arica-Parinacota, Tarapacá y Magallanes (Figura
9). En el futuro se utilizará el Geonodo para dichos
efectos.
database, create and publish compositions and
cartographic services through WMS maps to
the Geoportal and also to any other node on
the network. The fancy name of the application
is “Geonode” and allow you to communicate
with the chips through Metadata Geoportal via
crops and GeoRSS (Figure 8).
Finally, for the third type of institutions,
which do not possess the capabilities to
post their own information or to implement
the Geonode, there is a hosting service or
accommodation in the central servers of the
Geoportal, where it is feasible to maintain a
copy of the information , which is published
by mapping services. We have conducted
internal developments in conjunction with the
Coordination Regions of Arica-Parinacota,
Tarapaca and Magallanes (Figure 9). In the
future, Geonode will be used for such purposes.
CURRENT STATUS AND CHALLENGES
The Geoportal was published on the
Internet, for its start up, on August 25, 2008.
During this period, about 60 information
products supplied from twenty institutions in
the country were integrated into the tool.
Figure 8: Geonode Display.Figura 8: Visualizador Geonodo.
SECRETARÍA EJECUTIVA SNIT
42
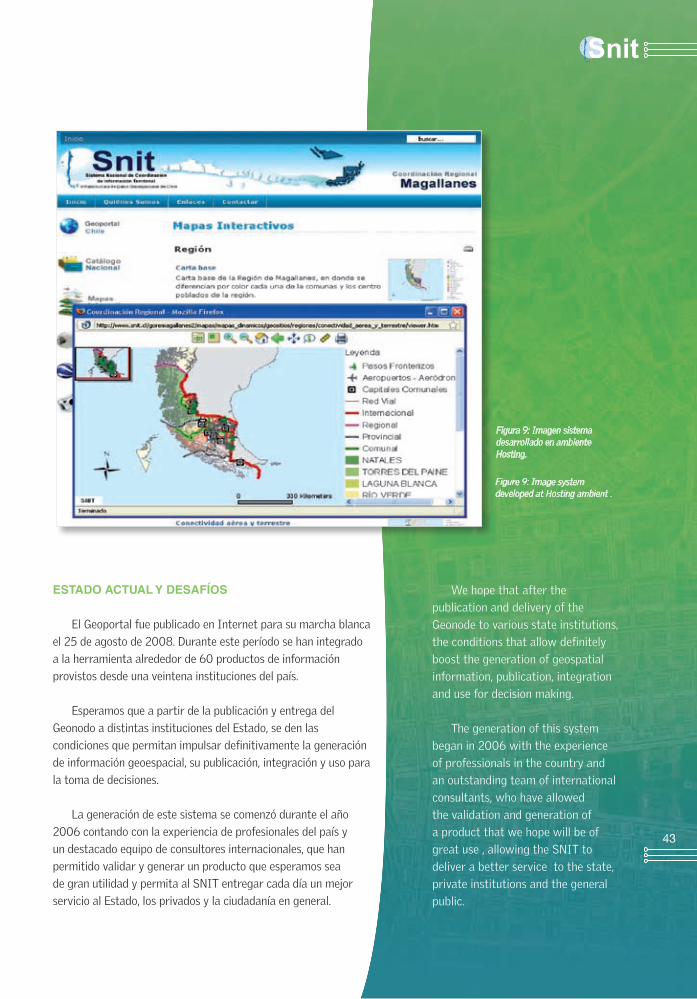
ESTADO ACTUAL Y DESAFÍOS
El Geoportal fue publicado en Internet para su marcha blanca
el 25 de agosto de 2008. Durante este período se han integrado
a la herramienta alrededor de 60 productos de información
provistos desde una veintena instituciones del país.
Esperamos que a partir de la publicación y entrega del
Geonodo a distintas instituciones del Estado, se den las
condiciones que permitan impulsar definitivamente la generación
de información geoespacial, su publicación, integración y uso para
la toma de decisiones.
La generación de este sistema se comenzó durante el año
2006 contando con la experiencia de profesionales del país y
un destacado equipo de consultores internacionales, que han
permitido validar y generar un producto que esperamos sea
de gran utilidad y permita al SNIT entregar cada día un mejor
servicio al Estado, los privados y la ciudadanía en general.
We hope that after the
publication and delivery of the
Geonode to various state institutions,
the conditions that allow definitely
boost the generation of geospatial
information, publication, integration
and use for decision making.
The generation of this system
began in 2006 with the experience
of professionals in the country and
an outstanding team of international
consultants, who have allowed
the validation and generation of
a product that we hope will be of
great use , allowing the SNIT to
deliver a better service to the state,
private institutions and the general
public.
Figure 9: Image systemdeveloped at Hosting ambient .
Figura 9: Imagen sistema desarrollado en ambiente Hosting.
43
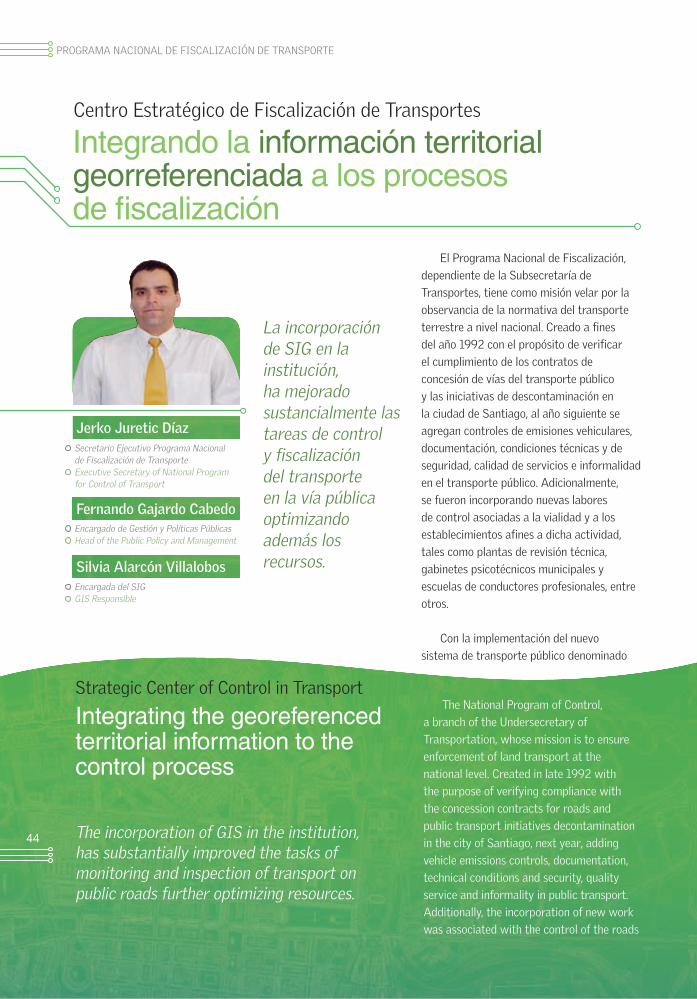
Jerko Juretic Díaz
Fernando Gajardo Cabedo
Silvia Alarcón Villalobos
Secretario Ejecutivo Programa Nacionalde Fiscalización de TransporteExecutive Secretary of National Program for Control of Transport
Encargado de Gestión y Políticas PúblicasHead of the Public Policy and Management
Encargada del SIGGIS Responsible
El Programa Nacional de Fiscalización,
dependiente de la Subsecretaría de
Transportes, tiene como misión velar por la
observancia de la normativa del transporte
terrestre a nivel nacional. Creado a fines
del año 1992 con el propósito de verificar
el cumplimiento de los contratos de
concesión de vías del transporte público
y las iniciativas de descontaminación en
la ciudad de Santiago, al año siguiente se
agregan controles de emisiones vehiculares,
documentación, condiciones técnicas y de
seguridad, calidad de servicios e informalidad
en el transporte público. Adicionalmente,
se fueron incorporando nuevas labores
de control asociadas a la vialidad y a los
establecimientos afines a dicha actividad,
tales como plantas de revisión técnica,
gabinetes psicotécnicos municipales y
escuelas de conductores profesionales, entre
otros.
Con la implementación del nuevo
sistema de transporte público denominado
Centro Estratégico de Fiscalización de Transportes
Integrando la información territorialgeorreferenciada a los procesosde fiscalización
The National Program of Control,
a branch of the Undersecretary of
Transportation, whose mission is to ensure
enforcement of land transport at the
national level. Created in late 1992 with
the purpose of verifying compliance with
the concession contracts for roads and
public transport initiatives decontamination
in the city of Santiago, next year, adding
vehicle emissions controls, documentation,
technical conditions and security, quality
service and informality in public transport.
Additionally, the incorporation of new work
was associated with the control of the roads
The incorporation of GIS in the institution, has substantially improved the tasks of monitoring and inspection of transport on public roads further optimizing resources.
Integrating the georeferenced territorial information to the control process
Strategic Center of Control in Transport
PROGRAMA NACIONAL DE FISCALIZACIÓN DE TRANSPORTE
La incorporación de SIG en la institución, ha mejorado sustancialmente las tareas de control y fiscalización del transporte en la vía pública optimizando además los recursos.
44
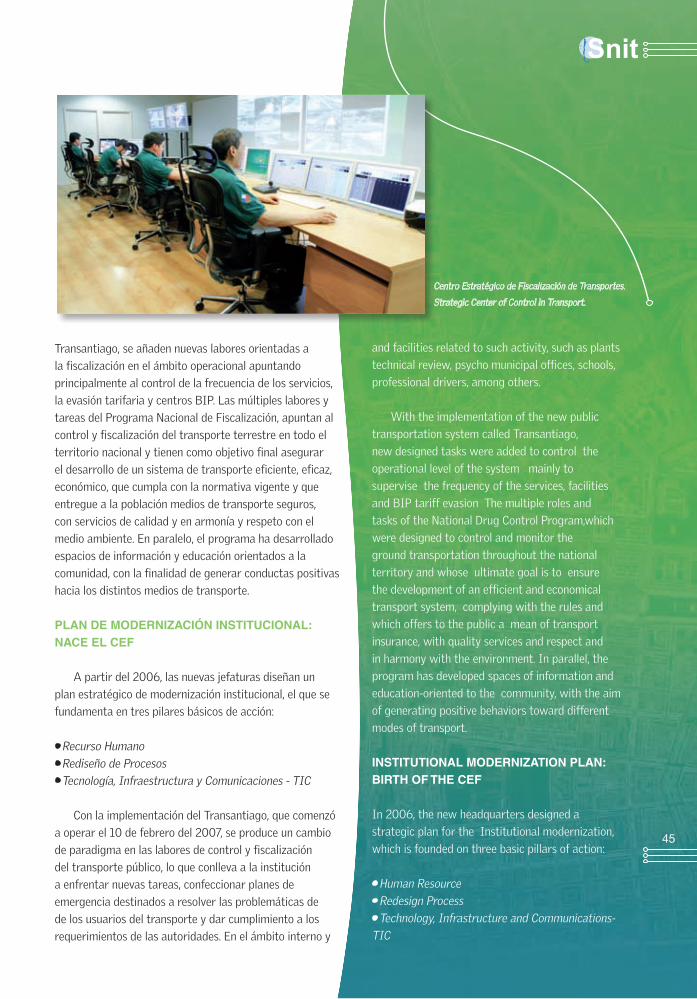
Transantiago, se añaden nuevas labores orientadas a
la fiscalización en el ámbito operacional apuntando
principalmente al control de la frecuencia de los servicios,
la evasión tarifaria y centros BIP. Las múltiples labores y
tareas del Programa Nacional de Fiscalización, apuntan al
control y fiscalización del transporte terrestre en todo el
territorio nacional y tienen como objetivo final asegurar
el desarrollo de un sistema de transporte eficiente, eficaz,
económico, que cumpla con la normativa vigente y que
entregue a la población medios de transporte seguros,
con servicios de calidad y en armonía y respeto con el
medio ambiente. En paralelo, el programa ha desarrollado
espacios de información y educación orientados a la
comunidad, con la finalidad de generar conductas positivas
hacia los distintos medios de transporte.
PLAN DE MODERNIZACIÓN INSTITUCIONAL: NACE EL CEF
A partir del 2006, las nuevas jefaturas diseñan un
plan estratégico de modernización institucional, el que se
fundamenta en tres pilares básicos de acción:
• Recurso Humano• Rediseño de Procesos• Tecnología, Infraestructura y Comunicaciones - TIC
Con la implementación del Transantiago, que comenzó
a operar el 10 de febrero del 2007, se produce un cambio
de paradigma en las labores de control y fiscalización
del transporte público, lo que conlleva a la institución
a enfrentar nuevas tareas, confeccionar planes de
emergencia destinados a resolver las problemáticas de
de los usuarios del transporte y dar cumplimiento a los
requerimientos de las autoridades. En el ámbito interno y
and facilities related to such activity, such as plants
technical review, psycho municipal offices, schools,
professional drivers, among others.
With the implementation of the new public
transportation system called Transantiago,
new designed tasks were added to control the
operational level of the system mainly to
supervise the frequency of the services, facilities
and BIP tariff evasion The multiple roles and
tasks of the National Drug Control Program,which
were designed to control and monitor the
ground transportation throughout the national
territory and whose ultimate goal is to ensure
the development of an efficient and economical
transport system, complying with the rules and
which offers to the public a mean of transport
insurance, with quality services and respect and
in harmony with the environment. In parallel, the
program has developed spaces of information and
education-oriented to the community, with the aim
of generating positive behaviors toward different
modes of transport.
INSTITUTIONAL MODERNIZATION PLAN: BIRTH OF THE CEF
In 2006, the new headquarters designed a
strategic plan for the Institutional modernization,
which is founded on three basic pillars of action:
• Human Resource • Redesign Process • Technology, Infrastructure and Communications-TIC
Strategic Center of Control in Transport.
Centro Estratégico de Fiscalización de Transportes.
45

por mandato presidencial, la institución debió extender las
jornadas laborales y crecer operacionalmente, aumentado
su dotación de personal en 400 inspectores fiscales.
Esta contingencia obligó al programa a acelerar su plan
estratégico de modernización institucional y en esta
coyuntura, nace el Centro Estratégico de Fiscalización
(CEF).
El CEF es fundamentalmente un centro estratégico
de monitoreo, control y fiscalización del transporte a nivel
nacional. En él converge toda la información proveniente
de distintas fuentes e instituciones. Sus pilares de diseño
fueron integrar infraestructura ya instalada o preexistente
de otras instituciones asociadas a la temática de
transporte, con el propósito de optimizar la operación del
programa de fiscalización y convertirse en la plataforma
tecnológica de integración e interoperabilidad de
información para futuros proyectos de fiscalización en
Chile. En este contexto, la información territorial cobra
gran relevancia en las labores operativas institucionales.
Creada la necesidad, el programa incorpora el uso de
los Sistemas de Información Geográfica (SIG) y se
inserta en el manejo y análisis de la información espacial
georreferenciada.
La integración e interoperabilidad de la información
implicó además la modernización en los procesos de toma
de datos, estandarización de la información y análisis
y reformulación de los procesos internos del programa.
Actualmente la institución se encuentra interoperando
con las siguientes entidades:
• Transporte Público (frecuencia, recorrido, denuncias)• UOCT (Unidad Operativa de Control de Tránsito)• OIRS, que se encarga de atender las denuncias de los usuarios
With the implementation of the new public
transport system, Transantiago, which began
operations on February 10, 2007, a paradigm
shift in the work of the control and supervision
of the public transport is produced , which leads
the institution to face new tasks,to make plans,
to solve the problems of transport users and to
comply with the requirements of the authorities.
On the domestic side and by the presidential
mandate, the institution had to extend working
hours and grow operationally, increasing its
staffing in 400 tax inspectors. This forced the
contingency program to accelerate its strategic
plan for modernization and institutional juncture,
giving birth to the Strategic Center of Control in
Transport (CEF).
The CEF is essentially a strategic center
for monitoring and controlling the transport
nationwide. It converges all the information from
various sources and institutions. Its pillars were
designed to integrate existing infrastructure
already installed or from other institutions
associated with the theme of transport, in order
to optimize the operation of the audit program
and become the technological integration platform
and interoperability of information for future
projects of control in Chile. In this context, the
territorial information becomes very relevant in
the institutional operational Proceedings. Having
created the need, the program incorporates the
use of Geographic Information Systems (GIS) and
it is inserted into the handling and analysis of geo-
spatial information.
The integration and interoperability of
information also meant the modernization of the
processes data making, the standardization of
information and the analysis and reformulation
of the internal processes of the program. Today
the institution is interoperable with the following
organizations:
• Public Transport (frequency, route, complaints) • UOCT (Operational Unit Traffic Control) • OIRS, which is responsible of users complaints • Control of Exclusive Roads with cameras • GPS Fleet Mobile Control
PROGRAMA NACIONAL DE FISCALIZACIÓN DE TRANSPORTE
46
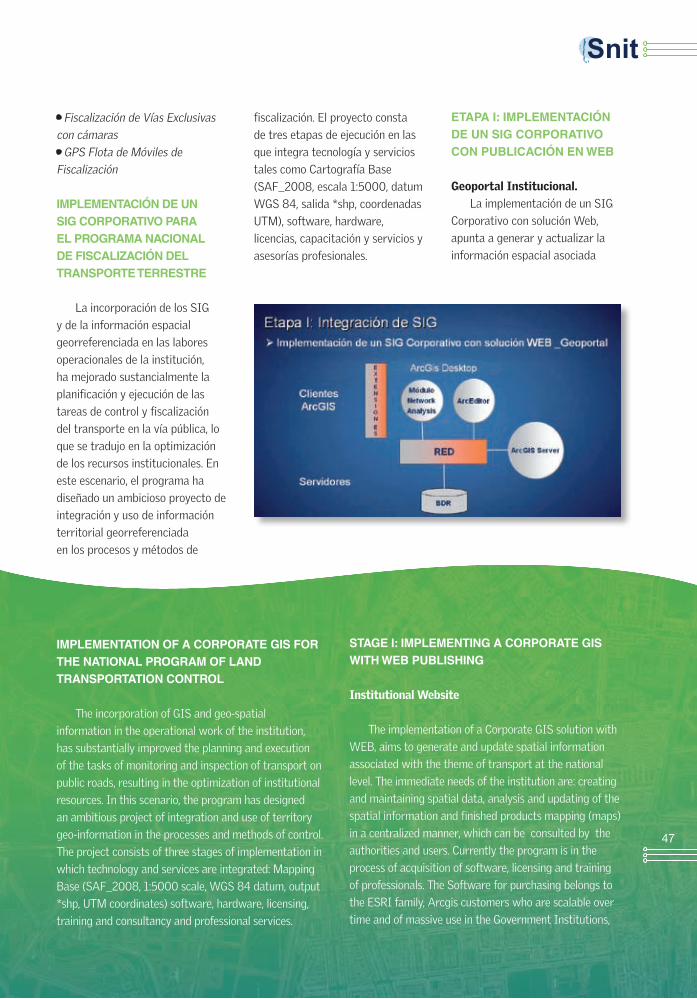
• Fiscalización de Vías Exclusivas con cámaras• GPS Flota de Móviles de Fiscalización
IMPLEMENTACIÓN DE UN SIG CORPORATIVO PARA EL PROGRAMA NACIONAL DE FISCALIZACIÓN DEL TRANSPORTE TERRESTRE
La incorporación de los SIG
y de la información espacial
georreferenciada en las labores
operacionales de la institución,
ha mejorado sustancialmente la
planificación y ejecución de las
tareas de control y fiscalización
del transporte en la vía pública, lo
que se tradujo en la optimización
de los recursos institucionales. En
este escenario, el programa ha
diseñado un ambicioso proyecto de
integración y uso de información
territorial georreferenciada
en los procesos y métodos de
fiscalización. El proyecto consta
de tres etapas de ejecución en las
que integra tecnología y servicios
tales como Cartografía Base
(SAF_2008, escala 1:5000, datum
WGS 84, salida *shp, coordenadas
UTM), software, hardware,
licencias, capacitación y servicios y
asesorías profesionales.
ETAPA I: IMPLEMENTACIÓN DE UN SIG CORPORATIVO CON PUBLICACIÓN EN WEB
Geoportal Institucional.
La implementación de un SIG
Corporativo con solución Web,
apunta a generar y actualizar la
información espacial asociada
IMPLEMENTATION OF A CORPORATE GIS FOR THE NATIONAL PROGRAM OF LANDTRANSPORTATION CONTROL
The incorporation of GIS and geo-spatial
information in the operational work of the institution,
has substantially improved the planning and execution
of the tasks of monitoring and inspection of transport on
public roads, resulting in the optimization of institutional
resources. In this scenario, the program has designed
an ambitious project of integration and use of territory
geo-information in the processes and methods of control.
The project consists of three stages of implementation in
which technology and services are integrated: Mapping
Base (SAF_2008, 1:5000 scale, WGS 84 datum, output
*shp, UTM coordinates) software, hardware, licensing,
training and consultancy and professional services.
STAGE I: IMPLEMENTING A CORPORATE GIS WITH WEB PUBLISHING
Institutional Website
The implementation of a Corporate GIS solution with
WEB, aims to generate and update spatial information
associated with the theme of transport at the national
level. The immediate needs of the institution are: creating
and maintaining spatial data, analysis and updating of the
spatial information and finished products mapping (maps)
in a centralized manner, which can be consulted by the
authorities and users. Currently the program is in the
process of acquisition of software, licensing and training
of professionals. The Software for purchasing belongs to
the ESRI family, Arcgis customers who are scalable over
time and of massive use in the Government Institutions,
47

a la temática de transporte a
nivel nacional. Las necesidades
inmediatas de la institución
son: generar y mantener datos
espaciales, análisis y actualización
de la información espacial
y elaboración de productos
cartográficos terminados (mapas)
en forma centralizada, que sean de
consulta para las autoridades y los
usuarios. Actualmente, el programa
se encuentra en proceso de
adquisición de software, licencias y
capacitación de profesionales. Los
softwares por adquirir pertenecen
a la familia ESRI, son clientes
ArcGis, escalables en el tiempo
y de uso masivo en instituciones
gubernamentales, lo que facilita la
interoperabilidad de la información
y produce una sinergia en la
coordinación y cooperación
interinstitucional.
Posteriormente se incluirá el
Geoportal en la página Web de
la institución, el que contendrá
productos cartográficos
terminados y algunas aplicaciones
de comandos básicos para los
usuarios de diferentes perfiles, los
que fueron definidos como usuario
administrador, usuarios internos de
la institución y usuarios básicos.
Este diseño de la plataforma
SIG en linea y el Geoportal de
publicación cartográfica y de
datos y documentos, debe tener la
capacidad de conectarse con los
servidores de otras instituciones,
lineamientos que se han estipulado
en el DS Nº 28/2006 del MBN y
que gestiona e impulsa el SNIT.
Es de gran interés conectarse
también con el Geoportal del
Sistema Nacional de Coordinación
de Información Territorial (SNIT),
con la finalidad de incluir las fichas
metadatos elaboradas por la
institución.
ETAPA II: TOMA DE DATOS EN TERRENO Y GEORREFE-RENCIACIÓN IN SITU
Fiscalización ha integrado
tecnología inalámbrica para la
toma y transmisión de datos en
terreno, la que se realiza en forma
remota a través de dispositivos
móviles (PDA). La información
recopilada en terreno por parte de
los inspectores fiscales (controles
e infracciones cursadas) queda
disponible de manera online, lo que
permite hacer gestión de forma
simultánea. También se puede
acceder a información relevante
para el control del transporte:
which facilitates the interoperability of information and
produces a synergy in the coordination and cooperation.
The Geosite was later included in the website of the
institution, which contains cartographic finished
products and some applications of basic commands
for users of different profiles, which were defined as: a
user manager, internal users and users of the Institution
commodities.
This design of the GIS platform and online publishing
Geosite mapping, data and documents, must have
the ability to connect servers from other institutions,
guidelines have been prescribed in the Supreme Decree
No. 28/2006 which manages the MBN and promotes
the SNIT. It is also of a great interest to connect with
the Geosite of the National Coordination of Territorial
Information (SNIT), with the aim of including the
metadata chips developed by the institution.
STAGE II: TAKING DATA AND GEOREFERENCING ON THE GROUND
The control has integrated wireless technology for
the taking and field data transmission, which takes place
through mobile devices (PDA). The information gathered
at field by the tax inspectors (and the issued Infractions)
are available online, which allows a simultaneous
management. Also the access to relevant information for
the control of the Transport is available in the following
units:
PROGRAMA NACIONAL DE FISCALIZACIÓN DE TRANSPORTE
48
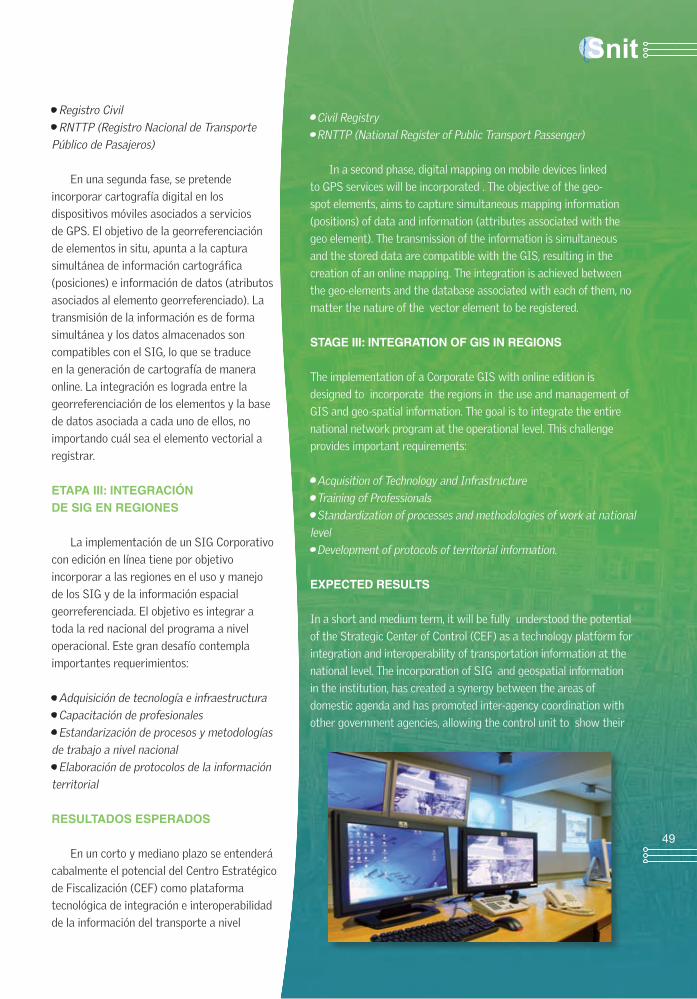
• Registro Civil• RNTTP (Registro Nacional de Transporte Público de Pasajeros)
En una segunda fase, se pretende
incorporar cartografía digital en los
dispositivos móviles asociados a servicios
de GPS. El objetivo de la georreferenciación
de elementos in situ, apunta a la captura
simultánea de información cartográfica
(posiciones) e información de datos (atributos
asociados al elemento georreferenciado). La
transmisión de la información es de forma
simultánea y los datos almacenados son
compatibles con el SIG, lo que se traduce
en la generación de cartografía de manera
online. La integración es lograda entre la
georreferenciación de los elementos y la base
de datos asociada a cada uno de ellos, no
importando cuál sea el elemento vectorial a
registrar.
ETAPA III: INTEGRACIÓNDE SIG EN REGIONES
La implementación de un SIG Corporativo
con edición en línea tiene por objetivo
incorporar a las regiones en el uso y manejo
de los SIG y de la información espacial
georreferenciada. El objetivo es integrar a
toda la red nacional del programa a nivel
operacional. Este gran desafío contempla
importantes requerimientos:
• Adquisición de tecnología e infraestructura• Capacitación de profesionales• Estandarización de procesos y metodologías de trabajo a nivel nacional• Elaboración de protocolos de la información territorial
RESULTADOS ESPERADOS
En un corto y mediano plazo se entenderá
cabalmente el potencial del Centro Estratégico
de Fiscalización (CEF) como plataforma
tecnológica de integración e interoperabilidad
de la información del transporte a nivel
• Civil Registry • RNTTP (National Register of Public Transport Passenger)
In a second phase, digital mapping on mobile devices linked
to GPS services will be incorporated . The objective of the geo-
spot elements, aims to capture simultaneous mapping information
(positions) of data and information (attributes associated with the
geo element). The transmission of the information is simultaneous
and the stored data are compatible with the GIS, resulting in the
creation of an online mapping. The integration is achieved between
the geo-elements and the database associated with each of them, no
matter the nature of the vector element to be registered.
STAGE III: INTEGRATION OF GIS IN REGIONS
The implementation of a Corporate GIS with online edition is
designed to incorporate the regions in the use and management of
GIS and geo-spatial information. The goal is to integrate the entire
national network program at the operational level. This challenge
provides important requirements:
• Acquisition of Technology and Infrastructure • Training of Professionals• Standardization of processes and methodologies of work at national level • Development of protocols of territorial information. EXPECTED RESULTS
In a short and medium term, it will be fully understood the potential
of the Strategic Center of Control (CEF) as a technology platform for
integration and interoperability of transportation information at the
national level. The incorporation of SIG and geospatial information
in the institution, has created a synergy between the areas of
domestic agenda and has promoted inter-agency coordination with
other government agencies, allowing the control unit to show their
49

nacional. La incorporación de los SIG y de la
información geoespacial en la institución, ha generado
una sinergia entre las áreas internas del programa y
ha fomentado la coordinación interinstitucional con el
resto de los organismos gubernamentales, permitiendo
a Fiscalización mostrar su quehacer al resto de la
comunidad y fomentando la colaboración de otras
organizaciones públicas. Los resultados más inmediatos
son:
• Disponer de una herramienta de gestión estratégica para actuar en tiempo real• Integración e interoperabilidad de la información del transporte• Integración de la información de otras instituciones públicas
work to the rest of the community and to promote the
collaboration of other public organizations. The more
immediate results are:
• Have a strategic management tool to act in real time. • Integration and interoperability of transportation information. • Integration of information from other public institutions. • Inter-agency coordination. • Optimization of resources and corporate services. FUTURE FROM 2008 TO 2010
As part of a Bicentennial project,it is intended to
integrate and unite the country around centers equivalent
to the local and national tasks. The great goals for the
future are:
• Interistitutional Operation: public and private. • Integration of GIS in the processes and methods of control. • Geowebsite: Online information and user authority. • CEF in the regions (bicentennial)
Finally, this great innovation in the technology,
internal processes, infrastructure and technical
expertice, aims to optimize the work planning and
institutional transparency in the management of
this program in the field of public policy. In this
sense, the institution has territorial dimension to
the information as an added value in the business
plan of the organization, since it involves reducing
operational and institutional costs. It is not a
matter of making the best decision, but to take
the right one for the benefit of transport users.
• Coordinación interinstitucional
• Optimización de los recursos y servicios institucionales
FUTURO 2008-2010
En el marco de un proyecto Bicentenario, se pretende
integrar y unir al país en torno a centros equivalentes para
las tareas nacionales y locales. Las grandes metas a futuro
son:
• Operación interinstitucional: público y privada• Integración del SIG en los procesos y métodos de fiscalización• Geoportal: Información en línea al usuario y a la autoridad• CEF en regiones (bicentenario)
Finalmente, esta gran innovación en tecnología, procesos
internos, infraestructura y expertice técnico, apunta a
optimizar la planificación de las labores institucionales y
transparentar la gestión de este programa en el ámbito
de las políticas públicas. En este sentido, la institución
ha dimensionado la información territorial como un valor
agregado en el plan de negocios de la organización, ya que
implica la reducción de costos operacionales e institucionales.
Ya no se trata de tomar la mejor decisión, sino que tomar la
decisión correcta en beneficio de los usuarios del transporte.
PROGRAMA NACIONAL DE FISCALIZACIÓN DE TRANSPORTE
50

Con el objetivo de fortalecer la
capacidad del Servicio Nacional de Turismo
(SERNATUR) en materia de planificación
e información sectorial, desde el año 2003
se está implementación un Sistema de
Información Geográfica (SIG) orientado
a apoyar las funciones de análisis,
planificación, gestión y promoción turística.
Este sistema surgió como respuesta a la
necesidad de disponer de una herramienta
que contribuyera a facilitar la planificación
y gestión del Departamento de Planificación
específicamente y de las direcciones
regionales.
Una de las fortalezas de este SIG
radica en su capacidad para construir
representaciones del territorio a partir
Proyecto desarrollado desde 2003 por Sernatur
Exitosa incorporacion de SIG a la Planificación y Gestión Turística
El sistema cuenta con más de 4 mil atractivos turísticos, cerca de 90 áreas prioritarias delimitadas y variados datos que permiten realizar cruces de información mejorando la gestión del servicio.
Humberto Rivas Ortega
Arlette Levy Arensburg
Geógrafo, Magíster en AsentamientosHumanos y Medio AmbienteJefe del Departamentode Planificación de SernaturGeographer, Master of Human Settlements and Environment Head of the Sernatur Planning Department
Geógrafo, Magíster en Gestión AmbientalDepto. Planificación SernaturGeographer, Master of EnvironmentalManagement. Sernatur Planning Department
The system has more than 4 thousand tourist attractions, about 90 priority areas identified and varied data that allow crossings by improving management service.
Succesful incorporation of GISto planning and tourism management
A project which has been developed by Sernatur since 2003
SERVICIO NACIONAL DE TURISMO
With the objective of strengthening the capacity
of the National Tourism Service (SERNATUR) in the
areas of planning and information sector, a Geographic
Information System (GIS) has been implemented to
aim at supporting the functions of analysis, planning,
management and tourism promotion since 2003. This
system emerged in response to the need for a tool to
help to facilitate the planning and management of the
Department of Planning and specifically the regional
bureaux.
One of the great strengths of the GIS is its
ability to construct representations of the territory
from digital and geodatabases for using in analyzing
51

and understanding the effects of natural and
anthropogenic processes that can produce on
the territory within a specific time or in temporal
sequences. In this sense, tourism is a clear example
of a very dynamic activity over time, thus, the
construction of these mapping models is a powerful
tool to analyze trends and identify factors that
determine them, as well as to assess the potential
consequences of planning decisions on existing
resources in the areas of interest.
The work of delimitation of the territory
tourism, as well as the registration, classification
and updating of information has been made
jointly between the National and all the Regional
SERNATUR units, following several variables, the
methodology of attractive land, equipment and
services proposed by the OAS and modified for this
project by SERNATUR.
The system has more than 4 thousand tourist
attractions included in the records, more than 90
bounded priority tourist areas and a varied sector
of touristic information, in addition to what is
obtained and processed as a result of working and
coordinating together with other entities, such as
the Public Services and Private sector, which allows
the crossings and generation of information for
the generation of various products needed for the
management of the service.
GIS STRUCTURE - SERNATUR
The SERNATUR GIS is in ArcView 3.2 and some
software applications such as AVENUE and ACCESS
programming. The base map is a 1 : 250,000 scale
in PSAD56 Datum, UTM coordinates, Huso 19 for
the regions of Arica-Parinacota to Bío-Bío and Huso
18 for the regions of La Araucanía to Magallanes.
The base mapping project corresponds to the
Sendero de Chile, provided for institutional use
through a working agreement with the CONAMA,
which has provided the base map.
Beginning in 2003, it began a process of
collecting and processing information, both at
central SERNATUR and also from the regional
de bases de datos digitales y georreferenciadas para
utilizarlas en el análisis y comprensión de los efectos
que procesos naturales o antrópicos pueden producir
sobre el territorio en un momento específico o en
secuencias temporales. En este sentido, la actividad
turística constituye un claro ejemplo de actividad muy
dinámica en el tiempo, por lo cual, la construcción de
estos modelos cartográficos constituye un instrumento
muy eficaz para analizar las tendencias y determinar los
factores que las determinan, así como para evaluar las
posibles consecuencias de las decisiones de planificación
sobre los recursos existentes en las áreas de interés.
El trabajo de delimitación del territorio turístico,
así como el registro, clasificación y actualización de
la información, ha sido realizado en conjunto entre la
Dirección Nacional y todas las Direcciones Regionales
de SERNATUR, siguiendo para algunas variables la
metodología de catastro de atractivos, equipamiento y
servicios propuesta por la OEA y modificada para este
proyecto por SERNATUR.
El sistema cuenta con más de 4 mil atractivos
turísticos incorporados en los registros, cerca de 90
áreas turísticas prioritarias delimitadas y una variada
información turística sectorial, además de la que se
obtiene y procesa como resultado del trabajo conjunto
Ejemplo de cartografía turística aplicada. Example of applied tourist map.
SERVICIO NACIONAL DE TURISMO
52

y coordinado con otros servicios públicos y entidades del
sector privado, lo cual permite realizar y generar cruces
de información para la generación de diferentes productos
necesarios para la gestión del servicio.
ESTRUCTURA DELSIG-SERNATUR
El SIG-SERNATUR está en formato software ARCVIEW
3.2 y algunas aplicaciones en programación AVENUE y
ACCESS. La base cartográfica es a escala 1 : 250.000
en Datum PSAD56, coordenadas UTM, Huso 19 para las
regiones de Arica-Parinacota hasta Bío-Bío y Huso 18 para
las regiones de La Araucanía hasta Magallanes.
La base cartográfica corresponde al proyecto Sendero
de Chile, facilitada para uso institucional mediante un
convenio de trabajo con la CONAMA, que ha permitido
contar con la cartografía base.
A partir del año 2003 se inició un proceso de
recopilación y procesamiento de información, tanto a
nivel central de SERNATUR como desde las direcciones
regionales, el cual implicó un levantamiento, registro y
procesamiento de la siguiente información georreferenciada
a escala:
• Atractivos turísticos• Areas turísticas prioritarias• Circuitos y corredores turísticos
bureaux, which led to an uprising, recording and
processing of georeferenced information to the
following schedule:
• Tourist Attractions
• Priority tourist Areas
• tourist circuits and travel corridors
• Investment projects
• Areas and places of national tourist interest
Similarly, within the framework of joint work
with other services and institutions such as the
INE, the International Police, the Civil Aeronautics
Board, CONAF, CONAMA and MOP among others,
it has been generated associated ,compiled and
integrated databases with georeferenced and statistics
information.
The GIS has incorporated, among others, the
following georeferenced information:
• Communities and populated localities
• Road Networks
• Airports
• Borders Crossing
• Government National System of Protected Wildernes
Areas (SNASPE) and other areas with official protection
(Marine and Coastal Protected Areas) among others
• Sendero de Chile
• Water Bodies and hydrography
Ejemplo de cartografía turística aplicada. Example of applied tourist map.
53

SERVICIO NACIONAL DE TURISMO
SIG SERNATUR(Directorio Principal
del Sistema)
SUBDIRECTORIOS COMUNES
DOCUMENTOS(Subdirectorio con la documentación
generada para este estudio)
REGIÓN XX(13 subdirectorios con la información
a nivel regional)
SIMBOLOGÍA(Subdirectorio común
con los archivos de simbología del
Sistema)
CHILE(Subdirectorio
con la información a nivel nacional)
SENDERO CHILE(Subdirectorio
con coberturas de Sendero de Chile
de CONAMA)
ÁREAS(Subdirectorio con cobertura y tablas de Áreas Turísticas)
FICHAS(Subdirectorio con archivos de aplicaciones Arcview y Acces)
PRODUCTOS(Subdirectorio con cobertura de productos turísticos)
ATRACTIVOS(Subdirectorio con cobertura y tablas de Atractivos Turísticos)
FOTOS(Subdirectorio con archivos de imagen)
FRAGILIDAD(Subdirectorio con cobertura de fragilidad ambiental)
CIRCUITOS(Subdirectorio con cobertura y tablas de Circuitos Turísticos)
LOCALIDADES(Subdirectorio con cobertura de localidades)
PAISAJE(Subdirectorio con cobertura de unidades de paisaje)
ESTADÍSTICAS(Subdirectorio con cobertura y tablas de CONAF, INE, JAC)
MAPAS(Subdirectorio con archivos de cartografía digital)
SECTORES DE INVERSIÓN(Subdirectorio con cobertura de inversión turística)
PUERTAS DE SALIDA(Subdirectorio con cobertura y tablas de puertas de salida: aeropuertos, puertos, pasos fronterizos)
SERVICIOS DE TURISMO(Subdirectorio con cobertura y tablas de Servicios turísticos: alojamiento, alimentación, agencias, esparcimiento, transporte, capacidad instalada)
PROYECTOS(Subdirectorio con cobertura de proyectos de inversión)
• Proyectos de inversión• Zonas y centros de interés turístico nacional
De igual forma, y en el marco
del trabajo conjunto con otros
servicios e instituciones como el
INE, la Policía Internacional, la
Junta de Aeronáutica Civil, CONAF,
CONAMA y el MOP entre otros,
se han generado bases de datos
asociadas, compiladas e integradas
con información georreferenciada
y estadística.
Así se ha ido incorporando a
este SIG, entre otras, la siguiente
información georreferenciada:
• Comunas y localidades pobladas • Redes viales• Aeropuertos• Pasos fronterizos• Áreas protegidas (SNASPE) y otras áreas con protección oficial (áreas marinas y costeras protegidas) entre otras• Sendero de Chile• Cuerpos de agua e hidrografía
A general outline of the GIS
structure of SERNATUR is shown
as follows:
Counting on these various
bases and sites has allowed the
incorporation of the following
statistical and numerical
information represented as supply
and demand for tourism in order
to build various cartographic
representations.
TOURIST ATTRACTION
• Tourist accommodation
establishments
• Type of accommodation
• Room capacity per class
accommodation.
• Total capacity of bedroom
accommodation
• Capacity of beds per type of
accommodation
• Total capacity of camping sites.
• Total number of food services.
• Total number of travel agencies
TOURIST DEMAND
• Arrival of a passenger to
accommodation establishments
• Passenger spent nights in
accommodation establishments
• Visitors to protected wilderness
areas
• Tourists who enter for border
crossings
• Air transport of passengers by
airport
• Annual average daily traffic for
stations
54

En la página anterior se muestra un
esquema general de la estructura del SIG de
SERNATUR.
El contar con estas diversas bases y
polígonos ha permitido incorporarles la
siguiente información estadística y numérica
asociada, representada como oferta y
demanda turística a efectos de construir
diversas representaciones cartográficas.
OFERTA TURÍSTICA
• Establecimientos de alojamiento turístico• Tipo de alojamiento• Capacidad de habitaciones por clase de alojamiento• Capacidad total de camas de alojamiento• Capacidad de camas por clase de alojamiento• Capacidad total de sitios de camping• Cantidad total de servicios de alimentación• Cantidad total de agencias de viaje
DEMANDA TURÍSTICA
• Llegada de pasajeros a establecimientos de alojamiento• Pernoctaciones de pasajeros en establecimientos de alojamiento• Visitantes a áreas silvestres protegidas• Turistas ingresados por pasos fronterizos• Tráfico aéreo de pasajeros por aeropuertos • Tránsito medio diario anual por estaciones
PROCESAMIENTO YGENERACIÓN DEPRODUCTOS
En función de la información señalada
anteriormente y que se encuentra gran parte
en la cartografía básica, contrastada con
la “capas” de información sobre atractivos
turísticos, circuitos turísticos y proyectos
de inversión turísticos y utilizando las
herramientas propias de ArcView, se aplicó
una metodología para la definición de las
denominadas áreas turísticas prioritarias.
PROCESSINGAND PRODUCT GENERATION
Based on the above information, which is largely
found in the basic cartography, contrasted with the
“layers” of information on tourist attractions, tour
operators and tourism investment projects and using the
own tools of ArcView, it was applied a methodology to
the definition of the so-called high priority tourist area.
Complying with certain methodological requirements,
these areas consists of the overlapping of thematic and
base information, where GIS tools are analyzed, resulting
in an area with homogeneous characteristics.
The largest effort to register basic information was
concentrated in areas that are perceived as more favorable
in terms of its potential tourist and other conditions that
help to generate “poles of tourist attraction.”
Ejemplo de cartografía turística aplicada. Example of applied tourist map.
55
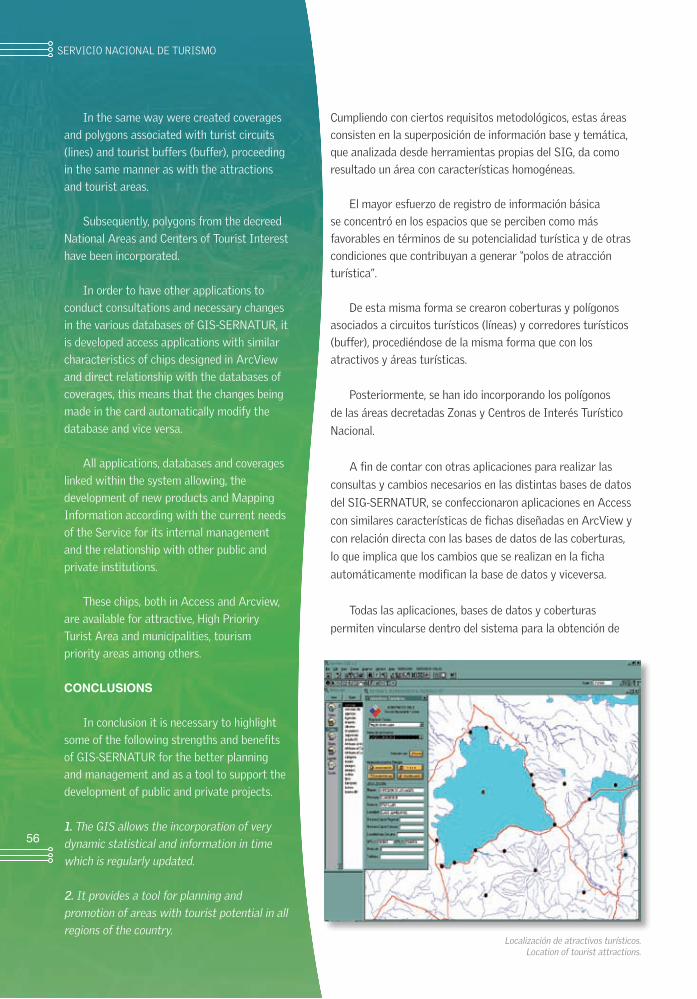
Cumpliendo con ciertos requisitos metodológicos, estas áreas
consisten en la superposición de información base y temática,
que analizada desde herramientas propias del SIG, da como
resultado un área con características homogéneas.
El mayor esfuerzo de registro de información básica
se concentró en los espacios que se perciben como más
favorables en términos de su potencialidad turística y de otras
condiciones que contribuyan a generar “polos de atracción
turística”.
De esta misma forma se crearon coberturas y polígonos
asociados a circuitos turísticos (líneas) y corredores turísticos
(buffer), procediéndose de la misma forma que con los
atractivos y áreas turísticas.
Posteriormente, se han ido incorporando los polígonos
de las áreas decretadas Zonas y Centros de Interés Turístico
Nacional.
A fin de contar con otras aplicaciones para realizar las
consultas y cambios necesarios en las distintas bases de datos
del SIG-SERNATUR, se confeccionaron aplicaciones en Access
con similares características de fichas diseñadas en ArcView y
con relación directa con las bases de datos de las coberturas,
lo que implica que los cambios que se realizan en la ficha
automáticamente modifican la base de datos y viceversa.
Todas las aplicaciones, bases de datos y coberturas
permiten vincularse dentro del sistema para la obtención de
In the same way were created coverages
and polygons associated with turist circuits
(lines) and tourist buffers (buffer), proceeding
in the same manner as with the attractions
and tourist areas.
Subsequently, polygons from the decreed
National Areas and Centers of Tourist Interest
have been incorporated.
In order to have other applications to
conduct consultations and necessary changes
in the various databases of GIS-SERNATUR, it
is developed access applications with similar
characteristics of chips designed in ArcView
and direct relationship with the databases of
coverages, this means that the changes being
made in the card automatically modify the
database and vice versa.
All applications, databases and coverages
linked within the system allowing, the
development of new products and Mapping
Information according with the current needs
of the Service for its internal management
and the relationship with other public and
private institutions.
These chips, both in Access and Arcview,
are available for attractive, High Prioriry
Turist Area and municipalities, tourism
priority areas among others.
CONCLUSIONS
In conclusion it is necessary to highlight
some of the following strengths and benefits
of GIS-SERNATUR for the better planning
and management and as a tool to support the
development of public and private projects.
1. The GIS allows the incorporation of very dynamic statistical and information in time which is regularly updated. 2. It provides a tool for planning and promotion of areas with tourist potential in all regions of the country.
Localización de atractivos turísticos.Location of tourist attractions.
SERVICIO NACIONAL DE TURISMO
56

nuevos productos e información
cartográfica acorde a las
necesidades actuales del Servicio
para su gestión interna y en su
relación con demás servicios e
instituciones públicas y privadas.
Estas fichas, tanto en Access
como ArcView, están disponibles
para áreas turísticas prioritarias,
atractivos y comunas, entre otros.
CONCLUSIONES
A modo de conclusión, es
necesario destacar algunas de las
siguientes fortalezas y beneficios
del SIG-SERNATUR para la mejor
planificación y gestión institucional
3. It complements databases available for both the website and for the same institutional SIG. 4. It exchanges information coverage with other public services. 5. It standardizes the methods of collecting and information classification within the service. 6. It provides background to guide the investment decisions of the private sector.
7. It provides mapping information and databases for the tourist information offices around the country. 8. It guides the management of the municipalities in their development initiatives of tourist attraction. 9. It has more accurate information to analyze the investment projects that enter into the System of Environmental Impact Evaluation.
y como una herramienta de
apoyo al desarrollo de proyectos
públicos y privados.
1. El SIG permite la incorporación
de información y estadística muy
dinámica en el tiempo con lo cual
se va regularmente actualizando.
2. Permite disponer de una
herramienta para la planificación
y promoción de zonas que cuentan
con potencial turístico en todas las
regiones del país.
3. Complementar bases de datos
disponibles tanto para la página
web institucional como para este
mismo SIG.
4. Intercambiar coberturas de
información con otros servicios
públicos.
5. Homologar los métodos de
recopilación y clasificación de
información al interior del servicio.
6. Disponer de antecedentes para
orientar decisiones de inversión del
sector privado.
7. Proporcionar información
cartográfica y bases de datos
para las oficinas de información
turística de todo el país.
8. Orientar la gestión de los
municipios en sus iniciativas de
desarrollo de la oferta turística.
9. Disponer de mayor precisión
para analizar los proyectos de
inversión que ingresan al Sistema
de Evaluación de Impacto
Ambiental.
Ficha de Atractivos turísticos.
Tourist Attractions Sheet.
57

Sin duda, existe una visión crítica de nuestra ciudad,
que pasa por los altos niveles de contaminación ambiental y
acústica, la mala calidad del transporte, la escasez de espacios
verdes y sobretodo de espacios públicos para caminar,
descansar, conversar, en definitiva, lugares para estar y
disfrutar de la ciudad. Por otro lado, los ciudadanos son cada
vez más conscientes de los cambios que están ocurriendo hoy en
Santiago, con escasa participación ciudadana y valoración por el
patrimonio humano, social y arquitectónico.
Si consideramos que estos cambios no sólo transforman
la ciudad en términos físicos, sino que también en términos
sociales, en la forma cómo nos movemos, relacionamos y
ocupamos la ciudad, nos damos cuenta de la importancia de
incorporar la opinión de las personas en la planificación urbana,
especialmente en el diseño de nuestros espacios públicos, así
lo señala el urbanista catalán Jordi Borja (2003), “el espacio
público define la calidad de la ciudad, porque indica la calidad de
vida de la gente y la calidad de la ciudadanía de sus habitantes”.
Cuando mapeamos nuestro espacio vital, estamos también mapeando nuestros deseos, sueños, compromisos. Por esto un mapa verde es una potente herramienta de cambio.
Loreto Rojas SymmesUrbanista. Encargada de ContenidosMapa Verde Santiago.Town planner. Content responsibleof Santiago Green Map.
Primer Mapa Verde de Santiago impulsado por Ciudad Viva
Una experiencia de mapeo participativo
Without doubt, there is a critical vision of our city, the high
levels of environmental pollution and noise, poor quality of
transport, shortage of green space and public spaces especially
for walking, relaxing, talking, in short, places to be and enjoy
the city. On the other hand, people are increasingly aware of
the changes that are happening today in Santiago, with little
public participation and appreciation for the human, social and
architectural heritage.
If you believe that these changes will not only transform
the city into physical but also in social terms, in the way we
move, interact and occupy the city, we realize the importance of
incorporating people’s views in planning urban places, especially
in the design of our public spaces, since our town planner Mr
Catalan Jordi Borja (2003) stated that a “public space defines
An experience of participatory mappingSantiago First Green Map promoted by Ciudad Viva (Living City)
When mapping our living space, we are charting our desires, dreams, commitments. For this a green map is a powerful tool for change.
CIUDAD VIVA
58
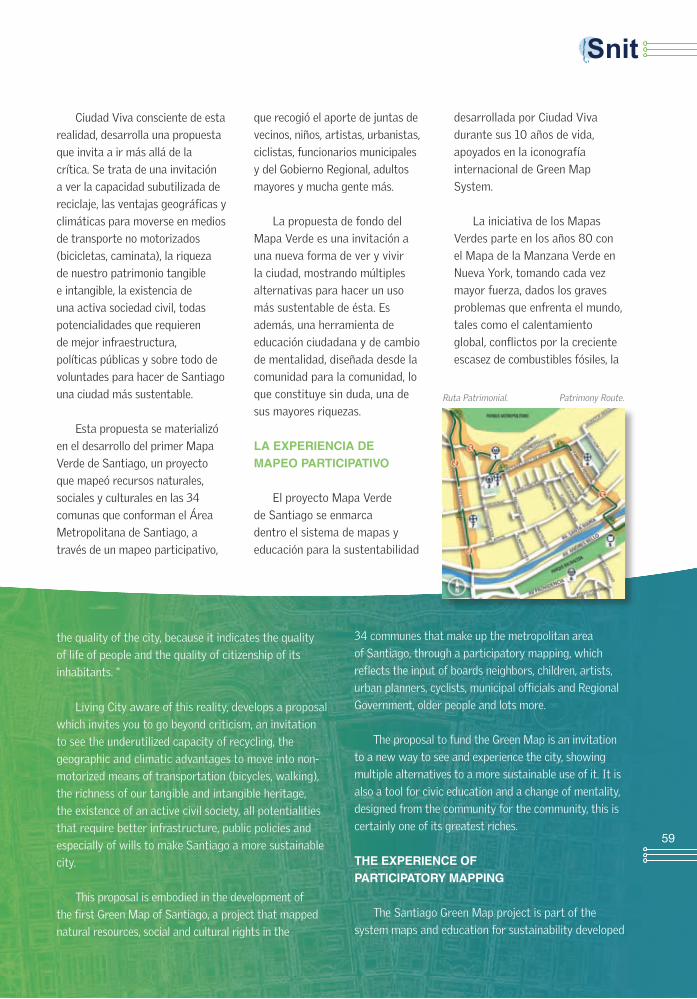
Ciudad Viva consciente de esta
realidad, desarrolla una propuesta
que invita a ir más allá de la
crítica. Se trata de una invitación
a ver la capacidad subutilizada de
reciclaje, las ventajas geográficas y
climáticas para moverse en medios
de transporte no motorizados
(bicicletas, caminata), la riqueza
de nuestro patrimonio tangible
e intangible, la existencia de
una activa sociedad civil, todas
potencialidades que requieren
de mejor infraestructura,
políticas públicas y sobre todo de
voluntades para hacer de Santiago
una ciudad más sustentable.
Esta propuesta se materializó
en el desarrollo del primer Mapa
Verde de Santiago, un proyecto
que mapeó recursos naturales,
sociales y culturales en las 34
comunas que conforman el Área
Metropolitana de Santiago, a
través de un mapeo participativo,
que recogió el aporte de juntas de
vecinos, niños, artistas, urbanistas,
ciclistas, funcionarios municipales
y del Gobierno Regional, adultos
mayores y mucha gente más.
La propuesta de fondo del
Mapa Verde es una invitación a
una nueva forma de ver y vivir
la ciudad, mostrando múltiples
alternativas para hacer un uso
más sustentable de ésta. Es
además, una herramienta de
educación ciudadana y de cambio
de mentalidad, diseñada desde la
comunidad para la comunidad, lo
que constituye sin duda, una de
sus mayores riquezas.
LA EXPERIENCIA DEMAPEO PARTICIPATIVO
El proyecto Mapa Verde
de Santiago se enmarca
dentro el sistema de mapas y
educación para la sustentabilidad
desarrollada por Ciudad Viva
durante sus 10 años de vida,
apoyados en la iconografía
internacional de Green Map
System.
La iniciativa de los Mapas
Verdes parte en los años 80 con
el Mapa de la Manzana Verde en
Nueva York, tomando cada vez
mayor fuerza, dados los graves
problemas que enfrenta el mundo,
tales como el calentamiento
global, conflictos por la creciente
escasez de combustibles fósiles, la
the quality of the city, because it indicates the quality
of life of people and the quality of citizenship of its
inhabitants. “
Living City aware of this reality, develops a proposal
which invites you to go beyond criticism, an invitation
to see the underutilized capacity of recycling, the
geographic and climatic advantages to move into non-
motorized means of transportation (bicycles, walking),
the richness of our tangible and intangible heritage,
the existence of an active civil society, all potentialities
that require better infrastructure, public policies and
especially of wills to make Santiago a more sustainable
city.
This proposal is embodied in the development of
the first Green Map of Santiago, a project that mapped
natural resources, social and cultural rights in the
34 communes that make up the metropolitan area
of Santiago, through a participatory mapping, which
reflects the input of boards neighbors, children, artists,
urban planners, cyclists, municipal officials and Regional
Government, older people and lots more.
The proposal to fund the Green Map is an invitation
to a new way to see and experience the city, showing
multiple alternatives to a more sustainable use of it. It is
also a tool for civic education and a change of mentality,
designed from the community for the community, this is
certainly one of its greatest riches.
THE EXPERIENCE OFPARTICIPATORY MAPPING
The Santiago Green Map project is part of the
system maps and education for sustainability developed
Ruta Patrimonial. Patrimony Route.
59
inseguridad, inequidad, etc. Es así como desde 1995 a
la fecha se han publicado más de 300 mapas verdes
en 51 países.
Las primeras experiencias de mapas verdes
desarrolladas por Ciudad Viva comienzan en el año
2006, con el mapeo verde de la Chimba, Santiago
Centro y Ñuñoa. Estos trabajos fueron la base para
que Ciudad Viva desarrollara el Primer Mapa Verde
de Santiago, a través de una metodología flexible y
participativa durante el año 2007.
El resultado de esta experiencia se plasma en
un conjunto de 10 mapas y un libro. Se agrega a ello
un conocimiento práctico expresado en talleres de
distinta índole, orientados al fomento de un uso más
sustentable de la ciudad.
Este mapeo se basa en los cuatro ejes de trabajo
de Ciudad Viva: Transporte Activo, Vida Verde,
Cultura y Patrimonio; y Sociedad Civil. Es, además,
una propuesta que tuvo por objetivo la inclusividad
y representatividad, desarrollando un mapa a escala
metropolitana, siendo hoy el mapa más grande de
la red internacional Green Map. Este sentido se
plasma además en la decisión de caracterizar al
mapa como versión cero, entendiendo que si bien fue
fruto de una construcción colectiva –donde cientos
de personas aportaron sus ideas, propuestas y
críticas–, falta incorporar la opinión de otras muchas
más. Por ello, la siguiente versión del Mapa Verde
contempla ampliar la participación, haciendo de éste
un proyecto más cercano, que incremente los grados
de identidad y apropiación de espacios y lugares de
la ciudad, ya que como señala el antropólogo Marc
Augé (1992), “…un espacio que no puede definirse
ni como espacio de identidad ni como relacional ni
como histórico, definirá un no lugar”.
A través de los temas mapeados, se invita a
contemplar aspectos de la ciudad que muchas
veces no vemos. En esta perspectiva, el Mapa
Verde es además una propuesta, una nueva lectura
de la ciudad, una mirada diferente al transporte,
al patrimonio y a la comunidad. Así por ejemplo,
en el apartado de Cultura y Patrimonio podemos
encontrar las ferias y mercados libres, lugares que
nos muestran la importancia de nuestro patrimonio
by Living City during its 10 years of life, supported
in the iconography in the international Green Map
System.
The initiative of the Green party maps in the 80s
with the Green Apple Map of New York, is taking
greater force, considering the serious problems which
faces the world, such as global warming, conflicts over
the growing shortage of fuel Fossil, insecurity, inequity,
and so on. That is how from 1995 over 300 green
maps in 51 countries have been published.
The first experiments of green maps developed by
the Living City started in 2006, with the mapping of
the green Chimba, Santiago and Ñuñoa Center. These
papers were the basis for the development of the first
Green Map of Santiago city, through a flexible and
participatory methodology in 2007.
The result of this experience is reflected in a set
of 10 maps and a book. Besides, a working knowledge
expressed in various kinds of workshops, aimed at
promoting a more sustainable city.
This mapping is based on the four main directions
of Living City: Active Transport, Green Life, Culture
and Heritage, and Civil Society. It is also a proposal
that aimed to inclusiveness and representativeness,
developing a metropolitan scale map, map being
today the largest international network of the Green
Map. This sense is reflected in the decision to further
characterize the map as a zero version, meaning that
while it was the fruit of a collective construction,
where hundreds of individuals contributed with
their ideas, suggestions and criticisms,it needs the
incorporation of the views of many more. Therefore,
the next version of the Green Map will provide the
broadening participation, making it a project which
will increase the degrees of identity and ownership
of spaces and places in the city since, as noted by the
anthropologist Marc Augé (1992) “... A space that can
not be defined either as space or as relational identity
nor as historical one ,will define the concept of a no
place.”
Through the themes mapped, we are invited to
consider aspects of the city that often we do not see.
In this perspective, the Green Map is also a proposal, a
CIUDAD VIVA
60

intangible y que, como señala la urbanista María Elena Ducci (2007), “…forman parte del imaginario de los habitantes de una ciudad, que lo percibe como un lugar de vitalidad, alegría, bullicio, olores y colores”.
El apartado de Transporte Activo es una abierta invitación a moverse de otra manera, a privilegiar modos de transporte más sustentables, a través de un mapeo participativo de sendas peatonales interesantes, rutas para andar en bicicleta y recorridos –a pie o en bicicleta– por los barrios patrimoniales más emblemáticos de nuestra ciudad. La propuesta de fondo, como señala la urbanista y presidenta de Ciudad Viva Lake Sagaris (2007), es “construir la ciudad para los adultos mayores, para los niños en triciclo, para las niñas que quieren caminar, los que andan en silla de ruedas, las ciclistas y los ciclistas urbanos, en fin, todos y todas de verdad.”
En la sección de Vida Verde, además de los puntos de reciclaje y parques, se desarrolló un mapeo participativo de los lugares de inspiración y encuentro, ejercicio que nos permitió levantar valiosa información de plazas, barrios, fuentes de agua, calles, en fin, lugares que nos muestran la cara amable y acogedora de nuestra ciudad.
El Mapa Verde de Santiago innovó, además, incorporando un catastro de organizaciones de la sociedad civil en cuatro áreas: Mujer, Desarrollo Social y Comunitario, Educación y Cultura, y Medio Ambiente. Esta iniciativa nos permite abrir los ojos y ver la cantidad de gente que se ha agrupado para enfrentar algún tema, algún problema, alguna molestia que los ha dejado desconformes.
Como complemento del mapeo colectivo, durante el año 2007 se desarrollaron dos talleres: “La Ciudad de la Imaginación” y “La Ciudad de la Memoria”. En el primero, un grupo de niños creó un mapa de su ciudad ideal y, en el segundo, adultos mayores construyeron un mapa del recuerdo. Ambas experiencias fueron un importante aporte para el Mapa Verde, un puente necesario entre la ciudad del pasado y la ciudad que queremos construir en el futuro.
Por las características del proceso y del producto final, un Mapa Verde es una experiencia única
new reading of the city, a glance at different transport,
heritage and the community. For example, under the
heading of Culture and Heritage we can find fairs and
free markets, places that show us the importance of
our intangible heritage, and as the town planner Maria
Elena Ducci (2007) states “... are part of the imaginary
inhabitants of a city, which perceives this as a place of
vitality, joy, noise, smells and colors. “
The section on Active Transport, is an open
invitation to move in another way, to focus on
more sustainable modes of transport, through a
participatory mapping of pedestrian paths interesting
routes for walking and cycling tours, on foot or by
bicycle, by the neighborhoods most symbolic heritage
of our city. The proposed fund, as the planner and
president of Living City, Mss. Lake Sagaris (2007),
said is “to build the city for the elderly, for children on
a tricycle, for girls who want to walk, those who walk
in a wheelchair, the urban cyclists and cyclists in short
all really“.
The section of Green Living, in addition to
the points of recycling and parks, developed a
participatory mapping of places of inspiration and
encounter, an exercise that allowed us to raise valuable
information for places, neighborhoods, water, streets,
in short, sites that show us the warm and friendly face
of our city.
The Green Map of Santiago further innovates,
incorporating a land of civil society organizations
in four areas: Women, Social and Community
Development, Education and Culture and
Environmental affairs. This initiative enables us to
open our eyes and see how many people have banded
together to confront any issue, any problem, and any
unhappy inconvenience.
Complementing the collective mapping in 2007,
two workshops were carried out: “The City of
Imagination” and “The City of Memory.” In the first,
a group of children created a map of their ideal city,
and in the second, older adults constructed a map of
remembrance. Both experiences were an important
contribution to the Green Map, a necessary bridge
between the city’s past and the city that we want to
build in the future.
61
entendiendo, como señala Jordi Borja (2003), que la
ciudad “es un complejo proceso en transformación
permanente que exige a los ciudadanos que cambien, se
adapten, tomen decisiones, sean competitivos, generen
oportunidades y no pierdan posiciones, sino que las
ganen”.
Este mapeo colectivo, además, nos hace conscientes de las fortalezas y debilidades de nuestra ciudad. En el caso del Mapa Verde de Santiago, “el proceso de mapear nuestra ciudad nos reveló sus tremendos recursos en cuanto a construir sustentabilidad, pero también expuso a la vista las tremendas injusticias territoriales. Los bienes de nuestra sociedad -la cultura, el patrimonio, los parques, incluso los centros de acopio para el reciclaje- no están distribuidos equitativamente a través de todo el territorio metropolitano” (Mapa Verde de Santiago).
Otro de los efectos del Mapa Verde es la oportunidad de difundir iniciativas exitosas hacia más comunidades, mostrando proyectos, experiencias y acciones sustentables de uso de la ciudad. En este sentido, el mapa se concibe como una herramienta de educación ciudadana, masiva y cercana a la gente.
Because of the characteristics of the process
and the finished product, a green map is a unique
experience for each country or city that is developed,
which reflects the peculiarities of each area, its
opportunities, to achieve goals and dreams.
BENEFITS OFPARTICIPATORY MAPPING
Beyond the benefits that means developing a
Green Map for a city, it is important to note that both
the process and the outcome of the mapping group,
have tangible effects for communities that are part
of it .
One of these effects is to involve communities
in a collective project, increasing participation,
encouraging a more active citizenship, and valuing
the knowledge that they possess , the people in its
district, commune and city. By involving communities
in urban processes, we are also providing incentives
for people to seize the city, engage in collaborative
actions, maintenance and care of their common areas.
But at the same time we understand as noted by
Jordi Borja (2003) that the city “is a complex process
that requires ongoing transformation of citizens to
change, adapt, make decisions, be competitive, create
opportunities and not to lose positions, but winning
them. “
This mapping group also makes us aware of the
strengths and weaknesses of our city. In the case of
the Green Map of Santiago, “the process of mapping
our city unveiled its tremendous resources in terms of
building sustainability, but also showed the tremendous
territorial injustices. The assets of our society, culture,
heritage, parks, including the collection centers for
recycling, are not distributed equitably throughout the
metropolitan territory “ (Green Map of Santiago).
Another of the effects of the Green Map is an
opportunity to disseminate successful initiatives to more
communities, showing projects, experiences and actions
for sustainable use of the city. In this sense, the map is
CIUDAD VIVA
para cada país o ciudad que lo desarrolla, ya que
refleja las particularidades de cada territorio, sus
oportunidades, metas y sueños por alcanzar.
BENEFICIOS DEL MAPEO PARTICIPATIVO
Más allá de los beneficios que significa el
desarrollo de un Mapa Verde para una ciudad, es
importante destacar que tanto el proceso como
el resultado del mapeo colectivo tienen efectos
tangibles para las comunidades que son parte de él.
Uno de estos efectos es hacer partícipes a las
comunidades de un proyecto colectivo, aumentando
la participación, incentivando una ciudadanía más
activa, y valorando el conocimiento que poseen
las personas de su barrio, comuna y ciudad. Al
hacer partícipes a las comunidades en los procesos
urbanos, estamos también incentivando que las
personas se apropien de la ciudad, se comprometan
en acciones de colaboración, mantención y cuidado
de sus espacios comunes. Pero a la vez estamos
62

Es importante señalar también, que un Mapa Verde y específicamente un mapeo colectivo, puede llegar a ser un importante instrumento en los procesos de participación ciudadana, disminuyendo las barreras del lenguaje técnico entre planificadores y comunidades, a través de un lenguaje común y sencillo. Esto significa poner la planimetría al servicio de la comunidad, tanto para recibir como para entregar información en forma sencilla y directa. Junto con ello, el mapeo colectivo puede llegar a ser una importante herramienta para conocer percepciones, críticas, demandas y propuestas de las comunidades, siendo esto especialmente importante cuando se abre la interrogante acerca de qué ciudad queremos.
Finalmente, como se expresa en la presentación del Mapa Verde de Santiago, “Nuestra ciudad es la imagen de lo que somos y todos tenemos la capacidad de transformarla”.
conceived as a tool of citizenship education, massive
and close to the people.
It is important to note also that a Green Map
and specifically a mapping group, can become
an important tool in the processes of public
participation, lowering the barriers of technical
language between planners and the communities,
through a common and simple language. This means
putting the planimetry community service, both to
receive and deliver information in a simple and direct
way. Along with this, the mapping group may become
an important tool to know perceptions, criticism,
complaints and suggestions from the communities,
this being especially important when you open the
question about what city we want.
Finally, as stated in the presentation of the Green
Map of Santiago “Our city is the image of who we are
and we all have the ability to transform it.”
Ciudad Viva nació en el año 1998 como una coalición de 25 organizaciones comunitarias, profundamente preocupadas ante el proyecto de la Autopista Costanera Norte, localizada en la ribera norte del río Mapocho, en Santiago de Chile.
Las comunidades lograron salvar sus barrios de este megaproyecto urbano y ese proceso de organización y vocerío ciudadano colectivo resultó ser una experiencia rica en capacitación y aprendizaje en temas de transporte sustentable, patrimonio, reciclaje, derechos civiles y participación ciudadana.
Hoy Ciudad Viva es una organización comunitaria de base, que promueve iniciativas de urbanismo ciudadano para construir una ciudad más sustentable, en el sentido de ser más justa, más amable (segura) y más verde.
CIUDAD VIVALiving City was born in the year 1998 as a
coalition of 25 community organizations, deeply concerned about the proposed North Coast Highway, located on the riverfront north of the Mapocho River in Santiago, Chile.
The communities were able to save their neighborhoods from this mega city and the process of organizing citizens proved to be a rich experience in training and learning on issues of sustainable transport, property, recycling, civil rights and civic participation.
Today Living City is a community-based organization that promotes urban citizen initiatives to build a more sustainable city, in the sense of being more just, more friendly (safe) and more green.
LIVING CITY
Referencias
Augé, Marc (1992) Los no Lugares. Espacios de anonimato. Gedisa Editorial.Borja, Jordi (1993) La Ciudad Conquistada. Alianza Editorial. Madrid.Borja, Jordi (1993) El Espacio Público: Ciudad y Ciudadanía. Electra. España.Ciudad Viva (2008). Mapa Verde Santiago.Ducci, María Elena, La Vega Central. En Guía de Patrimonioy Cultura de la Chimba (2007). Santiago de Chile.
References Augé, Marc (1992) Non-Places. Spaces of anonymity. Gedisa.Editorial Borja, Jordi (1993) The Conquered City. Alianza Editorial. Madrid. Borja, Jordi (1993) The Public Space: City and Citizenship. Electra. Spain. Viva City (2008). Green Map of Santiago. Ducci, Maria Elena, La Vega Central. In Guide Heritageand Culture of Chimba (2007). Santiago de Chile.
63

Javier Hurtado C.Gerente de EstudiosCámara Chilena de la ConstrucciónManaging Director of Studies Chilean Chamber of Construction
La información territorial y
su importancia para la gestión
privada y las decisiones de
inversión lo abordamos en base a
tres interrogantes: cuáles son las
necesidades del sector privado para
tomar sus decisiones de inversión; qué
necesidades de información territorial
hemos detectado en el sector de la
construcción, y por último, a qué
deberíamos aspirar como país en
cuanto a información territorial.
NECESIDADES DEL SECTOREN LA TOMA DE DECISIONES
Para tomar sus decisiones de
inversión, el sector privado requiere
básicamente reglas del juego claras
y estables, además de acceso a
Cámara Chilena de la Construcción
Uso eficiente de los datos geoespaciales en la gestión privada y decisión de inversión
We focused on the land information
and its importance to private
management and investment decisions
based on three questions: what are the
needs of the private sector to make
their investment decisions?, what
territorial information have we found
in the construction sector? and finally,
what should we expect as a country in
terms of land information?.
THE NEEDS OF THE SECTORIN DECISION-MAKING
To make their investment decisions,
the private sector requires basically
clear and stable rules of the game and
We need to measure objectively and with transparency impacts of development in the territory and simulations for a reversal with all the information about costs and benefits of the projects thus minimizing the risks
Chilean Chamber of Construction
Efficient use of geospatial data in the private management and investment decision
CÁMARA CHILENA DE LA CONSTRUCCIÓN
Necesitamos medir objetivamente y con transparencia los impactos del desarrollo en el territorio y simularlos para que se invierta con toda la información de costos y beneficios que tendrán los proyectos, minimizando así los riesgos.
64

información de mercado. Estas reglas del juego las
establece el sector público a través de la planificación
del territorio y de la definición de políticas públicas.
Como sector privado, lo que necesitamos es que
el sector público tome las decisiones sobre estas
materias con base en información territorial
actualizada, oportuna y transparente.
Sin embargo, estamos rodeados de ejemplos
donde el sector público tomas sus decisiones sin la
suficiente información, con información inadecuada
o bien tiene información pero no la comparte con la
sociedad y de esta forma la sociedad no puede ser
una buena contraparte para aportar en el debate de
las políticas públicas.
El Transantiago es un claro ejemplo sobre
cómo un enfoque excesivamente tecnocrático y
especializado, desestimando información realista de
la vida urbana que comprende muchas otras variables
además del transporte, ha generado soluciones con
altos costos económicos, sociales y ambientales que
empeoró las condiciones de vida en la ciudad y que
amenaza ser irreparable. Lo anterior ha resultado
agravado por los déficit de transparencia en la
generación y evaluación de soluciones.
La modificación del Plan Regulador
Metropolitano de Santiago es otro caso
ejemplarizador. Esta modificación, actualmente
en etapa de elaboración, propone ampliar el límite
urbano en alrededor de 9 mil hectáreas en un
esquema de condiciones (pago por impacto). Para
justificar esta modificación, entre otros aspectos,
el Ministerio de Vivienda y Urbanismo ha señalado
que no hay suficiente suelo disponible en la ciudad
de Santiago. Dice que quedarían cerca de 7 mil
hectáreas al 2007, lo que no es mucho, ya que señala
que el consumo anual de suelo es de cerca de mil
hectáreas. Sobre estas cifras han surgido muchas
voces críticas, cuestionando lo señalado por el
ministerio. ¿Por qué tenemos que centrar la discusión
en este tema? Podríamos transparentar fácilmente
el cálculo de esta cifra mostrando por ejemplo una
fotografía aérea actual en la que podamos ver cuál es
la realidad y dedicarnos a discutir el tema de fondo
que no es otro que cómo lograr un crecimiento de la
ciudad de manera sustentable.
access to market information. These rules are
established by the public sector through the
planning of the territory and the definition of
public policies. As a private sector, we need
the public sector to take decisions on these
matters based on territorial updated, timely
and transparent information .
However, we are surrounded by
examples where the public sector takes its
decisions without sufficient information,
with inadequate data or maybe they have
the information which is not shared with the
society and thus the society can not be a good
partner to bring in the discussion of the public
policy.
The Transantiago is a clear example of
how an overly and specialized technocratic
approach , rejecting realistic information of
urban life which includes many other variables
in addition to transport, has generated
solutions with high economic costs, social and
environmental concerns that worsened the
living conditions in the city and threatens to
be irreparable. This has turned out into worse
deficits of transparency in the generation and
evaluation of solutions. The modification of
the Metropolitan Regulator Plan of Santiago
is another exemplary case. This amendment,
now in design stage, proposes to extend the
limit in urban areas to 9 thousand hectares
approximately, in a pattern of conditions
(pay-per-impact). To justify this change,
among other things, the Ministry of Housing
and Urban Development has stated that
there is not enough land available in the city
of Santiago. He says it would be about 7
hectares by 2007 which is not much, because
it indicates that the annual consumption
of soil is about a thousand hectares. These
figures have emerged on many critical voices,
questioning the point made by the ministry.
Why do we need to focus the discussion
on this subject?. Can we not readily make
transparent the calculation of this figure?
To show as an example, a current aerial
photograph in which we can see what the
65

Otro ejemplo es la reciente Ley de Rentas
Municipales, que establece una sobretasa de 100%
a los sitios no edificados (eriazos). ¿Pero sabemos
cuántos sitios eriazos existen en las ciudades
chilenas? Seguramente el Servicio de Impuestos
Internos conoce esta información pero la maneja
con un alto grado de confidencialidad. A nuestro
juicio, la falta de apertura de esta información nos
impide analizar temas de fondo, como el efecto que
tendrá una política de este tipo en la sociedad o las
razones de la desocupación de esas propiedades.
¿Será un afán especulativo de sus propietarios, o
bien hay ciertos factores externos que desincentivan
el desarrollo de estos terrenos? Más aún, ¿es
natural que en las dinámicas de las ciudades existan
terrenos sin construir? Son preguntas que no se
han debatido con la información sobre la mesa.
Como Cámara Chilena de la Construcción (CChC)
hemos realizado algunas investigaciones y hemos
comprobado, por ejemplo, que un factor que incide
fuertemente en que un sitio se mantenga eriazo
es la normativa urbana que establece fajas de
expropiación en dichos predios. Además, hemos
revisado algunos estudios internacionales que
entregan evidencia sobre la existencia de una tasa
natural de sitios eriazos. Por ejemplo, un estudio
realizado para 70 ciudades de Estados Unidos
indica que en promedio un 15,4% del total de la
ciudad está sin construir. Otro estudio que analiza
9 ciudades latinoamericanas informa que el terreno
vacante varía entre un 5% y un 44% de la superficie
de la ciudad. En el caso de Santiago este estudio
entrega una cifra de 11,4%.
Dentro de estos casos podemos mencionar
también las políticas de enajenación del suelo fiscal
del Ministerio de Bienes Nacionales. Como sector
privado no conocemos cuánto de nuestro territorio
nacional pertenece al fisco, y por lo tanto, poco
podemos aportar en el debate de los efectos de
las políticas de enajenación de este ministerio.
¿Conviene facilitar el traspaso de suelo fiscal a
manos públicas con un sistema de subastas, por
ejemplo?, o ¿se justifica que este suelo se mantenga
en manos públicas? ¿Qué efectos económicos tiene
una política de este tipo? Es difícil discutirlo si
desconocemos el catastro de suelo fiscal a lo largo
del país.
reality is and to discuss the issue deeply, in
other words, how to achieve a growth of
cities in a sustainable manner.
Another example is the recent Municipal
Income Law, which establishes a rate
of about 100% at sites which are not
built (without building). But do we know
how many vacant sites are there in
the Chilean cities?. Surely the Internal
Revenue Service know this information
but they handle it with a high degree
of confidentiality. Due to the lack of
openness of this information ,in our
view, we can not discuss substantive
issues, such as the impact of such a
policy in the company or the reasons for
the unemployment of those properties.
Will it be a speculative effort from its
owners, or are there external factors
that discourage the development of these
lands?. Moreover, is it natural , in the
dynamics of the cities , the existance of
unbuilt land?. These are questions that
have not been discussed with information
on the table. As the Chilean Chamber
of Construction (CChC)we have done
some research and found for instance
that a heavily factor in a site that is
maintained unbuilt is the legislation that
establishes urban bands of expropriation
in those sites. We have also revised
some international studies that provide
evidence about the existence of a natural
rate of unbuilt sites. For example, a
study conducted for 70 U.S. cities shows
that on average 15.4% of the city was
not built. Another study that analyzed
9 Latin American cities reported that
the vacant land varies between 5% and
44% of the area of the city. In the case
of Santiago this study gives a figure of
11.4%.
Within these cases we can also mention
the political alienation of land tax from the
Ministry of National Assets. As a private
sector we do not know how much of our
CÁMARA CHILENA DE LA CONSTRUCCIÓN
66

Los ejemplos anteriores dan
cuenta de importantes deficiencias
en nuestro sistema de acceso a
la información para el sustento y
debate de las políticas públicas. Un
mejor país requiere que avancemos
en esta materia.
La información permite
al sector privado conocer las
necesidades de las personas y
anticipar dinámicas urbanas en
el territorio. También permite
que los mercados sean más
competitivos, con lo cual gana el
consumidor final. Por último, la
información abierta y transparente
disminuye la necesidad de arbitraje
mejorando la rentabilidad social de
los proyectos.
NECESIDADES DEINFORMACIÓN TERRITORIAL EN LA CONSTRUCCIÓN
En el ámbito del sector
construcción, la CChC ha
detectado diversas necesidades
de información y en alguna
national territory belongs to the Treasury, and therefore
can provide little information in the discussion of the
effects of policies for disposal of this ministry. Should
we facilitate the transfer of land to public ownership
tax with a system of auctions, for example, or do you
justify that this soil is kept in public hands?. What
economic impact has such a policy?. It is difficult to
discuss it if we do not know the land tax throughout
the country.
The above examples are evidence of significant
deficiencies in our system of access to information for
the livelihoods and discussion of the public policy. A
better country requires that we make progress in this
area.
The information allows the private sector meet
the needs of the people and anticipate the urban
dynamics in the territory. It also allows the
markets become more competitive, helping the
final consumer. Finally, the open and transparent
information reduces the need for arbitration
improving the social profitability of projects.
LAND INFORMATIONNEEDS IN THE CONSTRUCTION AREA
In the construction sector, the CChC has
identified various needs for information and some
of these areas have been able to generate and
process this information. Some examples are
Fuente: Cámara Chilena de la Construcción.
Fig. 1
2.980.000 m2
1.325.000 m2
34.000 unids.
15.000 unids.
Source: Chilean Chamber of Construction.
67
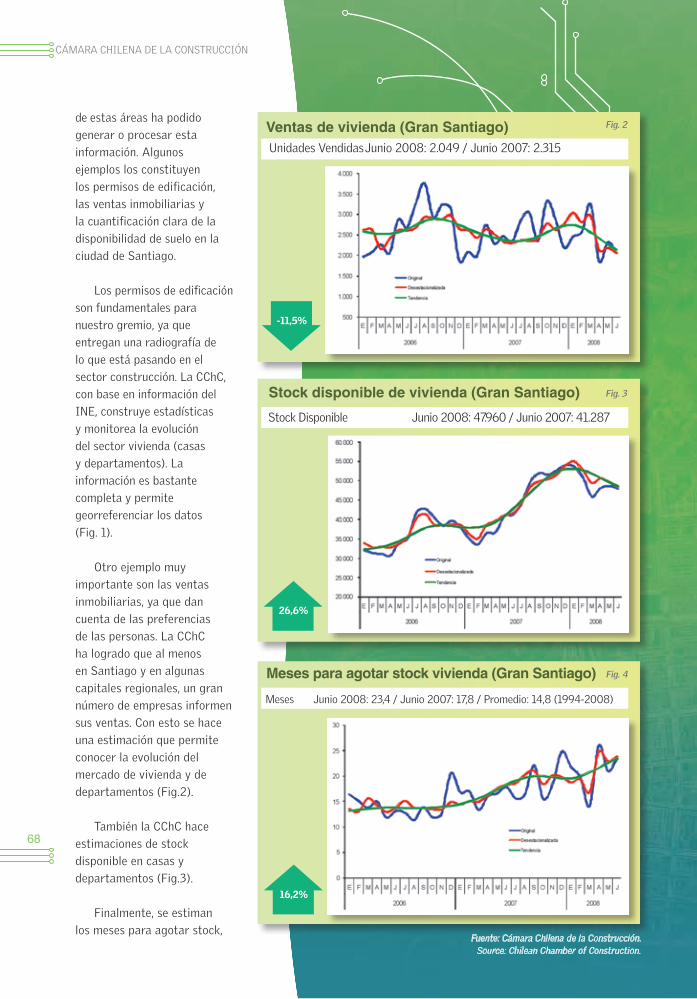
de estas áreas ha podido
generar o procesar esta
información. Algunos
ejemplos los constituyen
los permisos de edificación,
las ventas inmobiliarias y
la cuantificación clara de la
disponibilidad de suelo en la
ciudad de Santiago.
Los permisos de edificación
son fundamentales para
nuestro gremio, ya que
entregan una radiografía de
lo que está pasando en el
sector construcción. La CChC,
con base en información del
INE, construye estadísticas
y monitorea la evolución
del sector vivienda (casas
y departamentos). La
información es bastante
completa y permite
georreferenciar los datos
(Fig. 1).
Otro ejemplo muy
importante son las ventas
inmobiliarias, ya que dan
cuenta de las preferencias
de las personas. La CChC
ha logrado que al menos
en Santiago y en algunas
capitales regionales, un gran
número de empresas informen
sus ventas. Con esto se hace
una estimación que permite
conocer la evolución del
mercado de vivienda y de
departamentos (Fig.2).
También la CChC hace
estimaciones de stock
disponible en casas y
departamentos (Fig.3).
Finalmente, se estiman
los meses para agotar stock,
Stock disponible de vivienda (Gran Santiago)
26,6%
Stock Disponible Junio 2008: 47.960 / Junio 2007: 41.287
Ventas de vivienda (Gran Santiago)
-11,5%
Unidades Vendidas Junio 2008: 2.049 / Junio 2007: 2.315
Meses para agotar stock vivienda (Gran Santiago)
16,2%
Meses Junio 2008: 23,4 / Junio 2007: 17,8 / Promedio: 14,8 (1994-2008)
Fuente: Cámara Chilena de la Construcción.
Fig. 2
Fig. 3
Fig. 4
CÁMARA CHILENA DE LA CONSTRUCCIÓN
Source: Chilean Chamber of Construction.
68

the building permits, real estate sales and clear
quantification of the availability of land in the city of
Santiago.
The building permits are critical to our guild since
they deliver a picture of what is happening in the
construction sector. The CChC, based on information
from the INE statistics builds and monitors the
developments in the housing sector (houses and
apartments). The information is fairly complete and
allows georeferenced data.
Another very important example is the real
estate sales, since they account for the preferences
of individuals. The CChC has succeeded at least
in Santiago and in some regional capitals, a large
number of companies reporting their sales. This is
an estimate that studies the evolution of the housing
market and departments (Fig.2).
CChC also estimates the available stock of
houses and apartments (fig.3).
Finally, we believe the months to exhaust
stock, with very valuable information when making
investment decisions. Again, the databases would
show easily georeferenced information (Fig.4).
In the context of the amendment to the
Metropolitan Plan of Santiago, and starting
from the fact that it was not known a clear
quantification of the availability of land in the
city of Santiago, the CChC asked the Catholic
University to make the quantification of the
availability of land, using an aerial photograph of
Air Service Photogrammetric in the year 2007.
The most recent photograph was taken in 2006
and it was used later, with the results shown in
the chart 1.
Suelo Urbano disponible en el Gran Santiago(Foto Aérea Febrero de 2006)
Peñalolén
Quilicura
Las CondesMacul
Huechuraba
Lo Barnechea
Vitacura
La Reina
San Bernardo
Puente AltoRenca
Pudahuel
La PintanaMaipú
Cerrillos a
(a) No considera la superficie con uso no habitacional en el Portal Bicentenario. Fuente: Serex.
Gráfico 1
69

In the aggregate, the
available soil to February 2006
is 2,850 hectares, with the
following conditions: residential
destination or mixed-density
150 inhabitants per ha or more
and surface area higher than 2
ha. If it is considered an annual
consumption of 600 ha land in
residential use, the availability
of land last for less than three
years.
OUR ASPIRATION AS A COUNTRY IN TERMS OF LAND INFORMATION
Geospatial technology at
present would allow us to reach
a kind of land in line with all
the information associated with
each territorial boundaries
and possibilities of adding
a decentralized information
and extract statistics such
as location, year, type of use,
and so on. Ultimately it would
be a line land cadastre- and
in real time on the properties,
including:
• Land for construction, vacant
land, land protected. This
requires municipalities to report
their receipts of work. Today
only the permissions are asked
to the INE but not effectively
used.
• Land for construction. This
requires that municipalities
inform the beginnings of work.
• Property (land tax or
private). This requires opening
up the land register of National
Property.
• Valuation of the property.
This is critical for the opening
of the service information from
internal taxes.
• Building regulations and
conditions. This information
should be provided by the
municipalities and other
entities with jurisdiction
información muy valiosa a la hora
de tomar decisiones de inversión.
Nuevamente, las bases de datos
permitirían georreferenciar
fácilmente esta información
(Fig.4).
En el contexto de la
modificación al Plan Regulador
Metropolitano de Santiago, y
en vista de que no se conocía
una cuantificación clara de la
disponibilidad de suelo en la ciudad
de Santiago, el año 2007 la CChC
pidió a la Universidad Católica
que hiciera la cuantificación de la
disponibilidad de suelo, utilizando
para ello una fotografía aérea del
Servicio Aerofotogramétrico. La
fotografía más reciente que existía
era del año 2006 y ésa fue la
que se utilizó, con los resultados
indicados en el gráfico Nº1.
CÁMARA CHILENA DE LA CONSTRUCCIÓN
En el agregado, el suelo
disponible a febrero de 2006
es de 2.850 hectáreas, con las
siguientes condiciones: destino
residencial o mixto, densidad
150 hab/ha o más y superficie
superior a 2 ha. Si se considera
un consumo de suelo anual de
600 ha en uso residencial, la
disponibilidad de suelo alcanzaría
para menos de tres años.
NUESTRA ASPIRACIÓN COMO PAÍS EN CUANTO A INFORMACIÓN TERRITORIAL
La tecnología geoespacial
en la actualidad nos permitiría
llegar a una especie de catastro
en línea con toda la información
territorial asociada a cada
predio y con posibilidades
de agregar información
descentralizadamente, y extraer
estadísticas por lugar, año, tipo
de uso, etc. En definitiva, sería
un catastro en línea y en tiempo
real sobre las propiedades,
incluyendo:
• Terrenos construidos,
terrenos vacantes, terrenos
protegidos. Para esto se
requiere que las municipalidades
informen sus recepciones de
obra. Hoy sólo informan al INE
los permisos solicitados pero no
los efectivamente utilizados.
• Terrenos en construcción.
Para esto se necesita que los
municipios informen los inicios
de obra.
• Propiedad (suelo fiscal o
privado). Para esto se requiere
70
over land-use planning as
the Seremi MINVU, regional
governments, MOP, SNASPE,
Committees of Management
and other coastal edge.
• Simulation of natural
hazards. Including floods,
volcanoes, landslides, etc;
fundamental issue in our
country.
• Simulation of impacts on
development. This is a very
important task since that
planning in our country is aimed
at enabling developments in
the territory provided they
internalize their impacts. This
was already raised in the
current amendment to the
Plan of Metropolitan Santiago
and also on the bill amending
the General Law on Urban
Planning and Construction,
under discussion in Congress.
In this context we urgently
need to measure objectively
and with transparency impacts
of the developments in the
territory, and able to simulate
the private sector to make
their investment decisions with
all the information about costs
and benefits of their projects,
without taking unnecessary
risks for not having known in
advance the impacts to pay.
We know that an online
system of this kind is not easy
to implement, and we know
that this is not the goal of
SNIT. But if we trust that this
initiative led by SNIT form
a “Territorial Information
National Community “then
we are moving in the right
direction. As a private sector
we greatly appreciate and we
are grateful for the invitation
to be part of it.
la apertura del catastro de
Bienes Nacionales.
• Valoración de la propiedad.
Para esto es fundamental la
apertura de la información del
Servicio de Impuestos Internos.
• Normativa y condiciones de
edificación. Esta información
debiera ser aportada por
las municipalidades y otras
entidades con competencia en la
planificación del territorio, como
Seremi del MINVU, Gobiernos
Regionales, MOP, SNASPE,
Comisiones de Ordenamiento del
Borde Costero y otras.
• Simulación de riesgos
naturales. Incluyendo
inundaciones, volcanes,
deslizamientos de tierra, entre
otros, tema fundamental en
nuestro país
• Simulación de impactos
por desarrollo. Este es un
tema muy relevante, ya que
la planificación en nuestro
país se orienta a permitir los
desarrollos en el territorio
siempre y cuando internalicen
sus impactos. Esto ya se plantea
en la actual modificación del
Plan Regulador Metropolitano
de Santiago y también en el
proyecto de ley que modifica
la Ley General de Urbanismo y
Construcciones, en discusión en
el Congreso. En este contexto,
necesitamos con urgencia poder
medir objetivamente y con
transparencia los impactos de
los desarrollos en el territorio,
y poder simularlos para que
los privados puedan tomar sus
decisiones de inversión con
toda la información de costos
y beneficios que tendrán sus
proyectos, sin asumir riesgos
innecesarios por no haber
conocido los impactos a pagar.
Sabemos que un sistema
on line de este tipo no es fácil
de implementar, y sabemos
que tampoco es el objetivo
del SNIT. Pero confiamos en
que esta iniciativa liderada
por el SNIT de conformar
una “Comunidad Nacional de
Información Territorial” se
orienta en el sentido correcto.
Como sector privado la valoramos
enormemente y agradecemos la
invitación a ser parte de ella.
71
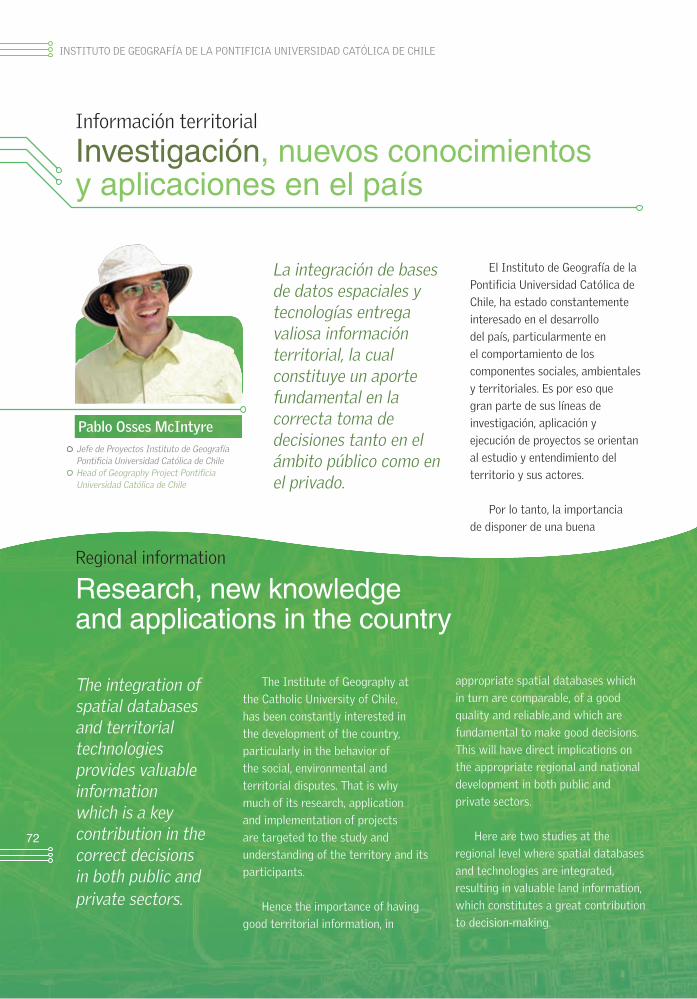
El Instituto de Geografía de la
Pontificia Universidad Católica de
Chile, ha estado constantemente
interesado en el desarrollo
del país, particularmente en
el comportamiento de los
componentes sociales, ambientales
y territoriales. Es por eso que
gran parte de sus líneas de
investigación, aplicación y
ejecución de proyectos se orientan
al estudio y entendimiento del
territorio y sus actores.
Por lo tanto, la importancia
de disponer de una buena
Información territorial
Investigación, nuevos conocimientosy aplicaciones en el país
La integración de bases de datos espaciales y tecnologías entrega valiosa información territorial, la cual constituye un aporte fundamental en la correcta toma de decisiones tanto en el ámbito público como en el privado.
Pablo Osses McIntyreJefe de Proyectos Instituto de Geografía Pontificia Universidad Católica de ChileHead of Geography Project Pontificia Universidad Católica de Chile
The Institute of Geography at
the Catholic University of Chile,
has been constantly interested in
the development of the country,
particularly in the behavior of
the social, environmental and
territorial disputes. That is why
much of its research, application
and implementation of projects
are targeted to the study and
understanding of the territory and its
participants.
Hence the importance of having
good territorial information, in
Regional information
Research, new knowledgeand applications in the country
The integration of spatial databases and territorial technologies provides valuable information which is a key contribution in the correct decisions in both public and private sectors.
appropriate spatial databases which
in turn are comparable, of a good
quality and reliable,and which are
fundamental to make good decisions.
This will have direct implications on
the appropriate regional and national
development in both public and
private sectors.
Here are two studies at the
regional level where spatial databases
and technologies are integrated,
resulting in valuable land information,
which constitutes a great contribution
to decision-making.
INSTITUTO DE GEOGRAFÍA DE LA PONTIFICIA UNIVERSIDAD CATÓLICA DE CHILE
72

información territorial, de adecuadas bases de datos
espaciales y que a su vez éstas sean comparables, de
calidad y confiables, resulta fundamental para la toma
de buenas decisiones. Esto tendrá directas implicancias
en el adecuado desarrollo regional y nacional tanto en
el ámbito público como privado.
A continuación se presentan dos estudios a
nivel regional en donde se integran bases de datos
espaciales y tecnologías, dando como resultado valiosa
información territorial, la cual constituye un gran
aporte a la toma de decisiones.
CASO Nº1ESTUDIO, DIAGNÓSTICOY PROPUESTA PARATERRITORIOS AISLADOS
Planteamiento
El desarrollo del territorio chileno es espacialmente
diferenciado. La desigual distribución de los servicios
administrativos, salud, educación, empleo, acceso a la
cultura y oportunidades en algunas ciudades o regiones,
ha generado grandes disparidades. Por esta razón,
resulta indispensable la construcción de herramientas
para la identificación de territorios aislados, orientando
la ejecución de planes y programas enfocados
al mejoramiento de las condiciones que resulten
menos favorables. El estudio fue elaborado para la
Subsecretaría de Desarrollo Regional y Administrativo
(SUBDERE) del Ministerio del Interior.
Método
Para la determinación de los territorios en
condición de aislamiento se utilizó una serie de
indicadores definidos en conjunto con la SUBDERE que
reflejan esta condición, los que fueron agrupados en
cinco criterios: físico, demográfico, económico, acceso a
servicios y político-administrativo.
En primer lugar se priorizó el uso de información
homogénea para todas las comunas del país, con el
objetivo de minimizar limitantes en el desarrollo del
estudio. De esta forma se trabajó con la unidad político-
administrativa comunal como territorio de análisis.
CASE Nº 1STUDY, DIAGNOSISAND PROPOSAL FORISOLATED TERRITORIES
Approach
The development of the Chilean territory is
spatially differentiated. The unequal distribution
of administrative services, health, education,
employment, access to culture and opportunities
in some cities or regions, has created huge
disparities. For this reason it is essential the
construction of tools for the identification of
isolated territories, guiding the implementation
of plans and programs aimed at improving
conditions which are less favorable. The study
was prepared for the regional development
and administrative Secretary (SUBDERE) of the
Ministry of Interior.
Method
For the determination of the insulation
territories, a series of indicators defined
in conjunction with the SUBDERE were
used, which reflect the condition, and which
were grouped into five categories: physical,
demographic, economic, political and access to
administrative services criteria.
First priority was the use of uniform
information for all communes in the country,
with the aim of minimizing limitations in the
development of study. In this way we worked
with the political and administrative unity as a
communal area of analysis.
Results at country level
It was obtained as a result of the study,
that out of 298 communes which were
analyzed, 76 were in critical isolation condition
and that they are concentrated mainly in
the regions of the south of the country, but
not necessarily correspond to the extreme
communes.
73

Resultados a nivel país
Se obtuvo como resultado del estudio que de las
298 comunas que fueron analizadas, 76 se encuentran
en condición de aislamiento crítico y que éstas se
concentran mayoritariamente en las regiones de la zona
sur del país, pero no necesariamente corresponden a
comunas extremas.
De manera general, si se consideran las regiones con
mayor cantidad de comunas en situación de aislamiento
DEFINICIÓN DE CRITERIOS
OBTENCIÓN DE VALORES POR INDICADOR
CRITERIOFÍSICO
TipoClimático
CRITERIODEMOGRÁFICO
Dispersiónde Población
TasaPoblación Indígena
CRITERIO ACCESOA SERVICIOS
IntegraciónComunicacional
CoberturaEducacional
Coberturaen Salud
Accesibilidada Servicios
CRITERIOECONÓMICO
Dependenciafondos externos
VALOR FINAL DE AISLAMIENTO
NivelActividad Económica
CRITERIO POLÍTICO ADMINISTRATIVO
JerarquíaAdministrativa
Estandarizaciónde los valoresobtenidos enindicadores
Ponderaciónde valores por
indicador
Sumade indicadores
ponderados
Determinaciónde rangos en
criterios
a nivel país, se observa un predominio de esta
condición en regiones del sector centro-sur como en las
regiones del Bío-Bío, de la Araucanía y de Los Lagos.
Conclusiones
El mayor número de comunas en situación de
aislamiento crítico se concentran en la zona central
del país a pesar de que las comunas con valores más
altos corresponden a zonas extremas. Esta situación
se debe a que un criterio esencial para el estudio,
Diagrama Metodológico. Methodological diagram.
INSTITUTO DE GEOGRAFÍA DE LA PONTIFICIA UNIVERSIDAD CATÓLICA DE CHILE
74
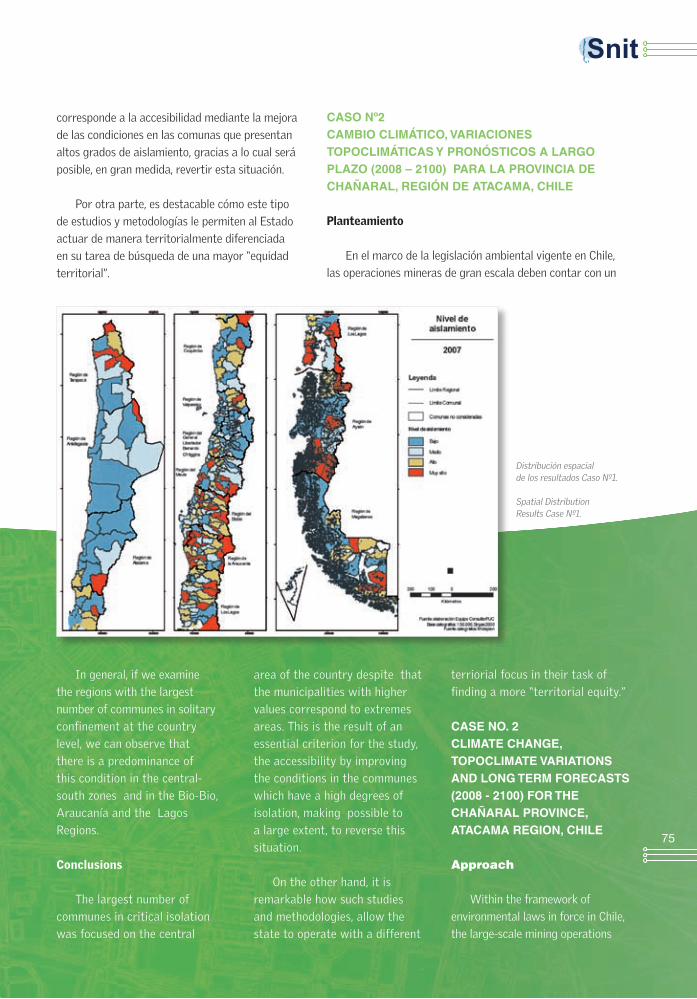
corresponde a la accesibilidad mediante la mejora
de las condiciones en las comunas que presentan
altos grados de aislamiento, gracias a lo cual será
posible, en gran medida, revertir esta situación.
Por otra parte, es destacable cómo este tipo
de estudios y metodologías le permiten al Estado
actuar de manera territorialmente diferenciada
en su tarea de búsqueda de una mayor “equidad
territorial”.
In general, if we examine
the regions with the largest
number of communes in solitary
confinement at the country
level, we can observe that
there is a predominance of
this condition in the central-
south zones and in the Bio-Bio,
Araucanía and the Lagos
Regions.
Conclusions
The largest number of
communes in critical isolation
was focused on the central
Distribución espacialde los resultados Caso Nº1.
Spatial DistributionResults Case Nº1.
CASO Nº2CAMBIO CLIMÁTICO, VARIACIONES TOPOCLIMÁTICAS Y PRONÓSTICOS A LARGO PLAZO (2008 – 2100) PARA LA PROVINCIA DE CHAÑARAL, REGIÓN DE ATACAMA, CHILE
Planteamiento
En el marco de la legislación ambiental vigente en Chile,
las operaciones mineras de gran escala deben contar con un
area of the country despite that
the municipalities with higher
values correspond to extremes
areas. This is the result of an
essential criterion for the study,
the accessibility by improving
the conditions in the communes
which have a high degrees of
isolation, making possible to
a large extent, to reverse this
situation.
On the other hand, it is
remarkable how such studies
and methodologies, allow the
state to operate with a different
terriorial focus in their task of
finding a more “territorial equity.”
CASE NO. 2CLIMATE CHANGE, TOPOCLIMATE VARIATIONS AND LONG TERM FORECASTS (2008 - 2100) FOR THE CHAÑARAL PROVINCE, ATACAMA REGION, CHILE Approach
Within the framework of
environmental laws in force in Chile,
the large-scale mining operations
75

plan que anticipe y modele el cierre de sus actividades.
En ese contexto, y dada la complejidad de los ambientes
en que generalmente éstas se llevan a cabo y que
corresponden a las grandes alturas de la Cordillera de los
Andes, es que la modelación a futuro del comportamiento
de algunas variables ambientales resulta imperiosa.
En este trabajo se expone la construcción de
un modelo climático que permita pronosticar el
comportamiento de algunas variables meteorológicas en
un escenario desde el presente hasta el período 2071-
2100, incorporando los efectos del eventual cambio
climático tan discutido en nuestros días. Se trabajaron
las variables de temperatura media, máxima y mínima,
precipitaciones y efectos de la topografía para una región
montañosa del desierto de Atacama, específicamente la
Provincia de Chañaral, perteneciente administrativamente
a la Región de Atacama.
Método
La base del modelo se construyó a partir de los
datos obtenidos del recientemente publicado “Estudio
de Variabilidad Climática para el S. XXI” de 2006. Este
estudio fue financiado por la Comisión Nacional de Medio
Ambiente (CONAMA) y realizado por el Departamento
de Geofísica de la Universidad de Chile. Específicamente
se utilizó el modelo PRECIS, que entrega información en
una grilla de 0,25º de latitud y longitud. Éste fue revisado
y optimizado para ser aplicado a una escala territorial
de mayor detalle y menor extensión. Se trabajaron dos
escenarios de cambio climático: uno sin variaciones
desde el presente en lo que dice relación con emisiones
y políticas globales de control, y el otro en que se
incorporan regulaciones y controlan las emisiones.
Se caracterizó el comportamiento de la nube
estratocúmulo costera (SC), gran regulador del clima
en la región, en base a imágenes GOES, obteniéndose
información de frecuencia de presencia de SC sobre la
costa, así como también su penetración continental.
Para la construcción del modelo topoclimático
se trabajó con imágenes de temperatura del aire
(TAG) basadas en el modelo global (PRECIS) y con
192 imágenes de temperatura superficial de la tierra
obtenidas del sensor MODIS. Se realizaron análisis de
regresión entre ambas imágenes para evaluar su nivel de
correlación.
should have a plan and model that anticipates the
closure of its activities. In that context, and given
the complexity of the environments in which these
usually are carried out and that correspond to the
high elevations of the Andes, some environmental
variables are imperative when shaping the future
behavior of those variables.
This paper outlines the construction of a
climate model that allows predicting the behavior
of some meteorological variables in a scene
starting from the present time until the period
2071-2100, incorporating the effects of possible
climate change as discussed in the present times.
Temperature information such as medium,
maximum and minimum variables ,rainfall and the
effects of topography to a mountainous region of
the Atacama desert, were observed specifically
Chañaral Province, which belongs administratively
to the region of Atacama.
Method
The base model was constructed from the
data obtained from the recently published “Study
of Climate Variability for the S. XXI, 2006. This
study was funded by the National Commission on
the Environment (CONAMA) and conducted by the
Department of Geophysics at the University of Chile.
Specifically PRECIS model was used to deliver
information in a grid of 0.25 degrees latitude
and longitude. This was revised and optimized to
be implemented on a scale of lower and further
territorial expansion . Two scenarios were worked
on climate change: an actual unchanged scenario
,which is in relation with control emissions and
global policies and other regulations which
incorporate and control emissions.
It was observed the behavior of the Coast
estratocumulo cloud (SC), a large regulatory climate
in the region, based on GOES images obtaining
information of the SC frequency presence on the
coast, as well as its continental penetration.
For the construction of the topoclimate model
we worked with images of air temperature (TAG)
based on the global model (PRECIS) and 192
surface temperatures over land from MODIS
INSTITUTO DE GEOGRAFÍA DE LA PONTIFICIA UNIVERSIDAD CATÓLICA DE CHILE
76

Resultados
Si cambian las condiciones del comportamiento
del anticiclón y la nube estratocúmulo del
Pacífico suroriental, se espera una variación en el
comportamiento térmico de la sección costera chilena.
La influencia moderadora del mar es más leve en
escenarios futuros. El aumento de las temperaturas
medias, máximas y mínimas es inminente, en cualquier
escenario.
El aumento de la temperatura media es mayor
(del orden de 0,5°C) en la estación de invierno, en
comparación con la estación estival.
En escenarios futuros, ya sea en una visión
moderada o severa, las precipitaciones se
intensificarán en el área de estudio con énfasis en las
cuencas altiplánicas y en los meses de invierno.
Los sectores precordilleranos presentarán
lluvias invernales, situación que se intensificará en el
futuro. Las precipitaciones tenderán a aumentar en
la estación de invierno, mientras que los meses de
primavera serán los más secos.
En escenarios futuros, las precipitaciones tenderán
a incrementarse en la sección oriental del área de
estudio, mientras que decrecerán sobre el océano y la
línea de costa.
sensor. Regression analysis was carried out between
the two images to assess their level of correlation.
Results
If the conditions change the behavior of
the anticyclone and the southeastern Pacific
estratocumulo cloud, then it will be expected a
change in the thermal behavior of the chilean coastal
section.
The moderating influence of the sea is softer in
the future scenarios. The increase in the average
of the maximum and minimun temperatures is
imminent, at any stage.
The increase in average temperature is higher
(on the order of 0.5° C) in the winter season,
compared to the summer season.
In future scenarios, either with a moderate or
severe vision, the precipitation will intensify the
study area with emphasis on the highland basins and
in the winter months.
The precordilleran sectors will present pre-
winter rains, a situation which will be stronger in the
future. Rainfall tend to increase in the winter season,
while the spring months are the driest ones..
In future scenarios, precipitation will tend to
rise in the eastern section of the study area, while
decreasing over the ocean and the coastline.
Escenarios futuros precipitaciones
Escenarios futuros temperaturas
77

Con un importante marco de
especialistas y público en general,
entre el 28 y el 30 de octubre se
realizó el primer encuentro en
el que participó una delegación
de autoridades y expertos del
Ministerio de Recursos Naturales
de Canadá, quienes debatieron
e intercambiaron experiencias
con sus pares chilenos sobre
variadas temáticas de información
territorial.
El encuentro, que se realizó
en Santiago y Valparaíso fue
organizado por la Secretaría
Ejecutiva del Sistema Nacional
de Coordinación de Información
Territorial (SNIT), y se enmarca
dentro del Convenio de
Cooperación sobre Geomática e
Información Geoespacial, suscrito
el año 2007 entre los Gobiernos
de Chile y Canadá.
El primer día se efectuó un
seminario titulado “Aplicación
de sistemas de información
territorial en el sector público: la
experiencia de Canadá”, al cual
concurrieron más de 150 invitados
entre autoridades y funcionarios
Fructífero intercambio Chile-Canadáen Información Teritorial
de servicios públicos. La actividad
fue inaugurada por la Ministra
de Bienes Nacionales, Romy
Schmidt, y el Consejero Comercial
de la Embajada de Canadá,
Sylvain Fabi. Las presentaciones
estuvieron a cargo del Director
del Programa GeoConnections
de Canadá, Sylvain Latour,
quien detalló la experiencia
del país norteamericano
en la implementación de la
Infraestructura de Datos
Espaciales (IDE), y la
Administradora de Contenidos de
dicho programa, Paula Rojas.
With a major part of specialists and public in general, between October 28 and 30 , it was held the first encounter in which a delegation of authorities and experts from the Ministry of Natural Resources form Canada, discussed and exchanged experiences with their Chileans peers on various topics of land information.
The meeting, held in Santiago and Valparaiso was organized by the Executive Secretariat of the
National Coordination of Territorial Information (SNIT) and it is part of the Agreement of Cooperation on Geomatics and Geospatial Information, signed in 2007 between the governments of Chile and Canada.
The first day was a seminar entitled “Implementation of land information systems in the public sector: the experience of Canada,” which was attended by over 150 guests between authorities and officials of public services. The
event was inaugurated by the Minister of National Property, Romy Schmidt, and the Commercial Counselor of the Embassy of Canada Mr. Sylvain Fabi. The presentations were made by the Director of GeoConnections from Canada, Mr. Sylvain Latour, who detailed the experience of the North American country in the implementation of the Spatial Data Infrastructure (SDI), and the contents of administering this program were made by Paula Rojas.
The next day, the Canadian delegation and the regional coordinators of the SNIT and Themes, moved to the Hydrographic and Oceanographic Service of the Chilean Navy (SHOA), based in Valparaiso, which along with
Overwhelming chilean and canadian exchange of Territorial Information
NOTICIAS
78

Al día siguiente, la delegación canadiense
y los coordinadores regionales y de las áreas
temáticas del SNIT, se trasladaron al Servicio
Hidrográfico y Oceanográfico de la Armada de
Chile (SHOA), con sede en Valparaíso, donde
junto con conocer sus modernas instalaciones,
pudieron presenciar las exposiciones de los
representantes del organismo, del Instituto
Geográfico Militar (IGM) y del Servicio
Aerotogramétrico de la Fuerza Aérea de Chile
(SAF), los que entregaron información sobre
los procesos utilizados en la generación de
productos cartográficos.
its modern facilities, were able to witness the presentations by the representatives of the agency, the Military Geographical Institute (IGM) and the Air Service Photogrammetric of the Chilean Air Force (SAF), which gave information on the processes used in the generation of mapping products.
Finally, on Friday, October 30, activities returned to Santiago with the development of a workshop
Finalmente, el viernes 30 de octubre, las
actividades regresaron a Santiago con el
desarrollo de un taller en el IGM, en el que los
coordinadores del SNIT conocieron la experiencia
canadiense en el trabajo sobre normas, estándares
y recomendaciones técnicas para la generación y
utilización de cartografía e información territorial
en general.
Antes de partir, las autoridades extranjeras
participantes destacaron los avances del país en
estas materias, a la vez que resaltaron la labor de
coordinación que está realizando el SNIT.
in the IGM, in which the regional coordinators of SNIT and those responsible for the thematic areas knew the Canadian experience in working on norms, standards and technical recommendations for the generation and use of mapping and land information in general.
Before leaving the foreign participants highlighted the progress of the country in these areas at the same time emphasizing the coordination work being done by the SNIT.
El Secretario Ejecutivo del SNIT, Cristian Aqueveque, se dirige a los asistentes en la ceremonia de inauguración. En la mesa (de izq. a der.), el Director del Programa GeoConnections de Canadá, Sylvain Latour; la Administradora de Contenidos GeoConnections, Paula Rojas; el Consejero Comercial de la Embajada de Canadá, Sylvain Fabi; la Ministra de Bienes Nacionales, Romy Schmidt; y la Consejera del Ministerio de los Recursos Naturales de Canadá, France Morin.
79

NOTICIAS
Una masiva convocatoria y exposiciones de alto
nivel marcaron el acto de creación de la Comunidad
Nacional de Información Territorial, una alianza
impulsada por SNIT, que apunta a que distintos
sectores de la sociedad trabajen complementariamente
en la consolidación de una potente infraestructura de
datos geoespaciales de Chile.
El evento, que se realizó el 25 de agosto de 2008
en un céntrico hotel capitalino, fue encabezado por la
Ministra de Bienes Nacionales, Romy Schmidt, en su
calidad de presidenta del Consejo de Ministros de la
Información Territorial, y contó con la participación
de unas 300 personas, entre representantes del sector
público, privado, académico y ciudadano.
La iniciativa busca sumar esfuerzos y conocimientos
para implementar un sistema que permita aprovechar
la multiplicidad de datos geoespaciales que se generan
en el país para ponerlos al servicio del Gobierno,
las instituciones públicas y privadas, y lo que es
más relevante aún, para toda la población. Así, esta
“puesta en común” apunta a ampliar el espectro de
coordinación, para generar así una gran red que integre,
actualice y complete la mayor parte de la información
geoespacial existente en Chile.
Este hecho es un verdadero hito en la vida del
SNIT, ya que constituye una importante instancia de
participación ciudadana, que expresamente establece
la necesidad de coordinación y de trabajo conjunto
entre el sector público y el privado, incluyendo el
mundo académicos, parlamentario y la comunidad en
general.
La constitución de la Comunidad Nacional
de Información Territorial tiene una importancia
estratégica destacable, por cuanto facilita y potencia
la colaboración conjunta de la sociedad, cuya
interacción constituye el motor del desarrollo del Siglo
XXI, y a la vez da cabal cumplimiento a uno de los
compromisos suscritos por el Gobierno respecto a las
Metas del Milenio.
Exitoso lanzamiento de la Comunidad Nacional de Información Territorial
A massive call and high-level exhibitions
marked the creation of the National Community
of Territorial Information, an alliance led by Snite,
which suggests that different sectors of society
work in a complementary association to build a
strong infrastructure of geospatial data in Chile.
The event, which took place on August 25,
2008 at a downtown hotel, was led by the
Minister of National Property, Romy Schmidt,
as chairwoman of the Council of Ministers
of the Territorial Information, and with the
participation of about 300 people, including
representatives of the public, private, academic
and citizen area.
The initiative seeks to join efforts and
expertise, to implement a system that makes the
multiplicity of geospatial data ,which is generated
in the country, to serve the Government, the
public institutions and the private area and what
is even more relevant for the entire population.
So this “pooling” aims to broaden the spectrum
of coordination, to generate a large network
to integrate, upgrade and complete the bulk of
geospatial information in Chile as well.
This is a real milestone in the life of SNIT,
as it constitutes an important body of civic
participation, which expressly stipulates the need
for coordination and joint work between the
public and private sectors, including the academic
world, parliamentary and community in general.
The constitution of the National Territorial
Information has a remarkable strategic
importance, as it facilitates and encourages
the joint collaboration of the entire society,
whose interaction is the driving force behind
the development of the century and at the same
time it fully implements one of the commitments
made by the Government on the Millennium
Development Goals.
Successful launch of National Community of Territorial Information
80