revisiting the sdi and eccs methods for in-plane shear ... · revisiting the sdi and eccs methods...
TRANSCRIPT

Revisiting the SDI and ECCS methods for in-plane shear
flexibility of metal roof deck diaphragms using 3D
non-linear finite element analysis
F. Bakhti & R. Tremblay Ecole Polytechnique de Montreal, Canada
C.A. Rogers McGill University, Canada
ABSTRACT:
Corrugated metal roof deck panels are commonly used to form horizontal diaphragms which carry lateral loads
in low-rise steel buildings. These thin steel panels are fastened to each other and to the supporting steel
framework in order to develop diaphragm action in the roof of a building. This paper describes a numerical
simulation with regards to the shear behaviour of the diaphragm. The results of a 3D non-linear finite element
analyses are presented, for which representative diaphragm configurations have been subjected to in-plane
loading. The analyses indicate that the total in-plane flexibility of the diaphragm is the sum of the sheet
flexibility including warping deformations, the shear flexibility of the connections, and a correction factor that
accounts for the interaction between the panels and their connections. Comparison with the current Steel Deck
Institute (SDI) and European Convention for Constructional Steelwork (ECCS) design methods for steel deck
diaphragms and experimental data is also presented.
Keywords: Steel deck, Diaphragm, Shear panel, Sheet warping, Fasteners
1. INTRODUCTION
Extensive testing and several analytical investigations have been carried out in North America (Nilson,
1960; Luttrell and Ellifritt, 1970; Tremblay et al., 2008) and Europe (Davies, 2006) to determine the
in-plane shear stiffness, G’, properties of metal roof deck diaphragms. Inconsistencies with recent field
test programs of low-rise steel buildings under ambient and forced vibration (Proulx et al., 2012;
Lamarche et al., 2009) as well as laboratory experiments of representative steel diaphragms (Tremblay
et al., 2008) have demonstrated that the predictor expressions for diaphragm flexibility may need to be
re-evaluated. Moreover, related studies have demonstrated that the diaphragm in-plane flexibility may
lengthen the building period compared to structures with rigid diaphragms (Tremblay, 2005). Given
that this building response will affect seismic design, a better understanding of the in-plane shear
behaviour of flexible diaphragms is sought.
The scope of this paper is to re-evaluate the diaphragm flexibility expressions of low-rise steel
buildings. In this sense, the experimental results of a research investigation conducted on the inelastic
behaviour of diaphragms (Essa et al., 2003) as well as the fasteners for steel roof deck diaphragms
(Rogers and Tremblay, 2003) are used. Thereafter, numerical models that predict with fidelity the
experimental results are prepared. Also, three dimensional nonlinear finite element analyses are
performed in order to improve the current code formulas for steel diaphragm design.
2. BACKGROUND RESEACH
Over the past three decades the in-plane shear flexibility, F=1/G’, of diaphragms has typically been
assessed according to either the SDI (Luttrell, 2004) or ECCS (1977) methods. Both the American and
European methods are semi-empirical in nature and are based on the same hypotheses for the

calculation of the total shear flexibility, F, of the diaphra
summation of individual components of various independent parameters. The resulting flexibility is
expressed as follow:
� � �� � �� � �� � ��
Where Fs is due to the shear deformation of a flat sheet, F
deformation of a corrugated profile,
fastener locations, and Fm is a miscellaneous flexibility to account e
the edge members or the deformation between purlins and rafters.
Both methods show some common similarity in the definition of F
due to the warping deformation is defined differently for each approach. The ECCS method usually
results in greater warping flexibility compared with the SDI method. In the SDI method, u
ECCS method, the miscellaneous flexibility is neglected and
to not take place. Note; accounting for
shear flexibility of the diaphragm.
A third design approach, known as the Tri
(CSSBI, 2006). This empirical design approach is valid only for a limited number of connector types;
including button punch or seam weld side
connections. The total shear flexibility F is defined (Army, 1973) as follows:
� � �� � � � �
Where: F1 is theoretical shear deformation of
flexibility due to the sheet distortion and
regards to the number of spans for single deck
interaction between warping deformation and fasteners deformation.
Diaphragm flexibility can also be measured by test as illustrated in Fig. 1. T
the numerical shear flexibility, F=1/
flow-shear angle curve corresponding to 40% of ultimate strengt
Figure 1. Typical diaphragm
3. STEEL DIAPHRAMS STUDIED
As shown in Fig. 2b, large-scale testing of cold
m x 3.66 m was conducted by Essa et al. (2003
quasi-static reversed cyclic shear loading. A cantileve
applied parallel to the direction of the deck panels (Fig. 2a). Canam profiled P3606 panels with
intermediate ribs having a 38 mm depth, 914 mm width and 6.25 m length were adopted. These
profiles are widely used for steel roof deck diaphragms in single
calculation of the total shear flexibility, F, of the diaphragm. The value of F is obtained from a simple
summation of individual components of various independent parameters. The resulting flexibility is
is due to the shear deformation of a flat sheet, Fd is due to the warping or distortion
deformation of a corrugated profile, Fc is due to the deformation in the sheet at frame and seam
is a miscellaneous flexibility to account either for the axial deformation in
the edge members or the deformation between purlins and rafters.
Both methods show some common similarity in the definition of Fs and Fc. However, the flexibility F
due to the warping deformation is defined differently for each approach. The ECCS method usually
results in greater warping flexibility compared with the SDI method. In the SDI method, u
ECCS method, the miscellaneous flexibility is neglected and in-plane torsion of the sheets
ing for the miscellaneous flexibility will significantly increase the total
the Tri-Services method, is also available for use in North America
(CSSBI, 2006). This empirical design approach is valid only for a limited number of connector types;
including button punch or seam weld side-laps connections and arc spot weld deck
lexibility F is defined (Army, 1973) as follows:
shear deformation of the diaphragm acting as a flat plate, F
sheet distortion and fastener deformation, F2 depicts the change in flexibility with
regards to the number of spans for single deck. In this approach, it is clearly noticed that there is an
interaction between warping deformation and fasteners deformation.
ty can also be measured by test as illustrated in Fig. 1. The experimental as well as
F=1/G’, is defined as the reciprocal of the secant stiffness
corresponding to 40% of ultimate strength according to the SDI method
iaphragm response under monotonic shear load (Essa et al., 2003)
STUDIED
scale testing of cold-formed steel deck diaphragms with dimension of 6.10
Essa et al. (2003) to study the inelastic behaviour under monotonic and
static reversed cyclic shear loading. A cantilever diaphragm setup was used, with the load
applied parallel to the direction of the deck panels (Fig. 2a). Canam profiled P3606 panels with
intermediate ribs having a 38 mm depth, 914 mm width and 6.25 m length were adopted. These
or steel roof deck diaphragms in single-storey buildings in North America.
gm. The value of F is obtained from a simple
summation of individual components of various independent parameters. The resulting flexibility is
(2.1)
is due to the warping or distortion
is due to the deformation in the sheet at frame and seam
ither for the axial deformation in
. However, the flexibility Fd
due to the warping deformation is defined differently for each approach. The ECCS method usually
results in greater warping flexibility compared with the SDI method. In the SDI method, unlike the
plane torsion of the sheets is assumed
increase the total
available for use in North America
(CSSBI, 2006). This empirical design approach is valid only for a limited number of connector types;
laps connections and arc spot weld deck-to-frame
(2.2)
F3 describes the
depicts the change in flexibility with
that there is an
he experimental as well as
the secant stiffness of the shear
h according to the SDI method.
under monotonic shear load (Essa et al., 2003)
formed steel deck diaphragms with dimension of 6.10
) to study the inelastic behaviour under monotonic and
r diaphragm setup was used, with the load
applied parallel to the direction of the deck panels (Fig. 2a). Canam profiled P3606 panels with
intermediate ribs having a 38 mm depth, 914 mm width and 6.25 m length were adopted. These
storey buildings in North America.
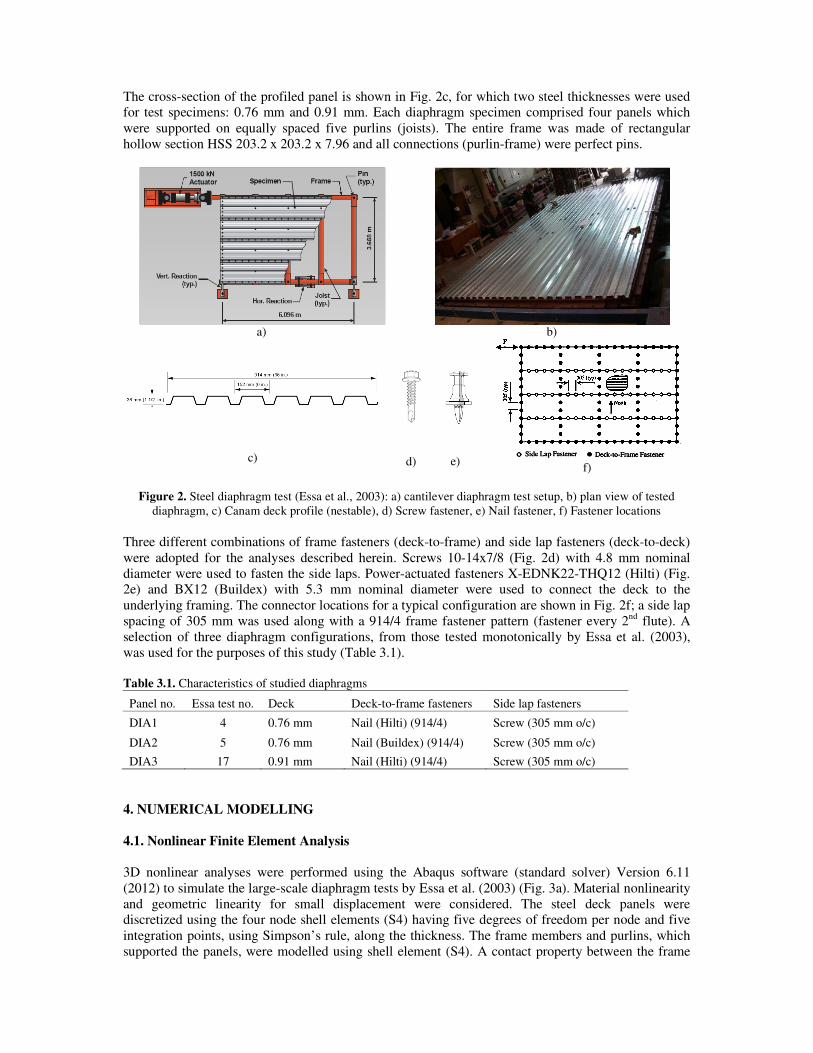
The cross-section of the profiled panel is shown in Fig. 2c, for which two steel thicknesses were used
for test specimens: 0.76 mm and 0.91 mm. Each diaphragm specimen comprised four panels which
were supported on equally spaced five purlins (joists). The entire frame was made of rectangular
hollow section HSS 203.2 x 203.2 x 7.96 and all connections (purlin-frame) were perfect pins.
a)
b)
c)
d)
e)
f)
Figure 2. Steel diaphragm test (Essa et al., 2003): a) cantilever diaphragm test setup, b) plan view of tested
diaphragm, c) Canam deck profile (nestable), d) Screw fastener, e) Nail fastener, f) Fastener locations
Three different combinations of frame fasteners (deck-to-frame) and side lap fasteners (deck-to-deck)
were adopted for the analyses described herein. Screws 10-14x7/8 (Fig. 2d) with 4.8 mm nominal
diameter were used to fasten the side laps. Power-actuated fasteners X-EDNK22-THQ12 (Hilti) (Fig.
2e) and BX12 (Buildex) with 5.3 mm nominal diameter were used to connect the deck to the
underlying framing. The connector locations for a typical configuration are shown in Fig. 2f; a side lap
spacing of 305 mm was used along with a 914/4 frame fastener pattern (fastener every 2nd
flute). A
selection of three diaphragm configurations, from those tested monotonically by Essa et al. (2003),
was used for the purposes of this study (Table 3.1).
Table 3.1. Characteristics of studied diaphragms
Panel no. Essa test no. Deck Deck-to-frame fasteners Side lap fasteners
DIA1 4 0.76 mm Nail (Hilti) (914/4) Screw (305 mm o/c)
DIA2 5 0.76 mm Nail (Buildex) (914/4) Screw (305 mm o/c)
DIA3 17 0.91 mm Nail (Hilti) (914/4) Screw (305 mm o/c)
4. NUMERICAL MODELLING
4.1. Nonlinear Finite Element Analysis
3D nonlinear analyses were performed using the Abaqus software (standard solver) Version 6.11
(2012) to simulate the large-scale diaphragm tests by Essa et al. (2003) (Fig. 3a). Material nonlinearity
and geometric linearity for small displacement were considered. The steel deck panels were
discretized using the four node shell elements (S4) having five degrees of freedom per node and five
integration points, using Simpson’s rule, along the thickness. The frame members and purlins, which
supported the panels, were modelled using shell element (S4). A contact property between the frame
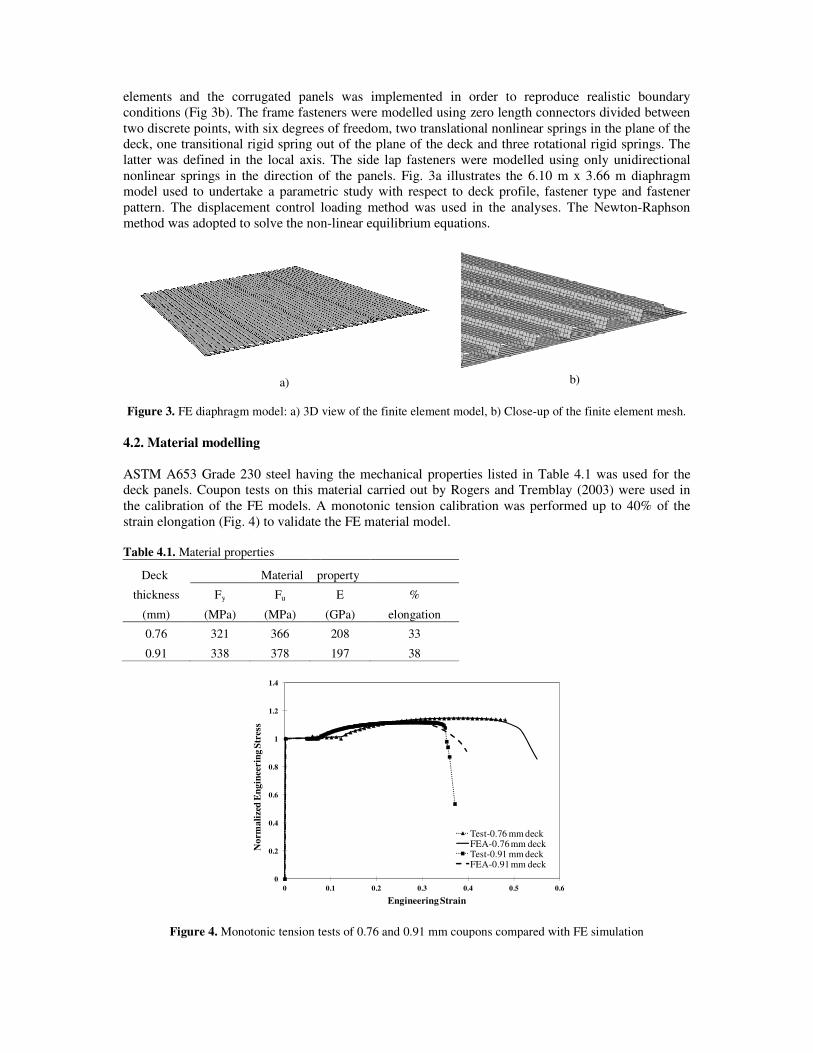
elements and the corrugated panels was implemented in order to reproduce realistic boundary
conditions (Fig 3b). The frame fasteners were modelled using zero length connectors divided between
two discrete points, with six degrees of freedom, two translational nonlinear springs in the plane of the
deck, one transitional rigid spring out of the plane of the deck and three rotation
latter was defined in the local axis. The side lap fasteners were modelled using only unidirectional
nonlinear springs in the direction of the panels. Fig. 3a illustrates the 6.10 m x 3.66 m diaphragm
model used to undertake a paramet
pattern. The displacement control loading method was used in the analyses.
method was adopted to solve the non
a)
Figure 3. FE diaphragm model: a) 3D view of
4.2. Material modelling
ASTM A653 Grade 230 steel having the mechanical properties listed in Table 4.1 was used for the
deck panels. Coupon tests on this material carried out by Rogers and Tremblay (
the calibration of the FE models. A monotonic tension calibration was performed up to 40% of the
strain elongation (Fig. 4) to validate the FE material model.
Table 4.1. Material properties
Deck Material property
thickness Fy Fu
(mm) (MPa) (MPa)
0.76 321 366
0.91 338 378
Figure 4. Monotonic tension tests of 0.76 and 0.91 mm coupons compared with FE simulation
0
0.2
0.4
0.6
0.8
1
1.2
1.4
0
No
rma
lize
d E
ng
inee
rin
g S
tres
s
the corrugated panels was implemented in order to reproduce realistic boundary
steners were modelled using zero length connectors divided between
two discrete points, with six degrees of freedom, two translational nonlinear springs in the plane of the
deck, one transitional rigid spring out of the plane of the deck and three rotational rigid springs. The
latter was defined in the local axis. The side lap fasteners were modelled using only unidirectional
nonlinear springs in the direction of the panels. Fig. 3a illustrates the 6.10 m x 3.66 m diaphragm
model used to undertake a parametric study with respect to deck profile, fastener type and fastener
The displacement control loading method was used in the analyses. The Newton
method was adopted to solve the non-linear equilibrium equations.
b)
3D view of the finite element model, b) Close-up of the finite element mesh.
ASTM A653 Grade 230 steel having the mechanical properties listed in Table 4.1 was used for the
material carried out by Rogers and Tremblay (2003)
the calibration of the FE models. A monotonic tension calibration was performed up to 40% of the
strain elongation (Fig. 4) to validate the FE material model.
property
E %
(GPa) elongation
208 33
197 38
Monotonic tension tests of 0.76 and 0.91 mm coupons compared with FE simulation
0.1 0.2 0.3 0.4 0.5 0.6
Engineering Strain
Test-0.76 mm deckFEA-0.76 mm deckTest-0.91 mm deckFEA-0.91 mm deck
the corrugated panels was implemented in order to reproduce realistic boundary
steners were modelled using zero length connectors divided between
two discrete points, with six degrees of freedom, two translational nonlinear springs in the plane of the
al rigid springs. The
latter was defined in the local axis. The side lap fasteners were modelled using only unidirectional
nonlinear springs in the direction of the panels. Fig. 3a illustrates the 6.10 m x 3.66 m diaphragm
ric study with respect to deck profile, fastener type and fastener
The Newton-Raphson
up of the finite element mesh.
ASTM A653 Grade 230 steel having the mechanical properties listed in Table 4.1 was used for the
2003) were used in
the calibration of the FE models. A monotonic tension calibration was performed up to 40% of the
Monotonic tension tests of 0.76 and 0.91 mm coupons compared with FE simulation

4.3. Fastener shear calibration
Each fastener was modelled as a nonlinear spring having the same properties in all directions in the
plane of the panel. Although the behaviour of the connection is more complicated than what was
modeled (Fig. 5b & Fig 7b), considering the possibility of local fracture and the onset of bearing
failure before reaching the ultimate strength of the connected steel sheets, an approach was taken in
which the simulation process replicated the global behaviour of the connection including the sheet
elements. From this, the nonlinear spring property of a single fastener, including the deck in the
connector vicinity, was extracted from the global response, and used in the overall diaphragm model.
4.3.1. Frame fasteners
The calibration of frame fastener behaviour was achieved using data from tests by Rogers and
Tremblay (2003a) (Fig. 5a). Connections were composed of a 250 mm long C-shape section (0.76 mm
or 0.91 mm thick) joined to a 200 mm long steel plate (3 mm thick plate). Both the Hilti and Buildex
nails were used in the scope of testing and for this FE model (Fig. 5b) calibration.
a)
b)
Figure 5. Nailed frame fasteners calibration: a) Test setup (Rogers and Tremblay, 2003a), b) FE model.
Comparison of the nonlinear FE model results with the measured connection resistance vs.
displacement response is shown in Figure 6. The slope of the first line segment fitted well with the
mean monotonic curve, representing three replicate tests (Fig. 6a-c). The slope follows the initial
elastic stiffness of the test (Kf-test), and it is close to that determined using the SDI method (Kf-SDI)
as described in Table 4.2. The elastic stiffness depends only on the thin plate thickness according to
the formulas developed by the SDI approach.
Table 4.2. Deck-to-frame fastener properties
Test SDI ECCS
Deck-to-frame connections Stiffness Strength Stiffness Strength Stiffness Strength
(kN/mm) (kN) (kN/mm) (kN) (kN/mm) (kN)
Hilti (0.76 mm deck) 23.2 6.41 24.1 7.08 40.0 3.70
Buildex (0.76 mm deck) 28.2 6.19 24.1 7.08 40.0 3.70
Hilti (0.91 mm deck) 23.9 7.46 26.5 8.31 - -
The nonlinear spring property of a single fastener, including the deck in the connector vicinity, was
extracted from the response of the entire test specimen (fitted curve of the mean test curve) as shown
in Fig. 6d. For each displacement step in the nonlinear analysis, the flexibility of the single fastener
was identified as the difference between the flexibilities of the test and an elastic system with a rigid
connector. This procedure provided a response from the simulation up to the ultimate strength, which
was in good accordance with the mean test curves shown in Fig. 6a-c.

a)
b)
c)
d)
Figure 6. Calibration of frame fastener models: a) Hilti nail in 0.76 mm deck, b) Buildex nail in 0.76 mm deck,
c) Hilti nail in 0.91 mm deck, d) Typical calibration curve for frame fastener.
4.3.2. Side lap fasteners
The calibration of side lap fasteners was also carried out using test data from Rogers and Tremblay
(2003b) (Fig. 7a) following a similar approach to that implemented for the frame fasteners. The test
specimens used for calibration were composed of two adjoining 300 mm long sections of 38 mm deep
deck connected with two screws. Figure 7b shows the modelled test specimen under shear loading.
a)
b)
Figure 7. Side lap fastener calibration: a) Test setup (Rogers and Tremblay, 2003b), b) FE model.
Comparison of the nonlinear FE model results with the measured side lap connection resistance vs.
displacement response is shown in Figure 8. As found for the frame fasteners, the slope of the first line
segment fitted well with the mean monotonic curve representing two replicate tests. This line follows
the initial elastic stiffness of the test (Ks-test) and the initial stiffness of a nonlinear system having
rigid connectors (Fig. 9). The initial elastic stiffness of the test was completely different from that
assessed using the SDI method (Ks-SDI) (Table 4.3), likely due to a difference in the test setup used
for development of the SDI equation; however, it was close to that calculated by the ECCS method. It
should be noted that that initial tangent stiffness of the analysis results, with or without flexible
fasteners, was the same. Based on this evidence, pre-stress and friction properties were created
0
2
4
6
8
-0.1 2 4.1 6.2
Load
, k
N
Displacement, mm
Test 39A
Test 39B
Test 39C
Mean Test
FEA
Kf-SDI(or Test)
0
2
4
6
8
-0.1 2 4.1 6.2
Load
, k
N
Displacement, mm
Test 40A
Test 40B
Test 40C
Mean Test
FEA
Kf-Test
Kf-SDI
0
2
4
6
8
-0.1 2 4.1 6.2
Load
, k
N
Displacement, mm
Test 41A
Test 41B
Test 41C
Mean Test
FEA
Kf-SDI (or Test)
0
2
4
6
8
0 0.25 0.5 0.75 1
Loa
d, k
N
Displacement, mm
Mean Test
Kf-Test
Ko-Rigid Connector

between the interfaces of the two sheets in the side lap connection model. The value of the in-plane
pre-existing force is determined using Fig. 9, corresponds to the point of change of the slope. This
procedure allowed for a simulated FE response of the side lap connection that was in good accordance
with the mean test curve up to the ultimate strength level (Fig. 8a-b).
Table 4.3. Side lap fastener properties
Test SDI ECCS
Side Lap connections Stiffness Strength Stiffness Strength Stiffness Strength
(kN/mm) (kN) (kN/mm) (kN) (kN/mm) (kN)
Screw (0.76 mm deck) 1.35 2.37 10.0 3.19 1.35 -
Screw (0.91 mm deck) 2.26 3.06 11.1 3.90 1.89 -
As shown in Fig. 9, the nonlinear spring property of the two fasteners, including the deck in the
vicinity of the connectors, was extracted from the response of the tested connection (fitted curve of the
mean test curve) and the numerical simulation of same specimen with rigid connectors (System1). For
this latter model, as evidenced from the nonlinear analysis, the top flange of the deck remained in the
elastic domain while the webs of the deck typically became distorted and reached the yield stress.
a)
b)
Figure 8. Screw side lap fastener numerical calibration: a) 0.76 mm deck, b) 0.91 mm deck.
For each displacement step in the nonlinear analysis, the flexibility of the two fasteners is the
difference between the flexibilities of the test and “System1” with a rigid connector (Fig. 9). This
procedure allowed for a response from the simulation up to the ultimate strength of the connection
which is in good accordance with the mean test curve (Fig. 8a-b).
Figure 9. Typical calibration curve for side laps fastener
0
1
2
3
4
5
6
7
0 2 4 6 8 10
Load
, k
N
Displacement, mm
Test 9A
Test 9B
Mean Test
FEA
Ks-Test
Ks-SDI0
1
2
3
4
5
6
7
0 2 4 6 8 10
Load
, k
N
Displacement, mm
Test 10A
Test 10B
Mean Test
FEA
Ks-Test
Ks-SDI
0
1
2
3
4
5
6
7
0 1 2 3 4
Loa
d, k
N
Displacement, mm
Mean Test
Elastic with Rigid Connector
System 1
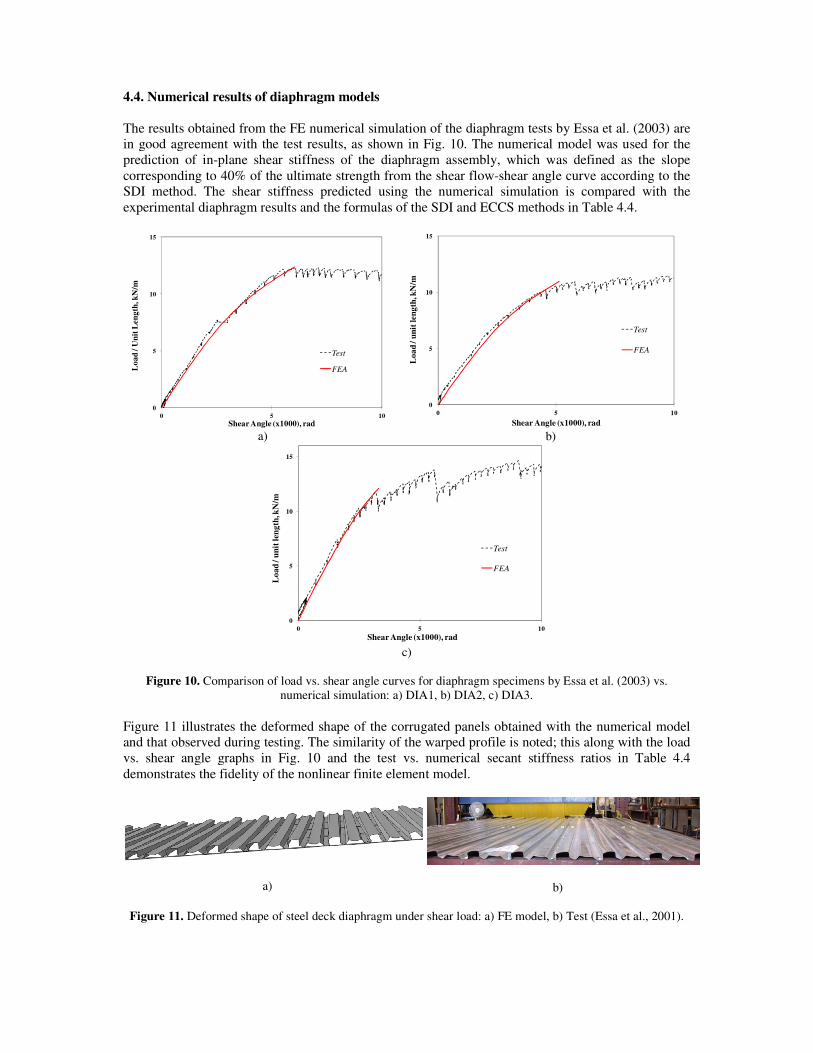
4.4. Numerical results of diaphragm models
The results obtained from the FE numerical simulation of the diaphragm tests by Essa et al. (2003) are
in good agreement with the test results, as shown in Fig. 10. The numerical model was used for the
prediction of in-plane shear stiffness of the diaphra
corresponding to 40% of the ultimate strength from the shear flow
SDI method. The shear stiffness predicted using the numerical simulation is compared with the
experimental diaphragm results and the formulas of the SDI and ECCS methods in Table 4.4.
a)
Figure 10. Comparison of load vs. shear angle curves for diaphragm specimens by Essa et al. (2003) vs.
numerical simulation: a) DIA1, b) DIA2, c) DIA3.
Figure 11 illustrates the deformed shape of the corrugated panels obtained with the numerical model
and that observed during testing. The similarity of the warped profile is noted; this along with the load
vs. shear angle graphs in Fig. 10 and the test vs. numerical
demonstrates the fidelity of the nonlinear finite element model.
a)
Figure 11. Deformed shape of steel deck diaphragm under shear load: a) FE model, b) Test
0
5
10
15
0 5
Lo
ad
/ U
nit
Len
gth
, kN
/m
Shear Angle (x1000), rad
0
5
10
15
0
Lo
ad
/ u
nit
len
gth
, kN
/m
Numerical results of diaphragm models
The results obtained from the FE numerical simulation of the diaphragm tests by Essa et al. (2003) are
in good agreement with the test results, as shown in Fig. 10. The numerical model was used for the
plane shear stiffness of the diaphragm assembly, which was defined as the slope
corresponding to 40% of the ultimate strength from the shear flow-shear angle curve according to the
SDI method. The shear stiffness predicted using the numerical simulation is compared with the
hragm results and the formulas of the SDI and ECCS methods in Table 4.4.
b)
c)
Comparison of load vs. shear angle curves for diaphragm specimens by Essa et al. (2003) vs.
numerical simulation: a) DIA1, b) DIA2, c) DIA3.
illustrates the deformed shape of the corrugated panels obtained with the numerical model
and that observed during testing. The similarity of the warped profile is noted; this along with the load
vs. shear angle graphs in Fig. 10 and the test vs. numerical secant stiffness ratios in Table 4.4
demonstrates the fidelity of the nonlinear finite element model.
b)
Deformed shape of steel deck diaphragm under shear load: a) FE model, b) Test (Essa et al.
10
Test
FEA
0
5
10
15
0 5L
oa
d / u
nit
len
gth
, kN
/m
Shear Angle (x1000), rad
5 10
Shear Angle (x1000), rad
Test
FEA
The results obtained from the FE numerical simulation of the diaphragm tests by Essa et al. (2003) are
in good agreement with the test results, as shown in Fig. 10. The numerical model was used for the
gm assembly, which was defined as the slope
shear angle curve according to the
SDI method. The shear stiffness predicted using the numerical simulation is compared with the
hragm results and the formulas of the SDI and ECCS methods in Table 4.4.
Comparison of load vs. shear angle curves for diaphragm specimens by Essa et al. (2003) vs.
illustrates the deformed shape of the corrugated panels obtained with the numerical model
and that observed during testing. The similarity of the warped profile is noted; this along with the load
secant stiffness ratios in Table 4.4
(Essa et al., 2001).
10
Test
FEA
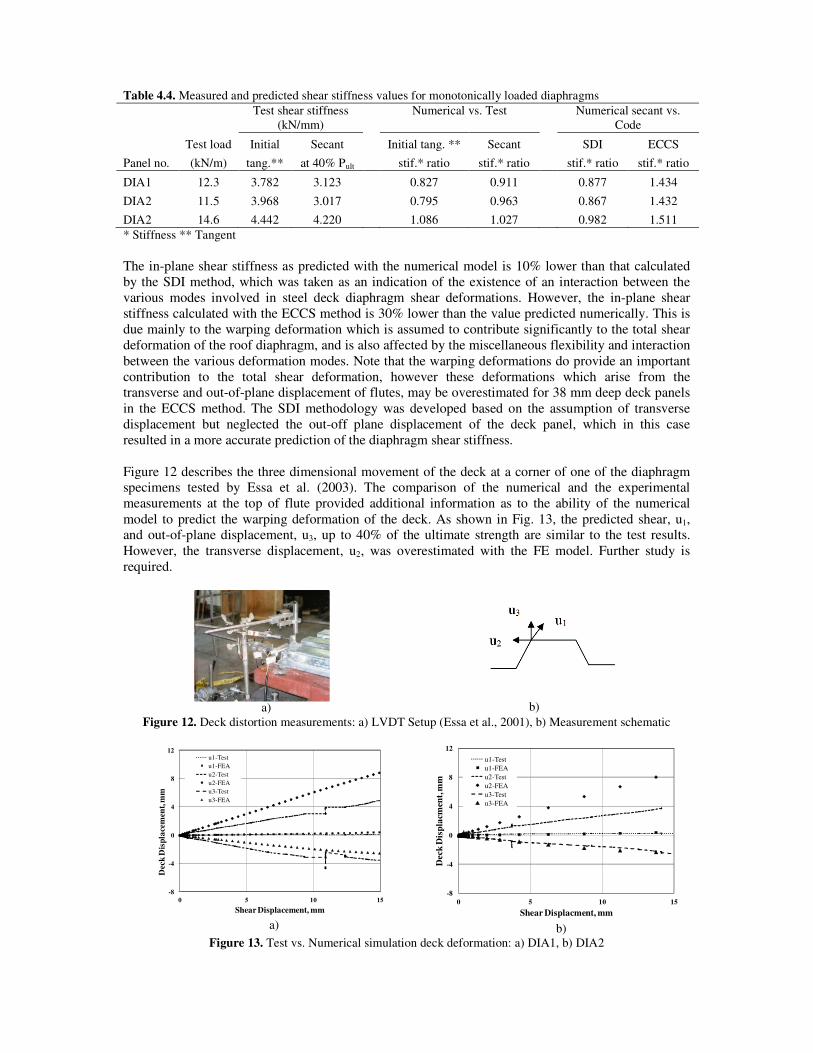
Table 4.4. Measured and predicted shear stiffness values for monotonically loaded diaphragms
Test shear stiffness
(kN/mm)
Numerical vs. Test
Numerical secant vs.
Code
Test load Initial Secant Initial tang. ** Secant SDI ECCS
Panel no. (kN/m) tang.** at 40% Pult stif.* ratio stif.* ratio stif.* ratio stif.* ratio
DIA1 12.3 3.782 3.123 0.827 0.911 0.877 1.434
DIA2 11.5 3.968 3.017
0.795 0.963
0.867 1.432
DIA2 14.6 4.442 4.220 1.086 1.027 0.982 1.511
* Stiffness ** Tangent
The in-plane shear stiffness as predicted with the numerical model is 10% lower than that calculated
by the SDI method, which was taken as an indication of the existence of an interaction between the
various modes involved in steel deck diaphragm shear deformations. However, the in-plane shear
stiffness calculated with the ECCS method is 30% lower than the value predicted numerically. This is
due mainly to the warping deformation which is assumed to contribute significantly to the total shear
deformation of the roof diaphragm, and is also affected by the miscellaneous flexibility and interaction
between the various deformation modes. Note that the warping deformations do provide an important
contribution to the total shear deformation, however these deformations which arise from the
transverse and out-of-plane displacement of flutes, may be overestimated for 38 mm deep deck panels
in the ECCS method. The SDI methodology was developed based on the assumption of transverse
displacement but neglected the out-off plane displacement of the deck panel, which in this case
resulted in a more accurate prediction of the diaphragm shear stiffness.
Figure 12 describes the three dimensional movement of the deck at a corner of one of the diaphragm
specimens tested by Essa et al. (2003). The comparison of the numerical and the experimental
measurements at the top of flute provided additional information as to the ability of the numerical
model to predict the warping deformation of the deck. As shown in Fig. 13, the predicted shear, u1,
and out-of-plane displacement, u3, up to 40% of the ultimate strength are similar to the test results.
However, the transverse displacement, u2, was overestimated with the FE model. Further study is
required.
a)
b) Figure 12. Deck distortion measurements: a) LVDT Setup (Essa et al., 2001), b) Measurement schematic
a)
b)
Figure 13. Test vs. Numerical simulation deck deformation: a) DIA1, b) DIA2
-8
-4
0
4
8
12
0 5 10 15
Dec
k D
isp
lace
men
t, m
m
Shear Displacement, mm
u1-Test
u1-FEA
u2-Test
u2-FEA
u3-Test
u3-FEA
-8
-4
0
4
8
12
0 5 10 15
Deck
Dis
pla
cmen
t, m
m
Shear Displacment, mm
u1-Test
u1-FEA
u2-Test
u2-FEA
u3-Test
u3-FEA
5. SUMMARY AND CONCLUSIONS
Conclusions are summarized as follows:
1. The numerical simulations show that the Abaqus based nonlinear finite element model
proposed in this study can result in predictions of the in-plane shear stiffness of steel deck
diaphragms, G', that are in general agreement with test results.
2. This model can be used for the prediction of the in-plane shear behaviour of steel deck
diaphragms to investigate the influence of the key parameters such as the fastener pattern, the
fasteners type or the deck profile.
3. In-plane shear stiffness as predicted with the numerical model is 10% lower than that
calculated by the SDI method.
4. In-plane shear stiffness as predicted with the numerical model is 46% higher than the values
calculated with the ECCS method; further study is ongoing to clarify this issue.
5. Compared to the SDI method, the ECCS method appears to give more flexible diaphragms as
a result of greater warping flexibility; the flexibility factors Fd(ECCS) being more than 20%
larger than the corresponding SDI warping flexibility factor Fd(SDI).
6. The study indicated that interactions likely exist between the various modes involved in steel
deck diaphragm shear deformations, as mentioned in background research; future studies are
needed to investigate further this aspect.
AKCNOWLEDGEMENT
Funding for this research was provided by the Natural Sciences and Engineering Research Council of Canada,
the Vancouver Steel Deck Diaphragm Design Committee (VSDDC) and its many member companies, the
Canadian Sheet Steel Building Institute, the Steel Deck Institute and Hilti Canada.
REFERENCES
Army, U. (1973). Seismic design for buildings (No. TM 5-809-10). Washington: Army Navy Air Force.
CSSBI. (2006). Design of Steel Deck Diaphragms, B13. Cambridge, Ont., Canada: Canadian Sheet Steel
Building Institute.
Dassault Systems Simulia, Corp. (2012). ABAQUS User's Manual, Version 6.11. Providence, RI, USA.
Davies, J. M. (2006). Developments in stressed skin design. Thin-Walled Structures 44:12, 1250-1260.
ECCS. (1977). European Recommendations for the Stressed Skin Design of Steel Structures. European
Convention for Constructional Steelwork. ECCS-XVII-77-1E.
Essa, H. S., Tremblay, R., and Rogers, C. A. (2003). Behavior of Roof Deck Diaphragms under Quasi-static
Cyclic Loading. Journal of Structural Engineering. 129:12, 1658-1666.
Lamarche, C.-P., Proulx, J., Paultre P., Turek M.,, & Ventura, C. E., Le, T.P., and Levesque C. (2009). Toward
a better understanding of the dynamic characteristics of single-storey braced steel frame buildings in
Canada. Canadian Journal of Civil Engineering. 36:6, 969-979.
Luttrell, L. D., & Ellifritt, D. S. (1970). Behavior of wide, narrow, and intermediate rib roof deck diaphragms -
Preliminary Rep. - phase II. W.Va.: West Virginia Univ.
Lutrell, L. D. (2004). Diaphragm design manual (3rd
ed.). Fox River Grove, IL: Steel Deck Institute.
Nilson, A. (1960). Shear Diaphragms of Light Gage Steel. J. Struct. Div. ASCE 86:11, 111-139.
Proulx, J., Boulanger, B., Bakhti, F., Shrestha, K., Tremblay, R., Rogers, C.A., Lamarche, C.P., Paultre, P.,
(2012). Field measurements and numerical predictions of the dynamic properties of a low-rise steel
building with a flexible steel roof deck diaphragm. Paper presented at the 7th Conference on the
behaviour of steel structures in seismic areas STESSA12.
Rogers, C. A., and Tremblay, R. (2003a). Inelastic seismic response of frame fasteners for steel roof deck
diaphragms. Journal of Structural Engineering. 129:12, 1647-1657.
Rogers, C. A., and Tremblay, R. (2003b). Inelastic seismic response of side lap fasteners for steel roof deck
diaphragms. Journal of Structural Engineering. 129:12, 1637-1646.
Tremblay, R. (2005). Fundamental Periods of Vibration of Braced Steel Frames for Seismic Design. Earthquake
Spectra. 21:3, 833-860.
Tremblay, R., Rogers, C. A., Nedisan, C., Franquet, J., Massarelli, R., & Shrestha, K. (2008). Dynamic seismic
testing of large size steel deck diaphragms for low-rise building applications. Paper presented at the
14th World Conference on Earthquake Engineering.