revisiting the relation between environmental...
TRANSCRIPT

ARTICLE IN PRESS
www.elsevier.com/locate/aos
Accounting, Organizations and Society xxx (2007) xxx–xxx
Revisiting the relation between environmentalperformance and environmental disclosure:
An empirical analysis
Peter M. Clarkson a,b, Yue Li c, Gordon D. Richardson c,*, Florin P. Vasvari d
a UQ Business School, The University of Queensland, Australiab Faculty of Business Administration, Simon Fraser University, Canada
c Joseph Rotman School of Management, University of Toronto, 105 St. George Street, Toronto, Ontario, Canada M5S 3E6d London Business School, University of London, London, United Kingdom
Abstract
Previous empirical evidence provides mixed results on the relationship between corporate environmental perfor-mance and the level of environmental disclosures. We revisit this relation by testing competing predictions from eco-nomics based and socio-political theories of voluntary disclosure using a more rigorous research design. Inparticular, we improve on the prior literature by focusing on purely discretionary environmental disclosures and bydeveloping a content analysis index based on the Global Reporting Initiative sustainability reporting guidelines toassess the extent of discretionary disclosures in environmental and social responsibility reports. This index better cap-tures firm disclosures related to its commitment to protect the environment than the indices employed by prior studies.Using a sample of 191 firms from the five most polluting industries in the US, we find a positive association betweenenvironmental performance and the level of discretionary environmental disclosures. The result is consistent with thepredictions of the economics disclosure theory but inconsistent with the negative association predicted by socio-politicaltheories. Nevertheless, we show that socio-political theories explain patterns in the data (‘‘legitimization’’) that cannotbe explained by economics disclosure theories.� 2007 Elsevier Ltd. All rights reserved.
0361-3682/$ - see front matter � 2007 Elsevier Ltd. All rights reservdoi:10.1016/j.aos.2007.05.003
* Corresponding author. Tel.: +1 416 946 8601.E-mail addresses: [email protected] (P.M.
Clarkson), [email protected] (Y. Li), [email protected] (G.D. Richardson), [email protected] (F.P. Vasvari).
Please cite this article in press as: Clarkson, P. M. et al., Reving, Organizations and Society (2007), doi:10.1016/j.aos.200
Introduction
An unresolved research issue in environmentalaccounting is the empirical association betweenthe level (i.e., amount) of corporate environmentaldisclosures and corporate environmental perfor-mance (Al-Tuwaijri, Christensen, & Hughes,
ed.
isiting the relation between environmental ..., Account-7.05.003
1 Patten (2002) was aware of the problem of non-discretion-ary disclosures in annual reports and dropped litigationdisclosures as a partial attempt to deal with this (see p. 768).
2 P.M. Clarkson et al. / Accounting, Organizations and Society xxx (2007) xxx–xxx
ARTICLE IN PRESS
2004; Hughes, Anderson, & Golden, 2001; Patten,2002). Accounting standard setters and securitiesregulators are increasingly being made aware ofdeficiencies in corporate environmental disclosures(Beets & Souther, 1999; Chan-Fishel, 2002;Franco, 2001). The results of previous studies onthe relation between corporate environmental per-formance and environmental disclosure in finan-cial reports have been mixed. Patten (2002)attributes the failure to find a significant and con-sistent relation between environmental perfor-mance and environmental disclosure to problemsin the research designs of existing research. Theseproblems include failure to control for other fac-tors associated with the level of environmentaldisclosure, inadequate sample selection, and inad-equate measures of environmental performanceand disclosure.
This study seeks to revisit the relation betweenenvironmental performance and the level of envi-ronmental disclosure using a more rigorousresearch design. We test two competing predic-tions about the level of voluntary environmentaldisclosures. Voluntary disclosure theory (Dye,1985; Verrecchia, 1983) predicts a positive associa-tion between environmental performance and thelevel of discretionary environmental disclosure.The notion is that superior environmental per-formers will convey their ‘‘type’’ by pointing toobjective environmental performance indicatorswhich are difficult to mimic by inferior type firms.Inferior performers will choose to disclose less orto be ‘‘silent’’ on their environmental performance,thus being placed in a pool of firms where inves-tors and other users ascribe the ‘‘average type’’to that pool. What sustains this partial disclosureequilibrium is proprietary costs associated withdisclosure about environmental performance (Ver-recchia, 1983) and uncertainty as to whether thefirm is informed regarding its type (Dye, 1985).
Socio-political theories including political econ-omy, legitimacy theory, and stakeholder theory(Patten, 2002), on the other hand, predict a negativeassociation between environmental performanceand the level of discretionary environmental disclo-sures. These overlapping theories suggest thatsocial disclosure is a function of social and politicalpressures facing the corporation. To the extent that
Please cite this article in press as: Clarkson, P. M. et al., Reving, Organizations and Society (2007), doi:10.1016/j.aos.200
poor environmental performers face more politicaland social pressures and threatened legitimacy,they will attempt to increase discretionary environ-mental disclosures to change stakeholder percep-tions about their actual performance. Thus, wehave competing directional predictions from alter-native theories, and the observed direction of asso-ciation between environmental performance andthe level of discretionary disclosures will eliminateone of the two predictions.
The predictions of the above theories relate todiscretionary, not mandatory, environmental dis-closures. Previous studies assessed environmentaldisclosures mainly from annual reports and otherregulatory filings such as 10 Ks and many of thosestudies rely on a Wiseman (1982) based contentanalysis index to measure the extent of environ-mental disclosures. The Wiseman index focuseson the financial consequences of corporate envi-ronmental activities and puts more weight onquantitative disclosures. Using this measure, poorenvironmental performers may actually havehigher disclosure scores than good performersbecause they have greater exposures and must dis-cuss any material financial information in theirregulatory filings such as annual reports and10 Ks. This may partially explain the inconclusivefindings in the previous literature and why Patten(2002) finds a negative relation between environ-mental disclosure and a toxics release inventory(TRI) based environmental performanceindicator.1
In collaboration with an environmental disclo-sure expert, we develop a content analysis indexbased on the global reporting initiative guidelines(GRI) to assess the level of discretionary environ-mental disclosures in environmental and socialresponsibility reports or similar disclosures pro-vided on the firm’s web site. This index differs fromWiseman (1982) index, previously used in the liter-ature, because we focus on firm disclosures relatedto its commitment to protect the environment. Ourindex potentially allows investors, regulators, and
isiting the relation between environmental ..., Account-7.05.003

P.M. Clarkson et al. / Accounting, Organizations and Society xxx (2007) xxx–xxx 3
ARTICLE IN PRESS
environmental stakeholder groups to infer envi-ronmental performance ‘‘type’’ from the disclosurescore. This is valuable to users who seek to assessthe firms’ true environmental commitment andrelated environmental exposures.
We focus on the 2003 environmental disclosuresof 191 firms drawn from five industries: Pulp andPaper, Chemicals, Oil and Gas, Metals and Min-ing, and Utilities. These five industries are consid-ered to have a high pollution propensity and havecollectively been the subject of a whole range ofenvironmental regulations in the US in the past30 or more years. The magnitude of the environ-mental spending by these industries to complywith the environmental regulations and the impactof their operations on the natural environmentshould be a major concern to investors and otherenvironmental stakeholder groups. Thus, firms inthese industries collectively form an ideal sampleto test the competing predictions of voluntary dis-closure and socio-political theories.
In brief, our results are as follows. We find apositive association between environmental per-formance and the level of discretionary disclosuresin environmental and social reports or related webdisclosures. In other words, superior environmen-tal performers are more forthcoming in truly dis-cretionary disclosure channels, as predicted bythe economics based voluntary disclosure theory.Our result is inconsistent with the prediction of anegative association arising from socio-politicaltheories such as legitimacy theory and stakeholdertheory. Further, using the Janis–Fadner coefficientof imbalance as a direct measure of perceived legit-imacy, we fail to observe the negative associationbetween legitimacy and the level of disclosuresimplied by socio-political theories.2 Thus, ourresults suggest that socio-political theories arenot robust in predicting the level of discretionaryenvironmental disclosures.
We do, however, find that socio-political theo-ries are helpful in predicting what is being said,
2 The Janis–Fadner coefficient of imbalance measures thepropensity of a firm’s prior year press articles pertaining to theenvironment to be unfavorable. See section ‘Other controlvariables specific to environmental disclosures’ for a detaileddefinition.
Please cite this article in press as: Clarkson, P. M. et al., Reving, Organizations and Society (2007), doi:10.1016/j.aos.200
which moves the focus of enquiry beyond the sim-ple level of discretionary disclosure. Using theratio of soft disclosure scores to total awardedscores as a proxy for ‘‘legitimization’’, we showthat firms with unfavorable prior year media cov-erage are more likely to make soft claims to becommitted to the environment which are not read-ily verifiable. This behavior is not predicted byeconomic disclosure theories, which assumetruth-telling. Thus, socio-political theories doindeed explain additional patterns in the data.
The paper is organized as follows. Following lit-erature review and hypothesis development, wedescribes our content analysis disclosure indexand the measures of environmental performancewhich we use in the study. We then present oureconometric model and preliminary empirical evi-dence. The sections ‘Empirical results involvingthe level of disclosure’ and ‘A revised role forsocio-political theories’ contain the main resultsfollowed by sensitivity analysis. The final sectionsummarizes the main findings of the study with adiscussion of implications for future research.
Literature review and hypothesis development
Literature review
The existing literature in environmentalaccounting research can be categorized into threebroad groups. The first group of studies examinesthe valuation relevance of corporate environmen-tal performance information and has found thatsuch information is valuable to investors seekingto assess environmental liabilities in different set-tings.3 The second line of literature examines fac-tors affecting managerial decisions to disclosepotential environmental liabilities. This group ofstudies finds that there are strategic factors affect-ing firms’ decisions to disclose environmentalliability information, especially when disclosures
3 See Cormier, Magnan, and Morard (1993), Blacconiereand Patten (1994), Barth and McNichols (1994), Cormier andMagnan (1997), Li and McConomy (1999), Richardson andWelker (2001), & Clarkson, Li, and Richardson (2004).
isiting the relation between environmental ..., Account-7.05.003

5 Many environmental disclosure studies since then rely on
4 P.M. Clarkson et al. / Accounting, Organizations and Society xxx (2007) xxx–xxx
ARTICLE IN PRESS
are discretionary.4 A third line of studies, onewhich we discuss in the following paragraphs sinceit is most relevant to this study, explores the rela-tion between environmental disclosures and envi-ronmental performance.
Ingram and Frazier (1980) examine the associa-tion between the content of corporate environmen-tal disclosure and corporate environmentalperformance. The study was concerned with a lackof corporate social responsibility disclosures inannual reports due to their voluntary nature. Theauthors scored environmental disclosures in 20pre-selected content categories along four dimen-sions; evidence, time, specificity, and theme.Ingram and Frazier (1980) proxied environmentalperformance by a performance index devised bythe Council on Economic Priorities (CEP), anon-profit organization specializing in the analy-sis of corporate social activities. Forty firmswere selected from the 50 firms that were moni-tored by the CEP. Regression results indicatedno association between environmental disclosureand environmental performance, consistent withauthors’ prior expectation about an overall poorquality of environmental disclosures in annualreports.
Wiseman (1982) examines the extent of volun-tary environmental disclosures made by corpora-tions in their annual reports using a researchdesign almost identical to Ingram and Frazier(1980). The study focuses on the 26 largest UScompanies that were monitored by the CEP forthe 1972–1976 period. Wiseman designed an envi-ronmental disclosure index covering 18 items infour categories: economic factors (5 items), envi-ronmental litigation (2 items), pollution abatementactivities (5 items), and environmental disclosuresthat do not fall into the other three (6 items). Inaddition, Wiseman assigned a score to each itembased on whether the disclosure is quantitative orqualitative (3 for quantitative disclosure, 2 fornon-quantitative disclosure, 1 for mentioning ingeneral terms, 0 for no disclosure).5 The CEP
4 See Patten (1992), Li, Richardson, and Thornton (1997),Barth, McNichols, and Wilson (1997), Li and McConomy(1999), & Aerts, Cormier, and Magnan (2006).
Please cite this article in press as: Clarkson, P. M. et al., Reving, Organizations and Society (2007), doi:10.1016/j.aos.200
rankings were used as a proxy for environmentalperformance. Spearman rank order correlationindicates that there is no significant associationbetween the CEP environmental performancerankings and the Wiseman environmental disclo-sure index rankings.
Freedman and Wasley (1990) examine the rela-tionship between corporate pollution performanceand pollution disclosures made in annual reportsand 10 K reports filed with the SEC. Their sampleconsists of 50 US companies in four industries(Steel, Oil, Pulp and Paper, Electric Utilities).Again, the CEP rankings are used as a proxy forenvironmental performance. The authors measureenvironmental disclosures in both annual and10 K reports using the same indexing proceduredeveloped by Wiseman (1982). Spearman rankorder correlation tests are conducted to examinethe associations both between annual report dis-closure indices and the CEP indices, and between10 K disclosure indices and the CEP indices. Theresults indicate that neither annual report environ-mental disclosures nor the 10 K environmentaldisclosures are indicative of firms’ actual environ-mental performance.
Bewley and Li (2000) examine factors associ-ated with the environmental disclosures in Canadafrom a voluntary disclosure theory perspective.The authors measure environmental disclosuresby 188 Canadian manufacturing firms in their1993 annual reports using the Wiseman index. Afirm’s pollution propensity (i.e., environmentalperformance) is proxied by their industry member-ship and by whether they report to the Ministry ofEnvironment under the National PollutionRelease Inventory program. The study finds thatfirms with more news media coverage of their envi-ronmental exposure, higher pollution propensity,and more political exposure are more likely to dis-
the Wiseman index in order to measure the extent of corporateenvironmental disclosures. Few recognize the fact that theWiseman index places a heavy weight on the financial conse-quences of corporate environmental activities, most of whichare required disclosures in 10 Ks for public companies regis-tered with the SEC.
isiting the relation between environmental ..., Account-7.05.003

P.M. Clarkson et al. / Accounting, Organizations and Society xxx (2007) xxx–xxx 5
ARTICLE IN PRESS
close general environmental information, suggest-ing a negative association between environmentaldisclosures and environmental performance.
Hughes et al. (2001) examine environmental dis-closures made by 51 US manufacturing firms for1992 and 1993. Again, the authors use a slightlymodified Wiseman index to measure environmen-tal disclosures made within the President’s letter,MD&A, and note section, and then assess whetherenvironmental disclosures are consistent with envi-ronmental performance ratings (good, mixed, andpoor) by the CEP. Although the study finds no dif-ference in environmental disclosures between goodand mixed groups, firms rated as poor environ-mental performers by the CEP tend to make sub-stantially more environmental disclosures underthe Wiseman disclosure index. The authors attri-bute this finding to increased scrutiny in 1992and 1993 by the FASB and SEC with respect toenvironmental disclosures, which forces poor per-formers to make more disclosure as they are sub-ject to more remediation activities.
Patten (2002) identifies three issues in the previ-ous studies in this area; (1) failure to control forother factors, (2) inadequate sample selection;and (3) inadequate measures of environmental per-formance. Since the CEP only followed a smallgroup of firms in only four industries, reliance onthe CEP for sample selection may be problematic.In addition, the CEP did not use the same criteriaand consistent methodology to assess corporateenvironmental performance in different industries.To overcome this issue, Patten uses TRI data, nor-malized by sales, to proxy for environmental per-formance. Using a sample of 131 US firms from24 different industries, and a modified Wisemanindex measure and line count of environmentaldisclosures in 1990 annual reports, Patten findsthat TRI/sales are positively associated with bothmeasures of environmental disclosures, suggestinga negative relation between environmental perfor-mance and environmental disclosures.
More recently, Al-Tuwaijri et al. (2004) explorethe relations among environmental disclosure,environmental performance and economic perfor-mance using a simultaneous equations approach.Similar to Patten (2002) and Al-Tuwaijri et al.(2004) use TRI based data to assess environmental
Please cite this article in press as: Clarkson, P. M. et al., Reving, Organizations and Society (2007), doi:10.1016/j.aos.200
performance. Specifically, they assess environmen-tal performance as the percentage of total wastegenerated that is recycled. The authors measureenvironmental disclosure using a content analysisin four categories (potential responsible parties’designation, toxic waste, oil and chemical spills,and environmental fines and penalties). These dis-closures are largely non-discretionary, in contrastto the discretionary disclosures which we examine.They find a positive association between environ-mental performance and environmental disclosure.
In summary, the existing studies find mixedresults on the relation between environmental dis-closure and environmental performance. One rea-son for the inconclusive findings is due to thechoice of non-discretionary disclosure channelsand use of the Wiseman (1982) index. It is self evi-dent that, as environmental problems and expo-sures increase, non-discretionary disclosures inregulated channels such as annual reports and10 Ks should increase. Thus, a negative associa-tion between environmental performance and con-tent analysis scores in annual reports and 10 Ksmay be driven by non-discretionary disclosures.The disclosure theories reviewed in the next sec-tion, on the other hand, apply to discretionary dis-closures. Thus, inferences about the robustness ofthese theories are confounded when the disclosuremedia are formal channels like the annual reportand the 10 K. Adding to this problem is the heavyweight the Wiseman index places on disclosuresabout the financial consequences of environmentalactivities, whereas our index places more weight ondisclosures that reveal true (but unobservable)environmental performance. By focusing exclu-sively on environmental and social responsibilityreports or similar disclosures on firms’ web sites,locations where disclosures are purely discretion-ary, and with an index that aims at revealing per-formance ‘‘type’’, we enhance the reliability ofinferences about the true direction of associationbetween environmental performance and discre-tionary disclosure.
Hypothesis development
The voluntary disclosure literature suggests thatcompanies have incentives to disclose ‘‘good
isiting the relation between environmental ..., Account-7.05.003
6 P.M. Clarkson et al. / Accounting, Organizations and Society xxx (2007) xxx–xxx
ARTICLE IN PRESS
news’’ to differentiate themselves from companieswith ‘‘bad news’’ in order to avoid the adverseselection problem (Dye, 1985; Verrecchia, 1983).While these theories do not pertain to environmen-tal performance per se, they are applied to this set-ting by Bewley and Li (2000) and Li et al. (1997).Companies with superior environmental perfor-mance due to their proactive environmental strat-egy have incentives to inform investors and otherstakeholders of their strategy by voluntarily dis-closing more environmental information. Put sim-ply, they seek to reveal their performance type,something not directly observable to investorsand other stakeholders, through direct voluntarydisclosures that cannot be easily mimicked by poorenvironmental performers. In doing so, theypotentially increase firm valuation since knowl-edgeable investors will infer that exposures andlatent environmental liabilities are lower for goodas opposed to poor environmental performers.6
Thus, voluntary disclosure theory predicts apositive association between environmental per-formance and the level of discretional environmen-tal disclosure.
Turning to the predictions of socio-political the-ories, Gray, Kouhy, and Lavers (1995) and Lindb-lom (1994) argue that companies whose sociallegitimacy is threatened have incentives to increaseenvironmental disclosures to: (1) educate andinform relevant publics about (actual) changes intheir performance, (2) change perceptions abouttheir performance, (3) deflect attention from theissue of concern by highlighting other accomplish-ments, and (4) seek to change public expectationsof their performance.7 According to Patten (2000,2002), socio-political theories predict a negative
6 The assumption that environmental performance ‘‘type’’ isnot readily observable to investors and other stakeholders issupported by the difficulties environmental researchers havehad obtaining reliable measures of environmental performancethat are comparable across companies in the same industry andacross industries (see Al-Tuwaijri et al., 2004 & Ilinitch,Soderstrom, & Thomas, 1998).
7 Socio-political theories include political economy, legiti-macy theory and stakeholder theory (see Patten, 2002). We donot differentiate them in this study as they have the sameprediction with respect to the relation between environmentalperformance and environmental disclosure.
Please cite this article in press as: Clarkson, P. M. et al., Reving, Organizations and Society (2007), doi:10.1016/j.aos.200
association between corporate environmental per-formance and level of discretional environmentaldisclosure. Thus, the two competing theories pro-vide opposite predictions on how environmentalperformance may affect discretionary environmen-tal disclosure strategies. Our hypotheses now fol-low (stated in the alternate form):
H1a: Environmental performance and the level ofdiscretionary environmental disclosures arepositively associated, as implied by econom-ics based voluntary disclosure theories.
H1b: Environmental performance and the level ofdiscretionary environmental disclosures arenegatively associated, as implied by thesocio-political theories.
Research design
Environmental performance indicators
A key research design issue in this study is todevelop a reliable proxy for a firm’s environmentalperformance. The difficulty in assessing environ-mental performance is well documented in the lit-erature (see, for example, Ilinitch et al., 1998).Since we seek to assess relative environmental per-formance in this study, we follow the existing liter-ature and develop our relative environmentalperformance proxy using the actual pollution dis-charge data from the US Environmental Protec-tion Agency’s (EPA) TRI database (King &Lenox, 2001). Specifically, we first aggregate thetotal toxic releases (in pounds) and the toxic wastetreated or processed for each of our sample firmsin 2003, as reported by the EPA in 2005 (EPAannually reports the data at the plant level, witha two year lag). To verify the accuracy of ouraggregation procedure, we compared the TRImeasures obtained at the firm level with those pro-vided by the Investor Responsibility ResearchCenter in their proprietary database. We foundthat the differences were minor.
Our first measure is the total toxic waste that istreated, recycled or processed as a percentage ofthe total toxic waste generated by each firm (%recycled). This measure is similar to the one used
isiting the relation between environmental ..., Account-7.05.003

9 As anecdotal evidence in support of this argument, Green-
P.M. Clarkson et al. / Accounting, Organizations and Society xxx (2007) xxx–xxx 7
ARTICLE IN PRESS
by Al-Tuwaijri et al. (2004). We supplement ouranalysis with an alternative measure, the ratio ofTRI to total firm sales. This gives us pounds oftoxic releases per thousand dollars of sales for eachof our sample firms (TRI/sales). However, if firmsare not homogenous in terms of production pro-cesses within one of our five industries (Pulp andPaper, Chemicals, Oil and Gas, Metals and Min-ing, and Utilities), such that TRI/Sales is notdirectly comparable across firms in that industry,the recycling measure reduces this noise and facil-itates pooling.
Since industry pollution propensity differs sig-nificantly, we alternatively rank the above twomeasures within each industry. Thus, the %Recy-cled ranks and TRI/sales ranks are our proxiesfor a firm’s relative performance within its indus-try. Similar relative performance measures are alsoused in Clarkson et al. (2004).
Environmental disclosure index
As discussed in section ‘Literature review andhypothesis development’, from the economic the-ory perspective, superior environmental perfor-mance (EP) types are hypothesized to seekcredible direct disclosures to reveal their (unob-servable) performance type. A crucial property ofthese disclosures is that they focus on objective,‘‘hard’’ measures that cannot be easily mimickedby poor environmental performers. Thus, reliableinferences about theories like Verrecchia (1983)and Dye (1985) require a content analysis disclo-sure index that puts a heavy emphasis on objectivemeasures of performance as opposed to soft (i.e.,not easily verifiable) claims to be committed tothe environment.8 As a simple example, considera good and a poor EP type firm in the same indus-try. The good EP firm will voluntarily discloseobjective measures of environmental impact (e.g.,quantitative environmental performance indica-tors) and will benchmark its performance relativeto the industry, something the poor EP firm willnot want to do. Thus, the good EP firm will
8 For a related discussion on the need for objective andverifiable disclosures to achieve the separation predicted byVerrecchia (1983) see Hutton, Miller, and Skinner (2003).
Please cite this article in press as: Clarkson, P. M. et al., Reving, Organizations and Society (2007), doi:10.1016/j.aos.200
emphasize discretionary disclosures that are hardto mimic. We assume these hard disclosures aretruthful, in that a firm would face litigation expo-sure if caught lying by informed stakeholders insocial responsibility reports or web relateddisclosures.9
What is striking in all this is that there is ademand by environmental stakeholders for pre-cisely the same thing: hard, objective measures ofenvironmental performance in social responsibilityreports, so that poor EP performers cannot mimicgood EP performers by soft, unverifiable claims tobe committed to the environment. Indeed, goodEP performers and environmental stakeholdershave joined forces to develop standards for firmspreparing social responsibility reports that put apremium on hard, objective measures.
The Global Reporting Initiative (GRI) waslaunched in 1997 as a joint initiative of Coalitionfor Environmentally Responsible Economies, aUS non-government organization and the UnitedNations Environmental Program. The overall goalof the initiative is to develop a globally acceptedreporting framework to enhance the quality, rigor,and utility of sustainability reporting (GlobalReporting Initiative, 2002). The GRI Guidelinesfollow 11 principles (transparency, inclusiveness,auditability, completeness, relevance, sustainabil-ity context, accuracy, neutrality, comparability,clarity, and timeliness) to ensure that sustainabilityreports (1) present a reasonable and balancedaccount of economic, environmental, and socialperformance, (2) facilitate comparison over timeand across organizations, and (3) credibly addressissues of concerns to stakeholders. The first set ofGRI Guidelines was published in 1999 as an Expo-sure Draft and several revisions have followedsince then. For the purpose of this study, we relyon the GRI Sustainability Reporting Guidelinespublished in 2002.
peace issued a press release on October 14, 1994 accusingMacMillan Bloedel of deliberately lying to the public byclaiming that, in 25 years, the company had been convicted ofonly 15 environmental offenses. Greenpeace identified 26convictions in the last four years.
isiting the relation between environmental ..., Account-7.05.003

8 P.M. Clarkson et al. / Accounting, Organizations and Society xxx (2007) xxx–xxx
ARTICLE IN PRESS
We engaged an expert in the field of environ-mental reporting to help us develop a content anal-ysis index suitable for firms’ sustainability reportsor the corresponding sections of a broad socialresponsibility report or equivalent discussions onthe web.10 From the outset, we agreed that theconstruct we seek to measure is the extent of afirm’s disclosure in their sustainability report.With this aim established, the expert convincedus that the GRI reporting guidelines are consistentwith that purpose. Thus, the expert helped usdevelop a scoring model containing 95 line itemsthat reflect the spirit of the GRI guidelines. Table1 contains the scoring model with a reference tothe corresponding section in the GRI guidelines.
Our disclosure index follows closely the report-ing requirements of the GRI guidelines for the fol-lowing reasons. Firms do not have to preparesocial responsibility reports or related web baseddisclosures discussing their environmental impacts,and if they voluntarily do so, they do not have toadopt the GRI guidelines. The voluntary decisionby a firm to both prepare a social responsibilityreport and use the GRI guidelines means that thefirm has opted for a format (the GRI format) that,by the intent of the GRI guidelines, will result inhard disclosures not easily mimicked by the poorEP types. Thus, a firm making a sincere attemptto use the GRI guidelines will score high usingour content analysis index, which is precisely theresult we seek (i.e., the poor EP types will not wantto conform to GRI guidelines that place a pre-mium, for example, on objective environmentalperformance indicators). Of the 95 equallyweighted items in our disclosure index, 79 relateto ‘‘hard’’ disclosure measures compared to only16 for ‘‘soft’’ disclosure items, a proportion which(according to the expert who helped us developingthe index) reflects the spirit of the GRI guidelines.
10 Alan Willis, CA, Project Director – Performance ReportingInitiatives, The Canadian Institute of Chartered Accountants.He was a member of the GRI Steering Committee since itsinception, and has been a member of the GRI Guidelinesdevelopment and revision working groups from 1998 to date.He is also a judge for the Canadian Institute for CharteredAccountants’ Corporate Reporting Awards.
Please cite this article in press as: Clarkson, P. M. et al., Reving, Organizations and Society (2007), doi:10.1016/j.aos.200
We now turn to discuss our disclosure index inmore detail. Our disclosure index consists of sevenbroad categories, A1–A7, of environmental disclo-sures (see Table 1). We consider A1–A4 and A5–A7 to represent ‘‘hard’’ and ‘‘soft’’ environmentaldisclosures, respectively.
To score environmental disclosures in discre-tionary channels and web related disclosures, weaccessed the internet web site of each sample firmand identified its environmental report, if any,and any web based environmental disclosures.We saved all such disclosures as of September2004. This arbitrary choice of timing worked outwell for us as all firms discussed their fiscal 2003environmental performance in the environmentalreports and related web based disclosures whichwe obtained.
Hard disclosure items
Category A1 focuses on disclosures pertainingto a firm’s governance structure and managementsystems put in place with respect to environmentalprotection. For instance, firms whose Board ofDirectors have an environmental committee orhave implemented ISO 14001 will inform theirstakeholders of such commitments. A2 focuseson the credibility of a firm’s disclosures in its envi-ronmental report. Firms that obtained indepen-dent verification of their environmental reports,and firms with their products and environmentalprograms certified by independent agencies andthird parties will receive higher scores in this cate-gory. In A3, we assess the extent to which firmsdisclose specific environmental performance indi-cators, both about their actual pollution emissionsand their conservation and recycling efforts. Theseare the ‘‘hard’’ data that firms can disclose to con-vince stakeholders about their environmental com-mitments. In addition, we also award scores whenfirms disclose performance indicators with respectto historical trends, the firms’ own emission reduc-tion targets, and the industry average. Disclosingactual performance indicators in the above contextcan convey critical information for stakeholders toassess the firm’s long-term environmental perfor-mance (and commitments).
The final category in the ‘‘hard’’ disclosuregroup is A4, which reflects a firm’s environmental
isiting the relation between environmental ..., Account-7.05.003
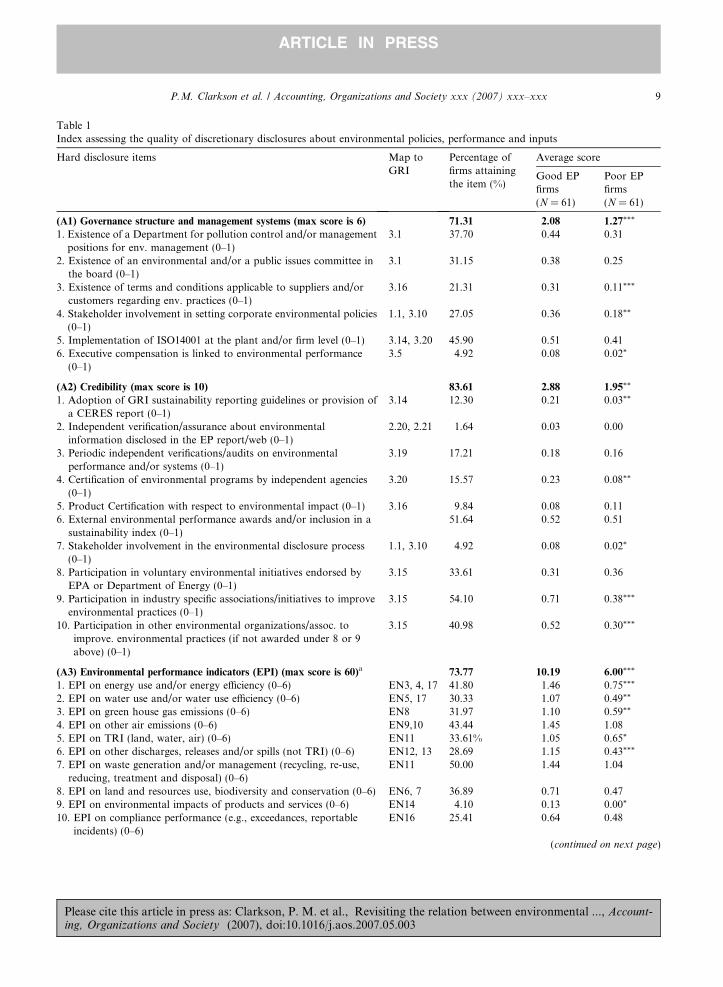
Table 1Index assessing the quality of discretionary disclosures about environmental policies, performance and inputs
Hard disclosure items Map toGRI
Percentage offirms attainingthe item (%)
Average score
Good EPfirms(N = 61)
Poor EPfirms(N = 61)
(A1) Governance structure and management systems (max score is 6) 71.31 2.08 1.27***
1. Existence of a Department for pollution control and/or managementpositions for env. management (0–1)
3.1 37.70 0.44 0.31
2. Existence of an environmental and/or a public issues committee inthe board (0–1)
3.1 31.15 0.38 0.25
3. Existence of terms and conditions applicable to suppliers and/orcustomers regarding env. practices (0–1)
3.16 21.31 0.31 0.11***
4. Stakeholder involvement in setting corporate environmental policies(0–1)
1.1, 3.10 27.05 0.36 0.18**
5. Implementation of ISO14001 at the plant and/or firm level (0–1) 3.14, 3.20 45.90 0.51 0.416. Executive compensation is linked to environmental performance
(0–1)3.5 4.92 0.08 0.02*
(A2) Credibility (max score is 10) 83.61 2.88 1.95**
1. Adoption of GRI sustainability reporting guidelines or provision ofa CERES report (0–1)
3.14 12.30 0.21 0.03**
2. Independent verification/assurance about environmentalinformation disclosed in the EP report/web (0–1)
2.20, 2.21 1.64 0.03 0.00
3. Periodic independent verifications/audits on environmentalperformance and/or systems (0–1)
3.19 17.21 0.18 0.16
4. Certification of environmental programs by independent agencies(0–1)
3.20 15.57 0.23 0.08**
5. Product Certification with respect to environmental impact (0–1) 3.16 9.84 0.08 0.116. External environmental performance awards and/or inclusion in a
sustainability index (0–1)51.64 0.52 0.51
7. Stakeholder involvement in the environmental disclosure process(0–1)
1.1, 3.10 4.92 0.08 0.02*
8. Participation in voluntary environmental initiatives endorsed byEPA or Department of Energy (0–1)
3.15 33.61 0.31 0.36
9. Participation in industry specific associations/initiatives to improveenvironmental practices (0–1)
3.15 54.10 0.71 0.38***
10. Participation in other environmental organizations/assoc. toimprove. environmental practices (if not awarded under 8 or 9above) (0–1)
3.15 40.98 0.52 0.30***
(A3) Environmental performance indicators (EPI) (max score is 60)a 73.77 10.19 6.00***
1. EPI on energy use and/or energy efficiency (0–6) EN3, 4, 17 41.80 1.46 0.75***
2. EPI on water use and/or water use efficiency (0–6) EN5, 17 30.33 1.07 0.49**
3. EPI on green house gas emissions (0–6) EN8 31.97 1.10 0.59**
4. EPI on other air emissions (0–6) EN9,10 43.44 1.45 1.085. EPI on TRI (land, water, air) (0–6) EN11 33.61% 1.05 0.65*
6. EPI on other discharges, releases and/or spills (not TRI) (0–6) EN12, 13 28.69 1.15 0.43***
7. EPI on waste generation and/or management (recycling, re-use,reducing, treatment and disposal) (0–6)
EN11 50.00 1.44 1.04
8. EPI on land and resources use, biodiversity and conservation (0–6) EN6, 7 36.89 0.71 0.479. EPI on environmental impacts of products and services (0–6) EN14 4.10 0.13 0.00*
10. EPI on compliance performance (e.g., exceedances, reportableincidents) (0–6)
EN16 25.41 0.64 0.48
(continued on next page)
P.M. Clarkson et al. / Accounting, Organizations and Society xxx (2007) xxx–xxx 9
Please cite this article in press as: Clarkson, P. M. et al., Revisiting the relation between environmental ..., Account-ing, Organizations and Society (2007), doi:10.1016/j.aos.2007.05.003
ARTICLE IN PRESS

Table 1 (continued)
Hard disclosure items Map toGRI
Percentage offirms attainingthe item (%)
Average score
Good EPfirms(N = 61)
Poor EPfirms(N = 61)
(A4) Environmental spending (max score is 3) 44.26 0.84 0.45**
1. Summary of dollar savings arising from environment initiatives tothe company (0-1)
23.77 0.30 0.18*
2. Amount spent on technologies, R& D and/or innovations to enhanceenviron. perf. and/or efficiency (0–1)
EN35 20.49 0.21 0.19
3. Amount spent on fines related to environmental issues (0–1) EN16 25.41 0.33 0.18**
Soft disclosure items Map toGRI
Percentage offirms attainingthe item (%)
Average score
Good EPfirms(N = 61)
Poor EPfirms(N = 61)
(A5) Vision and strategy claims (max score is 6) 95.90 3.48 3.04
1. CEO statement on environmental performance in letter toshareholders and/or stakeholders (0–1)
1.1, 1.2 61.48 0.69 0.54*
2. A statement of corporate environmental policy, values andprinciples, environ. codes of conduct (0–1)
1.1, 1.2,3.7
87.70 0.85 0.90
3. A statement about formal management systems regardingenvironmental risk and performance (0–1)
3.19 58.20 0.57 0.59
4. A statement that the firm undertakes periodic reviews and evaluations
of its environ. performance (0–1)3.19 37.70 0.47 0.27**
5. A statement of measurable goals in terms of future env. performance(if not awarded under A3) (0–1)
1.1, 1.2 27.05 0.31 0.22
6. A statement about specific environmental innovations and/or newtechnologies (0–1)
1.1, 1.2 54.92 0.58 0.52
(A6) Environmental profile (max score is 4) 70.49 1.49 1.23
1. A statement about the firm’s compliance (or lack thereof) withspecific environmental standards (0–1)
GN 8 32.79 0.38 0.28
2. An overview of environmental impact of the industry (0–1) GN 8 22.13 0.26 0.203. An overview of how the business operations and/or products and
services impact the environment. (0–1)GN 8 56.56 0.61 0.52
4. An overview of corporate environmental performance relative toindustry peers (0–1)
GN 8 24.59 0.26 0.23
(A7) Environmental initiatives (max score is 6) 72.95 1.93 1.34**
1. A substantive description of employee training in environmentalmanagement and operations (0–1)
3.19 30.33 0.39 0.21**
2. Existence of response plans in case of environmental accidents (0–1) 22.95 0.30 0.16*
3. Internal environmental awards (0–1) 13.11 0.18 0.084. Internal environmental audits (0–1) 3.19 3.20 34.43 0.38 0.315. Internal certification of environmental programs (0–1) 3.19 9.84 0.15 0.05*
6. Community involvement and/or donations related to environ. (if notawarded under A1.4 or A2.7) (0–1)
SO1,EC10
53.28 0.54 0.52
This table presents the index used to assess the discretionary disclosures about environmental policies, performance and inputs. Index itemsare classified in two categories: ‘‘hard’’ and ‘‘soft’’ disclosures. The second column presents the mapping of items in the index to the GlobalInitiative Reporting (GRI) guidelines. The third column presents the percentage of firms which made disclosures on that item (discretionarychannels considered are Environmental and/or Social Responsibility Reports, or similar disclosures in firms’ web site). Good environ-mental performance (EP) firms are firms that have the environmental performance measure (% recycled) above the industry median. Thelast two columns present the average score on each item for each group of firms. The significance levels presented in the last column are fromtwo-sample t-statistics that test the difference between the good and the poor group. ***, **, * represent significance levels (two-tailed) at 1%,5% and 10%, respectively. Wilcoxon Rank tests and t-tests with Bootstrap Resampling provided similar results. Sample size is 122 firms.
10 P.M. Clarkson et al. / Accounting, Organizations and Society xxx (2007) xxx–xxx
Please cite this article in press as: Clarkson, P. M. et al., Revisiting the relation between environmental ..., Account-ing, Organizations and Society (2007), doi:10.1016/j.aos.2007.05.003
ARTICLE IN PRESS

Table 1 (continued)a The scoring scale of environmental performance data is from 0 to 6. A point is awarded for each of the following items: (1)
Performance data is presented; (2) Performance data is presented relative to peers/rivals or industry; (3) Performance data is presentedrelative to previous periods (trend analysis); (4) Performance data is presented relative to targets; (5) Performance data is presentedboth in absolute and normalized form; (6) Performance data is presented at disaggregate level (i.e., plant, business unit, geographicsegment).
P.M. Clarkson et al. / Accounting, Organizations and Society xxx (2007) xxx–xxx 11
ARTICLE IN PRESS
spending. We do not score disclosures pertainingto environmental spending as a result of comply-ing with the existing environmental regulations,as such disclosures are largely non-discretionaryand appear in mandatory disclosure channels suchas 10 Ks and annual reports. Rather, we focus ondisclosures of dollar savings from existing environ-mental programs and efforts and discretionaryspending to further enhance future environmentalperformance such as investing in new environmen-tal technologies or environmentally related R&Dand innovations. We also include disclosures offines related to environmental issues. Such penal-ties are usually immaterial thus their reporting isnot mandatory. Nevertheless, the dollar amountof fines is important to environmental stakehold-ers to assess the level of true commitment to theenvironment. In summary, our index design inthe A1–A4 ‘‘hard’’ disclosure categories makes itrelatively difficult for poor environmental per-formers to mimic the environmental disclosuresof good environmental performers.
Soft disclosure items
We measure a firm’s disclosures of vision andenvironmental strategy claims in A5. For instance,firms often disclose broadly that they have an envi-ronmental policy, that management is committedto protecting the environment, etc. Such disclo-sures can be genuine when put in the specific con-text but they can also be deceiving as they lackcredibility and substantiation, and can be easilymimicked.11 A6 assesses the disclosure of a firm’s
11 Consider, for example, items A5-2, 3 and 5. We classifythese statements as soft because they involve claims aboutenvironmental management control systems without details orsubstantiation. In contrast, the corresponding items in A1-1and 2 are hard because they provide specific information aboutthe existence of the department, management positions orboard committees responsible for monitoring pollution control.
Please cite this article in press as: Clarkson, P. M. et al., Reving, Organizations and Society (2007), doi:10.1016/j.aos.200
environmental profile given the existing and forth-coming environmental regulations. Finally, wecode a firm’s disclosures of its environmental ini-tiatives in A7. Items coded here include employeetraining in environmental management, existenceof response plans for environmental accidents,internal environmental awards and audit, andcommunity involvement through scholarship anddonations. Again, these kinds of initiatives canrepresent true commitment but they can also beimitated by companies with no real commitmentsto protecting the environment.
Econometric model
Model and variable descriptions
In order to test our hypotheses, we employ thefollowing econometric model:
VED ¼ b0 þ b1EPþ b2J–F coefficientþ b3FIN
þ b4TOBIN Qþ b5VOLATþ b6ROA
þ b7LEVþ b8SIZEþ b9NEW
þ b10CAPINþ e
The variables in the regression above are definedas follows:
VED – is a score of voluntary environmentaldisclosures using web based disclosures as of Sep-tember, 2004. We perform a content analysis usingour disclosure index (see Table 1).
EP – is an environmental performance proxy.We use two alternative proxies to capture the envi-ronmental performance of each firm. The first is theTRI emission scaled by total sales revenue. Tofacilitate the interpretation of the results, wereverse the sign of this variable. In other words,the larger this measure is, the better the environ-mental performance of the firm. The second mea-sure is the percentage of toxic waste treated,
isiting the relation between environmental ..., Account-7.05.003

12 P.M. Clarkson et al. / Accounting, Organizations and Society xxx (2007) xxx–xxx
ARTICLE IN PRESS
recycled or processed in the production. Largerecycling percentages imply environmentally pro-active firms. Both measures are computed usingthe public database made available by the US Envi-ronmental and Protection Agency (EPA). Weaggregate the plant specific data at the firm level.
J–F coefficient – the Janis–Fadner coefficient ofimbalance, measured for the firm’s 2002 fiscal yearand defined in greater detail below.
FIN – is the amount of debt or equity capitalraised by the firm in the fiscal year 2004. It is thesale of common stock and preferred shares minusthe purchase of common stock and preferredshares (#108–#115) plus long term debt issuanceminus the long term debt reduction (#111–#114).12 The amount is scaled by the size of totalassets at the end of the fiscal year 2002.
TOBIN Q – is Tobin’s Q, measured as marketvalue of common equity (#25 * #199) plus bookvalue of preferred stock (#10), book value of longterm debt (#9) and current liabilities (#5), dividedby book value of total assets (#6).
VOLAT – is stock price volatility, measured asstandard deviation of market adjusted monthlystock return during fiscal year 2003.
ROA – is total return on assets measured as theratio of income before extraordinary items (#18)at the end of fiscal year 2004 and total assets(#6) at the end of fiscal year 2003.
LEV – is the leverage ratio, measured as theratio of total debt (#9 + #34) divided by totalassets (#6) at the end of fiscal year 2003.
SIZE – is the natural logarithm of the totalasset value measured as of the end of fiscal year2003.
NEW – is the asset newness, measured as a ratioof net properties, plant and equipment (#8)divided by the gross properties, plant and equip-ment (#7) at the end of fiscal year 2003.
CAPIN – is the capital intensity, measured as aratio of capital spending (#128) divided by totalsales revenues (#12) at the end of fiscal year 2003.
The control variables included in the multivari-ate regression model besides our environmental
12 Numbers in brackets represent data items in the CompustatAnnual File.
Please cite this article in press as: Clarkson, P. M. et al., Reving, Organizations and Society (2007), doi:10.1016/j.aos.200
performance (EP) measures have been docu-mented to be causes of voluntary disclosures inthe disclosure literature. We include them to avoida correlated omitted variables threat that EP isstanding in for some other well known determi-nants of disclosure in other disclosure channels.We divide the control variables in three groups:variables that proxy for the benefits of voluntarydisclosures, variables that measure costs of volun-tary disclosures and other control variables.
Benefits of voluntary disclosure
Financing: It is well known that firms that raisefinancing in debt and equity markets have a higherpropensity for disclosures in voluntary channels(Frankel, McNichols, & Wilson, 1995) to lowertheir cost of capital. We use the amount of debtand equity financing raised by the firm in the fiscalyear following the measurement of the environ-mental performance (FIN).
Information asymmetry: It is generally assertedin the voluntary disclosure literature that manag-ers seek to lower information asymmetry throughvoluntary disclosures in order to lower the costof capital (Healy & Palepu, 2001). Our chosenproxies for information asymmetry are: monthlystock return volatility measured (VOLAT) overthe 12 month period represented by fiscal 2003(Lim, 2001) and Tobin’s Q, based on the argumentthat firms with greater unbooked intangibles and apositive NPV investment opportunity set enjoylarger Tobin’s Q (Barth & Kasznik, 1999; Smith& Watts, 1992).
Firm performance: Lang and Lundholm (1993)and others have shown that firms with superiorupcoming earnings performance have a higher dis-closure propensity to reveal their ‘‘good news’’ tofinancial markets. At the time of observing webdisclosures (September 2004), markets wouldknow fiscal year 2003 ROA so earnings for theupcoming year would be fiscal 2004 ROA.
Leverage: A number of disclosure studies (e.g.,Leftwich, Watts, & Zimmerman, 1981) haveargued that the monitoring demand for informa-tion increases as firm debt increases, and empiricalevidence is consistent with managers being moreforthcoming, generally to facilitate the contracting
isiting the relation between environmental ..., Account-7.05.003

P.M. Clarkson et al. / Accounting, Organizations and Society xxx (2007) xxx–xxx 13
ARTICLE IN PRESS
demand for information. Agency costs of debt arehigher for firms with relatively more debt in theircapital structure (Jensen & Meckling, 1976), thusvoluntary disclosures are expected to increase withleverage.
Costs of voluntary disclosures
Firm Size: Most voluntary disclosure studiescontrol for firm size (see, for example, Lang &Lundholm, 1993) based on the assumption ofeconomies of scale with respect to informationproduction costs.13
Proprietary costs: In Verrecchia (1983), a keyfriction sustaining a partial disclosure equilibriumis the existence of proprietary costs associated withbeing forthcoming. In our setting, proprietarycosts pertain to the manager revealing informationto environmental regulators and other environ-mental activist groups that increase the probabilityof criticism, sanction or attack (see Li et al., 1997).We assume that industry serves as a measure ofproprietary costs, since pollution propensity andrelated monitoring by opponents is well knownto vary by industry. In our inter-industry regres-sions, we control for industry fixed effects in orderto control for differing proprietary costs and otherunidentified factors that might vary by industry.
Other control variables specific to environmental
disclosures
Equipment age and annual capital spending:
Healy and Palepu (2001) describe a common criti-cism in the voluntary disclosure literature involv-ing endogeneity. EP and sustainability disclosuresmight be joint endogenous variables driven bysome underlying exogenous variables such as the
13 Firm size has been regularly established as a determinant ofvoluntary disclosure in the literature, so its effects must becontrolled for. Firm size is marginally significant and positivelycorrelated with % recycled in the Chemical and Pulp and Paperindustries, but is insignificant for our other three industries. InTable 4, we control for firm size as a covariate to ensure thatour EP measures are not standing in for size. In Table 5, firmsize is once again a covariate in our model. Thus, the roleplayed by firm size in environmental disclosure is controlled forin both tables when we isolate effects due to EP.
Please cite this article in press as: Clarkson, P. M. et al., Reving, Organizations and Society (2007), doi:10.1016/j.aos.200
level of investments in clean technologies, thus rep-resenting a threat to causal inferences. Firms withnewer, cleaner technologies are likely to have asuperior environmental performance measure andit is reasonable to assume that they will wantstakeholders to know about this superior environ-mental performance in discretionary disclosurechannels. To address this threat, we control forthe average age of a firm’s equipment (NEW)based on the argument that newer equipment isexpected to employ newer and less polluting tech-nologies. For similar reasons, firms with highersustaining capital expenditures, as proxied byCAPIN, are expected to have newer equipmentand may want to signal their environmental typethrough more discretionary disclosures regardingtheir environmental performance.
Favorable media coverage: Following Aerts andCormier (2006), Bansal and Clelland (2004) andJanis et al. (1965), we measure lagged environmen-tal legitimacy as the propensity for unfavorablepress articles using the Janis–Fadner coefficientof imbalance. This coefficient ranges from �1(unfavorable) to +1 (favorable), with zero imply-ing neutral perceptions about the firm’s environ-mental legitimacy. Following Aerts and Cormier(2006) and Patten (2002), legitimacy theory pre-dicts a negative association between lagged envi-ronmental legitimacy and the level of voluntaryenvironmental disclosures.14 The Janis–Fadnercoefficient is measured as follows:
Janis–Fadner coefficient
¼ ðe2 � ecÞ
t2if e > c;
¼ ðec� e2Þt2
if c > e;
¼ 0 if e ¼ c;
14 In our sample of 191 firms, 126 have at least one article inFactiva database related to the environment in fiscal 2002. The126 firms generate 770 total articles related to the environmentduring fiscal 2002. Of these, 393, 207, and 170 are coded by usas unfavorable, neutral and favorable, respectively. For the 65firms with no environmental articles, the Janis–Fadner coeffi-cient is set to a default measure of zero. Thus, silence in themedia is interpreted to imply neutrality of perceptions aboutenvironmental legitimacy.
isiting the relation between environmental ..., Account-7.05.003

14 P.M. Clarkson et al. / Accounting, Organizations and Society xxx (2007) xxx–xxx
ARTICLE IN PRESS
where e is the number of favorable environmentalarticles, c is the number of unfavorable articles,and t is e + c.
Sample selection, summary statistics and univariate
empirical results
As mentioned in section ‘Introduction’, thesample of this study consists of public US compa-nies from five polluting industries that report toxicrelease data to the US Environmental ProtectionAgency and have financial and stock price datain the Compustat and CRSP database.15 The finalsample contains 191 firms covered by the EPA-TRI database for 2003 with adequate variablesavailable in Compustat and CRSP. The distribu-tion across the five industries is as follows: 27 firmsin the Pulp and Paper industry (14.14% of the sam-ple), 63 firms in the Chemical industry (32.98% ofthe sample), 18 firms in the Oil and Gas industry(9.42% of the sample), 42 firms in the Metals andMining industry (21.99% of the sample) and 41firms in the Utilities industry (21.47% of the sam-ple). Among these firms, 122 firms (63.87% ofthe sample) chose to provide discretionary disclo-sures about the environment in fiscal 2003: 55 ofthose firms had stand alone environmental reportsand invariably also had supplementary web disclo-sures, while the remaining 67 firms had discretion-ary web disclosures but no stand aloneenvironmental reports. If a firm has no environ-mental report or related discretionary web disclo-sures, we classify such a firm as being ‘‘silent’’,with the disclosure score set to zero for these 69firms.16 We allow silent firms in the sample sincenon-disclosure is a choice in a partial disclosureequilibrium setting.
15 We identify all firms with available TRI data and two-digitSIC codes: 26 (pulp and papers), 28 (chemicals), 29 (oil andgas), 33 (metals and mining), and 49 (utilities). For thesecompanies, we read the firm’s business descriptions anddropped companies that identify material business operationsin industries outside of their primary two-digit SIC code.16 We contacted the 69 firms with zero disclosures first by
email and then by phone. None of them indicated that theypublished a stand alone environmental report in 2003.
Please cite this article in press as: Clarkson, P. M. et al., Reving, Organizations and Society (2007), doi:10.1016/j.aos.200
For firms providing discretionary environmen-tal disclosures, Table 1 presents our scoring modelalong with descriptive statistics as to the percent-age of firms disclosing a particular item and thedifference in average disclosure scores across goodand poor EP firms. The table also shows the GRIreference for each line item. A crucial assumptionof our scoring approach is that the disclosures arediscretionary. In support of that assumption, weuse only disclosures that came from firm environ-mental reports (hereafter EP reports) or web baseddisclosures other than firm annual reports or10 Ks. We assume that EP reports/web disclosuresare purely discretionary, i.e., silence is always anoption.
In Table 1, A1–A4 summarize the separation inaverage awarded scores across good and poor EPperformers, using the %Recycled as the measureof environmental performance. We use the median% recycled in a given industry to classify firms asgood versus poor EP performers.17 Recall that,according to H1a, good EP performers shouldhave higher scores for hard disclosure items thatare difficult to mimic by poor EP performers.The results in Table 1 confirm that prediction forthe A1 category (Governance Structure and Man-agement Systems). The average score for good(poor) EP performers is 2.08 (1.27). Using a two-tailed t-test the difference is significant at the 1%level. For the A2 category (Credibility), the aver-age score for good (poor) EP performers is 2.88(1.95), and the difference is again significant atthe 5% level. Not surprisingly, good EP firms aremore likely to disclose that they adopt GRI guide-lines. The difference in average scores 0.21 versus0.03 is statistically significant at the 1% level. Itis apparent from the scores for A2-2 that 2(61 · 0.03) good EP firms obtained independentassurance for their ER report/web disclosurescompared to zero poor EP firms. While this is con-sistent with an attempt by good EP firms to signaltheir type, the difference between the two types offirms is not statistically significant.
17 Our results in Table 1 are qualitatively unaffected when wepartitioned the sample using the mean % recycled.
isiting the relation between environmental ..., Account-7.05.003

18 An alternative interpretation of our results for fines disclo-sures is that the firms disclosing such fines are seeking tolegitimize the violation of environmental regulation andrequirements. This pattern of disclosure behaviour is predictedby legitimacy theory (Patten, 2000). We leave the validation ofthis alternative explanation to future research.
P.M. Clarkson et al. / Accounting, Organizations and Society xxx (2007) xxx–xxx 15
ARTICLE IN PRESS
Of special interest is category A3 (EPI indica-tors), since this type of hard disclosure is not onethat poor EP firms will want to mimic. The aver-age score for Good EP performers of 10.19 is wellin excess of the corresponding average score forpoor EP performers, 6.00 (the difference is signifi-cant at the 1% level). Each item has a total score of6 based on the dimensions indicated in Table 1.The low scores for both good and poor EP per-formers suggest that disclosures in this area areless than ideal given the GRI guidelines. In unta-bulated analyses, we analyzed the contribution ofeach of the 6 dimensions to the total scores (i.e.,‘‘hits’’) awarded in A3, for good versus poor EPfirms: performance data presented represents43.50% (48.44%) of total A3 scores awarded forgood (poor) EP firms, respectively; performancedata presented relative to peers represents only1.06% (2.44%) of total A3 scores awarded for good(poor) EP firms, respectively; trend analysis repre-sents 28.86% (26.33%) of total A3 scores awardedfor good (poor) EP firms, respectively; perfor-mance relative to targets represents 8.76%(7.31%) of total A3 scores awarded, for good(poor) EP firms, respectively; performance datapresented in both absolute and normalized formrepresents 7.87% (8.63%) of total A3 scoresawarded, for good (poor) EP firms, respectively;and, finally, performance data presented at thedisaggregated level represents 9.64% (6.68%) oftotal A3 scores awarded, for good (poor) EP firms,respectively. Thus, it is apparent that GRI guide-lines with respect to performance relative to peersare not being followed by either good or poor EPperformers. This is not surprising, as it is difficultfor both types of firms to decide on appropriate‘‘peers’’ given differences in production processesacross firms within a given industry. It is preciselythis dilemma that makes relative environmentalperformance ‘‘unobservable’’ to the typical inves-tor or stakeholder, creating the potential for thesetting of a partial disclosure equilibrium wheresome firms are more transparent than others intheir report/web disclosures, and some firms areentirely silent.
The final hard category is A4 (disclosures per-taining to discretionary environmental spending).For that category, the average score for good
Please cite this article in press as: Clarkson, P. M. et al., Reving, Organizations and Society (2007), doi:10.1016/j.aos.200
(poor) EP performers is 0.84 (0.45). The differencebetween the good and poor groups is significant at5%. In this category we find that, on average, goodEP firms disclose significantly more often amountsspent on fines than the poor firms. Economicsbased voluntary disclosure theories predict thatgood EP firms will be more forthcoming aboutthe dollar amount spent on fines because thisamount will be lower than the correspondingamount for poor EP firms, consistent with supe-rior environmental performance within the indus-try. To validate that disclosing the amount spenton fines signals a firm’s commitment to the envi-ronment, we examine the dollar amount spent onfines and the number of environmental violationsin fiscal year 2000 for the 100 of our sample firms(56 good EP firms and 44 poor EP firms) coveredin the Corporate Environmental Profile Databasedeveloped by the Investor Responsibility andResearch Center. In untabulated results, we findthat the fifty-six good EP firms had an averageof 1.13 violations per firm and 0.17 cents of finesper thousand of dollars of sales. In comparison,the forty four poor EP firms had an average of2.63 violations per firm and 0.42 cents of finesper thousand dollars of sales. Using a two-tailedt-test, the difference in the number of violations(scaled dollar fines) between the two groups is sta-tistically significant at 0.02 (0.01) level.18
Table 1 contains corresponding statistics for thesoft disclosure categories A5–A7. Consistent withH1a, good EP performers have significantlygreater soft discretionary disclosures for A7 (envi-ronmental initiatives) relative to poor EP perform-ers. However, there is no significant difference forA5 (vision and strategy) and A6 (environmentalprofile). Overall, the results for our soft disclosurescores suggest less separation between good andpoor EP firms, a finding which we explore in moredepth in section ‘A revised role for socio-politticaltheories’ below.
isiting the relation between environmental ..., Account-7.05.003
16 P.M. Clarkson et al. / Accounting, Organizations and Society xxx (2007) xxx–xxx
ARTICLE IN PRESS
In Table 2, Panel A we present descriptive sta-tistics on environmental disclosure scores byindustry. The lowest average score (out of 95) is10.08 and is obtained by the Metals and MiningIndustry while the highest score, 25.21, is obtainedby the Pulp and Paper Industry.19 In Table 2,Panel B we show that the average ratios of TRI/Sales for Pulp and Paper and Metals and Miningare 2.34 (i.e., 2.34 pounds of toxic emissions perthousand dollar sales) and 1.72, respectively. Thus,it appears that industries with a high (low) pollu-tion propensity are more (less) likely to providediscretionary environmental disclosures to firmstakeholders. This is by no means inconsistentwith H1a which conditions disclosure predictionsby environmental type at the firm level relative toindustry peers. Table 2 does confirm differencesacross sectors in both environmental disclosureand pollution propensities suggesting the needfor industry controls.
Untabulated analysis for our 69 firms with zerodisclosure scores indicates that these firms have anaverage TRI/Sales (% recycled) measure of 2.97(59.01%) compared to 1.82 (65.61%) for the 122firms with non-zero disclosure scores. The differ-ences in both EP measures across the two groupsare significant at the 5% level. This is generallyconsistent with H1a, i.e., poor EP firms are morelikely to opt for silence.
In Table 3, Panel A we present descriptive sta-tistics for independent variables used in the estima-tion. The average firm has a negative financingvariable (FIN) meaning that it reduces debt orrepurchases shares more than it raises new financ-ing. Also, on average, the ROA is about 5% andthe average leverage (LEV) is 33% of total assets.
19 While our scoring scheme has 95 available points to allowfor rich variety of disclosures from one sustainability report tothe next, and from one industry to another, the attainable scoreis lower than this, even for an excellent sustainability report.For example, our top scoring firm, Weyerhaeuser, obtained 68of the 95 available points, suggesting an effective maximum of71%. This is comparable to the effective maximum in similarscoring scheme used in ‘‘Risk and Opportunity: the BestPractice in Non-financial Reporting’’ by Standard and Poor’s(2004). Nonetheless, the low average scores (out of 95) for eachof the four industries point to an overall need for improvementin sustainability reporting in the years beyond 2003.
Please cite this article in press as: Clarkson, P. M. et al., Reving, Organizations and Society (2007), doi:10.1016/j.aos.200
The firm size measured by the logarithm of totalassets (SIZE) is 8.01 implying average total assetsin dollar terms of $3.01 bn, thus our sample con-sists of relatively larger firms. The mean (and med-ian) firm size is comparable with the median firmsize reported by Patten (2002) for his sample.The average J–F coefficient is �0.08.
We present in Panel B of Table 3 Pearson cor-relations between the independent variables usedin the regressions. The Pearson correlationbetween the negative of TRI/Sales and % recycledis equal to 0.29 and is statistically significant at 1%,implying that (minus) TRI/Sales and % recycledboth measure environmental performance but theoverlap is modest.
Empirical results involving the level of disclosure
Inter-industry analysis
We present in Table 4 the results of inter-indus-try multivariate regressions of disclosure scores onthe environmental performance measures and thecontrol variables. We estimate the regressionsusing a Tobit analysis to account for the censoringof the dependent variable at zero.20 We estimatethe Tobit regressions by maximum likelihoodusing a Newton–Raphson algorithm.21 We runthree sets of equations based on the different dis-closure scores (total, hard and soft) used on thedependent side. All regressions are inter-industryanalyses using dummy variables to control forindustry fixed effects. We estimate the regressionsusing each environmental performance variableseparately and then include both variables at thesame time.
The first three columns present the results forthe total disclosure scores. As predicted by H1a,the estimated coefficients for our environmental
20 As an alternative, we have re-run our regressions usingsimple OLS and the inferences are unchanged.21 In the Tobit model, the marginal effect of a change in an
independent variable on the dependent variable (i.e., disclosurescore) is the estimated coefficient times the probability that thefirm provides discretionary environmental disclosures (Verbeek,2004).
isiting the relation between environmental ..., Account-7.05.003
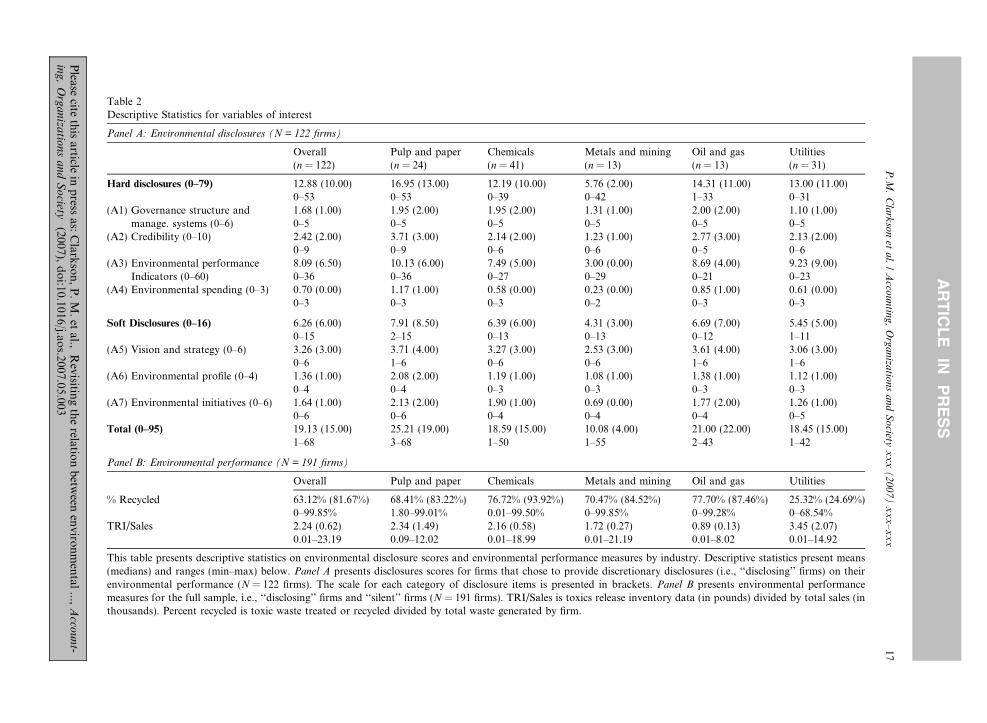
Table 2Descriptive Statistics for variables of interest
Panel A: Environmental disclosures (N = 122 firms)
Overall Pulp and paper Chemicals Metals and mining Oil and gas Utilities(n = 122) (n = 24) (n = 41) (n = 13) (n = 13) (n = 31)
Hard disclosures (0–79) 12.88 (10.00) 16.95 (13.00) 12.19 (10.00) 5.76 (2.00) 14.31 (11.00) 13.00 (11.00)0–53 0–53 0–39 0–42 1–33 0–31
(A1) Governance structure andmanage. systems (0–6)
1.68 (1.00) 1.95 (2.00) 1.95 (2.00) 1.31 (1.00) 2.00 (2.00) 1.10 (1.00)0–5 0–5 0–5 0–5 0–5 0–5
(A2) Credibility (0–10) 2.42 (2.00) 3.71 (3.00) 2.14 (2.00) 1.23 (1.00) 2.77 (3.00) 2.13 (2.00)0–9 0–9 0–6 0–6 0–5 0–6
(A3) Environmental performance 8.09 (6.50) 10.13 (6.00) 7.49 (5.00) 3.00 (0.00) 8.69 (4.00) 9.23 (9.00)Indicators (0–60) 0–36 0–36 0–27 0–29 0–21 0–23
(A4) Environmental spending (0–3) 0.70 (0.00) 1.17 (1.00) 0.58 (0.00) 0.23 (0.00) 0.85 (1.00) 0.61 (0.00)0–3 0–3 0–3 0–2 0–3 0–3
Soft Disclosures (0–16) 6.26 (6.00) 7.91 (8.50) 6.39 (6.00) 4.31 (3.00) 6.69 (7.00) 5.45 (5.00)0–15 2–15 0–13 0–13 0–12 1–11
(A5) Vision and strategy (0–6) 3.26 (3.00) 3.71 (4.00) 3.27 (3.00) 2.53 (3.00) 3.61 (4.00) 3.06 (3.00)0–6 1–6 0–6 0–6 1–6 1–6
(A6) Environmental profile (0–4) 1.36 (1.00) 2.08 (2.00) 1.19 (1.00) 1.08 (1.00) 1.38 (1.00) 1.12 (1.00)0–4 0–4 0–3 0–3 0–3 0–3
(A7) Environmental initiatives (0–6) 1.64 (1.00) 2.13 (2.00) 1.90 (1.00) 0.69 (0.00) 1.77 (2.00) 1.26 (1.00)0–6 0–6 0–4 0–4 0–4 0–5
Total (0–95) 19.13 (15.00) 25.21 (19.00) 18.59 (15.00) 10.08 (4.00) 21.00 (22.00) 18.45 (15.00)1–68 3–68 1–50 1–55 2–43 1–42
Panel B: Environmental performance (N = 191 firms)
Overall Pulp and paper Chemicals Metals and mining Oil and gas Utilities
% Recycled 63.12% (81.67%) 68.41% (83.22%) 76.72% (93.92%) 70.47% (84.52%) 77.70% (87.46%) 25.32% (24.69%)0–99.85% 1.80–99.01% 0.01–99.50% 0–99.85% 0–99.28% 0–68.54%
TRI/Sales 2.24 (0.62) 2.34 (1.49) 2.16 (0.58) 1.72 (0.27) 0.89 (0.13) 3.45 (2.07)0.01–23.19 0.09–12.02 0.01–18.99 0.01–21.19 0.01–8.02 0.01–14.92
This table presents descriptive statistics on environmental disclosure scores and environmental performance measures by industry. Descriptive statistics present means(medians) and ranges (min–max) below. Panel A presents disclosures scores for firms that chose to provide discretionary disclosures (i.e., ‘‘disclosing’’ firms) on theirenvironmental performance (N = 122 firms). The scale for each category of disclosure items is presented in brackets. Panel B presents environmental performancemeasures for the full sample, i.e., ‘‘disclosing’’ firms and ‘‘silent’’ firms (N = 191 firms). TRI/Sales is toxics release inventory data (in pounds) divided by total sales (inthousands). Percent recycled is toxic waste treated or recycled divided by total waste generated by firm.
P.M
.C
lark
son
eta
l./
Acco
un
ting
,O
rga
niza
tion
sa
nd
So
cietyx
xx
(2
00
7)
xx
x–
xx
x17
Please
citeth
isarticle
inp
ressas:
Clark
son
,P
.M
.et
al.,R
evisiting
the
relation
betw
eenen
viron
men
tal...,
Acco
un
t-in
g,
Org
an
izatio
ns
an
dS
ociety
(2007),doi:1
0.1016/j.a
os.2
007.05.003
AR
TIC
LE
INP
RE
SS

Table 3Descriptive and correlation statistics for variables used in the estimation
Panel A: Descriptive statistics
Variable Mean Median Q1 Q3 Std dev
% Recycled 0.63 0.82 0.30 0.95 0.35�TRI/Sales �2.24 �0.62 �2.50 �0.13 3.68J–F coefficient �0.08 0.00 0.00 0.37 0.81SIZE 8.01 7.89 6.70 9.28 1.70FIN �0.02 �0.01 �0.03 0.01 0.31TOBIN Q 1.13 1.04 0.81 1.35 0.75VOLAT 0.09 0.07 0.05 0.10 0.08ROA 0.05 0.03 0.00 0.08 0.07LEV 0.33 0.31 0.23 0.41 0.16NEW 0.54 0.54 0.45 0.62 0.14CAPIN 0.07 0.04 0.02 0.09 0.08Panel B: Pearson correlation statistics
TRI/Sales Size FIN TOBIN Q VOLAT ROA LEV AGE CAPIN Totaldisclosure
J–Fcoefficient
% Recycled 0.29*** �0.06 0.15** 0.28*** 0.07 0.14** 0.02 �0.26*** �0.30*** 0.23*** �0.05�TRI/Sales – �0.04 �0.01 0.11 �0.16** 0.08 0.01 �0.03 �0.01 0.17*** 0.13*
SIZE – 0.07 0.17** �0.09 0.01 0.01 0.33*** 0.21*** 0.46*** 0.05FIN – �0.03 0.03 0.05 0.02 0.05 0.03 0.03 0.01TOBIN Q – �0.01 0.47*** �0.04 �0.15** �0.06 0.14 0.03VOLAT – �0.11 0.03 �0.15** �0.06 �0.16** �0.15**
ROA – �0.11 �0.10 �0.07 0.04 0.03LEV – 0.14* 0.01 0.19*** 0.10NEW – 0.18** �0.12** �0.02CAPIN 0.34*** 0.09Total disclosure – 0.09*
This table presents descriptive and correlation statistics for independent variables used in multivariate tests. Statistics are presented forthe full sample of 191 firms. Percent recycled is toxic waste treated or recycled divided by total waste generated by firm. TRI/Sales is thenegative of Toxics Release Inventory data (in pounds) divided by total sales in thousands. SIZE is the logarithm of market value. FINis the amount of debt or equity capital raised in fiscal year 2004 divided by total assets. TOBIN Q is the sum of market value of equity,book value of preferred stock and book value of debt divided by total assets. VOLAT is stock price volatility (standard deviation ofmonthly returns during 2003). ROA is return on assets. LEV is the leverage ratio. NEW is asset newness measured as the ratio of netPPE to gross PPE. CAPIN is capital intensity measured as the ratio of capital spending to total sales. Total Disclosure is totalenvironmental disclosure score achieved using the disclosure index presented in Table 1. J–F coefficient is the Janis–Fadner Coefficient(see Bansal and Clelland, 2004 for details). Spearman Correlation statistics provide similar results. ***, **, * represent significance levels(two-tailed) at 1%, 5% and 10%, respectively.
18 P.M. Clarkson et al. / Accounting, Organizations and Society xxx (2007) xxx–xxx
ARTICLE IN PRESS
performance proxies are all positive and signifi-cant (recall, we reverse the sign of TRI/Sales tofacilitate the interpretation). This result is consis-tent with the discretionary disclosure theories ofVerrecchia (1983) and Dye (1985), but inconsis-tent with the negative association (H1b) pre-dicted by socio-political theories. Firms withbetter environmental performance have more vol-untary disclosures about their environmentalimpact. Furthermore, when we introduce bothscaled TRI and % recycled in the regression we
Please cite this article in press as: Clarkson, P. M. et al., Reving, Organizations and Society (2007), doi:10.1016/j.aos.200
find that they are significant and positive suggest-ing that each provides incremental informationto the other with respect to voluntary environmen-tal disclosures.
Table 4 indicates the predicted sign of associa-tion for our control variables given prior generaldisclosure literature and intuition. For the totaldisclosures as well as hard versus soft disclosures,the forward looking financing proxy is positive(consistent with the prior literature) but is statisti-cally significant only for the soft disclosure cate-
isiting the relation between environmental ..., Account-7.05.003
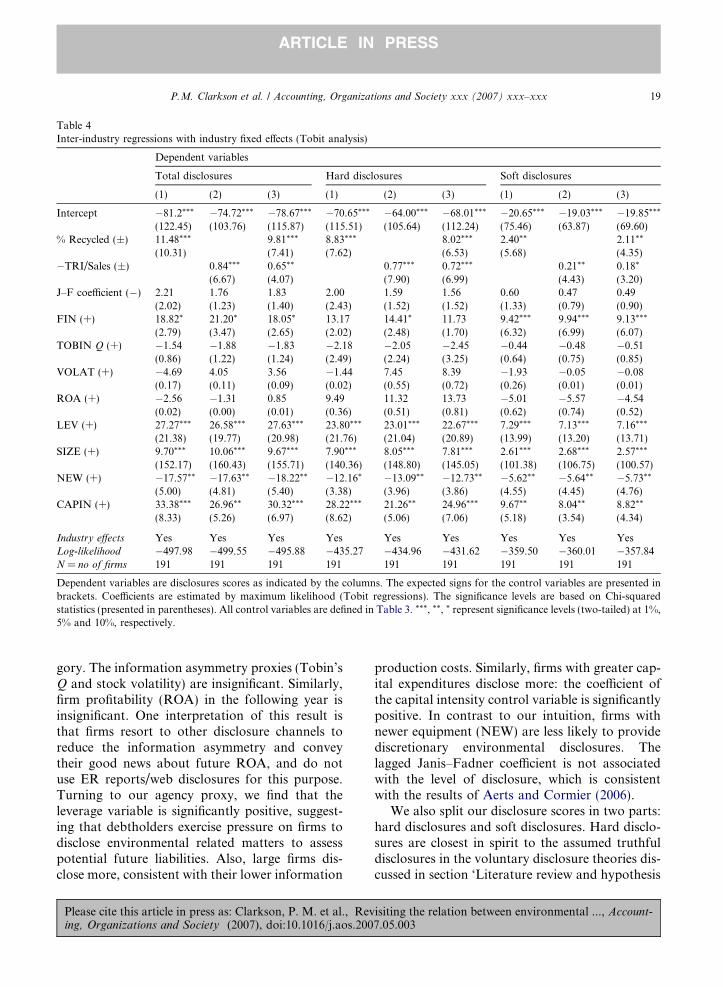
Table 4Inter-industry regressions with industry fixed effects (Tobit analysis)
Dependent variables
Total disclosures Hard disclosures Soft disclosures
(1) (2) (3) (1) (2) (3) (1) (2) (3)
Intercept �81.2*** �74.72*** �78.67*** �70.65*** �64.00*** �68.01*** �20.65*** �19.03*** �19.85***
(122.45) (103.76) (115.87) (115.51) (105.64) (112.24) (75.46) (63.87) (69.60)% Recycled (±) 11.48*** 9.81*** 8.83*** 8.02*** 2.40** 2.11**
(10.31) (7.41) (7.62) (6.53) (5.68) (4.35)�TRI/Sales (±) 0.84*** 0.65** 0.77*** 0.72*** 0.21** 0.18*
(6.67) (4.07) (7.90) (6.99) (4.43) (3.20)J–F coefficient (�) 2.21 1.76 1.83 2.00 1.59 1.56 0.60 0.47 0.49
(2.02) (1.23) (1.40) (2.43) (1.52) (1.52) (1.33) (0.79) (0.90)FIN (+) 18.82* 21.20* 18.05* 13.17 14.41* 11.73 9.42*** 9.94*** 9.13***
(2.79) (3.47) (2.65) (2.02) (2.48) (1.70) (6.32) (6.99) (6.07)TOBIN Q (+) �1.54 �1.88 �1.83 �2.18 �2.05 �2.45 �0.44 �0.48 �0.51
(0.86) (1.22) (1.24) (2.49) (2.24) (3.25) (0.64) (0.75) (0.85)VOLAT (+) �4.69 4.05 3.56 �1.44 7.45 8.39 �1.93 �0.05 �0.08
(0.17) (0.11) (0.09) (0.02) (0.55) (0.72) (0.26) (0.01) (0.01)ROA (+) �2.56 �1.31 0.85 9.49 11.32 13.73 �5.01 �5.57 �4.54
(0.02) (0.00) (0.01) (0.36) (0.51) (0.81) (0.62) (0.74) (0.52)LEV (+) 27.27*** 26.58*** 27.63*** 23.80*** 23.01*** 22.67*** 7.29*** 7.13*** 7.16***
(21.38) (19.77) (20.98) (21.76) (21.04) (20.89) (13.99) (13.20) (13.71)SIZE (+) 9.70*** 10.06*** 9.67*** 7.90*** 8.05*** 7.81*** 2.61*** 2.68*** 2.57***
(152.17) (160.43) (155.71) (140.36) (148.80) (145.05) (101.38) (106.75) (100.57)NEW (+) �17.57** �17.63** �18.22** �12.16* �13.09** �12.73** �5.62** �5.64** �5.73**
(5.00) (4.81) (5.40) (3.38) (3.96) (3.86) (4.55) (4.45) (4.76)CAPIN (+) 33.38*** 26.96** 30.32*** 28.22*** 21.26** 24.96*** 9.67** 8.04** 8.82**
(8.33) (5.26) (6.97) (8.62) (5.06) (7.06) (5.18) (3.54) (4.34)
Industry effects Yes Yes Yes Yes Yes Yes Yes Yes YesLog-likelihood �497.98 �499.55 �495.88 �435.27 �434.96 �431.62 �359.50 �360.01 �357.84N = no of firms 191 191 191 191 191 191 191 191 191
Dependent variables are disclosures scores as indicated by the columns. The expected signs for the control variables are presented inbrackets. Coefficients are estimated by maximum likelihood (Tobit regressions). The significance levels are based on Chi-squaredstatistics (presented in parentheses). All control variables are defined in Table 3. ***, **, * represent significance levels (two-tailed) at 1%,5% and 10%, respectively.
P.M. Clarkson et al. / Accounting, Organizations and Society xxx (2007) xxx–xxx 19
ARTICLE IN PRESS
gory. The information asymmetry proxies (Tobin’sQ and stock volatility) are insignificant. Similarly,firm profitability (ROA) in the following year isinsignificant. One interpretation of this result isthat firms resort to other disclosure channels toreduce the information asymmetry and conveytheir good news about future ROA, and do notuse ER reports/web disclosures for this purpose.Turning to our agency proxy, we find that theleverage variable is significantly positive, suggest-ing that debtholders exercise pressure on firms todisclose environmental related matters to assesspotential future liabilities. Also, large firms dis-close more, consistent with their lower information
Please cite this article in press as: Clarkson, P. M. et al., Reving, Organizations and Society (2007), doi:10.1016/j.aos.200
production costs. Similarly, firms with greater cap-ital expenditures disclose more: the coefficient ofthe capital intensity control variable is significantlypositive. In contrast to our intuition, firms withnewer equipment (NEW) are less likely to providediscretionary environmental disclosures. Thelagged Janis–Fadner coefficient is not associatedwith the level of disclosure, which is consistentwith the results of Aerts and Cormier (2006).
We also split our disclosure scores in two parts:hard disclosures and soft disclosures. Hard disclo-sures are closest in spirit to the assumed truthfuldisclosures in the voluntary disclosure theories dis-cussed in section ‘Literature review and hypothesis
isiting the relation between environmental ..., Account-7.05.003

20 P.M. Clarkson et al. / Accounting, Organizations and Society xxx (2007) xxx–xxx
ARTICLE IN PRESS
development’. However, we find similar results forboth hard and soft disclosure scores: the estimatedcoefficients for our two EP measures are positiveand significant for both hard and soft disclosuresas predicted by H1a.
Intra-industry analysis
Following Lang and Lundholm (1993, 1996)and Healy et al. (1999) we supplement the abovetests with an intra-industry approach which seeksto explain the within-industry variation in theranks of disclosure scores using the within-indus-try variation in the ranks of our independent vari-ables. There are two reasons justifying this
Table 5Intra-industry rank regressions (OLS analysis)
Dependent variables
Total disclosures Hard di
(1) (2) (3) (1)
Intercept 13.91* 15.30** 11.08 20.03***
(1.84) (2.03) (1.48) (2.65)% Recycled (±) 0.17*** 0.15*** 0.15***
(3.56) (3.19) (3.05)�TRI/Sales (±) 0.16*** 0.14***
(3.32) (2.93)J–F coefficient (�) 0.07 0.05 0.05 0.05
(1.57) (1.07) (1.19) (1.09)FIN (+) 0.06 0.07 0.06 0.06
(1.24) (1.45) (1.38) (1.35)TOBIN Q (+) �0.04 �0.05 �0.06 �0.04
(�0.67) (�0.89) (�1.07) (�0.72)VOLAT (+) �0.06 �0.04 �0.05 �0.06
(�1.15) (�0.83) (�0.99) (�1.15)ROA (+) 0.06 0.06 0.06 0.06
(1.09) (1.01) (0.97) (1.09)LEV (+) 0.17*** 0.17*** 0.17*** 0.15***
(3.51) (3.40) (3.44) (3.15)SIZE (+) 0.43*** 0.44*** 0.43*** 0.40***
(8.39) (8.55) (8.53) (7.67)NEW (+) �0.11** �0.11** �0.11** �0.09*
(�2.34) (�2.26) (�2.42) (�1.92)CAPIN (+) 0.11** 0.10** 0.10** 0.10**
(2.20) (2.13) (1.97) (2.07)Adj. R2 40.83% 40.33% 43.22% 36.38%N = no of firms 191 191 191 191
Dependent variables are disclosures scores as indicated by the columnbrackets. All variables are ranked within industry. Coefficients aresignificance levels are based on t statistics (presented in parentheses).significance levels (two-tailed) at 1%, 5% and 10%, respectively.
Please cite this article in press as: Clarkson, P. M. et al., Reving, Organizations and Society (2007), doi:10.1016/j.aos.200
approach: (1) some of our variables (i.e., TRI/Sales) can be compared within an industry butcannot be meaningfully compared across indus-tries due to differences in production processes;(2) the distribution of our disclosure scores forthe Metal and Mining sector are quite low, so tak-ing intra-industry ranks and then pooling facili-tates the i.i.d assumption requirement of ourOLS regression model.
We rank the dependent and the independentvariables within industry and then we pool the cor-responding percentiles across the five sectors. Theregression results are presented in Table 5. Theyare generally the same as in Table 4 and indicatea positive association between the environmental
sclosures Soft disclosures
(2) (3) (1) (2) (3)
19.03*** 16.20*** 15.38** 16.42*** 13.65***
(2.53) (2.18) (1.96) (2.09) (3.41)0.14*** 0.11** 0.11**
(2.98) (2.34) (2.24)0.17*** 0.16*** 0.09* 0.09*
(3.48) (3.42) (1.93) (1.73)0.04 0.03 0.18*** 0.17*** 0.17***
(0.84) (0.66) (3.74) (3.51) (3.46)0.07 0.07 0.03 0.04 0.04(1.50) (1.51) (0.69) (0.79) (0.75)�0.06 �0.07 �0.02 �0.03 �0.04(�0.98) (�1.21) (�0.36) (�0.50) (�0.62)�0.03 �0.05 �0.04 �0.03 �0.04(�0.54) (�0.97) (�0.84) (�0.60) (�0.76)0.08 0.06 0.03 0.02 0.02(1.33) (0.94) (0.44) (0.37) (0.36)0.15*** 0.15*** 0.16*** 0.15*** 0.15***
(3.02) (3.07) (3.12) (2.98) (3.04)0.41*** 0.39*** 0.36*** 0.37*** 0.36***
(8.03) (7.84) (6.77) (6.94) (6.81)�0.09** �0.09** �0.08* �0.08* �0.08*
(�1.99) (�2.03) (�1.65) (�1.64) (�1.68)0.08* 0.09* 0.13** 0.13** 0.12**
(1.75) (1.79) (2.54) (2.54) (2.39)37.32% 39.94% 34.98% 34.36% 35.69%191 191 191 191 191
s. The expected signs for the control variables are presented inestimated by OLS regressions using the ranked variables. TheAll control variables are defined in Table 3. ***, **, * represent
isiting the relation between environmental ..., Account-7.05.003

P.M. Clarkson et al. / Accounting, Organizations and Society xxx (2007) xxx–xxx 21
ARTICLE IN PRESS
performance measures and the discretionary envi-ronmental disclosures (total scores). Both (minus)TRI/Sales and % recycled complement each otherand neither is redundant for the total sample or forthe hard and soft groups considered separately.We find similar results when we split the totalscores into hard and soft disclosure scores: the esti-mated coefficients for our two environmental per-formance measures are positive and significant aspredicted by H1a. The results for the control vari-ables are also generally comparable to Table 4.The Janis–Fadner coefficient is now positivelyassociated with the level of soft disclosures, whichis opposite to the negative association predicted bythe socio-political theories.
22 As anecdotal evidence, consider the following soft environ-mental commitment claim made by one of our sample chemicalfirms in the bottom quartile of our environmental performanceranking: ‘‘Senior management leads the industry with respect to
responsible care.’’
A revised role for socio-political theories
Overall, the results in the previous sectionspoint to economic disclosure theory and notsocio-political theory as being robust in predictingthe level of discretionary environmental disclosure.If the focus of enquiry is switched to disclosurestrategies, it may be that socio-political theoriesexplain interesting patterns in the data. While weleave this possibility to future research, we offerin this section some preliminary evidence on thequestion.
Legitimacy theory predicts that firms withthreatened legitimacy are likely to make self-serv-ing disclosures referred to as ‘‘legitimization’’(see, for example, Adams, 2004; Gray et al.,1995, p. 54 & Hughes et al., 2001, p. 219). Oneexample of legitimization is for a poor environ-mental performer to make soft claims to be com-mitted to the environment which are not readilyverifiable. In fact, it is apparent from an inspectionof Table 1 that many poor EP firms do make softclaims to be committed to the environment. Focus-ing on A5, Vision and Strategy Claims, over 90%of our poor EP firms make a claim which isawarded at least one mark in category A5. Forexample, 55 of 61 poor EP firms (i.e., 0.90 * 61)make a claim that is awarded a score of 1 for itemA5-2 which is a statement of corporate environ-mental policy and/or commitment. Further, 33 ofour 61 poor EP firms are awarded a score under
Please cite this article in press as: Clarkson, P. M. et al., Reving, Organizations and Society (2007), doi:10.1016/j.aos.200
A5-1 which involves a CEO statement on environ-mental performance to stakeholders.22
More formally, using the ratio of soft disclosurescores to total awarded scores as a proxy for legit-imization, we would expect to find a negative rela-tion between prior perceived legitimacy and thisratio. Our tests based on the conditional sampleof firms with scored sustainability/web disclosuresappear in Table 6. We measure threats to legiti-macy in two ways: group EP membership basedon the median % recycled and group media cover-age based on the median Janis–Fadner Coefficient.There are 122 (95) firms with scored sustainability/web disclosures (at least one environmental pressarticle in 2002) and available EP. As indicated inTable 6, the ratio of soft/total scores is 50.95%for poor EP firms, compared to 34.23% for goodEP firms. Similarly, the ratio of soft/total scoresis 47.54% for unfavorable media coverage firms,compared to 32.58% for firms with favorablemedia coverage. In both instances, the differenceis statistically significant at the 1% level. Bothresults are consistent with firms whose environ-mental legitimacy is threatened to make soft claimsto be committed to the environment. This result ispredicted by legitimacy theory but cannot beexplained by economic disclosure theories, whichassume truth-telling and thus offer no predictionsabout biased disclosures.
These results hold when we repeat the tests(untabulated) in a multivariate fashion using allother control variables in Tables 4 and 5 andemploy the ratio of soft/total as the dependent var-iable. There is a significant negative associationbetween the lagged Janis–Fadner Coefficient andthe ratio of soft/total scores, after including allcontrol variables. Similar results hold for ourtwo EP measures. This result is robust to the Tobitanalysis approach (Table 4) and the rank regres-sion analyses approach (Table 5) and implies agreater propensity for ‘‘legitimization’’ behavior
isiting the relation between environmental ..., Account-7.05.003
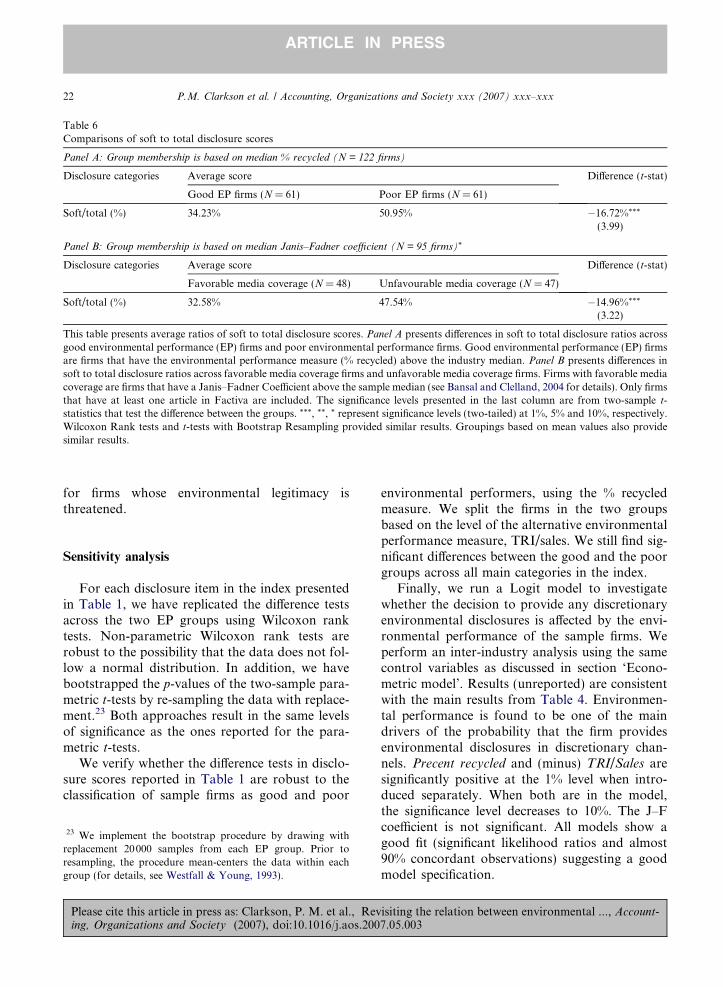
Table 6Comparisons of soft to total disclosure scores
Panel A: Group membership is based on median % recycled (N = 122 firms)
Disclosure categories Average score Difference (t-stat)
Good EP firms (N = 61) Poor EP firms (N = 61)
Soft/total (%) 34.23% 50.95% �16.72%***
(3.99)
Panel B: Group membership is based on median Janis–Fadner coefficient (N = 95 firms)*
Disclosure categories Average score Difference (t-stat)
Favorable media coverage (N = 48) Unfavourable media coverage (N = 47)
Soft/total (%) 32.58% 47.54% �14.96%***
(3.22)
This table presents average ratios of soft to total disclosure scores. Panel A presents differences in soft to total disclosure ratios acrossgood environmental performance (EP) firms and poor environmental performance firms. Good environmental performance (EP) firmsare firms that have the environmental performance measure (% recycled) above the industry median. Panel B presents differences insoft to total disclosure ratios across favorable media coverage firms and unfavorable media coverage firms. Firms with favorable mediacoverage are firms that have a Janis–Fadner Coefficient above the sample median (see Bansal and Clelland, 2004 for details). Only firmsthat have at least one article in Factiva are included. The significance levels presented in the last column are from two-sample t-statistics that test the difference between the groups. ***, **, * represent significance levels (two-tailed) at 1%, 5% and 10%, respectively.Wilcoxon Rank tests and t-tests with Bootstrap Resampling provided similar results. Groupings based on mean values also providesimilar results.
22 P.M. Clarkson et al. / Accounting, Organizations and Society xxx (2007) xxx–xxx
ARTICLE IN PRESS
for firms whose environmental legitimacy isthreatened.
Sensitivity analysis
For each disclosure item in the index presentedin Table 1, we have replicated the difference testsacross the two EP groups using Wilcoxon ranktests. Non-parametric Wilcoxon rank tests arerobust to the possibility that the data does not fol-low a normal distribution. In addition, we havebootstrapped the p-values of the two-sample para-metric t-tests by re-sampling the data with replace-ment.23 Both approaches result in the same levelsof significance as the ones reported for the para-metric t-tests.
We verify whether the difference tests in disclo-sure scores reported in Table 1 are robust to theclassification of sample firms as good and poor
23 We implement the bootstrap procedure by drawing withreplacement 20000 samples from each EP group. Prior toresampling, the procedure mean-centers the data within eachgroup (for details, see Westfall & Young, 1993).
Please cite this article in press as: Clarkson, P. M. et al., Reving, Organizations and Society (2007), doi:10.1016/j.aos.200
environmental performers, using the % recycledmeasure. We split the firms in the two groupsbased on the level of the alternative environmentalperformance measure, TRI/sales. We still find sig-nificant differences between the good and the poorgroups across all main categories in the index.
Finally, we run a Logit model to investigatewhether the decision to provide any discretionaryenvironmental disclosures is affected by the envi-ronmental performance of the sample firms. Weperform an inter-industry analysis using the samecontrol variables as discussed in section ‘Econo-metric model’. Results (unreported) are consistentwith the main results from Table 4. Environmen-tal performance is found to be one of the maindrivers of the probability that the firm providesenvironmental disclosures in discretionary chan-nels. Precent recycled and (minus) TRI/Sales aresignificantly positive at the 1% level when intro-duced separately. When both are in the model,the significance level decreases to 10%. The J–Fcoefficient is not significant. All models show agood fit (significant likelihood ratios and almost90% concordant observations) suggesting a goodmodel specification.
isiting the relation between environmental ..., Account-7.05.003

P.M. Clarkson et al. / Accounting, Organizations and Society xxx (2007) xxx–xxx 23
ARTICLE IN PRESS
Conclusions
Previous empirical evidence provides mixedresults on the relationship between corporate envi-ronmental performance and the level of environ-mental disclosures. We revisit this relation bytesting competing predictions from economicsbased and socio-political theories of voluntary dis-closure using a more rigorous research design. Inparticular, we improve the prior literature in twoimportant ways. First, the predictions of voluntarydisclosure theory relate to discretionary, not man-datory, environmental disclosures. This studyfocuses on purely voluntary disclosure media suchas corporate Internet web sites and stand-aloneenvironmental reports. Previous studies assessedenvironmental disclosures mainly from annualreports and other regulatory filings such as 10 Ksand many of those studies rely on a Wiseman(1982) based content analysis index to measurethe extent of environmental disclosures.
Second, in collaboration with an environmentalreporting expert, we develop a content analysisindex to assess the level of environmental disclo-sure in environmental and social responsibilityreports or similar disclosures in the firm’s web site.The index, which follows closely the GlobalReporting Initiative (2002) sustainability reportingguidelines, differs from the Wiseman index in thatwe focus on firm disclosures related to its commit-ment to protect the environment.
Our results are as follows. We find a positiveassociation between environmental performanceand the level of discretionary disclosures in envi-ronmental and social reports or related web disclo-sures. In other words, superior environmentalperformers are more forthcoming in truly discre-tionary disclosure channels, as predicted by eco-nomics based voluntary disclosure theories. Ourfindings are robust to two reliable environmentalperformance measures that use actual toxic emis-sion and waste management data. The first one isbased on Toxics Release Inventory scaled by salesdata at firm level (i.e., TRI normalized by firm’soperational scale) and the second one is percentageof total toxic wastes that were treated or processedby each firm. In addition, our findings are notaffected when we assess the relative environment
Please cite this article in press as: Clarkson, P. M. et al., Reving, Organizations and Society (2007), doi:10.1016/j.aos.200
performance within each industry in order to con-trol for industry differences in pollution propensity.Our results are inconsistent with the prediction of anegative association from socio-political theories,suggesting that these theories are not robust in pre-dicting the level of discretionary disclosure.
Although there is separation in scores and goodEP firms disclose more, the scores of good EPfirms are low relative to the expectation impliedby the 2002 GRI reporting guidelines and pointto the need for improvement in the years beyond2003. Specific areas where improvement is requiredinclude obtaining independent assurance of sus-tainability reports and the disclosure of environ-mental performance indicators.
Finally, our results suggest important directionsfor future research. Specifically, we provide preli-minary evidence that socio-political theories arerobust in predicting what is being said. In particu-lar, we find that firms whose environmental legiti-macy is threatened make soft claims to becommitted to the environment. This behavior ispredicted by legitimacy theory but cannot beexplained by economics disclosure theory. Thus,we argue that future environmental disclosureresearch should move the focus of enquiry beyondthe level of disclosure.
Acknowledgements
We are grateful for comments and suggestionsfrom the Editor (Anthony G. Hopwood), twoanonymous reviewers and from Kate Bewley, WaltBlacconiere, Denis Cormier, Gus De Franco,Kathy Herbohn, Ole-Kristian Hope, Hai Lu, Mi-chel Magnan, Naomi Soderstrom and seminarparticipants at Chinese University of Hong Kong,University of Queensland and University of Tor-onto. We acknowledge the financial support ofthe Canadian Academic Accounting Association,Canadian Institute of Chartered Accountants,and the AIC Institute for Corporate Citizenshipat Rotman School of Management, University ofToronto. We also thank concurrent session partic-ipants and discussants at the June 2006, July 2006and August 2006 meetings of the CAAA,AFAANZ (a Best Paper Award) and AAA,
isiting the relation between environmental ..., Account-7.05.003

24 P.M. Clarkson et al. / Accounting, Organizations and Society xxx (2007) xxx–xxx
ARTICLE IN PRESS
respectively. We thank Rod Lohin, Bill Swirsky,and Alan Willis for their support and encourage-ment for this project and Gauri Bhat, Grace Jinand Dushyantkumar Vyas for help in data collec-tion. Gordon Richardson thanks KPMG for theirgenerous financial support.
References
Adams, C. A. (2004). The ethical, social and environmental
reporting-performance portrayal gap. Accounting, Auditing
and Accountability Journal, 17(5), 731–757.Aerts, W., & Cormier, D. (2006). The association between
media legitimacy and corporate environmental communi-cation. Working paper.
Aerts, W., Cormier, D., & Magnan, M. (2006). The interfacebetween print- and web-based corporate environmentaldisclosure, financial markets and the media. Working Paper.
Al-Tuwaijri, S. A., Christensen, T. E., & Hughes, K. E. (2004).The relations among environmental disclosure, environ-
mental performance, and economic performance: A simul-
taneous equations approach. Accounting, Organizations and
Society, 29(5-6), 447–471.Bansal, P., & Clelland, I. (2004). Talking trash: Legitimacy,
impression management, and unsystematic risk in the
context of the natural environment. Academy of Manage-
ment Journal, 47(1), 93–102.Barth, M., & Kasznik, R. (1999). Share Repurchases and
Intangible Assets. Journal of Accounting and Economics,
28(2), 211–241.Barth, M., & McNichols, M. (1994). Estimation and market
valuation of environmental liabilities relating to superfund
sites. Journal of Accounting Research Supplement, 32,177–209.
Barth, M., McNichols, M., & Wilson, P. (1997). Factors
influencing firms’ disclosures about environmental liabili-
ties. Review of Accounting Studies, 2, 35–64.Beets, S. D., & Souther, C. (1999). Corporate environmental
reports: the need for standards and an environmental
assurance service. Accounting Horizons, 13(2), 129–145.Bewley, K., & Li, Y. (2000). Disclosure of environmental
information by Canadian manufacturing companies: A
Voluntary Disclosure Perspective. Advances in Environmen-
tal Accounting and Management, 1, 201–226.Blacconiere, W. G., & Patten, D. M. (1994). Environmental
disclosures, regulatory costs, and changes in firm value.Journal of Accounting and Economics, 18, 357–377.
Chan-Fishel, Michelle. (2002). Survey of climate changedisclosure in SEC filings of automobile, insurance, oil &gas, petrochemical, and utilities companies. Friends of the
Earth – US, September.Clarkson, P., Li, Y., & Richardson, G. (2004). The market
valuation of environmental expenditures by pulp and paper
companies. The Accounting Review, 79, 329–353.
Please cite this article in press as: Clarkson, P. M. et al., Reving, Organizations and Society (2007), doi:10.1016/j.aos.200
Cormier, D., & Magnan, M. (1997). Investors’ assessment of
implicit environmental liabilities: An empirical investiga-
tion. Journal of Accounting and Public Policy, 16, 215–241.Cormier, D., Magnan, M., & Morard, B. (1993). The impact of
corporate pollution on market valuation: Some empirical
evidence. Ecological Economics, 8, 135–155.Dye, R. A. (1985). Disclosure of non-proprietary information.
Journal of Accounting Research, 123–145, Spring.Franco, N.C. (2001). Corporate environmental disclosure:
opportunities to harness market forces to improve corporateenvironmental performance. American Bar Association
Conference on Environmental Law, Keystone, Colorado,March 8–11.
Frankel, R., McNichols, M., & Wilson, P. (1995). Discretionary
disclosure and external financing. The Accounting Review,
70, 135–150.Freedman, M., & Wasley, C. (1990). ‘The association between
environmental performance and environmental disclosure in
annual reports and 10 Ks’. Advances in Public Interest
Accounting, 3, 183–193.Global Reporting Initiative (2002). Sustainable Reporting
Guidelines, www.globalreporting.org.Gray, R., Kouhy, R., & Lavers, S. (1995). Corporate social and
environmental reporting: A review of the literature and a
longitudinal study of UK disclosure. Accounting, Auditing
and Accountability Journal, 8(2), 47–77.Healy, P. M., Hutton, A. P., & Palepu, K. G. (1999). A Stock
Performance and Intermediation Changes Surrounding
Sustained Increases in Disclosure. Contemporary Accounting
Research, 16, 485–520.Healy, P. M., & Palepu, K. G. (2001). Information asymmetry,
corporate disclosure, and the capital markets: A review of
the empirical disclosure literature. Journal of Accounting and
Economics, 31(1–3), 405–440.Hughes, S. B., Anderson, A., & Golden, S. (2001). Corporate
environmental disclosures: Are they useful in determining
environmental performance? Journal of Accounting and
Public Policy, 20, 217–240.Hutton, A., Miller, G., & Skinner, D. (2003). The Role of
Supplementary Statements with Management Earnings
Forecasts. Journal of Accounting Research, 41, 867–890.Ilinitch, A., Soderstrom, N., & Thomas, T. (1998). Measuring
corporate environmental performance. Journal of Account-
ing and Public Policy, 17, 387–408.Ingram, R. W., & Frazier, K. (1980). Environmental Perfor-
mance and Corporate Disclosure. Journal of Accounting
Research, 18(2), 614–622. Autumn.Janis, I. L., & Fadner, R. (1965). The coefficient of imbalance.
In H. D. Lasswell & N. Leites, et al. (Eds.), Language of
Politics (pp. 153–169). Cambridge MA: MIT Press.Jensen, M., & Meckling, W. (1976). Theory of the Firm:
Managerial Behavior, Agency Costs, and Ownership Struc-
ture. Journal of Financial Economics, 3(4), 305–360.King, Andrew, & Lenox, Michael. (2001). Does it really pay to
be green? An empirical study of firm environmental and
financial performance. The Journal of Industrial Ecology,
5(1), 105–116.
isiting the relation between environmental ..., Account-7.05.003

P.M. Clarkson et al. / Accounting, Organizations and Society xxx (2007) xxx–xxx 25
ARTICLE IN PRESS
Lang, Mark, & Lundholm, Russell. (1993). Cross-sectional
determinants of analyst ratings of corporate disclosures.Journal of Accounting Research, 31(2), 246–247. Autumn.
Lang, M., & Lundholm, R. (1996). Corporate disclosure policy
and analyst behavior. The Accounting Review, 71(4),467–492.
Leftwich, R. W., Watts, R. L., & Zimmerman, J. L. (1981).Voluntary corporate disclosure: The case of interim report-
ing. Journal of Accounting Research, 18, 50–77.Li, Y., & McConomy, B. (1999). An empirical examination of
factors affecting the timing of environmental accounting
standard adoption and the impact on corporate valuation.Journal of Accounting, Auditing and Finance, 14(3), 279–313.
Li, Y., Richardson, G. D., & Thornton, D. (1997). Corporate
disclosure of environmental information; theory and evi-
dence. Contemporary Accounting Research, 14(3), 435–474.Lim, T. (2001). Rationality and Analysts’ Forecast Bias.
Journal of Finance, LVI(1), 369–385.Lindblom, C. (1994). The implications of organizational
legitimacy for corporate social performance disclosure.Paper presented at the Critical Perspectives on Accounting
Conference, New York.Patten, Dennis (1992). Intra-industry Environmental Disclo-
sures in Response to the Alaskan Oil Spill: A Note on
Legitimacy Theory. Accounting, Organizations, and Society,
17, 471–475.
Please cite this article in press as: Clarkson, P. M. et al., Reving, Organizations and Society (2007), doi:10.1016/j.aos.200
Patten, Dennis (2000). Changing Superfund disclosure and its
relation to the provision of other environmental informa-
tion. Advances in Environmental Accounting and Manage-
ment, 1, 101–121.Patten, Dennis (2002). The relation between environmental
performance and environmental disclosure: A research note.Accounting, Organizations, and Society, 27, 763–773.
Richardson, A., & Welker, M. (2001). Social disclosure,
financial disclosure and the cost of equity capital. Account-
ing, Organizations and Society, 26(7/8), 597–616.Smith, C., & Watts, R. (1992). The Investment Opportunity Set
and Corporate Financing, Dividend and Compensation
Policies. Journal of Financial Economics, 32(1), 263–293.Standard & Poor’s (2004). Risk and Opportunity: the best
practice in non-financial reporting, first edition, ISBN 1-903168-12-0.
Verbeek, M. (2004). A Guide to Modern Econometrics. JohnWiley and Sons.
Verrecchia, R. (1983). Discretionary disclosure. Journal of
Accounting and Economics, 5, 179–194.Westfall, P., & Young, S. (1993). Resampling-Based Multiple
Testing: Examples and Methods for P-Value Adjustment.John Wiley and Sons.
Wiseman, J. (1982). An evaluation of environmental disclosures
made in corporate annual reports. Accounting, Organiza-
tions and Society, 7(1), 553–563.
isiting the relation between environmental ..., Account-7.05.003