revisions to the state implementation plan (sip) for … · were submitted to epa on april 13,...
TRANSCRIPT

.
REVISIONS TO THE STATE IMPLEMENTATION PLAN (SIP)FOR THE CONTROL OF OZONE AIR POLLUTION
COMPLETE ATTAINMENT DEMONSTRATION FOR THEDALLAS/FORT WORTH OZONE NONATTAINMENT AREA
Texas Commission on Environmental QualityP.O. BOX 13087
AUSTIN, TEXAS 78711-3087
UPDATED: March 18, 2003

iiDFW Attainment Demonstration
SECTION VI. CONTROL STRATEGY
A. Introduction
B. Ozone
1. Dallas/Fort Worth Chapter 1: GeneralChapter 2: Emissions InventoryChapter 3: Photochemical ModelingChapter 4: Data AnalysisChapter 5: Rate-of-ProgressChapter 6: Required Control Strategy ElementsChapter 7: Future Attainment Plans
2. Houston/GalvestonChapter 1: GeneralChapter 2: Emissions InventoryChapter 3: Photochemical ModelingChapter 4: Data AnalysisChapter 5: Rate-of-ProgressChapter 6: Required Control Strategy ElementsChapter 7: Future Attainment Plans
3. Beaumont/Port ArthurChapter 1: GeneralChapter 2: Emissions InventoryChapter 3: Photochemical ModelingChapter 4: Data AnalysisChapter 5: Rate-of-ProgressChapter 6: Required Control Strategy ElementsChapter 7: Future Attainment Plans
4. El Paso5. Regional Strategies
Chapter 1: GeneralChapter 2: Control Strategy ElementsChapter 3: Photochemical Modeling
C. Particulate Matter
D. Carbon Monoxide
E. Lead
F. Oxides of Nitrogen
G. Sulfur Dioxide
H. Conformity with the National Ambient Air Quality Standards

iiiDFW Attainment Demonstration
I. Site Specific
J. Mobile Sources Strategies
1. Inspection/MaintenanceChapter 1: GeneralChapter 2: ApplicabilityChapter 3: I/M Performance StandardsChapter 4: Network Type and Program EvaluationChapter 5: Adequate Tools and ResourcesChapter 6: Test Frequency and Convenience Chapter 7: Vehicle Coverage Chapter 8: Test Procedures and Standards and Test EquipmentChapter 9: Quality ControlChapter 10: Waivers and Time ExtensionsChapter 11: Motorist Compliance Enforcement Chapter 12: Motorist Compliance Enforcement Program OversightChapter 13: Quality AssuranceChapter 14: Enforcement Against Contractors, Stations, and Inspectors Chapter 15: Data Collection Chapter 16: Data Analysis and ReportingChapter 17: Inspector Training and Licensing or Certification Chapter 18: Public Information and Consumer Protection Chapter 19: Improving Repair EffectivenessChapter 20: Compliance with Recall Notices Chapter 21: On-Road TestingChapter 22: State Implementation Plan Submission Chapter 23: Attachment A - Modeling and Technical Supplement
2. Transportation Control Measures3. Vehicle Miles Traveled4. Clean Gasoline

ivDFW Attainment Demonstration
LIST OF ACRONYMS
ACT - Alternative Control TechniquesAFV - Alternative Fuel VehicleAIRS - Aerometric Information Retrieval SystemAPA - Administrative Procedure ActARACT - Alternate Reasonably Available Control TechnologyARPDB - Acid Rain Program Data BaseASC - Area Source CategoriesASE - Alliance to Save EnergyASM - Acceleration Simulation ModeATC - Air Traffic ControlBACT - Best Available Control TechnologyBEIS-2 - Biogenic Emissions Inventory System, version2BELD - Biogenic Emissions Land Cover DatabaseBIOME - Biogenic Model for EmissionsBPA - Beaumont/Port ArthurCal LEV - California Low Emission VehicleCAM - Compliance Assurance MonitoringCAMS - Continuous Air Monitoring StationCAMx - Comprehensive Air Model with ExtensionsCARB - California Air Resources BoardCARE - Clean Air Responsibility EnterpriseCB-IV HC - Carbon Bond IV HydrocarbonCFR - Code of Federal RegulationsCEMS - Continuous Emissions Monitoring SystemCMAQ - Congestion Mitigation and Air QualityCMSA - Consolidated Metropolitan Statistical AreaCNG - Compressed Natural GasCO - Carbon MonoxideCOAST - Coastal Oxidant Assessment for Southeast TexasCTG - Control Technique GuidelinesDART - Dallas Area Rapid TransitDFW - Dallas/Fort WorthDFWN - Dallas/Fort Worth NorthDFWRTM - Dallas/Fort Worth Regional Travel Model DOW - Day of WeekDRI - Desert Research InstituteDV - Design ValueEGAS - Economic Growth Analysis SystemEGF - Electric Generating FacilitiesEI - Emissions InventoryEIQ - Emissions Inventory QuestionnaireELP - El PasoEPA - U.S. Environmental Protection AgencyEPN - Emission Point NumberERC - Emission Reduction CreditETR - Employer Trip Reduction

vDFW Attainment Demonstration
FAA - Federal Aviation AdministrationFCAA - Federal Clean Air ActFMVCP - Federal Motor Vehicle Control ProgramFR - Federal RegisterFTP - File Transfer ProtocolGIS - Geographic Information Systemg/hp-hr - Grams Per Horsepower-HourGSE - Ground Support EquipmentHAP - Hazardous Air PollutantHAXL - Houston Air Excellence in LeadershipHB - House BillHC - HydrocarbonHDD - Heavy-duty DieselHDDV - Heavy-duty Diesel VehicleHDEWG - Heavy Duty Engine Working GroupHDV - Heavy-duty VehicleHGA - Houston/GalvestonH-GAC - Houston-Galveston Area CouncilHON - Hazardous Organic NESHAPSHOV - High Occupancy VehicleHP - HorsepowerHPMS - Highway Performance Monitoring SystemHRM - Houston Regional MonitoringIIG - Interim Implementation GuidanceIIP - Interim Implementation PlanI/M - Inspection and MaintenanceINIT - Initial Condition TracerITWS - Integrated Terminal Weather SystemIWW - Industrial WastewaterKG/HA - Kilograms/hectareKM - KilometerLDT - Light-duty TruckLED - Low Emission DieselLEV - Low Emission VehicleLNG - Liquefied Natural Gasm - MeterMACT - Maximum Achievable Control TechnologyMERC - Mobile Emission Reduction CreditMMBtu - Million British Thermal UnitMPA - Metropolitan Planning AreaMY - Model YearNAAQS - National Ambient Air Quality StandardNCDC - National Climatic Data CenterNCTCOG - North Central Texas Council of GovernmentsNEGU - Non-electric Generating UnitsNESHAPS - National Emission Standards for Hazardous Air PollutantsNEVES - Nonroad Engine and Vehicle Emission StudyNLEV - National Low Emission Vehicle

viDFW Attainment Demonstration
NNSR - Nonattainment New Source ReviewNOx - Nitrogen Oxides or Oxides of NitrogenNOy - Nitrogen SpeciesNSR - New Source ReviewNWS - National Weather ServiceO3 - OzoneOAQPS - Office of Air Quality Planning and StandardsOBD - On-Board DiagnosticsOSAT - Ozone Apportionment TechnologyOTAG - Ozone Transport Assessment GroupPAMs - Photochemical Assessment Monitoring SitesPEI - Periodic Emissions InventoryPM10 - Particulate Matter less than 10 micronsppb - Parts Per Billionppm - Parts Per Millionppmv - Parts Per Million by VolumePSDB - Point Source DatabasePSIA - Pounds per Square Inch AbsoluteQA/QC - Quality Assurance/Quality ControlRACT - Reasonably Available Control TechnologyRAQPC - Regional Air Quality Planning CommitteeRCTSS - Regional Computerized Traffic Signal SystemRFG - Reformulated GasolineREMI - Regional Economic Modeling, Inc.ROP - Rate-of-ProgressRSD - Remote Sensing DeviceRVP - Reid Vapor PressureSAIMM - Systems Applications International Meteorological ModelSB - Senate BillSCAQMD - South Coast Air Quality Management District [Los Angeles area]SCC - Source Classification CodeSCRAM - Support Center for Regulatory Air ModelsSETRPC - Southeast Texas Regional Planning CommissionSIC - Standard Industrial ClassificationSIP - State Implementation PlanSO2 - Sulfur DioxideSOx - Sulfur CompoundsSOCMI - Synthetic Organic Chemical Manufacturing IndustrySULEV - Super-Ultra-Low Emission VehicleTAC - Texas Administrative CodeTACB - Texas Air Control BoardTAFF - Texas Alternative Fuel FleetTCAA - Texas Clean Air ActTCF - Texas Clean FleetTCM - Transportation Control MeasureTIP - Transportation Implementation PlanTMC - Texas Motorist’s ChoiceTNMOC - Total nonmethane organic compounds

viiDFW Attainment Demonstration
TCEQ - Texas Commission on Environmental Quality (commission)TPOD - Tons Per Ozone DayTPY - Tons Per YearTSP - Total Suspended ParticulateTTI - Texas Transportation InstituteUAM - Urban Airshed ModelUSDA - United States Department of AgricultureUSGS - United States Geological SurveyUTM - Universal Transverse MercatorVAVR - Voluntary Accelerated Vehicle RetirementVERP - Voluntary Emission Reduction PermitVMAS - Vehicle Mass Analysis SystemVMEP - Voluntary Mobile Source Emissions Reduction ProgramVMT - Vehicle Miles TraveledVNR or VNRAT- VOC-NOx ratiosVOC - Volatile Organic CompoundWOE - Weight of Evidence

I-1DFW Attainment Demonstration
VI: Ozone Control Strategy
A. INTRODUCTION
This introduction is intended to provide the reader with a broad overview of the SIP revisions thathave been submitted to the EPA by the State of Texas. Some sections may be obsolete orsuperseded by new revisions, but have been retained for the sake of historical completeness. Thereader is referred to the body of the SIP for details on the current SIP revision.
Requirements for the SIP specified in 40 CFR §51.12 provide that “. . . in any region where existing(measured or estimated) ambient levels of pollutant exceed the levels specified by an applicable nationalstandard, the plan shall set forth a control strategy which shall provide for the degree of emissionreduction necessary for attainment and maintenance of such national standard.” Ambient levels of SO2
and NOx, as measured from 1975 through 1977, did not exceed the national standards set for thesepollutants anywhere in Texas. Therefore, no control strategies for these pollutants were included inrevisions to the Texas SIP submitted on April 13, 1979. Control strategies were submitted and approvedfor inclusion in the SIP for areas in which measured concentrations of ozone, TSP, or CO exceeded anNAAQS during the period from 1975 to 1977. On October 5, 1978, the Administrator of the EPApromulgated a lead ambient air quality standard. The FCAA Amendments of 1977 required that eachstate submit an implementation plan for the control of any new criteria pollutant. A SIP revision for leadwas submitted in March 1981.
The control strategies submitted in 1979 provided, by December 31, 1982, the amount of emissionreductions required by EPA policy to demonstrate attainment of the primary NAAQS, except for ozone,in the Harris County nonattainment area. For that area, an extension to December 31, 1987 wasrequested, as provided for in the FCAA Amendments of 1977.
Supplemental material, including emission inventories for VOCs and TSP submitted with the 1979 SIPrevisions, is included in Appendices H and O of the 1979 SIP submittal.
Proposals to revise the Texas SIP to comply with the requirements of the FCAA Amendments of 1977were submitted to EPA on April 13, November 2, and November 21, 1979. On December 18, 1979 (44FR 75830-74832), EPA approved the proposed revision to the Texas SIP relating to vehicle inspectionand maintenance and extended the deadline for attainment of the NAAQS for ozone in Harris Countyuntil December 31, 1987 (see Appendix Q of the 1979 SIP submittal for the full text of the extensionrequest and the approval notice). On March 25, 1980 (45 FR 19231-19245), EPA approved andincorporated into the Texas SIP many of the remaining provisions included in the proposals submitted bythe state in April and November 1979. The March 25, 1980 Federal Register notice also includedconditional approval of a number of the proposed SIP revisions submitted by the state.
Additional proposed SIP revisions were submitted to EPA by the state on July 25, 1980 and July 20, 1981to comply with the requirements of the March 25, 1980 conditional approvals. By May 31, 1982, all ofthe proposed revisions to the Texas SIP submitted to EPA in April and November 1979, July 1980, andJuly 1981, with the exception of provisions relating to the definition of major modification used in NSRand certain portions of the control strategy for TSP in Harris County, had been fully approved oraddressed in a Federal Register notice proposing final approval. The NSR provisions were approved onAugust 13, 1984.

I-2DFW Attainment Demonstration
The FCAA Amendments of 1977 required SIPs to be revised by December 31, 1982 to provide additionalemission reductions for those areas for which EPA approved extensions of the deadline for attainment ofthe NAAQS for ozone or CO. In 1982 the state submitted a revision to the Texas SIP to comply with theFCAA Amendments of 1977 and EPA rules for 1982 SIP revisions. Supplementary emissions inventorydata and supporting documentation for the revision were included in Appendices Q through Z of the 1982SIP submittal.
The only area in Texas receiving an extension of the attainment deadline to December 31, 1987 wasHarris County for ozone. Proposals to revise the Texas SIP for Harris County were submitted to EPA onDecember 9, 1982. On February 3, 1983, EPA proposed to approve all portions of the plan except for theVehicle Parameter I/M Program. On April 30, 1983, the EPA Administrator proposed sanctions forfailure to submit or implement an approvable I/M program in Harris County. Senate Bill 1205 waspassed on May 25, 1983 by the Texas Legislature to provide the Texas Department of Public Safety withthe authority to implement enhanced vehicle inspection requirements and enforcement procedures. OnAugust 3, 1984, EPA proposed approval of the Texas SIP pending receipt of revisions incorporating theseenhanced inspection procedures and measures ensuring enforceability of the program. These additionalproposed SIP revisions were adopted by the state on November 9, 1984. Final approval by EPA waspublished on June 26, 1985.
Although the control strategies approved by EPA in the 1979 SIP revisions were implemented inaccordance with the provisions of the plan, several areas in Texas did not attain the primary NAAQS byDecember 31, 1982. On February 23, 1983, EPA published a Federal Register notice identifying thoseareas and expressing the intent to impose economic and growth sanctions provided in the FCAA.However, EPA reversed that policy in the November 2, 1983 Federal Register, deciding instead to callfor supplemental SIP revisions to include sufficient additional control requirements to demonstrateattainment by December 31, 1987.
On February 24, 1984, the EPA Region 6 Administrator notified the Governor of Texas that suchsupplemental SIP revisions would be required within one year for ozone in Dallas, Tarrant, and El PasoCounties and CO in El Paso County. The Texas Air Control Board (TACB) requested a 6-monthextension of the deadline (to August 31, 1985) on October 19, 1984. EPA approved this request onNovember 16, 1984.
Proposals to revise the Texas SIP for Dallas, Tarrant, and El Paso Counties were submitted to EPA onSeptember 30, 1985. However, the revisions for Dallas and Tarrant Counties did not provide sufficientreductions to demonstrate attainment of the ozone standard and on July 14, 1987, EPA published intent toinvoke sanctions. Public officials in the two counties expressed a strong desire to provide additionalcontrol measures sufficient to satisfy requirements for an attainment demonstration.
A program of supplemental controls was taken to public hearings in late October 1987. As a result oftestimony received at the hearings, a number of the controls were modified and several were deleted, butsufficient reductions were retained to demonstrate attainment by December 31, 1991. These controlswere adopted by the TACB on December 18, 1987 and were submitted to EPA as proposed revisions tothe SIP. Supplemental data and supporting documentation are included in Appendices AA through AO ofthe 1987 SIP submittal.

I-3DFW Attainment Demonstration
The FCAA Amendments of 1990 authorized EPA to designate areas failing to meet the NAAQS forozone as nonattainment and to classify them according to severity. The four areas in Texas and theirrespective classifications include: HGA (severe), BPA (serious), ELP (serious), and DFW (moderate).
The FCAA Amendments required a SIP revision to be submitted for all ozone nonattainment areasclassified as moderate and above by November 15, 1993, which described in part how an area intends todecrease VOC emissions by 15%, net of growth, by November 15, 1996. The amendments also requiredall nonattainment areas classified as serious and above to submit a revision to the SIP by November 15,1994, which described how each area would achieve further reductions of VOC and/or NOx in the amountof 3.0% per year averaged over three years and which includes a demonstration of attainment based onmodeling results using the UAM. In addition to the 15% reduction, states were also required to preparecontingency rules that would result in an additional 3.0% reduction of either NOx or VOC, of which up to2.7% may be reductions in NOx. Underlying this substitution provision is the recognition that NOx
controls may effectively reduce ozone in many areas and that the design of strategies is more efficientwhen the characteristic properties responsible for ozone formation and control are evaluated for each area. The primary condition to use NOx controls as contingency measures is a demonstration through UAMmodeling that these controls will be beneficial toward the reduction of ozone. These VOC and/or NOx
contingency measures would be implemented immediately should any area fall short of the 15% goal.
Texas submitted rules to meet the ROP reduction in two phases. Phase I consisted of a core set of rulescomprising a significant portion of the required reductions. This phase was submitted by the originaldeadline of November 15, 1993. Phase II consisted of any remaining percentage toward the 15% net ofgrowth reductions, as well as additional contingency measures to obtain an additional 3.0% of reductions. Phase II was submitted by May 15, 1994. The complete list of contingency measures was submitted byNovember 15, 1994. The appropriate compliance date was to be incorporated into each control measureto ensure that the required reductions would be achieved by the November 15, 1996 deadline. Acommitment listing the potential rules from which the additional percentages and contingency measureswere selected was submitted in conjunction with the Phase I SIP on November 15, 1993. That list ofPhase II rules was intended to rank options available to the state and to identify potential rules availableto meet 100% of the targeted reductions and contingencies. Only those portions of the Phase II rulesneeded to provide reasonable assurance of achieving the targeted reduction requirements were adopted bythe commission.
The DFW and ELP areas achieved sufficient reductions with the 15% ROP SIP to demonstrate attainmentby 1996. Attainment Demonstration SIP Revisions for these two areas were submitted on September 14,1994.
The FCAA Amendments of 1990 classified the BPA area as a serious nonattainment area. The BPAnonattainment area includes Hardin, Jefferson, and Orange Counties. The BPA nonattainment area has anozone design value of 0.16 ppm, which places the area in the serious classification.
The FCAA Amendments of 1990 required a Post-96 ROP SIP revision and accompanying rules to besubmitted by November 15, 1994. According to the FCAA Amendments, this submittal had to contain anAttainment Demonstration based on UAM. Additionally, the revision had to demonstrate how the HGAand BPA nonattainment areas intended to achieve a 3% per year reduction of VOC and/or NOx until theyear 2007, and additional reductions as needed to demonstrate modeled attainment. The plan was alsorequired to carry an additional 3% of contingency measures to be implemented if the nonattainment areafails to meet a deadline. To use NOx reductions for all or part of the Post-96 controls or the contingency

I-4DFW Attainment Demonstration
measures required a demonstration using UAM showing that NOx controls would be beneficial inreducing ozone.
On November 9, 1994, the state submitted a SIP revision designed to meet the 3% per year ROPrequirements for the years 1997-1999. This Post-96 ROP SIP revision detailed how the BPA and HGAnonattainment areas intended to achieve these three years' reductions of VOC (or 9% net-of-growth).Most of this amount was achieved by quantifying additional reductions due to existing rules andreductions due to federally-mandated rules. Rules to achieve the further reductions needed to meet theROP SIP goal were submitted to EPA on January 11, 1995. This submittal included modelingdemonstrating progress toward attainment, using a 1999 future year emissions inventory.
On August 14, 1994, the state submitted preliminary UAM modeling results for the BPA and HGAnonattainment areas that showed the relationship between emission levels of VOC and NOx, and ozoneconcentrations. This modeling was conducted with a 1999 future year emissions inventory. Based on theresults of this preliminary modeling, which showed that NOx reductions might increase ozoneconcentrations, on April 12, 1995 the state received a temporary §182(f) exemption from all NOx
requirements, including RACT, I/M, NOx NSR, and transportation conformity requirements. Permanent§182(f) exemptions from all NOx requirements were granted for DFW and ELP, and temporaryexemptions until December 31, 1996 for HGA and BPA. The commission subsequently requested thatEPA extend this date until December 31, 1997. EPA approved this 1-year extension on May 14, 1997.
On March 2, 1995, Mary Nichols, EPA Assistant Administrator for Air and Radiation, issued a memowhich gave states some flexibility to design a phased Attainment Demonstration. It provided for an initialphase which was intended to continue progress in reducing levels of VOC and/or NOx, while giving statesan opportunity to address scientific issues such as modeling and the transport of ozone and its precursorpollutants. The second phase was designed to draw upon the results of the scientific effort and design aplan to bring the area into attainment. To constitute Phase I under this approach, the EPA guidancerequired that states submit the following SIP elements by December 31, 1995:
‚ Control strategies to achieve reductions of ozone precursors in the amount of 3% per year fromthe 1990 baseline EI for the years 1997, 1998, and 1999.
‚ UAM modeling through the year 1999, showing the effect of previously-adopted controlstrategies which were designed to achieve a 15% reduction in VOCs from 1990 through 1996.
‚ A demonstration that the state has met the VOC RACT requirements of the FCAA Amendments.‚ A detailed schedule and plan for the "Phase II" portion of the attainment demonstration which
will show how the nonattainment areas can attain the ozone standard by the required dates.‚ An enforceable commitment to:
# Participate in a consultative process to address regional transport;# Adopt additional control measures as necessary to attain the ozone NAAQS, meet ROP
requirements, and eliminate significant contribution to nonattainment downwind; and# Identify any reductions that are needed from upwind areas to meet the NAAQS.
Texas submitted the first two of these required sections in November 1994. The remaining three, a VOCRACT demonstration, the required commitments, and a Phase II plan and schedule, were submitted onJanuary 10, 1996 to EPA.
ROP SIP modeling was developed for the HGA nonattainment area in two phases using the UAM. Thefirst phase of ROP modeling was the modeling submitted in January 1995, as described above. The

I-5DFW Attainment Demonstration
second phase of the ROP modeling was conducted using data obtained primarily from the COASTproject, an intensive 1993 field study. The COAST modeling for HGA and the associated SIP wereprojected to be completed by December 1996 for submittal in May of 1997. Control strategies developedin this second phase were planned to be based on a more robust database, providing a higher degree ofconfidence that the strategies would result in attainment of the ozone NAAQS or target ozone value. Adiscussion of the schedule for the UAM modeling for the Phase II Attainment Demonstration can befound in Appendix 11-F of the January 10, 1996 submittal.
On January 29, 1996, EPA proposed a limited approval/limited disapproval for the Texas 15% ROP SIPrevision. EPA proposed a limited approval because the SIP revision would result in significant emissionreductions from the 1990 baseline and would, therefore, improve air quality. Simultaneously, the EPAproposed a limited disapproval because it believed that the plan failed to demonstrate sufficient reductionsto meet the 15% ROP requirements. It also proposed a limited approval/disapproval of the contingencyplans (designed to achieve an additional 3% of reductions if needed because a milestone is missed) alongthe same lines as the 15% action. EPA stated that some of the control measures submitted along with theSIP revision did not meet all of the requirements of the FCAA Amendments of 1990 and, therefore,cannot be approved. EPA further stated that it was not making a determination at this time about whetherthe state had met its requirements regarding RACT, or any other underlying FCAA Amendments of 1990requirements. Finally, EPA proposed approval of the Alternate Means of Control portion of theNovember 9, 1994 Post-96 SIP submittal, but did not propose action on any other portion of thatsubmittal.
Additionally, on November 29, 1995, the President signed the National Highway Systems DesignationAct, which, among other things, prohibited EPA from discounting the creditable emissions from adecentralized vehicle I/M testing program if an approvable conditional I/M SIP revision was submitted toEPA within 120 days of the bill’s signature. EPA’s Office of Mobile Sources issued guidance stating thatit would accept an interim I/M SIP proposal and Governor's letter 120 days after signature of the bill inlieu of an adopted SIP revision. The SIP proposal and letter was submitted to the EPA prior to the March27, 1996 deadline to meet the 120-day time frame. The final I/M SIP revision (Rule Log No. 96104-114-AI), commonly referred to as the “Texas Motorist’s Choice Program,” was adopted by the commission onMay 29, 1996 and submitted to the EPA by the state on June 25, 1996. On October 3, 1996, EPAproposed (61 FR 51651-51659) conditional interim approval of the Texas Motorist’s Choice Programbased upon the state’s good faith estimate of emission reductions and the program’s compliance with theClean Air Act.
Part of EPA’s determination that the new I/M SIP is approvable depends on the program’s ability toachieve sufficient creditable VOC reductions so that the 15% ROP can still be achieved. The commissiondesigned the revised I/M program to fit in with the other elements of the 15% SIP to achieve the fullamount of creditable reductions required. The I/M program also achieves creditable reductions for thePost-96 ROP SIP.
Changes to the I/M program have had an impact on the ELP §818 Attainment Demonstration as well. This demonstration was predicated on the assumption that the I/M program would be implemented asadopted for the 15% SIP. An addendum to the §818 Demonstration shows that the basic underlyingassumptions of the modeling still pertain despite the revisions to the I/M program.
The ETR program revision to the SIP and ETR rule were adopted in October 1992 by the TACB to meetthe mandate established in the FCAA Amendments of 1990 (§182(d)(1)(B)). This section of the FCAA

I-6DFW Attainment Demonstration
required states with severe or extreme ozone nonattainment areas to develop and implement ETRprograms in those areas. For Texas, the only area affected was the HGA area. The ETR programrequired large employers (those with 100 or more employees) to implement trip reduction programs thatwould increase the average passenger occupancy rate of vehicles arriving at the workplace during thepeak travel period by 25% above the average for the area.
Congress amended the FCAA in December of 1995 by passing House Rule 325. This amendment allowsthe state to require an ETR program at its discretion. It also allows a state to “remove such provisions(ETR programs) from the implementation plan . . . if the state notifies the Administrator, in writing, thatthe state has undertaken, or will undertake, one or more alternative methods that will achieve emissionreductions (1.81 tons/day) equivalent to those achieved by the removed . . . provisions.” As such, largeemployers will no longer be mandated to implement trip reduction programs. The HGA ozonenonattainment area will, however, through the coordination of the Houston-Galveston Area Council,implement a voluntary regional initiative to reduce vehicle trips.
The 1990 Adjusted Base Year EI was submitted on November 12, 1993. It is the official inventory of allemission sources (point, area, on-road and non-road mobile) in the four nonattainment areas. There havebeen several changes to the EI due to changes in assumptions for certain area and non-road mobile sourcecategories. Changes to the baseline EI have affected the target calculations and creditable assumptionsmade in the 15% and 9% SIPs.
In December of 1990, then-Texas Governor William Clements requested that the BPA area be reclassifiedas a "moderate" ozone nonattainment area in accordance with §181(a)(4) of the FCAA Amendments of1990. That request was denied on February 13, 1991. A recent review of the original request andsupporting documentation has revealed that this denial was made in error. As provided by §110(k)(6) ofthe Act, the EPA Administrator has the authority to reverse a decision regarding original designation if itis discovered that an error had been made.
Monitoring data from a privately-funded, special purpose monitoring network which was not included inthe Aerometric Information Retrieval System database was improperly used to deny this request. Furthermore, subsequent air quality trends demonstrated that BPA is more properly classified as amoderate nonattainment area, and could attain the standard by the required date for moderate areas ofNovember 15, 1996. Therefore, Governor Bush sent a letter and technical support to EPA on July 20,1995, requesting that the BPA area be reclassified to moderate nonattainment status. BPA planned todemonstrate attainment one of the following ways:
‚ Monitored values showing attainment of the standard at state-operated monitors for the years1994-1996, which is the time line the FCAA Amendments of 1990 specifies for moderate areas.
‚ UAM modeling showing attainment of the standard but for transport of ozone and/or precursors.
EPA Region 6 verified the data submitted in support of this request and concurred that it is valid. OnJune 3, 1996, the reclassification of the BPA area became effective. Because the area was classified asserious, it was following the SIP submittal and permitting requirements of a serious area, which includedthe requirements for a Post-96 SIP. With the consolidated SIP submittal, the commission removed theBPA area from the Post-96 SIPs, which became applicable to the HGA nonattainment area only.
The State of Texas, in a committal SIP revision submitted to EPA on November 15, 1992, opted out ofthe Federal Clean Fuel Fleet program in order to implement a fleet emission control program designed by

I-7DFW Attainment Demonstration
the state. In 1994, Texas submitted the state’s opt-out program in a SIP revision to the EPA and adoptedrules to implement the TAFF program. In 1995, the 74th Texas Legislature modified the state’salternative fuels program through passage of SB 200. In response to SB 200, the commission adoptedregulations modifying the TAFF program to create the TCF program.
Since adoption on July 24, 1996 and subsequent submission to EPA of the TCF SIP revision, the 75thTexas Legislature modified the state’s alternative program once again through passage of SB 681. Staffmodified the TCF program, now called the TCF Low Emission Vehicle program, to reflect changesmandated by SB 681.
On June 29, 1994, the commission adopted a revision to the SO2 SIP regarding emissions in HarrisCounty. The SIP revision was required by EPA because of exceedances of the SO2 NAAQS in 1986,1988, and 1990. An EPA study conducted by Scientific Applications International Corporation alsopredicted SO2 exceedances. On April 22, 1991, the EPA declared that portions of Harris County werepotentially in nonattainment of the SO2 NAAQS. Consequently, the HRM Corporation volunteered tofind reductions in SO2 in order to prevent being redesignated to nonattainment. HRM’s efforts resulted infinding voluntary SO2 reductions. These reductions were adopted in 13 commission Agreed Orders andwere included as part of the June 29, 1994 SIP revision. The EPA approved the Harris County SO2 SIPon March 6, 1995 (60 FR 12125).
On May 14, 1997, the commission adopted an additional revision to the Harris County SO2 SIP toincorporate modifications to two of the 13 commission Agreed Orders. The remaining sections of the SIPremained the same. While on the scale of "minor technical corrections," the modified orders weresubmitted as a SIP revision because the new emission rates differ from what EPA had previouslyapproved. The two Agreed Order modifications concerned grandfathered units at Simpson PasadenaPaper Company and Lyondell-Citgo Refining Company, Ltd. The commission approved changes to bothAgreed Orders on July 24, 1996.
On May 14, 1997, the commission also adopted a revision to the SIP modifying the vehicle I/M program. This revision removed the test-on-resale component that had been included in the vehicle I/M program, asdesigned in July of 1996. Test-on-resale required persons selling their vehicles in the I/M core programareas to obtain emissions testing prior to the title transfer of such vehicles. Test-on-resale was notrequired to meet the FCAA Amendments of 1990 and did not produce additional emissions reductionbenefits. The SIP revision also incorporated into the SIP the Memorandum of Understanding between thecommission and the Department of Public Safety, adopted by the commission on November 20, 1996.
The FCAA Amendments of 1990 required that, for severe and above ozone nonattainment areas, statesdevelop SIP revisions that include specific enforceable TCMs, as necessary, to offset increases in motorvehicle emissions resulting from growth in VMT or the number of vehicle trips. This SIP revision wouldalso satisfy reductions in motor vehicle emissions consistent with the 15% ROP and the Post-1996 ROPSIPs.
Therefore, the commission developed and submitted to EPA a committal SIP revision for the HGAnonattainment area on November 13, 1992, and VMT Offset SIP revisions on November 12, 1993 andNovember 6, 1994, to satisfy the requirements of the 15% ROP SIP revision. The former SIP revisionlaid out a set of TCMs and other mobile source controls which reduced emissions below the modeledceiling. The 1994 SIP revision did not require additional TCMs.

I-8DFW Attainment Demonstration
As a result of changes in the I/M and the ETR programs, it was necessary to do the 1997 VMT Offset SIPrevision for the HGA area, which was adopted on August 6, 1997. Additional TCMs were included: highoccupancy vehicle lanes, park and ride lots, arterial traffic management systems, computer transportationmanagement systems, and signalization. These TCMs were part of the “Super SIP” submitted to EPA onJuly 24, 1996.
Using the best technical guidance and engineering judgement available at the time, the State of Texascalculated emissions reductions available from the enhanced monitoring rule that was to be part of theTitle V permitting program. The enhanced monitoring rule was later revised and transformed into theCAM Rule. Texas maintained that its calculation methodologies still accurately reflected the amount ofcreditable reductions available. EPA disagreed with the calculation methodologies used by the state andintends to disapprove the 9% SIP as a result. EPA also indicated that the emission reduction creditsclaimed for the Texas Clean Fuels Fleet program were not approvable due to a legislative change to theprogram. The state plans to submit a SIP revision for this program in a separate action, but has removedthe credits claimed in the 9% SIP in this action. The State of Texas proposed to submit a revision to the9% SIP which revises the reductions claimed by the state toward the 9% emissions target.
The State of Texas did not reapply for an extension of the NOx §182(f) waivers for HGA and BPA asdiscussed previously. Therefore, on December 31, 1997, the waivers expired. The state is now requiredto implement several NOx control programs. Among them is a requirement for all major NOx sourceswithin the area to implement RACT. The state has adopted a revised compliance date of November 15,1999 for this program.
The commission, in a committal SIP revision adopted on June 3, 1998, and submitted to EPA on June 23,1998, agreed to implement OBD checks as part of the I/M program by the federal deadline of January 1,2001.
On July 29, 1998, the commission adopted regulations and a revision of the TCF SIP to set forth the LEVrequirements for mass transit fleets in each of the serious and above nonattainment areas, and for localgovernment and private fleets operated primarily within the serious and above nonattainment areas. These rules satisfy the state requirements to adopt rules to implement SB 681.
The DFW area was classified as a moderate ozone nonattainment area in accordance with the FCAAAmendments of 1990. As a moderate nonattainment area, DFW was to demonstrate, through monitoring,attainment of the 1-hour ozone standard by November 15, 1996, or face being “bumped up” to the seriousclassification. Air quality data from DFW ambient air quality monitors for the years 1994-96 show thatthe 1-hour NAAQS for ozone has been exceeded more than one day per year over this three-year period. On February 18, 1998, the EPA issued a final notice in the Federal Register that the DFW area was beingreclassified to the serious classification for failing to attain the NAAQS for ozone. As a result of thisreclassification, the EPA required that a new SIP demonstrating attainment of the ozone standard in DFWbe submitted by March 20, 1999. The state submitted a SIP for DFW that included photochemicalmodeling showing the level of reductions needed to attain the standard by 1999, a 9% ROP targetcalculation for the years 1997-99, VOC RACT rules in Chapter 115 applicable to sources meeting the 50tpy major source level, NOx RACT rules in Chapter 117 applicable to major sources of NOx, andamendments to Chapter 116 reinstating nonattainment new source review for NOx. The governorsubmitted this SIP to EPA on March 16, 1999. Because there was not enough time to implement the rulesto achieve necessary reductions of ozone precursor emissions in the DFW area by the required attainment

I-9DFW Attainment Demonstration
date of November 15, 1999, the state proposed to submit in March 2000 a full attainment demonstrationincluding a complete rule package necessary to attain the 1-hour ozone standard.
On February 24, 1999 the commission adopted a SIP revision for the DFW area which was submitted toEPA on March 16, 1999. This SIP was not only intended to demonstrate how the DFW area would attainthe standard through the submission of an updated emissions inventory and photochemical modeling, butto also include a 9% ROP target calculation in order to satisfy EPA’s requirement of reasonable furtherprogress in emission reductions for the DFW area for the years 1997-99. The reductions toward ROPwere short of the 9% target and the SIP lacked required modeled control strategies; therefore, a follow-upSIP was developed. More information about the follow-up submittal is addressed later in thisintroduction.
On May 12, 1999 the commission adopted a revision to the SIP for the Northeast Texas region whichwould make certain local ozone precursor emission reductions federally enforceable. This revision wassubmitted to EPA on June 4, 1999. Four affected companies (Norit Americas, Inc.; La Gloria Oil and GasCompany; Eastman Chemical Company, Texas Eastman Division; and ARCO Permian) in the NortheastTexas region voluntarily agreed to be subject to the implementation of enforceable emission reductionmeasures pursuant to Part A, Sections 2-5 of the Northeast Texas Flexible Attainment Region (FAR)Memorandum of Agreement. The FAR approach allows time for the area’s control program to work,similar to contingency measures in a post-1990 maintenance agreement, prior to EPA issuing a call for aSIP revision or nonattainment redesignation. The MOA required the immediate implementation ofcontrol measures through the use of Agreed Orders, which are included in the SIP revision to make themfederally enforceable.
On June 30, 1999 the commission adopted a revision to the SIP in order to incorporate cleaner gasolinerules. The cleaner gasoline is required to have a lower RVP outside the DFW and HGA areas, and a limiton the amount of sulfur in each gallon of gasoline. The RVP required in this SIP revision is 7.8 psistarting May 1, 2000. The RVP limit would be in effect every summer from May 1st through October1st. A 7.8 psi RVP fuel is expected to reduce evaporative emissions from automobiles, off-highwaygasoline powered equipment, and all gasoline storage and transfer operations. Evaporative VOCemissions from automobiles will be reduced by at least 14%. The sulfur cap requirement is 150 ppm pergallon of gasoline, starting January 1, 2004. Low sulfur gasoline is expected to reduce NOx emissionsfrom today’s cars by 8.5% according to the EPA complex model. The rules would further provide forcounties or large cities to opt into these regulations earlier than required provided that certain conditionsare met. If EPA were to adopt sulfur regulations to require compliance by January 1, 2004, thecommission’s rules would no longer apply, allowing the federal sulfur rules to take precedence. However, areas that choose to opt-in early would continue to follow the sulfur requirements of their earlycompliance plan until EPA actually implemented its regulations, unless otherwise specified in thecommission order.
On July 28, 1999 the commission adopted a site-specific revision to the SIP which provides for theredesignation to attainment of that portion of Collin County currently designated as nonattainment for thelead NAAQS. The revision also provides a maintenance plan for the area to ensure continuedcompliance. As part of the maintenance plan, the revision establishes a new contingency plan through anagreed order and replaces Agreed Board Orders 92-09(k) and 93-12 and Board Order 93-10. The revisionalso provides for a commitment by the commission to keep the existing monitoring network in place untilthe end of the maintenance period.

I-10DFW Attainment Demonstration
On October 15, 1999 the commission adopted a revision to the SIP for the DFW ozone nonattainmentarea. This SIP was developed in order to address the shortfall in the reductions toward the 9% ROP targetand the lack of modeled control strategies from the February 24, 1999 revision. Potential emissionreduction credits were reviewed that were not claimed in the February 1999 SIP in order to make up theROP shortfall. The focus was on VOC reductions because fewer VOC reductions would be needed tomake up the shortfall compared to NOx emission reductions. The ROP lacked about 20% of the VOCreductions needed, which amounted to 5.87 tpd. Making the 9% TOP portion of the SIP complete shouldallow certain transportation projects to avoid being put on hold. Elements have been identified that werenot previously considered that would bring SIP emission reduction credits in order to complete the 9%TOP requirements for the years 1996-99. These technical corrections were included in the October 1999revised SIP.
In November 1998, the H.A. SIP revision submitted to EPA in May 1998 became complete by operationof law. However, EPA stated that it could not approve the SIP until specific control strategies weremodeled in the attainment demonstration. EPA specified a submittal date of November 15, 1999 for thismodeling. As the H.A. modeling protocol evolved, the state eventually selected and modeled seven basicmodeling scenarios. As part of this process, a group of H.A. stakeholders worked closely withcommission staff to identify local control strategies for the modeling. This modeling showed a gap inreductions necessary for attainment of the 1-hour ozone standard. The commission adopted theserevisions to the SIP on October 27, 1999.
In January 1997 the commission proposed a program that, for the first time in Texas’ air pollution controlhistory, extended beyond the confines of the urbanized areas. The concept of the regional strategy wasdeveloped as a result of several major occurrences. These events include the COAST Study, participationin the OTAG process, deployment of intensive aircraft monitoring by Baylor University, and thedevelopment of regional photochemical modeling. While Texas was not involved in the OTAG SIP callrequiring mandatory statewide NOx reductions, the commission realized the importance of the role oftransported ozone and/or its precursors and the need for a statewide comprehensive plan in order to assistthe areas that are struggling to attain the ozone standard. The impact on several states from the smokeand haze episodes from fires in Central America during the summer of 1998 helped reinforce the fact thatair pollution is capable of traveling hundreds of miles.
The purpose of the regional strategy is to reduce ozone causing compounds in the eastern half of the statein order to help reduce background levels of ozone in both non attainment areas as well as those areasclose to a noncompliance for the new 8-hour ozone standard. Components of the regional strategyincluded support for the NLEV program, cleaner burning gasoline and stage. I vapor recovery, voluntaryinvolvement in the permitting of grand fathered facilities, and reductions from major stationary sources.
On July 16, 1998, EPA issued a guidance memorandum titled “Extension of Attainment Dates forDownwind Transport Areas.” The guidance, referred to hereinafter as the “transport guidance,” providesa means for EPA to extend the attainment date for an area affected by transported air pollution, withoutreclassifying (“bumping up”) the area to a higher classification. The transport guidance is particularlyrelevant to B.A., which is downwind of the H.A. area and is affected by transport from H.A. If EPAapproved such a determination for B.A., the area would have until no later than November 15, 2007, theattainment date for H.A., to attain the 1-hour ozone standard. There is also mounting technical datawhich suggests that the DFW area is impacted by transport and high regional background levels of ozone. A modeling demonstration has been developed and shows that the air quality in the DFW area isinfluenced at times from the H.A. area. This demonstration, if approved by the EPA, would allow EPA to

I-11DFW Attainment Demonstration
determine that the area should not be bumped up from serious too severe under the conditions of the July16, 1998 transport guidance. If approved by the EPA the new attainment date for the DFW area would beno later than November 15, 2007, the attainment date for HGA.
As a result of the transport demonstrations for BPA and DFW, the development of SIPs in Texas will be,for the first time ever, on a coordinated timeline. This coordinated planning effort will include three ofthe state’s four 1-hour ozone nonattainment areas as well as future 8-hour ozone areas. While there isuncertainty with the 8-hour ozone standard due to a pending court case, EPA’s original plan calls fordesignations of 8-hour areas in 2000, SIP submittals by 2003, and attainment of the 8-hour standard by2007. This statewide comprehensive planning with 2007 as a target date will allow Texas to utilize itsresources in the most efficient manner to develop control strategies to reduce air pollution not only in theurbanized areas but regionally as well.
The challenges associated with reducing pollution levels to comply with the federal standards are verygreat, especially in the state’s two largest urban areas - DFW and HGA. Commission staff worked veryclosely with local entities to develop recommendations that will get the respective areas into attainment. Future attainment relies on not only the development of local and state control measures, but on futurefederal rules involving new technologies as well. These especially involve cleaner fuels and cleanerengines for both on-road as well as non-road mobile sources. Unfortunately, many of these federalmeasures will not be available until the 2004 time frame and then time will be required to provide forturnover before they will become effective at reducing pollution levels. This would make it very difficultfor any large urban nonattainment area to comply before the 2007 time frame. As a result of federalmeasures, state regulations, and local initiatives it is estimated that emissions in the eastern and centralpart of the state that contribute to the production of ground level ozone will be reduced by approximately100 tpd by 2001; approximately 1200 tpd by 2003; approximately 1400 tpd by 2005; and approximately1500 tpd by 2007. Texas is committed to implementing these strategies as quickly as practicable.
In the April 2000 SIP revision for HGA the state made the following enforceable commitments: 1) toquantify the shortfall of NOx reductions needed for attainment; 2) to list and quantify potential controlmeasures to meet the shortfall of NOx reductions needed for attainment; 3) to adopt the majority of thenecessary rules for the HGA attainment demonstration by December 31, 2000, and to adopt the rest of therules as expeditiously as practical, but no later than July 31, 2001; 4) to submit a Post-99 ROP analysis byDecember 31, 2000; 5) to perform a mid-course review by May 1, 2004; and 6) to perform new mobilesource modeling, using MOBILE6, within 24 months of the model’s release. In addition, if atransportation conformity analysis is to be performed between 12 months and 24 months after theMOBILE 6 release, transportation conformity will not be determined until Texas submits an MVEBwhich is developed using MOBILE 6 and which the EPA finds adequate. Finally, if any of the measuresadopted in the SIP pertain to motor vehicles, the commission commits to recalculate and resubmit aMVEB by December 31, 2000.
The BPA area is classified as moderate, and therefore was required to attain the 1-hour ozone standard byNovember 15, 1996. The BPA area did not attain the standard by that date, and also did not attain thestandard by November 15, 1999, the attainment date for serious areas. In determining the appropriateattainment date for an area, EPA may consider the effect of transport of ozone or its precursors from anupwind area which interferes with the downwind area’s ability to attain. On April 16, 1999, EPAproposed in the Federal Register to allow BPA to take advantage of the transport guidance if anapprovable attainment demonstration is submitted by November 15, 1999. The SIP revision, adopted by

I-12DFW Attainment Demonstration
the commission on October 27, 1999 and submitted to EPA by November 15, 1999, contained results ofphotochemical modeling demonstrating transport from HGA to BPA, and, following EPA’s transportguidance, demonstrating that BPA attains the 1-hour ozone standard. In addition, the November 1999SIP revision contained adopted rules for IWW and batch process sources to ensure that VOC emissionlimits for these sources meet EPA’s guidelines for RACT. Furthermore, the SIP revision includedadopted rules establishing NOx RACT emission limits for gas-fired, lean-burn stationary internalcombustion engines. These NOx rules represented “Phase I” of a two-part revision to the BPA attainmentdemonstration SIP.
The April 2000 SIP revision represented “Phase II” of the BPA attainment demonstration SIP, andcontained adopted rules specifying NOx emission limits for electric utility boilers, industrial boilers, andindustrial process heaters. In accordance with EPA guidance, implementation of these NOx emissionlimits represented a reasonable level of control, necessary for an approvable attainment demonstration. Modeling of these Phase II reductions showed that the BPA area attains the 1-hour ozone standard, usingWOE analyses.
The DFW area’s attainment deadline as a serious ozone nonattainment area was November 15, 1999.
In March 1999 the state submitted an attainment demonstration to EPA, however this SIP submittal didnot contain the necessary rules to bring the DFW area into attainment by the November 1999 deadline. As a result, EPA issued a letter of findings that the March 1999 submittal was incomplete. This findingtriggered a 18-month sanctions clock effective May 13, 1999.
The state now has been mounting technical data suggesting that DFW is significantly impacted bytransport and regional background levels of ozone. The reductions from the strategies needed for theH.A. area and the regional rules discussed are a necessary and integral component in the strategy forDFW’s attainment of the 1-hour ozone standard. The April 2000 SIP contained a modelingdemonstration which showed that the air quality in the DFW area is influenced at times from the H.A.area. This demonstration, if approved by EPA, would allow EPA to determine that the DFW area shouldnot be bumped up to a more severe classification. It would also allow DFW to have until no later thanNovember 15, 2007, the attainment date for H.A., to reach attainment.
In order to develop local control strategy options to augment federal and state programs, the DFW areaestablished a North Texas Clean Air Steering Committee made up of local elected officials and businessleaders. Specific control strategies were identified for review by technical subcommittee members. Inaddition, the NCTCOG hired an environmental consultant to assist with the analysis and evaluation ofcontrol strategy options. The consultant was responsible for presenting the findings of the technicalsubcommittees to the NCTCOG air quality policy and steering committees for final approval prior tobeing submitted to the state. A WOE argument was developed for DFW consisting of several elementswhich, taken together, formed a compelling argument that attainment will be achieved by 2007.
The commission adopted the DFW Attainment Demonstration SIP on April 19, 2000. The SIP submittalcontained the following elements: 1) photochemical modeling of specific control strategies and futurestate and national rules for attainment of the 1-hour ozone standard by November 15, 2007; 2) a modelingdemonstration that shows that the air quality in the DFW area is influenced at times by transport from theH.A. area. ; 3) control strategies selected and developed by the NCTCOG and the state; 4) transportationconformity MVEBs for NOx and VOC; and 5) a commitment to perform and submit a mid-course reviewby May 2004.

I-13DFW Attainment Demonstration
In a further revision of the DFW SIP on May 23, 2001, the commission repealed the airport GSE rule forthe DFW area because agreed orders were signed with the area’s major airlines, airports, andgovernmental entities to achieve the same NOx reductions that would have been achieved by the rule.
On April 19, 2000 the state adopted a revision to the Northeast Texas FAR SIP. The Flexible AttainmentRegion Agreement requires that contingency measures be implemented as a result of exceedances of theNational Ambient Air Quality Standard for ozone. As outlined in the FAR Action Plan under Part B,Contingent Measures, in the event of a subsequent violation the SIP must be revised to includequantifiable and enforceable control measures. Through the use of Agreed Orders these measures wereadopted and included in the Northeast Texas FAR SIP to make them federally enforceable.
The commission adopted a revision to the I/M SIP on April 19, 2000 that includes onboard diagnosticschecks and ASM test equipment and extends the program to all four of the core counties of the DFWozone nonattainment area and five surrounding counties. On December 6, 2000, the commission adopteda revision to the I/M SIP that extends the program to the entire 8-county HGA ozone nonattainment area. The revision also incorporated program changes that apply in all I/M program areas.
On May 3, 2000 the state adopted a revision to the TCM and VMT portions of the SIP. This revisionrequired TCM project-specific descriptions and estimated emissions reductions to be included in the SIPand allowed nonattainment area MPOs to substitute TCMs without a SIP revision if the substitutionresults in equal or greater emission reductions.
The commission adopted the HGA Post-1999 ROP and Attainment Demonstration SIP on December 6,2000 . The December 2000 submittal contained the following elements: 1) rules and photochemicalmodeling analyses in support of the HGA ozone attainment demonstration; 2) post-1999 ROP plans forthe milestone years 2002 and 2005, and for the attainment year 2007; 3) transportation conformityMVEBs for NOx and VOC; 4) enforceable commitments to implement further measures in support of theHGA attainment demonstration; and 5) a commitment to perform and submit a mid-course review by May2004.
In order for the state to have an approvable attainment demonstration, the EPA indicated that the stateneeded to adopt those strategies modeled in the November 1999 SIP submittal, and then adopt sufficientmeasures to close the remaining gap in NOx emissions. The modeling indicated an emissions gap suchthat an additional 91 tpd of NOx reductions was necessary for an approvable attainment demonstration. The HGA nonattainment area needs to ultimately reduce NOx by more than 750 tpd to reach attainmentwith the 1-hour ozone standard. In addition, a VOC reduction of about 25% will also have to beachieved.
The September 2001 SIP revision for the HGA ozone nonattainment area included the followingelements: 1) corrections to the ROP table/budget for the years 2002, 2005, and 2007 due to amathematical inconsistency; 2) incorporation of a change to the idling restriction control strategyclarifying that the operator of a rented or leased vehicle is responsible for compliance with therequirements of Chapter 114 in situations where the operator of a leased or rented vehicle is not employedby the owner of the vehicle (the commission committed to making this change when the rule was adoptedin December 2000); 3) incorporation of revisions to the clean diesel fuel rules to provide greaterflexibility in complying with the requirements of the rule while preserving the emission reductionsnecessary to demonstrate attainment in the HGA area; 4) incorporation of a stationary diesel engine rulethat was developed as a result of the state’s analysis of EPA’s reasonably available control measures; 5)

I-14DFW Attainment Demonstration
incorporation of revisions to the point source NOx rules; 6) incorporation of revisions to the emissions capand trade rules; 7) the removal of the construction equipment operating restriction and the acceleratedpurchase requirement for Tier 2/3 heavy duty equipment; 8) the replacement of these rules with the TexasEmission Reduction Plan program; 9) the layout of the mid-course review process which details how thestate will fulfill the commitment to obtain the additional emission reductions necessary to demonstrateattainment of the 1-hour ozone standard in the HGA area; and 10) replacement of 2007 Rate of ProgressMVEBs to be consistent with the attainment MVEBs.
In August 2001 the DFW SIP, in accordance with SB 5, was revised to remove two rules submitted withthe area’s attainment demonstration SIP in 2002: 1) operating restrictions for construction and industrialequipment and 2) accelerated purchase of Tier 2/3 heavy-duty diesel equipment. The SIP revision statedthat the diesel emission reduction incentive program contained in SB 5 would replace the above-referenced rules and result in reductions in excess of the reductions expected from the repealed rules. TheSIP stated that the NOx reductions previously claimed in the DFW attainment demonstration SIP wouldbe achieved through an alternate but equivalent federally enforceable mechanism.
In June 2002 the commission proposed to revise the HGA SIP, partly as the result of a legal challenge ofthe 90% NOx reduction requirement for stationary sources in HGA. A court order required thecommission to perform an analysis of the causes of rapid ozone formation events and to identify potentialmitigating measures not yet identified in the HGA attainment demonstration. The scientific studyconducted by the commission showed that highly-reactive VOCs play a significant role in this rapidozone formation and were previously under reported in the December 2000 H.A. SIP. This studyconcluded that controlling industrial highly-reactive VOC emissions is necessary to reduce ozoneconcentrations. Additional analyses provide a directional indication that it may be possible to achievethe same level of air quality benefits with reductions in industrial highly reactive VOC emissions,combined with an 80% reduction in NOx emissions from industrial sources, as would be realized solelywith a 90% reduction in industrial NOx emissions. In light of these findings and in compliance with thecourt order, in June 2002 the commission proposed new rules to reduce emissions of certain highly-reactive VOCs from four key industrial sources: fugitives, flares, process vents, and cooling towers. Thecommission also proposed a revision to the speed limit strategy, and the development of the energyefficiency program and the protocol for the TERP program through EPA’s Economic Incentive Program.
Background on the March 2003 Revision
This SIP revision addresses three elements of the SIP:
(1) Revision of the NOx control strategy for cement kilns as the result of a settlement agreement with twoaffected industries. The commission has adopted a revision of the associated rules in Chapter 117.
(2) Incorporation of the energy efficiency measures contained in the SIP.

iDFW Attainment Demonstration
DALLAS/FORT WORTH ATTAINMENT DEMONSTRATIONTABLE OF CONTENTS
Chapter 1: General1.1 Background1.2 Public Hearing Information1.3 Social and Economic Considerations1.4 Fiscal and Manpower Resources
Chapter 2: Emissions Inventory2.1 Overview2.2 Point Sources2.3 Area Sources2.4 On-Road Mobile Sources2.5 Non-Road Mobile Sources 2.6 Biogenics2.7 Emissions Summary2.8 Transportation Conformity2.9 Motor Vehicle Emissions Budget
Chapter 3: Photochemical Modeling3.1 Introduction3.2 Summary of Results of the Phase I SIP3.3 Attainment Year for the Phase II SIP3.4 Evolution of Phase II Attainment Demonstration Modeling3.5 Base 4d Base Case3.6 2007b Future Case3.7 Control Strategy Development
Chapter 4: Data Analysis
Chapter 5: Rate-of-Progress
Chapter 6: Required Control Strategy Elements6.1 VOC Rules6.2 NOx Rules6.3 Weight of Evidence Analyses
Chapter 7: Future Attainment Plans

ii
DALLAS/FORT WORTH ATTAINMENT DEMONSTRATIONLIST OF APPENDICES
APPENDIX APPENDIX NAME
A Description of the Methodology for Determining Credit for Energy Efficiency
B Boundary and Initial Conditions
C Meteorological and Air Quality Data
D Base Case Modeling Emissions Inventory Development
E Base Case Modeling and Performance Evaluation
F 2007 Future Year Modeling Inventory Development
G Transportation Control Measures
H Survey Results for DFW Point Source VOC and NOx Inventory to Backcast 1990Emissions and Predict 1999 Emissions
I RACT Analysis for DFW 50-100 TPY Non-CTG/ACT Sources
J Adjustment of Projected 1999 VOC and NOx Inventories for Contributions from DFWInternational Airport
K Point Source Accounts and NOx Emissions in 1996 DFW Inventory
L NOx Reductions in DFW Nonattainment Area in 1998 by Texas Utilities for CARE
M Modeling Correspondence with EPA
N Demonstration of Transport From the HGA Ozone Nonattainment Area to DFW
O Calculation of Future Design Value
P Dedicated Alternative Fuel Vehicle Information
Q Revisions to State Implementation Plan for the Control of Ozone Air Pollution, Attainment Demonstration for the DFW Ozone Nonattainment Area and AppendicesA-F. Hard copies of this appendix can be obtained from Chris Kite by phone at (512)239-1959, or by e-mail at [email protected].
R Article by Smith, et.al., Ozone Design Value-Based Attainment DemonstrationMethodology: Application to Two Ozone Nonattainment Areas in Texas in Proceedingsof the Air & Waste Management Association 92nd Annual Meeting and Exhibition

iiiDFW Attainment Demonstration
S Reduction of I/M Program Credit in 4-County Area to Account for Non I/M CommuterTraffic
T Estimation of the Benefits from the Tier2/Low Sulfur Rulemaking for Light-DutyVehicles and Trucks
U E-mail from EPA Region VI -Point Source Growth Rates for HG, BPA, & DFW SIP
Modeling, 3/22/00, Richard Karp
V Improved Construction Inventory Documentation
W Discussion of Methodology of Airport Ground Support Emissions Inventory
X NCTCOG report, NCTCOG 2007 On-Road Mobile Source Episodic Emission Inventoryfor the Dallas-Fort Worth 37-County Modeling Domain, Volume II . Hard copies of thisappendix can be obtained from Chris Kite by phone at (512) 239-1959, or by e-mail [email protected].

ivDFW Attainment Demonstration
DALLAS/FORT WORTH ATTAINMENT DEMONSTRATIONLIST OF TABLES
TABLE # TABLE NAME
2.9-1 Motor Vehicle Emissions Budget Calculations3.5-1 Comparison of Phase I3.5-2 CAMx Base 4d Base Case Ozone Performance Statistics for June 18-22, 1995 Episode3.5-3 CAMx Base 4d Base Case Ozone Performance Statistics for June 30-July 4, 1996
Episode3.6-1 Adjustments Made to On-Road Mobile Source Emissions for 2007b Future Base3.6-2 Comparison of Base 4d and 2007d Future Base Emissions by Category in the DFW 4-
county Area for July 3, 19963.6-3 Peak Modeled Ozone in the Core Domain, 1995-96 Base 4d and Future Base 2007b3.7-1 Control Strategies Modeled with 2007b Future Base3.7-1 Control Strategies Modeled with 2007b Future Base (Part 2)3.7-1 Control Strategies Modeled with 2007b Future Base (Part 3)3.7-2 Reduction Factors Applied to 2007b Future Base On-Road Mobile Source Emissions3.7-3 Reduction Factors Applied to 2007b Future Base Area+Non-Road Mobile Source
Emissions3.7-4 Strategy D29 Emissions by Category in the DFW 4-county Area for July 3, 19966.2-1 Total 2007 Emission Reductions by Type of TCM6.2-2 Estimated VMEP NOx Emissions 6.2-3 Summary of DFW Area Voluntary Measures6.3-1 Comparison of Base 4d and Base 5 Emissions by Category in the DFW 4-county Area for
July 3, 19966.3-2 CAMx DFW Base Case Ozone Performance Statistics for June 18-22, 1995 Episode6.3-3 CAMx Base Case Ozone Performance Statistics for June 30-July 4, 1996 Episode6.3-4 Comparison of 1995 Base 5 and 2007d Future Base Emissions by Category in the DFW
4-county Area for July 3, 19966.3-5 2007 Future Base Peak Ozone Predictions (Compared with Base Case)6.3-6 2007d Directional Guidance Modeling6.3-7 Comparison of 2007d Future Base and Strategy D30 Emissions by Category in the DFW
4-county Area for July 3, 19966.3-8 2007 Future Base Peak Ozone Predictions (Compared with Base Case)6.3-9 Ozone Measures Modeled for Base5, Future Base 2007d, and Strategy D306.3-10 Future Design Values for the DFW Area

vDFW Attainment Demonstration
DALLAS/FORT WORTH ATTAINMENT DEMONSTRATIONLIST OF FIGURES
FIGURE # FIGURE NAME2.7-1 1996 VOC Emissions in DFW2.7-2 1996 NOx Emissions in DFW2.7-3 2007 VOC Emissions in DFW2.7-4 2007 NOx Emissions in DFW3.1-1 DFW Nested Grid Modeling Domain3.6-1 Maximum Daily Modeled Ozone for Base 4d, Future Base 2007b, and Control Strategy
D296.3-1 Maximum Daily Modeled Ozone for Base 5, Future Base 2007d, and Control Strategy
D306.3-2 Back Trajectories from DFW, September 19, 19986.3-3 Baylor Aircraft Flight Path for September 19, 1998 with Observed Ozone Concentrations6.3-4 Design Value Trends in the DFW Nonattainment Area
NOTE: These figures were all created as color graphics. Due to cost and time constraints they have beenphotocopied in black and white. To request copies in color please contact Heather Evans at (512) 239-1970 or via email [email protected]

1-1DFW Attainment Demonstration
CHAPTER 1: GENERAL
1.1 BACKGROUNDThe DFW area was classified as a moderate ozone nonattainment area in accordance with the FCAAAmendments of 1990. As a moderate nonattainment area, DFW was required to demonstrate attainmentof the 1-hour ozone standard by November 15, 1996. A SIP was submitted based on a VOC-onlystrategy. Air quality data from the DFW area ambient air quality monitors from the years 1994-96showed that the 1-hour NAAQS for ozone was exceeded more than one day per year over this three-yearperiod.
As a result, the EPA reclassified the DFW area from moderate to serious, effective March 20, 1998, forfailing to monitor attainment of the 1-hour ozone standard by the November 1996 deadline. The EPArequired that a serious area SIP revision addressing attainment of the standard be submitted by March 20,1999. The photochemical modeling investigated the effectiveness of both VOC and NOx reductions forreducing ground-level ozone. The modeling results indicated that a combination of both NOx and VOCreductions is most effective at reducing ozone levels in the DFW area. Previous modeling resultssubmitted to the EPA in 1994 indicated that attainment of the standard could be reached by VOCreductions alone. The DFW area applied for and was granted a waiver from §182(f) of the FCAA,regarding NOx reductions, on November 28, 1994. Because EPA’s approval of this waiver wasconditional on future photochemical modeling showing that NOx reductions contribute toward attainmentin the DFW area, submittal of this modeling resulted in EPA rescinding the NOx waiver and reinstatingthe NOx requirements for DFW, effective June 21, 1999. A SIP was submitted to the EPA on March 18,1999 that contained a 9% ROP target calculation and emission reductions toward satisfying EPA’srequirement of reasonable further progress for the DFW four-county nonattainment area for the years1997-99. In addition, the SIP contained photochemical modeling showing the level of reductions neededto attain the standard by 1999. The modeling indicated that reductions of NOx would be needed to attainthe standard. Therefore, the following rules were developed and included in the SIP:
• RACT for NOx
• Nonattainment NSR for NOx
• Fix-ups from the change in the major source threshold for RACT for VOCs
The commission indicated to the EPA and the local area that, due to time constraints, the March 1999 SIPwould not have the rules necessary to bring the DFW area into attainment by the November 1999deadline and that a complete attainment demonstration would be submitted in the spring of 2000. As aresult, the EPA issued a letter of findings that the February 1999 SIP was incomplete, which triggered an18-month sanctions clock effective May 13, 1999.
The attainment deadline for serious areas is November 15, 1999. Because of numerous 1-hour ozoneexceedances in 1997, 1998, and 1999, it was not possible for the DFW area to attain the standard by thatdeadline. There is mounting technical data suggesting that DFW is significantly impacted by transportand regional background levels of ozone. The reductions from the strategies needed for the HGA areaand the regional rules are a necessary and integral component in the strategy for DFW’s attainment of the1-hour ozone standard.
In order to develop local control strategy options to augment federal and state programs, the DFW areaestablished a North Texas Clean Air Steering Committee made up of local elected officials and businessleaders. Specific control strategies were identified for review by technical subcommittee members. In

1-2DFW Attainment Demonstration
addition, the NCTCOG hired an environmental consultant to assist with the analysis and evaluation ofcontrol strategy options. The consultant was responsible for presenting the findings of the technicalsubcommittees to the NCTCOG air quality policy and steering committees for final approval prior tobeing submitted to the state.
On April 19, 2000, the commission adopted a SIP revision and associated rules for the DFW ozoneattainment demonstration. The SIP revision contained the following control strategy elements:
! Federal and State measures to be implemented by 2007 (12 counties)
< On-road mobile source standards: Federal Phase II reformulated gasoline (RFG) Tier 2 vehicle emission standards Federal low sulfur gasoline (30 ppm) National low emission vehicles (NLEV) Heavy-duty diesel standards
< Non-road mobile source standards: Lawn and garden equipment Tier 3 heavy-duty diesel equipment Locomotives Standards for compression ignition vehicles and equipment Standards for spark ignition vehicles and equipment Recreational marine standards
< Point Sources: • SB 7 mandated that grandfathered EGFs in central and eastern Texas reduce
emissions by 50% of 1997 levels• Sources identified as grandfathered were reduced by 30%, while sources identified
as permitted were not reduced. Sources whose status could not be determined werereduced by the average (weighted) value of 13%. This is included as part of theWeight-of Evidence Analysis.
• Emissions from EGFs in the remainder of the state are also to be reduced by 30%.• In Oklahoma, Arkansas, Louisiana, Mississippi, and Florida, a reduction of 30%
from 1996 emission levels was assumed for all point source NOx to reflect nationaltrends toward lowered emissions. In Georgia, Missouri, Kentucky and Tennessee,NOx emissions were reduced by 59% from 1996 levels to reflect reductions expectedunder EPA’s NOx SIP Call. This is included as part of the Weight-of EvidenceAnalysis.
In addition, the following controls were endorsed and recommended by the North Texas Clean AirSteering Committee. While the commission took all recommendations from the North Texas Clean AirSteering Committee very seriously, some control strategies were modified from the Committee’srecommendations due to technical and other constraints.
• Electric generating facilities reduced up to 88% with use of episodic control technologies
• Up to 50% NOx reductions in Ellis County from controls on cement kilns

1-3DFW Attainment Demonstration
• ASM including VMAS with integrated OBD I/M test with increased enforcement
• Remote sensing to detect high emitting vehicles
• Vehicle recycling
• Transportation control measures
• Travel demand management, such as van pool, park and ride
• Voluntary incentive program for off-road and on-road diesel vehicles
• California diesel
• Airport electrification standards and operations management with state or local control
• Voluntary non-road mobile emission reduction program
• Energy conservation efforts for buildings which includes 2000 International Energy ConservationCode (IECC), and low-NOx water heaters
• California large spark ignition (LSI) engines (> 25 hp)
• A 5 mph speed limit reduction from currently existing 70 and 65 mph posted limits
A complete description of the control strategies is presented in Chapter 6 of this SIP.
The April 19, 2000 SIP contained the following elements:
‚ Photochemical modeling of specific control strategies and future state and national rules forattainment of the 1-hour ozone standard in the DFW area by the attainment deadline of November15, 2007.
‚ A modeling demonstration that shows that the air quality in the DFW area is influenced at timesby transport from the HGA area.
‚ Identification of the level of reductions of VOC and NOx emissions necessary to attain the 1-hourozone standard by 2007.
‚ Control strategies developed by the State involving controls on stationary sources.
‚ Control strategies selected by the NCTCOG North Texas Clean Air Steering Committee.
‚ A 2007 mobile source budget for transportation conformity.
‚ A commitment to perform and submit a mid-course review by May 1, 2004.

1-4DFW Attainment Demonstration
This attainment demonstration SIP, if approved by the EPA, would allow EPA to determine that the DFWarea should not be bumped up from serious to severe under the conditions of a transport policy publishedin the Federal Register on July 16, 1998. The new attainment date for the DFW area would be no laterthan November 15, 2007, the attainment date for HGA.
In this same SIP revision, the commission repealed the airport GSE rule for the DFW area because agreedorders were signed with the area’s major airlines, airports, and governmental entities to achieve the sameNOx reductions that would have been achieved by the rule.
In August 2001 the commission adopted revisions to the DFW SIP which repealed of two of the rulesadopted on April 19, 2000 as part of the control strategy for the DFW ozone attainment demonstration. The first rule restricted the use of construction and industrial equipment (non-road, heavy-duty dieselequipment rated at 50 hp and greater). The second rule required the replacement of diesel-poweredconstruction, industrial, commercial, and lawn and garden equipment rated at 50 hp and greater to withnewer Tier 2 and Tier 3 equipment, with the amount and timing of reductions depending on the hp ratingof the engine fleet. These repeals were required by SB 5, passed by the 77th Legislature of the State ofTexas in May 2001. This legislative requirement was implemented by submitting the rule repeals to EPAas a SIP revision. The diesel emission reduction incentive program contained in SB 5 will replace theabove-referenced rules and result in reductions in excess of the reductions expected from the rules that arebeing repealed. Therefore, the NOx reductions previously claimed in the DFW attainment demonstrationSIP will be achieved through an alternate but equivalent federally enforceable mechanism.
The current SIP revision addresses three elements of the SIP:
(1) Revision of the NOx control strategy for cement kilns as the result of a settlement agreement with twoaffected industries. The commission has adopted a revision of the associated rules in Chapter 117.
(2) Expansion of the energy efficiency measures contained in the SIP.

1-5DFW Attainment Demonstration
1.2 PUBLIC HEARINGS INFORMATION
The commission held public hearings at the following times and locations: Arlington, Texas at 1:30 p.m. on December 5, 2002, at the North Central Texas Council of Governments,616 Six Flags Dr., Suite 200; and in Austin, Texas at 1:30 p.m. on December 9, 2002, at the TexasCommission on Environmental Quality, 12100 Park 35 Circle, Building F, Room 2210. The publiccomment period closed on December 9, 2002.
1.3 SOCIAL AND ECONOMIC CONSIDERATIONSFor a detailed explanation of the social and economic issues involved with any proposed strategies pleaserefer to the preambles that precede each rule package accompanying this SIP.
1.4 FISCAL AND MANPOWER RESOURCESThe state has determined that its fiscal and manpower resources are adequate and will not be adverselyaffected through implementation of this plan.

1CO plays a relatively minor role in ozone formation compared with VOC and NOx.
2-1DFW Attainment Demonstration
CHAPTER 2: EMISSIONS INVENTORY
2.1 OVERVIEWThe 1990 Amendments to the FCAA require that EIs be prepared for ozone nonattainment areas. Becauseozone is photochemically produced in the atmosphere when VOCs are mixed with NOx and CO1 in thepresence of sunlight, it is important that the planning agency compile information on the importantsources of these precursor pollutants. It is the role of the EI to identify the source types present in an area,the amount of each pollutant emitted and the types of processes and control devices employed at eachplant or source category. The EI provides data for a variety of air quality planning tasks, includingestablishing baseline emission levels, calculating reduction targets, control strategy development forachieving the required emission reductions, emission inputs into air quality simulation models, andtracking actual emission reductions against the established emissions growth and control budgets. Thetotal inventory of emissions of VOC, NOx, and CO for an area is summarized from the estimatesdeveloped for five general categories of emissions sources, which are each explained below.
2.2 POINT SOURCESMajor point sources are defined for inventory reporting purposes in nonattainment areas as industrial,commercial, or institutional which emit actual levels of criteria pollutants at or above the followingamounts: 10 tpy of VOC, 25 tpy of NOx, or 100 tpy of any of the other criteria pollutants which includeCO, SOx, PM10, or lead. For the attainment areas of the state, any company which emits a minimum of100 tpy of any criteria pollutant must complete an inventory. Additionally, any source which generates orhas the potential to generate at least 10 tpy of any single HAP or 25 tpy of aggregate HAP is also requiredto report emissions to the commission. To collect emissions and industrial process operating data for these plants, the commission mails EIQs toall sources identified as having triggered the level of emissions. Companies are asked to report not onlyemissions data for all emissions generating units and emission points, but also the type and, for arepresentative sample of sources, the amount of materials used in the processes which result in emissions. Information is also requested in the EIQ on process equipment descriptions, operation schedules,emissions control devices currently in use, abatement device control efficiency, and stack parameters suchas location, height, and exhaust gas flow rate. All data submitted via the EIQ is then subjected to rigorousquality assurance procedures by the technical staff of the Industrial Emissions Assessment Section andentered into the PSDB by the Data Services Section.
2.3 AREA SOURCESTo capture information about sources of emissions that fall below the point source reporting levels andare too numerous or too small to identify individually, calculations have been performed to estimateemissions from these sources on a source category or group basis. Area sources are commercial, small-scale industrial, and residential categories of sources which use materials or operate processes which cangenerate emissions. Area sources can be divided into two groups characterized by the emissionmechanism: hydrocarbon evaporative emissions or fuel combustion emissions. Examples of evaporativelosses include: printing, industrial coatings, degreasing solvents, house paints, leaking undergroundstorage tanks, gasoline service station underground tank filling, and vehicle refueling operations. Fuelcombustion sources include stationary source fossil fuel combustion at residences and businesses, as wellas outdoor burning, structural fires and wildfires. These emissions, with some exceptions, may becalculated by multiplication of an established emission factor (emissions per unit of activity) times the

2-2DFW Attainment Demonstration
appropriate activity or activity surrogate responsible for generating emissions. Population is the mostcommonly used activity surrogate for many ASCs, while other activity data include amount of gasolinesold in an area, employment by industry type, and acres of cropland.
2.4 ON-ROAD MOBILE SOURCES On-road mobile sources consist of automobiles, trucks, motorcycles, and other motor vehicles travelingon public roadways in the nonattainment area. Combustion related-emissions are estimated for vehicleengine exhaust; evaporative hydrocarbon emissions are estimated for the fuel tank and other evaporativeleak sources on the vehicle. Emission factors have been developed using the EPA's mobile emissionsfactor model, MOBILE5a. Various inputs are provided to the model to simulate the vehicle fleet drivingin each particular nonattainment area. Inputs include such parameters as vehicle speeds by roadway type,vehicle registration by vehicle type and age, percentage of vehicles in cold start mode, percentage ofmiles traveled by vehicle type, type of I/M program in place, and gasoline vapor pressure. All of theseinputs have an impact on the emission factor calculated by the MOBILE model, and every effort is madeto input parameters reflecting local conditions. To complete the emissions estimate the emission factorscalculated by the MOBILE model must then be multiplied by the level of vehicle activity, VMT. Thelevel of vehicle travel activity is developed from travel demand models run by the Texas Department ofTransportation or the local council of governments. The travel demand models have been validatedagainst a large number of ground counts of traffic passing over counters placed in various locationsthroughout each county. Estimates of VMT are often calibrated to outputs from the federal HPMS, whichis a model built from a smaller number of traffic counters. Finally, roadway speeds, which are requiredfor the MOBILE model’s input, are calculated by a post-processor to the travel demand model.
2.5 NON-ROAD MOBILE SOURCESNon-road mobile sources are a subset of the area source category. This subcategory includes aircraftoperations, marine vessels, recreational boats, railroad locomotives, and a very broad category of off-roadequipment that includes everything from 600-horsepower engines mounted on construction equipment to1-horsepower string trimmers. Calculation methods for emissions from non-road engine sources arebased on information about equipment population, engine horsepower, load factor, emission factor, andannual usage. Emission estimates for all sources in the non-road category except aircraft, dieselconstruction equipment, and airport support equipment were originally developed by a contractor toEPA's Office of Transportation Air Quality as a 1990 emissions inventory for all nonattainment areasclassified as serious and above. Since Dallas was not included in the study, commission staff has proratedemissions to the Dallas area based on population and then projected the emissions to later years based onEPA’s Economic Growth Analysis System (EGAS) model. Aircraft emissions were estimated fromlandings and takeoff data for airports used in conjunction with a suitable aircraft emissions model(FAAED or EDMS). Diesel construction equipment and airport support equipment were estimated with anew method involving the use of local survey data and EPA’s new NONROAD model. These two lattercategories are addressed in Appendix V and Appendix W, respectively.
2.6 BIOGENIC SOURCESBiogenic sources are another subset of area source which includes hydrocarbon emissions from crops,lawn grass, and forests as well as a small amount of NOx emissions from soils. Plants are sources of VOCsuch as isoprene, monoterpene, and alpha-pinene. Tools for estimating emissions include satelliteimaging for mapping of vegetative types, field biomass surveys, and computer modeling of emissionsestimates based on emission factors by plant species (PCBEIS-2). Emissions from biogenic sources aresubtracted from the inventory prior to determining any required reductions for a rate of progress plan.

2-3DFW Attainment Demonstration
However, the biogenic emissions are important in determining the overall emissions profile of an area andtherefore are required for regional air quality dispersion modeling.
2.7 EMISSIONS SUMMARYThe July 3, 1996 base case 6a emissions inventory summary for the DFW four-county ozonenonattainment area is included in Figures 2.7-1 (VOC) and 2.7-2 (NOx). It is evident from the pie chartsthat the greatest man-made emissions contribution in the DFW area is from mobile sources. Contributionfrom biogenic emissions are included in the summary, however, control strategies are limited to thereduction of man-made emissions only. The contributions from VOC sources in the July 3, 1996 basecase inventory include the following: area and non-road sources 36%; on-road mobile sources 29%; pointsources 4%; and biogenic sources 31%. The contribution from NOx sources in the 1996 base caseinventory include the following: on-road mobile sources 55%; area and non-road sources 23%; pointsources 17%; and biogenic sources 5%.
The July 3, 2007j future base emission inventory for the DFW nonattainment area is summarized inFigures 2.7-3 (VOC) and 2.7-4 (NOx). The 2007 future base emissions inventory is an estimation that isprojected forward from the 1996 base case inventory using specific procedures approved by the EPA. The contribution from VOC sources in the 2007 base case inventory include the following: area and non-road sources 42%; on-road mobile sources 19%; point sources 4%, and biogenic sources 35%. Contribution from NOx includes the following: on-road mobile sources 50%; area and non-road sources33%; point sources 9%; and biogenic sources 8%.
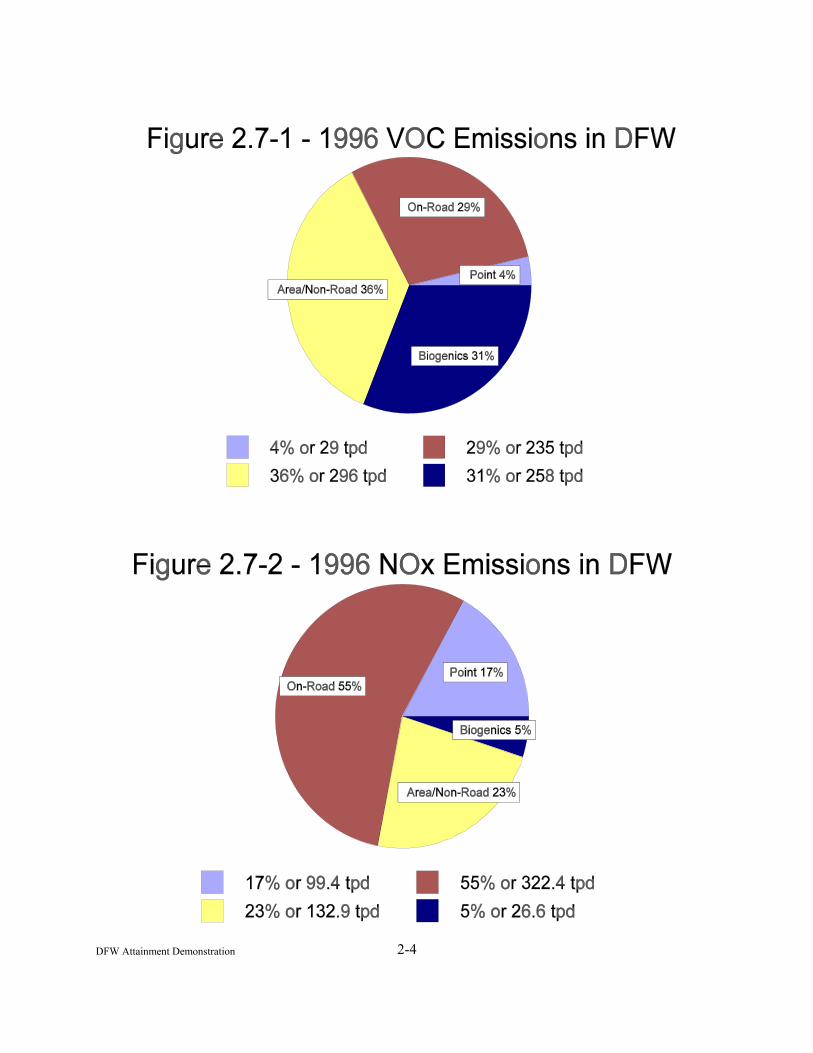
2-4DFW Attainment Demonstration

2-5DFW Attainment Demonstration
2.8 TRANSPORTATION CONFORMITYTransportation conformity is required by §176(c) of the FCAA. The FCAA requires that transportationplans, programs, and projects conform to SIPs in order to receive federal transportation funding andproject approvals. Conformity to a SIP means that transportation activities will not cause or contribute tonew air quality violations, increase the frequency or severity of existing violations, or delay timelyattainment of the NAAQS. EPA’s transportation conformity rule (40 CFR Parts 51 and 93) containscriteria and procedures for making conformity determinations for transportation plans, programs, andprojects. The Texas transportation conformity rule (30 TAC §114.260) adopts EPA’s rule by reference,contains Texas specific consultation procedures and is the enforcement mechanism for transportationconformity requirements in Texas.
2.9 MOTOR VEHICLE EMISSIONS BUDGETSEPA requires all ROP and attainment demonstration SIPs to establish motor vehicle emissions budgets fortransportation conformity purposes. A motor vehicle emission budget is the on-road mobile sourceallocation of the total allowable emissions for each applicable criteria pollutant or precursor, as defined inthe SIP. Transportation conformity determinations must be done using the budget test once EPAdetermines the budget(s) adequate for transportation conformity purposes. In order to pass the budgettest, areas must demonstrate that the estimated emissions from transportation plans, programs and projectsdo not exceed the motor vehicle emissions budget(s).

2-6DFW Attainment Demonstration
The 2007 motor vehicle emissions budgets for the 4 county nonattainment area are established at 107.6 tpd for VOC and 164.3 tpd for NOx. These budgets represent the 2007 projected on-road mobile sourceVOC and NOx emissions that demonstrate attainment. These emission levels are based on the July 3,1996 episode day, projected to 2007 and adjusted for all applicable control strategy reductions. For moreinformation, please refer to Chapter 3, Table 3.10-8.
3-1DFW Attainment Demonstration
CHAPTER 3: PHOTOCHEMICAL MODELING
3.1 INTRODUCTIONThis section of the DFW Phase II SIP document summarizes the procedures and results of thephotochemical modeling conducted in support of the attainment demonstration for the DFW ozonenonattainment area. This photochemical modeling builds upon the Phase I modeling, which isdocumented in Appendix Q of this document.
The purpose of this DFW Phase II ozone modeling was to:
• Provide compelling evidence of transport of ozone and ozone precursors from the HGAnonattainment area to the DFW nonattainment area. Once transport has been established, thenunder EPA’s transport policy the DFW area will be eligible to share the upwind HGA area’sattainment date of 2007.
• Review and revise the base case modeling emissions inventory as necessary, then project thisbase case inventory to the area’s attainment date of 2007.
• Use photochemical grid modeling to test control strategies for the future case and to determinethe amount of local reduction in ozone precursors that will be required to demonstrate attainmentof the 1-hour ozone NAAQS in 2007.
• Finally, demonstrate through photochemical grid modeling that the control strategy selected forthe region will in fact bring the area into attainment of the ozone NAAQS by 2007.
Because the Phase II modeling builds upon modeling already performed in Phase I, this SIP will notdiscuss in detail the portions of the modeling analysis unchanged from the Phase I work documented inAppendix Q. Rather, this document will discuss how the modeling analysis has changed from the Phase Ianalysis, then will describe the control strategy modeling performed to demonstrate attainment of theozone NAAQS. Specifically, the interested reader should consult Appendix Q for detailed discussions ofepisode selection, meteorology, initial and boundary conditions, and the definition of the modelingdomain and subdomains. For reference, Figure 3.1-1 shows the DFW modeling domain with the twonested grids. The inner grid, which covers the DFW nonattainment area and surrounding counties, isreferred to as the core domain.

3-2DFW Attainment Demonstration
Figure 3.1-1 DFW Nested Grid Modeling Domain
3.2 SUMMARY OF THE RESULTS OF PHASE I MODELINGThe Phase I ozone attainment demonstration modeling (see Appendix Q) for the DFW area waspredicated on the assumption that the area would have a 1999 attainment date, since its FCAAclassification at that time was serious (the area failed to demonstrate monitored attainment by 1999, hencethe Phase II SIP focuses on a later attainment date). The Phase I modeling did not evaluate specificcontrols, but rather focused on establishing the preferred VOC/NOx directional guidance and reductiontargets. The major conclusions reached in Phase I are:
• Although the 1999 future emissions show reductions to predicted peak ozone concentrations,additional reductions will be necessary to bring the area into attainment of the ozone NAAQS.
• NOx reductions are the more effective route to ozone control, but VOC reductions provideadditional benefits.
• To show modeled attainment for the July 3, 1996 episode day, NOx reductions of approximately74% (together with a 25% VOC reduction) would be required from the projected 1999 levels. For the June 21 and June 22, 1995 episode days, attainment is reached with less than 50%reduction of NOx (again with a 25% VOC reduction).

3-3DFW Attainment Demonstration
• The large reduction requirements may be somewhat mitigated by the fact that the analysis did notinclude any regional emission reductions, and the fact that the model over-predicted base caseozone concentrations by 12.3%. A design value-based analysis indicated that attainment may beachievable with around 40% NOx reduction (again combined with a 25% VOC reduction).
3.3 ATTAINMENT YEAR FOR PHASE II SIPSince the DFW area failed to demonstrate monitored attainment by 1999, the EPA could reclassify thearea as severe, with an attainment date of 2005. However, the commission believes the area’s ability toreach attainment is affected by transport from the HGA ozone nonattainment area, and that the provisionsof EPA’s transport policy apply to DFW. Under the transport policy, the DFW area would be given thesame attainment date as the HGA area (2007), and would not be reclassified to severe, provided that it canbe demonstrated that transport from the upwind area interferes with DFW’s ability to reach attainment. Appendix N provides a technical report showing the impact of the HGA nonattainment area on the ozonein the DFW area.
Proceeding under the assumption that EPA Region VI would approve the transport demonstration(conditional approval was granted on October 18, 1999 in a letter from Regional Administrator GreggCooke), the commission based its Phase II analysis on the future year of 2007.
3.4 EVOLUTION OF THE PHASE II ATTAINMENT DEMONSTRATION MODELING This section gives a brief chronology of the developments leading the the Phase II modeling attainmentdemonstration. Subsequent sections of this chapter discuss in more detail the steps leading to thedemonstration that the DFW area will reach attainment by the year 2007.
Because the Phase I base case modeling showed very good model performance, only limited changeswere made for Phase II initially. The most significant of these changes were migration to version 2 of theCAMx-2 and repairing some minor flaws in the modeling inventory. After reevaluating modelperformance (still quite good), a 2007 future base inventory was developed and some initial controlstrategies were modeled in late August of 1999. A subsequent minor revision was made to the base caseand 2007 future base modeling in mid-September, 1999. At this time, the 1995-96 base case was denotedas Base4d, and the future base was called 2007b. Over 20 control strategies were evaluated with the2007b future base, and the control strategy proposed in this SIP, called Strategy D29, was selected fromamong them.
In late October 1999, a new computer program for estimating biogenic emissions became available to thecommission, and staff concluded that the new program’s estimates are much more scientifically soundthan the estimates used in Base4d. Because the improved biogenic emissions represented a significantdecrease from earlier, a new base case, called Base5 was developed, and model performance was re-evaluated (still acceptable, but not quite as good as previously). Some additional updates were made tothe 2007 future base at this time, including adding planned EGFs and cement kilns within 100 miles ofthe DFW area. This future base was designated as 2007d (a 2007c future base was used briefly, but is notdiscussed in detail in this document). Strategy D29 was again run against the 2007d future base, and thismodel run forms the basis for the attainment demonstration.
3.5 BASE 4d BASE CASE

3-4DFW Attainment Demonstration
Several minor changes from Phase I were incorporated into the Base 4d base case for both the June, 1995and July, 1996 episodes. These changes represent both enhancements to the modeling and corrections tosome minor errors discovered subsequently to the last round of modeling:
• Migration from the original CAMx model to the newer version, CAMx-2. For this phase of theDFW modeling, the commission migrated to the newer version of (CAMx). Version 2 is noted asCAMx-2 (note: in this document, the term CAMx is understood to refer to version 2), and offersseveral enhancements over the original version, as well as incorporating fixes to a number ofminor bugs. For information on CAMx, the reader is referred to the CAMx web site athttp://www.camx.com.
• Corrected on-road mobile source emissions for the four nonattainment counties (plus RockwallCounty), to adjust emissions for daylight-savings time.
• Revised emissions for construction equipment from NCTCOG, using EPA-recommendedprocedures.
• Corrected CAMx land-use data file for the coarse grid (32 km. × 32 km.).
• Corrected emissions from the Cumberland Power Plant in Tennessee (emissions in the NOx SIPCall inventory were overstated by a factor of eight).
While these modifications serve to reduce uncertainty in the modeling process, they only resulted inminor modifications in the modeling inventory and in the model performance. Table 3.5-1 comparesemissions in the DFW four-county nonattainment area with the corresponding emissions from the Phase Imodeling for July 3, 1996, the day with the highest modeled ozone concentrations in both cases. Notethat although the on-road mobile source emissions were modified, the emission totals are unchanged,since the adjustment to account for daylight savings time only affected the timing of emissions, not thetotals. Also note that the Phase I emissions shown below differ slightly from those reported in AppendixQ. This deviation is due to minor differences in the emission reporting calculation method.
Table 3.5-1: Comparison of Phase I and Base 4d Emissions by Category in the DFW 4-county Areafor July 3, 1996
Category NOx (tons/day) VOC (tons/day)
Phase I Base 4d Phase I Base 4d
On-road mobile sources 314.5 314.5 234.7 234.7
Area/non-road mobile sources 129.2 156.3 287.8 293.8
Point sources 99.4 99.4 29.0 29.0
Biogenic sources 13.2 13.2 452.6 452.6
Total 556.3 583.4 1004.1 1010.1
Tables 3.5-2 and 3.5-3 show the model performance statistics for Base 4d for, respectively, the June, 1995and July, 1996 episodes. Values which fall within the EPA-recommended ranges for acceptable model

2On July 3 and 4, 1996, one or both Unpaired Peak Accuracy statistics is nominally higher than therecommendation. However, this condition does not necessarily indicate poor model performance, since the actualpeak will usually not coincide with the location of a monitoring station.
3-5DFW Attainment Demonstration
performance are noted in bold. Performance statistics for the Phase I base case modeling are shown initalics.
Table 3.5-2. CAMx Base 4d Base Case Ozone Performance Statistics for June 18 – 22, 1995 Episode. (Statistics for Phase I base case are shown in italics)
EpisodeDate
Normalized Bias(±5–15%)
NormalizedGross Error(30–35%)
Unpaired PeakAccuracy (±15–20%)
Domain-wide Peak Ozone (ppb)
Simulated Observed
06/18/95 -22.5 -27.0 25.4 28.0 0.0 -3.8 77.0 74.0 77
06/19/95 4.3 0.2 10.2 8.8 1.2 -1.8 114.3 110.0 113
06/20/95 -1.3 -2.5 12.7 13.0 15.3 13.2 137.2 134.7 119
06/21/95 -3.8 -3.0 10.7 10.5 -1.8 -0.9 141.4 142.6 144
06/22/95 -2.1 -2.6 10.6 10.4 10.2 10.2 148.8 148.8 135
Table 3.5-3. CAMx Base 4d Base Case Ozone Performance Statistics for June 30-July 4, 1996 Episode. (Statistics for Phase I base case are shown in italics)
EpisodeDate
Normalized Bias(±5–15%)
NormalizedGross Error(30–35%)
Unpaired PeakAccuracy (±15–20%)
Domain-wide Peak Ozone (ppb)
Simulated Observed
06/30/96 -20.8 -25.8 20.8 25.8 -17.3 -19.4 92.6 90.3 112
07/01/96 10.7 -13.1 14.6 14.3 2.9 0.5 115.3 112.6 112
07/02/96 -6.5 -6.7 14.6 12.5 7.7 7.7 122.7 122.8 114
07/03/96 12.4 12.3 21.1 20.8 21.0 20.2 174.3 173.1 144
07/04/96 1.3 7.2 10.9 11.2 12.4 23.1 130.4 142.8 116
With the exception of July 4, 1996 (not a primary episode day), it is seen that the Base 4d and Phase Ibase case models perform almost identically. As was the case in Phase I, model performance for the June,1995 episode is excellent, while model performance in the July, 1996 episode is acceptable. In bothepisodes, statistics for each day (excluding the ramp-up days) are within the EPA-recommendedtolerances2.
3.6 THE 2007b FUTURE CASEOnce the performance of Base 4d was evaluated and found to be acceptable, the next step in themodeling process was to create a 2007 future base, which could be used to evaluate control strategies. Development of the future base involved projecting growth from the base episode dates to the attainment

3-6DFW Attainment Demonstration
year of 2007, then applying federal and state regulations likely to be implemented prior to 2007. Theexact procedures were specific to the inventory sectors: on-road mobile, area/non-road mobile, and pointsources, as discussed below:
3.6.1 On-road Mobile SourcesOn-road mobile source emissions for the 2007 DFW attainment demonstration modeling were developedfor six separate regions, with the level of detail decreasing with distance from the core DFWnonattainment area. Link-based on-road mobile source inventories were developed by the NCTCOGusing a travel-demand model and Mobile5a. Model input included a projected 2007 roadway networkand projected 2007 demographic data for the region. The travel demand model covered the counties ofDallas, Tarrant, Collin, Denton, and Rockwall, which comprise the DFWRTM area.
For the 32 counties surrounding the DFWRTM area, NCTCOG utilized HPMS data in conjunction withMOBILE5a to develop a 2007 on-road mobile source inventory. Link-based inventories for 2007 –originally developed for the COAST project – were available from the Texas Transportation Institute forboth the 8-county HGA nonattainment area and the 3-county BPA nonattainment area. For theremaining Texas counties and other states within the modeling domain, the on-road portion of EPA’s1996 NET Inventory was adjusted by the commission using 2007 projections of both VMT and CO, NOx,and VOC emission rates.
Each portion of the total on-road mobile source inventory was processed by commission staff using bothcustom-written SAS code and EPS 2.0 software to prepare it for input into the CAMx model. As part ofthe final processing step, where files from various sources are merged together, the link-based emissionsin the DFWRTM area were multiplied by an adjustment factor of 1.056, (an increase of 5.6%) to provideconsistency with the HPMS. Additional details on the development of the 2007 on-road mobile sourceemissions are provided in Appendix X.
Modeling performed by NCTCOG accounted for the NLEV and HDDV standards, federal phase II RFG,and the Texas Motorist’s Choice vehicle I/M program in Dallas and Tarrant counties. Additionaladjustments were made to the gridded, model-ready emissions files to account for new information notavailable at the time the emissions data were developed by NCTCOG, such as Tier II/low sulfur rules. Table 3.6-1 lists these adjustments, and shows the adjustment factor applied by region within the coredomain.

3-7DFW Attainment Demonstration
Table 3.6-1: Adjustments Made to On-road Mobile Source Emissions for the 2007b Future Base
Adjustment
Region
Dallas & TarrantCounties
Denton & CollinCounties
Attainment countiesin central andeastern Texas
NOx VOC NOx VOC NOx VOC
Proposed federal Tier II/LowSulfur standards
.880 .941 .863 .934 .820 .904
Updated vehicle registration/Mobile 5b NOx correction
.900 1.02 .800 .930 .900 1.02
Texas cleaner gasoline - - - - .996 .953
Composite Adjustment .792 .960 .690 .869 .735 .879
The adjustment for Tier II/low sulfur reflects EPA’s new proposed rules to implement Tier II vehiclestandards nationwide. The adjustment for updated vehicle registration/Mobile 5b NOx correction isactually a composite factor developed by Eastern Research Group (ERG) under contract to thecommission. The first component, updated registration distribution, arises from new Texas Departmentof Transportation data showing that the average age of vehicles in the DFW area is lower than in previousyears. Assuming the age distribution will stay the same until 2007 yields somewhat lower emissions, dueto a higher percentage of newer (hence cleaner) vehicles in the fleet. The second component addresses anerror in the treatment of federal Phase II RFG by Mobile5a-h, the version of the Mobile model used byNCTCOG. The correction (which is implemented in the Mobile5b version of the Mobile model) reducesNOx emissions significantly from the original Mobile5a-h estimates. To view the EPA report describingthe correction, see http://www.epa.gov/oms/models/mobile5/m5info7.txt.
The final adjustment for Texas clean gasoline accounts for new rules adopted by the commission tomandate the sale of low (7.8) RVP gasoline in counties in central and eastern Texas. This rule does notaffect the DFW nonattainment area, since federal Phase II RFG in the area already has RVP of 6.7.
3.6.2 Area/non-road Mobile SourcesOriginally, commission staff had intended to use econometric forecasts from the REMI-EGAS to forecastgrowth of the area and non-road mobile source emissions. However, the latest forecasts from this systemavailable to the commission staff showed unexplained fluctuations, and generally predicted growth whichappeared too small in light of robust economic growth expected in the region. Since it was not feasible todevelop new REMI-EGAS forecasts in time to begin modeling control strategies for DFW, commissionstaff decided to use growth of human population in the modeling domain from 1995/1996 to 2007 as asurrogate for area and non-road emissions growth for the future case. Population growth shouldconstitute a reasonable surrogate for activity growth in most area and non-road categories, which consistlargely of such items as construction, lawn & garden, pleasure boating, house painting, etc., although afew categories such as locomotives and oil and gas production are only indirectly related to humanpopulation.

3-8DFW Attainment Demonstration
The population for the DFW four-county nonattainment area and the remainder of Texas in the modelingdomain was obtained from the reports “Texas Comptroller of Public Accounts, Winter 1997-98 CountyForecast”; and the “Texas State Data Center at Texas A&M University.” The population estimates for theremainder of the modeling domain were obtained from the projection of the 1990 US Census data (seriesA) found on the federal census web-site at the following internet address: http://www.census.gov/population/projections/state/stpjpop.txt. These population growth numbers wereused to project the 1995/1996 emission inventories to the attainment year of 2007.
Emission changes associated with federal regulations for non-road mobile sources were derived fromEPA’s prototype NONROAD model, by setting the equipment population growth rates to zero andrunning 1996 and 2007 evaluation years. The ratios of these emission estimates were used to developcontrol factors for non-road equipment (since locomotives are not covered by NONROAD, they weretreated separately). One area source control was also modeled, specifically Stage I vapor recovery atlarge gasoline service stations in central and eastern Texas. Appendix F gives the growth rates andcontrol factors applied to area and non-road mobile source emissions to develop the 2007b future base.
3.6.3 Point (Stationary) SourcesThe Texas legislature in 1999 passed two laws governing emissions from point sources in Texas. Thefirst, SB 7 limited NOX emissions from grandfathered EGFs in central and eastern Texas to 0.14lbs/MMBtu, which represents a reduction to approximately one-half of 1997 emission levels. Emissionsfrom grandfathered EGFs in the remainder of the state are limited to 0.195 lbs.MMBtu, representingabout a 30% reduction from 1997 levels. The second piece of legislation, SB 766 increases emissionsfees on grandfathered non-EGF sources and encourages these sources to acquire state permits. The actualimplementation of rules associated with these bills is through action of the commission. The developmentof the 2007b modeling inventory is summarized below:
Electric generation facilities in Texas - Since the original provision of SB 7 was based on 1997emission levels, commission modeling staff decided to use 1997 emissions for EGF sources tobuild the future inventory for these sources. An inventory representative of the two episodes wasdeveloped by averaging CEM observations from the Acid Rain Program Data Base (ARPDB) foreach hour over the 31-day period from June 15, 1997 to July 15, 1997. This inventory providedemissions for each ARPDB source which varied by hour, but not by day (an analysis wasconducted which showed no noticeable difference between weekday and weekend usagepatterns). Then, to model the effects of SB 7 and the regional EGF rule proposed by thecommission, the 1997 NOX emissions (both grandfathered and permitted) were reduced by 50%in eastern and central Texas (excluding the DFW nonattainment area), and by 30% in theremainder of the state.
Non-electric generating facilities in Texas - Non-EGF sources were grown from the 1996 base to2007 using observed emission trends (see Appendix F). It should be noted that within the DFWfour-county area, this method produced almost no predicted change in emissions from 1996 to2007. Then sources outside the DFW nonattainment area were reduced to account for theexpected effects of SB 766: Sources identified as grandfathered were reduced by 30%, whilesources identified as permitted were not reduced. Sources whose status could not be determinedwere reduced by the average (weighted) value of 13%.
Point sources in other states - In Oklahoma, Arkansas, Louisiana, Mississippi, and Florida, areduction of 30% from 1996 emission levels was assumed for all point source NOx to reflect

3-9DFW Attainment Demonstration
national trends towards lowered emissions. In Georgia, Missouri, Kentucky and Tennessee, NOx
emissions from EGFs were reduced by 59% from 1996 levels to reflect reductions expected underEPA’s NOx SIP Call. In these NOX SIP-call states, emissions from non-EGF sources werereduced by 30%.
DFW nonattainment area point sources - Within the DFW nonattainment counties, reductionsassociated with SB 7 and SB 766 were not applied, since it is anticipated that more stringentregulations will be necessary in the nonattainment counties than elsewhere. For the 2007b futurebase, only the NOx RACT regulations described in the Phase I modeling (see Appendix Q) wereapplied.
The 2007b point source inventory also included a small number of point sources which had beeninadvertently omitted from the Phase I modeling and from Base4d. Appendix F provides additionaldetails on the development of the point source emissions.
3.6.4 2007b Future Base Emissions SummaryTable 3-5 presents a comparison of the 2007b future case emissions with the 1995-6 Base4d emissionsused in the base case modeling for the July 3, 1996 episode day, for the four-county DFW nonattainmentarea.
Table 3.6-2: Comparison of Base 4d and 2007d Future Base Emissions by Category in the DFW 4-County Area for July 3, 1996
Category NOx(tons/day) VOC (tons/day)
Base 4d2007b
future base Base 4d2007b future
base
On-road mobile sources 314.5 211.6 234.7 135.5
Area/non-road mobile sources 156.3 159.0 293.8 301.3
Point sources 99.4 77.0 29.0 28.8
Biogenic sources 13.2 13.2 452.6 452.6
Total 583.4 460.8 1010.1 918.1
Clearly, the 2007b base case represents a significant reduction from the 1995-6 base case emissions,particularly for on-road mobile sources.
3.6.5 Future Case Modeling ResultsTable 3.6-3 shows peak predicted ozone in the entire core domain for Base 4d and for the 2007b futurebase for the three primary days. Note the significant decrease in daily peak ozone that occurs as a resultof planned national and state rules.
Table 3.6-3: Peak Modeled Ozone in the Core Domain, 1995-6 Base 4d and Future Base 2007b
Episode date 1995-6 Base 4d Future base 2007b

3 A limited number of model runs made with the future base 2007a also showed a strong preference forNOx controls.
3-10DFW Attainment Demonstration
6/20/95 141.4 ppb 128.0 ppb
6/21/95 148.8 ppb 133.1 ppb
7/3/96 174.3 ppb 154.8 ppb
Figure 3.6-1 at the end of this chapter shows daily peak ozone predictions for the three primary episodedays for the 1995 and 1996 Base 4d and for the 2007b future case. The first row of color isopleths showsthe modeled 1995-6 daily maximum ozone concentrations at each location in the core domain, and thesecond row shows the daily maximum concentrations after replacing the 1995-1996 inventory with the2007b future inventory. The last row of plots shows results of a control strategy run, and will bediscussed later.
3.7 CONTROL STRATEGY DEVELOPMENT
3.7.1 Directional GuidanceUpon completion of the future base 2007b modeling, the next step in the modeling process wouldnormally be to run future case sensitivity analyses to determine the preferred path to attainment. However, Phase I modeling had shown a very strong preference for NOx controls over VOC as the path toattainment. Since the Phase II modeling differed little from its Phase I counterpart, the commission staffdetermined that detailed directional guidance modeling was unnecessary3. The commission and the NorthCentral Texas Clean Air Steering Committee thus proceeded to evaluate control strategies against thefuture base 2007b.
3.7.2 Bias AdjustmentOne significant conclusion from the Phase I modeling was that reducing the peak ozone prediction onJuly 3 to below 125 parts/billion would require reductions of up to 75% in NOx emissions. However, thebase case modeling for this day showed a strong positive bias which was close to the EPA recommendedthreshold for acceptable performance. Overall, the model predicted 12.4% too much ozone at themonitoring sites, so it is likely that the modeled peak is overestimated as well. If the over-prediction inthe peak were equal to the model bias, that would indicate that the real base case peak would be about 155ppb, which is consistent with the measured peak on that day of 144 ppb. Applying this same logic to thefuture base 2007b prediction, the future base peak ozone concentration would drop from 154.8 ppb to137.7 ppb. Using a bias-adjusted July 3 peak, commission staff estimated (based on Phase I modeling)that a NOx reduction of about 42% from 1996 levels would be sufficient to bring the peak below the125ppb standard. If the July 3 peak is in fact an artifact of the modeling process and not a realphenomenon, then controlling to the unadjusted July 3 peak would result in nearly double the amount ofreduction (from 42% to 75%) that would be required otherwise. Thus, the commission and the NorthTexas Clean Air Steering Committee decided to use the bias-adjusted July 3 peak ozone prediction as thecriterion for evaluating candidate control strategies.
3.7.3 Control Strategy ModelingTable 3.7-1 shows the 23 control strategies evaluated with the 2007b future base. The left-hand columnof the table lists the elements of the control strategies, and the entries in the body of the table indicatewhich areas in the modeling domain the reductions were applied to. The bottom row lists bias-adjusted

3-11DFW Attainment Demonstration
peak July 3 predicted ozone for each strategy. In particular Strategy D29 shows peak ozone prediction of124.9, which is below the standard. This strategy was selected by the North Texas Clean Air SteeringCommittee and the commission as the attainment demonstration strategy. The last row of Figure 3.6-1 atthe end of this chapter shows unadjusted modeled peak ozone concentrations for each of the three primaryepisode days after applying Strategy D29.

1Notes are provided following Table 3-7.
3-12DFW Attainment Demonstration
Table 3.7-1: Control Strategies Modeled with 2007b Future Base
Emission control optionsControl Strategy
D6 D7 D8 D9 D10 D11 D12 D13 D14
Poi
nt S
ourc
es
Tier 2 point source NOx reduction 41 4 4 4 4 4 4 4 4
70% EGF + Tier 2 non-EGF
30% point source NOx reduction E E
50% point source NOx reduction E E
Proposed cement kiln regulations
Building code modifications
On-
road
mob
ile
sour
ces
Texas Motorists Choice I/M program2 12
Acceleration Simulation Mode I/M prog. 4 12 4 4 4 4 4 4
On-Board Diagnostics I/M program 8 8 8 8 8 8 8
Federal phase II Reformulated Gasoline3
California RFG 12 12 12
California diesel fuel 12 12 12 12 12
55 mph speed 4
60 mph speed limit
Reduce 65,70 mph speed limits by 5 mph
Remote sensing
Fed. Heavy Duty Gasoline Vehicle stds. N
Transportation Control Measures 4
Super low sulfur (20ppm)
Vehicle recycling, 3000 Cars/Year
Vehicle recycling, 5000 Cars/Year
California Low Emission Vehicles
Non
-roa
d m
obil
e so
urce
s
Construction equipment 10:00 AM start 4 4 4 4
Construction equipment 8:30 AM start
California RFG 4 12 12
California diesel fuel 4 12 12 12 12
Voluntary Mobile Emissions Program 4 4 4
Alternate construct. emissions (-31.2%)
Accelerated Tier 3 diesel replacement 12
Airport support equipment electrification 4 4
Low NOx water heaters
California spark ignition rules
Bias-adjusted July 3 peak modeled ozone (ppb) 136.2 132.4 132.3 130.5 132.2 129.6 128.9 128.8 131.1

3-13DFW Attainment Demonstration
Table 3.7-1: Control Strategies Modeled With 2007b Future Base (Part 2)
Emission control optionsControl Strategy
D15 D16 D17 D18 D19 D20 D21 D22
Poi
nt S
ourc
es
Tier 2 point source NOx reduction 4 4 4 4 4 4 4 4
70% EGF + Tier 2 non-EGF
30% point source NOx reduction E E E E
50% point source NOx reduction M M M M
Proposed cement kiln regulations
Building code modifications 4 4 4 4
On-
road
mob
ile
sour
ces
Texas Motorists Choice I/M program
Acceleration Simulation Mode I/M prog. 4 4 4 12 12 12 12 12
On-Board Diagnostics I/M program 8 8 8
Federal phase II Reformulated Gasoline
California RFG
California diesel fuel 12 124 124 124 124 124 124 124
55 mph speed
60 mph speed limit 4 4 4
Reduce 65,70 mph speed limits by 5 mph 4
Remote sensing 12
Fed. Heavy Duty Gasoline Vehicle stds. N N N N N N N N
Transportation Control Measures 4 4 4 4 4 4 4 4
Super low sulfur (20ppm) 12 12 12 12 12 12
Vehicle recycling, 3000 Cars/Year 4 4 4
Vehicle recycling, 5000 Cars/Year 4 4 4 4
California Low Emission Vehicles S
Non
-roa
d m
obil
e so
urce
s
Construction equipment 10:00 AM start 12 12
Construction equipment 8:30 AM start 12 12 12 12
California RFG
California diesel fuel 12 124 124 124 124 124 124 124
Voluntary Mobile Emissions Program 4 4 4 4 4
Alternate construct. emissions (-31.2%) 12 12 12 12 12 12 12
Accelerated Tier 3 diesel replacement 12 12 12 12 12 12 12
Airport support equipment electrification 4 4 4 4 4 4 4 4
Low NOx water heaters 12 12 12 12
California spark ignition rules 12
Bias-adjusted July 3 peak modeled ozone (ppb) 130.9 126.8 124.7 124.9 127.4 127.0 126.3 126.1

3-14DFW Attainment Demonstration
Table 3.7-1: Control Strategies Modeled With 2007b Future Base (Part 3)
Emission control optionsControl Strategy
D235 D245 D255 D23R5 D26 D29
Poi
nt S
ourc
es
Tier 2 point source NOx reduction 4 4 4 4 4
70% EGF + Tier 2 non-EGF 4
30% point source NOx reduction
50% point source NOx reduction M M M M M M6
Proposed cement kiln regulations C6
Building code modifications 4 4 4 4 4 4
On-
road
mob
ile
sour
ces
Texas Motorists Choice I/M program
Acceleration Simulation Mode I/M prog. 12 12 12 12 12 12
On-Board Diagnostics I/M program
Federal phase II Reformulated Gasoline 8
California RFG
California diesel fuel 124 124 124 124 124 12
55 mph speed limit
60 mph speed limit
Reduce 65,70 mph speed limits by 5 mph 4 4 4 4 4 12
Remote sensing 12 12 12 12 12 12
Fed. Heavy Duty Gasoline Vehicle stds. N N N N N N
Transportation Control Measures 4 4 4 4 4 127
Super low sulfur (20ppm) 12 12 12 12 12
Vehicle recycling, 3000 Cars/Year
Vehicle recycling, 5000 Cars/Year 4 4 4 4 12
California Low Emission Vehicles S S S S S S8
Non
-roa
d m
obil
e so
urce
s
Construction equipment 10:00 AM start 12 12 12 12 12 12
Construction equipment 8:30 AM start
California RFG
California diesel fuel 124 124 124 124 124 12
Voluntary Mobile Emissions Program 4 4 4 4 4 12
Alternate construct. emissions (-31.2%) 12 12 12 12 12 12
Accelerated Tier 3 diesel replacement 12 12 12 12 12
Airport support equipment electrification 4 4 4 4 4 4
Low NOx water heaters 12 12 12 12 12 12
California spark ignition rules 12 12 12 12 12 12
Bias-adjusted July 3 peak modeled ozone (ppb) 124.8 125.6 125.5 124.3 124.7 124.9

3-15DFW Attainment Demonstration
Notes for Table 3.7-1
1. Key: 4 - Four county DFW nonattainment area, 8 - DFW CMSA minus four nonattainment counties,12 - 12-county DFW CMSA, E - Ellis CountyM - Ellis County sources in Midlothian areaC - Counties in central and eastern TexasN - NationwideS - Statewide
2. Future base 2007b includes Texas Motorist’s Choice in Dallas & Tarrant counties.
3. Future base 2007b includes federal phase 2 RFG in 4-county area
4. Modified California diesel reduction factors based on recent study were used in Strategies D16through D26. Commission staff decided that insufficient evidence was available to support thisrevision, so the original California diesel factors were used in the final control strategy evaluationrun (D29).
5. Strategies D23, D24, D25 were run with an accidental addition of 3 tons/day of on-road mobilesource NOx. Results of these runs are included to show the effects of two control elements(reducing the Tier 2 point source controls to 70%, and accelerated Tier 3 diesel). Strategy D23Ris a re-run of Strategy D23 with corrected on-road mobile source NOx emissions.
6. Cement kilns in Midlothian area were modeled at 50% reduction; elsewhere, reductions werebased on proposed rule.
7. The ‘12' here includes both TCMs in the four county area and travel demand measures (TDMs),such as van pools, etc. in the surrounding 8 counties.
8. Updated factors were used in Strategy D29.
Most of the strategy elements listed in Table 3.7-1 are described in more detail elsewhere in this SIP, butfor convenience the elements are briefly described below:
Point (Stationary) sources
Point source NOx reduction - in the four-county ozone nonattainment area as follows:
! Tier 2 point source NOx reduction for EGFs - flue-gas cleanup, such as SCR. EGFswere modeled with a NOx emission limit of 0.02 pound per million British thermal unit(lb/MMBtu). This control represents a reduction of approximately 91% from theuncontrolled (i.e. assuming no NOx RACT) 2007 emission levels.
! Tier 1 point source NOx reduction for non-EGF sources - combustion modificationsuch as flue gas recirculation for boilers. Controls for non-EGF industrial, commercialand institutional boilers with a firing rate greater than 40 MMBtu/hr were modeled based

3-16DFW Attainment Demonstration
on the proposed Chapter 117 NOx limit of 30 ppmv (0.036 lb NOx/MMBtu) for existingboilers operated above the Chapter 117 annual heat input exemptions, and on theapplicable Chapter 116 permit NOx limit of 0.06 lb NOx/MMBtu, for two industrialsources which have replaced or are replacing boilers in the 1996 inventory. Industrialand institutional internal combustion engines were modeled with a NOx emission limit of2 grams per 1000-horsepower-hour (2g/1000hp-hr).
70% EGF + Tier 2 non-EGF - This control strategy element is the same as above, except thatthe EGFs were adjusted so as to represent a 70% reduction from the uncontrolled 2007 emissionlevels.
30% point source NOx reduction - across-the-board reduction applied to all point sources inEllis County. Does not affect emissions within the four-county nonattainment area.
50% point source NOx reduction - across-the-board reduction applied only to cement kilns nearMidlothian in Ellis County. Does not affect emissions within the four-county nonattainment area.
Proposed cement kiln reductions - proposed reductions for cement kilns in central and easternTexas. These regulations will reduce emissions from cement kiln operations in central andeastern Texas by approximately 27%. Does not affect emissions within the four-countynonattainment area.
Building code modifications - reduce electricity usage through use of better insulation, reflectiveroofing, etc. This element is estimated to provide a reduction of approximately .5 tpd due toadoption of building code modifications in the four-county DFW nonattainment area. Thiselement was modeled by reducing point source emissions in the four-county area by 2.5%.
For more details on modeling point source controls, see Appendix F.
On-road mobile sources
TMC I/M program - two-speed idle test integrated with the annual safety inspection programand operated by the Texas Department of Public Safety. Currently operated only in Tarrant andDallas Counties.
ASM I/M program - dynamometer-based test which is more stringent than TMC. In particular,has significant NOx benefits over TMC.
OBD I/M program - 1996 and later vehicles are self-diagnosing for emissions. This programwould require a check of the OBD status as part of the annual safety inspection. The OBD wouldbe used for newer vehicles in either a TMC or ASM program, or could be implemented as astand-alone program.
Federal phase II RFG - a formulation of gasoline that has lower amounts of certain chemicalcompounds which contribute to the formation of ozone and air toxins. RFG does not evaporate as readily as conventional gasoline during the summer months. It also contains oxygenates, whichincrease the combustion efficiency of gasoline and reduce carbon monoxide emissions. The four-county nonattainment area is required by the Clean Air Act to implement RFG.
3-17DFW Attainment Demonstration
California RFG - a different formulation of RFG which provides additional reductions beyondfederal Phase II RFG.
California diesel - a special formulation of diesel which provides additional reductions beyondfederal diesel requirements.
55 or 60 mph speed limit - reduce maximum speed limits to either 55 or 60 mph during ozoneseason.
Reduce 65 and 70 mph speed limits by 5 mph - During ozone season, roadways with 65 mphspeed limits would be reduced to 60 mph, and roadways with 70 mph speed limits would bereduced to 65 mph during the ozone season.
Remote sensing - use of roadside sampling equipment which detects high-emitting vehicles asthey drive by.
Federal heavy duty gasoline vehicle standards - proposed federal rules to reduce emissions inlight heavy-duty vehicles such as large sport utility vehicles. This regulation was treated as acontrol strategy element, but strictly should be included in the future base (it is included in futurebase 2007d).
Transportation control measures - a variety of local measures designed to reduce motor vehicleemissions in the four nonattainment counties. Also includes travel demand measures (TDM’s) inthe surrounding 8 counties (van pools, etc.).
Super low sulfur gasoline (20 ppm) - reduces sulfur content in gasoline beyond the proposedfederal limit of 30 ppm. Provides additional NOx benefits.
Vehicle recycling, 3000 or 5000 cars/year - a program to remove the dirtiest vehicles from thefleet and take them permanently out of service.
California Low Emission Vehicles - California standards are somewhat tighter than Federal Tier2 standards, although much of the incremental benefit occurs beyond the DFW area’s attainmentdate of 2007.
Table 3.7-2 shows the reductions for the items above as applied to different parts of the modeling domain.

1 Incremental change from TMC I/M program
2 Composite adjustment. In the four nonattainment counties, emission reductions resulting from speed limitchanges were applied on an hour-specific basis.
3-18DFW Attainment Demonstration
Table 3.7-2: Reduction Factors Applied to 2007b Future Base On-road Mobile Source Emissions
Control strategy item Data Source Pollutant
RegionDallas,Tarrant
Counties
Denton,Collin
CountiesEight
counties Statewide NationalTexas Motorist's Choice I/Mprogram
Radian/ERG NOx .922 .922VOC .730 .720
Acceleration Simulation Mode I/Mprogram
Radian/ERG NOx .8071 .770 .764VOC .8371 .623 .614
On-Board Diagnostic I/M program Radian/ERG NOx .896VOC .826
Federal phase II reformulatedgasoline
Radian/ERG NOx .954VOC .735
California reformulated gasoline Radian/ERG NOx .988 .988 .988VOC 1.078 1.075 1.078
California diesel: Strategies D6-D15, D29
Radian/ERG NOx .987 .985 .987VOC .996 .994 .996
Strategies D16-D26Environ NOx .973 .973 .973
VOC .996 .996 .99655 miles/hour speed limit TCEQ NOx .9702 .8412
VOC .9942 .9542
60 miles/hour speed limit TCEQ NOx .9822 .8792
VOC 1.002 .9882
Reduce 65, 70 mph speed limit by5 mph: Strategies D22-D26
NCTCOG NOx .9872 .8962
VOC 1.002 1.002
Strategy D29NCTCOG/TCEQ (R)
NOx .9862 .8982 .940VOC 1.002 .9772 .975
Remote sensing NCTCOG NOx .997 .997 .997VOC .997 .997 .997
Federal Heavy Duty GasolineVehicle standards
Environ NOx .982 .982 .982 .982 .982VOC .999 .999 .999 .999 .999
TCMs, TDMs NCTCOG NOx .983 .983 1.00VOC .991 .991 1.00
Super low sulfur gasoline Environ NOx .980 .980 .980VOC .983 .983 .983
Vehicle recycling, 3000 cars/ year NCTCOG NOx .988 .988VOC .988 .988
Vehicle recycling, 5000 cars/year: Strategies D19-D25
NCTCOG NOx .980 .980VOC .983 .983
Strategy D29TCEQ(revised)
NOx .998 .998 .998VOC .998 .998 .998
CA Low Emission Vehicles: Strategies D22-D26
Radian/ERG NOx .994 .994 .994 .994VOC 1.00 1.00 1.00 1.00
Strategy D29Radian/ERG(revised)
NOx .981 .981 .981 .981VOC .980 .980 .980 .980

3-19DFW Attainment Demonstration
Area and non-road mobile sources
Construction equipment 8:30 or 10:00 AM start - bans most heavy equipment usage prior to8:30 or 10:00 AM. Reduces NOx emissions during the time most critical for forming ozone.
California RFG - same as above.
California diesel fuel - same as above.
VMEP - a federal program which allows areas to take SIP credit for voluntary programs toreduce emissions from on-road and non-road mobile sources. The credit is limited to 3% of theamount required to reach attainment of the NAAQS. VMEP was modeled in the non-roadcategory for convenience, but can include on-road reductions as well.
Alternate construction equipment emissions - a comparison of construction equipmentemissions in the DFW area indicates that on a per-capita basis, DFW’s emissions are almost threetimes as high as Los Angeles’. The reduction of -31.2% reduces the discrepancy between theareas by half. This item is not a control strategy, but rather an emissions inventory adjustment. Astudy currently being conducted in the Houston area is expected to help better quantifyconstruction emissions in Texas, and should help the commission to refine the DFW inventory inthe near future.
Accelerated Tier 3 diesel equipment replacement - assumes that by 2007, 50% of theconstruction equipment fleet will be Tier 3 (available in 2006), and the remainder will be Tier 2(available in 2001).
Airport support equipment electrification - all ground support equipment at DFW InternationalAirport, Alliance Airport, Love Field, and Meacham Field are assumed to be replaced withelectric equipment by 2007.
Low NOx residential water heaters - requires new water heaters to have pilotless ignition andlow-NOx burners.
California spark ignition rules - California has instituted rules concerning large (>25horsepower) non-road spark ignition engines. This item assumes similar rules in the DFW area.
Table 3.7-3 shows the reduction factors for the items above as applied to different parts of the modelingdomain. Reductions were applied across-the-board to all categories of emissions in the area/non-roadinventory unless otherwise noted.

3-20DFW Attainment Demonstration
Table 3.7-3: Reduction Factors Applied to 2007b Future Base Area+Non-road Mobile Source Emissions
Control strategy itemData
Source Pollutant
Region
DFW 4counties
Eightcounties
Central &easternTexas
State-wide
Construction equipment 8:30 or 10:00AM start
TCEQ NOx 1.001 1.001
VOC 1.001 1.001
California reformulated gasoline andCalifornia diesel (combined factor)
Radian/ERG
NOx .950 .950
VOC .985 .985
California diesel: Strategies D6-D15, D29
Radian/ERG
NOx .958 .958
VOC .990 .990
Strategies D16-D26Environ NOx .939 .939
VOC .990 .990
Federal phase II RFGRadian/ERG
NOx 1.00 1.00
VOC .971 .971
Voluntary Mobile Emissions ProgramTCEQ NOx .960
VOC 1.00
Alternate construction equipmentemissions2
TCEQ NOx .876
VOC .987
Accelerated Tier 3 diesel equipment: Commercial equipment2
Environ NOx .860 .860
VOC .976 .976
Construction equipment2 Environ NOx .798 .798
VOC .854 .854
Industrial equipment2 Environ NOx .921 .921
VOC .950 .950
Lawn & garden equipment2 Environ NOx .937 .937
VOC .997 .997
Airport support equipmentelectrification2,, 3
Environ NOx 0.00
VOC 0.00
Low NOx residential water heatersTCEQ NOx .997 .997 .997 .997
VOC 1.00 1.00 1.00 1.00
California spark ignition rules: Commercial equipment2
Environ NOx .882 .882
VOC .954 .954
Industrial equipment2Environ NOx .771 .771
VOC .740 .740
Lawn & garden equipment2Environ NOx .957 .957
VOC .966 .966
Stage I gasoline station refueling inattainment counties
TCEQ NOx 1.00 1.00
VOC 0.98 0.981Emissions were shifted temporally, but daily total emissions were not changed2Reductions were applied to specific equipment categories3Reductions applied only at Meacham Field, DFW International Airport, Love Field, and Alliance Airport
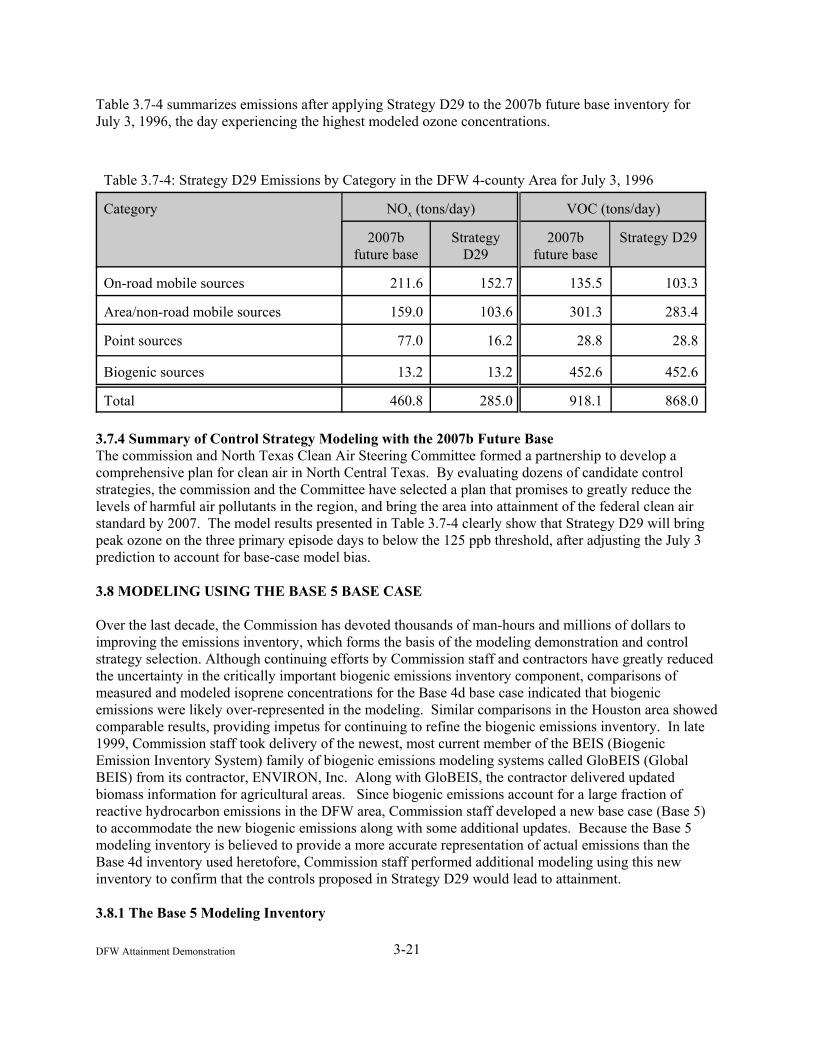
3-21DFW Attainment Demonstration
Table 3.7-4 summarizes emissions after applying Strategy D29 to the 2007b future base inventory forJuly 3, 1996, the day experiencing the highest modeled ozone concentrations.
Table 3.7-4: Strategy D29 Emissions by Category in the DFW 4-county Area for July 3, 1996
Category NOx (tons/day) VOC (tons/day)
2007bfuture base
StrategyD29
2007bfuture base
Strategy D29
On-road mobile sources 211.6 152.7 135.5 103.3
Area/non-road mobile sources 159.0 103.6 301.3 283.4
Point sources 77.0 16.2 28.8 28.8
Biogenic sources 13.2 13.2 452.6 452.6
Total 460.8 285.0 918.1 868.0
3.7.4 Summary of Control Strategy Modeling with the 2007b Future BaseThe commission and North Texas Clean Air Steering Committee formed a partnership to develop acomprehensive plan for clean air in North Central Texas. By evaluating dozens of candidate controlstrategies, the commission and the Committee have selected a plan that promises to greatly reduce thelevels of harmful air pollutants in the region, and bring the area into attainment of the federal clean airstandard by 2007. The model results presented in Table 3.7-4 clearly show that Strategy D29 will bringpeak ozone on the three primary episode days to below the 125 ppb threshold, after adjusting the July 3prediction to account for base-case model bias.
3.8 MODELING USING THE BASE 5 BASE CASE
Over the last decade, the Commission has devoted thousands of man-hours and millions of dollars toimproving the emissions inventory, which forms the basis of the modeling demonstration and controlstrategy selection. Although continuing efforts by Commission staff and contractors have greatly reducedthe uncertainty in the critically important biogenic emissions inventory component, comparisons ofmeasured and modeled isoprene concentrations for the Base 4d base case indicated that biogenicemissions were likely over-represented in the modeling. Similar comparisons in the Houston area showedcomparable results, providing impetus for continuing to refine the biogenic emissions inventory. In late1999, Commission staff took delivery of the newest, most current member of the BEIS (BiogenicEmission Inventory System) family of biogenic emissions modeling systems called GloBEIS (GlobalBEIS) from its contractor, ENVIRON, Inc. Along with GloBEIS, the contractor delivered updatedbiomass information for agricultural areas. Since biogenic emissions account for a large fraction ofreactive hydrocarbon emissions in the DFW area, Commission staff developed a new base case (Base 5)to accommodate the new biogenic emissions along with some additional updates. Because the Base 5modeling inventory is believed to provide a more accurate representation of actual emissions than theBase 4d inventory used heretofore, Commission staff performed additional modeling using this newinventory to confirm that the controls proposed in Strategy D29 would lead to attainment. 3.8.1 The Base 5 Modeling Inventory

3-22DFW Attainment Demonstration
Changes to the base case modeling inventory from Base 4d to Base 5 are:
C Updated emissions estimates for the DFW International Airport based on a detailed bottom-upinventory conducted by the airport. Emissions by aircraft during approach and climbout weretreated as elevated point sources using an innovative procedure developed by commissionmodeling staff.
C Minor adjustment to nonattainment county on-road NOx emissions to account for incidents(accidents, etc.). A similar adjustment was applied to VOC emissions in the inventory preparedby NCTCOG, but the adjustment was not applied to NOx.
C Newly developed biogenic emissions calculated with the state-of-the-science Global System(GloBEIS). This new system dramatically reduces biogenic hydrocarbon emissions in the four-county area compared with previous methodologies, primarily because of updates and correctionsto the calculated attenuation of sunlight as it passes through the leaf canopy. This significantreduction in biogenic hydrocarbon emissions is supported by ambient isoprene measurements,which are typically much lower than the modeled isoprene concentrations seen with Base 4d. SeeAppendix D for details on how the GloBEIS emissions were developed.
Table 3.8-1 provides a comparison of emissions by category for July 3, 1996, between the Base 4d andBase 5 modeling inventories.
Table 3.8-1: Comparison of Base 4d and Base 5 Emissions by Category in the DFW 4-county Areafor July 3, 1996
CategoryNOx (tons/day) VOC (tons/day)
Base 4d Base 5 Base 4d Base 5
On-road mobile sources 314.5 322.4 234.7 234.7
Area/non-road mobile sources 156.3 173.4 293.8 296.5
Point sources 99.4 99.4 29.0 29.0
Biogenic sources 13.2 26.6 452.6 257.9
Total 583.4 621.8 1010.1 818.1
As Table 3.8-1 shows, by far the most significant change to the inventory is the revision of the biogenichydrocarbon (VOC) emissions, with biogenic VOC emissions reduced by more than 38% in the four-county area. In fact, emissions in some surrounding counties showed even larger changes. For exampleEllis County, which lies south of Dallas County, saw a reduction in biogenic VOC emissions of 54%.
Because substantial modifications were made to the base case inventory, the commission re-evaluatedmodel performance for the Base 5 base case. Model performance statistics for the two episodes aretabulated below in Tables 3.8-2 and 3.8-3. Values within EPA-recommended ranges are shown in bold. Note that although statistics are included for June 21, 1995 and June 30, 1996, these days are only used to“ramp-up” the model, and are not expected to exhibit good performance.
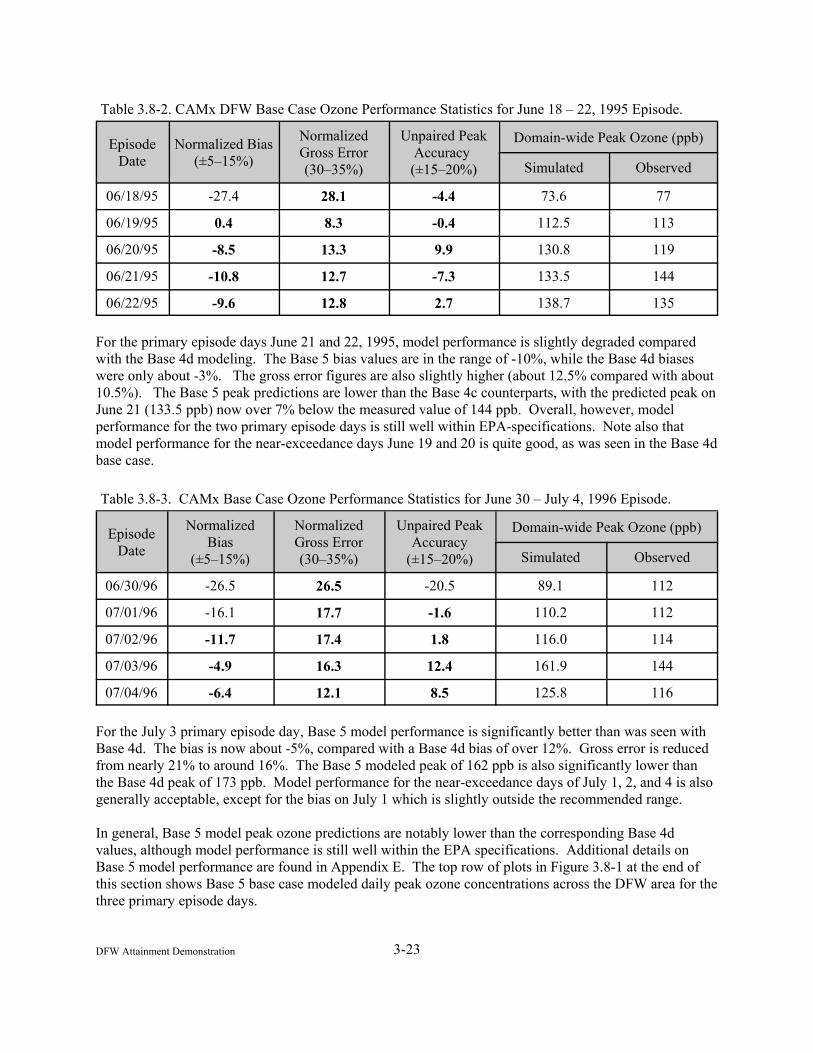
3-23DFW Attainment Demonstration
Table 3.8-2. CAMx DFW Base Case Ozone Performance Statistics for June 18 – 22, 1995 Episode.
EpisodeDate
Normalized Bias(±5–15%)
NormalizedGross Error(30–35%)
Unpaired PeakAccuracy (±15–20%)
Domain-wide Peak Ozone (ppb)
Simulated Observed
06/18/95 -27.4 28.1 -4.4 73.6 77
06/19/95 0.4 8.3 -0.4 112.5 113
06/20/95 -8.5 13.3 9.9 130.8 119
06/21/95 -10.8 12.7 -7.3 133.5 144
06/22/95 -9.6 12.8 2.7 138.7 135
For the primary episode days June 21 and 22, 1995, model performance is slightly degraded comparedwith the Base 4d modeling. The Base 5 bias values are in the range of -10%, while the Base 4d biaseswere only about -3%. The gross error figures are also slightly higher (about 12.5% compared with about10.5%). The Base 5 peak predictions are lower than the Base 4c counterparts, with the predicted peak onJune 21 (133.5 ppb) now over 7% below the measured value of 144 ppb. Overall, however, modelperformance for the two primary episode days is still well within EPA-specifications. Note also thatmodel performance for the near-exceedance days June 19 and 20 is quite good, as was seen in the Base 4dbase case.
Table 3.8-3. CAMx Base Case Ozone Performance Statistics for June 30 – July 4, 1996 Episode.
EpisodeDate
NormalizedBias
(±5–15%)
NormalizedGross Error(30–35%)
Unpaired PeakAccuracy
(±15–20%)
Domain-wide Peak Ozone (ppb)
Simulated Observed
06/30/96 -26.5 26.5 -20.5 89.1 112
07/01/96 -16.1 17.7 -1.6 110.2 112
07/02/96 -11.7 17.4 1.8 116.0 114
07/03/96 -4.9 16.3 12.4 161.9 144
07/04/96 -6.4 12.1 8.5 125.8 116
For the July 3 primary episode day, Base 5 model performance is significantly better than was seen withBase 4d. The bias is now about -5%, compared with a Base 4d bias of over 12%. Gross error is reducedfrom nearly 21% to around 16%. The Base 5 modeled peak of 162 ppb is also significantly lower thanthe Base 4d peak of 173 ppb. Model performance for the near-exceedance days of July 1, 2, and 4 is alsogenerally acceptable, except for the bias on July 1 which is slightly outside the recommended range.
In general, Base 5 model peak ozone predictions are notably lower than the corresponding Base 4dvalues, although model performance is still well within the EPA specifications. Additional details onBase 5 model performance are found in Appendix E. The top row of plots in Figure 3.8-1 at the end ofthis section shows Base 5 base case modeled daily peak ozone concentrations across the DFW area for thethree primary episode days.

3-24DFW Attainment Demonstration
3.8.2 The 2007d Future Base
Once the Base 5 model performance had been established, emissions were projected to 2007 and severalfederal and state controls were applied. The future base inventory developed upon the Base 5 base case iscalled 2007d (an intermediate future base, 2007c, was quickly replaced by 2007d). The 2007d futurebase is similar to the 2007b future base described earlier, with some notable exceptions:
C The biogenic emissions in 2007b were replaced with the new GloBEIS-generated emissions.
C The 2007d projected EGF point source emissions were recalculated using hourly three-yearaverage (1996-8) of continuous emissions monitored data from the ARPDB, taken over themonths of July, August, and September. This approach was deemed more representative oftypical ozone-season operation than the previous method, which had relied on a single 31-dayperiod in June-July of 1997.
C New 2007 emissions for the DFW International airport were provided directly by airport staff. As in the base case, approach and climbout emissions were modeled as elevated point sources.
C Because SB7 only applies to EGFs in operation in 1997, additional demand is expected to be metthrough construction of highly efficient combined-cycle gas turbine units in the near future. Toaccount for growth in electricity usage, the commission staff examined permit applications fornew sources within a 100-mile range of the DFW nonattainment area. These EGF sources wereexplicitly added to the future inventory. In addition, permit applications for cement kilns in thesame 100-mile radius were added to the future inventory.
C Point source growth in the BPA ozone nonattainment area was modified to account for bankedemissions.
C The nonattainment county on-road NOx emissions were adjusted to account for incidents(accidents, etc.), as was done in Base 5.
C Federal heavy duty gasoline vehicle standards were included in the future base.
Table 3.8-4 gives a comparison of the 1996 Base 5 emissions with the 2007d future base emissions bycategory for the July 3 episode day.

3-25DFW Attainment Demonstration
Table 3.8-4: Comparison of 1995 Base 5 and 2007d Future Base Emissions by Category in theDFW 4-county Area for July 3, 1996
CategoryNOx (tons/day) VOC (tons/day)
Base52007d
future base Base52007d
future base
On-road mobile sources 322.4 207.9 234.7 135.4
Area/Non-road mobile sources 173.4 176.3 296.5 304.4
Point sources 99.4 98.7 29.0 29.1
Biogenic sources 26.6 26.6 257.9 257.9
Total 621.8 509.5 818.1 726.8
As seen in Table 3.8-4, the future base case represents a substantial reduction of both VOC and NOx fromthe 1995/96 base cases. Consequently, peak predicted ozone concentrations are seen to decreasesignificantly from the base cases before applying any additional controls, although peak forecast ozoneconcentrations are still above the NAAQS of 125 parts/billion. Table 3.8-5 compares peak 2007 ozonepredictions with the base case modeled concentrations for the three primary episode days. The secondrow of Figure 3.8-1 at the end of this chapter shows peak daily predicted ozone concentrations modeledusing the 2007d future base for each of the primary episode days. Although the future base modelingindicates that ozone levels will be reduced substantially from the 1995-96 base, the peak ozone levels ontwo days exceed the 125 ppb ozone NAAQS. While the peak prediction on June 21 is below 125 ppb, wenote that the model underpredicted peak ozone in the base case, so underprediction in the future base islikely as well. Thus, the commission believes that substantial additional controls will be necessary toensure the area will reach attainment by 2007.
Table 3.8-5. 2007 Future Base Peak Ozone Predictions (Compared with Base Case) in ppb
EpisodeDate
Measured PeakOzone
Base 5Simulated Peak Ozone
2007d Future BaseSimulated Peak Ozone
6/21/95 144 133.5 122.4
6/22/95 135 138.7 126.7
7/3/96 144 161.9 147.4
3.8.3 Directional Guidance Modeling with the 2007d Base
To confirm that a NOx-based strategy was still appropriate after significantly changing the inventory,commission modeling staff executed two sensitivity runs from the new 2007d future base. In onesensitivity run, anthropogenic VOC emissions were reduced by 50%, and in the other NOx emissions weresimilarly reduced. The results of these analyses are shown in Table 3.8-6.

3-26DFW Attainment Demonstration
Table 3.8-6. 2007d Directional Guidance Modeling (in ppb)
EpisodeDate
2007d FutureBase Simulated
Peak Ozone
Simulated Peak Ozonewith 50% NOx
reduction
Simulated PeakOzone with 50%VOC reduction
6/21/95 122.4 105.9 115.2
6/22/95 126.7 107.5 118.0
7/3/96 147.4 123.9 135.1
For each primary episode date, the model responded much better to NOx reductions than to VOCreductions. This confirms that a NOx-based strategy is still the preferred path to attainment, althoughVOC reductions are clearly beneficial.
3.8.4 Control Strategy D30
After establishing that a NOx-based strategy was still appropriate for the DFW attainment plan, thecommission modeling staff ran Strategy D30 against the new 2007d future case. Strategy D30 is verysimilar to Strategy D29, which was evaluated against the 2007b future base. The changes from StrategyD29 are:
C The alternate construction inventory adjustment (-31.2%) was omitted from Strategy D29, since itrepresents an inventory adjustment and not a control strategy.
C Point source emission reductions associated with building code modifications were expandedfrom four to twelve counties.
C The reductions modeled for EGF point source NOx reductions were modified to change themaximum emission rate from 0.02 lbs/MMBtu to 0.033 lbs/MMBtu, in accordance with thecurrent proposed rules governing EGFs in the four-county nonattainment area.
Table 3.8-7 shows the emissions by category for the four-county DFW nonattainment area for the futurebase and Strategy D30.

3-27DFW Attainment Demonstration
Table 3.8-7: Comparison of 2007d Future Base and Strategy D30 Emissions by Category in theDFW 4-county Area for July 3, 1996
Category
NOx (tons/day) VOC (tons/day)
2007dfuture base
StrategyD30
2007dfuture base
StrategyD30
On-road mobile sources 207.9 157.2 135.4 103.4
Area/non-road mobile sources 176.3 128.3 304.4 296.1
Point sources 98.7 24.4 29.1 29.1
Biogenic sources 26.6 26.6 257.9 257.9
Total 509.5 336.5 726.8 686.5
The model was then executed with the Strategy D30 controls applied, and the results are tabulated inTable 3.8-8. The last row of plots in Figure 3.8-1 shows modeled 2007 daily maximum ozoneconcentrations for three primary episode days after applying strategy D30.
Table 3.8-8. 2007 Future Base Peak Ozone Predictions (compared with base case) in ppb
EpisodeDate
Measured PeakOzone
Base CaseSimulated Peak
Ozone
2007 Future BaseSimulated Peak
Ozone
2007 Simulated PeakOzone with Strategy D30
Controls
6/21/95 144 133.5 122.4 113.3
6/22/95 135 138.7 126.7 115.9
7/3/96 144 161.9 147.4 134.5
In the December, 1999 SIP proposal, several Weight-of-Evidence (WoE) arguments were presentedwhich provided a compelling argument that the DFW area would reach attainment in 2007, even thoughthe simulated 2007 peak ozone concentration for Strategy D30 is above the federal standard of 125parts/billion. As a result of comments received after the December, 1999 proposal, several new modelingruns were conducted and a new final control strategy was selected. The WoE arguments utilizingStrategy D30 have been replaced in this final modeling demonstration (see Sect. 6.3 of this document forthe current WoE documentation).
3.8.5 Additional Modeling using the Base 5 Base Case
A number of additional control strategy runs were performed as a result of comments received. StrategiesD31 through D42 were run using future bases built upon Base 5. Two new future bases were designatedduring this analysis, 2007e and 2007f. The 2007e future base incorporated some minor emissionsinventory corrections, while the 2007f future base incorporated updated assumptions about regionalreductions. Note that the 2007e and 2007f future bases were only run as part of control strategymodeling, so no results for the (uncontrolled) future bases are presented.

3-28DFW Attainment Demonstration
The 2007e future base is similar to 2007d, with the following exception: When the newly permitted EGFsources were added to the 2007d future base to account for future demand, the new units wereinadvertently subjected to the regional EGF rule, which reduces NOX emissions from permitted units inCentral and Eastern Texas by 50%. In fact, these units should have been modeled at their permittedlevels. Future base 2007e corrects this problem.
The 2007f future base is similar to 2007e, with the following exceptions:
EPA Region VI expressed concern that the 30% point source NOX reductions assumed in thestates of Arkansas. Louisiana, Florida, Mississippi, and Oklahoma was not supportable, andindicated that the attainment demonstration might be found incomplete if these assumptions wereincluded in the modeling without sufficient justification. Although the Commission believes thatthese assumptions are reasonable, there was insufficient time to develop supportingdocumentation. Therefore, the 2007f future base drops the assumption of reductions in thesestates (reductions in states covered by the NOX SIP call were not changed from the previousfuture base).
Region VI also expressed concern that the growth rates used to develop the 2007 future bases hadnot included bankable emissions. To account for banking, commission modeling staff determinedthe tons of VOC and NOX in the bank as of July 1, 1996, and added these tons back into thefuture inventory (minus a 20% discount to account for the Serious area offset ratio). The neteffect was to add in .61 tons/day of VOC to low-level points. Since only 5 tons/year (.013tons/day) of NOX emissions were in the bank on 7/1/96, emissions of NOX were not changed.
Table 3.8-9 summarizes the model runs conducted with the 2007d, 2007e, and 2007f future bases. Similar to Table 3.7-1, the bottom row of Table 3.8-9 shows peak 2007 modeled ozone concentration forthe July 3 episode day, but unlike Table 3.7-1, the value is not adjusted for base-case bias since the largeoverprediction seen in Base 4d is no longer present in the Base 5 base case (see Table 3.8-3).

3-29DFW Attainment Demonstration
Table 3.8-9: Control Strategies Modeled with the 2007d, 2007e, and 2007f Future Bases, part 1
Future Base: 2007d 2007e
Control Strategy: D30 D31 D32 D33 D34 D35 D36
Em
issi
on C
ontr
ol O
ptio
ns
Poi
nt S
ourc
es Tier 21 point source NOX reduction 42 4 4 43 43 43 44
Regional Cement Kiln Regulations C5 C5 C5 C C C C
Building Code Modifications 4 4 4 4 4 4 4
On-
Roa
d M
obil
e
Acceleration Simulation Mode (ASM) 12 12 12 4 4 12 12
On Board Diagnostics (OBD) 12 12 12 4 4 12 12
Federal Reformulated Gasoline 8 8 8 8 8 8 8
California Diesel fuel (on-road) 12 12 12 12 12 12 12
Reduce 65, 70 mph speed limits by 5 mph 12 12 12 4 4 12 12
55 mph Speed Limit
Remote Sensing 12 12 12 4 4 12 12
Transportation Control Measures (TCMs) 4 4 4 4 4 4 4
Vehicle Recycling Program (VRP) 12 12 12 12 12 12 12
California Low Emission Vehicles S S S S S S S
Non
-roa
d m
obil
e so
urce
s
Construction Equipment 10:00 AM Start 12 4 4 12 12
Reduce Construction Emissions by 25% 12
Alternate Construction Emissions 12
California Diesel 12 12 12 12 12 12 12
Accelerated Tier 3 Equip. Replacement 12 12 12 12 12 12 12
Electrify Airport Ground Service Equipment 4 4 4 4 4 4 4
Low NOx Hot Water Heaters S S S S S S S
Voluntary Mobile Emissions Prog. (VMEP) 12 12 12 12 12 12 12
California Spark Ignition Rules 12 12 12 12 12 12 12
July 3 Peak Modeled Ozone (no bias adjustment) 134.5 135.5 133.5 134.8 133.0 134.7 134.7
1 Notes on page following part 2 of this table.

3-30DFW Attainment Demonstration
Table 3.8-9: Control Strategies Modeled with the 2007d, 2007e, and 2007f Future Bases, part 2
Future Base: N/A6 2007f
Control Strategy: D376 D38 D39 D40 D41 D42
Em
issi
on C
ontr
ol O
ptio
ns
Poi
nt S
ourc
es Tier 21 point source NOX reduction 44 44 44 44 44 44
Regional Cement Kiln Regulations C C C C C C
Building Code Modifications 4 4 4 4 4 4
On-
Roa
d M
obil
e
Acceleration Simulation Mode (ASM) 12 127 48 127 127 99
On Board Diagnostics (OBD) 12 127 48 127 127 99
Federal Reformulated Gasoline 8 8
California Diesel fuel (on-road) 12 12 4 12 12 9
Reduce 65, 70 mph speed limits by 5 mph 12 12 4 12 9
55 mph Speed Limit 12
Remote Sensing 12 12 4 12 12 9
Transportation Control Measures (TCMs) 4 4 4 4 4 4
Vehicle Recycling Program (VRP) 12 12 4 12 12 9
California Low Emission Vehicles S S S S S S
Non
-roa
d m
obil
e so
urce
s
Construction Equipment 10:00 AM Start 12 12 4 4
Reduce Construction Emissions by 25%
Alternate Construction Emissions
Cal Diesel 12 12 4 12 12 9
Accelerated Tier 3 Equipment Replacement 12 12 4 4 4 4
Electrify Airport Ground Service Equipment 4 4 4 4 4 4
Low NOx Water Heaters S S S S S S
Voluntary Mobile Emissions. Program (VMEP) 12 12 4 12 12 9
California Spark Ignition Rules 12 12 4 12 12 9
July 3 Peak Modeled Ozone (no bias adjustment) 134.8 134.8 135.2 134.9 135.2 134.9
1 Notes on following page.
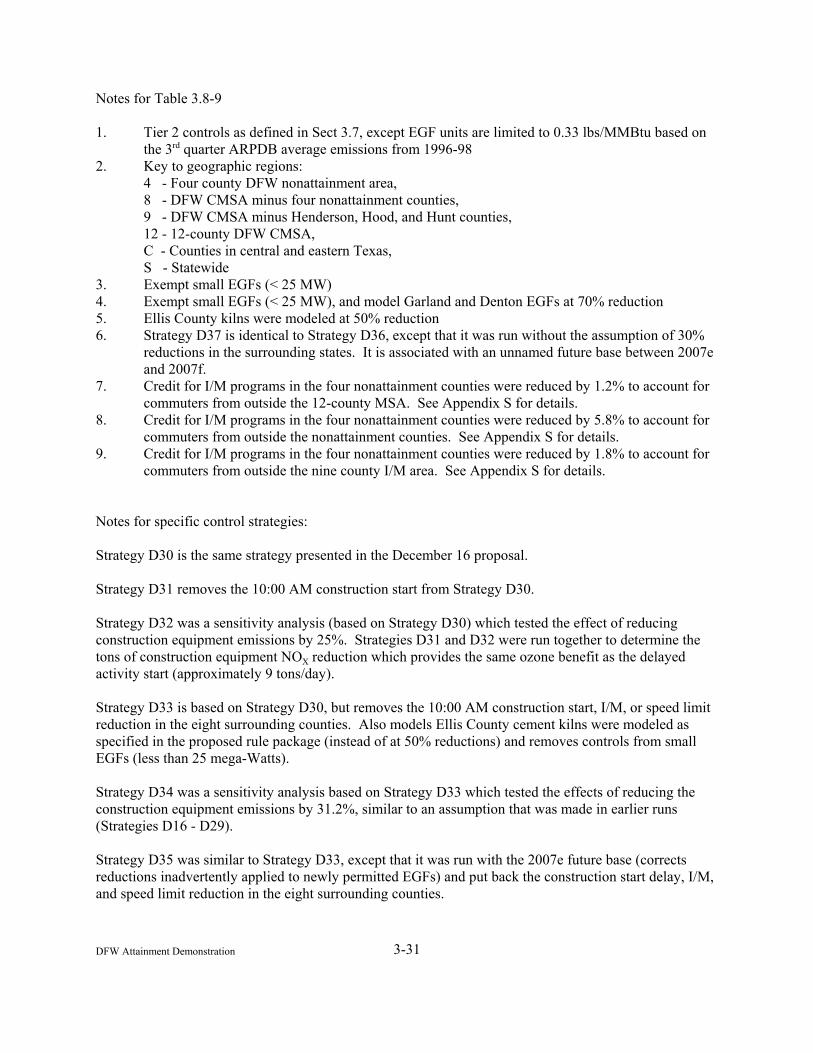
3-31DFW Attainment Demonstration
Notes for Table 3.8-9
1. Tier 2 controls as defined in Sect 3.7, except EGF units are limited to 0.33 lbs/MMBtu based onthe 3rd quarter ARPDB average emissions from 1996-98
2. Key to geographic regions: 4 - Four county DFW nonattainment area, 8 - DFW CMSA minus four nonattainment counties,9 - DFW CMSA minus Henderson, Hood, and Hunt counties,12 - 12-county DFW CMSA, C - Counties in central and eastern Texas,S - Statewide
3. Exempt small EGFs (< 25 MW)4. Exempt small EGFs (< 25 MW), and model Garland and Denton EGFs at 70% reduction5. Ellis County kilns were modeled at 50% reduction6. Strategy D37 is identical to Strategy D36, except that it was run without the assumption of 30%
reductions in the surrounding states. It is associated with an unnamed future base between 2007eand 2007f.
7. Credit for I/M programs in the four nonattainment counties were reduced by 1.2% to account forcommuters from outside the 12-county MSA. See Appendix S for details.
8. Credit for I/M programs in the four nonattainment counties were reduced by 5.8% to account forcommuters from outside the nonattainment counties. See Appendix S for details.
9. Credit for I/M programs in the four nonattainment counties were reduced by 1.8% to account forcommuters from outside the nine county I/M area. See Appendix S for details.
Notes for specific control strategies:
Strategy D30 is the same strategy presented in the December 16 proposal.
Strategy D31 removes the 10:00 AM construction start from Strategy D30.
Strategy D32 was a sensitivity analysis (based on Strategy D30) which tested the effect of reducingconstruction equipment emissions by 25%. Strategies D31 and D32 were run together to determine thetons of construction equipment NOX reduction which provides the same ozone benefit as the delayedactivity start (approximately 9 tons/day).
Strategy D33 is based on Strategy D30, but removes the 10:00 AM construction start, I/M, or speed limitreduction in the eight surrounding counties. Also models Ellis County cement kilns were modeled asspecified in the proposed rule package (instead of at 50% reductions) and removes controls from smallEGFs (less than 25 mega-Watts).
Strategy D34 was a sensitivity analysis based on Strategy D33 which tested the effects of reducing theconstruction equipment emissions by 31.2%, similar to an assumption that was made in earlier runs(Strategies D16 - D29).
Strategy D35 was similar to Strategy D33, except that it was run with the 2007e future base (correctsreductions inadvertently applied to newly permitted EGFs) and put back the construction start delay, I/M,and speed limit reduction in the eight surrounding counties.

3-32DFW Attainment Demonstration
Strategy D36 was the same as Strategy D35, except that the Garland and Denton city-owned EGFs werecontrolled at 70% (instead of tier 2).
Strategy D37 was like Strategy D36, but removed assumed NOX reductions in surrounding states notsubject to the NOX SIP Call (Oklahoma, Arkansas, Florida, Louisiana, and Mississippi. This change waspart of the new future base 2007f.
Strategy D38 includes the remainder of the 2007f future base (adds banked emissions into the 2007 pointsource emissions), and introduces an adjustment to the I/M credit in the nonattainment counties to accountfor commuters not in counties subject to the proposed I/M rule (in this case, counties outside the CMSA).
Strategy D39 is similar to Strategy D38, except that it removes all mobile and area source controls fromthe surrounding eight counties (except for regional, state, and federal rules). The I/M credit in thenonattainment counties was adjusted to account for commuters from these eight counties which are notsubject to an I/M program.
Strategy D40 is similar to Strategy D38, except that it removes the construction start delay, federalreformulated gasoline, and accelerated tier 3 equipment purchase from the surrounding eight counties.
Strategy D41 is the same as Strategy D40, but removes the construction start delay everywhere, andreplaces it with a twelve-county 55 mph speed limit.
Strategy D42 is the same as Strategy D40, except that the counties of Henderson, Hood, and Hunt arenow exempted from all but regional, state, and federal rules. The I/M credit in the nonattainment countieswas again adjusted to account for commuters from these three counties which are not subject to an I/Mprogram.
3.9 MODELING USING THE BASE 6 BASE CASE
The Base 5 base case introduced more accurate emissions estimates for biogenic sources, using the resultsof several years of applied research and field work directed by Commission staff. The Base 6 base caseintroduces additional emissions inventory improvements which represent the culmination of years ofeffort by Commission staff and their contractors. Most importantly, Base 6 replaces the emissions forconstruction equipment with updated emissions developed from an extensive survey conducted byEastern Research Group (ERG) under contract to the Commission. While the study was conducted in theHouston-Galveston Area (HGA) nonattainment area, ERG has developed a sound methodology forapplying these results to the DFW area. The updated emissions were not included in previous modelinganalyses because the HGA study did not conclude until February, 2000. The DFW area constructionequipment emissions were updated at this time because several commentors indicated concern with theaccuracy of the construction equipment emissions used in the attainment demonstration modeling.
In addition to comments received from stakeholders, Commission staff independently concluded that theprevious DFW construction emissions inventory was likely overstated, for several reasons:
C Ambient VOC/NOX ratios at monitors in the DFW area (as well as in HGA) are significantlylarger than inventory-derived VOC/NOX ratios. Reducing surface-level emissions of NOX isconsistent with reducing the discrepancy between the ambient and inventory-derived ratios.

3-33DFW Attainment Demonstration
C The approximately 88 tons/day of construction equipment NOX emissions in the 1996 Base 5inventory is significantly larger than the 54 tons/day of NOX emitted by on-road heavy dutydiesel equipment. Considering the large volume of truck traffic along the major interstatehighways in the region, it seems unlikely that construction equipment is responsible for 60%more emissions than the on-road diesels.
C Comparing the DFW construction emissions on a per-captia basis with the Los Angles air basinreveals that emissions per person are nearly three times as high in DFW as in the Los Angles area. Again, reducing construction equipment emissions substantially would lead to closer agreementbetween the inventories.
Overall, there is a significant body of evidence pointing towards reducing the construction equipmentemissions in the DFW area. The Base 6 base case reduces 1996 construction equipment NOX emissionsfrom 87.8 tons/day to 47.3 tons/day, and reduces VOC emissions from 18.7 tons/day to 12.5 tons/day. Development of this improved inventory is documented in Appendix V.
3.9.1 The Base 6 base case
Table 3.9-1 provides a comparison of emissions by category for July 3, 1996, between the Base 5 andBase 6 modeling inventories. The only change is seen in the area/non-road category.
Table 3.8-1: Comparison of Base 5 and Base 6 Emissions by Category in the DFW 4-county Area forJuly 3, 1996
CategoryNOx (tons/day) VOC (tons/day)
Base 5 Base 6 Base 5 Base 6
On-road mobile sources 322.4 322.4 234.7 234.7
Area/non-road mobile sources 173.4 132.9 296.5 290.3
Point sources 99.4 99.4 29.0 29.0
Biogenic sources 26.6 26.6 257.9 257.9
Total 621.8 581.3 818.1 811.9
Because a significant modification was made to the base case inventory, the commission re-evaluatedmodel performance for the Base 6 base case. Model performance statistics for the two episodes aretabulated below in Tables 3.9-2 and 3.9-3. Values within EPA-recommended ranges are shown in bold. Note that although statistics are included for June 21, 1995 and June 30, 1996, these days are only used to“ramp-up” the model, and are not expected to exhibit good performance.

3-34DFW Attainment Demonstration
Table 3.9-2. CAMx DFW Base 6 Ozone Performance Statistics for June 18 – 22, 1995 Episode.
EpisodeDate
Normalized Bias(±5–15%)
NormalizedGross Error(30–35%)
Unpaired PeakAccuracy (±15–20%)
Domain-wide Peak Ozone (ppb)
Simulated Observed
06/18/95 -27.4 28.1 -4.4 73.6 77
06/19/95 0.7 8.2 -1.7 111.0 113
06/20/95 -8.0 12.8 8.3 128.8 119
06/21/95 -10.0 12.1 -7.8 132.7 144
06/22/95 -8.8 12.5 1.8 137.4 135
For the primary episode days June 21 and 22, 1995, model performance is slightly improved comparedwith the Base 5 modeling. Model bias and gross error for each day (except for the ramp-up day of 6/18)are slightly reduced from Base 5. The lone exception to improved performance occurs on 6/21, where areduction in the peak modeled domain-wide ozone from 133.5 to 132.7 exacerbated the model’sunderprediction of the observed peak on that day by a small amount. Domain-wide peak ozone wasslightly smaller with Base 6 than with Base 5 for each day except 6/18, with reductions of up to 2 ppb.
Table 3.9-3. CAMx Base 6 Ozone Performance Statistics for June 30 – July 4, 1996 Episode.
EpisodeDate
NormalizedBias
(±5–15%)
NormalizedGross Error(30–35%)
Unpaired PeakAccuracy
(±15–20%)
Domain-wide Peak Ozone (ppb)
Simulated Observed
06/30/96 -26.5 26.5 -20.5 89.1 112
07/01/96 -14.9 17.0 -3.6 107.9 112
07/02/96 -10.8 16.0 0.3 114.4 114
07/03/96 -3.3 15.1 10.8 159.6 144
07/04/96 -6.5 12.2 8.3 125.6 116
For this episode, Base 6 model performance is also slightly better than was seen with Base 5. Bias andgross error are reduced on all days except for the ramp-up day 6/30 (no change) and on 7/4, where biasand gross error increased slightly. For every day except 6/30, domain-wide peak modeled ozone wasreduced by a small amount (up to 2.3 ppb).
Overall, Base 6 model performance is nearly identical to that of Base 5, with slightly improved bias andgross error, and slightly lower modeled peak ozone concentrations. Additional model performanceinformation for the Base 6 base case, including time series plots, is available from the Commission uponrequest.
3.9.2 The 2007g and 2007h future bases
After determining that the Base 6 base case exhibited acceptable model performance, Commission staffthen applied the same growth factors to the new construction equipment emissions as were used in Base

3-35DFW Attainment Demonstration
5, and applied the same controls as in the 2007f future base to create the 2007g future base. Table 3.9-4gives a comparison of the 1996 Base 6 emissions with the 2007d future base emissions by category forthe July 3 episode day.
Table 3.9-4: Comparison of 1995 Base 6 and 2007g Future Base Emissions by Category in theDFW 4-county Area for July 3, 1996
CategoryNOx (tons/day) VOC (tons/day)
Base 62007g
future base Base 62007g
future base
On-road mobile sources 322.4 207.9 234.7 135.4
Area/Non-road mobile sources 132.9 145.3 290.3 301.8
Point sources 99.4 98.7 29.0 29.1
Biogenic sources 26.6 26.6 257.9 257.9
Total 581.3 478.5 811.9 724.2
As was the case with the 2007d future base, the 2007g future base case represents a substantial reductionof both VOC and NOx from the 1995/96 base cases. However, it is worth noting that the Area/Non-roadmobile sources show relatively more growth than was seen previously (see Table 3.8-4). This change isdue to the new inventory allocating much more construction activity to the fast-growing counties ofDenton and Collin, which causes the overall construction inventory to grow faster than previously.
As before, peak predicted ozone concentrations are seen to decrease significantly from the base casesbefore applying any additional controls, with only one day exhibiting modeled concentrations above theNAAQS of 125 parts/billion. Table 3.9-5 compares peak 2007 ozone predictions with the base casemodeled concentrations for the three primary episode days. Modeled concentrations are seen to beslightly lower than those seen in Table 3.8-5, which shows peak modeled ozone for both the Base 5 basecase and the 2007d future base. Most significantly, the July 3 peak dropped from 147.4 ppb with the2007d future base to 143.5 ppb with the 2007g future base.
Table 3.9-5. 2007 Future Base Peak Ozone Predictions (Compared with Base Case) in ppb
EpisodeDate
Measured PeakOzone
Base 6Simulated Peak Ozone
2007g Future BaseSimulated Peak Ozone
6/21/95 144 132.7 120.3
6/22/95 135 137.4 124.5
7/3/96 144 159.6 143.5
Because the 2007g future base is very similar to the 2007d future base, commission staff concluded thatadditional directional guidance modeling was unnecessary.

3-36DFW Attainment Demonstration
After running one control strategy (D43) using the 2007g future base, an additional change was madewhich resulted in yet another future base. Because of comments related to the assumptions made inmodeling SB766, these reductions were removed from the future base, called 2007h. The 2007h futurebase also replaces the 30% NOX reduction assumed for EGFs in western Texas with a 24% reductionwhich is based on the system cap provided for in SB 7. An additional minor fix was made to theconstruction emissions to include some source categories which had been dropped during processing (~1ton/day of NOX). Note that the 2007h future base was run only as part of control strategies D44 throughD47, but was not run individually.
Finally, one additional strategy was run with an unnamed future base. In Strategy D48, the Tier 2/lowsulfur reduction factors for on-road mobile sources were revised as shown in Table 3.9-6 below. Therevised factors were developed using the Tier 2 spreadsheet model recently released by EPA, and arediscussed further in Appendix T.
Table 3.9-6: Revised Tier 2/Low Sulfur reductions
Region
Tier 2/ Low Sulfur Reduction
NOX VOC
Previous Current Previous Current
Dallas and Tarrant Counties .880 .877 .941 .939
Collin and Denton Counties .863 .917 .934 .955
Rural Counties .820 .917 .904 .960
3.9.3 Control strategy modeling with the 2007g and 2007h future bases
Table 3.9-7 describes the controls applied in Strategies D43 through D48, and lists the July 3 peakmodeled ozone concentration for each strategy.

3-37DFW Attainment Demonstration
Table 3.9-7: Control Strategies Modeled with the 2007g and 2007h Future Bases
Future Base: 2007g 2007h N/A
Control Strategy: D431 D44 D45 D46 D47 D48
Em
issi
on C
ontr
ol O
ptio
ns
Poi
nt S
ourc
es Tier 2 point source NOX reduction 42 43 44 43 43 43
Regional Cement Kiln Regulations C C C C5 C C5
Building Code Modifications 4 4 4 4 4 4
On-
Roa
d M
obil
e
Acceleration Simulation Mode (ASM) 9 9 9 9 9 9
On Board Diagnostics (OBD) 9 9 9 9 9 9
California Diesel fuel (on-road) 9 9 9 9 9 9
Reduce 65, 70 mph speed limits by 5 mph 9 9 9 9 9 9
Remote Sensing 9 9 9 9 9 9
Transportation Control Measures (TCMs) 4 4 4 4 4 4
Vehicle Recycling Program (VRP) 9 9 9 9 9 9
California Low Emission Vehicles S S S S S
Non
-roa
d m
obil
e so
urce
s
Construction Equipment 10:00 AM Start 4 4 4 4 4
California Diesel 9 9 9 9 9 9
Accelerated Tier 3 Equip. Replacement 4 4 4 4 4 4
Electrify Airport Ground Service Equipment 4 4 4 4 4 4
Low NOx Water Heaters S S S S S S
Voluntary Mobile Emissions Prog. (VMEP) 9 9 9 9 9 9
California Spark Ignition Rules 9 9 9 9 9 9
July 3 Peak Modeled Ozone (no bias adjustment) 130.7 131.0 131.5 131.0 131.4 131.4
Notes for Table 3.9-7
1. Controls in Strategy D43 are the same as in Strategy D42, except new future base2. Key to geographic regions:
4 - Four county DFW nonattainment area, 9 - DFW CMSA minus Henderson, Hood, and Hunt counties,C - Counties in central and eastern Texas,S - Statewide
3. Garland and Denton EGFs changed from 70% reduction to 0.06 lbs/MMBtu4. Texas Utilities sources modeled at 33 tons/day5. Regional cement kiln rule was revised to limit NOX emissions to 4 lbs/ton of clinker (instead of 6
lbs/ton) for wet kilns.
Notes for specific control strategies:

3-38DFW Attainment Demonstration
Strategy D43 is identical to Strategy D42, but using a future base incorporating the revised constructionequipment emissions. Peak modeled ozone on July 3 dropped from 134.9 ppb to 130.7 ppb using therevised emissions.
Strategy D44 is nearly identical to Strategy D42, but using the 2007h future base (no reductions assumedfor SB 766, minor correction to construction equipment emissions). Only control strategy change is thatGarland and Denton EGF’s are now modeled at 0.06 lbs/MMBtu instead of at 70% reduction.
Strategy D45 is the same as Strategy D44, but with emissions at Texas Utilities sources in the fournonattainment counties modeled at 33 tons/day (instead of 0.033 lbs/MMBtu, which is about 14tons/day).
Strategy D46 is the same as Strategy D44, but with wet cement kilns in central and eastern Texas limitedto 4 lbs. of NOX per ton of clinker produced, rather than 6 lbs. of NOX per ton (as had previously beenassumed). This modification reflects a change in the proposed rule.
Strategy D47 is the same as Strategy D44, but without the delayed construction start. With the improvedconstruction equipment inventory, the construction delay is seen to reduce peak ozone of July 3 from131.4 ppb to 131.0 ppb.
Strategy D48 is the same ad D46, except California LEV is replaced by revised federal Tier 2/Low sulfur. Note that the change in peak predicted ozone from Strategy D46 to D48 (.4 ppb) is primarily due to thechange in the Tier 2/Low sulfur assumptions, not merely to replacing Cal LEV with Tier 2/Low sulfur.
3.10 MODELING USING THE BASE 6a BASE CASE
Another significant improvement to the modeling inventory was completed late in the SIP developmentprocess, necessitating the development of one additional base case. The Base 5 base case incorporatednew emissions for the DFW International Airport, as provided by the airport staff. These new emissionsincluded 15.08 tons/day of NOX and 2.26 tons/day of VOC from airport ground-support equipment. Although these emissions appear quite large, they were developed by the airport staff using EPA-approved methodology and were accepted by the commission for use in the attainment demonstrationmodeling. Subsequent to the original SIP proposal, the Airline Transport Association (ATA) conducted abottom-up inventory of airport ground-support equipment in the area. The DFW International Airportemissions for NOX and VOC provided by the ATA were, respectively, 6.61 tons/day and 4.68 tons/day,including buses which operate exclusively on airport property.
After carefully reviewing the ATA methodology and consulting with EPA Region VI, the commissionconcluded that the ATA emissions provided a more accurate estimate of actual emissions than did thevalues used previously. A new base case, Base 6a, was created to incorporate this inventoryimprovement. A discussion of the methods used to develop these latest airport ground-support equipmentemissions is provided in Appendix W.
About this same time, commission staff developed a minor revision to the construction equipmentemissions introduced in Base 6. This revision used survey-generated operational data instead of defaultvalues contained in EPA’s prototype NONROAD model, and added 3.3 tons/day of NOX and 0.5 tons/dayof VOC to the construction equipment emissions (see Appendix V for details). Base 6a also includes thisinventory upgrade.

3-39DFW Attainment Demonstration
3.10.1 The Base 6a base case
Table 3.10-1 provides a comparison of emissions by category for July 3, 1996, between the Base 6 andBase 6a modeling inventories. As was the case with Base 6, the only changes seen are in the area/non-road category.
Table 3.10-1: Comparison of Base 6 and Base 6a Emissions by Category in the DFW 4-county Areafor July 3, 1996
CategoryNOx (tons/day) VOC (tons/day)
Base 6 Base 6a Base 6 Base 6a
On-road mobile sources 322.4 322.4 234.7 234.7
Area/non-road mobile sources 132.9 123.3 290.3 293.4
Point sources 99.4 99.4 29.0 29.0
Biogenic sources 26.6 26.6 257.9 257.9
Total 581.3 571.7 811.9 815.0
The observant reader may notice that the change in NOX emissions from Base 6 to Base 6a is larger thanwould be expected from the modifications to airport ground support equipment and constructionemissions described above. The discrepancy arises from an error made originally in the Base 5 base case,wherein the projected 2007 airport emissions (19.6 tons/day) were used instead of the 1996 emissions(15.1 tons/day). This error did not affect control strategy modeling, since all scenarios built on the Base 5and Base 6 base cases assumed 100% ground support equipment electrification.
The commission once again re-evaluated the model performance for the new base case. Modelperformance statistics for the two episodes are tabulated below in Tables 3.10-2 and 3.10-3. Valueswithin EPA-recommended ranges are shown in bold. Note that although statistics are included for June21, 1995 and June 30, 1996, these days are only used to “ramp-up” the model, and are not expected toexhibit good performance.
Table 3.10-2. CAMx DFW Base 6a Ozone Performance Statistics for June 18 – 22, 1995 Episode.
EpisodeDate
Normalized Bias(±5–15%)
NormalizedGross Error(30–35%)
Unpaired PeakAccuracy (±15–20%)
Domain-wide Peak Ozone (ppb)
Simulated Observed
06/18/95 -27.4 28.1 -4.7 73.4 77
06/19/95 0.7 8.1 -2.5 110.1 113
06/20/95 -8.1 12.8 7.9 128.4 119
06/21/95 -10.1 12.2 -7.8 132.8 144
06/22/95 -8.8 12.5 1.9 137.6 135

3-40DFW Attainment Demonstration
For is episode, model performance is nearly identical with Base 6. On the primary episode days June 21and 22, 1995, modeled peak ozone increased by .1 and .2 ppb, respectively. Both model bias and grosserror increased by .1% on June 21, and were both unchanged on June 22. On the remaining days, modelpredictions were slightly lower, with the largest change seen on June 19 where peak predicted ozonedropped by .9 ppb.
Table 3.10-3. CAMx Base 6a Ozone Performance Statistics for June 30 – July 4, 1996 Episode.
EpisodeDate
NormalizedBias
(±5–15%)
NormalizedGross Error(30–35%)
Unpaired PeakAccuracy
(±15–20%)
Domain-wide Peak Ozone (ppb)
Simulated Observed
06/30/96 -26.4 26.4 -21.2 88.3 112
07/01/96 -14.9 17.0 -3.6 108.0 112
07/02/96 -10.8 16.1 0.3 114.3 114
07/03/96 -3.4 15.0 10.5 159.2 144
07/04/96 -6.6 11.9 7.8 125.0 116
For this episode, model performance is again very similar to that seen in Base 6. On the primary episodeday July 3, the modeled peak decreased by .4 ppb, and bias increased by .1ppb. However, gross errordeclined by .1 ppb. On the remaining episode days, modeled peak ozone dropped slightly, except for July1 where the modeled peak increased by .1 ppb.
Overall, Base 6a model performance is nearly identical to that of Base 6, with a general tendency toreduce peak ozone by a fraction of a ppb. All model performance statistics are nearly identical with thoseseen in Base 6. Additional model performance information for the Base 6a base case, including timeseries plots, is available from the Commission upon request.
3.10.2 The 2007i, 2007j and 2007k future bases
After determining that the Base 6a base case exhibited acceptable model performance, Commission staffthen applied growth factors to the revised inventory to create the 2007i future base. The growth factorsused were the same as those used previously, with the exceptions of point sources and the newly-revisedairport ground support equipment. In the latter case, projected 2007 emissions were supplied directly bythe ATA, and are documented in Appendix W.
Regarding point sources, EPA Region VI had expressed concerns that the growth methodology usedpreviously did not sufficiently account for banked (or bankable) emissions. Staff at Region VI developeda growth methodology based on the observed emission trends described in Appendix F. Themethodology itself is documented in Appendix U. The growth factors supplied by Region VI were usedto develop the 2007i future base, and are shown below in Table 3.10-4.
Table 3.10-4: Growth factors used to develop the 2007i future base
RegionAnnual Growth
Rate (%)1996-2007
Growth Factor

3-41DFW Attainment Demonstration
Houston/Galveston +0.002179 1.0002
Beaumont/Port Arthur -0.1035 0.989
Dallas/Fort Worth +0.01557 1.002
Central and Eastern Texas +0.01808 1.002
As before, these growth factors were applied only to non-EGF sources in the DFW nonattainmentcounties and in Central and Eastern Texas. However, a revision to the proposed rule language caused achange to the way that the nonattainment area EGF sources are modeled in 2007. The current proposalallows each system to have an emission cap based on the highest 30-day moving average heat input whichoccurred during the three years 1996, 97, and 98. This significantly increased emissions in the futurebase, but not necessarily in the control strategies.
Additional changes to the 2007i future base included:
C Incorporation of the revised Tier 2/Low sulfur reductions introduced in Strategy D48.
C Include reductions from Agreed Orders at Texas Eastman and ALCOA facilities.
C Corrected an error in on-road mobile source emissions. The NCTCOG had inadvertently appliedreductions for congestion mitigation twice in the four nonattainment counties. This changeincreased on-road NOX emissions by 1% and VOC emissions by 1.9%.
C Minor corrections to stack parameters of five stacks not originally included in the 1995/96modeling inventory.
C Missouri was removed from the states receiving reductions due to the NOX SIP call.
After two strategies were run with the 2007i future base, one additional modification were made to createthe 2007j future base. This change increased emissions at the ALCOA facility to their allowable underthe Agreed Order (30% reduction from 1997 emissions). This change was made in response to commentsreceived, and also to be consistent with the way the EGFs in Central and Eastern Texas were modeled.
Table 3.10-5 shows emissions for the Base 6a base case and the 2007j future base.
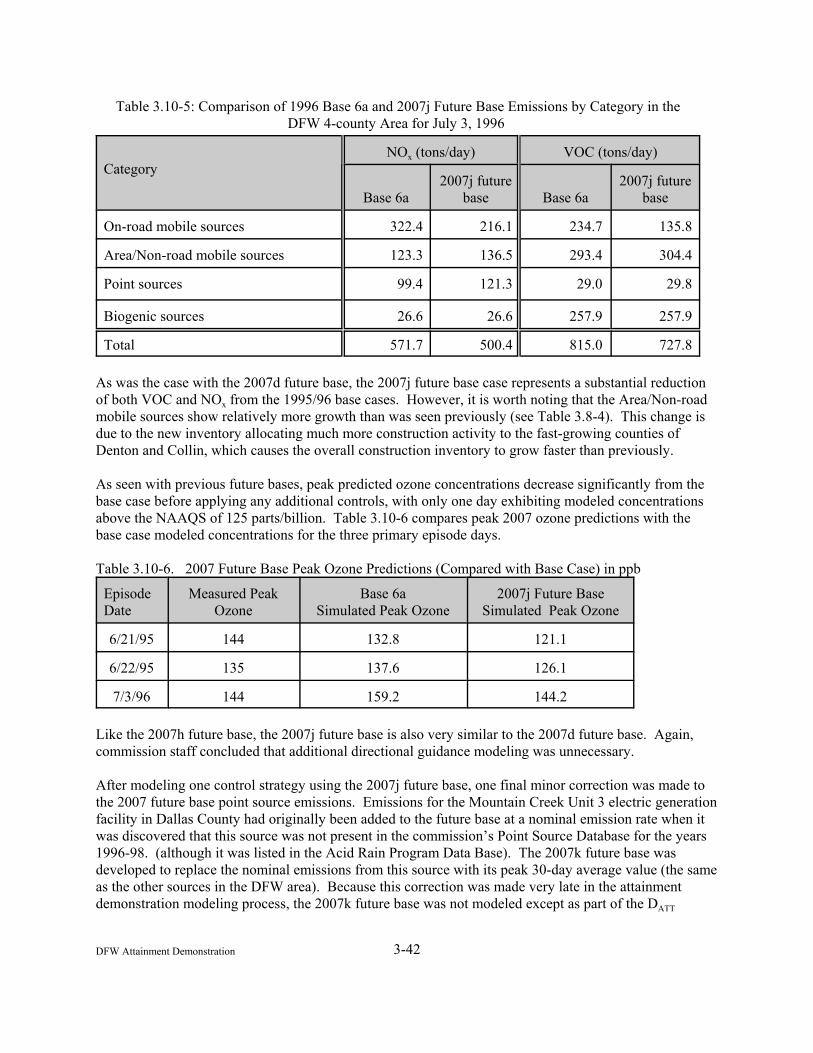
3-42DFW Attainment Demonstration
Table 3.10-5: Comparison of 1996 Base 6a and 2007j Future Base Emissions by Category in theDFW 4-county Area for July 3, 1996
CategoryNOx (tons/day) VOC (tons/day)
Base 6a2007j future
base Base 6a2007j future
base
On-road mobile sources 322.4 216.1 234.7 135.8
Area/Non-road mobile sources 123.3 136.5 293.4 304.4
Point sources 99.4 121.3 29.0 29.8
Biogenic sources 26.6 26.6 257.9 257.9
Total 571.7 500.4 815.0 727.8
As was the case with the 2007d future base, the 2007j future base case represents a substantial reductionof both VOC and NOx from the 1995/96 base cases. However, it is worth noting that the Area/Non-roadmobile sources show relatively more growth than was seen previously (see Table 3.8-4). This change isdue to the new inventory allocating much more construction activity to the fast-growing counties ofDenton and Collin, which causes the overall construction inventory to grow faster than previously.
As seen with previous future bases, peak predicted ozone concentrations decrease significantly from thebase case before applying any additional controls, with only one day exhibiting modeled concentrationsabove the NAAQS of 125 parts/billion. Table 3.10-6 compares peak 2007 ozone predictions with thebase case modeled concentrations for the three primary episode days.
Table 3.10-6. 2007 Future Base Peak Ozone Predictions (Compared with Base Case) in ppb
EpisodeDate
Measured PeakOzone
Base 6aSimulated Peak Ozone
2007j Future BaseSimulated Peak Ozone
6/21/95 144 132.8 121.1
6/22/95 135 137.6 126.1
7/3/96 144 159.2 144.2
Like the 2007h future base, the 2007j future base is also very similar to the 2007d future base. Again,commission staff concluded that additional directional guidance modeling was unnecessary.
After modeling one control strategy using the 2007j future base, one final minor correction was made tothe 2007 future base point source emissions. Emissions for the Mountain Creek Unit 3 electric generationfacility in Dallas County had originally been added to the future base at a nominal emission rate when itwas discovered that this source was not present in the commission’s Point Source Database for the years1996-98. (although it was listed in the Acid Rain Program Data Base). The 2007k future base wasdeveloped to replace the nominal emissions from this source with its peak 30-day average value (the sameas the other sources in the DFW area). Because this correction was made very late in the attainmentdemonstration modeling process, the 2007k future base was not modeled except as part of the DATT

3-43DFW Attainment Demonstration
control strategy. Table 3.10-7 shows the emissions from the 2007k future base compared with the Base6a base case emissions.
Table 3.10-7: Comparison of 1996 Base 6a and 2007k Future Base Emissions by Category in theDFW 4-county Area for July 3, 1996
CategoryNOx (tons/day) VOC (tons/day)
Base 6a2007k
future base Base 6a2007k
future base
On-road mobile sources 322.4 216.1 234.7 135.8
Area/Non-road mobile sources 123.3 136.5 293.4 304.4
Point sources 99.4 123.2 29.0 30.1
Biogenic sources 26.6 26.6 257.9 257.9
Total 571.7 499.4 815.0 728.2
3.10.3 Control Strategy Modeling with the 2007i, 2007j and 2007k future bases
Table 3.10-8 shows the control strategies modeled with the 2007i, 2007j and 2007k future bases,including Strategy DATT which provides the basis for the attainment demonstration.
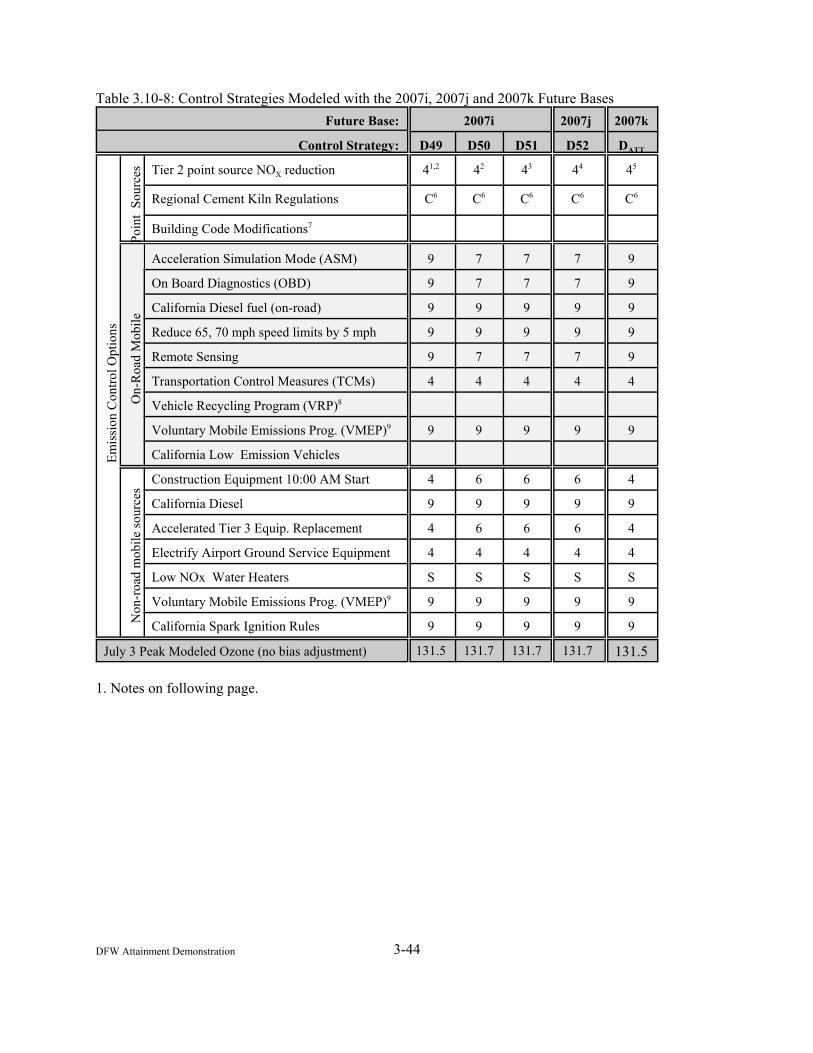
3-44DFW Attainment Demonstration
Table 3.10-8: Control Strategies Modeled with the 2007i, 2007j and 2007k Future Bases
Future Base: 2007i 2007j 2007k
Control Strategy: D49 D50 D51 D52 DATT
Em
issi
on C
ontr
ol O
ptio
ns
Poi
nt S
ourc
es Tier 2 point source NOX reduction 41,2 42 43 44 45
Regional Cement Kiln Regulations C6 C6 C6 C6 C6
Building Code Modifications7
On-
Roa
d M
obil
e
Acceleration Simulation Mode (ASM) 9 7 7 7 9
On Board Diagnostics (OBD) 9 7 7 7 9
California Diesel fuel (on-road) 9 9 9 9 9
Reduce 65, 70 mph speed limits by 5 mph 9 9 9 9 9
Remote Sensing 9 7 7 7 9
Transportation Control Measures (TCMs) 4 4 4 4 4
Vehicle Recycling Program (VRP)8
Voluntary Mobile Emissions Prog. (VMEP)9 9 9 9 9 9
California Low Emission Vehicles
Non
-roa
d m
obil
e so
urce
s
Construction Equipment 10:00 AM Start 4 6 6 6 4
California Diesel 9 9 9 9 9
Accelerated Tier 3 Equip. Replacement 4 6 6 6 4
Electrify Airport Ground Service Equipment 4 4 4 4 4
Low NOx Water Heaters S S S S S
Voluntary Mobile Emissions Prog. (VMEP)9 9 9 9 9 9
California Spark Ignition Rules 9 9 9 9 9
July 3 Peak Modeled Ozone (no bias adjustment) 131.5 131.7 131.7 131.7 131.5
1. Notes on following page.

3-45DFW Attainment Demonstration
Notes for Table 3.10-81. Key to geographic regions:
4 - Four county DFW nonattainment area, 9 - DFW CMSA minus Henderson, Hood, and Hunt counties,7 - DFW CMSA minus Henderson, Hood, Hunt, Parker and Johnson counties,6 - DFW CMSA plus Parker and Johnson counties only,C - Counties in central and eastern Texas,S - Statewide
2. Tier 2 point source controls were modified from Strategy D48 as follows:Denton EGF’s NOX emissions were reduced 78% from the new future base level.Garland EGF’s NOX emissions were reduced 79% from the new future base level.Remaining DFW area EGF’s NOX emissions were reduced 88% from new future base level.
3. Added 2.4 tons/day of NOX emissions to non-municipally owned EGFs.4. Tier 2 point source controls were modified from Strategy D48 as follows:
Denton EGF’s NOX emissions were reduced 86% from the new future base level.Garland EGF’s NOX emissions were reduced 72% from the new future base level.Remaining DFW area EGF’s NOX emissions were reduced 89% from new future base level.
5. Tier 2 point source controls were modified from Strategy D52 as follows:Non-Acid Rain sources in Garland and Denton systems were reduced 79% from future base levelA processing error which had left Handley Unit 5 uncontrolled previously, was corrected.A processing error which had uncontrolled the new EGF in Collin County, was corrected.Control the Mountain Creek Unit 3 boilers that were added/corrected in the 2007k future base.
6. Cement kilns are now modeled at either 30% reduction or (4 lbs/ton of clinker for wet kilns, 2.8lbs/ton for dry kilns), whichever allows higher emissions.
7. Building code modifications are no longer explicitly modeled, but will be included as Weight-of-Evidence.
8. Vehicle recycling now assumed to be part of VMEP.9. VMEP is now divided between on-road and non-road emissions (60/40 split)
Notes for specific control strategies:
Strategy D49 incorporates a number of changes from the previous strategy, besides the changes alreadyincorporated into the 2007i future base. These changes include modifications to controls to EGFs in thefour nonattainment counties and to the regional cement kiln rule. Additionally, the building codemodifications were removed from the modeling (they will be described in the Weight-of-Evidencesection), vehicle recycling is now assumed to be a part of the VMEP, and the VMEP has been distributedover both on-road and non-road mobile sources.
Strategy D50 removes Johnson and Parker counties from the I/M controls (ASM, OBD, remote sensing)and instead includes them in the delayed construction start and accelerated Tier 3 equipment rules.
Strategy D51 is like D50, but allows an additional 2.4 tons/day from non-municipal utility sources in thefour-county nonattainment area.
Strategy D52 is a minor revision of Strategy D51, based on the 2007j future base. It adjusts EGUreductions in the four-county nonattainment area to reflect the final rule language.

3-46DFW Attainment Demonstration
Strategy DATT is similar to Strategy D52, but uses the 2007k future base. It adds Parker and Johnsoncounties back into the I/M program, and removes the delayed construction start and accelerated Tier 3equipment purchase. This strategy also makes a very minor adjustment to the way that non-Acid RainEGF sources in the Garland and Denton utility systems were controlled. These seven units are nowreduced by 79% each. It also corrects a processing error which had left a Tarrant County EGF (HandleyUnit 5) at its uncontrolled 2007 level. Emissions from this unit are now correctly reduced by 89%. Additionally, a processing error which had applied negative control to the new EGF in Collin County,was corrected to apply no control. Finally, the Mountain Creek Unit 3 boilers, which were modeled at thecorrect peak 30-day average NOX emissions rate in the 2007k future base, were also controlled. This runprovides the basis for the attainment demonstration.
3.10.4 Summary of Strategy DATT Modeling
Table 3.10-9 summarizes the controlled inventory for strategy DATT.
Table 3.10-9: Comparison of 2007k Future Base and Strategy DATT Emissions by Category in theDFW 4-county Area for July 3, 1996
CategoryNOx (tons/day) VOC (tons/day)
2007kfuture base
StrategyDATT
2007kfuture base
StrategyDATT
On-road mobile sources 216.1 164.3 135.8 107.6
Area/Non-road mobile sources 136.5 106.6 304.4 285.0
Point sources 123.2 23.4 30.1 30.1
Biogenic sources 26.6 26.6 257.9 257.9
Total 499.4 320.9 728.2 680.6
Table 3.10-10 shows the final modeled peak ozone concentrations for each of the three primary episodedays with Strategy DATT. Also included are results from the base case and 2007j future base (2007j isincluded for comparison, although Strategy DATT was actually built from the 2007k future base, whichwas not modeled directly). Although the peak concentration on July 3 is still above the standard if 125ppb, the peaks for the two other days are well below the standard. The Weight-of-Evidence analysis inSection 6.3 will provide a convincing demonstration that the controls in Strategy DATT will be sufficient tobring the area into attainment by 2007.
Table 3.10-10 2007 Strategy DATT Peak Ozone Predictions (Compared with base case and future base)ppb
EpisodeDate
Measured PeakOzone
Base 6aSimulated Peak
Ozone
2007j Future BaseSimulated Peak
Ozone
Strategy DATT
Simulated PeakOzone
6/21/95 144 132.8 121.1 110.3

3-47DFW Attainment Demonstration
6/22/95 135 137.6 126.1 113.1
7/3/96 144 159.2 144.2 131.5
Figure 3.10-1 at the end of this chapter shows three ozone isopleth plots for each of the three primaryepisode days. For each day, base 6a, future base 2007j, and control strategy DATT are plotted. Thesefigures illustrate graphically the reductions in area and intensity of modeled ozone due to the controlsmodeled. It is evident that the modeling forecasts a tremendous air quality benefit for the citizens ofnorthern Texas.
Conclusions of the Phase II Ozone Modeling:
• Transport of ozone and precursors from the HGA area will affect the ability of the DFW area toattain the ozone standard.
• A large portion of the ozone precursors are locally generated, and therefore substantial localcontrols will be required to meet the ozone standard.
• The DFW 4-county area will still be NOx limited in 2007, therefore a NOx control strategy isrequired to bring the area into attainment. However, a combined VOC/NOx strategy is moreeffective than a NOx-only strategy.
• The most effective control package will involve substantial NOx reductions applied to the mobileand area portions of the emissions inventory.
• Weight-of-Evidence analysis presents a compelling argument that the area will reach attainmentby 2007. In fact, the predicted future design value of the area is substantially below 125 ppb,indicating that the area may actually achieve air quality better than that required under the FCAA.

4-1DFW Attainment Demonstration
CHAPTER 4: DATA ANALYSIS
Analysis of Impact of Houston Emissions on DFWA considerable body of evidence has been developed which shows that emissions from HGA affect theDFW area. The most compelling evidence of transport is based on some special modeling runs where weremoved all the anthropogenic emissions from the Houston 8-county area to see what difference it wouldmake in the two Dallas episodes. From these HGA-Zero Out runs we see that if HGA emissions areremoved from the model, significant ozone reductions occur in a plume downwind of the HGA area.
• During the 1995 DFW episode, the ozone reduction plume impacts the Austin area by more than10 ppb. The largest ozone reductions from this HGA-Zero Out run occurs in the afternoon whenozone is normally at a maximum.
• During the 1996 DFW episode, the ozone reduction plume impacts the Tyler-Longview area bymore than 10 ppb. The largest ozone reductions from this HGA-Zero Out run occurs in theafternoon, when ozone is normally at a maximum.
• A special episode was created with synthetic winds to carry the HGA plume directly towards theDFW area. With the synthetic wind package, the ozone reduction plume impacts the DFW areaby 5 ppb during the evening and morning hours, and by 10 ppb during the afternoon when ozoneis at a maximum.
• Modeling with CAMx and Ozone Source Apportionment Technology (OSAT) analysis during the1996 episode shows that 3-6 ppb of the Dallas ozone comes from HGA sources.
Supplementary evidence that emissions from Houston affect the DFW area has also been developed. Some of this evidence comes from surface winds and trajectory data, and some comes from satellite andaircraft measurements.
• Back trajectories calculated from wind flow during ozone episodes imply that parcels andpollution are carried from Houston. Our analysis shows that more than 13 percent of the highozone days have back trajectories that pass near or through the HGA area.
• Review of the DFW back trajectories indicates parcels that pass closer to Houston have higherozone, and that this relationship is statistically significant (p=.0001).
• Actual measurements from satellite and aircraft missions provide strong evidence of the existenceof an urban ozone plume downwind of the Houston area.
• During ozone episodes, surface wind directions in the DFW area shift to a more southeasterlydirection, which implies contributions from both the lignite belt and Houston.
Conclusions:
• The HGA urban plume does on occasion contribute to the high ozone that occurs in the DFWarea.
• The HGA urban plume is transported to other areas in Texas and adds to the backgroundconcentrations.

4-2DFW Attainment Demonstration
Graphic images which illustrate the results of the modeling test can be found in Appendix N

5-1DFW Attainment Demonstration
CHAPTER 5: RATE OF PROGRESS
5.1 OVERVIEW
The DFW ozone nonattainment area was classified as a moderate area as a result of the FCAAAmendments of 1990. As a moderate area, the State of Texas was required to submit a SIP demonstratinga 15% VOC emission reduction, net of growth, for the DFW area for the years 1990 through 1996. The15% ROP SIP was adopted by the commission on November 10, 1993 and May 13, 1994 and submittedto the EPA. The DFW area did not attain the 1-hour ozone standard by the November 1996 deadline. OnMarch 18, 1999 the commission submitted a SIP to the EPA addressing attainment of the ozone standardfor the DFW area. The revised SIP also included ROP toward satisfying EPA’s requirement ofreasonable further progress in emission reductions for the DFW area for the years 1997-99.
Because of the short amount of time to develop the 9% ROP portion of the SIP, placeholder numberswere used until certain emission estimates could be more firmly established. The reductions ultimatelysubmitted toward ROP were short of the 9% target. The combination of this shortfall, a lack of modeledcontrol strategies, and non-inclusion of rules needed to bring the area into attainment led to adetermination of incompleteness by the EPA.
Subsequently, the request of the NCTCOG, commission staff met to discuss the 9% ROP portion of theDFW SIP. As the metropolitan planning organization for the DFW region, the NCTCOG is concernedabout meeting transportation conformity. The SIP that was submitted in March 1999 contained for thefirst time a transportation conformity budget for NOx. Because the SIP was found to be incomplete, theNOx budget will be unusable and it will be extremely difficult to show conformity in the future. This willaffect the region’s ability to implement their metropolitan transportation plan.
Potential emission reduction credits were investigated that were not claimed in the March 1999 SIP inorder to make up the ROP shortfall. The focus was on VOC reductions because fewer would be neededto make up a shortfall compared to NOx emission reductions. The ROP lacked about 20% of the VOCreductions needed, which amounted to 5.87 TPD. A complete 9% ROP SIP would allow certaintransportation projects from being put on hold. Reductions not previously considered were identified thatwould make up the shortfall in order to complete the 9% ROP requirements for the years 1996-99. Theseadditions are included in this revised 9% ROP SIP.
EPA’s method for calculating ROP targets involves growing emissions out to the future year ofattainment. Because of the tremendous growth in the DFW area over the last several years, the on-roadand non-road mobile source emission estimates for NOx from the years 1997, 1998, and 1999 outweighthe NOx emission reductions from mobile source control strategies implemented in the area. As a result,the commission has decided to pursue the full 9% ROP through the use of VOC reductions.
However, because photochemical modeling for the DFW area shows that NOx reductions are necessary inbringing the area into attainment. The State of Texas submitted to the EPA on November 13, 1998 aletter indicating that this most recent photochemical modeling has triggered their condition of the NOx
waiver and thus it should be rescinded. The EPA initiated steps to rescind the NOx exemption which wasmade effective on June 21, 1999.
5-2DFW Attainment Demonstration
5.2 CALCULATION OF THE 1999 TARGET LEVELS
Table 5.2-1 shows the amount of VOC reductions needed to achieve the ROP requirements. EPA hasdevised a complex method for calculating the rate of progress target. This process was developed toensure that the rate of progress calculation reflected growth in the emissions inventory, and appropriately accounted for both creditable and non-creditable emission reductions achieved since 1990.
The VOC calculation in Table 5.2-1 starts with the 1990 Base Year EI (Step 1). This EI is then adjustedto remove non-creditable reductions that occurred since 1990 (Steps 2, 3, and 5). This new EI is calledthe "Adjusted Base Year EI". The ROP percentage of 9% in this case is taken from this new AdjustedBase Year EI (Step 4). The 1999 Target Level is calculated in Step 7 by subtracting Steps 4 and 5 fromStep 6. This new target level can be considered as a ROP budget for the area. In Step 8, the uncontrolled1999 forecast emissions inventory is listed. Step 9 is the difference between where the area would be in1999 without controls (Step 8) and where they are required to be (their Target Level in Step 7). Step 10lists the creditable reductions made through the 15% SIP, and Step 11 calculates the difference betweenSteps 9 and 10 to yield the remaining needed reductions for the ROP demonstration, or the excess.

5-3DFW Attainment Demonstration
Table 5.2-1
1999 ROP Required VOC Emissions Target CalculationsDallas/Fort Worth Ozone Nonattainment Area Ozone
Season VOC Tons Per Day January 18, 1999
Step Emissions Basis Stationary Mobile Total
Point Area On-road
Non-road
1 1990 ROP Nonattainment Area Base YearEI
63.98 174.02 306.60 105.19 649.79
2 Adjusted Base Year EI Relative to 1996 63.98 174.02 204.35 105.19 547.54
3 Adjusted Base Year EI Relative to 1999 63.98 174.02 192.59 105.19 535.78
4 9% of Adjusted Base Year EI Relative to1999
48.22
5 RVP and Fleet turnover correction [steps(2-3)]
11.76 11.76
6 1996 Target Level 465.52
7 1999 Target Level [steps (6-5-4)] 405.54
8 1999 Emissions Forecast (Grown) WithPre-90 Control
26.16 182.02 247.75 119.35 575.28
9 Total Reductions Required by 1999 WithGrowth [steps (8-7)]
169.74
10 Creditable Reductions (1990-1996) 0.00 50.99 76.40 12.59 139.98
11 Required Reductions 1996-1999 29.76
Notes for On-Road Mobile
1. Forecast in step 8 is 1999 Emissions Forecast (Grown) With Pre-90 Control.2. Base year on-road mobile emissions calculated with MOBILE5 for an ozone season weekday.3. Adjusted base year on-road mobile emissions and 1999 forecast on-road mobile emissions
calculated with MOBILE5A for an ozone season weekday.4. Point source reductions from step 10 have been removed to avoid double counting.

5-4DFW Attainment Demonstration
5.3 CONTROLS TO ACHIEVE THE RATE OF PROGRESS TARGET
5.3.1A summary of the reductions toward achieving the 9% ROP target are included in Table 5.3-1. The tableshows VOC reductions net of growth from the 1990 baseline by 1999. Table 5.3-2 shows NOx net ofgrowth reductions that will occur from the 1990 baseline by 1999. Contingency measures for VOCs areincluded as well as further NOx reductions that will occur by 2001.

5-5DFW Attainment Demonstration
Table 5.3-1
VOC ESTIMATES TOWARDS 9% ROP SIP - DALLAS/FORT WORTH
Emissions Inventory 1990 Percent Growth 1999 Percent
Area Sources 174.02 26.8% 4.6% 182.02 31.6%
Point Sources 63.98 9.8% -59.1% 26.16 4.5%
On-road Mobile Sources 306.60 47.2% -19.2% 247.75 43.1%
Off-road Mobile Sources 105.19 16.2% 13.5% 119.35 20.7%
TOTALS 649.79 -11.5% 575.28
ESTIMATED VOC REDUCTIONS
Control Strategy 1999 Projected Reduction Percent ofTons Per Day Tons Per Day Requirement
Aircraft Engines 6.73 1.52 5.30%TCMs 247.75 3.74 13.04%Windshield Washer Fluid 2.27 0.29 1.01%1998 Vehicle Registration 244.18 3.57 12.45%Utility engine 1997-1999 68.45 2.37 8.26%UST Remediation 1.81 1.81 6.31%Tier I, I/M, RFG 161.47 16.82 58.65%
Subtotal 30.12 105.02%
Contingency StrategyCommercial Bakeries 0.51 0.15 0.77%Offset Printing 0.55 0.24 1.23%I/M, Tier I, RFG Phase II 247.75 10.94 56.12%Naphtha Dry Cleaners 4.77 2.41 12.36%Utility Engine 2000 68.45 0.92 4.72%
Subtotal 14.66 75.20%
Required Target 29.76 100.00%Creditable Reductions 30.12 101.21%Excess 0.36 1.2%
Required Contingency 19.49 100.0%Required Target + Contingency 49.25 100.0%Total Reductions 44.78 90.9%Shortfall 4.47 9.1%
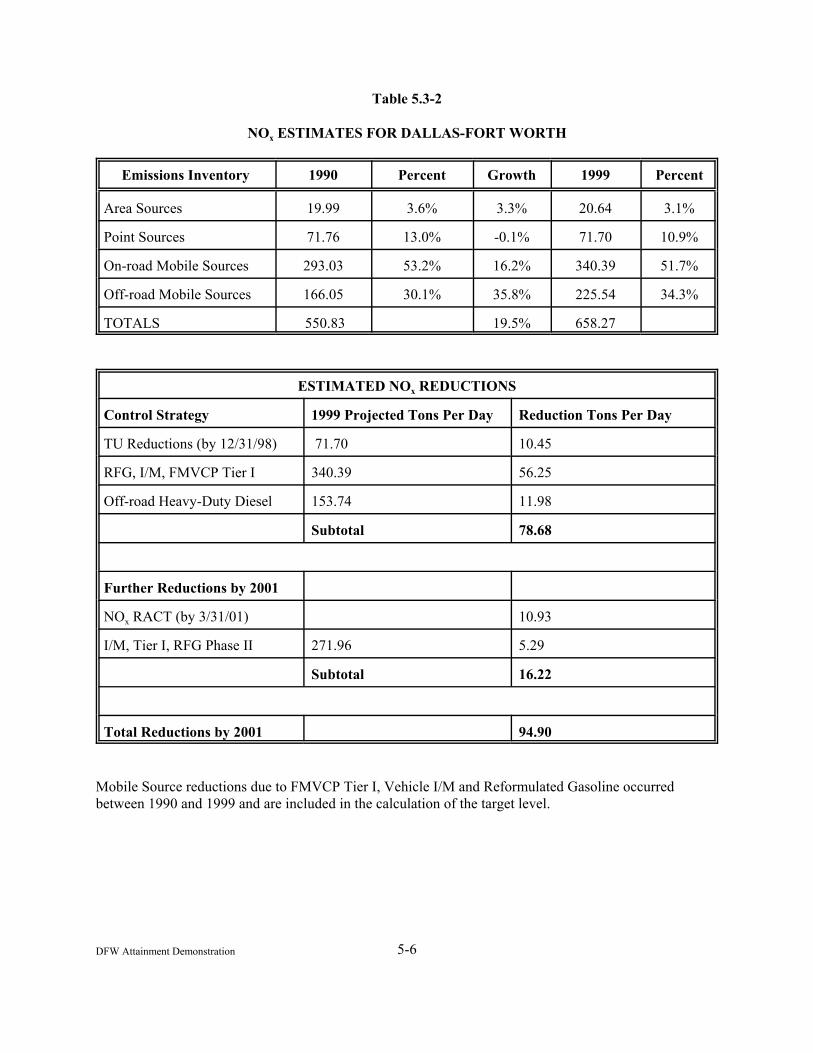
5-6DFW Attainment Demonstration
Table 5.3-2
NOx ESTIMATES FOR DALLAS-FORT WORTH
Emissions Inventory 1990 Percent Growth 1999 Percent
Area Sources 19.99 3.6% 3.3% 20.64 3.1%
Point Sources 71.76 13.0% -0.1% 71.70 10.9%
On-road Mobile Sources 293.03 53.2% 16.2% 340.39 51.7%
Off-road Mobile Sources 166.05 30.1% 35.8% 225.54 34.3%
TOTALS 550.83 19.5% 658.27
ESTIMATED NOx REDUCTIONS
Control Strategy 1999 Projected Tons Per Day Reduction Tons Per Day
TU Reductions (by 12/31/98) 71.70 10.45
RFG, I/M, FMVCP Tier I 340.39 56.25
Off-road Heavy-Duty Diesel 153.74 11.98
Subtotal 78.68
Further Reductions by 2001
NOx RACT (by 3/31/01) 10.93
I/M, Tier I, RFG Phase II 271.96 5.29
Subtotal 16.22
Total Reductions by 2001 94.90
Mobile Source reductions due to FMVCP Tier I, Vehicle I/M and Reformulated Gasoline occurredbetween 1990 and 1999 and are included in the calculation of the target level.

5-7DFW Attainment Demonstration
5.3.2 Windshield Washer Fluid
In the September 11, 1998 issue of the Federal Register (63 FR 48819), EPA published the adoptednational VOC emission standards for certain categories of consumer products under §183(e) of theFCAA. Title 40 CFR 59.203 (Standards for Consumer Products) states:
(a) The manufacturer or importer of any consumer product subject to this subpart shallensure that the VOC content levels in table 1 of this subpart and HVOC content levels intable 2 of this subpart are not exceeded for any consumer product manufactured orimported on or after December 10, 1998, except as provided in paragraphs (b) and (c) ofthis section, or in Secs. 59.204 or 59.206.
In turn, Table 1 limits automotive windshield washer fluid to 35 weight-% VOC. EPA calculated VOCreductions from this national consumer products rule to be 20% and allowed states to take this emissionreduction credit in their SIPs. Consequently, Texas took credit in its SIPs for a 20% VOC reduction inemissions from consumer products, based upon EPA's national rule.
Prior to EPA's issuance of its national rule, Texas adopted a consumer products rule in 30 TAC Chapter115, §§115.600, 115.610, 115.612-115.617, and 115.619. The limits for automotive windshield washerfluid (23.5 weight-%), nonaerosol glass cleaners (6 weight-%), nail polish removers (75 weight-%) in theTexas rule are more stringent than the corresponding limits in the national rule (35, 8 and 85 weight-%,respectively).
On May 13, 1999, Mr. Bruce Moore of EPA's OAQPS stated that the 35 weight-% limit for windshieldwasher fluid in the national rule represented the "status quo" (i.e., resulted in no reductions). Mr. Mooreagreed that Texas could take credit for the difference between 23.5 and 35 weight-%. Therefore, Texas istaking VOC emission reduction credit for this difference. Texas has incorporated an 80% ruleeffectiveness for its windshield washer fluid rule in Table 5.3-3. As with the other Texas rules, the Texasconsumer products rule is enforced by the Field Operations Division, and unresolved violations result inenforcement action, which may include penalties, as appropriate.

5-8DFW Attainment Demonstration
Table 5.3-3
DFW Windshield Wiper Fluid
35-23.5% 1990 1990 WITH RE 1999 1999 WITH RE NEW 1999 REDUCTIONSCOUNTY TPY TPD TPY TPD TPY TPD TPY TPD TPY TPD TPY TPDCOLLIN 85.73 0.2349 54.44 0.1492 135.68 0.3717 86.16 0.2361 76.25 0.2089 9.91 0.0271 DALLAS 601.61 1.6482 382.02 1.0466 709.49 1.9438 450.52 1.2343 398.71 1.0924 51.81 0.1419 DENTON 88.81 0.2433 56.40 0.1545 132.12 0.3620 83.90 0.2299 74.25 0.2034 9.65 0.0264 TARRANT
379.93 1.0409 241.26 0.6610 494.40 1.3545 313.94 0.8601 277.84 0.7612 36.10 0.0989
TOTAL 1156.09 3.1674 734.11 2.0113 1471.69 4.0320 934.52 2.5603 827.05 2.2659 107.47 0.2944
35% 1990 1990 WITH RE 1999 1999 WITH RE NEW 1999 REDUCTIONSCOUNTY TPY TPD TPY TPD TPY TPD TPY TPD TPY TPD TPY TPDCOLLIN 85.73 0.2349 54.44 0.1492 135.68 0.3717 86.16 0.2361 56.00 0.1534 30.16 0.0826 DALLAS 601.61 1.6482 382.02 1.0466 709.49 1.9438 450.52 1.2343 292.84 0.8023 157.68 0.4320 DENTON 88.81 0.2433 56.40 0.1545 132.12 0.3620 83.90 0.2299 54.53 0.1494 29.36 0.0804 TARRANT
379.93 1.0409 241.26 0.6610 494.40 1.3545 313.94 0.8601 204.06 0.5591 109.88 0.3010
TOTAL 1156.09 3.1674 734.11 2.0113 1471.69 4.0320 934.52 2.5603 607.44 1.6642 327.08 0.8961
23.5% 1990 1990 WITH RE 1999 1999 WITH RE NEW 1999 REDUCTIONSCOUNTY TPY TPD TPY TPD TPY TPD TPY TPD TPY TPD TPY TPDCOLLIN 85.73 0.2349 54.44 0.1492 135.68 0.3717 86.16 0.2361 65.91 0.1806 20.25 0.0555 DALLAS 601.61 1.6482 382.02 1.0466 709.49 1.9438 450.52 1.2343 344.65 0.9442 105.87 0.2901 DENTON 88.81 0.2433 56.40 0.1545 132.12 0.3620 83.90 0.2299 64.18 0.1758 19.72 0.0540 TARRANT
379.93 1.0409 241.26 0.6610 494.40 1.3545 313.94 0.8601 240.17 0.6580 73.78 0.2021
TOTAL 1156.09 3.1674 734.11 2.0113 1471.69 4.0320 934.52 2.5603 714.91 1.9587 219.61 0.6017
POPULATIONSCounty 1990 1999Collin 264036 417874 Windshield washer fluid: calculated 1999 using factor and population.Dallas 1852810 2185052 Recalculated 1999 (new 1999) using the percentage options associated

5-9DFW Attainment Demonstration
Denton 273525 406905 with the rule (35-23, 35, and 23). Then showed reduced emissions.Tarrant 1170103 1522627

5-10DFW Attainment Demonstration
5.3.3 Transportation Control Measures
Additional Credits from Existing 15% ROP TCMsOn July 7, 1999, the EPA responded to questions posed by the commission regarding TCMs and theirappropriateness in SIPs. Specifically, the 9% ROP must show all projects implemented for the 15% ROPSIP before 1996 and remaining projects that will be counted as emission reduction in the 9% ROP SIP. Therefore, it was determined that benefits from TCMs, as listed in the submitted DFW 9% ROP, were notall inclusive. Specifically, benefits were only determined for those projects being funded betweenNovember 1996 and November 1999, and operational by November 1999. This initial analysis did notinclude benefits to those projects accounted for in the previous 15% ROP (through November 1996). Many of these TCMs have a long design life that will have benefits in November 1999. Examples ofthese projects include HOV lanes, corridor management, park-n-ride lots, bicycle/pedestrian, commuterrail, light rail, intersection improvements, and signal improvements. Only those signal improvements thatwere implemented in calendar year 1996 were re-evaluated for the 9% ROP. Table 5.3-4 summarizes theapproach to quantifying expected benefits to these long-term projects. November 1996 benefits aredocumented in NCTCOG’s Transportation Control Measure Effectiveness Study, Technical Report,August 1996. An emission factor ratio (based on EPA’s MOBILE5a model) of 0.874, suggests a loss of12.6% in benefits over a three year period. Therefore, accounting for projects with a long design lifefrom the 15% ROP, an additional VOC reduction of 3.07 TPD is expected by November 1999.
Table 5.3-4
LONG TERM 1996 TCM’s EVALUATED TO 1999Volatile Organic Compounds
TCM November 1996Benefits (lbpd)
1996 to 1999Emission Factor
Adjustment
November 1999Benefits (lbpd)
HOV 398 0.874 348Corridor Management
1,088 0.874 951Park-n-Ride Lots 154 0.874 135Bicycle/Ped 22 0.874 19Commuter Rail 9 0.874 8Light Rail 27 0.874 24IntersectionImprovements 2,085 0.874 1,822Signal Improvements(Implemented in 1996) 3,249 0.874 2,840
Total Pounds per Day(lbpd) 6,147Total Tons per Day(TPD) 3.07
Appendix G includes the inventory of TCMs implemented through November 1996, as determined for the15% ROP SIP.
Additional TCMs Implemented Between 1996 and 1999

5-11DFW Attainment Demonstration
As submitted in late 1998, the 9% ROP inventoried TCM’s to be let, constructed, and operational byNovember 1999, and placed each project in one of two categories. Projects receiving funds betweenNovember 1996 and November 1998 were categorized as committed. As originally identified in the 9%ROP, committed projects accounted for 0.29 TPD of VOC reductions. Projects receiving funds betweenNovember 1998 and November 1999 were categorized as contingent. Contingent projects account for anadditional 0.38 TPD of VOC reductions. Since one year has elapsed since this evaluation occurred, it wasdetermined to be appropriate to consider the extra 0.38 TPD as committed. Therefore, this 9% ROP SIPis accounting for the additional 0.38 TPD of VOC reductions from committed TCMs in 1999. Insummary, a total of 0.67 TPD has been identified from implementing TCMs between November 1996 toNovember 1999. Table 5.3-5 summarizes these SIP commitments.
Table 5.3-5
DALLAS-FORT WORTH OZONE NONATTAINMENT AREA9% RATE OF PROGRESS STATE IMPLEMENTATION PLANTRANSPORTATION CONTROL MEASURE COMMITMENTS
TCM Category 1997-1999Implementation Levels
1999 VOCEmission Reductions
(per day)Intersection Improvements/
Signal Improvements360 Locations 1,141.9 lbs
Freeway Corridor Management 4 Projects 72.0 lbsTravel Demand Management 2 Projects 54.6 lbsPark and Ride Lots 1 Lot 6.4 lbsAlternative Fuel Vehicles 387 Vehicles 0.0 lbsPed/Bicycle Facilities 19 Miles 34.7 lbsLight Rail 9 Miles 29.2 lbs
Total (lbs) 1,338 lbsTotal (TPD) 0.67 tons
Appendix G includes the inventory of TCMs implemented from November 1996 through November1999, as inventoried for the 9% ROP SIP. TCM details include location, length, emission reductions,implementation date, and other information within each category, where appropriate.
Two project categories were established at the time the analysis was conducted because of EPA’srequirement to identify projects by location, length, emission reductions, implementation date, and otherinformation within each category. NCTCOG believes this creates an obstacle to efficient recordmanagement, since a revision must be made to the SIP each time a project location changes. Therefore,since project descriptions are apt to change due to a wide variety of circumstances, a conservativeapproach was taken in the development of the 9% ROP SIP originally submitted.
5.3.4 Updated Vehicle Registration Distributions
In developing MOBILE5a_h emission factors for the 1999 on-road mobile source emission inventory,observed 1996 vehicle registration distributions were originally used as input since it was the latest andbest data available when the emission inventory was being created (December 1997). NCTCOG and thecommission determined that it would be sensible to update the vehicle registration distributions with the

5-12DFW Attainment Demonstration
most recent data available from TxDOT Vehicle Titles and Registration Division. Updating the vehiclefleet with current data, from 1996 to 1998, will allow the inventory to take credit for cleaner and moreemission efficient vehicles due to annual vehicle fleet turnover. The VOC emission benefits associatedwith this change in the DFW nonattainment area is a reduction of 3.57 TPD. Final 1998 vehicleregistration distributions for Dallas/Tarrant Counties (core urban) and Collin/Denton Counties (core rural)are summarized in Tables 5.3-6 and 5.3-7, respectively.
Table 5.3-6
DALLAS-FORT WORTH NONATTAINMENT AREA1998 VEHICLE REGISTRATION DISTRIBUTION FOR DALLAS AND TARRANT COUNTIES (CORE URBAN)
MODELYEAR LDGV LDGT1 LDGT2 HDGV LDDV LDDT HDDV MC
1998 0.097 0.093 0.112 0.030 0.097 0.093 0.125 0.1821997 0.088 0.097 0.142 0.054 0.088 0.097 0.113 0.1441996 0.080 0.074 0.066 0.045 0.080 0.074 0.107 0.1371995 0.094 0.084 0.091 0.179 0.094 0.084 0.066 0.1121994 0.076 0.078 0.064 0.043 0.076 0.078 0.077 0.0971993 0.071 0.060 0.051 0.033 0.071 0.060 0.063 0.0751992 0.062 0.051 0.034 0.034 0.062 0.051 0.044 0.0541991 0.061 0.050 0.033 0.029 0.061 0.050 0.069 0.0401990 0.059 0.047 0.037 0.030 0.059 0.047 0.061 0.0381989 0.054 0.048 0.032 0.027 0.054 0.048 0.045 0.0421988 0.048 0.043 0.039 0.030 0.048 0.043 0.035 0.0381987 0.041 0.033 0.038 0.036 0.041 0.033 0.033 0.0411986 0.037 0.041 0.041 0.051 0.037 0.041 0.031 0.0001985 0.032 0.035 0.049 0.044 0.032 0.035 0.035 0.0001984 0.025 0.031 0.028 0.040 0.025 0.031 0.026 0.0001983 0.015 0.019 0.014 0.017 0.015 0.019 0.013 0.0001982 0.010 0.017 0.020 0.026 0.010 0.017 0.015 0.0001981 0.008 0.013 0.012 0.026 0.008 0.013 0.014 0.0001980 0.006 0.009 0.010 0.034 0.006 0.009 0.008 0.0001979 0.007 0.013 0.015 0.049 0.007 0.013 0.008 0.0001978 0.006 0.012 0.010 0.033 0.006 0.012 0.005 0.0001977 0.004 0.010 0.016 0.022 0.004 0.010 0.003 0.0001976 0.003 0.007 0.013 0.015 0.003 0.007 0.001 0.0001975 0.002 0.003 0.010 0.014 0.002 0.003 0.001 0.0001974 0.014 0.032 0.023 0.060 0.014 0.032 0.003 0.000
Total 1.000 1.000 1.000 1.000 1.000 1.000 1.000 1.000
Table 5.3-7

5-13DFW Attainment Demonstration
DALLAS-FORT WORTH NONATTAINMENT AREA1998 VEHICLE REGISTRATION DISTRIBUTION FORCOLLIN AND DENTON COUNTIES (CORE RURAL)
MODELYEAR LDGV LDGT1 LDGT2 HDGV LDDV LDDT HDDV MC
1998 0.092 0.109 0.164 0.019 0.092 0.109 0.074 0.1591997 0.104 0.126 0.220 0.024 0.104 0.126 0.088 0.1651996 0.101 0.094 0.101 0.063 0.101 0.094 0.093 0.1541995 0.109 0.095 0.081 0.139 0.109 0.095 0.033 0.1221994 0.088 0.084 0.064 0.016 0.088 0.084 0.077 0.0921993 0.081 0.062 0.044 0.020 0.081 0.062 0.067 0.0751992 0.068 0.053 0.023 0.028 0.068 0.053 0.061 0.0551991 0.063 0.047 0.031 0.046 0.063 0.047 0.060 0.0351990 0.055 0.041 0.027 0.032 0.055 0.041 0.061 0.0381989 0.048 0.042 0.030 0.012 0.048 0.042 0.050 0.0381988 0.040 0.036 0.015 0.026 0.040 0.036 0.041 0.0331987 0.032 0.027 0.013 0.040 0.032 0.027 0.038 0.0341986 0.028 0.033 0.032 0.040 0.028 0.033 0.035 0.0001985 0.022 0.027 0.023 0.054 0.022 0.027 0.054 0.0001984 0.017 0.023 0.018 0.045 0.017 0.023 0.044 0.0001983 0.010 0.013 0.014 0.026 0.010 0.013 0.022 0.0001982 0.007 0.013 0.014 0.023 0.007 0.013 0.023 0.0001981 0.005 0.010 0.007 0.023 0.005 0.010 0.027 0.0001980 0.004 0.006 0.017 0.035 0.004 0.006 0.017 0.0001979 0.005 0.010 0.015 0.067 0.005 0.010 0.013 0.0001978 0.004 0.009 0.010 0.046 0.004 0.009 0.010 0.0001977 0.003 0.007 0.005 0.028 0.003 0.007 0.008 0.0001976 0.002 0.005 0.009 0.021 0.002 0.005 0.001 0.0001975 0.001 0.002 0.004 0.033 0.001 0.002 0.001 0.0001974 0.013 0.024 0.018 0.094 0.013 0.024 0.004 0.000
Total 1.000 1.000 1.000 1.000 1.000 1.000 1.000 1.000
A simple analysis was performed by adjusting final emission estimates, by county, with an adjustmentfactor accounting for the percent change in emission rates from 1996 to 1998 vehicle registrationdistributions. Specifically, VOC emission factors in Dallas and Tarrant Counties (core urban) werereduced by 2.36%. Likewise, VOC emission factors in Collin and Denton Counties (core rural) werereduced by 3.99%. Therefore, VOC emission benefits associated with updating observed vehicleregistration data in the DFW nonattainment area is a reduction of 3.57 TPD.

5-14DFW Attainment Demonstration
5.4 1999 MOTOR VEHICLE EMISSIONS BUDGETS
Motor Vehicle Emission Budgets for transportation conformity purposes are established at 147.22 TPDfor VOC and 284.14 TPD for NOx. These figures have been calculated by subtracting all on-road mobilesource reductions from the 1999 on-road mobile source emissions forecast. These calculations are shownbelow:
VOC NOx
1999 On-Road Emissions Forecast 247.75 TPD 340.39 TPD
1996 Tier1, I/M, RFG credits 69.46 0.00
1999 Tier1, I/M, RFG credits 16.82 56.25
1996 Transportation Control Measures 6.94 0.00
1998 Vehicle Registration 3.57 0.00
1999 Transportation Control Measures 3.74 0.00
1999 Motor Vehicle Emissions Budget 147.22 TPD 284.14 TPD
Calculation of motor vehicle emission budgets (MVEB) are based on data from Table 5.2-1 and 5.3-1. Table 5.2-1 lists a quantity of information including “1999 Emissions Forecast (grown with Pre-90Control” (Step 8), “Total Reductions Required by 1999 with Growth” (Step 9), “Creditable Reductions(1990-1996)” (Step 10), and “Required Reductions 1996-1999" (Step 11). The required reductions1996-1999 subtracts 1990-1996 reductions from the total reductions required.
Table 5-3.1 lists on-road mobile source VOC reductions as 247.75 TPD. This is the same number as Step8 in Table 5.2-1. The “Required Target” in Table 5.3-1 is 29.76 TPD for VOC and is the same as Step 11in Table 5.2-1. Although it does not specifically list the creditable reductions from 1990-1996, therequired target in Table 5.3-1 takes into account creditable reductions from 1990-1996.
The motor vehicle emission budget calculation begins with 245.75 TPD VOC and subtracts 1990-1996on-road mobile source controls and 1997-1999 on-road mobile source controls.

6-1DFW Attainment Demonstration
CHAPTER 6: REQUIRED CONTROL STRATEGY ELEMENTS
Table 6-1 shows the emission reduction estimates projected from implementation of federal, state, andlocal initiatives.
Table 6-1 DFW NOx Reduction Estimates1
July 3, 1996 Base CaseEmissions Inventory
1996 BaseCase 6a
(tpd)Percent of1996 Total
2007jFutureBase2
2007 FutureControlStrategy
DATT (tpd)Percent of2007 Total
Area and Non-road sources 132.9 23% 136.5 106.6 33%
Point sources 99.42 17% 121.33 234 7%
On-road mobile sources 322.4 55% 216.1 164.3 51%
Biogenic sources 26.6 5% 26.6 26.6 8%
TOTALS 581.3 500.5 320.6
1 See Chapter 3, Section 3.10 2 Utility emissions portion of emissions total is based on 7/3/96 episode day 3 Utility emissions portion of emissions total is based on highest 30-day average emissions over 3rd
quarter 1996-98, with growth projection to 2007 and previously adopted 30 TAC §117.105 electricutility RACT controls applied
4 Reductions applied from 30 TAC §117.106 (electric utility) and §117.206(industrial/commercial/institutional) emissions specifications for attainment demonstration
EPA-ISSUED RULES Estimated NOx
Reductions in 2007 (tpd)
Federal on-road measures:• Federal Phase II RFG• Tier 2 vehicle emission standards and federal low-sulfur gasoline• NLEV• Heavy-duty diesel standards
93
Federal off-road measures:• Lawn and garden equipment• Tier 3 heavy-duty diesel equipment• Locomotives• Compression ignition standards for vehicles and equipment• Spark ignition standards for vehicles and equipment• Recreational marine standards
48

6-2DFW Attainment Demonstration
TCEQ-ISSUED RULES Estimated NOx
Reductions in 2007 (tpd)
Major point source NOx reductions in 4 counties* 129
I/M (ASM, OBD, and remote sensing in 9 counties) 54.45
Low-emission diesel in 9 counties 3.48
SB 5 Voluntary Incentive Program** 16.3
Airport GSE electrification in 4 counties 6.12
Heavy equipment fleets–gasoline in 9 counties 1.8
Gas-fired water heaters, small boilers, and process heaters (statewide rule)
0.5
Other State measures:Energy efficiencies
0.7
DFW LOCAL INITIATIVES Estimated NOx
Reductions in 2007 (tpd)
Speed limit reduction in 9 counties 5.42
VMEP in 9 counties 2.40 - 5.40
TCMs in 4 counties 4.73
* Major source NOx reductions from: Title 40 Code of Federal Regulations Part 75 (40 CFR 75)affected utility boilers (126.2 tpd); non- 40 CFR 75 utility boilers (1.3 tpd); andindustrial/commercial/institutional sources (1.6 tpd).
** This credit is equal to the sum of NOx credits previously taken for the Tier 2/Tier 3 equipmentaccelerated purchase rule (13.8 tpd) and the heavy-duty diesel operating restriction rule (2.5 tpd),which are being proposed for repeal. Reductions from the new SB 5 voluntary incentive program inthe 12-county DFW area are projected to surpass 16.3 tpd NOx, based on the size of the equipmentinventory eligible to participate in the program.
6.1 VOC RULE CHANGESThe commission is not proposing any rules at this time that specifically target VOC sources. However,through some of the strategies proposed the DFW area will see reductions in both VOC and NOx.
6.2 NOx RULE CHANGESIn its effort to ensure that the SIP strategies impose no more burden than necessary to protect health andwelfare, the commission has decided not to include the counties of Hunt, Hood, and Henderson asaffected counties due to their limited impact on the air quality within the DFW nonattainment area. Dueto the relatively low population, percentage of commuters, and growth rate of these counties thecommission has reevaluated the need for implementing control strategies in these three counties. The

6-3DFW Attainment Demonstration
reevaluation included new photochemical modeling runs which applied the strategies in the nineremaining counties only. The results of these runs indicated a minor impact of including Hunt, Hood, andHenderson counties but also showed that the area could demonstrate attainment of the NAAQS withoutthose reductions in emissions. However other control measures which were proposed for these countiesdo have measurable benefits for attainment of the NAAQS.
6.2.1 Ground Support Equipment ElectrificationOn April 19, 2000, the commission adopted a rule that required owners or operators of affected GSE toensure that their GSE fleet be electric-powered or else utilize alternative emission reduction measures toreduce NOx emissions by 90% by the end of 2007. The rule had a provision allowing for other means tomeet the reduction requirements. On May 23, 2001, the commission repealed the airport GSE rule for theDFW area because agreed orders were signed with the area’s major airlines, airports, and governmentalentities to achieve the same NOx reductions that would have been achieved by the rule.
6.2.2 Speed Limit Reduction MeasureSubstantial emissions reductions can be achieved by implementing a 5 mph reduction in maximum speedlimits on all roadways in the 9-county area with current posted speeds of 70 and 65 mph. BeginningSeptember 1, 2001, speed limits on roadways with a current maximum speed limit of 70 mph will bereduced to 65 mph, while speed limits on roadways with a current maximum speed limit of 65 mph willbe reduced to 60 mph. This measure will reduce NOx emissions by at least 5.42 tpd and VOC emissionsby at least 0.55 tpd in the 9-county area.
The reduced speed limit measure is based on vehicle emission information from EPA’s MOBILE5 model. The MOBILE5 model calculates emissions in grams per mile and indicates that vehicles produce moreNOx emissions per mile at higher speeds. If the speed is multiplied by the emission rate, emissions ingrams per hour can be calculated, which indicate that vehicles operating at higher speeds emit more NOx
and VOC per hour (see table below). Example MOBILE5a_H 2007 DFW composite emission rates forVOC and NOx at various speeds and the resulting emissions per hour are as follows:
SPEED VOC Emission Rate (g/mile)
VOC (g/hr) NOx Emission Rate(grams per mile)
NOx (g/hr)
30 mph 0.69 20.7 1.17 35.1
35 mph 0.62 21.7 1.18 41.3
40 mph 0.57 22.8 1.19 47.6
45 mph 0.52 23.4 1.22 54.9
50 mph 0.50 25 1.30 65
55 mph 0.49 26.9 1.49 81.9
60 mph 0.52 31.2 1.69 101.4
65 mph 0.56 36.4 1.91 124.1
Composite emission rates are an average rate that accounts for the area’s vehicle fleet composition (cars,gas trucks, heavy duty diesel trucks etc.) and age distribution (% of fleet that is 1 year old, 2 years old

6-4DFW Attainment Demonstration
etc.). The emission rates listed here are for vehicles that participate in the Texas Motorist’s Choiceinspection and maintenance program, so the rates are generally reflective of rates for properly runningcars.
The emissions reductions were calculated using NCTCOG’s travel/air quality models and EPA’sMOBILE5a emissions model. The modeled area encompasses the metropolitan planning area (MPA),which includes Dallas, Tarrant, Collin, Denton, Rockwall counties and part of Parker, Johnson and Elliscounties. Traffic was simulated for an average weekday (which was divided into 5 time periods) and theassociated emissions calculated. The base emissions (before speed limits are reduced) were computed for2007; the resulting emissions were 275.94 tpd NOx and 111.13 tpd VOC. Speeds were then lowered onall applicable roadway segments, the travel model rerun and the emissions recalculated, resulting inemissions of 270.52 tpd NOx and 110.58 tpd VOC. The emissions reductions associated with the speedlimit reduction measure are the difference between the two analysis scenarios, or reductions of 5.42 tpdNOx and 0.55 tpd VOC respectively. Two underlying assumptions support the modeled results. Theseassumptions are: 1) no credit is taken for emissions reductions from vehicles on roadways where themodels indicate traffic is moving slower than the reduced speed limit and 2) the modeling assumes thatvehicles will travel at speeds ten percent higher than the reduced speed limits. Although emissionsreductions were calculated for the MPA, the speed limit reductions will be implemented in the entire 9county area, resulting in additional emissions reductions that have not been quantified for this SIP.
Speed limit signs will have to be changed in order to implement this measure. The Texas Department ofTransportation estimates costs of $300.00 for small sign replacement and $600.00 for large signreplacement. NCTCOG has estimated overall costs for sign replacement to be approximately $2,000,000.
Benefits in addition to emissions reductions will be achieved through implementation of this measure. The severity of traffic accidents will be reduced. Significant fuel savings will also be realized from thespeed limit reductions. NCTCOG modeling of the measure indicates a 1.3% reduction in fuelconsumption. In 2007, this is equivalent to fuel savings of approximately 92,000 gallons per day andassociated cost savings of approximately $110,000 per day.
The Texas Department of Transportation has proposed revisions to the Texas Transportation Code onFebruary 24, 2000 which would establish procedures allowing speed limits to be changed for emissionsreductions purposes. The proposed revisions were filed with the Secretary of State on February 28, 2000and published in the Texas Register on March 10, 2000. The comment period closed on April 10, 2000. The revisions are scheduled to be adopted on either April 27, 2000 or May 25, 2000.
The speed limit reduction measure will be enforced through state and local speed limit enforcementregulations and practices. The commission will work with other state and local agencies to ensureadequate enforcement of this measure.
6.2.3 Heavy Equipment Fleets - GasolineThe strategy for off-road large spark-ignition engines establishes exhaust emission limitations on engines25 horsepower and greater for model year 2004 and subsequent engines.. Excluded from this categoryare engines less than 175 horsepower which are used in construction or farm equipment and vehicles. Also exempt from these standards are: 1) engines operated on or in any device used exclusively uponstationary rails or tracks; 2) engines used to propel marine vessels; 3) internal combustion enginesattached to a foundation at a location for at least 12 months; 4) off-road recreational vehicles andsnowmobiles; and 5) stationary or transportable gas turbines for power generation.

6-5DFW Attainment Demonstration
The exhaust emission standards for off-road large spark-ignition engines set by the State of California areincorporated in the rule. Engines must be certified for use in the State of California prior to being sold oroperated in the 9-county DFW area. Engines must also meet the California warranty requirements andmanufacturers must take corrective action if an engine recall occurs in California.
EPA’s NONROAD model estimates approximately 15,000 off-road large spark-ignition engines in the 9-county in calendar year 2007. The model also estimates approximately 5.9 tpd of NOx emissions fromthese sources. Assuming a 10% fleet turnover per year and applying the implementation schedule in therule, approximately 6,000 of these engines in 2007 would require certification under the new rule. Thenew standards will provide an estimated 1.8 tpd NOx reduction.
Environ reports that the cost of compliance per engine is expected to be $100 to $500 depending upon theengine size and typical engine type. The California Air Resources Board estimates the overall costeffectiveness is less than $500 per ton of HC+NOx.
6.2.4 Accelerated Purchase of Tier 2/Tier 3 Non-road Compression-Ignition EquipmentOn April 19, 2000, the commission adopted a rule implementing an accelerated purchase programrequiring the owners or operators of diesel-powered construction, industrial, commercial, and lawn andgarden equipment rated at 50 hp and greater to replace their affected equipment with newer Tier 2 andTier 3 equipment, with the amount and timing of reductions depending on the hp rating of the enginefleet.
In May 2001 the 77th Legislature of the State of Texas passed SB 5. Section 18 of SB 5 requires thecommission to submit a SIP revision to the EPA, deleting the requirements of the above-referenced rulefrom the SIP no later than October 1, 2001. The diesel emission reduction incentive program contained inSB 5 will replace the above-referenced rules and result in reductions in excess of the reductions expectedfrom the rules that are being repealed. Therefore, the NOx reductions previously claimed in the DFWattainment demonstration SIP will, as a result of this rulemaking, be achieved through an alternate butequivalent federally enforceable mechanism. The rule repeals are being proposed concurrently with thisSIP revision as part of the implementation of SB 5.
In the April 19, 2000 DFW SIP, the state took credit for 13.8 tpd NOx from the Tier 2/Tier 3 equipmentaccelerated purchase rule. This credit, which appeared in the summary table on page 6-2 of the referencedDFW SIP revision, has been deleted. In its place, the table now contains the estimated credit resultingfrom the new SB 5 voluntary incentive program rule.
6.2.5 Expanded RFG Program The state evaluated a NOx control strategy option to implement a state reformulated gasoline (RFG)program requiring gasoline which meets the federal Phase II RFG standards to be implemented in theadditional eight counties making up the DFW Consolidated Metropolitan Statistical Area. The additionalcounties are: Ellis, Henderson, Hood, Hunt, Johnson, Kaufman, Parker, and Rockwall Counties. Thestate has made the decision not to adopt this control strategy.
The state's decision not to adopt this control strategy is due in part to the concerns over water qualityissues associated with the increased use of MTBE anticipated from expanding the RFG program. In itsSeptember 15, 1999 report, “Achieving Clean Air and Clean Water: The Report of the Blue Ribbon Panelon Oxygenates in Gasoline,” EPA’s Blue Ribbon Panel on MTBE recognized the potential threat MTBEposes to water quality and recommended that the oxygenate mandate for RFG be removed and thatclarification be provided on federal and state authority to regulate and/or eliminate the use of gasoline

6-6DFW Attainment Demonstration
additives including MTBE. The state supported the Blue Ribbon Panel’s recommendations andunderstands that these issues are still under discussion. The state will continue to closely monitordevelopments relating to the MTBE/oxygenate issues. Once these issues have been resolved, the statewill reevaluate the necessity for additional gasoline control strategies in the DFW area.
The state's decision not to adopt this control strategy is also based on the EPA's new Federal low sulfurgasoline regulations, which were finalized in December 1999, that require all gasoline, includingreformulated and conventional gasoline, to meet a 30 ppm sulfur content standard beginning in 2004. These new federal gasoline rules will result in a low sulfur conventional gasoline that does not have theoxygenate requirement associated with Federal RFG. In addition, since the DFW ozone nonattainmentarea is required to have three years of emissions monitoring data demonstrating the area's compliance tothe NAAQS to support the 2007 attainment demonstration, the implementation of the Federal low sulfurgasoline in 2004 should provide the area the necessary time to allow the results of this program to berealized through emission monitoring data.
6.2.6 Voluntary Accelerated Vehicle Retirement ProgramThis control strategy is now being included as part of the VMEP Program. Refer to Section 6.2.13 formore information.
6.2.7 Low Emission Diesel (LED) Rules This strategy will implement a state LED fuel program requiring diesel fuel which may ultimately be usedto fuel diesel fueled compression-ignition engines in automobiles, light and heavy duty trucks and buses,and non-road equipment applications in the affected area to meet the LED fuel standards by May 2002.The fuel required by the state LED fuel program will have a lower aromatic hydrocarbon content and ahigher cetane number in each gallon of diesel than required by current federal regulations for on-roaddiesel.
The state LED fuel program will lower NOx emissions from diesel fueled compression-ignition engines inthe affected areas. Because NOx emissions are precursors to ground-level ozone formation, reducedemissions of NOx will result in ground-level ozone reductions. By 2007, the state LED fuel program willreduce NOx emissions in the affected area by 3.48 tpd.
The state LED fuel program will require LED fuel in Collin, Dallas, Denton, Ellis, Johnson, Kaufman,Parker, Rockwall, and Tarrant Counties. The state LED fuel program will require that diesel fuelproduced for delivery and ultimate sale to the consumer in the affected area does not contain more than500 ppm sulfur, have no greater than 10.0% aromatic hydrocarbons by volume, and have a cetane numberof 48 or greater. Alternative diesel fuel formulations that achieve equivalent emission reductions mayalso be used.
The state LED fuel program will require diesel fuel producers and importers that provide fuel to theaffected area to register with the commission. In addition, the state LED fuel program will require dieselfuel producers and importers to test fuel samples for compliance and keep records of the test results. Diesel fuel producers and importers will also be required to submit a report on each blend batch and aquarterly summary report of the results from the fuel testing for compliance to the commission. Allparties in the fuel distribution system (producers, importers, pipelines, rail carriers, terminals, truckers,and retailers) will be required to keep records of product transfer documents for two years. Retail fueldispensing outlets will be exempt from all of the state LED fuel program's testing and record keepingrequirements except for the keeping of product transfer documents.

6-7DFW Attainment Demonstration
SECTION 211(C)(4)(C) WAIVER REQUESTSection 211(c)(4)(A) of the FCAA prohibits states from prescribing or attempting to enforce any “controlor prohibition” of a “characteristic or component of a fuel or fuel additive” if the EPA has promulgated acontrol or prohibition applicable to such characteristic or component under section 211(c)(1). EPAregulates diesel fuel used in on-road applications in Title 40 CFR Section 80.29. Section 211(c)(4)(C)provides an exception to this prohibition for a nonidentical state standard contained in a SIP where thestandard is “necessary to achieve” the primary or secondary NAAQS that the SIP implements. EPA canapprove a SIP provision as necessary if the Administrator finds that “no other measures exist and aretechnically possible to implement, but are unreasonable or impracticable.” Therefore, Texas is submittingthis revision to the SIP as adequate justification and is requesting a waiver from Section 211(c)(4)(A) ofthe FCAA from EPA to implement a state LED fuel program in the areas defined in this SIP revision. Texas is requesting this waiver for the state regulation of on-road diesel fuel only since EPA does notregulate diesel fuel used in non-road applications and as such, no waiver is required.
Waiver Requirements for Alternative Fuel SpecificationsUnder Section 211 (c)(4)(C) of the FCAA, EPA may approve a non-identical state fuel control as a SIPprovision, if the state demonstrates that the measure is necessary to achieve the national primary orsecondary ambient air quality standard that the plan implements. EPA can approve a state fuelrequirement as necessary only if no other measure exists that would bring about timely attainment, or ifother measures exist but are unreasonable or impracticable.
If a state decides to pursue a state fuel requirement, the state must submit a SIP revision adopting the statefuel control and apply for a waiver from federal preemption. The state must include in its petition specificinformation showing the measure is necessary to meet the ozone NAAQS, based on the statutoryrequirements for showing necessity. The waiver request must:• Identify the quantity of reductions needed to reach attainment of the NAAQS;• Identify possible other control measures and the quantity of reductions each would achieve;• Explain in detail, with adequate factual support, which of those identified control measures are
considered unreasonable or impracticable; and• Show that even with the implementation of all reasonable and practicable measures, the state would
need additional emissions reductions for timely attainment, and the state fuel measure would supplysome or all of such additional reductions.
Determining Whether Other Measures are Unreasonable or ImpracticableIn determining whether ozone control measures are unreasonable or impracticable, reasonableness andpracticability are determined in comparison to the state-specific fuel control program.
While the basis for finding unreasonableness or impracticability is in part comparative, the state still mustprovide solid reasons why the other measures are unreasonable or impracticable and must demonstratethese reasons with adequate factual support. Reasons why a measure might be unreasonable orimpracticable for a particular area include, but are not limited to, the following:• Length of time to implement the measure;• Length of time to achieve ozone reduction benefits;• Degree of disruption entailed by implementation;• Other implementation concerns, such as supply issues;• Costs to industry, consumers, or the state;• Cost-effectiveness; and• Reliance on commercially unavailable technology.
6-8DFW Attainment Demonstration
A strong justification for finding a measure unreasonable or impracticable might rely upon thecombination of several of these reasons.
THE NEED FOR THE STATE LOW EMISSION DIESEL PROGRAMThe commission has developed a NOx control strategy consisting of a state LED fuel program that itbelieves is an essential element in the control strategy package needed for the DFW ozone nonattainmentarea to be able to demonstrate attainment of the NAAQS. The fuel that is required by the state LED fuelprogram is a low aromatic hydrocarbon/high cetane diesel fuel which will be required for use by both on-road and non-road diesel fueled compression-ignition engines.
The main attractiveness of the fuel based strategy is that it has a more immediate impact than othercontrols. Once the fuel is in the marketplace, it begins having an immediate air quality impact as both oldand new vehicles and non-road equipment begin using the new fuel.
The fuel required by the state LED fuel program was chosen based upon the following reasons: • Emissions performance;• Effect on advanced technology vehicles and engines;• Impacts on non-road emissions; • Modeling; • Distribution;• Transport; and • Length of time needed to achieve benefits.
Emissions PerformanceState and federal modeling has shown that reductions in NOx continue to contribute to reductions inozone. The use of LED fuel will reduce emissions of NOx from diesel fueled compression-ignitionengines in the four county DFW ozone nonattainment area. The LED fuel will help five surroundingcounties included within the DFW CMSA as well since travel from and to and through these areas occuron a daily basis. The LED fuel is also beneficial in that NOx emission reductions will be seen in all dieselfueled compression-ignition engines - both old and new and from on-road and non-road applications.
Effect on Advanced Technology Vehicles and EnginesThrough the NLEV program and agreements between the heavy-duty engine manufacturers and EPA,vehicle and engine manufacturers have made a commitment to introduce cleaner vehicles and engines tothe nation earlier than what would have been required by the FCAA. The NOx reductions from this actionwill not be enough to get Texas where it needs to be in relation to overall air quality. Improvements indiesel fuel quality alone will not be enough. However, an improvement in diesel fuel quality as the resultof a state LED fuel program, combined with the advanced vehicle and engine technology, will bringTexas closer to achieving its overall air quality goals.
Impacts on Emissions from On-road Vehicles and Non-road EnginesBy 2007, the state LED fuel program will reduce NOx emissions in the affected area by 3.48 tons per day.
ModelingThe modeling performed by Eastern Research Group (ERG) for this SIP revision assumed that state LEDfuel will be similar to California diesel fuel (CA diesel) in terms of the specifications (sulfur content,aromatic content, and cetane). Thus the emission benefits for the state LED fuel (compared to CA diesel)are based upon the switch from current Federal diesel (industry standard) to CA diesel.

6-9DFW Attainment Demonstration
CA diesel fuel benefits were evaluated relative to industry average on-road diesel fuel (as provided inEPA's Heavy-duty Engine Working Group (HDEWG) report).
ERG compared the regression equations generated under the HDEWG study with those from theEuropean Auto Oil study. Given similar inputs these models tend to agree in their NOx predictions, with< 2.0% difference. Selecting the HDEWG model, NOx reductions are predicted to be 5.7% for on-roadengines with electronic controls (i.e., 1990 and later models for the most part). Note that the EuropeanAuto Oil equations estimated a 4.1% NOx reduction for the same engines.
Also note that pre-1990 engine benefits were estimated using CARB test data from 1988. While this dataset is thin, it is the only data available for estimating aromatics effects in pre-electronic control engines(estimated at 7% for NOx). Therefore ERG relied on this estimate for the older portion of the on-roadfleet, as well as the entire off-road diesel fleet. Weighting these reductions by the appropriate model yearand fuel type fractions yields the following overall adjustment factors for the on-road fleet.
• NOx in Collin and Denton Counties – 0.985• NOx in other seven counties – 0.987
As described in Table 6-1, modeling has indicated that by 2007, the state LED fuel program will reduceNOx emissions in the affected area by 3.48 tpd. These reductions are necessary for the area todemonstrate attainment with the NAAQS within the time frame prescribed.
DistributionLED fuel is estimated to cost 4 cents more per gallon than conventional on-road diesel fuel. A singleLED fuel for nine counties in the DFW CMSA facilitates distribution. This will create a large enoughmarket to ease the costs of distribution. Supplies can be co-mingled in the pipeline, trading can takeplace, and tracking compliance will be simplified. The DFW ozone nonattainment area alreadydistributes a federal reformulated gasoline (RFG) and the state LED fuel will require similar distributionprocedures.
TransportAir pollution knows no boundaries. Federal and state studies have shown that pollution from one areacan affect ozone levels in another area. Regional air pollution should be considered when studying airquality in Texas’ ozone nonattainment areas. This work is supported by the findings of the OTAG studywhich is the most comprehensive attempt ever undertaken to understand and quantify the transport ofozone. Both the commission and OTAG study results point to the need to take a regional approach tocontrol air pollutants, such as that described in the state LED fuel program which will affect nine countiesin the DFW CMSA.
Length of Time Needed to Achieve BenefitsThe most important aspect of using the state LED fuel program is that the benefits are seen immediately. Once the state LED fuel program begins, emission reductions begin for both old and new vehicles, as wellas from non-road engines that use the fuel. The larger nine county area that the state LED fuel programcovers ensures NOx emission reductions significant enough to have an immediate impact on the airquality in the DFW ozone nonattainment area.
EMISSION REDUCTIONS NEEDED FOR ATTAINMENT OF THE NAAQSModeling for the DFW ozone nonattainment area has shown that NOx emissions need to be reduced asmuch as 60% in order for the area to achieve attainment with the NAAQS. Modeling has also shown that

6-10DFW Attainment Demonstration
over 50% of the NOx emissions come from mobile sources. As such, the control strategy package for theDFW area needs to include strategies that have an immediate impact on mobile sources. The LED fuelprogram will have an immediate impact. As demonstrated in Table 3.7.1, modeling has indicated thatwithout a state LED fuel program in the proposed nine county area, which by 2007 will reduce NOx
emissions in the affected area by 3.48 tpd, it will not be possible to demonstrate attainment with theNAAQS within the time frame prescribed.
EVALUATION OF OTHER CONTROL MEASURESThe commission has analyzed other control measures for reasonableness and practicability forimplementation to meet the attainment deadline. This included evaluating on-road mobile sources, non-road mobile sources, area, and point sources.
The commission, with the assistance of local stakeholder committees, evaluated approximately 375control measures from 41 separate categories to determine which control strategy packages werereasonable, practicable, and timely to implement. As demonstrated in Table 3.7.1, of the 29 controlstrategy packages modeled only four were able to demonstrate attainment within the time frameprescribed and the addition of a state LED fuel program was essential for attainment in all of thesepackages.
CONCLUSIONSThe state LED fuel program will achieve a 3.48 tpd reduction in NOx emissions and it is a vitalcomponent of the overall NOx emissions reduction strategy for the DFW ozone nonattainment areas. Modeling has shown that without the 3.48 tpd reduction achieved by the state LED fuel program it willnot be possible for the DFW ozone nonattainment area to demonstrate attainment with the NAAQS withinthe time frame prescribed by EPA. Therefore, the commission finds that the state LED fuel program isessential to the timely attainment of the one-hour NAAQS in the DFW ozone nonattainment area. Inaddition, the commission believes the state LED fuel program will lead to emission reductions in thecounties adjacent to the nonattainment area and could facilitate compliance for these counties with the 8-hour NAAQS.
6.2.8 Gas-fired Water Heaters, Small Boilers, And Process HeatersThis statewide rule would reduce NOx emissions from new natural gas-fired water heaters, small boilers,and process heaters sold and installed in Texas beginning in 2002. The rules would apply to each newwater heater, boiler, or process heater with a maximum rated capacity of up to 2.0 MMBtu/hr. The rulesare based upon those of California's Bay Area Management District Regulation 9, Rule 6 and South CoastManagement District Rules 1121 and 1146.1.
6.2.9 (Major Source NOx Rules)On April 19, 2000, the commission adopted new cement kiln rules as part of the ozone SIP controlstrategy for the DFW ozone nonattainment area. The rules required portland cement kilns in Bexar,Comal, Ellis, Hays, and McLennan Counties to meet specific NOx emission limits.
Under these rules, owners or operators of cement kilns were given several options to meet the emissionrequirements in Chapter 117. The commission is adopting rules concurrent with this SIP revision to givethe owners and operators of cement kilns in the affected areas additional flexibility in meeting their NOx
reduction requirements, through either the use of a technology option (for dry-process cement kilns) oremission reduction credits. In addition, owners and operators of wet-process kilns could, in lieu of mid-kiln firing, use some other form of secondary combustion which achieves equivalent levels of NOx
reductions, or could make other additions or changes to the kiln system which achieve at least a 30%

6-11DFW Attainment Demonstration
reduction in NOx emissions. Finally, owners and operators would be able to use a 90-day rolling averagefor determination of compliance with the source cap in lieu of the current 30-day rolling average.
The proposed changes would result in a similar level of emission reductions compared to the SIP rulesoriginally adopted. Therefore, the NOx reductions previously claimed in the DFW attainmentdemonstration SIP will, as a result of this rulemaking, be achieved through alternate, but equivalent,Chapter 117 rules.
6.2.10 Heavy-Duty Diesel Operating RestrictionOn April 19, 2000, the commission adopted a rule to implement an operating-use restriction programrequiring that heavy-duty diesel construction equipment rated at 50 horsepower and greater be restrictedfrom use between the hours of 6:00 a.m. through 10:00 a.m., June 1 through October 31, beginning June1, 2005. The basis for the rule is that emissions of NOx, a key ozone precursor, are delayed until later inthe day, thus limiting ozone formation.
In May 2001 the 77th Legislature of the State of Texas passed SB 5. Section 18 of SB 5 requires thecommission to submit a SIP revision to the EPA, deleting the requirements of the above-referenced rulefrom the SIP no later than October 1, 2001. The diesel emission reduction incentive program contained inSB 5 will replace the above-referenced rules and result in reductions in excess of the reductions expectedfrom the rules that are being repealed. Therefore, the NOx reductions previously claimed in the DFWattainment demonstration SIP will, as a result of this rulemaking, be achieved through an alternate butequivalent federally enforceable mechanism. The rule repeals are being proposed concurrently with thisSIP revision as part of the implementation of SB 5.
In the April 19, 2000 DFW SIP, the state took credit for 2.5 tpd NOx from the heavy-duty diesel operatingrestriction rule. This credit, which appeared in the summary table on page 6-2 of the referenced DFW SIPrevision, has been deleted. In its place, the table now contains the estimated credit resulting from the newSB 5 voluntary incentive program rule.
6.2.11 Transportation Control MeasuresTCMs are transportation projects and related activities that are designed to achieve on-road mobile sourceemissions reductions and are included as control measures in the SIP. Allowable types of TCMs arelisted in §7408 (Air Quality Criteria and Control Techniques) of the FCAA, 42 United States Code, 1970,as amended (FCAA), and defined in the federal transportation conformity rule found in Title 40 CFR (40CFR), Part 93 (Determining Conformity of Federal Actions to State or Federal Implementation Plans). Ingeneral, a TCM is a transportation related project that attempts to reduce vehicle use, change traffic flow,or reduce congestion conditions. A project that adds single-occupancy-vehicle roadway capacity or isbased on improvements in vehicle technology or fuels is not eligible as a TCM.
The NCTCOG has identified numerous TCMs that have been, or will be, implemented in the 4 countynonattainment area. By July 2007, these TCMs will reduce NOx emissions in the nonattainment area byat least 4.73 tpd and VOC emissions by at least 2.95 tpd. The table below summarizes total 2007emissions reductions by type of TCM. Appendix G contains a project specific list of the TCMs, includingTCM location, project limits, emissions reductions and implementation date.
Table 6.2-1 Total 2007 Emission Reductions by Type of TCM
TCM Type July 2007 NOx Benefits(lbs/day) July 2007 VOC Benefits (lbs/day)
HOV Lanes 349 115

6-12DFW Attainment Demonstration
Rail Projects 865 532
Bicycle/Pedestrian Projects 2,272 1,132
Intersection Improvements 4,634 2,305
Vanpools 685 341
Park and Ride Lots 437 218
Grade Separations 224 1,259
Total Pounds Per Day 9,466 5,902
Total Tons Per Day 4.73 2.95
All TCM emissions reductions were calculated using EPA’s MOBILE5a model 2007 emission factors.Specific calculation methodologies for the different types of TCMs are documented in NCTCOG’sTransportation Control Measure Effectiveness Study, Technical Report, August 1996 and part of Chapter7 of the Transportation Conformity Determination for the Mobility 2025 Metropolitan TransportationPlan . Appendix G contains these documents.
A TCM life span is defined as the time period during which the TCM continues to reduce emissions. Different types of TCMs have different life spans; for example, an HOV lane will reduce emissions for alonger time period than a traffic signal synchronization project. Many TCMs that have already beenimplemented will still reduce emissions in July 2007. Examples of these TCMs include HOV lanes, parkand ride lots, bicycle/pedestrian facilities, rail projects and intersection improvements.
Other TCMs will be implemented between November 1999 and July 2007 and those TCMs will alsoreduce emissions in July 2007. NCTCOG’s 1999 call for projects identifies many TCMs that will befunded in the 2000 to 2002 timeframe and implemented before July 2007.
The NCTCOG’s call for projects estimates the cost of TCMs implemented between 1999 and 2007 to beapproximately $361,600,000. In addition to emissions reductions benefits, the TCMs will also reducecongestion, which will produce time savings for drivers in the nonattainment area. Many TCMs, such asrail projects and bicycle/pedestrian facilities, will also encourage mixed use and sustainable development,which may reduce urban sprawl in the area.
The TCMs have been included in the DFW area long range transportation plan and/or transportationimprovement program (TIP), which constitutes evidence that the TCMs were properly adopted and havefunding and appropriate approval. Inclusion of the TCMs in the DFW area long range transportation planand TIP also constitutes evidence of a specific schedule to plan, implement and enforce the measures. Additional evidence of the TCMs’ specific implementation schedule is found in Appendix G. TheNCTCOG is required by 30 TAC §114.260 to submit an annual TCM status report to the commission. The report must include the TCMs’ implementation and emissions reductions status. The status report andsupporting activities serve as the TCM monitoring program.
Enforcement and implementation of TCMs is also addressed in the Texas transportation conformity rule(30 TAC §114.260) and the federal transportation conformity rule (40 CFR §93.113), which indicate thatthe NCTCOG is responsible for ensuring that TCMs are implemented on schedule. According to 30 TAC

6-13DFW Attainment Demonstration
§114.260 and 40 CFR §93.113, failure to implement TCMs according to schedule can be grounds for thedenial of an area’s transportation conformity determination.
6.2.12 Voluntary Mobile Source Emission Reduction ProgramThe Clean Air Act Amendments of 1990 increased the responsibility of states to demonstrate progresstoward attainment of the NAAQS. Voluntary mobile source measures have the potential to contribute, ina cost-effective manner, emission reductions needed for progress toward attainment and maintenance ofthe NAAQS.
Historically, mobile source control strategies have focused primarily on reducing emissions per milethrough vehicle and fuel technology improvements. Tremendous strides have been made resulting in newlight-duty vehicle emission rates that are 70-90% less than for the 1970 model year. However,transportation emissions continue to be a significant cause of air pollution due to a doubling of VMT from1970 to 1990, and tripling since 1960.
With the increasing cost of technological improvements to produce incrementally smaller reductions ingrams per mile emissions in the entire fleet of vehicles, and the time it takes for technologicalimprovements to penetrate the existing fleets, it becomes clear that supplemental or alternativeapproaches for reducing mobile source air pollution is necessary. Mobile source strategies that attempt tocomplement existing regulatory programs through voluntary, non-regulatory changes in localtransportation sector activity levels or changes in in-use vehicle and engine fleet composition are beingexplored and developed.
A number of such voluntary mobile source and transportation programs have already been initiated at theState and local level in response to increasing interest by the public and business sectors in creatingalternatives to traditional emission reduction strategies. Some examples include economic and market-based incentive programs, TCMs, trip reduction programs, growth management strategies, ozone actionprograms, and targeted public outreach. These programs attempt to gain additional emissions reductionsbeyond mandatory Clean Air Act programs by engaging the public to make changes in activities that willresult in reducing mobile source emissions.
Current EPA regulations have set a limit on the amount of emission reductions allowed for VMEPs in aSIP. The limit is set at 3% of the total projected future year emissions reductions required to attain theappropriate NAAQS. Specifically in the DFW nonattainment area, the commission estimates that 3% ofthe regions projected emissions are to be 5 tons per day. Table I summarizes the DFW voluntarycommitments under VMEP.
TABLE I
VOLUNTARY MOBILE EMISSIONS REDUCTION PROGRAM (VMEP)EMISSION BENEFITS BY PROGRAM TYPE
PROGRAM TYPE VOC BENEFITS(tons per day)
NOx BENEFITS(tons per day)
Alternative Fuel Program 0.18 0.18
Employee Trip Reduction 0.29 0.53
Public Education Campaign/Ozone Season Fare Reduction 0.08 0.15

VOLUNTARY MOBILE EMISSIONS REDUCTION PROGRAM (VMEP)EMISSION BENEFITS BY PROGRAM TYPE
6-14DFW Attainment Demonstration
Sustainable Development N/A* N/A*
Non-Road Ozone Season Reductions N/A* N/A*
Tier II Locomotive Engines 0 to 0.6 0 to 3.0
Off-Road Heavy Duty Diesel Engine Retrofits N/A* N/A*
Vehicle Retirement Program/Vehicle Maintenance1 0.56** 0.77**
TOTAL BENEFITS (tpd) 1.11 to 1.71 1.63 to 4.63**1Emission benefits quantified for the Vehicle Retirement Program only. Emission benefits for Vehicle Maintenance have beencredited in the I/M Program.*No benefits quantified or claimed at this time**Varying emission reduction benefits based on different methodologies. Currently under EPA review.***Goal is 5 tpd NOx. Shortfall will be substituted with additional TCMsSource: NCTCOG 3/24/00
The North Central Texas area is identifying eight programs that will aid in the improvement of theregions air quality. Currently three of the eight programs, Sustainable Development, Non-Road OzoneSeason Reductions and Off-Road Heavy Duty Diesel Engine Retrofits, do not have emission benefitsassociated with them. The remaining five programs result in a VOC benefit between 1.25 to 1.85 tpd andNOx benefits of 1.83 to 4.83 tpd.
Any shortfall (of the total 5tpd) will be covered by supplementing additional TCMs. The TCMs to beused to supplement the VMEP program are signal improvements and freeway corridor management. These TCMs are in addition to those already credited in the SIP. Table II summarizes TCM commitmentsinventoried for the DFW nonattainment area, including those credited in the SIP and those to be used ascontingency for VMEP.
TABLE II
ATTAINMENT DEMONSTRATION SIP COMMITMENTSTCMs OPERATIONAL BY 2007
TCM COMMITMENTS
Category 1990-1996(1)
1997-1999(2)
2000-2007(3)
TOTAL
Intersection Improvements 393 Locations 96 Locations 286 Locations 775 Locations
Grade Separations 16 Locations 16 Locations
Signal Improvements (4)(5) 3,573 Locations 3,573 Locations
HOV Lanes (6) 33 Lane Miles 27.9 Miles 60.9 Miles
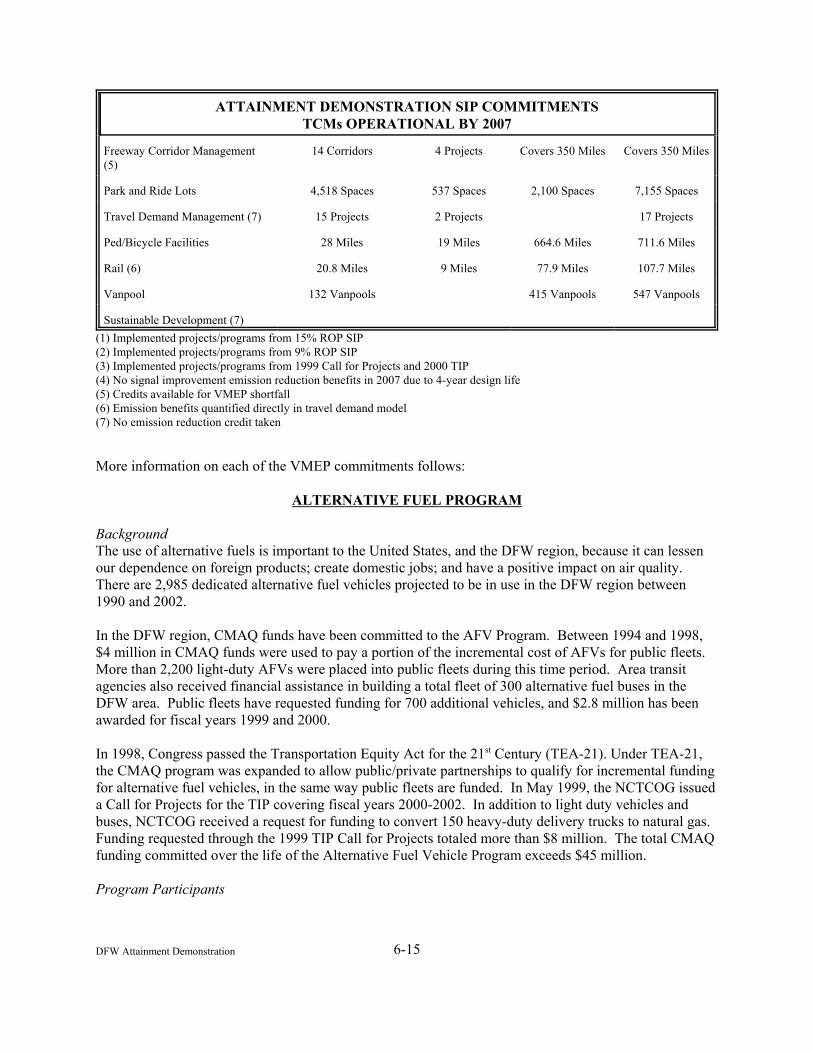
ATTAINMENT DEMONSTRATION SIP COMMITMENTSTCMs OPERATIONAL BY 2007
6-15DFW Attainment Demonstration
Freeway Corridor Management(5)
14 Corridors 4 Projects Covers 350 Miles Covers 350 Miles
Park and Ride Lots 4,518 Spaces 537 Spaces 2,100 Spaces 7,155 Spaces
Travel Demand Management (7) 15 Projects 2 Projects 17 Projects
Ped/Bicycle Facilities 28 Miles 19 Miles 664.6 Miles 711.6 Miles
Rail (6) 20.8 Miles 9 Miles 77.9 Miles 107.7 Miles
Vanpool 132 Vanpools 415 Vanpools 547 Vanpools
Sustainable Development (7)
(1) Implemented projects/programs from 15% ROP SIP(2) Implemented projects/programs from 9% ROP SIP(3) Implemented projects/programs from 1999 Call for Projects and 2000 TIP(4) No signal improvement emission reduction benefits in 2007 due to 4-year design life(5) Credits available for VMEP shortfall(6) Emission benefits quantified directly in travel demand model(7) No emission reduction credit taken
More information on each of the VMEP commitments follows:
ALTERNATIVE FUEL PROGRAM
BackgroundThe use of alternative fuels is important to the United States, and the DFW region, because it can lessenour dependence on foreign products; create domestic jobs; and have a positive impact on air quality. There are 2,985 dedicated alternative fuel vehicles projected to be in use in the DFW region between1990 and 2002.
In the DFW region, CMAQ funds have been committed to the AFV Program. Between 1994 and 1998,$4 million in CMAQ funds were used to pay a portion of the incremental cost of AFVs for public fleets. More than 2,200 light-duty AFVs were placed into public fleets during this time period. Area transitagencies also received financial assistance in building a total fleet of 300 alternative fuel buses in theDFW area. Public fleets have requested funding for 700 additional vehicles, and $2.8 million has beenawarded for fiscal years 1999 and 2000.
In 1998, Congress passed the Transportation Equity Act for the 21st Century (TEA-21). Under TEA-21,the CMAQ program was expanded to allow public/private partnerships to qualify for incremental fundingfor alternative fuel vehicles, in the same way public fleets are funded. In May 1999, the NCTCOG issueda Call for Projects for the TIP covering fiscal years 2000-2002. In addition to light duty vehicles andbuses, NCTCOG received a request for funding to convert 150 heavy-duty delivery trucks to natural gas. Funding requested through the 1999 TIP Call for Projects totaled more than $8 million. The total CMAQfunding committed over the life of the Alternative Fuel Vehicle Program exceeds $45 million.
Program Participants

6-16DFW Attainment Demonstration
The NCTCOG AFV Programs are now open to all public fleets, transit agencies, and private companies. The Regional Transportation Council approves the funding of the programs, and staff members ofNCTCOG administer them.
How the Program WorksThere are three aspects of the overall program and each is accessed in different ways. For light- andmedium-duty alternative fuel vehicles, fleets submit a proposal during the time when NCTCOG has a“Call for Projects” open. If requests exceed available funds, the proposals are scored and ranked. Currently, recipients are eligible to receive 80% of the incremental cost of an AFV compared to its dieselor gasoline equivalent.
Transit agencies are also able to apply for funds that have been dedicated to the AFV Program. Likewise,these funds are used to cover a portion of the incremental costs of transit buses, which can total $50,000each.
Through the TIP, alternative fuel projects are submitted and compete with projects from other categoriesthat are eligible for the funding program. The amounts requested, awarded, and the required cost-sharemay vary from project to project.
Activity EffectsThe AFV Programs have been successful in putting alternative fuel vehicles on the roadways of the DFWarea. In addition to the dedicated AFVs previously mentioned, funding has been requested for 288dedicated vehicles in fiscal years 1999-2000. The City of Dallas also is interested in 300 additionalvehicles in 2000-2001.
Emission EffectsThe region is requesting credit for the emission reductions of 2,985 dedicated alternative fuel vehiclesthat are in operation in the DFW area. These vehicles represent emissions reductions of 47 tons of NOx
per year.
State Commitment for Evaluation, Reporting, Remedying Emission Credit ShortfallNCTCOG as the regional metropolitan transportation planning agency for the DFW area commits tomake a best faith effort to implement this project. NCTCOG will be responsible for monitoring andreporting the emission reductions to the commission. There is not expected to be a shortfall from thisprogram since the credits are based on actual vehicles as opposed to projections. Any VMEP shortfall (ofthe total 5 tpd) will be covered by supplementing additional TCMs. These TCMs are in addition to thosealready credited in the SIP.
Technical Support DocumentationIncluded in the attached Excel file, “Alternative Fuels”, are the AFVs In Public Fleets (Funded ThroughFiscal Year 2000), AFVs in Private Fleets, AFVs Requested Under 1999 TIP Call for Projects andMethods and Assumptions. These charts detail the fleets in the DFW area who currently own andoperate dedicated alternative fuel vehicles, the emissions benefits of each fleet and the costs associatedwith the emission reductions. The assumptions and methodology for the calculations are also included.

6-17DFW Attainment Demonstration
AFVs in Public Fleets (Funded Through Fiscal Year 2000)Agency Vehicle Size Fuel Quantity Incremental
CostNOx lbs/yr NOx tons/day NOx
cost/lbs/YrVOCslbs/yr
VOCs tons/day VOCscost/lbs./Yr
City of Dallas Light Duty CNG 235 $822,500.00 1548.72 0.002978308 $23.53 2049.78 0.003941885 $17.78City of Denton Light Duty Electric 1 $3,500.00 19.38 0.000037269 $8.00 19.38 0.000037269 $8.00City of Plano Light Duty Propane 62 $217,000.00 709.04 0.001363538 $13.56 516.76 0.000993769 $18.60City of Plano Mid Duty Propane 4 $14,000.00 75.37 0.000144942 $8.23 54.93 0.000105635 $11.29City of Plano Heavy Duty Propane 6 $240,000.00 169.20 0.000325385 $17.06 123.32 0.000237154 $23.40U.S. Postal Service Light Duty CNG 143 $500,500.00 942.41 0.001812327 $23.53 1247.31 0.002398673 $17.78U.S. Postal Service Light Duty Propane 7 $24,500.00 80.05 0.000153942 $13.56 58.34 0.000112192 $18.60City of Fort Worth Light Duty Propane 136 $476,000.00 1555.31 0.002990981 $13.56 1133.53 0.002179865 $18.60City of FarmersBranch
Light Duty Electric 1 $3,500.00 19.38 0.000037269 $8.00 19.38 0.000037269 $8.00
City of FarmersBranch
Light Duty CNG 1 $3,500.00 6.59 0.000012673 $23.53 8.72 0.000016769 $17.78
Denton ISD Heavy Duty* Propane 92 $3,680,000.00 9339.99 0.017961519 $4.74 5382.36 0.010350692 $8.22Dallas County Schools Heavy Duty* Propane 236 $9,440,000.00 23959.09 0.046075173 $4.74 17461.71 0.033580212 $6.50Carrollton-FarmersBranch ISD
Heavy Duty* Propane 13 $520,000.00 1319.78 0.002538038 $4.74 760.55 0.001462596 $8.22
TxDOT-Ft. Worth Light Duty Propane 220 $770,000.00 2515.95 0.004838365 $13.56 1833.66 0.003526269 $18.60TxDOT-Ft. Worth Light Duty CNG 76 $266,000.00 500.86 0.000963192 $23.53 662.91 0.001274827 $17.78City of Mesquite Light Duty Propane 54 $189,000.00 617.55 0.001187596 $13.56 450.08 0.000865538 $18.60City of Mesquite Mid Duty Propane 100 $350,000.00 1884.36 0.003623769 $8.23 1373.35 0.002641058 $11.29City of Glenn Heights Light Duty Propane 1 $3,500.00 11.44 0.000022000 $13.55 8.33 0.000016019 $18.61U.S. General ServicesAdministration
Mid-Duty CNG 33 $115,500.00 358.35 0.000689135 $14.28 474.28 0.000912077 $10.79
DART Light Duty LNG 355 $1,242,500.00 2339.56 0.004499154 $23.53 3096.48 0.005954769 $17.78DART Heavy Duty* LNG 139 $5,560,000.00 8132.05 0.015638558 $8.22 10763.01 0.020698096 $6.21FWTA - The "T" Light Duty CNG 39 $136,500.00 257.02 0.000494269 $23.53 340.18 0.000654192 $17.77FWTA - The "T" Heavy Duty* CNG 113 $4,520,000.00 6610.95 0.012713365 $8.22 8749.78 0.016826500 $6.21DFW InternationalAirport
Light Duty CNG 35 $122,500.00 230.66 0.000443577 $23.53 305.29 0.000587096 $17.77
DFW InternationalAirport
Heavy Duty* CNG 18 $720,000.00 1053.07 0.002025135 $8.22 1393.77 0.002680327 $6.21
TOTAL 2120 $29,118,000.00 64256.13 0.123569481 $348.74 58287.19 0.112090750 $350.39
Cost Per Ton Per DayNOx: $0.00067VOCs: $0.00067

6-18DFW Attainment Demonstration
AFVs in Private Fleets
Owner VehicleSize
Fuel Quantity IncrementalCost
NOx lbs/yr NOx tons/day NOx
Cost/lb./YrVOCslbs/yr
VOCs lbs/day VOCsCost/lb./Yr
Super Shuttle Light Duty Propane 60 $210,000.00 6861.67 0.013195519 $1.36 5000.88 0.009617077 $1.86McShan Florist Light Duty CNG 8 $28,000.00 105.44 0.000202769 $11.76 139.56 0.000268385 $8.89TXU Gas & Electric Light Duty CNG 29 $101,500.00 172.01 0.000330788 $26.14 227.66 0.000437808 $19.75TXU Gas & Electric Light Duty Electric 2 $7,000.00 34.89 0.000067096 $8.89 34.89 0.000067096 $8.89Northwest Propane Light Duty Propane 38 $133,000.00 434.57 0.000835712 $13.56 316.72 0.000609077 $18.60TX New Mexico Power Light Duty Electric 3 $10,500.00 52.33 0.000100635 $8.89 52.33 0.000100635 $8.89TX New Mexico Power Light Duty CNG 1 $3,500.00 5.93 0.000011404 $26.15 7.85 0.000015096 $19.75TX New Mexico Power Light Duty LPG 2 $7,000.00 20.59 0.000039596 $15.06 15.00 0.000028846 $20.67Central & SouthwestInc.
Light Duty Electric 3 $10,500.00 52.33 0.000100635 $8.89 52.33 0.000100635 $8.89
Marquis Messengers Light Duty Propane 30 $105,000.00 686.17 0.001319558 $6.78 500.09 0.000961712 $9.30Alcon Laboratories Light Duty Natural Gas 6 $21,000.00 35.59 0.000068442 $26.14 47.10 0.000090577 $19.75Texas Instruments Light Duty Electric 5 $17,500.00 87.22 0.000167731 $8.89 87.22 0.000167731 $8.89Ford Motor Company Light Duty CNG 1 $3,500.00 5.93 0.000011404 $26.15 7.85 0.000015096 $19.75DaimlerChrysler Light Duty CNG 1 $3,500.00 5.93 0.000011404 $26.15 7.85 0.000015096 $19.75Huffhines Gas Light Duty Propane 18 $63,000.00 507.61 0.000976173 $5.50 369.95 0.000711442 $7.54Propane Systems of TX Heavy Duty Propane 1 $40,000.00 28.20 0.000054231 $17.06 20.55 0.000039519 $23.41
TOTAL 208 $764,500.00 9096.41 0.017493096 $237.37 6887.83 0.013245827 $224.58
Cost Per Ton Per DayNOx: $0.00046VOC: $0.00043

6-19DFW Attainment Demonstration
AFVs Requested Under 1999 TIP Call for Projects
Project Name Numberof
Vehicles
Incremental Cost NOx lbs./yr NOx tons/day NOx
cost/lb./YrVOCslbs./yr
VOCstons/day
VOCscost/lb./Yr
DFW Airport - Light Duty CNG 162 $640,000.00 3061.20 0.00589 $9.26 4051.59 0.007791519 $7.00DFW Airport - Mid-Duty (Vans) 10 $40,000.00 108.59 0.00021 $16.32 143.72 0.000276385 $12.33DFW Airport - Heavy Equipment 19 $684,000.00 308.77 0.000593788 $26.64 408.67 0.000785904 $20.13DFW Airport Private Sector Sponsorship -Buses
13 $520,000.00 760.55 0.001462596 $8.22 1006.61 0.001935788 $6.21
FWTA - CNG Fueled Buses 68 $9,350,000.00 3978.27 0.007650519 $28.26 5265.36 0.010125692 $21.36FWTA - CNG Fuel Systems - Light DutyTruck
75 $206,250.00 2355.07 0.004528981 $5.13 2355.07 0.004528981 $3.88
Plano - Alternative Fuel - Light Duty Truck 2 $10,000.00 100.79 0.000193827 $4.39 100.79 0.000193827 $4.39TXU - Coca Cola LNG Conversion - HeavyDuty Truck
175 $3,500,000.00 11091.38 0.021329577 $3.79 14679.76 0.028230308 $2.87
Grand Total 524 $14,950,250.00 21764.62 0.04 $102.01 ###### 0.05 $78.17
COST Per Ton Per Day NOx: $0.00020VOCS: $0.00015

6-20DFW Attainment Demonstration
ASSUMPTIONS
These emission reduction calculations are based on an assumed mileage of 36,000 miles per year forbuses and 10,000 miles annually for other vehicles unless the city or company noted otherwise. Theemission factors, from Transportation Control Measure Effectiveness Study by the NCTCOG, are .88 forlight duty vehicles, 1.45 for mid-duty vehicles (vans), and 2.17 for buses and heavy-duty vehicles. Thefuel factors (how much an alternative fuel reduces NOx or VOCs emissions from gasoline) were takenfrom the Chesapeake Bay Alternative Fuel Vehicle Source Book. Propane reduces NOx by 59% andVOCs by 43%; CNG reduces NOx by 34% and VOCs by 45%; and electricity is a 100% reduction ofemissions from the vehicle tailpipe. Since these vehicles are dedicated, they have a 100% usage rate.
METHODOLOGY
To Calculate the Tons Per Year:1. Multiple the number of vehicles by the emission factor.2. Multiple that rate by the emission factor appropriate for the vehicle type.3. Take that number and multiple by the total reduction factor (this is the fuel factor multiplied by the
usage rate and divided by 454 for the grams conversion) and you will get the pounds per year.4. The pounds per year can be converted to tons per day by dividing it first by 260 and then by 2000.
To Calculate the Cost Per Pound Per Year :1. Determine whether the project length is 5 years or 10 years.2. Divide the project length into the incremental cost. For projects with an unspecified incremental cost,
$3,500 was used for light duty vehicles and $40,000 for heavy-duty.3. Multiply the result by a capital recovery factor of 0.12026 for 10 years and .22149 for 5 years as
taken from the TIP "Factsheet".4. The result is the annualized project cost which then can be divided by the pounds of NOx and VOCs
per year to get the cost. 5. Once you have the cost per pound per year you can convert it to the cost per ton per day by dividing it
first by 260 and then by 2000.
EMPLOYEE TRIP REDUCTION PROGRAM
Program SummaryThe ETR program is a cooperative effort between the NCTCOG, Dallas Area Rapid Transit, the FortWorth Transportation Authority, and other public and private sector organizations (in the form ofTransportation Management Associations). The voluntary program, aimed at all public and privateemployers in the region with 100 or more employees (of which there are over 3,200 large employers inthis region), is designed to reduce employee commute vehicle trips through implementation of rideshareprograms (such as vanpools), telecommuting, flexible work hour programs, transit pass subsidies,bicycling, and similar strategies.
The role of the transportation/transit authorities involved in the program has been to market voluntaryTDM programs to the large employers, both in and outside of the transit service areas. One of the maintasks is assisting large employers with setting up their program. Employers are encouraged to designateor hire an employee transportation coordinator (ETC) for the company. The ETC acts as a liaisonbetween the company and the transportation authority in the administration of the program. Moreimportantly, the ETC markets alternative commute options to fellow coworkers. The transportationauthority also provides support to the ETC and employer by offering marketing materials, ETC training

6-21DFW Attainment Demonstration
and education, administering employee surveys to better determine what programs will work best at thatwork site, and providing information on tax credits and other incentives from which the employer maybenefit.
Transportation Management Associations (TMAs) are private and public/private organizations thatimplement congestion mitigation strategies and work together on local transportation issues. Many areincorporated, non-profit organizations; they tend to be membership organizations, made up of employers,developers, building owners, and local government representatives. Most TMAs are located in areas ofdense employment and focus on the travel demand management programs of public and privateemployers. In recent years, this region has seen TMAs play increased roles in new areas, includingCongestion Management System development, Intelligent Transportation Systems initiatives, and indevelopment of residential and tourism travel markets. Usually, the principle role of a TMA is to involvethe business community in transportation planning and to provide a forum for the private sector to impactstrategy development and implementation. TMAs can be involved in a variety of transportation activities,as this non-inclusive list indicates:C Advocacy on transit, roadway, bicycle, pedestrian, land use, and air quality issuesC Transit pass subsidy or voucher programsC Shuttles or vanpools for employees, customers, or bothC Ridematching services and support for carpools and vanpoolsC Parking management programsC Guaranteed or emergency ride home programsC Telecommuting/teleconferencing center(s) operation C Employer transportation coordinator (ETC) trainingC Educational, promotional, and incentives programs for alternative travel modes
Taking advantage of future rail transit and HOV system options, while partnering with transit authoritiesand other transportation agencies, will strengthen the influence of TMAs in positively improving mobilityand accessibility around employment and activity areas.
Program Implementation Currently, at least 394 large employers in the DFW region are active in ETR programs, and 346 smalleremployers are participating as well; over 80,000 employees at these companies are reducing vehiclecommute trips through various means. Active ETR programs include employer-subsidized vanpools andtransit passes, as well as flexible work weeks and telecommuting, among others. Through thecontinuation of marketing efforts, combined with robust employment growth and construction ofalternative transportation infrastructure, a steady growth in employee participation in various tripreduction programs is expected.
Activity EffectsClose to 400 large employers in the region offer some sort of employee commute trip reduction programor incentive. The degree of implementation within a company or organization varies greatly: mostcompanies offer three or less types of programs (about 95%), for instance. These figures are based on theinformation provided by ETCs on their company’s ETR participation and activities to the transportationauthority contact. (The Fort Worth Transportation Authority, for example, surveys the ETCs on aquarterly basis.)
Currently, approximately 200 vanpools are operating in this region. The transportation authorities expectthe number of vanpools to double by 2003, based on current trends and recent Call for Projects funding.

6-22DFW Attainment Demonstration
Two Transportation Management Associations currently operate in the area. The Central DallasAssociation operates a TMA in the Dallas Central Business District (CBD). Downtown Fort Worth, Inc.,operates as the TMA for the Fort Worth CBD. Studies are currently underway to assess the feasibility ofTMAs in Major Investment Study corridors. Emerging TMAs in the DFW Airport, East Side of FarmersBranch, and Richardson-North Central Expressway areas, will soon begin to impact the transportationstrategy implementation in their respective areas.
Additional marketing of TDM programs will continue, especially as the transportation system expands. As transit services and systems are expanded and added, including the construction of rail lines and HOVlanes, more transportation options will be available to employees at other employers.
Emission EffectsThe ETR program is expected to produce a VMT reduction of 414,334 during the a.m. commute period in2007. The corresponding air quality benefits are the following:
Emission reductions NOx
At 34 mph, the EF for NOx in 2007 is 1.16 g/mile414,334 daily VMT x 1.16 g/mile = 480,627 g/day or 1058.6 pounds/day
Emission reductions VOCAt 34 mph, the EF for VOC in 2007 is 0.64 g/mile414,334 daily VMT x 0.64 g/mile = 265,173 g/day or 584.1 pounds/day
Program CommitmentThe ETR Program has been funded by NCTCOG in the TIP for the past six years. In addition, the 1999Call for Projects funded three ETR programs, four vanpool subsidy programs, and the start-up funds forthree new TMAs. Funds for the programs are anticipated to be let during the next three years.
NCTCOG imposed a set of requirements to which the program implementers must comply. An elementof the implementation criteria is performance reporting, so that the implementation and expected benefitscan be more closely monitored. The Travel Demand Management Committee and the RegionalTransportation Council (RTC) have been briefed in the past on the progress of these programs. With thestronger requirements, a regular reporting of performance figures will be seen; comments on the directionon how to proceed with the ETR program can then be provided.
Furthermore, analyses conducted in Major Investment Studies (MIS) will help in defining areas in ourregion that should be targeted by this program, so that the appropriate strategies can be defined. The RTCapproved a resolution requesting MISs to study and seek TDM program commitments from largeemployers in their respective study corridors. In fact, efforts are being undertaken in MIS studies toidentify large employers with strong potential to become active in ETR programs. Several MISs arecurrently underway that will target additional large employers to further increase employee participationin various trip reduction programs. In addition, future vanpool markets are also being identified in theMIS process. This will provide opportunities to increase vanpool participation in these strategic markets. Results from MIS analyses are transmitted to the transportation authorities in order to help them guidetheir ETR program efforts.
State Commitment for Evaluation, Reporting, Remedying Emission Credit ShortfallNCTCOG as the regional metropolitan transportation planning agency for the DFW area commits tomake the best faith effort to implement this project. NCTCOG will be responsible for monitoring and

6-23DFW Attainment Demonstration
reporting the emission reductions to the commission. Any VMEP shortfall (of the total 5 tpd) will becovered by supplementing additional TCM. These TCMs are in addition to those already credited in theSIP.
Technical Support DocumentationCurrently (March 2000), an estimated 77,456 employees are active in ETR programs, based on figuresfrom DART and FWTA. This number is included within the estimated 1,242,976 total employeesworking at large employers. Assuming an annual increase of 2% for employment at large employers(based on employment growth forecasts), the total workforce grows by 14.8% to 1,427,788 in 2007. Assuming the proportion remains constant, 88,919 employees would be active in some ETR program.
Based on an average vehicle occupancy of 1.14 (a recent region-wide estimate for AVO during the peakcommute period) this translates into 78,000 vehicles. The average HBW trip distance in this region,based on the NCTCOG travel demand model, is 13.28 miles. Hence, the daily VMT reduced in 2007would be 1,035,834.
With 40% of these HBW trips being taken in the a.m. commute period, the adjusted VMT reduced due tothe ETR program is 414,334.
PUBLIC EDUCATION CAMPAIGN/OZONE SEASON FARE REDUCTION
BackgroundIn response to DFW’s air quality problems, the North Texas Clean Air Coalition (NTCAC) was formed in1993 to educate North Texas about the region’s air quality and encourage individuals to “do their sharefor cleaner air.” Founding members include the North Central Texas Council of Governments, the NorthTexas Commission, the Fort Worth Chamber of Commerce and the Greater Dallas Chamber. The DFWregion’s transportation authorities: DART, SPAN, and The T are also active members.
Since its inception, the NTCAC has focused on promoting voluntary measures that businesses andindividuals can take to help improve the region’s air quality. NTCAC has developed and distributedprinted materials, and television and radio public service announcements to help increase publicawareness of this issue. NTCAC has also succeeded in attracting corporate sponsors for many of theirprograms.
Program ParticipantsProgram participants are the Dallas Area Rapid Transit (DART), Fort Worth Transportation Authority(The T), and Denton’s Program for Aging Needs, Inc. (SPAN), which are the regional transit providers inthe DFW region. As described previously, NTCAC will also participate by promoting this programthrough the Ozone Action Day Program.
How the Program WorksThe Ozone Action Day program runs May 1 through October 31. The day before a possible ozone eventcould occur in the region, the Texas Commission on Environmental Quality announces the potential foran Ozone Action Day. A warning for the following day is announced by the NCTCOG by sending out1500 faxes to Ozone Action Day participants to remind them that the next day will be an Ozone ActionDay. The information is also received and announced on all the major television and radio weatherprograms. This allows DFW residents to know to take action and participate in programs such as theOzone Action Day Discounted Transit Fare Program. The DART, The T, and SPAN will be offeringreduced fares to transit riders during all Ozone Action days throughout the ozone season. In addition,

6-24DFW Attainment Demonstration
NCTCOG is working to expand this program to each day in the ozone season, regardless if an ozone alerthas been announced. Activity EffectsThe assumed reduced fare reduction per ride will be $0.50. The fare subsidy funds will be coming from$2,500,000 worth of CMAQ, which were approved by the Regional Transportation Council (RTC) for athree-year program.
Emission EffectsThe emission benefits for the Ozone Alert On-Road Program: Ozone Alert Fare Reduction are a NOx
reduction of 0.114 tons per day, and a VOC reduction of 0.063 tons per day.
State Commitment for Evaluation, Reporting, Remedying Emission Credit ShortfallNCTCOG as the regional metropolitan transportation planning agency for the DFW area commits tomake the best faith effort to implement this project. NCTCOG will be responsible for monitoring andreporting the emission reductions to the commission. Any VMEP shortfall (of the total 5 tpd) will becovered by supplementing additional TCMs. These TCMs are in addition to those already credited in theSIP.
Technical Support DocumentationThe reduction is quantified based on new riders only, and a calculation’s review was performed to insureno double counting. Emission benefits are determined by first estimating total transit ridership in 2007(approximately 202,953). Next, to estimate new riders due to the Ozone Action Day Discounted TransitFare Program, multiply 2007 total transit riders by 5% (a conservative estimate based on total transitriders). Then take the total new riders, 10,148 (assuming all are work trips currently made by auto),multiply that by average trip length of 13.28 miles (determined by the NCTCOG trip model), and divide itby auto occupancy (1.14 persons per vehicle) to obtain the VMT removed. The total VMT removed is118,211, then take this number and multiple it by 1.16 g/mi and divide it by 454 g/lb for the gramsconversion to obtain the NOx reduction of pounds per day, which is 302.04 lb/day. Next divide thatnumber by 2000 to get the reduction of tons per day of 0.15 tpd. Finally, To obtain the reduction inVOCs per tons per day, take the 118,211 VMT removed, multiple it by 0.64 g/mi and divide it by 454g/lb for the grams conversion to obtain the VOC reduction of pounds per day, which is 166.64 lb/day, andthen divide that number by 2000 to get the reduction of tons per day of 0.083 tpd.
SUSTAINABLE DEVELOPMENT
Program SummaryThe Sustainable Development Element of the region’s newly adopted Mobility Plan recognizes that theway transportation is planned, programmed and constructed in this region must be responsive to regionaltrends in economic expansion, population growth, development, quality of life, public health and theenvironment in order to provide mobility, prevent the continued decline of the region’s air quality statusand avoid risk of sanctions on federal transportation funds. Promoting sustainable development is aspecific objective of the Mobility Plan because of the direct link between land use, transportation and airquality. A variety of strategies and policies have been adopted by the Regional Transportation Council toinsure the development of transportation plans, programs and projects which promote air qualityimprovements through sustainable development.
Strategies to Meet Financial Constraints, Diversify Mobility and Improve Air Quality

6-25DFW Attainment Demonstration
Topic Recommended StrategySustainable Development Support NCTCOG “Integrated Regional Process”. Transit Service Providers Support service providers in areas with recommended
rail service and/or HOV lanes. Increased Densities and Mixed UseDevelopment
Form new Center for Development Excellence.
Speed Limits Reduce peak limits by 5 mph as per SIP initiative.Congestion Pricing Support on selected corridors (case by case).Trip Reduction Programs Support voluntary 20% program for major employers
during ozone season. Transportation AccessibilityProgram
Support sustainable development through facilitylocation decisions.
Borrowing Roadway Funds to Expedite Rail Projects
Staff directed to develop proposal.
Air Quality TransportationEnhancements
Staff directed to develop proposal.
Revise Project Scoring to FavorSustainable Development in MPOProject Selection
Staff directed to develop proposal.
Overall, the objectives of these practices are to (1) respond to local initiatives for Town Centers, MixedUse Growth Centers, Transit Oriented Developments, Infill/Brownfield Developments and PedestrianOriented Projects; (2) complement rail investments with coordinated investments in park and ride, bicycleand pedestrian facilities and, (3) reduce the growth in VMT per person.
Program ParticipantsThere are three general categories of participants. First, the planning, programming and construction ofpublic facilities is the task of governmental entities such as the North Central Texas Council ofGovernments, the Texas Department of Transportation, Individual Cities and each of the CountyGovernments. Second, other project implementers will come from the private sector as developers andbusinesses respond to (or encourage) public initiatives and make location decisions, construct buildingsand operate businesses within a more sustainable development framework. Third, actual citizens willchange their actual behavior based on changes in the built environment and public and private sustainabledevelopment practices.
How the Program WorksThe program works by favoring sustainable development through each stage in the transportationplanning, programming and construction process. This will provide the platform for businesses andindividuals in the DFW area to choose low emission styles of building, development, commuting andmobility.
Activity EffectsIn short, denser and/or more multi-use land use leads to fewer VMT and an increase in the use ofalternative modes of travel. VMT per person, or per household, rises dramatically from the centralbusiness district to urban zones and then out further to suburban and rural areas. The mixed use, higherdensity and mode choice characteristics of the urban core can be replicated throughout the region. LowerVMT and increased use of alternative modes lead to lower emissions of VOCs and NOx and a reducedrisk of air quality problems.

6-26DFW Attainment Demonstration
Emission EffectsThese specific strategies and the overall sustainable development approach to transportation will (1)facilitate the development of projects for which the region can take air quality credits and (2) provide anopportunity to claim stand alone air quality credits for sustainable development in future conformitydocumentation and air quality plans. No benefits are quantified or claimed at this time.
State Commitment for Evaluation, Reporting, Remedying Emission Credit ShortfallAs no benefits are quantified or claimed at this time, no state commitment is required. However, the Stateand Federal government will be invited to participate in the future development of quantified benefitsunder this category at the appropriate time.
Technical Support DocumentationAs no benefits are quantified or claimed at this time, no technical documentation is provided.
NON-ROAD OZONE SEASON REDUCTIONS
Program SummaryBecause the precursors for ozone formation are added to the local atmosphere during the morning hours, aVMEP program to reduce and defer off-road morning emissions is important. This “AM AM” or“Morning Air Measures” program will target specific non-regulated sources of off-road emissions forvoluntary reductions.
Program ParticipantsNCTCOG will facilitate this effort under the oversight of the NTCASC and seek participation from: • local governments (counties, cities and school districts);• landscaping businesses and golf courses;• operators of small engines (go-carts, boats); and• individuals
How the Program WorksThe following voluntary non-road reductions are considered as part of a broad regional public outreachcampaign by NCTCOG during 2000 through 2003 focusing on deferral of emission causing activitiesduring the early morning hours, every day during the summer ozone season (May 1 through October 31).
(a) Beginning in 2000, NCTCOG will identify and survey all local governments in the DFW area,including 16 counties, nearly 200 cities, and many school districts. Through the local Dallas and FortWorth Chambers, NCTCOG will also identify and survey the largest landscaping businesses and golfcourses. Voluntary commitments will be sought from lawn mowing and landscaping operations tovoluntarily defer or reduce early morning non-road activities that are sources of NOx emissions. Thecommitments would include deferring the emission causing activities until 10 am, or the use of manual orelectric equipment or other alternatives. Many cities and counties in the DFW area already defer theirlandscaping activities and the scope of these commitments can easily be surveyed and documented. Thewritten commitments and description of activities would be tabulated across the region to document theprogram. Periodic surveys and self-reports would assist in monitoring the activities. Voluntaryparticipants would receive recognition within the regional program.
(b) NCTCOG anticipates as a result of the public outreach campaign that a certain number of individualsamong the 4.5 million residents of the DFW Metroplex will voluntarily defer their early morning lawn

6-27DFW Attainment Demonstration
mowing activities. The level of individual change in activities could be assessed using periodic surveysthroughout the 3-year period. The result of the surveys will be submitted as reports to the State.
(c) In addition, NCTCOG may earmark some funds during the 2000-2003 period and allocate thosetowards a lawn mower buy back program. EPA guidelines would be followed to implement the program,document its effectiveness and report the results. No specific details are available at this time as thisproject is still being negotiated and no funds are committed yet. NCTCOG is the regional metropolitantransportation agency and every year engages in allocation of federal TEA-21 transportation grants, underTxDOT oversight. Congestion Mitigation Air Quality funding could be sought in the 2001 upcomingcycle of grant allocations.
(d) NCTCOG will also target businesses operating smaller equipment sources of off-road equipment suchas go-cart facilities and seek commitments to reduce or defer early morning operations. Again, writtencommitments and surveys would be the instrument for documenting the deferrals.
Activity EffectsThe entire program focuses on the voluntary reduction and deferral of early morning emissions until after10 a.m. The emissions would come from daily activities that would occur anyway: the program simplyasks for a shift from early morning hours to later in the day.
Emission EffectsThe actual emission reduction on a daily basis would be very minimal.
State Commitment for Evaluation, Reporting, Remedying Emission Credit ShortfallNCTCOG as the regional metropolitan transportation planning agency for the DFW area commits tomake a best faith effort to implement this project. NCTCOG will be responsible for monitoring andreporting the emission reductions to the commission. Any VMEP shortfall (of the total 5 tpd) will becovered by supplementing additional TCMs. These TCMs are in addition to those already credited in theSIP.
Technical Support DocumentationNCTCOG at this time does not have sufficient support documentation to estimate the amount ofemissions that might be deferred through this program.
TIER II LOCOMOTIVE ENGINES
Program SummaryThis measure seeks to have only Tier II locomotive engines operating in the DFW Area by the ozoneseason of the year 2005.
Program ParticipantsNCTCOG will facilitate the program under the oversight of the North Texas Clean Air SteeringCommittee. Three national railroad companies operate in the DFW area: Burlington Northern/Santa Fe,Union Pacific, and Kansas City Southern Railways. NCTCOG will contact representatives from theaffected railway companies and any other related industries.
How the Program WorksEssentially, during 2001-2002, NCTCOG will seek input from the three railroad companies. First,NCTCOG staff would attempt to inventory the rail lines activity and emissions for a year 2000 baseline.

6-28DFW Attainment Demonstration
Next, NCTCOG staff will seek voluntary commitments from the 3 railroad companies to have Tier IIlocomotive engines for all rail locomotives traveling through the DFW Metroplex. This would bedocumented through written commitments as well as reports such as specific equipment lists showing thetypes of engines used or purchased.
Activity EffectsThis program would assume no change in the activity patterns of the railroad engines.
Emission EffectsAssuming that all three railroad companies would voluntarily participate and all engines would be Tier IIcompliant in 2005, up to 3 tpd NOx reductions could be achieved from the use of cleaner engines.
State Commitment for Evaluation, Reporting and Remedying Emission Credit ShortfallNCTCOG as the regional metropolitan transportation planning agency for the DFW area commits tomake the best faith effort to implement this project. NCTCOG will be responsible for monitoring andreporting the emission reductions to the commission. Any VMEP shortfall (of the total 5 tpd) will becovered by supplementing additional TCMs. These TCMs are in addition to those already credited in theSIP.
Technical Support DocumentationAccording to information provided by the NTCASC consultant (ENVIRON), the incrementaleffectiveness for using only Tier II engines in DFW would be a 37% NOx reduction from the 2007 baseinventory. In the 2007 base inventory, locomotive emissions are predicted to be 8.2 tpd. The reductiondue to accelerated implementation of Tier II would thus be:
8.2 tpd * 37% = 3.0 tpdThe 3 tpd figure assumes, of course, 100% compliance. The actual range could potentially be anywherefrom zero to 3 tpd. NCTCOG does not have any other data to substantiate a more definitive commitmentor more specific reduction figure.
OFF-ROAD HEAVY DUTY DIESEL ENGINE RETROFITS
Program SummaryOwners and operators of heavy-duty diesel off-road equipment in the 12 counties surrounding the DFWnonattainment area will be encouraged to voluntarily retrofit their engines using selective catalyticreduction or other technologies.
Program ParticipantsNCTCOG will facilitate this outreach program under the oversight of the NTCASC. Target participantswould include owners and operators of off-road heavy-duty diesel equipment in the 12 countiessurrounding the DFW nonattainment, such as:• Local counties, cities and school districts (road and site construction, landscaping, materials moving,
etc.) and state agencies (TxDOT, General Services, etc.)• Commercial equipment rental firms • Commercial construction firms • Sand and gravel sites and mining operations (such as the cement manufacturing plants with limestone
mining facilities in Ellis County)• Landfill operations• Agricultural operations

6-29DFW Attainment Demonstration
• Commercial/Industrial businesses with stationary generators and material moving equipment such asforklifts.
How the Program WorksNCTCOG will act as the DFW regional planning agency promoting a program along the guidelines ofEPA’s newly announced “Diesel Retrofit Initiative” (March 20 EPA press release). EPA intends topromote the voluntary retrofit program in three or four pilot project cities, yet to be identified, thennationwide.
At this time, EPA has not finalized the definition of what constitutes a “retrofit”. However, somedefinitions that EPA is considering may include an engine upgrade, use of cleaner fuels or additives, or acombination of definitions. NCTCOG anticipates using as much of the EPA information availablethrough its upcoming web site and staff technical assistance as possible in the near future.
NCTCOG will survey and identify the subsets of targeted heavy-duty diesel equipment activities and seekvoluntary participation in a diesel equipment retrofit program. The target area will specifically be the 12-county area surrounding the 4-county urban non-attainment area. NCTCOG is an association of localgovernments and can easily contact its member county and city governments and school districts. Stateagencies with significant fleets of heavy-duty diesel equipment such as Texas Department ofTransportation will also be targeted for participation. NCTCOG can also work with industry associationsand representatives: local chambers of commerce, professional associations representing the constructionindustry, the solid waste management industry, etc. to identify private sector operations using heavy-dutydiesel equipment.
The current proposal for the DFW State Implementation Plan already includes two measures targetingheavy-duty diesel equipment operations in the NCTCOG metropolitan statistical 12-county area:• An accelerated equipment purchase program requiring 50% Tier II and 50% Tier 3 equipment among
heavy-duty equipment fleets in the year 2007;• A proposed shift of operation hours from 6 to 10 am in the summer ozone season for all construction
and mining heavy-duty equipment.
Assuming the accelerated purchase program proceeds, NCTCOG does not believe that a diesel retrofitprogram for non-road equipment in the 4-county area would add any appreciable emission reductionbenefits: all of the heavy-duty diesel equipment fleet is anticipated to be state of the art between 2004 and2007. Most heavy-duty diesel equipment is on an average replacement schedule of 15 to 25 years. If theequipment fleet in the 4-county nonattainment area is to be entirely replaced between 2004 and 2007, it isunlikely, although, not impossible that equipment owners or operators would consider a retrofit programbetween 2000 and 2004.
NCTCOG believes that a voluntary emission reduction program in the surrounding counties might befeasible and would provide additional benefits not otherwise targeted in the SIP. This VMEP programwould specifically target the public and private sector owners and operators of all classes of heavy-dutydiesel equipment in the surrounding member counties in the NCTCOG region, beginning in 2001 through2007. Note: the metropolitan statistical area identifies 8 counties beyond the 3 county area, but the actualNCTCOG region has 12 more counties in addition to the 4 urban counties. Therefore, this voluntaryinitiative could potentially target 8 to 12 counties. NCTCOG would actively seek commitments fromvoluntary participants to retrofit their heavy-duty diesel off-road equipment.

6-30DFW Attainment Demonstration
At the current time, no funding is available to provide incentives for a retrofit program. However,NCTCOG intends to seek grant funds in the coming competitive allocation of the federal TEA-21Congestion Mitigation Air Quality funds managed by the Texas Department of Transportation andNCTCOG in order to fund a “regional diesel retrofit initiative” for both public and private operators. Early EPA guidance indicates that the Department of Energy’s Clean Cities Program for projects usingclean fuels such as natural gas might be another source of economic incentives and funding.
Pending additional EPA guidance on this voluntary retrofit program, NCTCOG will work with interestedprogram participants in technical work group sessions to research and identify the type of equipment andengine and the type of retrofit technology. Once commitments are made, NCTCOG would monitor theactual implementation of the retrofit equipment and tabulate the emission reductions. Pending theavailability of CMAQ or other funding, the program could be much larger than currently anticipated.
Activity EffectsThere would be no activity effects from this program, since the initiative targets technologyimprovements through engine retrofits. Activity patterns and operations are not expected to change.
Emission EffectsThe primary impact of this initiative will be on the 8-12 counties surrounding the 4-county nonattainmentarea. NCTCOG currently does not have sufficient data to evaluate the emission reduction effect of thisproposed initiative.
State Commitment for Evaluation, Reporting, Remedying Emission Credit Shortfall NCTCOG as the regional metropolitan transportation planning agency for the DFW area commits tomake the best faith effort to implement this project. NCTCOG will be responsible for monitoring andreporting the emission reductions to the commission. Any VMEP shortfall (of the total 5 tpd) will becovered by supplementing additional TCMs. These TCMs are in addition to those already credited in theSIP.
Technical Support DocumentationSince nonroad equipment powered by diesel engines tend to have relatively long useful lives, often up to25 years, retrofit of the in-use fleet represents an especially important tool for reducing non- road enginepollution. Achieving emission reductions from in-use diesels is needed because older engines pollute atmuch higher rates than newer ones due to deterioration and less stringent emission standards. Althoughthe EPA’s rule for “Control of Emissions of Air Pollution from Nonroad Diesel Engines,” which will bephased in between 1999 and 2008, will reduce NOx by 50%, retrofits can reduce emissions prior to 2008by up to 90%.
According to the report “Heavy-Duty Diesel Emission Reduction Project Retrofit/Rebuild Component”issued by EPA in June 1999, various technologies can reduce emissions from heavy-duty diesel engines. For example, one of the most effective NOx-reduction retrofit technologies is selective catalytic reduction(SCR). Several field installations of SCR on stationary generators exist and have shown NOx reductionsup to 90% (EPA, 1999). All possible retrofit technologies based on EPA guidance and technologytransfer will be considered in this program.
VEHICLE MAINTENANCE/RETIREMENT PROGRAM
A) VEHICLE MAINTENANCE
6-31DFW Attainment Demonstration
BackgroundVehicle emission reduction programs are comprised of two areas. One of which is regular vehiclemaintenance. Routine car maintenance is important for several reasons. First, 10% of our cars produce50% of the emission-related pollution. Next, the majority of cars that do not pass the vehicle emissionstest require only a tune-up. Also, emissions from one badly maintained vehicle can equal those from 25properly maintained vehicles. Regularly scheduled vehicle maintenance can easily save an individualmotorist hundreds of dollars per year. Tire pressure checks, checks of spark plugs and changing of airfilters and oil at different intervals adds to the life of a car. They can also help eliminate costly repairs inthe future. For those vehicles which cannot economically be repaired, the second type of program is theVoluntary Accelerated Vehicle Retirement (VAVR) Program.
Program ParticipantsProgram participants are the North Texas Clean Air Coalition (NTCAC) and NCTCOG. Also, thisprogram will be folded into part of the NCTCOG’s Regional Ozone Action Day Program. Furthermore,all citizens of the four-county nonattainment region (Dallas, Denton, Collin, and Tarrant) for the pollutantozone will be allowed to participate in this Vehicle Maintenance Program.
How the Program Works500 vehicles will be identified for tune-ups per year, and each vehicle owner will receive $500 for vehiclemaintenance. The Total Program Cost of the vehicle maintenance element of the VAVR Programapproved by the RTC is $250,000. Please see Section B, of this section, regarding the VAVR Program for information concerning:• Activity effects• Emission effects• State commitment for evaluation, reporting, remedying emission credit shortfall• Technical support documentation
B) VEHICLE RETIREMENT PROGRAM
BackgroundThe FCAA Amendments of 1990 define “programs to encourage the voluntary removal from use and themarketplace of pre-1980 model year light duty vehicles and pre-1980 model light duty trucks” as a TCMin Section 108(f). Old automobiles with no or few emission controls are typically a source of highemissions. Newer vehicles possessing emission controls which have been tampered with, maintainedimproperly, have failed, or have otherwise been rendered ineffective are also significant contributors ofemissions. While normal attrition of the fleet solves some of this emissions problem, some high emittingvehicles remain in operation and contribute to the problem for long periods of time. Studies have shown10% of the vehicles cause 50% of vehicle pollution. A vehicle retirement program could be such ameasure to remove high emitting vehicles from the fleet. These programs offer a cost-effectivealternative to more expensive and difficult stationary source emission control measures.
Program ParticipantsThe Vehicle Retirement Program (VRP) will begin in 2001 and is estimated to cost roughly $3.9 millionper year to implement. This cost will involve the repair of high emitting vehicles and the acquisition ofvehicles that are unable to be repaired. The successful operation of this program will require cooperationbetween government agencies, private industry, and the general public. Program funding is expected tocome from the private sector or from a possible $1.00 surcharge added to every inspection/maintenancetest through legislative action. Other organizations needed for the successful operation for this project are

6-32DFW Attainment Demonstration
financial institutions. Working in conjunction with these institutions will help provide low interestfinancing for the purchase of OBD II compliant vehicles. Working with reputable car dealerships is alsoa necessity for this program, as they will help in identifying vehicles that are in good repair and are notthemselves high emitters.
The NCTCOG Regional Transportation Council has committed $3.6 million in the transportationimprovement program to serve as supplemental funding, if needed, and will be available in 2003.
How the Program WorksAs shown in Exhibit 1, the VRP focuses on removing high emitting vehicles from two areas, localgovernment impound lots and vehicles owned by the general public. A portion of the plan, Part I, callsfor the acquisition of vehicles scheduled for auction that are currently held in city impound lots. Acquiring the impounded high emitting vehicles will remove them from the fleet and aid in reducingmobile source emissions in the region. The second part of the program, Part II, involves the acquisitionof high emitting vehicles from the general public. Repair (vehicle maintenance) has been quantified as aseparate program. Part II is designed in a manner to assist residents with the costs of vehicle replacement. For a typical person with a high emitting vehicle, the replacement of their vehicle will be partiallysubsidized by the program. They will still have to pay a portion of the cost associated with purchasing anew vehicle. People with low incomes will not have to pay any of the costs. The costs of replacing thevehicle will be fully provided for by this program. The program will replace high emitting vehicles withmodel year 1996 or newer vehicles that meet clean air standards. This model year was chosen due tovehicle cost and the presence of an OBD II system. The OBD II system allows for a more efficient andreliable test of the vehicle’s emission control systems.
Activity EffectsThe Vehicle Maintenance/Retirement Program is designed to capture 2500 high emitting vehicles peryear. Selected vehicles will either be repaired or retired if repair is not practical. Vehicles to be retiredwill be replaced with OBD II compliant vehicles, which will assist in the reduction in emissions of ozoneproducing pollutants.
Emission EffectsThe repair and removal of high emitting vehicles will create emission reduction benefits of approximately0.77 tons per day by 2007. The methodology for quantifying these emission reduction benefits isincluded as VRP.xls.
State Commitment for Evaluation, Reporting, Remedying Emission Credit ShortfallNCTCOG as the regional metropolitan transportation planning agency for the DFW area commits tomake the best faith effort to implement this project. NCTCOG will be responsible for monitoring andreporting the emission reductions to the commission. Any VMEP shortfall (of the total 5 tpd) will becovered by supplementing additional TCMs. These TCMs are in addition to those already credited in theSIP.
Technical Support DocumentationThe emission reduction benefits were calculated by using EPA’s Guidance for the Implementation ofAccelerated Retirement of Vehicles Program, February 1993. Specific calculations were provided by thecommission and adjusted for region specific criteria. The emission benefits are calculated by first findingthe difference in emissions between the high emitting vehicle and the vehicle replacing it. Theseemissions are then multiplied by the VMT per vehicle per year, to calculate the total emissions for thatvehicle per year. The total emissions are then multiplied by the number of vehicles to be replaced, and a

6-33DFW Attainment Demonstration
conversion factor to change from grams per year to tons per day. The final result gives the emissionreduction benefits for the selected vehicles in tons per day.

6-34DFW Attainment Demonstration
Recycling/Repairing pre-1980 LDGV in DFW (Dallas and Tarrant County)2000 Vehicles Are to Be Retired
0.8 Effective Number of Vehicle Factor
VOC NOx
1st year 2001 2002 2003 2001 2002 2003Recycled grams/mile 5.25 4.87 4.24 Recycled grams/mile 2.99 2.96 2.77Replaced grams/mile 0.77 0.72 0.68 Replaced grams/mile 1.27 1.22 1.17VOC Benefit 4.48 4.15 3.56 NOx Benefit 1.72 1.74 1.6VMT/year/vehicle 4,025 3899 3790 VMT/year/vehicle 4,025 3899 3790Grams/vehicle/year 18,034 16,179 13,492 Grams/vehicle/year 6,924 6,783 6,064Eff. Vehicle 1,600 2,880 3,904 Eff. Vehicle 1,600 2,880 3,904Tons per day 0.087 0.141 0.159 Tons per day 0.033 0.059 0.071
2nd year 2002 2003 2004 2002 2003 2004Recycled grams/mile 4.87 4.24 3.27 Recycled grams/mile 2.96 2.77 3.56Replaced grams/mile 0.72 0.68 0.64 Replaced grams/mile 1.22 1.17 1.11VOC Benefit 4.15 3.56 2.63 NOx Benefit 1.74 1.6 2.45VMT/year/vehicle 3,899 3790 3790 VMT/year/vehicle 3,899 3790 3790grams/vehicle/year 16,179 13,492 9,968 Grams/vehicle/year 6,783 6,064 9,286Eff. Vehicle 2,880 3,904 4,723 Eff. Vehicle 2,880 3,904 4,723Tons per day 0.141 0.159 0.142 Tons per day 0.059 0.071 0.132
3rd year 2003 2004 2005 2003 2004 2005Recycled grams/mile 4.24 3.27 3.22 Recycled grams/mile 2.77 3.56 4.02Replaced gram/mile 0.68 0.64 0.61 Replaced grams/mile 1.17 1.11 1.04VOC Benefit 3.56 2.63 2.61 NOx Benefit 1.6 2.45 2.98VMT/year/vehicle 3,790 3790 3790 VMT/year/vehicle 3,790 3790 3790Grams/vehicle/year 13,492 9,968 9,892 Grams/vehicle/year 6,064 9,286 11,294Eff. Vehicle 3,904 4,723 5,379 Eff. Vehicle 3,904 4,723 5,379Tons per day 0.159 0.142 0.161 Tons per day 0.071 0.132 0.183
4th year 2004 2005 2006 2004 2005 2006Recycled grams/mile 3.27 3.22 3.18 Recycled grams/mile 3.56 4.02 4.15Replaced grams/mile 0.64 0.61 0.56 Replaced grams/mile 1.11 1.04 0.95VOC Benefit 2.63 2.61 2.62 NOx Benefit 2.45 2.98 3.2VMT/year/vehicle 3,790 3790 3790 VMT/year/vehicle 3,790 3790 3790

6-35DFW Attainment Demonstration
Grams/vehicle/year 9,968 9,892 9,930 Grams/vehicle/year 9,286 11,294 12,128Eff. Vehicle 4,723 5,379 5,903 Eff. Vehicle 4,723 5,379 5,903Tons per day 0.142 0.161 0.177 Tons per day 0.132 0.183 0.216
5th year 2005 2006 2007 2005 2006 2007Recycled grams/mile 3.22 3.18 3.09 Recycled grams/mile 4.02 4.15 4.43Replaced grams/mile 0.61 0.56 0.52 Replaced grams/mile 1.04 0.95 0.87VOC Benefit 2.61 2.62 2.57 NOx Benefit 2.98 3.2 3.56VMT/year/vehicle 3,790 3790 3790 VMT/year/vehicle 3,790 3790 3790Grams/vehicle/year 9,892 9,930 9,740 Grams/vehicle/year 11,294 12,128 13,492Eff. Vehicle 5,379 5,903 6,322 Eff. Vehicle 5,379 5,903 6,322Tons per day 0.161 0.177 0.186 Tons per day 0.183 0.216 0.257
6th year 2006 2007 2008 2006 2007 2008Recycled grams/mile 3.18 3.09 3.05 Recycled grams/mile 4.15 4.43 4.48Replace grams/mile 0.56 0.52 0.48 Replaced grams/mile 0.95 0.87 0.8VOC Benefit 2.62 2.57 2.57 NOx Benefit 3.2 3.56 3.68VMT/year/vehicle 3,790 3790 3790 VMT/year/vehicle 3,790 3790 3790Grams/vehicle/year 9,930 9,740 9,740 Grams/vehicle/year 12,128 13,492 13,947Eff. Vehicle 5,903 6,322 6,658 Eff. Vehicle 5,903 6,322 6,658Tons per day 0.177 0.186 0.196 Tons per day 0.216 0.257 0.280
7th year 2007 2008 2009 2007 2008 2009Recycled grams/mile 3.09 3.05 3.01 Recycled grams/mile 4.43 4.48 4.36Replaced grams/mile 0.52 0.48 0.44 Replaced grams/mile 0.87 0.8 0.73VOC Benefit 2.57 2.57 2.57 NOx Benefit 3.56 3.68 3.63VMT/year/vehicle 3,790 3790 3790 VMT/year/vehicle 3,790 3790 3790Grams/vehicle/year 9,740 9,740 9,740 Grams/vehicle/year 13,492 13,947 13,758Eff. Vehicle 6,322 6,658 6,926 Eff. Vehicle 6,322 6,658 6,926
TPD 0.186 0.196 0.204 Tons per day 0.257 0.280 0.288

6-36DFW Attainment Demonstration
VOCCalendar Year 2001 2002 2003 2004 2005 2006 2007 2008 2009Year 1 Credit 0.087 0.141 0.159 0.142 0.161 0.177 0.186Year 2 Credit 0.141 0.159 0.142 0.161 0.177 0.186 0.196Year 3 Credit 0.159 0.142 0.161 0.177 0.186 0.196 0.204Total 0.087 0.281 0.477 0.426 0.482 0.531 0.557 0.391 0.204
NOx
Calendar Year 2001 2002 2003 2004 2005 2006 2007 2008 2009Year 1 Credit 0.033 0.059 0.071 0.132 0.183 0.216 0.257Year 2 Credit 0.059 0.071 0.132 0.183 0.216 0.257 0.280Year 3 Credit 0.071 0.132 0.183 0.216 0.257 0.280 0.288Total 0.033 0.118 0.214 0.397 0.550 0.648 0.772 0.560 0.288

6-37DFW Attainment Demonstration
6.2.13 Inspection/MaintenanceThe DFW area is expanding and revising the vehicle emissions I/M program as an additional controlstrategy option. Dallas, Tarrant, Harris, and El Paso Counties will continue to utilize the current two-speed idle test until December 31, 2001. Beginning January 1, 2001, Dallas and Tarrant Counties willincorporate OBD testing into the current two-speed idle program. Beginning May 1, 2002, Dallas,Denton, Collin, and Tarrant Counties will begin emissions testing utilizing OBD and ASM-2 or a vehicleemissions testing program that meets SIP emission reduction requirements and is approved by EPA.. Beginning May 1, 2003, Ellis, Johnson, Kaufman, Parker, and Rockwall Counties will begin the OBDand ASM-2 program or a vehicle emissions testing program that meets SIP emission reductionrequirements and is approved by EPA. Program expansion is essential for reduction of NOx emissions tobe able to demonstrate attainment with the NAAQS for ozone. These additional five countiessurrounding the DFW nonattainment area are voluntarily opting into the I/M program in accordance withTexas Health and Safety Code §382.037(c) and Texas Transportation Code §548.301(b).
6.2.14 Dedicated Alternative Fuel VehiclesThis control strategy is now being included as part of the VMEP Program. Refer to Section 6.2.13 formore information.
6.2.15 Voluntary Incentive ProgramIn May 2001 the 77th Legislature of the State of Texas passed SB 5, which establishes the TexasEmissions Reduction Program to provide grants and other financial incentives for emission reductionsand alternatives to certain components of the SIP. SB 5 authorizes the commission to operate the emissionreduction program, manage the funds collected and allocated under the bill, submit the provisions of thebill as a revision to the SIP, and delete the Tier 2/Tier 3 equipment accelerated purchase and heavy-dutydiesel operating restriction requirements from the SIP by October 1, 2001.
One of the provisions of SB 5 establishes the Diesel Emissions Reduction Incentive Program, modeled onthe Carl Moyer program in California, under which grant funds are provided to offset the incrementalcosts of projects that reduce NOx emissions from heavy-duty diesel trucks and construction equipment inthe nonattainment and near-nonattainment areas of the state.
The current proposed SIP revision reflects the proposed repeal of the Tier 2/Tier 3 equipment acceleratedpurchase and heavy-duty diesel operating restriction rules. The diesel emission reduction incentiveprogram contained in SB 5 will replace the above-referenced rules and result in reductions in excess ofthe reductions expected from the rules that are being repealed. Therefore, the NOx reductions previouslyclaimed in the DFW attainment demonstration SIP will, as a result of this rulemaking, be achievedthrough an alternate but equivalent federally enforceable mechanism. The rule repeals are being proposedconcurrently with this SIP revision as part of the implementation of SB 5.
Photochemical modeling will be performed according to the schedule outlined in Chapter 7, as part of themid-course review to be submitted to EPA by May 1, 2004. This modeling will show that the emissionreductions from the referenced withdrawn rules, which were part of the modeled control strategies, arepreserved by the new voluntary incentive program rule, and that attainment of the 1-hour ozone standardis demonstrated for the DFW area.
6.3 WEIGHT-OF-EVIDENCE
The 1996 EPA guidance document Guidance on Using Modeled Results to Demonstrate Attainment of theOzone NAAQS presents two approaches to demonstrating attainment, a statistical approach and a

6-38DFW Attainment Demonstration
deterministic approach. Both approaches -- unlike earlier EPA guidance -- allow for occasional modeledexceedances of the 125 ppb ozone standard. The statistical approach uses the ranked severity of ozoneepisodes to “adjust” peak ozone predictions downward if particularly severe episodes are modeled. Sincemonitored ozone levels during the two episodes modeled are not unusually high, the statistical approachwill not be pursued in this attainment demonstration.
The deterministic approach is based on comparing peak ozone predictions with the standard, and if thepeak for each modeled episode day is below 125 ppb, then this test is passed. As seen in Chapter 3, Table3-18, modeled peak ozone with Strategy D30 is well below the threshold for two of the three primaryepisode days. However, peak modeled ozone on July 3 is still above 125 ppb, so we must proceed to thesecond step in the deterministic approach and use WOE to complete the demonstration that the area willlikely reach attainment by 2007.
The key concept behind WOE is that the determination of attainment (based on monitored ozoneconcentrations) allows for some exceedances of the one-hour standard. Thus, even though the model mayshow some areas with peak concentrations above 125 ppb, such modeled exceedances do not necessarilyimply violations.
6.3.2 Weight of Evidence Supporting Modeling Run DATT
The WOE argument presented here consists of several elements which, taken together, form a compellingargument that attainment will most likely be achieved by 2007. Because the only day which failed to passthe deterministic test is July 3, 1996, much of the following discussion is specific to that day.
Unusually high peak modeled ozone concentrations:While the monitored peak ozone concentration on July 3 is not unusually high (144 ppb), the modeledpeak is significantly higher. Since the modeled peak occurred several kilometers from the nearestmonitor, there is no way to verify whether or not such a peak actually occurred on that day. However, ifthe model is accurately replicating an actual occurrence, then this event would be rare given the history ofozone violations since 1992. During the eight-year period encompassing the 1992 through 1999 ozoneseasons, the area has experienced only two days where the area-wide monitored peak ozone exceeded 160ppb, and only seven days when the area-wide peak exceeded 150 ppb. It is likely some higher ozonepeaks escaped detection during this time period, but with eight (nine beginning in 1997) full-timemonitors distributed across the four-county area, many more days with peak ozone exceeding 160 ppbwould have been monitored if such events were common. Thus, if the model is accurately replicatingevents of July 3, 1996, then this day likely represents an extreme event. EPA’s guidance indicates that itis inappropriate to develop controls for such rare events, since these infrequent occurrences would not bythemselves lead to a violation of the NAAQS.
Two specific reasons why July 3, 1996 may be atypical are 1). the next day is a national holiday, so manypeople may be expected to leave work early, potentially increasing mobile source emissions in the earlyafternoon, and 2). a number of scattered showers occurred in the area in mid-afternoon which could haveperturbed the normal afternoon wind-flow patterns.
Meteorology:Since there were no monitors in the area of the maximum predicted ozone concentration on July 3, 1996(one was installed nearby in 1997), it can never be determined whether or not the model predicted anactual peak near 160 ppb.

6-39DFW Attainment Demonstration
It appears likely that scattered thunderstorms in the DFW vicinity on July 3rd had not accounted foreffects on the meteorology. These effects would possibly have included; perturbation of the wind flow,temperature variations, and cloud cover effects on actinic flux. The meteorological model which wasused, SAIMM, is hydrostatic, meaning it is incapable of accounting for precipitation, clouds, and relatedphenomena. The presence of thunderstorms would probably create small scale meteorological variations(wind, temperature and clouds) beyond the spatial and temporal scales resolved by the model. Toaccurately model an event such as occurred on July 3, it would be necessary to use a non-hydrostaticmodel which can simulate the small-scale events characteristic of convective thunderstorm activity. Thelimitations of SAIMM indicate that the complexities of the actual meteorology may not be accuratelysimulated on July 3, particularly at the time the highest ozone was modeled.
For future modeling work the commission plans to use the MM5 non-hydrostatic meteorological model(or other similar advanced prognostic model). Such an advanced model should be able to much moreaccurately simulate the conditions associated with meteorological events like that observed on July 3.
Additional ozone metrics: EPA guidance indicates that a key part of a WOE determination is showing the reductions in area ofexceedance caused by applying the SIP control strategy. In this section we present three metrics besidesthe peak predicted ozone concentration: 1). Area of exceedance (the area, in kilometers, where themodeled one-hour ozone concentration is greater than or equal to 125 ppb any time during the day), 2).Area-hours, which sums the number of hours of exceedance across the exceedance area, and 3). Exposure, which is area-hours weighted by the amount by which predicted ozone exceeds 125 ppb ineach location. Table 6.3-1 shows each metric for the 1995-96 base case, the 2007j future base, andControl Strategy DATT for each of the three primary episode days.
Table 6.3-9. Ozone Measures Modeled for Base5, Future Base 2007i, and Strategy DATT
Model Run
Area of Ozone > 124 ppb (km2)
Area-Hours > 124 ppb(km2-hours)
Exposure(km2-hours-ppb)
6/21/95 6/22/95 7/3/96 6/21/95 6/22/95 7/3/96 6/21/95 6/22/95 7/3/96
1995/6 Base6a 464 608 2464 784 1376 7232 2068.8 6131.7 76046.1
Future Base 2007j 0 32 1404 0 32 3696 0 23.5 23367.7
Strategy DATT 0 0 272 0 0 416 0 0 852.0
Table 6.3-9 shows that Strategy DATT produces very significant reductions in each of these measures, bothwhen compared with the 1995-96 base case and with the 2007 future base. For July 3, Strategy DATT isseen to reduce the exceedance area by 89% from the 1995-96 base case, and by 81% from the future base. Similarly, area-hours is reduced by more than 94% from the 1995-96 base, and by 89% from the futurebase. Exposure is reduced by almost 99% from the 1995-96 base case, and by over 96% from the futurebase.
We can calculate the average duration of exceedance in each grid cell by dividing area-hours byexceedance area. For July 3, the average duration in the 1995-96 base case was over 2.9 hours, and isover 2.6 hours in the future base. After applying Strategy DATT, however, the average duration drops tojust over one and one-half hours (since an exceedance is defined in terms of one-hour averageconcentrations, the minimum value for average duration is one hour). Each of these metrics shows amarked improvement in air quality from 1995-96, and also from the 2007 predictions without additional

6-40DFW Attainment Demonstration
controls. These results indicate that the control package modeled is sufficient to reduce an extremeexceedance to, at worst, a mild exceedance of short duration in a small geographic area.
Future design value (DVf)Originally designed as the guideline methodology for demonstrating attainment of the proposed eight-hour standard, the future design value, or DVf, is a valuable component of WOE, since it directly predictswhether an area will reach attainment or not. The DVf is closely related to the monitored design value ofan area, and is based upon the relative reduction modeled at each monitoring site in the region. Thiscalculation uses the five episode days which had either measured or modeled exceedances of the the one-hour standard 125 ppb. The future design value is found by determining reductions in peak ozonemodeled within a 7 × 7 square of grid cells surrounding each monitor, then reducing each monitor’s basedesign value (average of 1995, 1996, and 1997 design values) by the calculated reduction factor at thatmonitor. The methodology used to calculate DVf is described in Appendix O. Table 6.3-10 presents thepredicted design values for the future base and for Strategy DATT.

6-41DFW Attainment Demonstration
Table 6.3-10: Future Design Values for the DFW area
1995-97Design Value
Predicted future design value DVf
2007i Future Base Strategy DATT
139 ppb 128.9 ppb 115.3 ppb
Table 6.3-10 clearly illustrates the highly significant reductions in the area’s design value from both thenational and state regulations assumed in the future base, and especially from the control measures inStrategy DATT. With this strategy, the predicted design value in the region in 2007 is nearly 10 ppb belowthe standard. This analysis presents a highly compelling argument that the area will reach attainment by2007.
VOC-NOx Ratios at 1996 Auto-GC sites:This analysis was described in detail in the Phase I SIP. The conclusion is that ambient data analysisindicates that NOx controls would be somewhat more beneficial than VOC controls in reducing ozoneconcentrations. This conclusion provides corroboration of the modeling results, and also providesadditional evidence that the NOx-based strategy D30 will lead towards attainment of the ozone standard.
Transport from the Houston-Galveston area
Houston-Galveston zero-out runs - Commission staff evaluated the impact of transport from theHGA area to DFW by reducing anthropogenic emissions from HGA to zero and calculating theresulting difference in modeled peak ozone concentrations in the DFW area. These runs for the 1995and 1996 episodes showed that the wind field carried Houston emissions toward Austin and Tyler-Longview respectively, and that DFW received only a small contribution from the Houston plumeduring these episodes. Impact analysis for Austin and Tyler-Longview indicated impacts of 5-10 ppbcould be attributed to sources in Houston. It is reasonable to conclude that on some days, transportfrom the HGA area could contribute similarly to ozone in the DFW area. Since the commission isdeveloping plans to reduce emissions in HGA area by well over 50%, the DFW area will likely seesignificant air quality benefits on days when the wind blows directly from the upper Texas Coast toDFW.
Back Trajectory Analysis. Analysis of the meteorology associated with ozone in the DFW areaindicates that high ozone episodes are associated with light and variable or even stagnant winds in thelocal area. However, even stagnant air must come from somewhere outside of the city during thedays prior to the episode. Analysis of numerous back trajectories for ozone episodes indicates thatwinds from the south and southeast are quite common and winds from the north and northwest arequite rare. Depending on the altitude evaluated, winds blew directly from HGA to DFW duringapproximately 15-22% of the high ozone days. Thus, it can be concluded that winds do blow fromthe HGA area to the DFW area even though those winds directions were not captured in the 1995 and1996 episodes.
Synthetic Wind Exercise. Although the 1995 and 1996 DFW episodes did not show a direct impactupon DFW from HGA sources, it is clear from the trajectory analysis that transport from the HGAarea can occur. Therefore the commission conducted a synthetic wind demonstration to determine themagnitude of the impact of HGA pollutants upon DFW when they are transported directly. Thissynthetic wind demonstration showed that Houston emissions could contribute as much as 10 ppb of

6-42DFW Attainment Demonstration
ozone to DFW afternoon exceedances. This value is likely near the upper limit of potential transportfrom the HGA area to DFW, since both the wind speed and direction were selected to maximize theimpact.
It is clear that the HGA has a significant impact on many cities in Texas. When the HGA sources arebetter controlled the ozone concentrations in the urban plume will be reduced and many cities, includingDallas, will benefit. Depending upon the specific wind direction each day during the ozone season,individual Texas cities will experience reduced background concentrations of ozone and are therefore lesslikely to violate the ozone standard. The HGA zero-out runs indicate that DFW should also experiencefewer ozone exceedances as a result of the emissions reductions required to bring HGA into compliance. Appendix N provides a detailed discussion of issues related to transport from the HGA area to DFW.
Transport from East TexasAs is the case with the HGA area, the episodes selected for modeling DFW did not show significanttransport from East Texas. However, numerous flights conduced by Baylor University have shown highbackground levels of ozone and NOx being transported towards DFW from the east. A recent analysissuggests that, on average, only about 50% (65 ppb) of DFW’s peak ozone concentration is generatedlocally. Regional background ozone levels contribute, on average, 70 ppb ozone to peak concentrationsin DFW.
The attached back trajectories (generated by HYSPLIT 4) and aircraft flight path (Figures 6.3-1 and 6.3-1, respectively) show significant background ozone levels that were generated as air parcels that traveledthrough Arkansas, Louisiana, and Northeastern Texas on their way to DFW. This particular mission wasflown on September 19, 1998. The estimated upwind ozone concentration on this day was 71 ppb. Thepeak ozone level measured by the aircraft was 136 ppb, suggesting that DFW contributed only 65 ppb tothe peak concentration.
Since East Texas is home to several very large coal-fired powerplants and a smaller number of largeindustrial sources, sources in this area may be expected to contribute significantly to DFW ozone levelswhen the wind blows from East Texas. Reduction in NOx emissions in East Texas from regional NOx
point source reductions will, therefore help to reduce both the number and severity of exceedances in theDFW area.
Emission trends:The following paragraphs summarize conclusions reached in the Phase I SIP (Appendix Q):
Trend Line Analysis for DFW VOCs. TNMOC data was collected near the Hinton Drive monitoringsite during the mid to late 1980's and the mid 1990's. Analysis of the morning canister samples shows astatistically significant downward trend in TNMOC concentrations. Overall, the drop from the combined1985-86 years to the combined 1995-96 years was 62%. Analysis of just the high ozone days during thesame periods shows the same downward trend in TNMOC. This analysis indicates that VOCconcentrations have declined significantly in the Dallas urban core over the past fifteen years, indicatingthat the mix of federal and state controls, especially on motor vehicles, has been effective in reducing oneof the ozone precursors. This material was previously discussed in detail in the DFW Phase I SIP inSection 4.3.2.
Design value trends:Analysis of the monitoring data and trend lines between 1981and 1999 has shown a substantial decline inthe DFW ozone design value. The design value is based upon the 4th highest ozone measured in the DFW

6-43DFW Attainment Demonstration
area over the most recent three year period. The downward trend in the design value over the entire the18 year period is likely due at least in part to the replacement of older, carbureted motor vehicles with apool of newer, more tightly controlled vehicles with electronic fuel injection. Recently the trend hasflattened somewhat, reflecting the completion of this transition to computer controls. A simple lineartrend line over the entire period would suggest that attainment is possible in 2007 without the applicationof any additional controls. (See Figure 6.3-3)
The most recent trend, however, is relatively flat, though the design value did drop from 139 ppb in 1998to 137 ppb in 1999 (based on preliminary data). Whether this recent decline is indicative of a long-termtrend is uncertain, but it is encouraging to note that this decline occurred despite dramatic increases in thelevel of construction and economic activity, as well as substantial growth in the mobile fleet and VMT. The conclusion is that existing regulations are sufficient to hold the line against ozone pollution, and withthe substantial reductions offered through this SIP, we may expect to see a significant decline in theozone design value in the near future.
New technologies
The commission will continue to review and implement new control strategies based on sound science. In the past few years, significant new discoveries have provided cleaner technologies than were thoughtpossible ten or fifteen years ago. TCEQ is committed to reviewing and implementing these strategies thatmake sense for Texas. EPA is continuing to mandate cleaner vehicles. Recent announcements have beenmade regarding cleaner buses and sports utility vehicles. Currently, TCEQ is evaluating the use ofcleaner gasoline and the use of a new technology that will reduce ozone by way of an innovative surfacecoating. This is more assurance that the control strategies proposed coupled with the continuingimprovements in technology will result in cleaner air in the Dallas/Fort Worth area.
Additional Measures not Modeled
• Senate Bill 766. Senate Bill 766 encourages non-EGU sources in attainment areas of Texas toacquire permits for their grandfathered units, and significantly increases emission fees for thesesources. The commission estimated that SB766 would result in approximately a 30% decrease inemissions of NOX from grandfathered non-EGU sources across Texas, and this assumption wasincluded in all strategies prior to D44, but was dropped in response to comments from EPA RegionVI. The modeling for Strategy DATT does include the Agreed Orders for two large sources affected bySB 766, but the commission expects many additional sources to make substantial emission reductionsprior to 2007. These reductions will aid the DFW area in its quest to reach attainment by reducingbackground concentrations of ozone and its precursors, which will in turn aid in lowering ozoneconcentrations in the nonattainment area.
• Reductions in surrounding states. Similar to SB 766, the commission had assumed NOX reductionswould occur in surrounding states before 2007. Prior to Strategy D38, a 30% reduction had beenassumed in Louisiana, Arkansas, Oklahoma, Mississippi, and Florida, but this assumption wasdropped, also in response to comments received from Region VI. The commission expects that manystates will reduce emissions in the near future as awareness of the regional nature of air quality grows,and expects that these reductions will further reduce the levels of ozone and its precursors transportedinto the DFW airshed.
• Building code modifications. This control strategy element was included in strategies D19 throughD47, but was removed as a result of comments from Region VI. The Region noted that in order for

6-44DFW Attainment Demonstration
these reductions to be used, the actual ordinances from all the municipalities in the area would need tobe included in the SIP itself. Because of time limits, the building code modification element wasremoved from the modeling. However, the commission believes that the local governments share astrong commitment to enact ordinances which will reduce energy consumption. This will in turn leadto reduced emissions from electric generating facilities both within and outside of the four-countynonattainment area.
Model uncertainty:A common thread throughout the modeling and WOE analyses is the uncertainty in the modeling process. While modeling is by far the best tool for evaluating proposed control strategies, it is imperative torecognize its limitations and the uncertainty in the model predictions. The photochemical model input isalmost entirely the result of other models - meteorological models, emissions models, chemistry models,forecast models - which themselves are built upon yet other models. Each component adds its ownuncertainty to the process, so that the end result is a composite of hundreds of individual uncertainties. Fortunately, photochemical grid models have proven to be fairly robust in hundreds of applications, andprovide reasonable answers under most circumstances. Nonetheless, the policy maker must be aware thatthe model can only provide general guidance for control strategy development, and cannot be expected topredict future ozone concentrations with high precision.
In the current application, the uncertainty regarding the meteorology on July 3 has already beendiscussed. Similar concerns apply to other days, although the meteorology on those days was generallysimpler and presumably modeled with a lower degree of uncertainty. Significant uncertainty also existsin the modeling inventory. Recent improvements in biogenic emissions modeling have reduced greatlythe uncertainty in that very important sector, but of course have not eliminated it. The constructionequipment inventory is another area which is suspect, since the emissions on a per capita basis are almosttriple the corresponding emissions in the Los Angeles air basin. A study of construction equipmentemissions currently being conducted in the Houston area may help refine the DFW area emissions. Comparisons of ambient VOC/NOx ratios with the emissions inventory indicate that the modelinginventory may have a deficit of VOC, an excess of NOx, or both. The impending arrival of MOBILE6may change significantly the on-road mobile source emissions, and may affect the reductions modeled forvarious I/M strategies.
The uncertainties in the modeling process are inevitably reduced over time, but will never be entirelyeliminated. Thus, controls must be implemented before it is possible to judge their impact with as muchprecision as we would like. The WOE process allows for a middle ground, where a reasonable controlpackage is sufficient to demonstrate probable attainment.
New Emissions Data
At the adoption hearing for this SIP, representatives of the construction industry presented data indicatingthat the construction equipment emissions for DFW may be smaller than previously assumed. Thecontractor who developed the DFW emissions based on survey work completed in the Houston area hadmade several conservative assumptions while developing the DFW emission estimates. Since the timethat the revised construction equipment emissions were first presented to the commission (andincorporated into the Base 6 base case), the contractor has collected additional data which indicates thatthe construction equipment NOX emissions are actually 4.6 tons/day lower than the emissionsincorporated in Base 6a. This revision would be expected to lower even further the modeled 2007 peakozone levels and future design value.

6-45DFW Attainment Demonstration
6.4 PROTOCOL FOR IMPLEMENTING THE ENERGY EFFICIENCY PROGRAM (New)
The commission is proposing that the development of the energy efficiency program be incorporated intothe DFW SIP. The Texas Legislature anticipated the need for air quality improvement programs andinitiated both energy efficiency measures and the TERP program through legislation. The commissionseeks to continue the development of these programs to demonstrate progress in reducing NOx emissions.
Energy efficiency measures are a critical part of the commission’s plan for clean air. Not only do theydecrease NOx emissions, they also produce significant reductions in other criteria pollutants such as PM,SO2, VOC, CO, and CO2. When combined, various efficiency measures have the potential to add up tosignificant energy savings as well as emission reductions, thereby contributing to the overall goal of cleanair in Texas.
The primary benefit of energy efficiency is its ability to decrease the demand for electrical generation,which provides for greater reliability, with the secondary benefit being emission reductions. However,one significant challenge is how to allocate the emission reductions on a geographic basis. Since Texas’electricity needs are primarily served by an isolated power grid controlled by the Electric ReliabilityCouncil of Texas (ERCOT), this issue can be overcome.
The Texas Legislature anticipated the need for energy efficiency programs in Texas and passed legislationto initiate such programs. The 76th Texas Legislature passed Senate Bill 7 which included, among otherthings, a commitment to improving air quality through an energy efficiency mandate to offset futuregrowth in the demand of energy production. The details of this plan are set out in Chapter 25 of thePublic Utility Commission of Texas’ rules, which require at least a 10% reduction of electric utility’sgrowth in demand by January 1, 2004 and each year thereafter. These reductions can be achieved throughenergy efficiency measures or by utilizing renewable energy, such as wind power. The 77th TexasLegislature passed Senate Bill 5 which requires each political subdivision to establish a goal to reduceelectricity consumption by five percent each year for five years, beginning January 1, 2002, with anannual report submitted to the State Energy Conservation Office demonstrating these reductions. To meetthe goals set forth by the Texas Legislature, political subdivisions may develop municipal planningrequirements, energy efficiency performance standards, home energy rating programs, and Energy Starprograms. The bill also provides for a grant program to be administered through the PUC to providefinancial incentives for energy efficiency measures. Furthermore, SB 5 establishes new building coderequirements for all new construction statewide.
The energy savings resulting from the SB 7 and SB 5 measures are expected to achieve reductions of NOx
emissions from electricity generators. This proposed SIP estimates county-wide NOx reductions withinthe ERCOT territory. The EPA’s Office of Atmospheric Programs, in coordination with the TCEQ,ERCOT and PUC, has developed a methodology for quantifying NOx emission reductions resulting fromenergy savings due to energy efficiency measures. The inputs consider the amount of expected energysavings (kWh) in different areas of the state above what is expected in the baseline. The outputs are anestimate of the emission reductions at each plant within the ERCOT region, which can be summed foreach county. Using Matrix Algebra, Power Control Area Generation and Interchange Data are combinedinto simultaneous equations to determine how much of each power control area’s generation is directed toeach power control area. This is the first step in quantifying emission reductions associated with energyefficiency measures. The commission plans to refine the analysis of these reductions as part of the mid-course review process. Furthermore, the commission is soliciting comments on the management of thisprogram in other regions of Texas, the incorporation of this program into the cap and trade program, and

6-46DFW Attainment Demonstration
solutions to any other unresolved issues. Appendix A of the proposal details the methodology throughwhich the emission reductions were estimated.
The proposed tonnage associated with energy efficiency measures is based on the most recent availablegiven inputs. The commission expects the inputs to be updated prior to adoption if more informationbecomes available. The change in inputs will result in a change in the tonnage. In an attempt to enhancethe energy efficiency program in terms of potential emission reductions, particularly since thosereductions can now be quantified, the commission encourages interested parties to develop additionalprograms that utilize energy efficiency measures.

6-47DFW Attainment Demonstration
Figure 6.3-1

6-48DFW Attainment Demonstration
6.3-2

6-49DFW Attainment Demonstration
6.3-3

7-1DFW Attainment Demonstration
CHAPTER 7: FUTURE ATTAINMENT PLANS
The commission will perform a mid-course review and submit the results to EPA by May 1, 2004. Thiseffort will involve a thorough evaluation of all modeling, inventory data, and other tools and assumptionsused to develop the attainment demonstration. However, the mid-course review will not relate monitoredambient ozone measurements to the effectiveness of the overall control strategy, since the key strategiescrucial to attainment probably will not have been implemented by that time. Although NOx emissionswill begin to decrease in the 2001/2002 time frame, these reductions may not result in lowered monitoredozone levels until the 2005/2006 time frame, considering the time needed to implement point, on-roadmobile, and non-road mobile source controls.
One aspect of the mid-course review involves an intensive field study planned for the summer of 2000,which will improve understanding of the physical processes leading to high ozone concentrations in EastTexas and particularly along the Gulf Coast. Together with improvements to the emissions inventory, theresults of this study will provide part of the scientific basis for reassessing the ozone problem in the DFWozone nonattainment area. The commission plans to perform new modeling after the appropriate qualityassurance and analysis of the field study and inventory data are completed. New modeling results may beexpected in 2003, at which time the commission would be able to re-evaluate the control strategies for thearea. Completing the mid-course review in late 2003 and taking it through the proposal, hearing, andadoption process in early 2004 would allow the mid-course review SIP revision to be submitted to EPAby May 1, 2004.
The commission commits to continue working with EPA and the DFW regional stakeholders in an open,public consultative process to ensure that the mid-course review is a comprehensive and thoroughevaluation.
EPA is expected to release MOBILE6, an enhanced version of its mobile source model, by Fall 2000.Application of MOBILE6 to the DFW inventory will likely change the on-road mobile source emissionsinventory, and hence the motor vehicle emissions budget (MVEB) used for transportation conformitypurposes.
The commission commits to perform new mobile source modeling, using MOBILE6, within 24 months ofthe model’s release. In addition, if a transportation conformity analysis is to be performed between 12months and 24 months after the MOBILE 6 release, transportation conformity will not be determineduntil Texas submits a MVEB which is developed using MOBILE 6 and which the EnvironmentalProtection Agency finds adequate. The NCTCOG and the Department of Transportation have beeninformed of these commitments.