revisions in the current population survey effective ... · revisions in the current population...
TRANSCRIPT

Revisions in the Current PopulationSurvey Effective January 1994
Sharon R. Cohany, Anne E. Polivka, and Jennifer M. Rothgeb
A major redesign of the Current Population Survey(CPS) was implemented in January 1994. The primaryaim of the redesign was to improve the quality of the dataderived from the survey by introducing a new question-naire and modernized data collection methods. Thisarticle discusses the major features of the new question-naire and collection methods and compares the estimatesderived under the former and new procedures.' The articlealso describes the introduction of new population controlsbased on the 1990 census adjusted for the estimated popu-lation undercount. (The effects of the redesign and othersurvey changes on the publication of data are discussed inthe companion article, "Revisions in the Presentation ofData in Employment and Earnings," in this issue.)
Redesign of the Current PopulationSurvey
BackgroundA monthly survey of some 60,000 households, the CPS
is conducted by the Bureau of the Census for the Bureau ofLabor Statistics. Since its inception in 1940, the CPS hasbeen the primary source of information on the employed,the unemployed, and persons not in the labor force.
Prior to the recent redesign, the survey questionnairehad been virtually unchanged for nearly three decades.The last major revisions were made in 1967.2 Since thattime, problems with the questionnaire in measuring cer-tain labor market concepts were identified. Also, the Na-tion's economy and society underwent major shifts. Forinstance, there has been tremendous growth in the numberof service-sector jobs, while the number offactory jobs hasdeclined sharply as a share of overall employment. Otherchanges include the more prominent role of women inthe work force and the growing popularity of alternative
Sharon R. Cohany is an economist in the Division of Labor Force Sta-tistics and Anne E. Polivka is an economist in the Office of Research andEvaluation, Bureau of Labor Statistics. Jennifer M. Rothgeb is a socialscience statistician in the Center for Survey Methods Research, Bureau ofthe Census. The sections relating to the 1990 census-based populationcontrols were co-authored by Shail J. Butani, Janice Lent, Edwin L. Robi-son, and Michael E. Welch of the Statistical Methods Division, Bureau ofLabor Statistics, and Frederick W. Hollman of the Population Division,Bureau of the Census.
work schedules. These changes raised issues which werenot being fully addressed with the old questionnaire. In ad-dition, there had been major advances in survey researchmethods and data collection technology. Spurred by all ofthese developments, work by BLS and the Bureau of theCensus began in the mid-1980's to redesign the CPS to bet-ter capture the dynamics of the contemporary labor mar-ket, while incorporating recent advances in data collectiontechnology .
The redesign of the questionnaire had four main objec-tives: 1) To measure the official labor force concepts moreprecisely, 2) to expand the amount of data available, 3) toimplement several definitional changes, and 4) to adopt acomputer-assisted interviewing environment.
Beginning in 1988, BLS and the Bureau of the Censusconducted a number of research projects to guide the de-velopment of a new CPS questionnaire. Alternative ver-sions of the questionnaire were developed, based on boththis research and recommendations made in 1979 by theNational Commission on Employment and Unemploy-ment Statistics, also known as the Levitan Commission.'The various questionnaire alternatives were tested in 1990and 1991 in two phases, using centralized computer-assisted telephone interviewing (CAT!) with a sample ofhouseholds selected through random digit dialing (RDD)techniques. The results of both of these experimentalphases were used in the development of the final revisedquestionnaire.
The new version was then tested extensively in a nation-al sample survey, which ran parallel to the CPS from July1992 to December 1993. This article compares data fromthis "parallel survey" with results from the official CPS us-ing 1993 annual averages, in order to gauge the effects ofthe new questionnaire and computer-assisted data collec-tion on the estimates.
1 For additional information on the background of the CPS redesign,see "Questions and Answers on the Redesign of the Current PopulationSurvey," available from BLS, and three articles published in the Septem-ber 1993 Monthly Labor Review under the heading "Overhauling the Cur-rent Population Survey." A comprehensive bibliography is available fromBLS upon request.
2 See Robert L. Stein, "New Definitions for Employment and Unem-ployment," Emtioyment and Earnings, February 1967.
3 National Commission on Employment and Unemployment Statis-tics, Counting the Labor Force, 1979.
13

ComputerizationThe new questionnaire was designed for a computer-
assisted interview. In most cases, interviewers conduct thesurvey either in person at the respondent's home or by tele-phone from the interviewer's home, using laptop comput-ers on which the questionnaire has been programmed.This mode of data collection is known as computer-assisted personal interviewing (CAP!). Interviewers askthe survey questions as they appear automatically on thescreen of the laptop, and then type the responses directlyinto the computer. At the end of each day, interviewerstransmit the data via modem to the computer at theBureau of the Census headquarters. A portion of samplehouseholds (expected to reach about 20 percent later thisyear) is interviewed via CATI, from two centralized tele-phone centers (located in Hagerstown, Maryland andTucson, Arizona) by interviewers who also use a comput-erized questionnaire.
Computer-assisted interviewing has important benefits,most notably:
Consistency. In a survey such as the CPS, consistency frominterview to interview is essential for data quality. Auto-mation facilitates the use of a relatively complex question-naire, incorporating complicated skip patterns and stan-dardized followup questions. Yet, certain questions areautomatically tailored to the individual's situation tomake them more understandable to the respondent.
Editing. The computerized questionnaire has several built-in editing features, including automatic checks for internalconsistency and unlikely responses. In this way, some po-tential errors can be caught and corrected during the inter-view itself.
Dependent interviewing. An automated interview also per-mits dependent interviewing, that is, the use of informa-tion in the current interview that was obtained in a pre-vious month's interview. Dependent interviewing reducesrespondent and interviewer burden, while improving con-sistency of the data from one month to the next. The tech-nique is being used to confirm the previously reported oc-cupation and industry of a person's job and, for many peo-ple not in the labor force, to confirm their status as retiredor disabled. If it is determined that there has been nochange in the information which was supplied in the earli-er interview, no further questions on the topic are asked. If,however, the information which was previously suppliedhas changed, the respondents are asked to provide the up-dated information. In a somewhat different form of depen-dent interviewing, persons' duration of unemployment isasked in the first month they are reported as unemployed,and this information is automatically updated by either 4or 5 weeks if they remain unemployed in the subsequentmonth.
It should be noted that the new questionnaire was de-signed for computer-assisted interviewing. Given the
14
complexity of the skip patterns and the use of dependentinterviewing, it would be nearly impossible to administerthe new survey using a paper-and-pencil questionnaire. Infact, there is no operational paper version of the new ques-tionnaire.
Major Questionnaire Changes
Enhanced accuracyUnlike the 1967 revision, whose major purpose was to
sharpen the definition of unemployment, the emphasis ofthe 1994 redesign was to improve the overall quality of la-bor market information through extensive questionchanges and the introduction of computers into the collec-tion procedures. The redesign was also undertaken to ob-tain data on topics not previously or adequately covered.
While the labor force status of most people is straight-forward, some are more difficult to classify correctly, espe-cially if they are engaged in activities that are relatively in-formal or intermittent. Many of the changes to the ques-tionnaire were made to deal with such cases. This was ac-complished by rewording and adding questions to con-form more precisely with the official definitions, makingthe questions easier to understand and answer, minimizingreliance on volunteered responses, revising response cate-gories, and taking advantage of the benefits of an auto-mated interview. Areas affected by these improvementsinclude:
Reference week. Many questions refer to activities "lastweek," but in the former questionnaire the time period wasnever defined. Research found that fewer than 20 percentof respondents defined the reference week as it is meant inthe survey, that is, from Sunday to Saturday of the weekincluding the 12th day of the month. The new question-naire provides respondents with the specific dates of thereference week.
On layoff. Persons on layoff are defined as those who areseparated from a job to which they are awaiting recall. Theold questionnaire, however, was not structured to consis-tently obtain information on the expectation of recall. Thiswas a particular problem since, in common parlance, theterm "layoff" has come to refer to a permanent termina-tion rather than the temporary situation that BLS and theCensus Bureau are trying to measure.
In order to measure layoffs more accurately, questionswere added to determine if people reported to be on layoffdid in fact have an expectation of recall- that is, had theybeen given a specific date to return to work or, at least, hadthey been given an indication that they would be recalledwithin the next 6 months. Also, a direct question aboutlayoff replaced a long and cumbersome question aboutboth layoff and absence from work.
Jobsearch methods. To be counted as unemployed, a per-son must have engaged in an active job search during the 4

weeks prior to the survey, that is, must have taken someaction that could result in a job offer. In addition to con-tacting employers directly, active jobsearch methodsinclude answering want ads, sending out resumes, andcontacting private or public employment agencies. On theother hand, passive methods, such as taking a class orsik ply reading the want ads, do not qualify as a jobsearch.To allow interviewers to better distinguish between activeand passive methods, the response categories for jobsearchmethods were expanded and reformatted. Also, the basicquestion on jobsearch methods was reworded andfollowup questions were added to encourage respondentsto report all types of jobsearch activity.
Hours at work. Research showed that, when asked abouttheir actual hours at work, some respondents providedtheir scheduled or usual hours instead. To improve theaccuracy of these data, the series of questions on hoursworked was reordered to incorporate a recall strategy,which asks for usual hours first, then about possible timetaken off or extra hours worked during the reference week,and finally about hours actually worked.
Reasons for working part time. Persons who work parttime (fewer than 35 hours a week) do so either voluntarily(that is, because of personal constraints or preferences) orinvoluntarily (that is, because of business-related reasonssuch as slack work or the lack offull-time opportunities).Because respondents typically are not familiar with thisdistinction, the question asking why those working parttime were doing so was reworded to provide examples ofthe two types of reasons. More importantly, the measure-ment of working part time involuntarily (or for economicreasons) was modified to better reflect the concept. Start-ing in 1994, workers who are part time for economic rea-sons must want and be available for full-time work. Indi-viduals who usually work part time for an economic rea-son are asked direct questions to determine if they meetthese criteria; those usually working full time are assumedto meet them.
Occupation and industry. Research has shown that the for-mer system of asking questions on occupation, industry,and class of worker independently each month led to anoverreporting of month-to-month change. The accuracyof these data will benefit significantly from the use of de-pendent interviewing, with most respondents being askedto supply this information only in the initial interview. Insubsequent months, they are asked merely to verify the in-formation that had been reported earlier regarding theiremployer, occupation, and usual activities on the job. If nochanges have taken place, no further questions are askedand the information is simply carried forward. If changesin the job situation have occurred, the series of questionsthat was asked in the previous month is asked again.
Unpaid family workers. The definition of employment in-cludes persons who work without pay for at least 15 hoursa week in a business or farm owned by a member of theirimmediate family. To better measure the extent of work insuch businesses, the new questionnaire-has a direct ques-tion on the presence of a business in the household. Per-sons in households with a business who are not otherwiseemployed are specifically asked if they worked in thebusiness.
Earnings. With the former questionnaire, respondentswere asked to report their earnings as a weekly amount,even though that may not have been the easiest way to re-call or report their earnings. In the new version, respon-dents are asked to report earnings in the time frame whichthey find easiest, for example, hourly, weekly, biweekly,monthly, or annual. Weekly earnings are automaticallycalculated for persons who respond on a basis other thanweekly. Also, individuals are asked a specific question todetermine if they usually receive overtime pay, tips, orcommissions. For minimum wage studies, all earners areasked if they are, in fact, paid at hourly rates.
New dataThe questionnaire redesign also makes it possible to
collect several types of data regularly for the first time,namely:
Multipe jobholding. Employed persons are now askedeach month whether they had more than one job. This al-lows BLS to produce estimates of multiple jobholding on amonthly basis, rather than having to derive them throughspecial, periodic supplements. The inclusion of the multi-ple jobholding question also enhances the accuracy of an-swers to the questions on hours worked, and it may help toreconcile employment estimates from the CPS with thosefrom the Current Employment Statistics program, BLS'survey of nonfarm business establishments.
Usual hours. All employed persons are asked each monthabout the hours they usually work. Previously, informa-tion on usual hours was collected from just one-quarter ofwage and salary workers each month.
Definitional changesAs part of the redesign, several labor force defmitions
were modified, specifically:
Discouraged workers. This was the most importantdefini-tional change implemented. The Levitan Commission hadcriticized the former definition, because it was based on aSUbjective desire for work and on somewhat arbitrary as-sumptions about an individual's availability to take a job.As a result of the redesign, two requirements were added:For persons to qualify as discouraged, they must have en-gaged in some job search within the past year (or since theylast worked if they worked within the past year), and theymust be currently available to take a job. (Formerly, avail-
15

ability was inferred from responses to other questions;now there is a direct question.) Discouraged workers arenow defined as persons who want a job, are available to takea job, and who had looked for work within the past year butnot within the prior 4 weeks because they believed theirsearch would be futile. Specifically, their main reason fornot recently looking for work was one of the following: Be-lieves no work available in line of work or area; couldn't findany work; lacks necessary schooling, training, skills or expe-rience; employers think too young or too old; or other typesof discrimination. Also, beginning in January 1994, ques-tions on this subject are asked of the full CPS sample ratherthan being limited to a quarter of the sample, permittingestimates of the num ber of discouraged workers to be pub-lished monthly (rather than quarterly).
Unemployment. A relatively minor change was incorpo-rated into the definition of unemployment. Under the for-mer definition, persons who volunteered that they werewaiting to start a job within 30 days (a very small groupnumerically) were classified as unemployed, whether ornot they were actively looking for work. Under the newdefinition, people waiting to start a new job are no longerautomatically counted as unemployed. Rather, they musthave actively looked for a job within the last 4 weeks inorder to be counted as unemployed. Otherwise, they willbe classified as not in the labor force. Thus, beginning inJanuary 1994, the unemployed are defined as persons 1)without jobs; 2) actively seeking work, or on layoff from ajob and expecting recall (who need not be seeking work toqualify); and 3) currently available to take a job (includingtemporary illness).
New entrants and reentrants. Unemployed persons whowere not working just before their jobsearch commencedare classified as either new entrants or reentrants (to thelabor force). Prior to 1994, new entrants were defined asjob seekers who had never worked at a full-time job lasting2 weeks or longer; reentrants were defined as jobseekerswho had held a full-time job for at least 2 weeks and hadthen spent some time out of the labor force prior to theirmost recent period of jobsearch. These definitions havebeen modified to encompass any type of job, not just a full-time job of at least 2 weeks duration. Thus, new entrantsare now defined as jobseekers who have never worked atall, and reentrants are jobseekers who have worked before,but not immediately prior to their jobsearch.
Full-time and part-time workers. The classification of full-and part-time workers is now based completely on theirusual weekly hours worked. In the past, due to limitationsin the questionnaire, persons who worked full time in thereference week were not asked about their usual hours.Rather, they were assumed to work full time on a usual
16
basis and classified as full-time workers. In the revisedquestionnaire, all workers are asked the number of hoursthey usually work, and are classified accordingly.
The Darallel SurveyAs mentioned above, the new computerized question-
naire was tested in a parallel survey, also known as the. "CATI/CAPI Overlap." The parallel survey was ad minis-
tered to approximately 12,000 households per month for18 months, from July 1992 to December 1993. The surveyhad several objectives, including testing the complex pro-gramming of the questionnaire, breaking in computerizeddata collection and transmission operations, and measur-ing differences in major labor force estimates between theold and new surveys. Since a lack of funding prevented theadministration of the former questionnaire in a CAP! en-vironment and since the new questionnaire's complexityprevented its administration on paper, the effects of com-puter-assisted data collection on the labor force estimatescannot be completely isolated from the effects of changesin question wording and sequence.
The parallel survey was a nationally representative sur-vey, in which all of the largest metropolitan areas were in-cluded and the remaining areas were sampled on a proba-bility basis.' The parallel survey had the same rotationschedule as the CPS, that is, households were interviewedfor 4 months, left the ~mple for the next 8 months, andthen were interviewed for another 4 months.
When comparing estimates derived from the parallelsurvey with official CPS estimates, it should be recognizedthat the parallel survey was based on a national sample, incontrast with the State-based sample design of the CPS.Moreover, the sample of the parallel survey was just one-fifth the size of the CPS sample. This means that its esti-mates have greater variance, particularly those for smallgroups, which are based on relatively few sample mem-bers.
The data compared in this article are 1993 annual aver-ages. There were, of course, month-to-month fluctuations,especially in the parallel survey, which are mini-mized using averages of 12 months of data. For example,the overall unemployment rate from the parallel survey forthe 12-month period under study (January-December1993) averaged 0.5 percentage point higher than the ratefrom the CPS, compared with monthly differences rangingfrom 0.1 to 0.7 percentage point.
Comparisons Between CPS and ParallelSurvey Estimates
The following analysis describes differences in labormarket estimates between the official CPS and the parallelsurvey for 1993. This includes highlights of the major
1The sample design of the parallel survey was based on that used by theNational Crime Victimization Survey (NCVS), which is conducted by theBureau of the Census for the Bureau of Justice Statistics.

differences as well as sections on the employed, unem-ployed, persons in the labor force, and persons not in thelabor force.
Explanations for observed differences in the estimatesare suggested whenever possible. It is important to note,however, that given the sweeping changes to the survey, itis impossible to completely disentangle the underlyingcauses behind the differences. In general, only differencesthat are statistically significant at the 90-percent confi-dence level are discussed. Confidence intervals for majorestimates are shown in table 1. Standard errors for esti-mates in all other tables are available from BLS upon re-quest. In order to maintain comparability with parallelsurvey results, the CPS estimates used in this article werenot subjected to the compositing procedure, and as a resultmay not always agree with published estimates+
Highlights of findingsThe following are highlights of the study comparing
data from the parallel survey (using the revised question-naire and automated collection) with the CPS (using theformer questionnaire and procedures) for 1993.
• The national unem ployment rate as estimated by theparallel survey was higher than the rate obtained by theCPS. This difference averaged 0.5 percentage point (table1). As shown in table 2, the measured effect was relativelylarger for women than for men. The parallel survey alsomeasured more unemployment among teenagers and old-er workers (65 years and over).
• The overall proportion of the population that wasworking-the employment-population ratio-was essen-tially the same in the parallel survey and the CPS. Howev-er, there were marked differences by gender. For men, theratio was lower in the parallel survey than in the CPSj forwomen the ratio based on the parallel survey was higher.
• The labor force participation rate was estimated tobe higher in the parallel survey than in the CPS. Again,there were significant differences by gender: The percent-age for men was lower in the parallel survey while the ratefor women was higher.
EmploymentAs stated above, overall estimates of employment dif-
fered little between the parallel survey and the CPS. Theemployment-population ratio was 61.8 percent in the par-allel survey, statistically indistinguishable from the 61.7percent using the CPS. This similarity in the aggregate ra-tio, however, masks significant differences by gender. Theratio for women was higher in the parallel survey than inthe CPS - 54.9 versus 54.2 percent - while for men themeasure from the parallel survey was lower - 69.3 versus
5 Compositing is an estimation procedure which reduces variability inestimates, especially of month-to-month change. For a detailed explana-tion, see "Estimating Methods" under the Household Data section of theExplanatory Notes and Estimates of Error in this publication.
69.9 percent. (See table 2.)There are several questionnaire changes which may
have contributed to higher estimates of employmentamong women. Many of the revisions to the new question-naire were made to capture labor force activity more com-pletely, especially that of a more irregular or informal na-ture. To this end, key questions on work activity were re-worded. (See exhibit A.) For example, the question askingabout work was changed from" Did you do any work at allLAST WEEK, not counting work around the house?" to"LAST WEEK, did you do ANY work for pay?" Somerespondents to the former questionnaire may have failedto report work activities if their activities were part time,intermittent, or perhaps even if they were home-based.The revised question communicates more clearly to the re-spondent that the survey uses an inclusive definition ofwork, to encompass any work for pay.
Indeed, the entire context of the interview must be con-sidered. The labor force portion of the former CPS inter-view began with the following question: "What were youdoing most of LAST WEEK (Working, keeping house, go-ing to school, or something else)?" This question, original-ly introduced as an "icebreaker," has been criticized onseveral grounds. For one, we really don't want to knowwhat a person was doing most of last week (the answer tothat might be something unrelated to labor force activity),but rather whether a person worked at all last week. Thephrase "most of last week," moreover, may have beenindi-eating to some respondents that the interest of the surveywas in full-time, "regular" employment and not in part-time or intermittent work.
Another difficulty with the former opening question wasthat interviewers were instructed to tailor it depending onthe person's apparent situation. For a person (typically awoman) who appeared to be a homemaker, the questioncould be phrased, "What were you doing most of lastweek - working, keeping house, or something else?" For ayoung person, the question could be tailored to read, "Whatwere you doing most of last week- working, going toschool, or something else?"The "working" option was notalways offered. Everyone else was asked, "What were youdoing most of last week - working or something else?" It isnot known to what extent these procedures werefollowed; however, the instructions for tailoring pro-vided the potential for bias and may have cast doubton the intent of the survey to capture all labor forceactivity.
In the new questionnaire, none of the questions is cus-tomized on the basis of the appearance of respondents.Thus, for example, after an opening question (asked oncefor the entire household) on the presence of a business orfarm, everyone is asked whether he or she did any work forpay, clearly setting the tone that this is a survey in whichlabor force activity is the sole interest. Also, the new ver-sion systematically asks about employment in family busi-
17

Table 1. Employment status of the population for selected labor force groups using 1980 census-based population estimatesfrom the CPS and the parallel survey, 1993 annual averages
(Numbers in thousands)
ParallelDifference
Employment status and group CPS1 surveyLevel Error at 1.6 sigma2
TOTAL
Civilian noninstitutional population • •••••• o •••••• 193,550 193,550 0 0Civilian labor force .......................... 128,103 128,965 862 642
Percent of population .................. ,. 66.2 66.6 .4 .3Employed .............. ,.,. " ...... " ... 119,389 119,606 217 696
Employment-population ratio .............. 61.7 61.8 .1 .4Unemployed •••••• , •••• 0 •••••••• , ••••• , •• 8,714 9,359 645 278
Unemployment rate ...................... 6.8 7.3 .5 .2
Men, 20 years and over
Civilian noninstitutional population ....... ,., .... 85,906 85,850 ·56 0Civilian labor force .......................... 66,077 65,599 -478 354
Percent of population ..... , ............. , 76.9 76.4 -.5 .4Employed ...... , ... , ............... , ... , 61,884 61,283 -601 381
Employment-population ratio .............. 72.0 71.4 -.6 .4Unemployed ................... '" , ...... 4,193 4,316 123 189
Unemployment rate ...................... 6.4 6.6 .2 .3
Women, 20 years and over
Civilian noninstitutional population · ............. 94,389 94,361 -28 0Civilian labor force .......................... 55,184 56,162 978 486
Percent of population ................... , 58.5 59.5 1.0 .5Employed ..................... '" , ...... 51,966 52,604 638 503
Employment-population ratio .............. 55.1 55.8 .7 .5Unemployed .. , ...................... ,., .. 3,219 3,559 340 159
Unemployment rate ...................... 5.8 6.3 .5 .3
Both sexes, 16 to 19 years ••
Civilian noninstitutional populanon · ........ , .... 13,254 13,338 84 0Civilian labor force .......................... 6,842 7,203 361 178
Percent of population ....... '" '" ....... 51.6 54.0 2.4 1.3Employed ................ " ............. 5,540 5,719 179 174
Employment-population ratio .............. 41.8 42.9 1.1 1.3Unemployed ............................. 1,503 1,485 182 100
Unemployment rate ...................... 19.0 20.6 1.6 1.3
White
Civilian noninstitutional population ..... , ..... '" 163,921 163,921 0 0Civilian labor force .......................... 109,407 110,209 802 607
Percent of population ........... , ........ 66.7 67.2 .5 .4Employed ...................... , ........ 102,891 103,267 376 648
Employment-population ratio .............. 62.8 63.0 .2 .4Unemployed ...................... , ....... 6,516 6,942 426 223
Unemployment rate ............ ' .......... 6.0 6.3 .3 .2
Black
Civilian noninstitutional population .............. 22,329 22,329 0 • 0Civilian labor force .......................... 13,957 13,908 -49
,325
Percent of population .......... '" ....... 62.5 62.3 -.2 , 1.5Employed ............................... 12,148 11,923 -225 321
Employment-population ratio .............. 54.4 53.4 -1.0 1.4Unemployed ............................. 1,809 1,985 176 129
Unemployment rate ...................... 13.0 14.3 1.3 .9-----
See footnote at end of table.
18

Table 1. Employment status of the population for selected labor force groups using 1980 census-based population estimatesfrom the CPS and the parallel survey, 1993 annual averages-Continued
(Numbers in thousands)
Difference
Employment status and group CPS1 Parallelsurvey
Level Error at 1.6 sigma2
Hispanic origin
Civilian noninstitutional population .............. 15,753 15,753 O. 0Civilian labor force .......................... 10,385 10,666 281 241
Percent of population .................... 65.9 67.7 1.8 1.5Employed '0' •••••••••••••••••••••••••••• 9,285 9,412 127 268
Employment-population ratio .............. 58.9 59.7 .8 1.7Unemployed ............................. 1,100 1,254 154 97
Unemployment rate ................•..... 10.6 11.8 1.2 .9
1 These estimates differ slightly from previously published 1993averages because of the estimation procedure used.
2 Sampling error at the 90-percent confidence level.NOTE: Population estimates obtained from the two surveys will not
always agree due to slight differences in estimating procedures. Detailfor the above race and Hispanic-origin groups will not sum to totals be-cause data for the "other races" group are not presented and Hispanicsare included in both the white and black population groups.
Table 2. Employment status of the population by age, sex, race, and Hispanic origin using 1980 census-based estimates from theCPS and the parallel survey, 1993 annual averages
(Numbers in thousands)
Total Men Women
Employment status and ageParallel Differ· Parallel Differ- Parallel Differ-CPS1 CPS1 CPS1survey ence2 survey ence2 survey ence2
Civilian noninstitutionalpopulation
Total, 16 years and over .... 193,550 193,550 0 92,620· 92,620 0 00,930 100,930 016 to 19 years ............... 13,254 13,338 84 6,714 6,769 55 6,540 6,569 2920 to 24 years ............... 17,583 17,641 58 8,613 8,677 64 8,970 8,964 -625 to 34 years ............... 41,314 41,375 61 20,382 20,374 -8 20,933 21,002 6935 to 44 years ............... 40,341 40,238 -103 19,831 19,785 -46 20,510 20,453 -5745 to 54 years ............... 28,863 28,943 80 14,027 14,016 -11 14,836 14,927 9155 to 64 years ............... 21,029 21,006 -23 9,976 9,990 14 11,053 11,016 -3765 years and over ........... 31,164 31,008 -156 13,078 13,009 -69 18,086 17,999 -87
Civilian labor force
Total, 16 years and over , ... 128,103 128,965 862 69,656 69,300 -356 58,447 59,664 1,21716 to 19 years ............... 6,842 7,203 361 3,579 3,702 123 3,263 3,502 23920 to 24 years ............... 13,555 13,705 150 7,159 7,186 27 6,396 6,519 12325 to 34 years ............... 34,473 34,609 136 19,049 18,828 -221 15,424 15,782 35835 to 44 years ............... 34,274 34,287 13 18,544 18,457 -87 15,730 15,830 10045 to 54 years ............... 23,556 23,622 66 12,642 12,482 -160 10,914 11,139 22555 to 64 years ............... 11,863 11,736 -127 6,632 6,473 -159 5,231 5,262 3165 years and over •••••••• 0 •• 3,540 3,802 262 2,051 2,173 122 1,489 1,629 140
Participation rate
Total, 16 years and over .0 •• 66.2 66.6 .4 75.2 74.8 -.4 57.9 59.1 1.216 to 19 years ............... 51.6 54.0 2.4 53.3 54.7 1.4 49.9 53.3 3.420 to 24 years ............... 77.1 77.7 .6 83.1 82.8 -.3 71.3 72.7 1.425 to 34 years ............... 83.4 83.6 .2 93.5 92.4 -1.1 73.7 75.1 1.435 to 44 years ............... 85.0 85.2 .2 93.5 93.3 -.2 76.7 77.4 .745 to 54 years ............... 81.6 81.6 .0 90.1 89.1 -1.0 73.6 74.6 1.055 to 64 years ............... 56.4 55.9 -.5 66.5 64.8 -1.7 47.3 47.8 .565 years and over . . . . . . . . . . . 11.4 12.3 .9 15.7 16.7
i1.0 8.2 9.1 .9
._,.-
See footnote at end of table.
19

Table 2. Employment stJtusof:,th",opulatlon by age, sex, race, and Hispanic origin using 1980 census-based estimates from theCPS and the parallel survey, 1993 annual averages-Continued
(Numbers in thousands)
Total Men Women
Employment status and age Parallel Differ- Parallel Differ· Parallel Differ·CPS1 survey ence2 CPS1 survey ence2 CPS1 survey ence2
Employed
Total, 16 years and over .... 119,389 119,606 217 64,727 64,200 -527 54,662 55,406 74416 to 19 years ......•........ 5,540 5,719 179 2,844 2,918 74 2,696 2,802 10620 to 24 years .............. -. 12,137 12,233 96 6,354 6,386 32 5,783 5,846 6325 to 34 years ...•........... 32,119 32,099 -20 17,729 17,527 -202 14,390 14,573 18335 to 44 years ............... 32,406 32,347 -59 17,512 17,400 -112 14,894 14,947 5345 to 54 years ............... 22,444 22,431 -13 12,011 11,808 -203 10,433 10,623 19055 to 64 years ............... 11,313 11,154 -159 6,292 6,106 -186 5,022 5,048 2665 years and over ........... 3,430 3,623 193 1,986 2,057 71 1,444 1,566 122
Employment-populationratio
Total, 16 years and over .... 61.7 61.8 .1 69.9 69.3 -.6 54.2:
54.9 .7·16 to 19 years ............... 41.8 42.9 1.1 42.4 43.1 .7 41.2 42.7 1.520 to 24 years ............... 69.0 69.3 .3 73.8 73.6 -.2 64.5
•
65.2 .725 to 34 years ............... 77.7 77.6 -.1 87.0 86.0 -1.0 68.7 69.4 .735 to 44 years ............... 80.3 80.4 .1 88.3 88.0 -.3 72.6 73.1 .545 to 54 years ............... 77.8 77.5 -.3 85.6 84.3 -1.3 70.3 i 71.2 .955 to 64 years ............... 53.8 53.1 -.7 63.1 61.1 -2.0 45.4 45.8 .465 years and over ........... 11.0 11.7 .7 15.2 15.8 .6 8.0 8.7 .7
Unemployed I:
Total, 16 years and over .... 8,714 9,359 645 4,928 5,100 172 3,785 I' 4,259 47416 to 19 years ............... 1,302 1,485 183 735 784 49 567 700 13320 to 24 years ............... 1,417 1,472 55 805 800 -5 613 673 6025 to 34 years ............... 2,354 2,511 157 1,320 1,301 -19 1,034 1,210 17635 to 44 years ............... 1,868 1,940 72 1,033 1,057 24 835 883 4845 to 54 years ............... 1,112 1,190 78 631 675 44 482 516 3455 to 64 years ............... 550 581 31 341 367 26 209 214 565 years and over ........... 110 180 70 65 116 51 45 63 18
Unemployment rate
Total, 16 years and over .... 6.8 7.3 .5 7.1 7.4 .3 6.5 7.1 .616 to 19 years ............... 19.0 20.6 1.6 20.5 21.2 .7 17.4 20.0 2.620 to 24 years ............... 10.5 10.7 .2 11.2 11.1 -.1 9.6 10.3 .725 to 34 years ............... 6.8 7.3 .5 6.9 6.9 .0 6.7 7.7 1.035 to 44 years ............... 5.5 5.7 .2 5.6 5.7 .1 5.3 5.6 .345 to 54 years ............... 4.7 5.0 .3 5.0 5.4 .4 4.4 4.6 .255 to 64 years ............... 4.6 5.0 .4 5.1 5.7 .6 4.0 4.1 .165 years and ever ........... 3.1 4.7 1.6 3.2 5.4 2.2 3.0 3.9 .9
1 These estimates differ slightly from previously published 1993averages because of the estimation procedure used.
2 These differences may not equal the results obtained from comparingthe values shown in the table because of independent rounding.
NOTE: Population estimates obtained from the two surveys willnot always agree due to slight differences in estimating procedures.
20

EXHIBIT A. COMPARISON OF'KEYEMPLOYMENT AND UNEMPLOYMENTQUESTIONS
CPS
1. What were you doing most of LAST WEEK -
(working or something else?)
(keeping house or something else?)
(going to school or something else?)
If answer indicates "with a job, but not at work"(either temporarily or on layoff), ask 2, and if 2 is"no" ask 4.1f answer indicates "working," skip 2.All others, ask 2.
2. Did you do any work at all LAST WEEK, notcounting work around the house? (Note: If farmor business operator in household, ask aboutunpaid work.)
3. Did you have a job or business from which youweretemporarily absent or on layoff LASTWEEK?
If "no," ask 5. If "yes," ask 4.
4. Why were you absent from work LAST WEEK?
5. Have you been looking for work during the past 4weeks?
If "yes," ask 6.
6. What have you been doing in the last 4 weeks tofind work?
PARALLEL SURVEY
1. Does anyone in this household have a businessor a farm?
2. LAST WEEK, did you do ANY work for (either)pay (or profit)?
Parentheticals in question filled in if anyone in thehousehold has a business or farm.
!f 1 is "yes" and 2 is "no," ask 3.
3. LAST WEEK, did you do any unpaid work in thefamily business or farm?
If 2 and 3 are both "no," ask 4.
4. LAST WEEK, (in addition to the business,) did youhave a job, either full or part time? Include anyjob from which you were temporarily absent.
Parenthetical in question filled in if anyone in thehousehold has a business or farm.
If 4 is "no," ask 5.
5. LAST WEEK, were you on layoff from a job?
If 5 is "yes," ask 6. 115 is "no," ask 8.
6. Has your employer given you a date to return towork?
If "no," ask 7.
7. Have you been given any indication that you willbe recalled to work within the next 6 months?
If "no," ask 8.
8. Have you been doing anything to find work duringthe last 4 weeks?
If "yes," ask 9.
9. What are all of the things you have done to findwork during the last 4 weeks?
21

nesses and farms, where much of the previously "missingemployment" seems to have taken place.
The series of questions on work in the former question-naire may have also led to an overstatement of men's labormarket activity, which was concentrated among men whowere reported as having a job but absent from work. Thisis discussed in the section on characteristics of theemployed.
UnemploymentThe new questionnaire (including the new collection
procedures) yielded an overall unemployment rate half apercentage point higher than the CPS, 7.3 percent com-pared with 6.8 percent for the period January to December1993. But, as with the employment-population ratio, thisstatistic hides variations among worker groups. Namely,the higher incidence of unemployment was statisticallysignificant only for women, workers 65 years and O~i',and teenagers. The difference for men (0.3 percentagepoint higher in the parallel survey) was close to being sta-tistically significant.
The new questionnaire had a relatively large effect onwomen's unemploymentrate, which was 7.1 percent in theparallel survey compared with 6.5 percent based on theCPS. Unemployment in the parallel survey increased forboth white women and black women. Among age groups,teenagers and workers 65 years and over had higher joblessrates in the parallel survey. The difference for the25-to-34-year-old category was also statistically signifi-cant.
There are several differences between the old paperquestionnaire and the revised automated questionnairewhich could help to explain the higher unemploymentrates obtained by the parallel survey. Part of the explana-tion is consistent with that given in the section on theemployed. That is, the new questionnaire has a broaderapproach to both work and jobsearch activities, due atleast in part to different messages communicated at thebeginning of the survey. This could help to explain thehigher unem ployment rates among women, teenagers, andolder workers, who are more likely to be looking forinformal employment.
Also, older people in the new questionnaire who initiallyreport that they are retired are asked, "Do you want a jobeither full or part time?" If they answer yes, they are askedthe questions on jobsearch for potential classification asunemployed. The "part-time" reference may prompt someolder workers to recall that they have looked for such a job.
Another part of the explanation for the differences re-lates to persons initially reported to be temporarily absentfrom jobs. It appears that a larger proportion of personsare reported as temporarily absent with the new question-naire but are not classified as such because, when asked toprovide a reason for their absence, they report they were"on layoff" or they cite "slack work/business conditions."
22
Such responses disqualify persons from being classified asemployed and move them into the layoff/ jobseeking ques-tion series.
A third part of the explanation is the direct question onlayoff. Research has indicated that the former question onlayoff was frequently misunderstood. The new direct ques-tion on layoff and a revised question on the reasons forabsence produce a larger proportion of persons reported(but not classified) as on layoff in the parallel survey thanin the CPS. When the criterion of expectation of recall isapplied, nearly 60 percent of those initially reported to beon layoff are eliminated from this category. They are thenrouted to the series of questions on jobseeking, and, if theyhave an active jobsearch (which about half do), and areavailable to work, they will be counted among the unem-ployed.
It appears that, with the revised questions, a number ofwomen are initially reported to be on layoff, although theyhad no expectation of recall. They do, however, meet therequirement of active jobsearch and thus were counted asunemployed. It is unknown how such persons would haveresponded to the previous questionnaire. The new ques-tions, however, communicate a different message at thestarloftheinterview which maybe prompting more wom-en to report a layoff status and an active jobsearch, result-ing in a higher unemployment rate.
Characteristics of the employed
Multiple jobholding. About 6.2 percent of all employedpeople held two or more jobs during the fourth quarter of1993, according to findings from the parallel survey."
As a result of the redesign, information on multiple job-holding is available each month; previously, this informa-tion had been obtained only in periodic supplements to theCPS. While truly comparable data are not available fromthe regular CPS, the most recent supplement, conductedin May 1991, also showed a multiple jobholding rate of 6.2percent.
Hours of work. Hours actually worked were somewhatlower as estimated in the parallel survey compared withthe CPS. Mean (average) hours for workers in nonagricul-tural industries were 38.9 per week with the new question-naire, compared with 39.4 using the former questionnaire.The pattern held for both adult men and adult women.(See table 3.)
These findings reflect several changes to the question-naire which were made to obtain more accurate informa-tion on hours worked per week. A recall strategy wasembedded in the series of questions, asking first about
6 Due to processing problems, data on multiple jobholding are notavailable for the first 9 months of 1993. The data presented here areOctober-December 1993 averages.

\
Table 3. Persons at work In nonagrlcultural'lndustrles by actual hours of work, sex, and age using 1980 census-based populationestimates from the CPS and the parallel survey, 1993 annual averages
,.Thousands of persons Percent distribution
Hours of work,Differ- Parallelsex, and age Parallel
CPS1 Differ-CPS1 survey ence2 survey ence2
TOTAL
Total at work ......................... 110,488 111,225 737 100.0 100.0 -1 to 34 hours ........................... 26,954 29,563 2,609 24.4 26.6 2.2
1 to 14 hours ........................ 5,130 6,066 936 4.6 5.5 .815 to 29 hours ....................... 13,410 14,475 1,065 12.1 13.0 .930 to 34 hours ....................... 8,414 9,021 608 7.6 8.1 .5
35 hours and over •• 0 ••••••••••••••••••• 83,535 81,663 -1,872 75.6 73.4 -2.235 to 39 hours ....................... 7,176 8,534 1,357 6.5 7.7 1.240 hours ............................ 42,523 38,717 -3,806 38.5 34.8 -3.741 to 48 hours ....................... 11,528 13,684 2,157 10.4 12.3 1.949 to 59 hours ....................... 13,004 12,158 -845 11.8 10.9 -.860 hours and over .................... 9,304 8,570 -735 8.4 7.7 -.7
Average hours, total at work ............•. 39.4 38.9 -.6 - - -Men, 20 years and over
Total at work ......................... 57,032 57,014 -18 100.0 100.0 -1 to 34 hours ........................... 8,531 9,422 891 15.0 16.5 1.6
1 to 14 hours ........................ 1,396 1,564 168 2.4 2.7 .315 to 29 hours ....................... 3,946 4,251 305 6.9 7.5 .530 to 34 hours ....................... 3,190 3,607 418 5.6 6.3 .7
35 hours and over ...................... 48,501 47,592 -909 85.0 83.5 -1.635 to 39 hours ., .......... '" ........ 2,488 3,104 616 4.4 5.4 1.140 hours ............................ 22,777 21,033 -1,743 39.9 36.9 -3.041 to 48 hours ....................... 6,980 8,387 1,408 12.2 14.7 2.549 to 59 hours ....................... 9,161 8,513 -648 16.1. 14.9 -1.160 hours and over .................... 7,096 6,554 -542 12.4 11.5 -.9
Average hours, total at work .............. 43.1 42.7 -.4 -. - -Women, 20 years and over
Total at work ....................... 48,308 48,956 648 100.0 <e. 100.0 -1 to 34 hours ........................... 14,68J 16,311 1,630 30.4 33.3 2.9
1 to 14 hours ............. '" ........ 2,537 3,259 722 5.3 6.7 1.415 to 29 hours ............ '" ........ 7,416 8,106 690 15.4 16.6 1.230 to 34 hours ............ '" ........ 4,728 4,945 217 9.8 10.1 .3
35 hours and over ...................... 33,627 32,645 -983 69.6 66.7 -2.935 to 39 hours ....................... 4,390 5,119 729 9.1 10.5 1.440 hours ............................ 18,977 16,959 -2,017 39.3 34.6 -4.641 to 48 hours ....................... 4,383 5,080 697 9.1 10.4 1.349 to 59 hours ....................... 3,731 3,540 -191 7.7 7.2 -.560 hours and over .................... 2,146 1,947 -200 4A 4.0 -.5
Average hours, total at work .............. 36.8 36.0 -.8 - - -Both sexes, 16 to 19 years
,
Total at work ......................... 5,148 5,256 108 100.0 100.0 -1 to 34 hours ........................... 3,741 3,829 88 72.7 72.9 .2
1 to 14 hours ............. '" ........ 1,197 1,243 46 23.3 23.7 .415 to 29 hours ............ '" ........ 2,048 2,117 69 39.8 40.3 .530 to 34 hours .......... , ............ 496 469 -27 9.6 8.9 -.7
35 hours and over ...................... 1,407 1,426 20 27.3 27.1 -.235 to 39 hours ....................... 298 311 12 5.8 5.9 .140 hours . '" ........................ 770 725 -45 15.0 13.8 -1.241 to 48 hours ....................... 165 217 52 3.2 4.1 .949 to 59 hours ....................... 112 105 -6 2.2 2.0 -.260 hours and over .................... 62 69 7 1.2 1.3 .1
Average hours, total at work .............. 24.3 24.3 .0 - - -1These estimates differ slightly from previously published 1993 aver-
ages because of the estimation procedure used.2 These differences may not equal the results obtained from compar-
ing the values shown in the table because of independent rounding.
23

usual hours, then about any time taken off and extra hoursworked in the reference week, and finally about total hoursactually worked. And, as described earlier, the questionsrelated to employment were reworded to capture workactivities more fully, especially informal, intermittent, andpart-time work. The more complete measurement of thistype of work could help to lower the average number ofhours worked.
The parallel survey found a higher proportion of work-ers at the lower end of the hours spectrum. For example,nonagricultural workers who actually worked less than 15hours in the reference week accounted for 5.5 percent ofpersons at work in the parallel survey, compared with 4.6percent in the CPS. Those working between 15 and 29hours in the reference week comprised 13.0 percent of per-sons at work in the parallel survey, compared with 12.1percent in the CPS.
The proportion of workers reporting a workweek of ex-actly 40 hours was lower in the parallel survey than in theCPS. With the memory aids embedded into the new ques-tions, workers are better able to recall exceptions to theirusual schedule, resulting in less clustering at precisely 40hours.
Part-time employment. Some of the most closely watchedmeasures derived from the CPS pertain to part-time em-ployment. The proportion of employed people who usual-ly work part time (less than 35 hours per week) was largerin the parallel survey (17.0 percent) than in the CPS (16.3percent). The difference in part-time employment was rel-atively largest for adult women. (See table 4.)
Part time for economic reasons. The proportion ofem ployed persons working part time for economic reasonswas substantially lower in the parallel survey. The differ-ences were observed for all major demographic groups butwere relatively larger for teenagers. Overall, the parallelsurvey found that 4.2 percent of employed persons wereworking part time for economic reasons, compared withan estimate of 5.3 percent from the CPS. In terms of num-bers of people, this translates into 5.0 million people asmeasured by the parallel survey, compared with 6.3 mil-lion as measured by the CPS, a difference of 21 percent.
The smaller number and proportion of workers classi-fied as part time for economic reasons in the parallel sur-vey were observed among both those who usually workpart time and those who usually work full time. Amongthose who usually work part time, the difference was morepronounced for adult women and teenagers. The declineamong those who usually work full time did not differ sig-nificantly by demographic group.
The relatively large drop in the proportion of workerswho usually work part time for economic reasons stemsfrom two new criteria, formerly inferred, that are now ex-plicit in the new questionnaire: Persons usually workingpart time are asked if they want to work full time and also
24
if they were available to accept a full-time job during thereference week. (For persons who usually work full time,these criteria are assumed to be met.) The first criterion-desire for full-time work - had a particularly large im pactin reducing the estimate of economic part-time workers,while the second - availability - disqualified relatively fewpeople. To provide a context for respondents, the questionasking why those who want to work full time were workingpart time was reworded to provide examples of both eco-nomic and noneconomic reasons for working part time.
The difference in the proportion of full-time workers (asdefined by their usual status) who were part time for eco-nomic reasons in the reference week can be at least partial-ly traced to several changes in the questionnaire. For ex-ample, the parallel survey contains separate questions forpeople who usually and actually worked part time,reducing the incidence of coding errors. Also to obtainmore accurate coding, the labels of some of the noneco-nomic response categories were expanded. For example,"own illness" was changed to "own illness/injury/medicalappointment," and "on vacation" was changed to "vaca-tion/personal day."
Part time for noneconomic reasons. The proportion ofemployed persons who worked part time for noneconomicreasons was markedly higher in the parallel survey (21.4percent) compared with the CPS (18.0 percent). All majordemographic groups showed a similar pattern.
These workers can be divided into two types-eitherthey usually work full time or usually work part time. It isnot uncommon for workers who are usually full time tohave worked part time in the reference week, having takentime off for reasons such as vacation, holiday, or illness.The higher proportion of these workers in the parallel sur-vey-7.3 percent of all employed people, compared with5.3 percent in the CPS - reflects the more precise informa-tion regarding hours at work obtained from the recallstrategy embedded in the new questions. It appears thatthe new questionnaire is indeed effective in promptingworkers to remember exceptions to their usual schedule.
Most of the people who were part time for noneconomicreasons in the reference week usually work part time, oftento give them more time for school.family, or other activi-ties. The parallel survey also obtained a higher estimate ofthese workers-14.1 versus 12.7 percent. This differentialreflects in part the new questionnaire's more stringent re-quirements to be classified as economic part time.
Temporary absences. While most employed people areactually at work in the reference week, some are found tobe temporarily absentfrom their jobs for the full week. Theproportion of employed persons classified as temporarilyabsent in the parallel survey (4.5 percent) was lower thanthe proportion found in the CPS (5.0 percent). Thispattern held true for all major demographic groups exceptteenagers.

Table 4. Employed persons b'y usual full- or part-time status, sex, and age, using 1980 census-based population estimates from theCPS and the parallel survey, 1993 annual averages
Thousands of persons Percent distributionSex, age, and full-
CPSl Parallel Differ-or part-ti me status CPSl Parallel Differ-survey ence2 survey ence2
II
TOTAL
Total employed ••.......•........... 119,389 119,606 217 100.0 100.0 -At work ............................... 113,438 114,201 763 95.0 95.5 .5
35 hours or more •......••....•.•... 85,617 83,610 -2,007 71.7 69.9 -1.81 to 34 hours ....................... 27,821 30,591 2,770 23.3 25.6 2.3
Part time 'for economic reasons ..... 6,325 5,028 -1,297 5.3 4.2 -1.1Usually work full time ............ 1,988 1,501 -487 1.7 1.3 -.4Usually work part time ......•.... 4,337 3,527 -810 3.6 2.9 -.7
Part time for noneconomic reasons .. 21,496 25,563 4,067 18.0 21.4 3.4Usually work full time ............ 6,325 8,674 2,349 5.3 7.3 2.0Usually work part time •.......... 15,171 16,889 1,718 12.7 14.1 1.4
With a job but not at work ...............• 5,951 5,405 -546 5.0 4.5 -.5
Men, 20 years and over
Total employed ..................... 61,884 61,284 -600 100.0 100.0 -At work ............................... 59,198 59,065 -133 95.7 96.3 .6
35 hours or more ... , ............... 50,162 49,168 -994 81.1 80.2 -.81 to 34 hours ....................... 9,036 9,897 861 14.6 16.1 1.5
Part time for economic reasons ..... 2,720 2,225 -495 4.4 3.6 -.8Usually work full time ............ 1,140 849 -291 1.8 1.4 -.5Usually work part time ........... 1,580 1,376 -204 2.6 2.2 -.3
Part time for noneconomic reasons .. 6,316 7,672 1,356 10.2 12.5 2.3Usually work full time ............ 3,006 4,187 1,181 4.9 6.8 2.0Usually work part time .....•.•... 3,310 3,485 175 5.3 5.7 .3
With a job but not at work ................ 2,686 2,218 -468 4.3 3.6 -.7
Women, 20 years and over
Total employed .................... 51,966 52,603 637 100.0 100.0 -At work ............................... 48,885 49,643 758 94.1 94.4 .3
35 hours or more .0 ••.•••••••••••••. 33,967 32,957 -1,010 65.4 62.7 -2.71 to 34 hours ....................... 14,918 16,686 1,768 28.7 31.7 3.0
Part time for economic reasons ..... 2,983 2,371 -612 5.7 4.5 -1.2Usually work full time ............ 744 574 -170 1.4 1.1 -.3Usually' work part time ........... 2,239 1,797 -442 4.3 3.4 -.9
Part time for noneconomic reasons .. 11,935 14,315 2,380 23.0 27.2 4.2Usually work full time ............ 3,169 4,292 1,123 6.1 8.2 2.1Usually work part time ........... 8,766 10,023 1,257 16.9 19.1 2.2
With a job but not at work ................ 3,082 2,960 -122 5.9 5.6 -.3
Both sexes, 16 to 19 years
Total employed ..................... 5,540 5,719 179 100.0 100.0 -At work ............................... 5,357 5,492 135 96.7 96.0 -.7
35 hours or more ................... 1,488 1,485 -3 26.9 26.0 -.91to 34 hours ....................... 3,869 4,007 138 69.8 70.0 .2
Part time for economic reasons ..... 623 430 -193 11;2 7.5 -3.7Usually work full time ............ 104 77 -27 1.9 1.3 -.5Usually work part time ........... 519 353 -166 9.4 6.2 -3.2
Part time for noneconomic reasons .. 3,246 3,577 331 58.6 62.5 3.9Usually work full time ...........• 150 195 45 2.7 3.4 .7Usually work part time ........... 3,096 3,382 286 55.9 59.1 3.2
With a job but not at work ................ 183 227 44 3.3 4.0 .7
1 These estimates differ slightly from previously published 1993 aver-ages because of the estimation procedure used.
2 These differences may not equal the results obtained fro mco mpar-ing the values shown in the table because of independent rounding.
25

The new questionnaire appears to result in more accu-rate classification of workers who are temporarily absent.This may reflect several changes - the elimination of themajor-activity question, the inclusion of separate directquestions on temporary absence and on layoff, and the re-vamping of the question on the reason for absences. Re-garding the major-activity question in the former ques-tionnaire, some responses may have given interviewers theimpression that those respondents had a job from whichthey were absent, when in fact they did not have a job at all.Also, the direct questions on layoff in the new question-naire allow some people to be properly classified as unem-ployed or not in the labor force, rather than being erro-neously counted as absent from a job.
To emphasize the im portant role played by the series ofquestions on temporary absence, it is estimated that mostof the drop in men's employment level in the parallel sur-vey was attributed to a lower estimate for persons tempo-rarily absent. The other category of employed persons,those at work, was essentially the same for men on bothsurveys.
Class of worker. In the aggregate, the distribution ofemployed persons by their "class-of-worker" status dif-fered little between the two surveys. Wage and salaryworkers comprised about 88 percent of all workers in boththe CPS and the parallel survey. This classification is fur-ther broken down into private and government workers.Again, there were no significant differences between thesurveys, with the private sector accounting for about 73percent and the government sector accounting for about15 percent of all employed persons. Nearly all of the re-maining 12 percent were classified as self-employed onboth surveys. (See table 5.)
Only a small fraction of all workers were classified asunpaid family workers in the CPS, and the proportion waseven smaller in the parallel survey. This may seem surpris-ing, given the changes to the questionnaire designed toidentify workers in family businesses. In fact, the newquestions were successful; however, many persons re-ported as working in family businesses were also found tohave received payor profit from the business and thuswere classified as wage and salary workers. Even in agri-culture, where unpaid family workers are far more preva-lent than in most other industries, the new questions re-sulted in a smaller proportion of such workers. In sum, theredesign's efforts to more accurately identify workers infamily businesses resulted in more wage and salary work-ers compared with the former procedures.
Looking at the class-of-worker data by gender, the newseries of questions obtained quite different results for menand women. For men, the parallel survey had a higher pro-portion in wage and salary work and a smaller proportionin self-employment. For women, the findings were just thereverse - a higher proportion of self-em ployed and a lower
26
proportion of wage and salary workers in the parallel sur-vey. The level of self-employment among women was 4.8million in the parallel survey, com pared with 4.1 million inthe CPS, which was equal to most of the increase in femaleemployment in the parallel survey. Thus, the improvedquestions on work activity and the addition of questionson work in a family business resulted in more women.beingproperly classified as self-employed.
Occupation and industry. The distribution of employedpersons according to the occupation and industry of theirjob shifted somewhat under the new questionnaire. (Seetable 6.) For men, the parallel survey had a larger propor-tion employed in the managerial, professional, and techni-cal categories, and a smaller proportion in sales occupa-tions. The data suggest that the large decrease in the num-ber of men who were employed but absent from their jobsin the parallel survey may have reduced their representa-tion in occupations (such as sales) in which employmentarrangements may be more tenuous.
Looking at the industry distributions for men, the paral-lel survey had a higher proportion in manufacturing andeducational services and a smaller proportion in retailtrade, mining, public administration, and private house-holds. As a partial explanation of these differences, it is hy-pothesized that the classification of fewer men as tempo-rarily absent from work as a result of the revised question-naire reduces their representation in industries with moreinformal or irregular employment, such as trade and pri-vate households.
Among women, a higher proportion in the parallel sur-vey were working in managerial and farming occupations.This is consistent with evidence presented earlier that thenew questionnaire is measuring more women working infamily businesses or farms and in their own businesses.A smaller proportion were in administrative support andprivate household positions.
The distribution by industry for women showed thatonly one industry, agriculture, had a higher proportion ofworkers in the parallel survey than in the CPS. (Evidencesuggests that the former survey may have underestimatedemployment of women in agriculture by 25 percent.) Pro-portions as measured by the parallel survey were lower inpublic administration and private households.
Earnings. Median weekly earnings of full-time wage andsalary workers were somewhat higher under the revisedquestionnaire ($462) than under the CPS ($450). Theparallel survey found higher median earnings for men butno difference in earnings for women. Among part-timeworkers, total earnings and those for men were also slight-ly higher in the parallel survey. (See table 7.)
Both in the parallel survey and in the full CPS, estimatesof earnings are based on data collected from one-quarter ofthe sample each month. It should be noted that due to the
,

Table 5. Employed persons by class of worker and sex using 1980 census-based population estimates from the CPSand theparallel survey, 1993 annual averages
Thousands of persons Percent distribution
Class of worker and sexParallel Differ- CPS1 Parallel Differ-CPS1
survey ence2 survey ence2
TOTAL
Total employed ......................... 119,389 119,606 217 100.0 100.0 -Agriculture .........................•. 3,080 3,175 95 2.6 2.7 .1
Wage and salary workers ............ 1,488 1,487 -1 1.2 1.2 .0Private industries ................. 1,476 1,439 -37 1.2 1.2 .0Government ...................... 12 48 36 (3) (3) -
SeH-employed workers .............. 1,488 1,632 144 1.2 1.4 .1Incorporated ':' .................. 159 172 13 .1 .1 .0Other ........................... 1,328 1,460 132 1.1 1.2 .1
Unpaid family workers ............... 105 56 ·49 .1 e) -Nonagricultural industries ............... 116,309 116,432 123 97.4 97.3 -.1
Wage and salary workers ............ 103,703 103,897 194 86.9 86.9 .0Private industries ................. 85,194 85,835 641 71.4 71.8 .4Government ...................... 18,509 18,062 -447 15.5 15.1 -.4
SeH-employed workers .............. 12,397 12,369 -28 10.4 10.3 .0Incorporated ..................... 3,413 3,759 346 2.9 3.1 .3Other ........................... 8,984 8,611 -373 7.5 7.2 -.3
Unpaid family workers ............... 208 166 -42 .2 .1 .0
Men
Total employed ......................... 64,727 64,200 -527 100.0 100.0 -Agriculture ........................... 2,444 2,366 -78 3.8 3.7 -.1
Wage and salary workers ............ 1,149 1,184 35 1.8 1.8 .1Private industries ................. 1,142 1,165 23 1.8 1.8 .1Government ...................... 8 18 10 (3) (3) -
SeH-employed workers 00 •• ' ••••••••• 1,257 1,158 -99 1.9 1.8 '~.1Incorporated ..................... 132 113 -19 .2 .2 -Other ........................... 1,125 1,045 ·80 1.7 1.6 -.1
Unpaid family workers ............... 37 24 -13 .1 (3) -Nonagricultural industries .............. 62,284 61,835 -449 96.2 96.3 .1
Wage and salary workers ............ 53,685 53,758 73 82.9 83.7 .8Private industries ................. 45,297 45,480 183 70.0 70.8 .9Government ...................... 8,387 8,278 -109 13.0 12.9 -.1
Self-employed workers .............. 8,554 8,022 -532 13.2 12.5 -.7Incorporated ... " .. , ............. 2,656 2,703 47 4.1 4.2 .1Other ................... '" ..... 5,898 5,319 -579 9.1 8.3 -.8
Unpaid family workers ............... 45 54 9 .1 .1 .0
Women I
Total employed ....... " ........ '" ..... 54,662 55,406 744 100.0 100.0 -Agriculture ........................... 636 808 172 1.2 1.5 .3
Wage and salary workers • to ••••••••• 338 303 -35 .6 .5 -.1Private industries ... , ............. 334 274 -60 .6 .5 -.1Government ...................... 4 29 25 e) .1 -
Self-employed workers .............. 231 474 243 .4 .9 .4Incorporated ..................... 28 59 31 .1 .1 -.1Other ............................ 203 415 212 .4 .7 .4
Unpaid family workers ............... 67 31 -36 .1 .1 -.1Nonagricultural industries ...... '" ..... 54,025 54,597 572 98.8 98.5 -.3
Wage and salary workers ............ 50,019 50,139 120 91.5 90.5 -1.0Private industries .............. , .. 39,897 40,355 458 73.0 72.8 -.2Government ................. 1 •••• 10,122 9,784 -338 18.5 17.7 -.9
Self-employed workers .............. 3,844 4,347 503 7.0 7.8 .8Incorporated ..................... 757 1,056 299 1.4 1.9 .5Other ......... '" ............... 3,087 3,291 204 5.6 5.9 .3
Unpaid family workers ............... 163 111 -52 .3 .2 -.1
1These estimates differ slightly from previously published 1993 aver-ages because of the estimation procedure used.
2 These differences may not equal the results obtained from compar-
in%the values shown in the table because of independent rounding.Less than 0.05 percent.
27
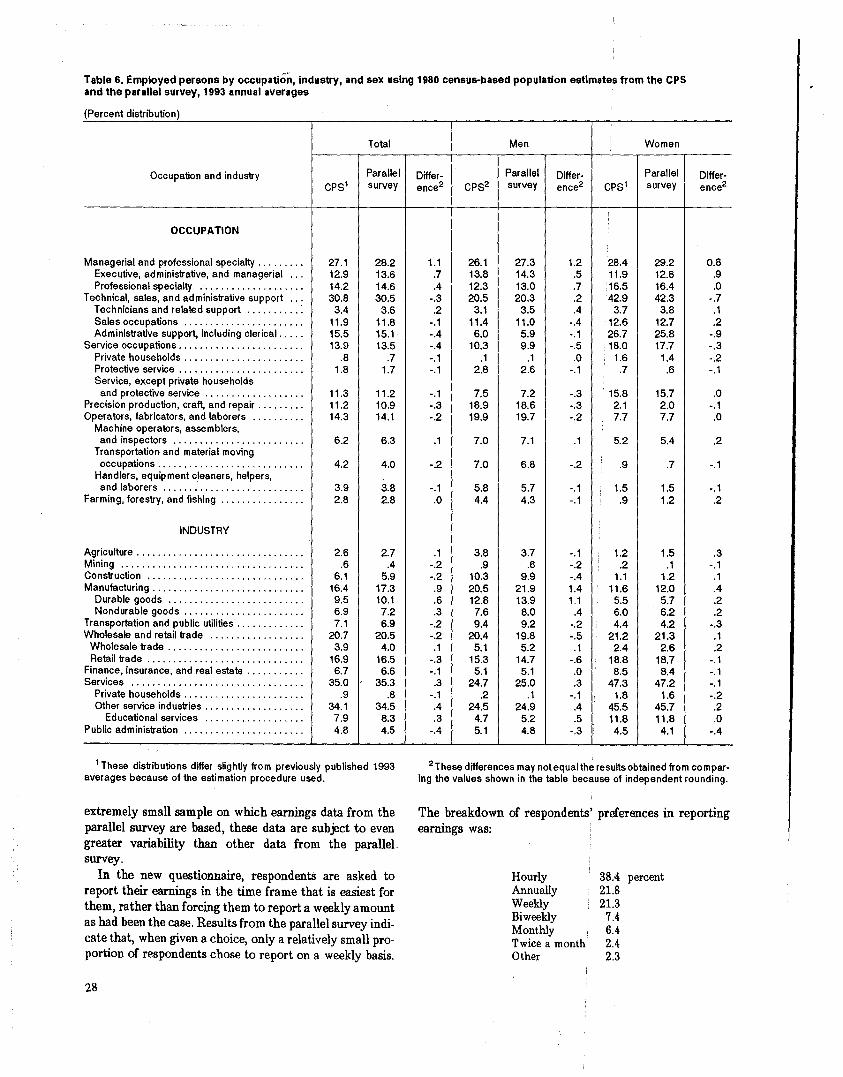
Table 6. Employed persons by occupation, industry, and sex using 1980 census-based population estimates from the CPSand the parallel survey, 1993 annual averages
(Percent distribution)i
Total Men Women
Occupation and industry Parallel Differ- Parallel Differ- Parallel Differ-CPS1 survey ence2 CPS2 survey ence2 CPS1 survey ence2
OCCUPATION
Managerial and professional specialty ......... 27.1 28.2 1.1 26.1 27.3 1.2 28.4 29.2 0.8Executive, administrative, and managerial .. , 12.9 13.6 .7 13.8 14.3 .5 11.9 12.8 .9Professional specialty •• , ••••••••••••• 0 •• 0 14.2 14.6 .4 12.3 13.0 .7 16.5 16.4 .0
Technical, sales, and administrative support ... 30.8 30.5 -.3 20.5 20.3 .2 42.9 42.3 -.7Technicians and related support .0 •• 0 ••••••
3.4 3.6 .2 3.1 3.5 .4 3.7 3.8 .1Sales occupations ' •• 0.0 ••••••••• ' ••• 0 •• 0 11.9 11.8 -.1 11.4 11.0 -.4 12.6 12.7 .2Administrative support, including clerical ..... 15.5 15.1 -.4 6.0 5.9 -.1 .26.7 25.8 -.9
Service occupations ........................ 13.9 13.5 -.4 10.3 9.9 -.5 18.0 17.7 -.3Private households ....................... .8 .7 -.1 .1 .1 .0 1.6 1.4 -.2Protective service ........................ 1.8 1.7 -.1 2.8 2.6 -.1 .7 .6 -.1Service, except private households
and protective service '" ................ 11.3 11.2 -.1 7.5 7.2 -.3 15.8 15.7 .0Precision production, craft, and repair ......... 11.2 10.9 -.3 18.9 18.6 -.3 2.1 2.0 -.1Operators, fabricators, and laborers ••• 0 •• 0 •• 0 14.3 14.1 -.2 19.9 19.7 -.2 7.7 7.7 .0
Machine operators, assemblers,and inspectors •••••••••••••••••• 0 ••• 0.0 6.2 6.3 .1 7.0 7.1 .1 5.2 5.4 .2
Transportation and material movingoccupations ............................ 4.2 4.0 -.2 7.0 6.8 -.2 .9 .7 -.1
Handlers, equipment cleaners, helpers,and laborers .0 •••••••••• 0 •••• , ••••••••• 3.9 3.8 -.1 5.8 5.7 -.1 1.5 1.5 -.1
Farming, forestry, and fishing '·.·.0 .......... 2.8 2.8 .0 4.4 4.3 -.1 .9 1.2 .2
INDUSTRY
Agriculture ................................ 2.6 2.7 .1 3.8 3.7 -.1 1.2 1.5 .3Mining .0 ••• 0 ••• 0 •• 0 ••• 0 •• ,0 ,. , ••••••• , '" .6 .4 -.2 .9 .6 -.2 .2 .1 -.1Construction ••••••••••••••••• _0 ••••••• 0 •• 0 6.1 5.9 -.2 10.3 9.9 -.4 1.1 1.2 .1Manufacturing ............................. 16.4 17.3 .9 20.5 21.9 1.4 11.6 12.0 .4
Durable goods •••••••••• ,0, •••••• 0 •••••• 9.5 10.1 .6 12.8 13.9 1.1 5.5 5.7 .2Nondurable goods ........................ 6.9 7.2 .3 7.6 8.0 .4 6.0 6.2 .2
Transportation and public utilities ............. 7.1 6.9 -.2 9.4 9.2 -.2 4.4 4.2 -.3Wholesale and retail trade ••••• 0 .0' •• 0 •• 0 ••• 20.7 20.5 -.2 20.4 19.8 -.5 21.2 21.3 .1
Wholesale trade .......................... 3.9 4.0 .1 5.1 5.2 .1 2.4 2.6 .2Retail trade .............................. 16.9 16.5 -.3 15.3 14.7 -.6 18.8 18.7 -.1
Finance, insurance, and real estate ........... 6.7 6.6 -.1 5.1 5.1 .0 8.5 8.4 -.1Services ••••••••••••••••• "0 •••••••••• 0'0 35.0 35.3 .3 24.7 25.0 .3 47.3 47.2 -.1
Private households ....................... .9 .8 -.1 .2 .1 -.1 1.8 1.6 -.2Other service industries ................... 34.1 34.5 .4 24.5 24.9 .4 45.5 45.7 .2
Educational services •••••••• 0 •••••••••• 7.9 8.3 .3 4.7 5.2 .5 11.8 11.8 .0Public administration .0 ••••• "0 •• 0 •••••••••• 4.8 4.5 -.4 5.1 4.8 -.3 4.5 4.1 -.4
1These distributions differ slightly from previously published 1993averages because of the estimation procedure used.
2These differences may not equal the results obtained from compar-ing the values shown in the table because of independent rounding.
extremely small sample on which earnings data from theparallel survey are based, these data are subject to evengreater variability than other data from the parallel.survey.
In the new questionnaire, respondents are asked toreport their earnings in the time frame that is easiest forthem, rather than forcing them to report a weekly amountas had been the case. Results from the parallel survey indi-cate that, when given a choice, only a relatively small pro-portion of respondents chose to report on a weekly basis.
The breakdown of respondents' preferences in reportingearnings was:
HourlyAnnuallyWeeklyBiweeklyMonthlyTwice a monthOther
38.14 percent21.821.3
7.46.42.42.3
28

For minimum wage sttidies, iriformation is also col-lected on the number and wage rate of persons who arepaid at hourly rates. In the revised questionnaire, individu-als who choose to report their earnings on a basis otherthan hourly are asked directly whether they were paid atan hourly rate. If so, they are asked what their hourly rateof pay is. In the parallel survey, 61 percent of workers re-ported be~g paid by the hour, somewhat higher than the59 percent reported in the CPS.7
Characteristics of the unemployedThe new questionnaire had a greater incidence of unem-
ployment overall, with significantly higher rates for cer-tain worker groups. This section explores the effect of thenew procedures on selected characteristics of the unem-ployed, including persons on layoff, and reasons for andduration of unemployment.
On layoff. As described earlier, the series on workers onlayoff was revamped to obtain more accurate information,particularly relating to the expectation of recall. As mea-sured in the parallel survey, the percentage of the unem-ployed accounted for by persons on layoff was 12.8 per-cent, essentially the same as the 12.5 percent obtainedfrom the CPS. (See table 8.)
The proportion of unemployed men who were on layoffwas not statistically significant between surveys. On theother hand, the proportion of unemployed women whowere on layoff was higher in the parallel survey comparedwith the CPS. For men, there appeared to have beenseveral offsetting effects. In the parallel survey, peoplewere asked a direct question - "LAST WEEK, were youon layoff from a job?" - and more were initially reportedto be on layoff. But when the questions on expectations ofrecall were posed, some did not meet these criteria. As aresult, the number of men on layoff ended up to be aboutthe same under the old and new questionnaires.
For women, these offsetting effects are also present, butin addition it is suspected that other changes to the ques-tionnaire, such as the elimination of the initial labor forcequestion, the specificity of the work for pay question andthe direct layoff question, prompted more women toreport labor market activities. Greater reporting of suchactivities by women could contribute to the higher propor-tion of unem ployed women on layoff in the parallel survey.
Those who are initially reported to be on layoff, but donot meet the expectation of recall, are asked the series ofquestions on jobsearch, and most are found to have lookedfor work within the prior 4-week period. If so, they are stillcounted as unemployed, but as "jobseekers," rather thanpersons on layoff.
Duration of unemployment. Measures of both mean andmedian duration were little different between the old and
7 These estimates pertaining to hourly paid workers are based on theaverage of the 6 months from September 1992 to February 1993.
new procedures. The mean duration in the parallel surveywas 19.7 weeks, compared with 18.1 weeks in the CPS, andthe median duration was 9 weeks, compared with 8 weeks.
Several changes were made to the unemployment dura-tion measure, including one which allowed respondents toreport duration in weeks, months, or years, as they prefer,rather than only in weeks, as in the former questionnaire.This change was designed to make it easier for the longer-term unemployed to report their length of jobsearch, and,in fact, the parallel survey obtained relatively more reportsof longer-term joblessness.
Another change involved dependent interviewing. Asmentioned in the section on computerization, duration ofunemployment is automatically updated by either 4 or 5weeks each month (depending on the number of weeksbetween surveys) as long as a person continues to be unem-ployed.
Reasons for unemployment. The unemployed are classifiedby their activity immediately prior to becoming unem-ployed. These "reasons for unemployment" include hav-ing lost a job (including persons on layoff), having left a jobto seek a new one, or being either new entrants or reen-trants to the labor force. Several changes to the question-naire - both definitional and operational- resulted in dif-ferences in the way the unemployed are distributed amongthese categories.
There was a higher proportion of the unemployedcounted as reentrants in the parallel survey (32.7 percent)compared with the CPS (24.6 percent) and a smaller pro-portion of new entrants (6.7 versus 10.2 percent). Theseestimates were affected by the increase in the overall num-ber of unemployed, some of whom were coming from out-side the labor force and increasing the ranks of reentrants.Also, the seemingly minor modification to the definition ofentrants, which was broadened to take into account anytype of job, and not just a full-time job of at least 2 weeksduration, affected the estimates of new entrants and reen-trants.
Table 7. Median weekly earnings of full- and part-time wageand salary workers by sex using 1980 census-basedpopulation estimates from the CPS and the parallel survey,1993 annual averages(In current dollars)
Category CPS1 Parallel Differencesurvey
FUll-time workers
Total ............... $450 $462 $12Men ............. 509 529 20Women .......... 400 400 -
Part-time workers
Total ............... 130 133 3Men .......... , .. 120 127 7Women ........... 136 135 -1
1These estimates differ slightly from previously published 1993 av-erages because of the estimation procedures used.
29

Table 8. Unemployed persons by reason for and duration of unemployment using 1980 census-based population estimates fromthe CPS and the parallel survey, 1993 annual averages
Thousands of persons Percent distribution
Reason and duration Parallel ParallelCPS' survey Difference2 CPS' survey Difference2
REASON
Total unemployed ............................ 8,714 9,358 644 100.0 100.0 -Job losers .... , .................... " ............. 4,731 3,820 -911 54.3 40.8 -13.5
On layoff ....................................... 1,091 1,202 111 12.5 12.8 .3Other job losers ................................. 3,640 2,618 -1,022 41.8 28.0 -13.8
Persons who completed temporary jobs ............... e) 985 (3) e) 10.5 e)Job Ieavers ....................................... 949 861 -88 10.9 9.2 -1.7Reentrants ........................................ 2,143 3,064 921 24.6
!32.7 8.1
New entrants ..................................... 890 629 -261 10.2 6.7 -3.5
DURATIONI,
Less than 5 weeks ................................. 3,138 2,801 -337 36.0 29.9 -6.15 to 14 weeks ..................................... 2,562 2,968 406 29.4 31.7 2.315 weeks and over ................................. 3,015 3,590 575 34.6 38.4 3.8
15 to 26 weeks ... , ..............•............... 1,250 1,476 226 14.3 15.8 1.527 weeks and over ................................ 1,765 2,114 349 20.3 22.6 2.3
27 to 51 weeks ................................ 747 899 152 8.6 9.6 1.052 weeks and over ............................. 1,018 1,215 197 11.7 13.0 1.3
Average (mean) duration, in weeks ................... 18.1 19.7 1.6 - - -Median duration, in weeks .......................... 8.0 9.0 1.0 - - -
, These estimates differ slightly from previously published 1993 av-erages because of the estimation procedure used.
2 These differences may notequal the results obtained from compar-
"Completed temporary job" was added as a major rea-son for unemployment category, based on a revised ques-tion posed to jobseekers who were working before theystarted looking for work: "Did you lose or quit that job, orwas it a temporary job that ended?" Under the old ques-tionnaire, most people who became unemployed whentheir temporary job ended were classified as "job losers."Under the new procedures, persons who completed tem-porary jobs accounted for about 11 percent of all unem-ployed. The job loser proportion was lowered by close tothis magnitude.
Other changes. As discussed in the section on major ques-tionnaire changes, the distinction between active and pas-sive jobsearch methods is a crucial one, and, in the newquestionnaire, response categories were reordered and ex-panded for greater accuracy in classifying responses. Twopassive methods- "looked at ads" and "attended jobtraining programs/courses" - were added to the list, aswas a category called "other passive." In the past, inter-viewers were instructed to code passive jobsearch methodsas "nothing" and otheractive methods as "other," butthere was evidence that some passive methods were beingmiscoded as "other." Also, it is quite possible that someactive jobsearches were miscoded as "nothing."
30
in~ the values shown in the table because of independent rounding.Not available. '
The question on whether a person looked for a job dur-ing the last 4 weeks was reworded to convey a broader con-cept of jobsearch activity (see exhibit A), and followupquestions were added to obtain a full accounting of the job-search methods used. The parallel survey yielded a some-what higher proportion of individuals who gave passivereasons only-4,4 versus 3.2 percent of everyone receivingthe jobsearch question.
Labor forceThe labor force participation rate, that is, the percent-
age of the population that is either employed or unem-ployed, was higher in the parallel survey than in the CPS.For all workers, the labor force participation rate using thenew questions was 66.6 percent, compared with 66.2 per-cent in the CPS. (See tables 1 and 2.)
Women's participation rate was 59.1 percent in the par-allel survey. compared with 57.9 percent in the CPS. Teen-agers and older workers also had higher participation ratesin the parallel survey than in the CPS. The labor force par-ticipation rate for men, however, was somewhat lower inthe parallel survey -74.S versus 75.2 percent.
To explain the differences in participation rates amongcertain demographic groups, the arguments used to ex-plain variations in employment and unemployment apply.

That is, the new questionnaire generally-obtains more la-bor force activity, especially for those worker groupswhich have traditionally had more part-time or irregularparticipation.
Not In the labor forceGiven the greater proportion of labor force participants
in the parallel survey compared with the CPS, it followsthat the percentage of the population that was out of thelabor force was lower in the parallel survey, 33.4 percentcompared with 33.8 percent. The "not in the labor force"group is large and diverse, including retirees, homemak-ers, students, the ill and disabled, and all others who areneither working nor looking for work.
Discouraged workers. Within the "all others" category is agroup of particular interest-discouraged workers. Theseare people who want jobs but have not searched for workin the prior month because they believe there are no jobs tobe found or none for which they could qualify.
As discussed in the section on definitional changes, thedefinition of discouraged workers was made more restric-tive by requiring some search activity within the prior yearand availability to work. These two new criteria, especiallythe former, contributed to a substantially reduced numberof discouraged workers in the parallel survey comparedwith the CPS. (See table 9.)
Most, but not all, of the reduction in discouragement isdue to the change in definition, but other changes in thequestionnaire played a role also. Even when estimatesbased on the former definition were com pared, the parallelsurvey estimates remained lower than those from the CPS.
Data on a larger group of persons outside the laborforce, one that includes discouraged workers as well aspersons who desire work but give other reasons for notsearching (such as child-care problems, family responsibi-lities, school, or transportation problems) may also be rele-vant for analysis. This group is made up of persons whowant a job, are available to work, and have looked for workwithin the past year. They constitute 2.1 percent of thenot-in-the-labor-force group in the parallel survey. Thereis no com parable figure for the CPS, since the old question-naire did not ask about recency of jobsearch for those notin the labor force.
Retired and disabled persons. One of the most frequentcomplaints from respondents and interviewers about theformer questionnaire was the burden it placed on retiredand disabled people, who every month were asked a seriesof questions on labor force activity which had no relevanceto their situation. In the new questionnaire, severalchanges were made to address this problem. In the case ofretirees 50 years and over, the first month they volunteerthat they are retired they are skipped to a question askingwhether they currently want a job (either full or part time).If they do not want a job, the interview is ended. In subse-
~quent months, through dependent interviewing, they areasked if they did any work in the last week. If not, it is veri-fied that they are still retired and do not want a job. Nearlyall of the people who were identified as retired in previousmonths verify that they are still retired in the subsequentmonth.
Similar changes were made to reduce the burden forthose who volunteer that they are disabled or unable towork. (The latter category is intended to cover people witha temporary illness or injury who might not perceive them-selves as disabled, a term which may have a more perma-nent connotation.) Individuals who are reported as dis-abled or unable to work are asked a followup question todetermine if they will be able to do any gainful work in thenext 6 months. If they won't, the interview is ended. Insubsequent months, they are asked if they worked in theprior week. If not, they are asked to sim ply verify their pre-vious month's status as disabled or unable to work.
It is important to be aware ofthefactthat the "shortcut"offered to older survey participants did not reduce thecount of older persons who are active in the labor market.On the contrary, the parallel survey obtained a larger laborforce among the older population than did the CPS. Asexplained in the sections on employment and unemploy-ment, the new questions appeared, to capture morepart-time and irregular work, as well as more jobsearch .for these types of work, resulting in higher estimates oflabor force activity for several groups, including olderworkers.
It should also be noted that the response categories ofretired and disabled were intended merely to reduce theburden of participating in the survey, not to provide acom plete count of retired or disabled persons. Such classi-
Table 9. Discouraged workers by sex and age using 1980census-based population estimates from the CPS and theparallel survey, 1993annual averages
(In thousands)
Category CPS1 Parallel Difference2survey
Not in labor force, total .. 65,447 64,585 ·862
Discouraged workers:Total .............. 1,127 424 ·703
Men ............ 523 221 ·302Women ......... 604 204 ·400
16 to 24 years .... 222 114 -108Men .......... 120 67 ·53Women ........ 102 47 -55
25 years and over 905 311 -594Men .......... 404 154 -250Women ........ 502 157 -345
1These estimates differ slightly from previously published 1993averages because of the estimation procedure used.
2 These differences may not equal the results obtained from com-paring the values shown in the table because of independent rounding.
31

fications in the survey depend strictly on individuals' vol-unteering the information. No attempt is made to deter-mine if those who say they are retired ever worked at a pay-ing job or met any other specific criteria. Moreover,persons active in the labor force market who are also re-tired from previous careers or disabled are classified asemployed or unemployed rather than as not in the laborforce (retired or disabled).
Historical Comparability
The new questionnaire and mode of data collection willresult in changes for most estimates. Examination of theparallel survey data has helped quantify the magnitude ofthese differences and identify their possible causes. BLSwill not, however, use the parallel survey data to reissueofficial estimates. Instead, BLS will provide estimates andsuggestions in the form of research series and publications,in order to aid individuals who examine CPS data histori-cally.
Some of the techniques being investigated for use in theconstruction of historical research series include the im po-sition of old definitions on the data collected beginning inJanuary 1994, construction of new definitions with datacollected prior to January 1994, the use of measurementerror models to explore the structural relationship be-tween the CPS and the parallel survey data in order to pre-dict what the CPS estimates would have been had the newprocedures been used prior to January 1994, the explora-tion of geographic variation to gain insight into the effectsof the new questionnaire and procedures at different levelsof unemployment, and the tracking of the CPS and parallelsurvey data with other concurrent measures of economicactivity.
Considerable analysis of the aggregate unemploymentrate has already been completed and is available from BLSupon request. Work on other labor market series will becoming out over the next 12 to 18 months."
Also for comparability, BLS and the Bureau of the Cen-sus will, for a period, continue to conduct the "oldCPS" -that is, with the old questionnaire and paper andpencil procedure, using the 12,000 household sample inthe 1992-93 parallel survey. Current plans call for datafrom this second parallel survey to be made available inJuly 1994 after the effects of switching respondents and in-terviewers from the automated survey to the paper surveyhave been investigated. It is important for data users andthe public to know that data from the second parallel sur-veyare being collected for the purposes of historical com-
8 For preliminary findings from this research, see two BLS TechnicalReports: "What Would the Unemployment Rate Have Been Had the Re-designed Current Population Survey Been in Place From September 1992to December 19931: A Measurement Error Analysis, n by Stephen M.Miller (Telephone 202-606-7379); and "Predicting the National Unem-ployment Rate That the 'Old' CPS Would Have Produced," by RichardTiller (Telephone 202-606·6370).
32
parisons only. The official unemployment rate estimateswill continue to be derived from the 60,000 householdsample that, as of January 1994, is administered with thenew automated questionnaire. Given its small sample size,estimates from the second parallel survey will have a greatdeal of variability and thus reduced reliability. Specifical-ly, the standard error on a 3-month national unemploy-ment rate from the 12,000 household second parallel sur-vey will be more than twice as large as the standard errorfrom the 60,000 household sample. To put this in perspec-tive, data from the second parallel survey would have to beaggregated together for more than a year to obtain a levelof variability as small as that obtained for 1 month of CPSdata collected from the 60,000 household sample.
Introduction of 1990 Census-BasedPopulation Controls
Derivation of 1990 census-based populationcontrols, with adjustment for net censusundercoverage
Beginning with the CPS estimates for January 1994, theindependent national population controls used for the age-sex-race groups in the second-stage estimation procedureare being prepared by projecting forward the resident pop-ulation as enumerated on April 1, 1990. Also, for the firsttime, estimates of the decennial census undercount, ob-tained from the Post Enumeration Survey (PES), are beingadded to the population controls.
Current month CPS estimates of the population are ad-justed to agree with independent population controls.These controls are developed from a variety of sources, asdescribed below. In the second-stage estimation proce-dure, the CPS sample weights are adjusted to ensure thatsample-based estimates of population match the indepen-dent controls. The CPS population estimates are consis-tent with three sets of controls for:
1) 50 States and the District of Columbia
2) 14 Hispanic and 5 non-Hispanic age-sex groups
3) 66 white, 42 black, and 10 other race-age-sexgroups
The first set of controls is restricted to the civilian nonin-stitutional population (16 years and over) and the remain-ing controls are developed for the civilian noninstitutionalpopulation plus noninstitutionalized children 15 years andunder.
Since the population controls are derived primarilyfrom non-survey data, they are assumed to contain nosampling error and thus do not contribute to the varianceof the survey estimates. The second-stage ratio adjustmentreduces the variability of those CPS estimates which are

correlated with the population - particularly estimates ofem ployment and civilian labor force. At the same time, theadjustment partially corrects for CPS undercoverage ofcertain demographic groups, most notably Hispanics.
The 1990-based independent population controls areaggregates of more detailed population projections and aredeveloped in a manner similar to earlier controls. Decen-nial census data and a variety of administrative and surveyinformation are used to "age forward" estimates of thepopulation to the current month, adjust for births anddeaths, account for net migration, and then subtract thecounts of Armed Forces and institutionalized persons.The population figures derived in this manner are projec-tions based on administrative estimates, in contrast to thesurvey-based estimates of population obtained from theCPS. A description of the method used to make the1990-based projections is given here.
The base figures for the resident population are derivedfrom the 1990 decennial census, which has an official ref-erence date of April 1, 1990. (The resident population in-cludes all persons living in the United States, regardless ofage, institutional status, or Armed Forces membership.)The age distribution is modified to correct for lags betweenthe census date and the actual date of interview. The racedistribution is modified to be consistent with OMB Direc-tive 15, which stipulates that persons of unspecified race,mostly persons of Hispanic origin, are allocated to one offour race categories (white; black; American Indian, Eski-mo, and Aleut; Asian and Pacific Islander). As a result ofthese changes, the base figures differ in age and race distri-bution from figures published by the Bureau of the Censusin decennial census reports. For details, see U.S. Bureau ofthe Census, Publication CPH-L-74, Age, Sex, Race, andHispanic Origin Information from the 1990 Census: aComparison of Census Results with Results where Age andRace have been Modified. The Bureau of the Census alsodevelops estimates of the April 1, 1990 population, inde-pendent of the 1990 census, using methods of demogra ph-ic analysis. These estimates are also used in developing thepopulation controls for CPS.
A myriad of data sources are tapped to measure post-censal change in the resident population due to births,deaths, and net migration. The National Center for HealthStatistics (NCHS) provides the Census Bureau with dataon births by sex, race, and Hispanic origin, although datafor the latest month must be projected. Deaths by age, sex,and race are also obtained from NCHS, although the latest6 months must be projected from a life table based onNCHS and Social Security Administration data. (The en-tire series of deaths for the Hispanic-origin population isprojected.) Data on legal international immigration areobtained from the Immigration and Naturalization Ser-vice, the Office of Refugee Resettlement, and the PuertoRican Planning Board (mostly projected between the lat-est July 1 to the current month, although preliminary data
are used to track refugee movements). EStimates of net un-documented immigration and permanent emigration oflegal United States residents are modeled using the 1980census and data from surveys and earlier censuses. The netmovement of United States citizens from overseas to theUnited States is estimated based on data provided by theDepartment of Defense and the Office of Personnel Man-agement (for military and civilian Federal Governmentpersonnel and their dependents). Other net migration isassumed to be zero (e.g., movement offoreign students andcivilians not affiliated with the Federal Government).Most of the data are characterized as administrative,although some data for recent months must be projected.Thus, while the data are not subject to sampling error, theymay contain nonsampling errors and bias.
The "inflation-deflation" method uses data from allthese sources to generate the current month's national (notState) projections of the resident population by age, sex,race, and ethnicity. The inflation-deflation method is avariant of the standard cohort-component method inwhich a population is aged forward a number of years tak-ing into account births, deaths, and net migration by age.The cohort-component method is improved by factoringin estimates of the decennial census undercount, using themethod of inflation-deflation.
The basic procedure may be described as follows. Foreach age-race-sex cell, the 1990 census population count isdivided by the corresponding estimate of the resident pop-ulation made by demographic analysis. The resulting in-flation-deflation factors are estimates of census coveragerates. The factors are assumed to be time-invariant and as-sociated with a specific age range. At the April 1 censusdate, the reciprocals of the factors are viewed as inflatingthe census figures up to the demographic analysisfigures (although these are not always larger). The demo-graphic analysis population estimate is aged forwardto the current time. Estimates of births and net migrationare added to each aged demographic analysis cell value,and estimates of deaths are subtracted. Each cell value isthen multiplied by the inflation-deflation factor of its newage to deflate the value. While not correcting for net censusundercount (which is both added and subtracted), the in-flation-deflation procedure preserves the age pattern of theundercount. For more information on data sources andmethods, see Current Population Reports, Series P-25, Re-ports 1045 and 1095, U.S. Bureau of the Census.
Let us consider an example. The 1990 factor of approxi-mately 0.98 for white male 13-year-olds represents a 2-per-cent undercount in the census; the factor of 1.02 for whitemale 17-year-olds represents an overcount of 2 percent.The demographic analysis population estimate is aged for-ward to the current time. Each aged demographic analysiscell value is adjusted for births, deaths, and migration.Each cell value is then multiplied by the inflation-defla-tion factor for its new age to deflate the cell value to corre-
33

::::
spond to the decennial census base. If the current referencedate is April 1994, the la-year-old white male cell value forthe census is inflated by dividing by 0.98 and aged forwardto 17 years of age. Deaths are subtracted, and net migra-tion figures are added. The cell value is then multi' plied bythe 1.02 factor for the 17-year- old group, effectivelygiving the new cell estimate a census overcount of 2percent.
To obtain the civilian noninstitutional population,which is the universe. for the CPS, the resident populationestimates for those 16 years of age and over are reduced bysubtracting both Armed Forces personnel residing in theUnited States and civilians living in institutions. The num-ber of resident Armed Forces personnel is estimated usingdata from the Department of Defense. The 1990 demo-graphic census data on the institutional population are up-dated annually through a canvass of group quarters facili-ties. The estimates of the resident population for those un-der 16 years of age are also reduced by subtracting the in-stitutional population.
As a last step, corrections for net census undercount areapplied. The level of the 1990 decennial census under-count is calculated from the PES by sex-race-ethnicity foreach year of age. The level of undercount is assumed to beinvariant over time, and a matrix of undercounts is addedto the population projections. The overall level of the pro-jections is raised by the addition of this constant matrix,but month-to-month changes in the population are unaf-fected. See U.S. Bureau of the Census, Assessment of Accu-racy of Adjusted versus Unadjusted 1990 Census Base foruse in Intercensal Estimates: Report of the Committee onAdjustment of Postcensal Estimates. The undercount ad-justed projections are aggregated to obtain the nationalage-sex-ethnicity and age-sex-race population controlsused in second-stage ratio adjustment.
State projections of the civilian noninstitutional popula-tion age 16 and over are developed using similar proce-dures. Population estimates for States are produced by ageand sex only (not race or Hispanic origin), and only the 16and over totals are used in computing independent con-trols. Information from tax returns is used to estimate mi-gration between States. For each State, the population 16years and over is calculated for each JUly. The two mostrecent July figures give the latest estimate of year-to-yearchange. For the current month, a straight-line extrapola-tion of the change is made, with a new base series for theprojection instituted each January. Counts of residentArmed Forces and the institutional population 16 yearsand older are subtracted to yield the civilian noninstitu-tional population. A pro rata adjustment ensures the addi-tivity of the State projections to the projection for thenational civilian noninstitutional population. For mereinformation,see Current Population Reports, Series P-25, .Reports 957 and 1010, Bureau of the Census.
34
Effect of 1990 census-based populationcontrols on national estimates
CPS estimates of major labor force characteristics forthe annual average of 1993, using both the 1980 census-based and adjusted 1990 census-based population con-trols, are presented in table 10. An undercount adjust-ment, based on results from the Census Bureau's PostEnumeration Survey (PES), is applied to the 1990-basedcontrols. These averages are based on monthly CPS esti-mates using the final weights computed after second-stageestimation, which are neither composited nor seasonallyadjusted. Under the new controls, the annual average esti-mate of the civilian noninstitutional population 16 years ofage and over increased by about 1.3 million or 0.7 percent;the civilian labor force increased by about 1.1 million or0.9 percent; and the level of unemployed increased by 0.2million or 2.3 percent. The estimated totals using the 1990population controls are considered to be more accurate,since these controls are projected from the April 1990decennial census estimates and adjusted for undercount,whereas the 1980-based controls are projected from the1980 decennial census estimates.
Under the new controls, the estimate of the annual aver-age unemployment rate increased by 0.1 percentage point,primarily because of the large upward population adjust-ment for Hispanics (see below), who have an unemploy-ment rate higher than the overall labor force. The laborforce participation rate increased by 0.2 percentage point;and the employment-population ratio increased by 0.1percentage point.
Levels increased for the civilian noninstitutional popula-tion and all labor force categories in all demographicgroups shown in table 10. The most notable increases oc-curred for Hispanics. The change from the 1980- to1990-based estimates of the population for this group wasapproximately 11 percent, with similar percentage in-creases in employed and unemployed levels. The differencebetween the 1980- and 1990-based estimates of the unem-ployment rate for all groups, except teenagers, was near thenational average of 0.1 percentage point; for teenagers,there was negligible change in the unemployment rate.
Differences in labor force participation rates for adultmen, blacks, and Hispanics were above the national aver-age of 0.2 percentage point, while the differences for adultwomen, teenagers, and whites were below the nationalaverage. Differences in employment-population ratios alsoexceeded the national average of 0.1 percentage pointfor adult men, blacks, and Hispanics, while there were vir-tually no differences for adult women, teenagers, andwhites.
Total effects due to changes in methods andpopuJation controls
Differences in labor force estimates using the old and

. new questionnaires and data collection' procedures werepresented in the section on the redesign. These differenceswere calculated from 1993 annual average CPS and para-llel survey estimates based on 1980 population controlsand represent changes that can be attributed to the rede-sign. Changes in 1993 CPS estimates attributed to the newpopulation controls were discussed in the previous section.This section presents a brief discussion of the combined ef-fects of the new questionnaire and controls by comparinglabor force estimates from the 1993 CPS, adjusted to1980-based controls, with estimates from the parallel sur-vey, adjusted to 1990-based controls.
Table 10 shows annual average estimates of major laborforce characteristics for the 1993 CPS (1980-based) andthe parallel survey (1990-based) and the differences be-tween these estimates. The effects from the new methodsand population controls are essentially additive. For ex-ample, the estimate of civilian labor force increased by 2million; an increase of 1.1 million is due to the new popula-tion controls as reported in the previous section, and theremainder (0.9 million) is attributed to the survey rede-sign. Similarly, estimated total employment increased by1.1 million under the new methods and population con-trols. Of this amount, about 0.9 million is due to the newcontrols and 0.2 million is contributed by the new ques-tionnaire. Total unemployment increased by 0.9 million,of which 0.7 million is attributed to the redesign and 0.2million is due to the new population controls.
The sum due to the population controls and the redesignmay not equal the total effect in table 10, primarily becausethe new population controls affect CPS and parallel surveyestimates differently. For example, the parallel surveyyields a larger estimate of the number of unemployed; con-sequently, the effect due to the population controls wouldbe slightly larger for that survey estimate. In addition,there are minor differences in the CPS and parallel surveysecond-stage estimation algorithms.
The breakdown of the total effect on various rates andratios is given in table 11. The increase in the annual aver-age unemployment rate is 0.6 percentage point; since thedifference due to population controls is 0.1 percentagepoint, the contribution from the redesign is 0.5 percentagepoint. The labor force participation rate increased by a to-tal of 0.6 percentage point, with 0.2 percentage point dueto population controls. The total change in the employ-ment-population ratio is 0.2 percentage point. The changeattributed to the redesign is about half this amount, or 0.1percentage point. Note that the total effect is not alwaysthe sum of two positive effects. For example, the total ef-fect for adult men's employment-population ratio is -0.4percentage point. The effect from population controls is0.3 percentage point, and the questionnaire effect is -0.7percentage point.
Table 11 also shows that for the unem ployment rate theeffects from new population controls are about 0.1 per-centage point for all demographic groups except teenag-ers. The total effects vary from 0.3 percentage point foradult men to 1.6 percentage points for teenagers. The ef-fects from population controls are fairly stable over timeso the annual average is similar to the population controleffect for a given month; however, as the redesign effectsvary from month to month, especially for Hispanics andteenagers, the annual average redesign effect may not be agood indicator of difference for a single month.
The total change for labor force participation rates intable 11 varies from -0.2 percentage point for adult men to2.3 percentage points for teenagers and Hispanics. The ef-fect due to population controls is largest for blacks. For theemployment-population ratio, the total changes are largerfor teenagers (about 1 percentage point, all attributed tothe redesign) and Hispanics (0.8 percentage point from theredesign and 0.3 percentage point due to population con-trols). Again, the estimates of the redesign effects for teen-agers and Hispanics have a high degree of month-to-month variability, primarily due to small sample sizes. Foradult men and blacks, the total effect on the employment-population ratio is a decline of about one-half of one per-centage point.
Effect on State and Area EstimatesBeginning with estimates for January 1994, State and
area labor market statistics produced by BLS in coopera-tion with State Employment Security Agencies also reflecta number of important changes. Consistent with changesaffecting the national data, these include:
• implementation of the CPS redesign, and
• introduction of 1990 census-based population con-trols (adjusted for the estimated population undercount).
In addition, the State and area labor market estimatesare affected by:
• improved time-series models for the smaller States,and
• incorporation of selected 1990 census data in thegeographic definition of labor market areas and in localarea labor force estimation.
Each of these topics will be explained in a detailedarticle which will appear in the March 1994 issue of thispublication.
Further InformationAdditional information is available on all of the suh.jects
covered in this article. Requests should be sent to: Il.S,Bureau of Labor Statistics, Room 4675, 2 MassachusettsAvenueNE., Washington, DC 20212-0001. The telephonenumber is (202) 606~6378; Fax (202) 606-6426.
35

Table 10. Total effect of the adjusted 1990 census-based population controls and the redesign on selected labor 'force groups, 1993annual averages
(Numbers in thousands\
CPS Parallel survey Effect2
Adjusted Adjusted Popu-Employment status and group 1980 1990 1980 1990 Total lation Redesign
census- census- census- census- controlsbased! based based based (4-1) (2-1) (3-1)
(1) . (2) (3) (4) (5) (6) (7)
TOTAL
Civilian noninstitutional population ........ 193,550 194,805 193,550 194,805 1,255 1.255 0Civilian labor force' ................... 128,103 129,240 128,965 130,103 2,000 1,137 862
Percent of population ............. 66.2 66.3 66.6 66.8 .6 .2 .4Employed ....................... , 119,389 120,323 119,606 120,511 1,112 934 217
Employment-population ratio .•. , ... 61.7 61.8 61.8 61.9 .2 .1 .1Unemployed ...................... 8,714 8,917 9,359 9,592 878 203 645
Unemployment rate ......... ,. '" 6.8 6.9 7.3 7.4 .6 .1 .5
Men, 20 years and over
Civilian noninstitutional population ........ 85,906 86,290 85,850 86,236 329 384 -56Civilian labor force ................... 66,On 66,680 65,599 66,197 120 604 -478
Percent of population ............. 76.9 n.3 76.4 76.8 -.2 .4 -.5Employed ........................ 61,884 62,402 61,283 61,786 -97 519 -601
Employment-population ratio ....... 72.0 72.3 71.4 71.7 -.4 .3 -.6Unemployed ...................... 4,193 4,278 4,316 4,410 218 85 123
Unemployment rate '" .......... , 6.4 6.4 6.6 6.7 .3 .1 .2
Women, 20 years and over
Civilian noninstitutional popUlation ........ 94,389 94,598 94,361 94,590 201 209 -28Civilian labor force ....•.............. 55,184 55,379 56,162 56,363 ,178 195 978
Percent of population ..........•.. 58.5 58.5 59.5 59.6 1.1 .1 1.0Employed ........ , ............... 51,966 52,110 52,604 52,735 769 144 638
Employment-population ratio ....... 55.1 55.1 55.8 55.8 .7 .0 .7Unemployed ....................... 3,218 3,270 3,559 3,627 409 51 340
Unemployment rate '0 •••••• , ••••• 5.8 5.9 6.3 6.4 .6 .1 .5
Both sexes, 16 to 19 years
Civilian noninstitutional population ........ 13,254 13,916 13,338 13,979 725 662 84Civilian labor force ................... 6,842 7,180 7,203 7,543 701 338 361
Percent of populeuon ............. 51.6 51.6 54.0 54.0 2.3 .0 2.4Employed •••••• "0 •••• "0', •••• "0 5,540 5,812 5,719 5,989 449 272 179
Employment-population ratio ....... 41.8 41.8 42.9 42.8 1.1 .0 1.1Unemployed .· .. ·.0 ............... 1,302 1,369 1,485 1,554 252 66 182
Unemployment rate • to' '" ••••••• 19.0 19.1 20.6 20.6 1.6 .0 1.6
White
Civilian n6ninstitutional population ........ 163,921 164,268 163,921 164,268 347 347 0Civilian labor force ................... 109,407 109,736 110,209 110,550 1,143 329 802
Percent of population ............. 66.7 66.8 67.2 67.3 .6 .1 .5Employed '" ......... , .. , ........ 102,891 103,114 103,267 103,482 592 223 376
Employment-population ratio ....... 62.8 62.8 63.0 63.0 .2 .0 .2Unemployed ............. , ........ 6,516 6,622 6,942 7,067 551 106 426
Unemploy ment rate '" ........... 6.0 6.0 6.3 6.4 .4 .1 .3
•Black
Civilian noninstitutional population .. " .... 22,329 22,505 22,329 22,505 176 176 0Civilian labor force ................... 13,957 14,224 13,908 14,171 214 267 -49
Percent of population ............. 62.5 63.2 62.3 63.0 .5 .7 -.2Employed ................... '" ... 12,148 12,370 11,923 12,133 -14 222 -225
Employment-poPlllation ratio ....... 54.4 55.0 53.4 53.9 -.5 .6 -1.0Unemployed ...................... 1,809 1,855 1,985
i2,038 229 45 176
Unemployment rate .............. 13.0 13,0 14.3 I 14.4 I 1.4 .1 1.3
36

Table 10. Total effect of the adjusted 1990census-based population controls and the redesign on selected labor force groups, 1993annual averages-Continued
(Numbers in thousands)
CPS Parallel survey Effect2
Adjusted Adjusted Popu-Employment status and group 1980 1990 1980 1990 Total lation Redesign
census- census- census- census- controlsbasedl based based based (4-1) (2-1) (3-1)
(1) (2) (3) (4) (5) (6) (7)
Hispanic origin
Civilian noninstitutional population ........ 15,753 17,505 15,753 17,505 1,752 1,752 0Civilian labor force .....•.•........... 10,385 11,611 10,666 11,933 1,548 1,226 281
Percent of population ...... '" .... 65.9 66.3 67.7 68.2 2.3 .4 1.8Employed ........................ 9,285 10,370 9,412 10,528 1,243 1,085 127
Employment-population ratio .•..... 58.9 59.2 59.7 60.1 1.2 .3 .8Unemployed ..................•... 1,100 1,241 1,254 1,405 305 141 155
Unemployment rate .............. 10.6 10.7 11.8 11.8 1.2 .1 1.2
1 These estimates differ slightly from previously published 1993 aver-ages because of the estimation procedure used.
2 Changes in column 5 minus those in column 6 do not necessarilyequal those in column 7 primarily because the population controls af-fected the CPS and the parallel survey estimates differently. Moreover,population estimates obtained from the two surveys do not always
agree due to slight differences in estimating procedures.
NOTE: Detail for the above race and Hispanic-origin groups will notsum to totals because data for the "other races" group are not presentedand Hispanics are included in both the white and black population groups.
Table 11_ Total effect of adjusted 1990 census-based population controls and the redesign on selected labor force ratios and rates,1993 annual averages.
(Percent)
Effect2
Category CPS 1980 Parallel survey,census-based" adjusted 1990 Population
census-based Total controls Redesign
Labor force participation rates
Total, 16 years and over ...................... 66.2 66.8 0.6 0.2 0.4Men, 20 years and over •••••••••• 0 •••••••••• 76.9 76.8 -.2 .4 -.5Women, 20 years andover .. , ............... 58.5 59.6 1.1 .1 1.1Both sexes, 16 to 19 years ..............•.... 51.6 .54.0 2.3 .0 2.4White ..................................... 66~7 67.3 .6 .1 .5Black ..................................... 62.5 63.0 .5 .7 -.2Hispanic origin ............................. 65.9 68.2 2.3 .4 1.8
Employment-population ratios
Total, 16 years and over ...................... 61.7 61.9 .2 .1 .1Men, 20 years and over •••••••••••••• 0 •••••• 72.0 71.7 -.4 .3 -.7Women, 20 years and over '" .... " ......... 55.1 55.8 .7 .0 .7Both sexes, 16 to 19 years ................... 41.8 42.8 1.1 : .0 1.1White ................•.................... 62.8 63.0 .2 .0 .2Black ................•..............•..... 54,4 53.9 -.5 .6 -1.0Hispanic origin .....•....................... 58.9 60.1 1.2 .3 .8
Unemployment rates
Total, 16 years and over •••• 0 ••••••••••• 0 •• ' •• 6.8 7.4 .6 .1 .5Men, 20 years and over ••••••••••• 0 ••••• II ••
6.4 6.7 .3 .1 .2Women, 20 years and over ....... , .......... 5.8 6.4 .6 .1 .5Both sexes, 16 to 19 years .................•. 19.0 20.6 1.6 .0 1.6White ..................................... 6.0 6.4 .4 .1 .3Black ..................................... 13.0 14.4 1.4 .1 1.3Hispanic origin ............................. 10.6 11.8 1.2 .1 1.2
1 These estimates differ slightly from previously published 1993 av-erages because of the estimation procedure used.
2 The sum ofthe difference due to population controls and the redesignmay not equal the total difference primarily due to rounding.
37