revision 3 z-contrast imaging and ab initio study on “d” … · 2015. 5. 21. · 62 2002). with...
TRANSCRIPT

Revision 3 1
Z-contrast imaging and ab initio study on “d” superstructure in sedimentary 2
dolomite 3
Zhizhang Shen1, Hiromi Konishi1, Izabela Szlufarska2, Philip E. Brown1, and Huifang Xu1* 4
5
1 NASA Astrobiology Institute, Department of Geoscience, 6
University of Wisconsin - Madison 7
Madison, Wisconsin 53706 8
2 Department of Materials Science and Engineering, 9
University of Wisconsin-Madison, 10
Madison, Wisconsin 53706 11
12
13
* Corresponding author: Dr. Huifang Xu 14
Department of Geoscience, 15
University of Wisconsin-Madison 16
1215 West Dayton Street, A352 Weeks Hall 17
Madison, Wisconsin 53706 18
Tel: 1-608-265-5887 19
Fax: 1-608-262-0693 20
Email: [email protected] 21
22
ABSTRACT 23
Nano-precipitates with tripled periodicity along the c-axis are observed in a Ca-rich dolomite 24
sample from Proterozoic carbonate rocks with “molar tooth” structure. This observation is 25
consistent with previous description of d reflections. High-angle annular dark-field STEM 26
imaging (or Z-contrast imaging) that avoids dynamic diffraction as seen in electron diffraction 27
and high-resolution TEM imaging modes, confirms that d reflections correspond to nanoscale 28
precipitates aligned parallel to (001) of the host dolomite. The lamellae precipitates have a cation 29
ordering sequence of Ca-Ca-Mg-Ca-Ca-Mg along the c direction resulting in a chemical 30
composition of Ca0.67Mg0.33CO3. This superstructure is attributed to the extra or d reflections, 31
thus is referred to as the d superstructure in this study. The structure can be simply described as 32
interstratified calcite/dolomite. The crystal structure of the d superstructure calculated from 33
density functional theory (DFT) has a space group of P31c and has a and c unit cell parameters 34
of 4.879 Å and 16.260 Å, respectively, values between those of dolomite and calcite. The 35
detailed structural characteristics and parameters obtained from ab initio calculations are also 36
reported in this paper. The method of combining Z-contrast imaging and ab initio calculation can 37
be used for solving structures of other nano-precipitates and nano-phases. 38
39

INTRODUCTION 40
The dolomite(R3c) structure has alternating Ca2+ and Mg2+ cation layers along the c-axis with 41
the triangular CO32- anion layers lying between two cation layers. Since the size of Mg2+ ions is 42
smaller than that of Ca2+, the CO32- layers are closer to Mg2+ layers. The lack of c glides in the 43
dolomite structure due to the cation ordering causes the occurrence of extra reflections (b 44
reflections, h 0l, l= odd) in dolomite diffraction patterns compared to that of calcite (a 45
reflections only) (Reeder, 1992). Two additional reflections (c and d reflections) have been 46
observed in natural sedimentary dolomite. Previously reported c reflections were interpreted as 47
being a result of cation ordering within dolomite basal planes (Van Tendeloo et al., 1985). Our 48
recent STEM work confirmed that the “c”-reflections could result from multiple diffraction 49
between the host dolomite and twinned Mg-calcite nano-lamellae under TEM imaging and 50
diffraction modes (Shen et al., 2013). The d reflection was first observed in Devonian dolomite 51
samples by Wenk and Zenger (1983) and have been also found in ankerite samples (Rekesten, 52
1990). The d reflections occur as satellites around a and b reflections with diffraction vector ~1/3 53
(000l)* and are usually streaking along c* direction (Wenk and Zenger,1983; Wenk and Zhang, 54
1985; Van Tendeloo et al., 1985). 55
56
Dynamical diffraction in transmission electron microscopy (TEM) mode has been a major 57
problem for structure determination as shown in previous work of analyzing “c” superstructures 58
(Shen et al., 2013). The scanning transmission electron microscopy (STEM) method uses the 59
high-angle annular dark-field (HAADF) detector to give the most highly localized 1s Bloch state 60
imaging, which eliminates most of the obvious effects of dynamical diffraction (Pennycook, 61

2002). With the advantage of a spherical aberration corrector, the resolution of HAADF STEM 62
or Z-contrast images is only limited by the size of the 1s Bloch state that is ~0.6-0.8 Å 63
(Pennycook et al., 2000). The intensity of Z-contrast images is dependent on the atomic number 64
of atoms through the ~ Z2 dependence of the Rutherford scattering cross-section, which thus 65
provides chemical information for the material (Kirkland, 1998; Pennycook et al., 2000). A study 66
of microstructures in natural dolomite samples using Z-contrast images may help find answers to 67
previous observations of superstructures and explore new microstructures in dolomite. 68
69
In addition to experimental studies in mineralogy, the application of ab initio calculations of 70
crystal structure, phase stability, and physical properties of minerals at given pressure and 71
temperature has increased in the past few years (Ogonov et al., 2006; Barnard and Xu, 2008; 72
Chatterjee and Saha-Dasgupta, 2010; Stackhouse et al., 2010). Density functional theory (DFT) 73
uses the functional of electron density to solve the Schrödinger equation for a many electron 74
system to acquire the minimum energy of the system (Scholl and Steckel, 2009). This method 75
can calculate the enthalpy of a system at 0K and the corresponding structure. Since STEM work 76
only provides topological information for the crystal structure, the use of the DFT method is 77
needed in this study to calculate the detailed crystal structure of the d phase and confirm our 78
model for the d superstructure by comparing the energetic stability of our model to another 79
model proposed in literature. 80
81
The “molar tooth” structure refers to vertical and horizontal ribbons and blobs of fine-grained 82
calcite in a dolomite host (Bauerman, 1885). This structure has only been recognized in 83
Mesoproterozoic and Neoproterozoic marine carbonate rocks with a few exceptions (Frank and 84
Lyons, 1998). The origin and the temporally limited occurrence of molar tooth carbonate have 85
bewildered geologists for over a century (James et al., 1998; Pratt, 1998; Meng and Ge, 2002; 86
Marshall and Anglin, 2004; Pollock et al., 2006; Long, 2007; Kuang et al., 2012). However, no 87
previous work on the nano-scale mineralogy of carbonates with the “molar tooth structure” has 88
been conducted. In this present study, STEM imaging and DFT calculations were combined to 89
provide a complete crystallographic description of the d superstructure. 90
91
SAMPLES 92
The “molar tooth” carbonate samples were collected near Hungry Horse Dam, Montana, from 93
outcrops of the Helena Formation of the Mesoproterozoic Belt Group (Frank and Lyons, 1998). 94
The sample HHL-00H was chosen for STEM analysis. In the hand specimen of HHL-00H 95
(Figure 1), the thin sinuous vertical and horizontal ribbons with width of ~0.2-1.5cm intersect 96
each other. The “molar tooth” is composed of clean and fine-grained calcite crystals with similar 97
size (~10 μm). The “molar tooth” host has three major phases: dolomite, calcite, and quartz 98
(Figure 2). K-feldspar, illite, chlorite, rutile, and apatite are also present in the “molar tooth” host 99
rock. The XRD powder analysis of the “molar tooth” host rock shows that the dolomite is cation-100
ordered with the presence of sharp (105) and (009) peaks. The dolomite has a composition of 101
~Ca1.02Mg0.98(CO3)2 based on the d104 value (2.890Å) and the relationship between d104 values 102
and MgCO3 content in ordered dolomite (Goldsmith and Graf, 1958; Zhang et al., 2010). 103
104
METHODS 105

Specimens for STEM measurements were prepared by ion milling. Ion milling was performed 106
with a Fischione 1010 ion mill operated at an accelerating voltage of 4 kV and an incident ion-107
beam angle of 10°, followed by gentler milling at an accelerating voltage of 2.6 kV and an 108
incident angle of 10° in order to reduce surface amorphous material. The ion-milled samples 109
were lightly carbon coated. The microstructures in the dolomite crystals were examined by using 110
a spherical aberration-corrected FEG- STEM (Titan 80-200) operating at 200 kV at the 111
University of Wisconsin-Madison. This instrument can image single atoms with ~ 0.1 nm or 112
better spatial resolution in STEM mode. Probe current was set at 24.5 pA. Camera length for the 113
image acquisition was set at 160 mm. Collection angle of the HAADF detector for acquiring the 114
Z-contrast images ranges from 54 to 270 milliradians (mrads). 115
116
The DFT calculations were performed by using the Vienna ab initio simulation package (VASP) 117
(Kresse et al., 1996). The general gradient approximation (GGA) with the Perdew, Burke, and 118
Ernzerhof (PBE) parameters was employed (Perdew et al., 1996). The projector-augmented wave 119
(PAW) method with an energy cutoff of 600 eV was used. A conventional hexagonal supercell 120
of calcite derived structures including 30 atoms or 6 chemical formula units was used. We tested 121
k-point convergence and a mesh of 3×3×1 was found to be sufficient for the system. Two 122
starting structures for the d phase: one with calcite’s unit cell parameters from experiments 123
(Graf, 1969) and another with dolomite’s (Beran and Zemann, 1977). All the initial structures 124
were optimized using the static energy minimization scheme, where both the shape and volume 125
of the cell were allowed to relax. The structure with minimum energy calculated from the 126
previous step was further calculated by ab initio molecular dynamics simulations at 10K to better 127

explore the local minimum. The powder and electronic diffraction patterns of calculated 128
structures were generated by CrystalDiffract® and SingleCrystalTM respectively. 129
130
HIGH-RESOLUTION (S)TEM OBSERVATIONS 131
In TEM images, the modulated microstructures with strong strain contrast are prevalent through 132
the “molar tooth” host dolomite. Calcite inclusions that are a common phenomenon in 133
sedimentary dolomites can be easily recognized because of being free of modulations (Figure 3). 134
Diffuse streaks along c* occur in the electron diffraction pattern of the host dolomite (Figure 4). 135
Some maxima of the streaks are about one third of (Fig. 4, and also see diffraction patterns 136
of Wenk and Zenger, 1983; Wenk and Zhang, 1985). According to the Fast Fourier Transform 137
(FFT) patterns of different areas in the dolomite images, the streaks in the diffraction pattern 138
come from the precipitates with linear features that are parallel to (001) (Figure 5). However, the 139
precipitates themselves are arranged in such a way that they are roughly parallel to (114). The 140
observations above match the features of d reflections that were first described by Wenk and 141
Zenger (1983). It was proposed that the streaks parallel to c* could be from stacking disorder 142
(Van Tendeloo et al., 1985). 143
144
The dark areas of the precipitates in the bright field (BF) image under STEM mode become 145
bright areas in the HAADF image (Figure 6), which suggests higher Ca contents in the 146
precipitates than the host dolomite. The occurrence of d reflections in the FFT pattern of the 147
HAADF image excludes the possibility that they are caused by multiple diffraction. In the 148
HAADF of high magnification or Z-contrast image (Figure 7), the alternating bright and dark 149

layers along c axis represent the alternating Ca and Mg layers in the normal dolomite structure. 150
However, the d dolomite precipitate has the cation sequence of Ca-Ca-Mg-Ca-Ca-Mg- (Figure 151
7). The FFT pattern of this domain shows that the d reflections are attributed to this 152
superstructure. This observation is different from the previous model for the d superstructure in 153
which every third Mg layer is replaced by a Ca layer producing a sequence of Ca-Mg-Ca-Ca-Ca-154
Mg- (Wenk and Zhang, 1985). But both sequences produce the same chemical stoichiometry of 155
Ca0.67Mg0.33CO3. However, the repetition along the c-axis is doubled in the previous model with 156
respect to the observed Ca-Mg ordering in the Z-contrast image (Figure 7). 157
158
Mg-bearing calcite precipitates are also observed in the dolomite (Figure 8). Along the (102) 159
trace, the calcite exsolution region has six consecutive Ca layers as opposed to the dolomite host 160
that has alternating Ca and Mg layers. In the line profile of the calcite region, some Ca columns 161
have slightly lower intensities than the pure Ca columns in the dolomite host, which suggests the 162
existence of a small amount of Mg in this calcite precipitate (Figure 8). This calcite exsolution is 163
similar to Mg-calcite precipitates in Ca-rich dolomite (Shen et al., 2013). 164
165
DFT CALCULATIONS 166
The structural parameters for the optimized d superstructure from DFT calculations are listed in 167
Table 1. Tables 2 and 3 compare the calculated lattice parameters of dolomite and calcite 168
structures with the reported experimental data. The calculated equilibrium volumes for both 169
dolomite and calcite are slightly smaller than the reported data, the underestimation of the c 170
parameter being the major contribution, but are still within the range of previous theoretical 171

calculation data (see Table 2 and 3). The calculated values are for the structures at 0K. The 172
reported experimental values were measured at ambient environment. Temperature could be a 173
factor for the small discrepancy between calculated and measured the unit cell volumes. A small 174
discrepancy between calculated and experimental values of lattice parameters is not uncommon 175
for DFT calculations and may result from the use of an approximate exchange-correlation 176
potential (Hossain et al., 2011). In spite of this discrepancy, the trend found in experimental data 177
is maintained in our DFT calculations. The calculated d superstructure has an a parameter close 178
to that of dolomite but has a c parameter closer to stoichiometric calcite. This finding is 179
consistent with the observation from the diffraction patterns of the d superstructure that the 180
difference between a parameters of dolomite and the d superstructure is smaller than that 181
between c parameters, even though the DFT calculations are unconstrained bulk structure 182
calculations. This trend is reasonable because superstructure precipitates share the (001) interface 183
with the host dolomite. Smaller differences in the a dimensions between the host dolomite and d 184
superstructure would cause less strain at the interface. 185
186
The C-O bonds in CO32- groups are rigid and the C-O distances in both experimental and 187
calculation data are constant no matter what the actual composition of the carbonate mineral is. It 188
is interesting to note that the C-O distances in the d superstructure are divided into two categories 189
(Table 1): 1.294Å when a CO32- layer is between Ca2+ and Mg2+ layers along the c axis; and 190
1.297Å when a CO32- layer is in between two Ca2+ layers. DFT calculations predict slightly 191
shorter Ca-O and Mg-O bonds in dolomite and calcite than experimental data (Table 2 and 3). 192
The Mg-O distance in the d superstructure increases from 2.069Å in calculated dolomite to 2.085 193
Å. The Ca-O distance in the d superstructure differs depending on the oxygen positions; the Ca-194

O distances (2.374 Å) are larger when the oxygen ions are from CO32- group sitting in between 195
Ca2+ and Mg2+ layers than those (2.355 Å) from CO32- group between two Ca2+ layers. This is 196
because that the CO32- layers are closer to Mg2+ layers than Ca2+ layers due to the smaller Mg2+ 197
radius. The inversion center is missing in the d superstructure while the c glide is retained. The 198
existence of (100) and (200) reflections in the diffraction pattern proves that it is not a 199
rhombohedral unit cell, but a primitive hexagonal (Figure 9C). Therefore, the space group is 200
determined to be P31c (No. 159). The atom coordinates and symmetry equivalent positions of 201
the d superstructure are reported in Table 1. 202
203
The superstructure with cation sequence of Ca-Mg-Ca-Ca-Ca-Mg-Ca that was proposed to 204
explain the d reflections was referred to as δ structure (Wenk and Zhang, 1985; and Wenk et al., 205
1991) (see Figure 9A for details). The calculated δ structure has slightly larger unit cell 206
parameters (a = 4.883Å and c = 16.281Å) than the d superstructure indicated here. The enthalpy 207
of a unit cell of δ structure is slightly higher than that of the d superstructure by 0.54 kJ/mol per 208
MCO3 unit. The previously proposed δ structure is unstable with respect to the current d 209
superstructure. The proposed δ structure model was based on the assumption that overlapped 210
diffraction patterns from host dolomite and d superstructure were from the precipitates only 211
(Wenk and Zhang, 1985). Careful examination of their diffraction pattern (Fig. 1A of Wenk and 212
Zhang, 1985) and our FFT pattern (Figure 9D), show that the position of 003 is not half way 213
between 002 and 004 of the d superstructure, and the position of 009 is not midway between 008 214
and 0010 of the d superstructure. The d superstructure does not have reflections with odd l due to 215
its c-glide. A powder X-ray diffraction pattern with d104 value of 2.930Å for the d superstructure 216
is also calculated (Fig. 10). 217

The observed intermediate phases are analogous to those locally ordered domains in 218
mixed-layer clay minerals, such as interstratified chlorite/serpentine, chlorite/biotite, and 219
chlorite/pyrophyllite minerals (Banfield and Bailey, 1996; Xu and Veblen, 1996; Xu et al., 1996; 220
Wang and Xu, 2006). The observed intermediate phase between calcite and dolomite may be 221
described as interstratified calcite/dolomite, instead of δ–dolomite or d-dolomite. 222
223
IMPLICATIONS 224
The calculated energies of calcite (Ca(CO3)), dolomite (CaMg(CO3)2), and d superstructure 225
(Ca2Mg(CO3)3) are 3620.64, 7132.37 and 10740.22 kJ/mol, respectively. The energy for the d 226
superstructure (Ca2Mg(CO3)3) is higher (~4.2 kJ/mol per MCO3 unit) than the sum of the 227
calculated energies from dolomite (CaMg(CO3)2) and calcite (CaCO3) end members. The d 228
superstructures serve as a metastable phase with respect to the stoichiometric dolomite and 229
calcite. The d superstructures have a maximum of 4 repeats of Ca-Ca-Mg- along the c axis (< 230
35Å) in our sample and are only stable within dolomite host in the form of nano-precipitates. It 231
is very difficult for extra Ca ions in the dolomite structure to diffuse through carbonate layers 232
and to congregate to form lamellae parallel to the basal plane at low temperature (Wenk et al., 233
1991; Shen et al., 2013). This explains all the reported occurrences of nano-precipitates of d-234
reflections in natural samples. Wenk et al. (1991) summarized the various proposed 235
superstructures of Ca-Mg carbonates. By using Z-contrast imaging, we can image the cation 236
ordering directly and propose a more accurate structure model. By using the DFT method, we 237
can calculate the detailed structures and explore the energetics of these metastable nano-phases. 238

The methods may be applied to understand many other nano-phases, where there are challenges 239
or artifacts by using other methods. 240
241
ACKNOWLEDGEMENTS 242
This work is supported by NASA Astrobiology Institute (N07-5489) and NSF (EAR-095800). 243
Shen also thanks alumni of the Department of Geosciece for supporting his field trips. 244

REFERENCES 245
Aydinol, M., Mantese, J. and Alpay, S. (2007) A comparative ab initio study of the ferroelectric 246
behaviour in KNO3 and CaCO3. Journal of Physics: Condensed Matter, 49, 496210 247
Ayoub, A., Zaoui, A. and Berghout, A. (2011) High-pressure structural phase transitions and 248
mechanical properties of calcite rock. Computational Materials Science, 3, 852-857 249
Bakri, Z. and Zaoui, A. (2011) Structural and mechanical properties of dolomite rock under high 250
pressure conditions: A first principles study. physica status solidi (b), 8, 1894-1900. 251
Banfield, J.F., and Bailey, S.W. (1996) Formation of regularly interstratified serpentine – 252
chlorite minerals by tetrahedral inversion in long-period serpentine polytypes. American 253
Mineralogist, 81, 79-81. 254
Barnard, A. S. and Xu, H. (2008) An environmentally sensitive phase map of titania 255
nanocrystals. ACS NANO, 2 (11), pp 2237–2242. 256
Beran, A. and Zemann, J. (1977) Refinement and comparison of the crystal structures of a 257
dolomite and of an Fe-rich ankerite. Tschermaks mineralogische und petrographische 258
Mitteilungen, 4, 279-286 259
Chatterjee, S. and Saha-Dasgupta, T. (2010) First-principles simulations of structural, electronic, 260
and magnetic properties of vacancy-bearing Fe silicates. Physical Review B, 15, 155105 261
Frank, T.D. and Lyons, T.W. (1998) “Molar-tooth” structures: A geochemical perspective on a 262
Proterozoic enigma. Geology, 8, 683-686 263
Goldsmith, J.R., and Graf, D.L. (1958) Relation between lattice constants and composition of the 264
Ca-Mg carbonate: American Mineralogist, 43, 84-101. 265
Graf, D. (1969) Crystallographic tables for the rhombohedral carbonates. A correction. American 266
Mineralogist, 325 267
Kuang, H., Liu, Y., Peng, N., Luo, S., Li, J., Cen, C., and Chen, M. (2012) Molar‐Tooth 268
Structure from the Mesoproterozoic Wumishan Formation in Lingyuan, Yanshan Region, 269

North China, and Geological Implications. Acta Geologica Sinica‐English Edition, 1, 85-270
95 271
Hossain, F., Dlugogorski, B., Kennedy, E., Belova, I. and Murch, G. (2011) First-principles 272
study of the electronic, optical and bonding properties in dolomite. Computational 273
Materials Science, 3, 1037-1042 274
James, N.P., Narbonne, G.M. and Sherman, A.G. (1998) Molar-tooth carbonates: shallow 275
subtidal facies of the Mid- to Late Proterozoic. Journal of Sedimentary Research, 5 276
Kirkland, E.J. (1998) Advanced computing in electron microscopy. Plenum Press, New York, 277
250 pp. 278
Kresse, G. and Furthmüller, J. (1996) Efficiency of ab-initio total energy calculations for metals 279
and semiconductors using a plane-wave basis set. Computational Materials Science, 1, 280
15-50 281
Long, D.G. (2007) Tomographic study of Paleoproterozoic carbonates as key to understanding 282
the formation of molar-tooth structure. Gondwana Research, 4, 566-570 283
Marshall, D. and Anglin, C. (2004) CO2-clathrate destabilization: a new model of formation for 284
molar tooth structures. Precambrian Research, 3, 325-341 285
Meng, X. and Ge, M. (2002) The sedimentary features of Proterozoic microspar (Molar-tooth) 286
carbonates in China and their significance. Episodes-Newsmagazine of the International 287
Union of Geological Sciences, 3, 185-195 288
Oganov, A.R., Glass, C.W. and Ono, S. (2006) High-pressure phases of CaCO3: Crystal structure 289
prediction and experiment. Earth and Planetary Science Letters, 1, 95-103 290
Pennycook, S. (2002) Structure determination through Z-contrast microscopy. Advances in 291
imaging and electron physics, 173-206 292

Pennycook, S., Rafferty, B. and Nellist, P. (2000) Z-contrast imaging in an aberration-corrected 293
scanning transmission electron microscope. Microscopy and Microanalysis, 04, 343-352 294
Perdew, J.P., Burke, K. and Ernzerhof, M. (1996) Generalized gradient approximation made 295
simple. Physical Review Letters, 18, 3865-3868 296
Pollock, M.D., Kah, L.C. and Bartley, J.K. (2006) Morphology of molar-tooth structures in 297
Precambrian carbonates: influence of substrate rheology and implications for genesis. 298
Journal of Sedimentary Research, 2, 310-323 299
Pratt, B.R. (1998) Molar-tooth structure in Proterozoic carbonate rocks: Origin from 300
synsedimentary earthquakes, and implications for the nature and evolution of basins and 301
marine sediment. Geological Society of America Bulletin, 8, 1028-1045 302
Reeder, R.J. (1992) Carbonates: growth and alternation microstructures. In P.B. Buseck, Eds., 303
Minerals and Reactions at the Atomic Scale: Transmission Electron Microscopy, 27, p. 304
381-424. Reviews in Mineralogy, Mineralogy Society of America, Washington, D.C. 305
Reksten, K. (1990) Superstructures in calcian ankerite. Physical Chemistry of Minerals, 17, 266-306
270 307
Shen, Z., Konishi, H., Brown, P.E. and Xu, H. (2013) STEM investigation of exsolution lamellae 308
and “c” reflections in Ca-rich dolomite from the Platteville Formation, western 309
Wisconsin. American Mineralogist, 4, 760-766 310
Sholl, D. and Steckel, J.A. (2011) Density functional theory: a practical introduction Wiley-311
Interscience. 312
Stumm, W. and Morgan, J.J. (1995) Aquatic chemistry: chemical equilibria and rates in natural 313
waters. JOHN WILEY & SONS, NEW YORK, NY 10158(USA). 1995. 314
Van Tendeloo, G., Wenk, H. and Gronsky, R. (1985) Modulated structures in calcian dolomite: 315
A study by electron microscopy. Physics and Chemistry of Minerals, 6, 333-341. 316

Wang, Y., and Xu, H. (2006) Geochemical chaos: periodic and nonperiodic growth of mixed-317
layer phyllosilicates. Geochimica et Cosmochimica Acta, 70, 1995-2005. 318
Wenk, H. and Zhang, F. (1985) Coherent transformations in calcian dolomites. Geology, 7, 457-319
460 320
Wenk, H. and Zenger, D. (1983) Sequential basal faults in Devonian dolomite, Nopah Range, 321
Death Valley area, California. Science, 4623, 502-504 322
Wenk, H., Hu, M., Lindsey, T. and Morris Jr, J. (1991) Superstructures in ankerite and calcite. 323
Physics and Chemistry of Minerals, 6, 527-539. 324
Xu, H., and Veblen, D.R. (1996) Interstratification and other reaction microstructures in the 325
chlorite-berthierine series. Contribution to Mineralogy and Petrology, 124, 291-301. 326
Xu, H., Zhang, Y., and Veblen, D. R. (1996) Periodic and nonperiodic interstratification in the 327
chlorite-biotite series. American Mineralogist, 81, 1396-1404. 328
Zhang, F., Xu, H., Konishi, H., and Roden, E.E. (2010) A relationship between d104 value and 329
composition in the calcite - disordered dolomite solid solution series. American 330
Mineralogist, 95(11-12), 1650-1656. 331
332

Figure 1. (A)The outcrop shows the brittle deformation inside the carbonate layers with “molar tooth” structure. (B) Sinuous dark blue riboons of fine crystallined calcite (“molar tooth”) exist in the dolomite host that is weathered into buff color. (C) Weathered surface of HHL-00H specimen . (D) “Molar tooth” becomes light color in fresh cut surface of HHL-00H specimen.

Figure 2. Powder XRD pattern of “molar tooth” host and “molar tooth” in sample HHL-00H.
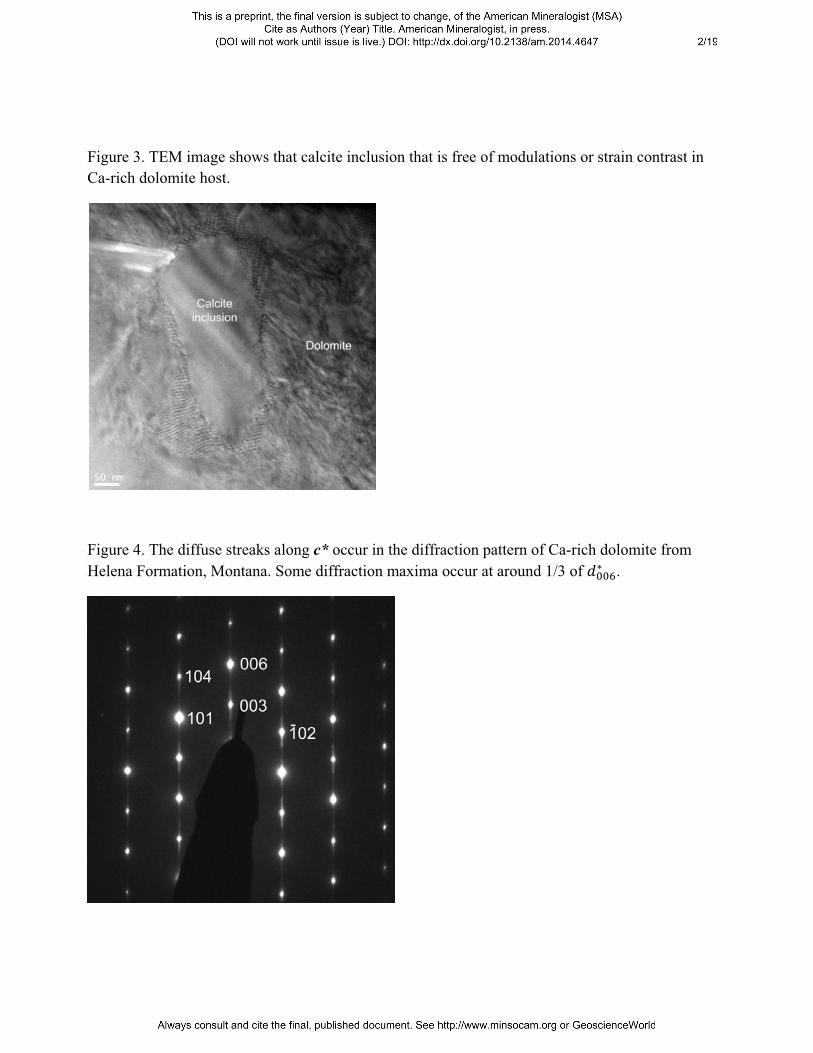
Figure 3. TEM image shows that calcite inclusion that is free of modulations or strain contrast in Ca-rich dolomite host.
Figure 4. The diffuse streaks along c* occur in the diffraction pattern of Ca-rich dolomite from Helena Formation, Montana. Some diffraction maxima occur at around 1/3 of .

Figure 5. FFT patterns from TEM image show that the streaking and “d” reflections are from the precipitates (compare the FFT patterns from outlined areas of a and b).

Figure 6. The dark areas of d superstructure in the bright-filed image (left) under STEM mode become bright in HAADF image (right), which means higher Ca content in the precipitates of dsuperstructure than the host dolomite.

Figure 7. High magnification bright-field (A) and dark-filed (B) STEM images of d domains. Z-contrast (dark-filed) image shows that the Ca-rich precipitates have a cation sequence (bottom-right) of Ca-Ca-Mg-Ca-Ca-Mg- along c axis as opposed to dolomite cation sequence as shown in the middle-right corner (B). The occurrence of streaking and splitting along c* (i.e., dreflections) in the FFT patterns (bottom-left corner). 003 and 009 spots are from host dolomite, not from the d superstructure, because the position of 003 half way between 002 and 004 of the d superstructure, and the position of 009 is half way between 008 and 0010 of the d superstructure. Noise-filtered Z-contrast image (C) shows enhanced cation sequences in the d superstructure and dolomite host. Line profiles from line 1 (dolomite host) and 2 (d superstructure) also illustrate the ordering of Ca and Mg atoms.

Figure 8. Z-contrast image shows calcite exsolution lamellae // (001) in dolomite host. The line profile 1 has six consecutive Ca columns along ( ) trace. The line profile 2 of the dolomite region shows the normal dolomite cation sequence of alternating Ca and Mg columns. The line profile 3 shows one repeat of d superstructure. The lines with arrows show the boundaries between calcite and dolomite and between dolomite and d superstructure. The atomic models for dolomite/calcite and dolomite/d phase interfaces are shown at the bottom. Carbonate group are not shown proportionally in order to highlight the cations.

Figure 9. Previously proposed structure model for “ dolomite” (A), and calculated model for dsuperstructure (B), and corresponding calculated electron diffraction pattern (C), compared to the FFT pattern (D) from an area dominated by the d superstructure. Very weak 003 and 009 reflections also occur in FFT pattern due to contributions from the dolomite host. However, the position of 003 is not half way between 002 and 004 of the d superstructure, and the position of 009 is not half way between 008 and 0010 of the d superstructure. The d superstructure does not have (h0l) reflections with odd l due to its c-glide.
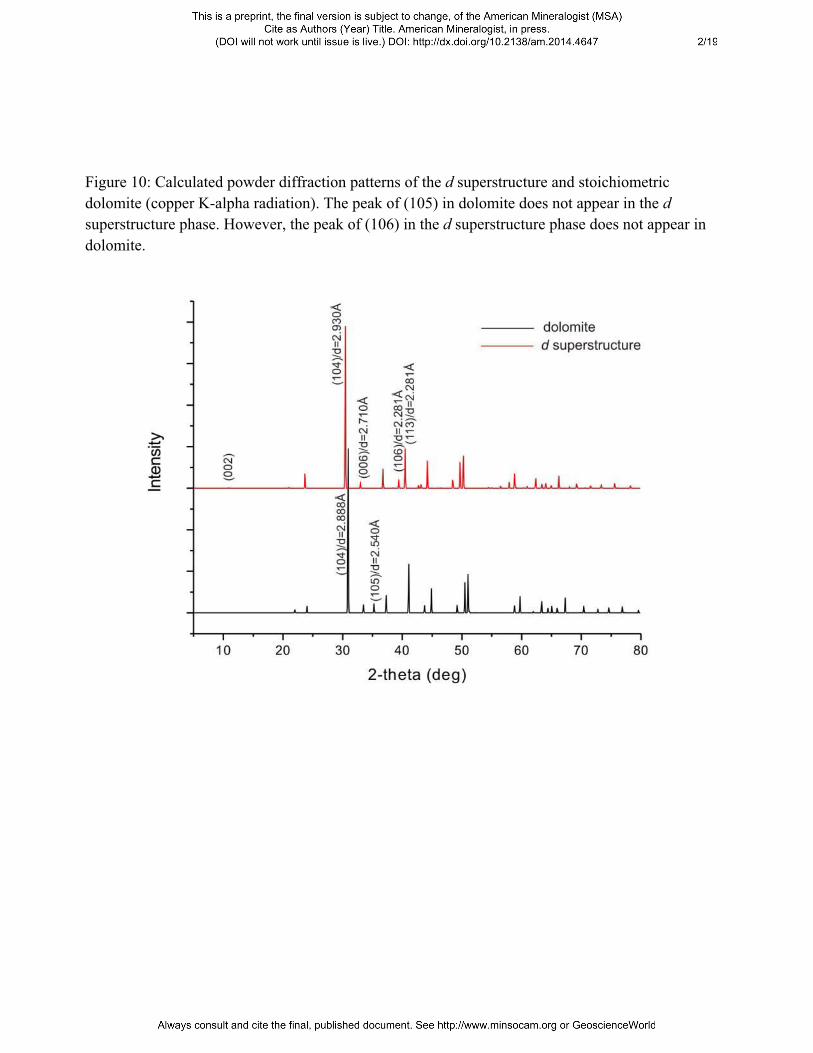
Figure 10: Calculated powder diffraction patterns of the d superstructure and stoichiometric dolomite (copper K-alpha radiation). The peak of (105) in dolomite does not appear in the dsuperstructure phase. However, the peak of (106) in the d superstructure phase does not appear in dolomite.

Table 1. Fractional coordinates of atoms, lattice parameters, and bond distances for the dsuperstructure calculated using DFT method.
Atom x y z Atom x y z Ca1 0.00000 0.00000 0.00000 Ca2 0.33333 0.66667 0.18457 Mg 0.66667 0.33333 0.34229 C1 0.66667 0.33333 0.09229 C2 0.00000 0.00000 0.26849 C3 0.33333 0.66667 0.41608 O1 0.66667 0.06803 0.09229 O2 0.28361 0.04018 0.26739 O3 0.04972 0.62648 0.41719
a: 4.879Å c: 16.260Å V: 335.226Å3 Space group: P31c (no. 159)C-O bond (Å) : 1.294, 1.297 Ca-O bond (Å) 2.355, 2.374 Mg-O bond (Å) 2.085
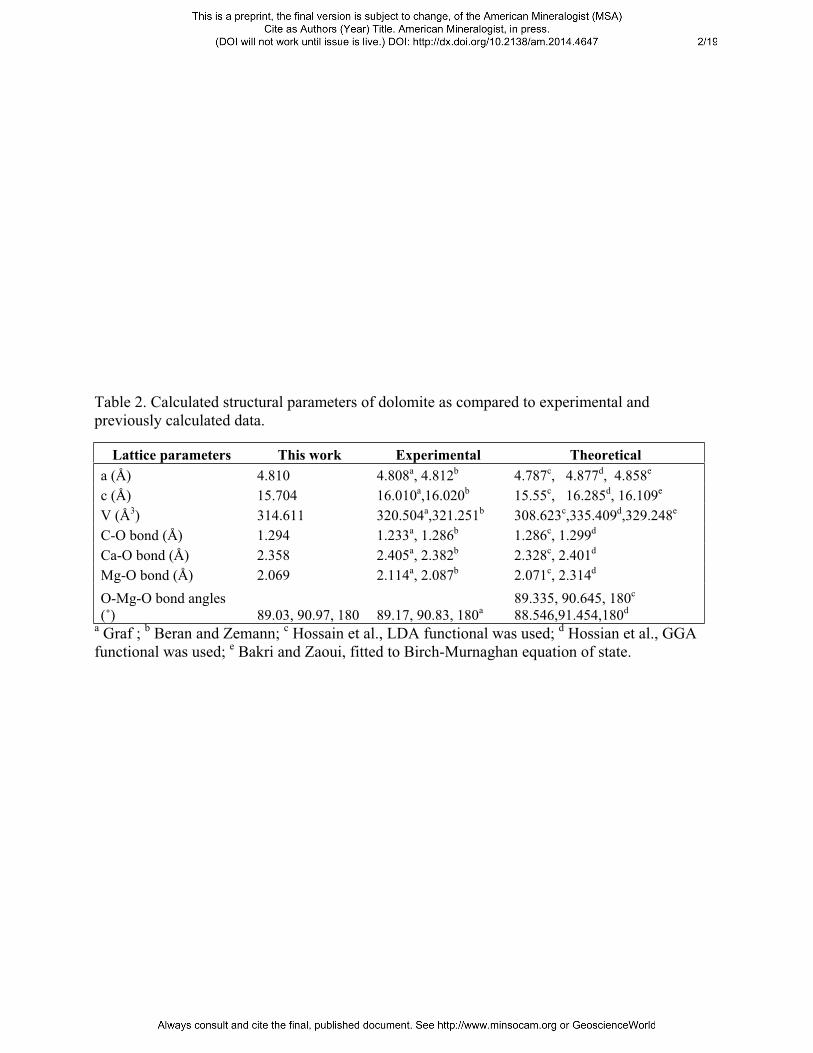
Table 2. Calculated structural parameters of dolomite as compared to experimental and previously calculated data.
Lattice parameters This work Experimental Theoretical a (Å) 4.810 4.808a, 4.812b 4.787c, 4.877d, 4.858e
c (Å) 15.704 16.010a,16.020b 15.55c, 16.285d, 16.109e
V (Å3) 314.611 320.504a,321.251b 308.623c,335.409d,329.248e
C-O bond (Å) 1.294 1.233a, 1.286b 1.286c, 1.299d
Ca-O bond (Å) 2.358 2.405a, 2.382b 2.328c, 2.401d
Mg-O bond (Å) 2.069 2.114a, 2.087b 2.071c, 2.314d
O-Mg-O bond angles (˚) 89.03, 90.97, 180 89.17, 90.83, 180a
89.335, 90.645, 180c
88.546,91.454,180d
a Graf ; b Beran and Zemann; c Hossain et al., LDA functional was used; d Hossian et al., GGA functional was used; e Bakri and Zaoui, fitted to Birch-Murnaghan equation of state.

Table 3. Calculated structural parameters of calcite as compared to experimental and previously calculated data.
Latticeparameters
Thiswork Experimental Theoretical
a (Å) 4.995 4.990a 5.061b, 4.981c
c (Å) 16.685 17.062a 17.097b,15.902c
V (Å3) 360.435 367.916a 379.279b, 341.676c
C-O bond (Å) 1.295 1.286a
Ca-O bond (Å) 2.336 2.357a
a Graf; b Ayoub, Zaoui, and Berghout; c Aydinol et al.