revised protocols for sampling algal, invertebrate, and ... · revised protocols for sampling...
TRANSCRIPT
Revised Protocols for Sampling Algal, Invertebrate, and Fish Communities as Part of the National Water-Quality Assessment ProgramOpen-File Report 02-150
U.S. Department of the InteriorU.S. Geological Survey

Front Cover:
A. Nymph of the stonefly Calineuria californica (Banks). (Photograph by James Carter)
B. A crewmember scraping algae from a cobble. (Photograph by Mitchell Harris)
C. The diatom Navicula lacustris Greg. (Photograph by Phycology Section,
The Academy of Natural Sciences of Philadelphia)
D. Crewmembers sampling fishes with barge electrofishing gear.
(Photograph by Rodney Knight)
E. The redfin darter, Etheostoma whipplei (Girard). (Photograph copyright Joseph R.
Tomelleri)
F. Two crewmembers sampling invertebrates with a Slack sampler. (Photograph by Dennis Sun)
A
B
C
D
E
F
Revised Protocols for Sampling Algal, Invertebrate, and Fish Communities as Part of the National Water-Quality Assessment ProgramBy Stephen R. Moulton II, Jonathan G. Kennen, Robert M. Goldstein, and Julie A. Hambrook
Open-File Report 02-150
Reston, Virginia2002

U.S. DEPARTMENT OF THE INTERIORGALE A. NORTON, Secretary
U.S. GEOLOGICAL SURVEYCharles G. Groat, Director
The use of trade or product names in this report is for identification purposes only and does not constitute endorsement by the U.S. Government.
For additional information write to:
U.S. Geological SurveyChief, National Water-Quality Assessment Program413 National Center12201 Sunrise Valley DriveReston, VA 20192
Information regarding the National Water-Quality Assessment (NAWQA) Program is available on the Internet at http://water.usgs.gov/nawqa/. Copies of this report can be downloaded from this address.

FOREWORD
The U.S. Geological Survey (USGS) is committed to providing the Nation with accurate and timely scientific information that helps enhance and protect the overall quality of life and that facilitates effective management of water, biological, energy, and mineral resources. Information on the quality of the Nation’s water resources is critical to assuring the long-term availability of water that is safe for drinking and recreation and suitable for industry, irrigation, and habitat for fish and wildlife. Population growth and increasing demands for multiple water uses make water availability, now measured in terms of quantity and quality, even more essential to the long-term sustainability of our communities and ecosystems.
The USGS implemented the National Water-Quality Assessment (NAWQA) Program in 1991 to support national, regional, and local information needs and decisions related to water-quality management and policy. Shaped by and coordinated with ongoing efforts of other Federal, State, and local agencies, the NAWQA Program is designed to answer: What is the condition of our Nation’s streams and ground water? How are the conditions changing over time? How do natural features and human activities affect the quality of streams and ground water, and where are those effects most pronounced? By combining information on water chemistry, physical characteristics, stream habitat, and aquatic life, the NAWQA Program aims to provide science-based insights for current and emerging water issues and priorities. NAWQA results can contribute to informed decisions that result in practical and effective water-resource management and strategies that protect and restore water quality.
From 1991–2001, the NAWQA Program completed interdisciplinary assessments in 51 of the Nation’s major river basins and aquifer systems, referred to as Study Units. Baseline conditions were established for comparison to future assessments, and long-term monitoring was initiated in every basin studied. Financial constraints will reduce the number of Study Units that NAWQA can assess in the future; therefore, during the next decade, 42 of the 51 Study Units will be reassessed so that 10 years of comparable
monitoring data will be available to determine trends at many of the Nation’s streams and aquifers. The next 10 years of study also will fill in critical gaps in characterizing water-quality conditions, enhance understanding of factors that affect water quality, and establish links between sources of contaminants, the transport of those contaminants through the hydrologic system, and the potential effects of contaminants on humans and aquatic ecosystems.
The USGS aims to disseminate credible, timely, and relevant science information so that the most current knowledge about water resources can be applied in management and policy decisions. We hope this NAWQA publication will provide you with insights and information to meet your needs, and will foster increased citizen awareness and involvement in the protection and restoration of our Nation’s waters.
The USGS recognizes that a national assessment by a single program cannot address all water-resource issues of interest. External coordination at all levels is critical for a fully integrated understanding of watersheds and for cost-effective management, regulation, and conservation of our Nation’s water resources. The NAWQA Program, therefore, depends on advice and information from other agencies—Federal, State, interstate, Tribal, and local—as well as nongovernment organizations, industry, academia, and other stakeholder groups. Your assistance and suggestions are greatly appreciated.
Timothy L. MillerChief, NAWQA Program
(signed)

Mou
lton
and
othe
rs—
Revi
sed
Prot
ocol
s fo
r Sam
plin
g Al
gal,
Inve
rtebr
ate,
and
Fis
h Co
mm
uniti
es a
s Pa
rt of
the
Nat
iona
l Wat
er-Q
ualit
y As
sess
men
t Pro
gram
—OF
R 02
-150

CONTENTS
Abstract ....................................................................................................................................................................................................... 1Introduction ................................................................................................................................................................................................ 1Overview of the NAWQA Program .............................................................................................................................................. 1Purpose and scope ........................................................................................................................................................................ 1Summary of revisions to original protocols ............................................................................................................................... 2Acknowledgments ......................................................................................................................................................................... 2
Field protocols ............................................................................................................................................................................................ 31. Overview of the sampling approach ....................................................................................................................................... 3
1.1 Establishing the sampling reach ................................................................................................................................ 31.2 Types of samples collected ......................................................................................................................................... 31.3 Identifying instream-habitat types for sampling ...................................................................................................... 41.4 Factors determining when to sample ......................................................................................................................... 41.5 Coordination of field activities .................................................................................................................................... 4
2. Pre-field activities ...................................................................................................................................................................... 52.1 Preparing a sampling plan ........................................................................................................................................... 62.2 Collecting permits ......................................................................................................................................................... 62.3 Supplies and chemicals ............................................................................................................................................... 62.4 Sample preservatives ................................................................................................................................................... 82.5 Sample identification and tracking ............................................................................................................................ 82.6 Sampling gear maintenance ....................................................................................................................................... 10
3. Safety in the field ........................................................................................................................................................................ 123.1 Personal and environmental safety ........................................................................................................................... 123.2 Chemical safety ............................................................................................................................................................. 133.3 Vehicles, boats, and sampling gear safety ............................................................................................................... 14
4. Algal sampling protocols .......................................................................................................................................................... 144.1 Algal sample types collected ...................................................................................................................................... 154.2 Identifying instream habitats for sampling ............................................................................................................... 154.3 Quantitative targeted-habitat sampling methods .................................................................................................... 164.4 Qualitative multihabitat sampling methods .............................................................................................................. 224.5 Sample processing procedures ................................................................................................................................. 244.6 Quality-control recommendations ............................................................................................................................. 284.7 Field data sheets ........................................................................................................................................................... 28
5. Invertebrate sampling protocols ............................................................................................................................................. 365.1 Invertebrate sample types collected ......................................................................................................................... 365.2 Identifying instream habitats for sampling ............................................................................................................... 365.3 Semi-quantitative targeted-habitat methods for sampling wadeable and nonwadeable streams ................ 375.4 Qualitative multihabitat methods for sampling wadeable and nonwadeable streams ..................................... 415.5 Sample processing procedures ................................................................................................................................. 425.6 Field data sheets ........................................................................................................................................................... 48
6. Fish Sampling Protocols ............................................................................................................................................................ 556.1 Overview of sampling methods .................................................................................................................................. 556.2 Sampling methods for wadeable streams ................................................................................................................ 566.3 Sampling methods for nonwadeable streams ......................................................................................................... 596.4 Alternative sampling methods .................................................................................................................................... 606.5 Sample processing procedures ................................................................................................................................. 606.6 Field data sheet ............................................................................................................................................................. 66
Contents V

7. Post-Field Activities ................................................................................................................................................................... 697.1 Logging samples into the Biological Transactional Data Base ............................................................................. 697.2 Replacing field sample labels ..................................................................................................................................... 697.3 Preparing packing lists and Analytical Services Request Forms ......................................................................... 697.4 Shipping samples to analytical laboratories ............................................................................................................ 69
Summary ..................................................................................................................................................................................................... 70References cited ....................................................................................................................................................................................... 73Appendix ..................................................................................................................................................................................................... 75
FIGURES
1. Sample identification code used to distinguish algal (top), invertebrate (middle) and fish (bottom) samples in the National Water-Quality Assessment Program .................................................................... 9
2. Examples of field sample labels used to uniquely identify algae ................................................................................ 113. Methods used to collect microalgal periphyton samples ............................................................................................ 174. Examples of common macroalgae ................................................................................................................................... 235. Steps followed in the field to process algal samples .................................................................................................... 256. Major steps in processing microalgal sample components in the field .................................................................... 267. Priority levels for determining the habitat type that is selected as the richest targeted
habitat for semi-quantitatively sampling invertebrates ................................................................................................ 388. Samplers used to collect invertebrate samples ............................................................................................................. 399. Steps followed in the field to process invertebrate samples ...................................................................................... 43
10. Key steps in the collection and processing of invertebrate samples ........................................................................ 4411. Steps followed in the field to process fish collections ................................................................................................. 6112. Total and standard length measurements of a fish ....................................................................................................... 6313. Deformities, eroded fins, lesions, and tumors noted on fish ........................................................................................ 65
TABLES
1. Hierarchical framework for geomorphic descriptors used to determine habitats from which algal and invertebrate samples are collected .................................................................................................... 5
2. Definition of character fields used to create sample identification codes for algae, invertebrates, and fish samples ............................................................................................................................ 8
3. Algal sample types, sample components, and subsamples collected ....................................................................... 154. Explanation of field data-sheet sections used to record information
about algal sampling activities .......................................................................................................................................... 295. Generalized matrix of the 51 instream habitats .............................................................................................................. 376. Explanation of field data-sheet sections used to record information
about invertebrate sampling activities ............................................................................................................................ 487. Two-letter codes used to denote external anomalies in fish ....................................................................................... 648. Explanation of field data-sheet sections used to record information
about fish sampling activities ............................................................................................................................................ 66
VI Contents

Contents VII
Multiply By To obtain
Lengthmicrometer (µm) 0.00003937 inch
millimeter (mm) 0.03937 inch
centimeter (cm) 0.3937 inch
meter (m) 3.281 foot
kilometer (km) 0.6214 mile
Areasquare centimeter (cm2) 0.155 square inch
square meter (m2) 10.76 square foot
square kilometer (km2) 0.3861 square mile
Volumeliter (L) 1.057 quart
liter (L) 0.2642 gallon
milliliter (mL) 0.0338 ounce, fluid
Flowcentimeter per second (cm/s) 0.0328 foot per second
Massgram (g) 0.03527 ounce, avoirdupois
Pressurekilopascal (kPa) 0.1450 pound-force per square inch
CONVERSION FACTORS, VERTICAL DATUM, AND ABBREVIATED WATER-QUALITY UNITS
Temperature ConversionDegrees Celsius (°C) may be converted to degrees Fahrenheit (°F) by using the following equation:
°F = 1.8 (°C) + 32
ABBREVIATIONS FREQUENTLY USED IN THIS REPORT
AFDM ash-free dry mass QA/QC quality assurance/quality control
ANSP Academy of Natural Sciences of Philadelphia QC quality control
ASR analytical services request QMH qualitative multihabitat
Bio-TDB Biological Transactional Data Base RTH richest-targeted habitat
CHL A chlorophyll a SMCOD sample identification code
DTH depositional targeted habitat USGS U.S. Geological Survey
ID identification > greater than
NAWQA National Water-Quality Assessment < less than
NWQL National Water Quality Laboratory ≥ greater than or equal to
PFD personal flotation device ≤ less than or equal to
PHY phytoplankton ± plus or minus
QA quality assurance

VIII Glossary
Algae—Chlorophyll-bearing, nonvascular aquatic plants (for example, diatoms, green algae, and red algae) including the primitive photosynthetic bacteria (for example, blue-green algae).
Anadromous—Refers to fish species (for example, some species of salmon) that live in the ocean as adults and return to freshwater to spawn.
Benthic—Refers to bottom; for example, benthic organisms that live on or burrow into an aquatic substrate.
Brails—The poles supporting each end of a seine.Coarse-grained substrates—Stream substrates (> 2 mm
widest dimension) composed primarily of gravels, cob-bles, and boulders.
Component—See sample component.Composite sample—See sample.Decant volume (algae only)—The volume associated with
decanting an algal sample or subsample in order to con-centrate the material by removing excess liquid. There are two types of decant volume: (1) before decant volume (BDV)—the volume before excess liquid is removed; and (2) after decant volume (ADV)—the volume after excess liquid is removed.
Depositional-targeted habitat (DTH)—A habitat targeted for sampling in the reach where fine sediments (for example, sand and silt) are deposited. A composited sam-ple from this habitat is referred to as a "DTH sample."
Discrete collection—The material collected from a single location within a reach. Discrete collections are compos-ited either physically (sensu invertebrates) or logically (sensu algae) to create a sample. For example, a single invertebrate RTH sample is composed of five discrete collections that are physically combined. Likewise, an algae QMH sample is composed of discrete collections that are composited according to growth form (either micro- or macroalgae) that then collectively form a logi-cal algal sample from the reach.
Discrete sample—See discrete collection.Ecological studies—Studies of biological communities and
habitat characteristics to evaluate the effects of physical and chemical characteristics of water and hydrologic conditions on aquatic biota and to determine how biolog-ical and habitat characteristics differ among environmen-tal settings in NAWQA study areas.
Epidendric—Benthic habitat consisting of woody substrates on which organisms are attached or loosely associated.
Epilithic—Benthic habitat consisting of natural, coarse-grained substrates (for example, gravels, cobbles, or boulders) or bedrocks, or artificial hard substrates such as submerged concrete on which organisms are attached or loosely associated.
Epipelic—Benthic habitat consisting of silt-sized (<0.064 mm) streambed sediments on which organisms are loosely associated. This habitat is commonly found in
areas of low velocities, such as pools and side-channel areas, where silt can deposit.
Epiphytic—Benthic habitat consisting of plants on which organisms are attached or loosely associated.
Epipsammic—Benthic habitat consisting of sand-sized (> 0.064 – 2 mm) particles on which organisms are attached or loosely associated.
External anomalies—Visible body surface or subcutaneous disorders in fish, such as deformities, eroded fins, lesions, and tumors.
Fine-grained substrates—Stream substrates (< 2 mm wid-est dimension) composed primarily of silt and sand.
Fixed site—Sites on streams at which streamflow is mea-sured and samples are collected to assess the broad-scale spatial and temporal character and transport of inorganic constituents of streamwater in relation to hydrologic con-ditions and environmental settings.
Formaldehyde—As used for a preservative, the term "formaldehyde" is marketed as a saturated water solution of formaldehyde gas (HCHO), representing a concentrated stock solution of formalin (37-percent formaldehyde by weight). Also referred to as “concentrated formalin" or "100 percent formalin."
Formalin—A mixture of formaldehyde and water. Ten-percent formalin is prepared by mixing one part formal-dehyde with 9 parts water; this mixture is typically used for preserving invertebrate and fish samples.
Galvanotaxis—A response by fish to swim toward the anode during application of direct current during electro-fishing.
Geomorphic channel units—Fluvial geomorphic descrip-tors of channel shape and stream velocity. Pools, riffles, and runs are three types of geomorphic channel units considered for NAWQA Program ecological sampling.
Habitat—In general, aquatic habitat includes all nonliving (physical) aspects of the aquatic ecosystem (Orth, 1983), although living components like macrophytes and ripar-ian vegetation also are usually included. Measurements of habitat are typically made over a wider geographic scale than measurements of species distribution.
Hyporheic zone—The subbenthic habitat of interstitial spaces between substrate particles in the streambed bor-dered by surface water above and true ground water below. This zone acts as a faunal reservoir and refugium for aquatic invertebrates during floods, droughts, and extreme temperatures.
Invertebrates—Animals that do not have backbones, such as worms, clams, crustaceans, and insects.
Meandering stream—Typically a low gradient stream with high channel sinuosity.
Motile—Refers to organisms that have the ability to move, often rapidly and spontaneously.
GLOSSARY

Glossary IX
Periphyton—Algae attached to an aquatic substrate; also known as benthic algae.
Phytoplankton—Floating or weakly swimming micro-scopic algae; also known as algal seston in streams.
Pool—A part of the reach with little velocity, commonly with water deeper than surrounding areas.
Preservative volume (PV, algae only)—The volume of the preservative added to an algal subsample that is submit-ted for taxonomic identification analysis.
Qualitative multihabitat (QMH)—A series of different habitats identified in a reach from which discrete collec-tions of algae or invertebrates are taken and later com-bined to form a composite sample. The composited sample is referred to as a QMH sample.
Reach—A length of stream (150–300 m for wadeable streams; 300–1,000 m for nonwadeable streams) that is chosen to represent a uniform set of physical, chemical, and biological conditions within a segment. It is the prin-cipal sampling unit for collecting physical, chemical, and biological data.
Relative abundance—The number of organisms of a partic-ular taxon present in a sample relative to the total number of organisms of that sample.
Replicate sample—The 2nd to nth independently collected sample of the same type from the same reach on the same day. For example, a replicated invertebrate sample would be the second invertebrate RTH sample collected on a particular date from the same reach.
Repeated-sampling replicate–See Replicate sample.Retrospective analysis—The review and analysis of exist-
ing water-quality and ecological data to provide a histori-cal perspective of water quality and biological integrity, to assess strengths and weaknesses of available informa-tion, and to evaluate implications for water-quality man-agement and NAWQA Program design.
Richest-targeted habitat (RTH)—A targeted habitat (usu-ally a riffle or woody snag where the taxonomically rich-est algal or invertebrate community is theoretically located) identified in a reach from which discrete collec-tions of algae or invertebrates are taken and later com-bined to form a composite sample. The composited sample is referred to as a "RTH sample."
Riffle—A shallow part of the stream where water flows swiftly over completely or partially submerged obstruc-tions to produce surface agitation.
Riffle-pool stream—A stream composed of alternating rif-fles and pools.
Run—A shallow part of a stream with moderate velocity and little or no surface turbulence.
Sample—Operationally defined as all of the material and organisms collected during one application of the NAWQA Program sampling protocol for a particular sample type (for example, invertebrate RTH sample). A single sample may be subdivided during field processing
to create sample components (sensu invertebrates and algae) or subsamples (sensu algae).
Sample component—(Algae) Discrete collections of algae that are composited according to growth form (for exam-ple, micro- or macroalgae) to represent a particular sam-ple or subsample. (Invertebrates) A subset of an invertebrate sample that is produced after the sample is processed in the field. Field processing can produce up to four different sample components: large-rare, main-body, split, and elutriate.
Sample identification code (SMCOD)—A 16-character alphanumeric code that uniquely identifies each sample.
Sample medium—The type of biological community being sampled (algae, invertebrates, or fish).
Sample number—A four-digit number given to each sam-ple type.
Sample type—A certain type of algal or invertebrate sample collected in a reach from either a single targeted habitat or multiple habitats.
Sample volume (SV, algae only)—The total volume of a composited algal sample before any preservative is added or subsamples taken.
Sensu—Latin, meaning "in the sense of."Sinuosity—The ratio of the channel length between two
points on a channel to the straight-line distance between the same two points; a measure of meandering.
Split (algae only)—The 2nd to nth subsample that will be analyzed for the same purpose as another subsample taken from the same sample. For example, the second chlorophyll a subsample taken from a particular RTH sample is a split.
Subsample (algae only)—A subset of the sample that is usually created during field processing. For example, a single periphyton RTH sample is typically subdivided into three subsamples, each one for a different laboratory analysis, such as identification/enumeration, chlorophyll a, and ash-free dry mass.
Subsample volume (SSV, algae only)—The volume of the material removed from a composite sample for a particu-lar analysis. Subsample volume is measured before any preservative is added.
Voucher collection—An assortment of preserved specimens representing selected species and maintained for valida-ting taxonomic identifications and documenting spatial and temporal distributions.
Wadeable—From a field-sampling perspective, a stream that can be safely waded, allowing effective deployment and performance of sampling gear (for example, stream depth does not exceed the height of the sampler opening or net). In situations where wadeable conditions do not exist, nonwadeable sampling methods are used.

Glossary X
Woody snag—A submerged segment of wood (branch or log) having a minimum diameter of 1 cm and colonized by aquatic organisms. Organic (for example, leaf packs) and mineral debris also might be associated with woody snags; also known as snag or submerged woody debris.

Revised Protocols for Sampling Algal, Invertebrate, and Fish Communities as Part of the National Water-Quality Assessment ProgramBy Stephen R. Moulton II, Jonathan G. Kennen, Robert M. Goldstein, and Julie A. Hambrook
ABSTRACT
Algal, invertebrate, and fish communities are characterized as part of ecological studies in the U.S. Geological Survey’s National Water-Quality Assessment Program. Information from these ecological studies, together with chemical and physical data, provide an integrated assessment of water quality at local, regional, and national scales. Analysis and interpretation of water-quality data at these various geographic scales require accurate and consistent application of sampling protocols and sample-processing procedures. This report revises and unifies into a single document the algal, invertebrate, and fish community sampling protocols used in the National Water-Quality Assessment Program.
INTRODUCTION
Overview of the NAWQA Program
The U.S. Geological Survey’s (USGS) National Water-Quality Assessment (NAWQA) Program is a perennial program designed to provide a comprehen-sive, interdisciplinary water-quality assessment of the Nation’s flowing water resources (Hirsch and others, 1988; Leahy and others, 1990). During the Program’s first decade of operation (1991–2001), ecological stud-ies were conducted to assess the occurrence and distri-bution of algal, invertebrate, and fish communities in about 59 study units (Gilliom and others, 1995). These study units represented the dominant hydrologic sys-tems nationwide and are staggered in time with respect to implementation, high-intensity, and low-intensity sampling periods (Gilliom and others, 1995). In the second decade of the Program (2001–2011), ecological studies will be conducted at selected fixed sites to pro-
vide long-term-trends monitoring. Ecological studies also are part of nationally guided studies addressing selected water-quality issues.
Accurate and consistent guidance and applica-tion of field-sampling and processing protocols are central to the capability of the NAWQA Program to analyze and interpret the physical, chemical, and bio-logical attributes of aquatic systems at local, regional, and national scales. Protocols were developed or adapted for sampling algal, invertebrate, and fish com-munities during the first decade of the Program (see Cuffney and others, 1993; Meador and others, 1993; Porter and others, 1993). Although these protocols were tested during pilot studies (for example, Cuffney and others, 1997) and implemented by study units at fixed sites, they also were applied extensively in NAWQA synoptic studies (for example, Sorenson and others, 1999) and USGS District cooperative programs. Field experience acquired during the nearly decade-long application of these protocols has resulted in the need to revise the protocols to improve clarity and consistency in their use, and to reflect new pro-gram practices.
Purpose and scope
The purpose of this report is to provide revised protocols for sampling algal, invertebrate, and fish communities as part of the NAWQA Program. The revised protocols describe required methods for col-lecting and processing biological samples. When the application of required methods is not possible, appro-priate alternative methods are used following discus-sion and approval by NAWQA regional and national biologists. Where appropriate, sampling and proces-sing procedures are presented in a concise, stepwise format to promote consistent interpretation and appli-cation of methods by NAWQA sampling teams. Impor-tant procedural or safety information is italicized. Tip boxes are used to convey helpful information that was derived from experiences of NAWQA sampling teams.
Abstract 1

Quality assurance/quality control (QA/QC) and safety guidance are provided where appropriate.
This report revises the original NAWQA proto-cols for algae (Porter and others, 1993), invertebrates (Cuffney and others, 1993), and fish (Meador and oth-ers, 1993). A revision of NAWQA habitat protocols was published by Fitzpatrick and others (1998). The revised protocols also may be adapted for use in studies by the USGS District cooperative program and other governmental agencies. Investigators evaluating the use of these revised NAWQA protocols also should consult additional sampling protocol discussion found in Brit-ton and Greeson (1987), Lazorchak and others (1998), and Barbour and others (1999).
Summary of revisions to original protocols
Several additions, deletions, and modifications have been made to the original field protocols. The major changes are listed as follows:
Changes to the entire set of original protocols:1. Added a glossary of terms frequently used in the
protocols.
2. Added a checklist of sampling gear and com-monly used equipment and supplies.
3. Added guidance to prevent the translocation of aquatic nuisance species (for example, zebra mussels) and parasites (for example, whirling dis-ease).
4. Added guidance on the completion of field data sheets and post-field activities related to the Bio-logical Transactional Data Base (Bio-TDB).
5. Revised the procedure and explanation for creating the alphanumeric sample identification code.
Changes to the algal protocols:1. Added collection of light measurements in con-
junction with algal sampling.
2. Added requirement to prepare microalgal sub-samples for chlorophyll a and ash-free dry mass/carbon analysis from each richest-targeted habitat periphyton sample or phytoplankton sam-ple collected.
3. Added photographs and flow chart to illustrate sample-collection and processing procedures.
4. Revised the algal sample identification code by adding a 17th character to identify the sample bot-tle/filter sequence and dropping the letter desig-nation for a replicate microalgal sample.
5. Dropped the collection of mosses as a sample component of qualitative multihabitat samples.
Changes to the invertebrate protocols:1. Added photographs and flow chart to illustrate
sample-collection and processing procedures.
2. Dropped the collection of a depositional targeted-habitat sample type.
3. Changed sampling and field-processing mesh size to 500 µm for all samples.
4. Revised guidance on field processing of samples and the formation of sample components.
Changes to the fish protocols:1. Added requirement for examination of deformi-
ties, eroded fins, lesions, and tumors as external anomalies of fish.
2. Emphasized use of fish quality-assurance (QA) report by Walsh and Meador (1998).
3. Established a standard seine mesh size of 6.4 mm (0.25 in) to provide a consistent minimum cap-ture size.
4. Dropped requirement for measuring standard length.
Acknowledgments
We thank Thomas Cuffney (Raleigh, North Carolina), Martin Gurtz (Reston, Virginia), Michael Meador (Reston, Virginia), and Stephen Porter (Lake-wood, Colorado) for their work to develop the original protocols for sampling algal, invertebrate, and fish communities; much of their original guidance has been used or modified in this report. The revision of these protocols would not have been possible without the contributions and experiences of these individuals and many other USGS personnel who applied the original protocols in a wide range of stream types across the Nation during the first decade of the Program. The fol-
2 Revised Protocols for Sampling Algal, Invertebrate, and Fish Communities as Part of the National Water-Quality Assessment Program

lowing USGS personnel (in alphabetical order) pro-vided helpful information and comment during the preparation of this revision: Debbie Adolphson (Urbana, Illinois), Robert Anderson (Pittsburgh, Penn-sylvania), Karen Beaulieu (East Hartford, Connecti-cut), Michael Bilger (Lemoyne, Pennsylvania), Larry Brown (Sacramento, California), Carmen Burton (San Diego, California), James Coles (Northborough, Mas-sachusetts), Carol Couch (Reston, Virginia), Steven Goodbred (Sacramento, California), Evan Hornig (Austin, Texas), Ronald Kuzniar (Lakewood, Colo-rado), Terry Maret (Boise, Idaho), Karen Murray (Troy, New York), David Peterson (Cheyenne, Wyoming), Peter Ruhl (Reston, Virginia), Barbara Scudder (Mid-dleton, Wisconsin), Clyde Sholar (Louisville, Ken-tucky), Terry Short (Menlo Park, California), Stephen Smith (Reston, Virginia), Ian Waite (Portland, Oregon), Holly Weyers (Dover, Delaware) and Humbert Zappia (Montgomery, Alabama).
Photographs used in this report were provided courtesy of Mark Ayers (USGS, West Trenton, New Jersey), Barry Biggs (National Institute of Water and Atmospheric Research, Christ Church, New Zealand), Carmen Burton, Richard Frehs (USGS, Columbus, Ohio), Julie Hambrook (USGS, Columbus, Ohio), Jonathan Kennen (USGS, West Trenton, New Jersey), USGS Leetown Science Center (Leetown, West Vir-ginia); Michael Mac (USGS, Reston, Virginia), Michael Meador, Stephen Porter, Stephen Smith, Jason Sonneman (Monash University, Australia), Dennis Sun (USGS, West Trenton, New Jersey), and Wildlife Sup-ply Company (Buffalo, NewYork).
This report was reviewed by Barbara Scudder (USGS, Middleton, Wisconsin) and Mitchell Harris (USGS, Urbana, Illinois). Editorial reviews were pro-vided by Jon Raese (USGS, Lakewood, Colorado).
FIELD PROTOCOLS
1. OVERVIEW OF THE SAMPLING APPROACH
Ecological studies characterize benthic algae and invertebrate or fish communities in relation to chemical and physical characteristics at sites investigated for NAWQA ecological studies. Biological sampling and habitat assessments are conducted within a defined length of stream, or "reach," which provides a common spatial scale on which to relate biotic and abiotic fac-
tors that influence water quality (Cuffney and others, 1993; Fitzpatrick and others, 1998)
1.1 Establishing the sampling reach
The sampling reach is established at a site by using a combination of geomorphic characteristics, such as stream width, stream depth (wadeable or non-wadeable), geomorphology (type and distribution of geomorphic channel units), and local habitat distur-bance (Fitzpatrick and others, 1998). Although much of the sampling effort is concentrated in one primary reach, multiple sampling reaches (typically three) are established at certain sites to determine variability among reaches and to provide alternative sampling reaches should the primary reach become inaccessible. After reaches are established, their locations and iden-tities (for example, letter designation A, B C, and so on) do not change. Sampling crewmembers (hereafter, "crewmembers") should consult Fitzpatrick and others (1998) for specific guidance on establishing sampling reaches. In general, reach length ranges from 150 to 300 m for wadeable streams and from 500 to 1,000 m for nonwadeable streams (Fitzpatrick and others, 1998; Meador and others, 1993). Photographs should be taken at the reach to document instream and riparian physical characteristics, especially on the day of bio-logical sampling.
1.2 Types of samples collected
Quantitative, semi-quantitative, and qualitative sample types are collected in the NAWQA Program to characterize algal and invertebrate communities within a sampling reach. A representative sample of the fish community is collected from the entire reach. Depend-ing on study objectives, one or more different algal or invertebrate sample types might be collected in the reach.
Quantitative algae or semi-quantitative inverte-brate samples are collected from a known area of sub-strate to provide estimates of abundance of algal or invertebrate taxa present in a targeted habitat (for example, riffle, woody snag, or pool). Two contrasting types of targeted habitats are defined in the NAWQA program: a richest-targeted habitat (RTH) and a depositional-targeted habitat (DTH). The RTH repre-sents that habitat in the reach, usually erosional, where maximum taxa richness is likely to be observed. For example, invertebrate RTH samples typically are col-
Field Protocols 3

lected from riffles in moderate to high gradient streams dominated by coarse-grained substrates; in low-gradi-ent streams dominated by fine-grained substrates, invertebrate RTH samples often are collected from woody snags. Separate discrete collections of algae and invertebrates are taken in the RTH and then combined into a composited RTH algae or invertebrate sample. The DTH represents that habitat in the reach where sediments (for example, silt and sand) are deposited. Discrete collections of algae are taken in the DTH and then combined into a composited DTH sample. The DTH sample is not included as part of the invertebrate sampling protocols. Additional guidance and explana-tion of the targeted habitat samples is presented in the algal and invertebrate protocol sections of this report.
A seston sample [or phytoplankton (PHY), cf. Porter and others, 1993] represents a third type of quantitative algal sample that might be collected depending on study objectives. Seston sampling usu-ally is conducted in conjunction with routine water-chemistry sampling because of the specialized sampling gear (for example, a D-96 sampler) used to collect whole-water samples.
Qualitative algal and invertebrate samples may be collected from a reach to document the presence of other algal or invertebrate taxa in addition to those taxa found in the targeted habitat samples (RTH and DTH). Separate discrete collections of algae and invertebrates are taken from each of the instream habitats present in the reach and then combined into a composited qualita-tive multihabitat (QMH) sample. Additional guidance and explanation of the QMH sample is presented in the algal and invertebrate protocol sections of this report.
1.3 Identifying instream-habitat types for sampling
Habitat types within each stream reach are cate-gorized according to a hierarchical framework that includes three tiers of organization to promote sam-pling comparability among the diversity of streams across the Nation (table 1). These tiers are (1) major geomorphic channel units, (2) major channel bound-aries, and (3) major channel features (Cuffney and oth-ers, 1993). This framework is used to guide where certain types of invertebrate and algae samples are col-lected in the reach of wadeable and nonwadeable streams. Tiers 1 and 2 are used to determine sampling locations for algae and invertebrates. However, there are differences in the terminology used to identify major channel features (Tier 3) based on common prac-
tices in the sampling disciplines for algae and inverte-brates. For example, the habitat where an invertebrate collection is taken may be described as a "riffle-main channel-natural bed habitat." Similarly, the same habi-tat where an algal collection is taken may be described as a "riffle-main channel-epilithic habitat."
Except for qualitative sampling, areas down-stream of obstructions (for example, bridge abutments and storm water outflow pipes) and along the edges of atypical habitat features (for example, island margins) are avoided because they might bias the quantitative sample. Specific guidance for determining the sam-pling habitats for algae, invertebrates, and fish are pro-vided in the respective protocol section of this report.
1.4 Factors determining when to sample
Determining when to sample algal, invertebrate, and fish communities requires careful consideration of several factors, especially when sampling is performed annually. Some of these factors (listed as follows) are interrelated and might conflict with one another:
• historical sampling records • life history attributes of the community being sam-
pled [for example, development of aquatic insects or spawning/migratory patterns of anadromous fish or threatened and endangered (T&E) species]
• current and historical hydrological conditions (for example, stage, flood recurrence interval)
• seasonal human recreational activities (for exam-ple, rafting)
• seasonal agricultural practices (for example, appli-cation of pesticides)
• access to sites (for example, road conditions, per-mission to cross or sample on private property)
• availability of crewmembers and technical special-ists (for example, fish taxonomist)
Many of these factors are difficult or impossible to control or predict; therefore, the sampling period ultimately represents a compromise of the most impor-tant factors. In nearly all cases, historical sampling periods based on optimal hydrological conditions to permit safe and effective sampling and organism life cycles are the primary determinants of when to sample biological communities. Depending on the study objec-tives, all sites are sampled within a defined index period (for example, May–June) to ensure year-to-year data comparability (Cuffney and others, 1993).
4 Revised Protocols for Sampling Algal, Invertebrate, and Fish Communities as Part of the National Water-Quality Assessment Program

Tier 1
Major geomorphicchannel units
Description
Riffle Turbulent flow; shallow, coarse-grained substrate
Run Laminar flow, less turbulent; variable depth and substrate
PoolVery low current velocity; relatively deep, depositional accumulations of fine sediment particles
Tier 2
Major channelboundaries
Description
Channel Flow paths associated with the main and secondary river channels
Channel margin Subhorizontal, fluvial areas associated with the streambanks
Island margin Subhorizontal, fluvial areas associated with the banks of islands
Tier 3
Major channelfeature (habitat) Description
Algae Invertebrates
EpilithicNatural bed Natural bed materials without extensive macrophyte beds
Manufactured bed Revetments, riprap, other manufactured or artificial bed materials
Epipsammic & EpipelicBar
Shallow, gently sloping sand or gravel bars primarily associated with channel edges or major changes in water velocity
SloughRemnants of abandoned river channels that connect with the main channel even at nor-mal low flows
Epidendric Woody snagTrees, branches, other woody debris of terrestrial origin that extend into the water col-umn
Epiphytic Macrophyte bed Growths of emergent or submergent aquatic macrophytes
Table 1. Hierarchical framework for geomorphic descriptors used to determine habitats from which algal and invertebrate samples are collected (modified from Cuffney and others, 1993).
1.5 Coordination of field activities
Biological sampling, habitat assessment, and water-quality measurements (for example, dissolved-oxygen concentration, conductivity, and pH) are often performed during one or more visits to a sam-pling site. Consequently, coordination among crew-members and operations is desirable when possible to minimize sampling interferences (for example, physi-cal disturbance of the reach) and the time spent work-ing at a site. However, close coordination of sampling operations may not always be achieved because of dif-fering sampling requirements for various studies. Regardless of the approach taken to achieve coordina-tion, disturbance to instream habitats of the reach by crewmembers must be avoided prior to sampling.
Because activities related to habitat assessment and fish sampling (for example, upstream progression of an electrofishing team or kick seining) can disturb substantially instream habitats of the reach, they are performed at a later date after algal and invertebrate
sampling. Doing this also allows fish species to return to their preferred habitats in the reach. Before any sam-ples are collected, crewmembers must identify the instream habitat types present in the reach, from which series of discrete samples are collected and composited according to sample type. Algal and invertebrate sam-ples are collected within the reach beginning with the most downstream sampling location and progressing upstream. When sampling multiple reaches in a stream segment, sampling is completed within the downstream-most reach before proceeding to the next reach upstream. RTH and DTH samples are collected before QMH samples to minimize disturbance of the targeted habitats.
2. PRE-FIELD ACTIVITIES
The collection of high-quality biological samples and resulting data is dependent on careful planning and preparation prior to the actual visit to a study site.
Field Protocols 5

Pre-field activities include preparing a sampling plan, obtaining collecting permissions and field supplies, and ensuring that sampling gear is in proper working order. Sampling team crewmembers also should familiarize themselves with the sample-tracking functions of the NAWQA Biological Transactional Data Base (Bio-TDB).
2.1 Preparing a sampling plan
Prior to conducting any fieldwork, sampling teams are encouraged to prepare a sampling plan. A sampling plan is a tool that might be used to define the sampling objectives, describe the roles and responsibil-ities of crewmembers, list sampling methods and pro-cedures, and define QA/QC activities appropriate for the study. The sampling plan should describe when fieldwork would be performed, including a process for determining alternative plans in the event of adverse weather or hydrological conditions. All members of a sampling team should be familiar with the standard protocols described in this report for collecting and processing algal, invertebrate, and fish samples. Train-ing in the application of these protocols can be obtained by attending periodic nationally or regionally organized courses, or by mentoring opportunities among the sampling teams and the regional and national NAWQA biologists. Although these protocols are intended to maximize consistency among the algal, invertebrate, and fish community samples collected in the NAWQA Program, there might be occasions when these standard protocols cannot be effectively applied or study objectives warrant alternative sampling or pro-cessing protocols. Alternative protocols are reviewed in consultations with the Regional Biologist.
2.2 Collecting permits
The sampling team leader is responsible for obtaining collecting permits prior to sampling. Permis-sion from a landowner is also required when sampling on or crossing private property. In some cases, multiple permits might be required to satisfy private, State, and Federal (for example, National Park Service or U.S. Fish and Wildlife Service) regulations. Walsh and Mea-dor (1998) provide a comprehensive summary of state permitting agencies and their reporting conditions. Normally, permits are required only to collect fish and other aquatic vertebrates. However, some states also require a collecting permit or fishing license for inver-
tebrates (for example, Arkansas and New York). Sam-pling team leaders also must inquire about and be familiar with applicable conditions regulating collec-tion gear and methods, specimen-holding require-ments, and number of specimens sacrificed and preserved for study; compliance with all permit condi-tions is required. A brief list of possible requirements that should be considered follows:
• Prepare a study plan in advance of sampling• Document species targeted in sampling• Document state and federally protected species
having special concern, threatened and endangered (T&E) status that might be encountered (see Walsh and Meador, 1998)
• Obtain a sport-fishing license if necessary• Notify permitting agency prior to conducting field
work• Submit a periodic (typically annual) summary
report describing all sampling activities and listing the species and numbers collected. (The report for-mat is usually specified and might consist of an electronic data form provided by the permitting agency.)
• Provide copies of research reports or publications acknowledging the permitting agency
2.3 Supplies and chemicals
The following supplies and chemicals are used to collect and field-process algal, invertebrate, or fish community samples in the NAWQA Program. Sam-pling teams should ensure that reserve quantities of supplies and replacement parts (for example, collection nets) are maintained during extended sampling trips. Although most supplies can be purchased from local retailers (for example, hardware and sporting goods stores), some supplies can be purchased only from retailers specializing in field or laboratory products (see Walsh and Meador, 1998, p. 23).
6 Revised Protocols for Sampling Algal, Invertebrate, and Fish Communities as Part of the National Water-Quality Assessment Program

Field Protocols 7
Sampling GearAlgae❑ SG-92 with brushes (see section 4.3.1)❑ Gravel sampler with large masonry trowel (see section 4.3.1)Invertebrates❑ Slack sampler with 500-µm mesh net (see section 5.3.1)❑ Grab sampler (for example, petite Ponar or Ekman)❑ D-frame kick net with 500-µm mesh netFish❑ Backpack (with ammeter) or towed electrofishing unit❑ Electrofishing boat❑ 3 x 1.2-m seine (6.4-mm mesh)❑ 7.6 to 9.6 x 1.2-m seine (6.4-mm mesh)❑ 30 to 61 x 1.8-m seine (6.4-mm mesh)Water-Quality Meters❑ Current velocity meter❑ Dissolved oxygen meter❑ Thermometer❑ Conductivity meter❑ pH meter❑ Light meter and quantum sensorBasic Field Supplies❑ Wire mesh sieves (20-cm and 30-cm diameter, 500-µm mesh)❑ White buckets (19 L)❑ Forceps, blunt and fine tipped❑ Tongs❑ Knives (pocket and putty), scalpels, scissors❑ Spatula (without holes)❑ Plastic petri dishes (47-mm diameter)❑ Oxford™ Macro-Set hand pipettor (1 mL–5 mL w/tips)❑ Heavy-duty aluminum foil❑ Hand-held electric stirrer (periphyton homogenizer)❑ Batteries (various sizes including 12 volt)❑ Whatman™ GF/F glass fiber filters (25-mm and 47-mm diameter)❑ Hand-operated vacuum pump with pressure gauge❑ Plastic Erlenmeyer flask (1 L)❑ Filter funnel and base (for 25 mm and 47 mm filters)❑ Hand saw or lopping shears❑ White enamel or plastic trays❑ Hand brush❑ Dice❑ Gas can with pre-mixed fuel❑ Electrofishing battery charger❑ Dip nets❑ Portable aeration system❑ Live cage for holding fish❑ Small aquarium nets❑ Small wooden club ❑ Syringes with locking hypodermic needles❑ Resealable plastic bags, various sizes❑ Arm-length rubber gloves (per person)❑ Surgical gloves❑ Chemical splash goggles❑ Respiratory mask with formaldehyde filter❑ Heavy-duty nylon thread and sewing needles❑ Hand rake❑ Squirt bottles❑ Wide-mouth Nalgene™ sample bottles
(60, 125, 250, 500 mL, and 1 L)❑ Plastic scintillation vials❑ Alcohol/waterproof pens, black❑ Pencils (lead, red wax)❑ Waterproof paper❑ Field data sheets printed on waterproof paper❑ Measuring board
❑ Ruler and tape measure❑ Large plastic insulated coolers❑ Graduated cylinders (glass 10 mL, plastic 50–500 mL)❑ Hanging scale❑ Portable weighing balance❑ First aid kit❑ Insect repellant❑ Sun screen❑ Antibiotic liquid soap❑ Polarized sunglasses❑ Cellular phone❑ Flashlight and lantern❑ Safety plan (with emergency phone numbers)❑ Collecting permits❑ Hip boots (per person)❑ Chest waders (per person)❑ Wader repair kit❑ Rain gear❑ Personal flotation devices (per person)❑ Digital camera (high-resolution)❑ Geographic positioning system❑ Field guides (plants, fish, insects)❑ Folding table and chairs❑ Braided, 1.9-cm nylon rope❑ Trash can❑ Glue gun❑ Tool set❑ Paper towelsChemicals❑ 37-percent buffered formaldehyde (buffered to pH 7)❑ 10-percent buffered formalin❑ 1-percent bleach solution❑ Anesthetic (for example, CO2 tablets, clove oil)❑ Dry ice❑ WaterBasic Shipping Supplies❑ Plastic tape (for example, 3M Scotch Brand™ 471)❑ Resealable plastic bags, various sizes❑ Heavy-duty trash bags❑ Absorbent packing material❑ Bubble packing sheets❑ Ice chests❑ Transparent packaging tape❑ Shipping paperwork

2.4 Sample preservatives
Proper preservation of biological samples is par-amount to obtaining high-quality taxonomic and eco-logical data about organisms. Samples are preserved in the field to prevent the breakdown of structural pro-teins, thereby maintaining the integrity of tissues and other morphological structures for taxonomic study. Many morphological structures and color patterns are destroyed when samples are poorly preserved, thereby resulting in undesirable levels of taxonomic resolution and quality of material for vouchering or referencing. Before working with sample preservatives, crewmem-bers must put on personal protective equipment (for example, safety glasses and gloves) and ensure that work is performed in a ventilated area (for example, an outdoor field processing area or laboratory fumehood).
Formaldehyde, whether concentrated (37-percent stock = 100-percent formalin) or diluted (for example, 10-percent formalin), is the required pre-servative for algal, invertebrate, and fish samples in the NAWQA Program. Algal samples are preserved by adding a sufficient volume of buffered formaldehyde to the sample to obtain a final concentration of 5-percent buffered formalin (see Algal Sampling Protocols). Invertebrate and fish samples are preserved with 10-percent buffered formalin. Buffering formaldehyde or formalin to pH 7 with borax minimizes shrinkage and decalcification of tissues, especially mollusk shells. It is more economical to prepare 10-percent buffered formalin rather than purchase this concentra-tion from a supply company.
Preparing a 1-L solution of 10-percent buffered formalin:
1. Add 100 mL of formaldehyde to 900 mL of water in a chemically resistant, nonbreakable bottle.
2. Add about 3 g of borax to 10 mL of water and mix.
3. Add dissolved borax solute to buffer formalin solution.
4. Tightly seal the bottle and mix by carefully inverting the bottle several times.
5. Label the outside of the bottle with "10-percent buffered formalin," the date of preparation, and related hazardous chemical stickers.
2.5 Sample identification and tracking
Algae, invertebrate, and fish community samples collected as part of NAWQA Program studies are tracked by using an alphanumeric sample identification code (SMCOD). The SMCOD is a smart code because it succinctly summarizes key information about a sam-ple (table 2), and if created properly, it will uniquely identify each bottle or filter associated with a particular sample. Variables associated with each of the SMCOD character fields are explained in figure 1 for the differ-ent sample media.
Sample numbers are assigned consecutively to all of the different samples in each sample medium col-lected each year. The following example shows how samples are numbered for a 2-year study at a site:
Sampling Year 1
Sample Medium Sample Number Sample Type
Algae 0001 RTHAlgae 0002 DTHAlgae 0003 QMH
Invertebrates 0001 RTHInvertebrates 0002 QMH
Fish 0001 Not applicable
Sampling Year 2
Sample Medium Sample Number Sample Type
Algae 0001 RTHAlgae 0002 DTHAlgae 0003 QMH
Invertebrates 0001 RTHInvertebrates 0002 QMH
Fish 0001 Not applicable
8 Revised Protocols for Sampling Algal, Invertebrate, and Fish Communities as Part of the National Water-Quality Assessment Program
Sample identification code character fields1–4 5–8 9 10 11 12–15 16 17
Algae
Study Unit abbreviation
Collection date (MMYY)
Sample medium
Sample type
Subsample(analysis type)
Sample number
Sample com-ponent
Bottle/filtersequence
Invertebrates Sample component
Bottle sequence
–
Fish Sample medium – –
Table 2. Definition of character fields used to create sample identification codes for algae, invertebrates, and fish samples in the National Water Quality Assessment Program
[MMYY, month and year; –, not applicable]

Field Protocols 9
STUDY UNIT:4–letter abbr.
DATE:MMYY
SAMPLE NUMBER:0001–9999
ALGAE SAMPLE COMPONENT: A = macroalgae B = microalgae S = split sample, microalgae
SAMPLE MEDIUM: A = algae
SAMPLE MEDIUM: I = invertebrate
ALGAL ANALYSIS TYPES: E = identification and enumeration C = chlorophyll a M = ash-free dry mass
ALGAL SAMPLE TYPES: R = RTH D = DTH Q = QMH P = phytoplankton
LINJ 0602 IRM 0001 A
LINJ 0602 FSH 0001
LINJ 0602 ARE 0001 B A ALGAE BOTTLE/FILTER SEQUENCE:A–Z
INVERTEBRATE SAMPLE COMPONENTS: M = main-body L = large-rare S = split
INVERTEBRATE SAMPLE TYPES: R = RTH Q = QMH
INVERTEBRATE BOTTLE SEQUENCE:A–Z
SAMPLE MEDIUM:FSH–fish
Figure 1. Sample identification code used to distinguish algal (top), invertebrate (middle) and fish (bottom) samples in the National Water-Quality Assessment Program (modified from Cuffney and others, 1993 and Porter and others, 1993). abbr, abbreviation; MMYY, month/year; RTH, richest-targeted habitat; DTH, depositional targeted habitat; QMH, qualitative multihabitat; SMCOD, sample identification code.

2.5.1 Sample logs
Sampling teams are encouraged to maintain sam-ple logs for each sample medium (algae, invertebrates, and fish) to provide an accounting of the samples col-lected in a study and to track the sample numbers that are used during a given year. The minimum informa-tion for each log should include:
• Study unit identification• Log year• Station identification code• Reach designation• Collection date (MM/DD/YYYY)• Sample type (except for fish)• Sample number• Replicate flag (except for fish)
An algae sample log for the Long Island-New Jersey (LINJ) NAWQA study unit listing the samples collected at two study sites in one year might look like the following:
In this example, three algal sample types (RTH, DTH, and QMH) were collected in each of three sam-pling reaches (A, B, and C) at station 12345678 (total of nine algal samples). Note that the samples were numbered consecutively and that no replicate samples were collected. At station 87654321, four algal sam-ples were collected from reach A only; the sample types collected include primary RTH, DTH, and QMH samples and a RTH repeated sampling replicate (sam-ple number 0011).
2.5.2 Sample labels
Sampling teams are encouraged to prepare for-matted sample labels (fig. 2) before going into the field so that sample information can be recorded neatly on the label immediately after a sample is collected and processed. Sheets of formatted sample labels should be printed or photocopied on waterproof paper (for exam-ple, "Write-in-the-Rain"™ paper). Information is recorded on the labels using pens (for example, Rapi-dograph™ and Pigma Pen™) containing water- and formalin-resistant ink. Field sample labels are placed on the outside of the sample bottles for each sample medium. An identical label is placed inside each bottle for invertebrate and fish samples. Do not place labels inside algae sample bottles because algal cells might adhere to the label and compromise the integrity of the sample.
2.6 Sampling gear maintenance
Sampling gear must always be maintained to ensure proper working order. The following mainte-nance checks should be performed before, during, and after each sampling event.
• Inspect metal sieve screening and nylon-collection nets for holes and tears. Use a black pen to mark the location of numerous small holes. Apply sili-con adhesive or hot glue to both sides of a net or sieve to close small holes. Alternatively, a wood-burning tool can also be used to melt and close nylon netting surrounding small holes. Use heavy-duty needle and thread to close large tears. Replace the sieve or collection net if it is beyond repair. Store nets out of direct sunlight to dry when not in use; ultraviolet radiation from the sun and prolonged dampness promotes deterioration of nylon netting.
• Clean, inspect, and lubricate moving gear parts (for example, the jaw mechanism on grab samplers) and cables. Never lubricate sampling gear when the gear will also be used to collect samples for chemi-cal analysis.
• Rinse sand from threaded gear parts to ensure proper fitting and minimize leakage. Also rinse sieves and buckets to prevent jamming when they are stacked.
• Inspect and calibrate water-quality meters accord-ing to standard protocols described in Wilde and Radtke (1998). Document maintenance and cali-bration records on all sampling gear and meters for QA purposes.
LINJ Algae Sample Log — Year 2002
Station ID ReachCollection
DateSample
TypeSample Number
Replicate Flag
12345678 A 06/15/2002 RTH 0001 No
12345678 A 06/15/2002 DTH 0002 No
12345678 A 06/15/2002 QMH 0003 No
12345678 B 06/16/2002 RTH 0004 No
12345678 B 06/16/2002 DTH 0005 No
12345678 B 06/16/2002 QMH 0006 No
12345678 C 06/17/2002 RTH 0007 No
12345678 C 06/17/2002 DTH 0008 No
12345678 C 06/17/2002 QMH 0009 No
87654321 A 06/20/2002 RTH 0010 No
87654321 A 06/20/2002 RTH 0011 Yes
87654321 A 06/20/2002 DTH 0012 No
87654321 A 06/20/2002 QMH 0013 No
10 Revised Protocols for Sampling Algal, Invertebrate, and Fish Communities as Part of the National Water-Quality Assessment Program

Field Protocols 11
NAWQA Algae Sample
SU ID:__________Station name:_____________________________________
Station code:____________________________Reach:___________________
Collection date:____________________ Time:_____________
Collectors:________________________________________________________
Sample type (circle one): RTH / DTH / PHY / QMH
Sample component (circle one): Macroalgae / Microalgae
Subsample (circle one): ID / CHL A / AFDM / POC
Sample number:__________ Bottle/filter sequence identifier:______________
Total area of periphyton sample:__________________cm2
Sample volume:__________; Subsample volume:__________mL
Preservative: buffered formaldehyde; Preservative volume:__________mL
Field SMCOD (optional):____________________________________________
NAWQA Invertebrate Sample
SU ID:__________Station name:_____________________________________
Station code:______________________________Reach:__________________
Collection date:____________________Time:_____________
Collectors:__________________________________________________
Collection mesh: 500 µm; Preservative: 10% buffered formalin
Sample type (circle one): RTH / QMH Split ratio___________
Sample component (circle one): Large-rare / Main-body / Split
Sample number:_____________ Bottle sequence identifier:________________
Field SMCOD (optional):____________________________________________
NAWQA Fish Sample
SU ID:__________Station name:_____________________________________
Station code:______________________________Reach:__________________
Collection date:____________________Time:_____________
Collectors:________________________________________________________
Sampling method:_____________________ Preservative: 10% buffered formalin
Sample number:_____________
Field SMCOD (optional):____________________________________________
Species:__________________________________________________________
Taxonomic specialist:__________________________ID date:______________
State:_________________County:____________________________________
Latitude:________________________Longitude:________________________
USGS quad name:_________________________________________________
Figure 2. Examples of field sample labels used to uniquely identify algae (top), invertebrate (middle), and fish (bottom) samples in the National Water-Quality Assessment Program. SU ID, study unit abbreviation; RTH, richest targeted habitat; DTH, depositional targeted habitat; PHY; phytoplankton; QMH, qualitative multihabitat; SMCOD, sample identification code; NAWQA, National Water-Quality Assessment; USGS, U.S. Geological Survey; ID, identification; CHL A, chlorophyll a; AFDM, ash-free dry mass; mL, milliliter; µm, micrometer; %, percent.

There is potential for cross-contaminating sam-ples or translocating organisms among sampling sites or drainages when sampling gear and field-processing equipment are not adequately cleaned between samples or sites. Many invertebrates have claws and body hooks that allow them to be easily retained on the fine mesh netting, seams or crevices of sampling gear or field-processing equipment. Algae are particularly sus-ceptible for cross-contamination because of their microscopic size (for example, diatoms). Filamentous algae (for example, Cladophora) might promote cross-contamination because they represent either a microhabitat or an entrapment mechanism for inverte-brates. Translocation of organisms relates to the intro-duction of nonindigenous or aquatic nuisance species into areas where they might cause substantial environ-mental, socioeconomic, or public health damage. Sev-eral nuisance species are well documented for plants (for example, Eurasian watermilfoil), animals (for example, zebra mussel), and disease-forming spores (for example, whirling disease parasite found in salmo-nids).
Cleaning sampling gear and equipment:• After collecting and field processing each sample,
inspect the sampling gear and net surface including all seams and crevices; remove debris and place attached organisms in the sample.
• Vigorously wash both sides of a net and inspect all seams and crevices; discard any remaining debris or organisms.
• Scrub and wash all sieves, dishpans, buckets, and brushes used to process samples. Closely inspect sieves for trapped organisms (especially tubificid worms and midges).
• After sampling at each site, wash mud from all sampling gear (including boats and electrofishing gear), field-processing equipment and waders, and spray with a 1-percent bleach solution.
Preparing a 1-L solution of 1-percent bleach:1. Add 1 mL of bleach to 99 mL of water in a plastic
spray bottle.
2. Label the outside of the bottle with "1-percent bleach" and the date of preparation.
3. SAFETY IN THE FIELD
Safety issues related to any aspect of scientific study deserve serious attention by all members of a
sampling team. In particular, some field-sampling activities carry a real potential for personal injury or death. Sampling teams are encouraged to review field safety guidance presented by Yobbi and others (1996) and Lane and Fay (1997). All field-sampling activities must comply with official USGS safety guidelines (U.S. Geological Survey, 2001a) and memoranda. At a minimum, the team leader should work with the Dis-trict safety officer to document that training sessions to promote safety awareness are conducted as appropriate for the sampling frequency. Approved training and ded-icated application of safe operating procedures and maintenance for vehicles, trailers, watercraft, and sam-pling gear will minimize the potential for personal injury. Property damage, accidents, and injuries can be avoided by (1) wearing appropriate safety equipment, (2) handling chemicals safely, and (3) coping with common environmental hazards (for example, heat, thunderstorms, floods, poisonous plants, and venomous animals).
Sampling teams always must consist of at least two crewmembers; no one should sample alone. At least two crewmembers of each sampling team must be trained and currently certified in basic first aid, car-diopulmonary resuscitation techniques, and hazard communications. Each sampling team must carry a first aid kit, a cellular telephone, and an emergency contact list (including medical facilities closest to each sam-pling site) inside each field vehicle as part of the Job Hazard Analysis (JHA) for a particular study or sam-pling site. The JHA is prepared by the study team and reviewed by District management for the purpose of assigning and understanding responsibilities for safety in field and laboratory studies.
3.1 Personal and environmental safety
Crewmembers are responsible for wearing their personal protective equipment when it is appropriate to do so. Regular inspection of this equipment is neces-sary to ensure that it is in proper working condition. Waders, gloves, safety glasses or goggles, and face-masks are worn when dangerous objects (for example, scrap metal and broken glass), water-borne pathogens, toxic substances (including sample preservatives) are encountered at a sampling site. Crewmembers should ensure that vaccinations against water and soil-borne diseases are up-to-date. Hand sanitizing creams and bactericidal soap must be supplied to sampling teams.
12 Revised Protocols for Sampling Algal, Invertebrate, and Fish Communities as Part of the National Water-Quality Assessment Program

Personal-flotation devices (PFDs) must always be worn when working in or near the water regardless of hydrologic conditions except when a JHA docu-ments approved exemptions. Sampling teams working at established USGS gaging stations must follow the guidelines established by the site-specific JHA for that station. Chest-wader suspenders can be worn on the outside of all clothing, including noninflating PFDs. However, inflatable suspender style PFDs must always be the outermost layer to allow for complete expansion of the PFD air bladder without injury to the wearer or damage to the bladder. Non-U.S. Coast Guard (USCG) flotation devices are allowed for wading, cableway and bridgework. Belts are sometimes worn to cinch loose-fitting waders. Wearing a belt traps air below the waist, slowing the onset of hypothermia in cold water, and also prevents waders from filling quickly if a crew-member falls in the stream.
Field sampling safety risks also include potential contact with dangerous plants and animals or exposure to adverse weather conditions. Crewmembers working at sites where dangerous wild animals (for example, bears, mountain lions, alligators, and poisonous snakes) might be encountered should receive animal awareness and avoidance training. This training should include (1) identification of the dangerous animals, (2) behavioral traits of the animals, (3) recognition of signs of animal activity, (4) how to avoid attracting or pro-voking the animals, and (5) how to react during encounters or if attacked. Training should be provided before work at such sites begins and at least every 3 years thereafter. Crewmembers should be instructed on how to identify and avoid poisonous plants (for exam-ple, poison ivy and poison oak), and venomous arthro-pods (for example, wasps, spiders, and ticks) including first aid procedures. Prolonged exposure to the sun, wind, air, and water temperature extremes can result in varying degrees of skin irritation, discomfort, and injury (for example, frostbite), including hypo- and hyperthermia. Crewmembers should know the signs of heat stress, wear appropriate clothing and eyewear to protect and maintain comfort, and treat exposed skin with sun block and lip balm. Crewmembers periodi-cally should stay out of direct sunlight or otherwise cool their bodies and stay hydrated by drinking plenty of water and electrolyte replacement drinks. Field sam-pling should be delayed or rescheduled when any form of severe weather is forecasted. Environmental safety training also should include (where applicable) proce-
dures for hazards, such as floods, icy conditions, earth-quakes, and fires.
3.2 Chemical safety
Crewmembers must receive appropriate occupa-tional safety training before being assigned to hazard-ous duties. Unique or uncommon hazardous activities should be addressed separately as they are encountered. Crewmembers handling or using hazardous materials must receive initial Hazard Communication Training with refresher training every 3 years. Personal protec-tive equipment appropriate for working with a particu-lar chemical (for example, safety glasses or ventilation mask) and any emergency procedures must be part of Hazard Communication Training. A "Material Safety Data Sheet" (MSDS) for each chemical used in the field must be maintained in a field safety notebook con-taining a Chemical Hygiene Plan. This field safety notebook is kept in vehicles and mobile labs, and all crewmembers must be familiar with its contents. All chemical containers must be appropriately labeled with chemical name, concentration, date, and manufacturer hazard warnings. All secondary containers (for exam-ple, beakers, flasks, squirt bottles, and safety cans) must be labeled with the same information if the chem-ical is kept in the container past the immediate work shift or if the container is transported away from the immediate work area. Chemical formulas or nonspe-cific names, such as "Mixture A," are not acceptable identifiers. Even innocuous substances (for example, buffers and water) must be labeled and identified.
Crewmembers should practice good personal hygiene around hazardous materials, such as washing hands after handling chemicals, using required per-sonal protective equipment, and not consuming or stor-ing food and drink in areas where hazardous materials are used or stored. Coolers or other containers used for shipping samples must never be used for storing food and drink. Chemicals should be transported in their original U.S. Department of Transportation-approved shipping containers, according to State and Federal regulations. Ideally, chemicals should be transported in trailers or carriers attached to the vehicle and not inside the passenger area. Transporting chemicals in this man-ner minimizes the risk of exposure if a chemical bottle breaks or leaks.
Preservation of algal, invertebrate, and fish sam-ples involves the use of aqueous buffered formaldehyde or 10-percent buffered formalin. Studies indicate that
Field Protocols 13

formaldehyde is a potential human carcinogen. The severity of irritation increases as formalin concentra-tion increases. Airborne concentrations > 0.1 mg/L can cause irritation of the eyes, nose, and throat; at > 50 mg/L, formalin is acutely hazardous to life and might result in death. Dermal contact with formalin causes various skin reactions, including sensitization, which might force crewmembers so sensitized to seek other job duties. Specific hazard labeling is required for formaldehyde and formalin. Hazard labeling, including a warning that formaldehyde presents a potential can-cer hazard, is required where formaldehyde levels, under reasonably foreseeable conditions of use, might potentially exceed 0.5 mg/L. These chemicals should be handled only in well-ventilated areas while wearing chemical-resistant gloves and approved eye protection. The use of formaldehyde in poorly ventilated areas might require the use of respirators and medical moni-toring. Vehicles or mobile labs transporting and using formaldehyde or formalin must have eyewash solutions readily available.
3.3 Vehicles, boats, and sampling gear safety
All vehicle operators must be at least 18 years of age and have a valid driver’s license. Successful com-pletion of USGS-approved driver education courses is required every 3 years. Operators of specialized vehi-cles (for example, all-terrain vehicles) should partici-pate in training programs for these vehicles. Boat operators must complete the motorboat operator certifi-cation course training sponsored by the U.S. Depart-ment of Interior and be re-certified every 5 years. In addition, operators must be familiar with the type of boat and its equipment (for example, trailer, outboard motors, safety devices, winches, and USCG-required emergency equipment). All occupants on board a boat must wear a USCG-approved PFD at all times when working on watercraft less than 8 m long. Sampling teams also should review safety and communications procedures for towing and launching. Boat operators are responsible for the safety and security of occupants and equipment at all times.
The sampling team leader is responsible for instructing other crewmembers on the safe handling, operation, and storage of sampling gear. Several grab samplers (for example, Ponar and Ekman grabs) that are recommended for use in the NAWQA Program have spring-loaded jaws or are of sufficient mass that
could inflict serious injury to fingers or other body parts.
Although electrofishing is a highly effective method to sample fish communities, it can result in serious personal injury or death if performed improp-erly. At least one crewmember of each electrofishing team must be certified by successful completion of the U.S. Fish and Wildlife Service training program on the safe operation of electrofishing gear (U.S. Geological Survey, 2001a). Certified individuals should act as the sampling team leaders and will be responsible for com-munication of safety protocols and individual responsi-bilities. At least two crewmembers must be trained and certified in basic first aid and cardiopulmonary resusci-tation techniques (U.S. Geological Survey, 2001a). Only commercially manufactured electrofishing gear in good working condition is used. All equipment must receive periodic maintenance and inspection to ensure proper working condition and should never be altered for personal or operational conveniences. Dip nets must be made of nonconducting material (polyvinyl chloride tubing, or nylon); aluminum or wooden dip nets must never be used. Everyone in the sampling team must wear appropriately rated rubber gloves and waders that have been inspected for leaks before entering the water. Rubber gloves must cover the forearm for maximum protection. Chest waders with slip-resistant boot soles (for example, heavy-duty felt) must be worn in wade-able habitats; hip boots are preferable when boat elec-trofishing in nonwadeable habitats. Waders manufactured with a "breathable" fabric must not be used during electrofishing because of a potential for shock resulting from inadequate insulating properties of the fabric.
4. ALGAL SAMPLING PROTOCOLS
Stream algal communities are sampled in the NAWQA Program following nationally consistent pro-tocols. Algae grow in streams as periphyton (attached to a substrate) or as phytoplankton (unattached, carried in current). Periphyton are further grouped into growth forms, either as microalgae (morphology is micro-scopic, appearing as pigmented accumulations or films attached to submerged surfaces, typically single-celled algae) or macroalgae (morphology is visible without magnification, typically filamentous). Algal communi-ties are characterized by using richness and abundance data derived from quantitative and qualitative samples
14 Revised Protocols for Sampling Algal, Invertebrate, and Fish Communities as Part of the National Water-Quality Assessment Program

of these communities. Regardless of which sample types are collected in a particular study, all samples are collected from instream habitats that are present in the reach. The instream habitats are identified according to a hierarchical framework of geomorphic channel units, channel boundaries, and channel features. The algal-sampling protocols described herein present guidelines for identifying instream habitats, methods for quantitatively and qualitatively sampling these hab-itats, and methods for processing collected samples in the field. These revised algal-sampling protocols are based on original guidance presented by Porter and oth-ers (1993).
4.1 Algal sample types collected
The algal-sampling protocols present methods for collecting three different types of quantitative algal sample (RTH, DTH, and PHY) and a qualitative algal sample (QMH) (table 3). These samples are formed by compositing discrete collections taken in the targeted sampling habitats (RTH and DTH) or multiple habitats throughout the reach (QMH). Each quantitative sample represents a composited sample of microalgae that is further split (except for DTH) into as many as three different subsamples, which correspond to a particular laboratory analysis (table 3). Two of these subsamples are processed by the National Water Quality Laboratory (NWQL) to measure chlorophyll a (CHL A) and ash-free dry mass (AFDM) except PHY samples, which are analyzed instead for CHL A and particulate organic carbon (POC). [Note: The NWQL determines POC by subtracting particulate inorganic carbon from total particulate carbon; this analysis requires a minimum of two filters.] A third subsample is processed for taxonomic identification (ID) by the
Academy of Natural Sciences of Philadelphia (ANSP), Phycology Section to provide estimates of taxa richness, cell density, relative abundance, and biovolume of algal species. The QMH sample consists of both micro- and macroalgal sample components, each of which is only processed in a taxonomic laboratory to determine algal taxa that are present in the sample (table 3).
4.2 Identifying instream habitats for sampling
In general, the identification of instream habitats follows the same approach that is applied for sampling invertebrate communities in the reach. However, the terminology applied in referring to potential sampling habitats follows a convention among algal ecologists to classify these habitats according to the following groups: (1) epilithic, (2) epidendric, (3) epiphytic, (4) epipsammic, and (5) epipelic. Characteristics of each of these habitats are as follows:
• Epilithic—benthic habitat consisting of natural, coarse-grained substrates (for example, gravels, cobbles, or boulders) or bedrocks, or artificial hard substrates such as submerged concrete on which organisms are attached or loosely associated.
• Epidendric—benthic habitat consisting of woody substrates (for example, woody snags) on which organisms are attached or loosely associated.
• Epiphytic—benthic habitat consisting of plants on which organisms are attached or loosely associ-ated.
• Epipsammic—benthic habitat consisting of sand-sized (> 0.064–2 mm) particles on which organisms are attached or loosely associated.
• Epipelic—benthic habitat consisting of silt-sized (< 0.064 mm) streambed sediments on which
Field Protocols 15
Quantitative algal samples Qualitative algal sample
Sample types RTH DTH PHY QMH
Sample components pro-cessed
Micro Micro Micro Micro Macro
Subsamples (submitted for laboratory analysis)
IDCHL AAFDM
IDID
CHL APOC
ID ID
Table 3. Algal sample types, sample components, and subsamples collected and prepared in the National Water-Quality Assessment Program
[RTH, richest targeted habitat; DTH, depositional targeted habitat; QMH, qualitative multihabitat; PHY, phytoplankton; Micro, microalgae; Macro, macroalgae; ID, Identification/enumeration; CHL A, chlorophyll a; AFDM, ash-free dry mass; POC, particulate organic carbon]

organisms are loosely associated. This habitat is commonly found in areas of low velocities, such as pools and side-channel areas, where silt can deposit.
4.3 Quantitative targeted-habitat sampling methods
The selection of the appropriate RTH and DTH to sample is based on information derived from the study objectives, reconnaissance sampling, and consul-tation with technical specialists. Selection of the habitat where the RTH microalgal sample components are col-lected is based on the following priority: (1) riffles in shallow streams with coarse-grained substrates (eplithic habitat); (2) woody snags in streams with fine-grained substrates (epidendric habitat); and (3) macrophyte beds (epiphytic habitat) in streams where riffles and woody snags are absent. In contrast, selec-tion of the habitat where the DTH microalgal sample component is collected is based on the presence of organically rich or sandy depositional areas along stream margins (episammic and epipelic habitats). A DTH microalgal sample is only collected if a DTH is present in the reach.
Measurements of water depth and velocity are collected for discrete collections of periphyton and recorded on the appropriate field data sheet. Light mea-surements are taken at three locations in the reach to determine light extinction coefficients. Rinse water should be prepared before sampling by filtering native stream water. The volumes of water used to acquire or rinse discrete collections must be carefully monitored to ensure that the total sample volume after composi-ting does not exceed 475 mL. Doing this will allow enough empty volume to add formaldehyde and not exceed a 500-mL sample-volume limitation.
4.3.1 Sampling methods for epilithic habitats
Epilithic habitats are sampled by using one of three methods depending on the types of rock substrate being sampled. The SG-92 (fig. 3a) is a modified syringe-sampling device and performs best on smooth cobble surfaces with moderate-to-dense coverage of microalgal periphyton. The "top-rock scrape" method (fig. 3b) is used for sampling irregular cobble surfaces or when cobble surfaces have sparse periphyton cover-age. The gravel sampler (fig. 3c) is used when sam-pling microalgal periphyton attached to gravel substrates.
Using the SG-92 to sample epilithic habitats:1. Assemble the SG-92 sampling device and periph-
yton brushes (fig 3a). This step should be com-pleted before going into the field; also, prepare several SG-92 samplers and periphyton brushes.
a. Remove the end of a 30-mL syringe barrel opposite the syringe flanges. Sand the cut end of the barrel smooth.
b. Flatten one side of a rubber O-ring (inside diameter, 2.06 cm; outside diameter, 2.70 cm) using emory cloth.
c. Using cyanoacrylate adhesive, cement the flat-tened side of the O-ring to the flanged end of the syringe barrel.
d. Construct periphyton brushes by affixing (with epoxy adhesive) small, circular bristles from a stiff-bristled toothbrush to the ends of 0.64-cm diameter plastic rods.
e. Trim the bristles to a length of about 4 mm. [Note: the periphyton brushes are discarded when the bristle lengths are worn to about 1 mm (Porter and others, 1993)].
2. Collect five cobbles from each of five locations in riffles distributed throughout the reach (a total of 25 cobbles per reach). Place cobbles in a plastic dishpan and transport them to an on-site proces-sing station to collect periphyton from each cob-ble.
3. Place the SG-92 barrel on a smooth part of the cobble. Press down on the O-ring and rotate slightly to create a tight seal. Maintain this seal while the collection is made.
4. Using a pipettor, squirt about 5 mL of filtered stream water into the SG-92 barrel on the cobble. If the water leaks from the barrel, select another place on the cobble and try again. If the water does not leak, insert the periphyton brush into the barrel and scrub the enclosed area on the cobble to remove the periphyton.
5. Remove the periphyton and water mixture with the pipette and dispense it in a 100-mL graduated cylinder. [Note: dispensing into a graduated cyl-inder instead of a 500-mL sample bottle is recom-mended in case the SG-92 seal fails while
16 Revised Protocols for Sampling Algal, Invertebrate, and Fish Communities as Part of the National Water-Quality Assessment Program

a. SG-92 sampler: preparing to scrape a cobble with microalgal periphyton brush (arrow points to O-ring seal on bottom of SG-92).
b. Top-rock scrape method: scraped area of a cobble covered with foil to determine the area sampled.
d. Inverted petri dish method: a collection being taken in an epipsammic habitat (arrow points to spatula placed beneath the petri dish to keep the collection intact).c. Gravel sampler: beveled edge (arrow)
on bottom of sampler improves coring into gravel substrates.
Figure 3. Methods used to collect microalgal periphyton samples (Photographs a, b, d by R. Frehs; c by S. Porter).
collecting the sample, thereby causing the collec-tor to start over. If the seal fails, then only the contents of the graduated cylinder are dis-carded.] Repeat this process several times until all of the visible periphyton is removed. Pour the contents of the graduated cylinder into a 500-mL sample bottle.
6. Repeat the sampling procedure for a single area on each of the cobbles selected (the composited sample is composed of 25 discrete collections taken from 25 cobbles). Ensure that the sample volume does not exceed 475 mL. Place the bottle on ice inside a cooler and keep in the dark until the sample is processed.
7. Measure the diameter of the area sampled by the SG-92 at the beginning and end of sampling.
Record these diameters on the Quantitative Targeted-Habitat Periphyton Field Data Sheet to establish an average diameter from which the sampling area can be calculated.
8. Calculate the total sampling area by using the fol-lowing formula:
Total sampling area (cm2)
where,n = number of discrete SG-92 collections
π = 3.1416, and
d = average diameter of the sampled areas, incentimeters.
2)2)()(( dn π=
Field Protocols 17
[Note: if using the inside diameter of a 30-mL syringe barrel, then the total surface area sam-pled for 25 cobbles will be about 75 cm2.]
9. Process the periphyton sample following the steps described in "Sample Processing Proce-dures" (Section 4.5).
Using the top-rock scrape method to sample epilithic habitats:
1. Collect five cobbles from each of five locations in riffles distributed throughout the reach (a total of 25 cobbles per reach). Place cobbles in a plastic dishpan and transport them to an on-site proces-sing station to collect periphyton from each cob-ble.
2. Identify the area on each cobble where periphy-ton are attached by using a red wax pencil to draw a line around the middle (side) of the cobble. The area above this line represents the sampling area to be scraped.
3. Using a small brush or pocket knife, scrape the periphyton from the sampling area on each cob-ble (typically the top and sides) down to the red line.
4. Rinse the periphyton from each cobble into the dishpan using a poultry baster and filtered stream water. Ensure that the sample volume does not exceed 475 mL.
5. Pour the contents of the dishpan through a funnel into a 500-mL sample bottle. Place the bottle on ice inside a cooler and keep in the dark until the sample is processed.
6. Wrap aluminum foil around the surface of each cobble, covering the area that was scraped down to the red line. Mold the foil tightly (fig. 3b) and trim the excess foil from the bottom edge of the scraped area.
7. Remove the formed foil from each cobble and flatten by making a series of radial cuts.
8. Place the foil templates in a labeled resealable plastic bag and determine the area of each tem-plate in the field office. The areas for all rocks sampled in the reach are summed and the total area recorded on the Quantitative
Targeted-Habitat Periphyton Field Data Sheet and sample labels.
9. Process the periphyton sample following the steps described in "Sample Processing Proce-dures" (Section 4.5).
18 Revised Protocols for Sampling Algal, Invertebrate, and Fish Communities as Part of the National Water-Quality Assessment Program

Using the gravel sampler to sample epilithic habitats:1. Assemble the gravel sampler from a plumbing
"clean-out" (7.6-cm diameter) (fig. 3c). Attach the threaded cap; bevel the bottom edge of the clean-out by using a grinding wheel to improve the coring capability of the sampler. Obtain a large masonry trowel wide enough to enclose completely the bottom of the sampler.
2. Select 5 to 10 sampling locations throughout the reach.
3. Press the beveled end of the sampler into the gravel substrate. After the sampler is in place, carefully remove the gravel surrounding the out-side of the sampler and insert the masonry trowel.
4. Slide the sampler onto the trowel and carefully lift it out of the water.
5. Quickly invert the sampler to contain the gravel and water in the sampler cap.
6. Pour each discrete collection into a dishpan and rinse the sampler before taking another discrete collection.
7. Repeat these steps to complete 5 to 10 discrete collections, which form the composited sample.
8. Extract macroalgal filaments (if present) from the gravel with forceps and then cut them into fine pieces.
9. Brush and rinse (with dishpan water) the gravel. Recycle rinse water to keep the sample volume < 475 mL.
10. Pour the sample from the dishpan through a fun-nel into a 500-mL sample bottle. Place the bottle on ice inside a cooler and keep in the dark if the sample is not processed immediately.
11. Calculate the total sampling area by using the for-mula presented for the SG-92 sampling method.
12. Process the periphyton sample following the steps described in "Sample Processing Procedures" (Section 4.5).
4.3.2 Sampling method for epidendric habitats
Collecting quantitative microalgal periphyton samples from epidendric habitats (or woody snags) pre-sents a challenge because they generally have an irreg-
ular surface and are difficult to remove without loss of algal biomass (Porter and others, 1993). If the woody snag has a smooth surface, it can be sampled in a simi-lar manner to epilithic habitats by using the SG-92. Otherwise, periphyton is collected from woody snags by using the cylinder scrape method.
Using the cylinder scrape method to sample epidendric habitats:
1. Select one woody snag in each of five locations throughout the reach.
2. Identify the part of the woody snag that will be sampled for periphyton. Carefully remove a 10- to 20-cm-long section with pruning shears or by sawing and place in a plastic dishpan.
3. Scrub the entire surface of each woody snag sec-tion in the dishpan with a stiff brush. Rinse the brush and each section in the dishpan. Recycle rinse water to keep the sample volume less than 475 mL.
4. Pour the sample from the dishpan through a fun-nel into a 500-mL sampling bottle.
5. Measure the length and diameter of each cleaned woody snag section and calculate the total sam-pling area by using the following formula (assumes a cylinder):
Total Sampling Area (cm2)
where,
n = number of discrete collections,
π = 3.1416,di = diameter of each woody snag section, in
centimeters, andli = length of each woody snag section, in
centimeters.Alternatively, a foil template can be used (see top-rock scrape method) for irregularly shaped woody snag sections.
6. Process the periphyton sample following the steps described in "Sample Processing Proce-dures" (Section 4.5).
�=
=n
i
ii ld1
))(()(π
Field Protocols 19
4.3.3 Sampling method for epiphytic habitats
Epiphytic samples from macrophytes with small or finely dissected leaves (for example, Elodea or Cer-atophyllum; Terrell and Perfetti, 1996) are difficult to quantify because the surface area of periphyton coloni-zation cannot be reliably determined in the field. How-ever, quantitative samples should be collected from these macrophytes if the epiphytic periphyton micro-habitat represents the dominant RTH in the sampling reach.
Using the square frame method to sample epiphytic habitats:
1. Select five locations in the reach from which macrophytes can be sampled.
2. Carefully place a 50- x 50-cm square frame (for example, Slack sampler with area template) over one of the macrophyte beds. Do not disturb the macrophyte leaves; epiphytes are often loosely attached.
3. Cut the plants at their bases within the frame and place them in a plastic bag. Alternatively, macro-phytes can be placed carefully in the Slack sam-pler net.
4. Rinse the macrophytes with water in the plastic bag; additional agitation or brushing might be necessary to remove epiphytic periphyton. Set the rinsed macrophytes aside to determine their sur-face area.
5. Repeat this collection procedure in four addi-tional macrophyte beds in the reach.
6. Combine the discrete collections contained in the plastic bags. Ensure that the sample volume does not exceed 475 mL.
7. Pour the sample through a funnel into a 500-mL sample bottle. Place the sample on ice inside a cooler and keep in the dark until the sample is processed.
8. Determine the surface area of the sampled macro-phytes. If necessary, save examples and record the number of each different macrophyte by pressing and drying for identification in the field office.
9. Process the periphyton samples following the steps described in "Sample Processing Proce-dures" (Section 4.5).
4.3.4 Sampling method for epipsammic/epipelic habitats
Quantitative microalgal periphyton samples are collected from the upper 5- to 7-mm layer of epipsam-mic (sand) or epipelic (silt) habitat in depositional areas of the reach.
Using the inverted petri-dish method to sample epip-sammic or epipelic habitats:
1. Select five locations in the reach that have a depo-sitional zone consisting of either sand or silt sub-strates. [Note: all five locations must be either sand or silt.]
2. At each location, hold the lid of a small plastic petri dish (about 47-mm diameter) upside down in the water; rub the inside of the lid to remove air bubbles.
3. Turn the inside of the lid toward the substrate that will be sampled without disturbing the sediment.
4. Carefully and slowly press (in cookie cutter fash-ion) the lid into the sediment.
5. Slide the lid onto a spatula (fig. 3d) to enclose the discrete collection. Holding the petri dish tight against the spatula, carefully wash extraneous sediment from the spatula, and then lift out of the water.
6. Invert the lid and remove the spatula.
7. Rinse the sediment from the lid with filtered stream water into a 500-mL sample bottle.
8. Repeat this collection procedure at each addi-tional sampling location in the reach.
9. Combine the five discrete collections in a 500-mL sample bottle (the total area sample will be about 85 cm2).
10. Process the sample following the steps described in "Sample Processing Procedures" (Section 4.5). [Note: subsamples for CHL A and AFDM analy-ses typically are not prepared from DTH samples; consult your study team leader or Regional Bio-logist if these analyses are required for this sam-ple type.]
20 Revised Protocols for Sampling Algal, Invertebrate, and Fish Communities as Part of the National Water-Quality Assessment Program
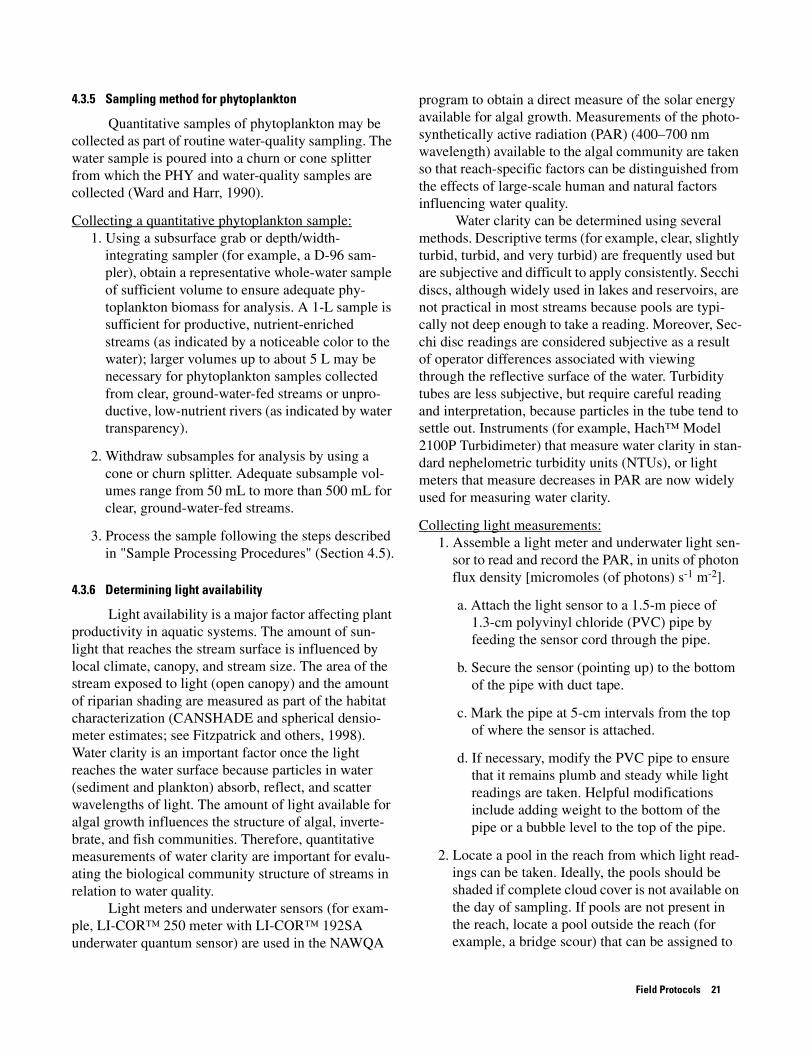
4.3.5 Sampling method for phytoplankton
Quantitative samples of phytoplankton may be collected as part of routine water-quality sampling. The water sample is poured into a churn or cone splitter from which the PHY and water-quality samples are collected (Ward and Harr, 1990).
Collecting a quantitative phytoplankton sample:1. Using a subsurface grab or depth/width-
integrating sampler (for example, a D-96 sam-pler), obtain a representative whole-water sample of sufficient volume to ensure adequate phy-toplankton biomass for analysis. A 1-L sample is sufficient for productive, nutrient-enriched streams (as indicated by a noticeable color to the water); larger volumes up to about 5 L may be necessary for phytoplankton samples collected from clear, ground-water-fed streams or unpro-ductive, low-nutrient rivers (as indicated by water transparency).
2. Withdraw subsamples for analysis by using a cone or churn splitter. Adequate subsample vol-umes range from 50 mL to more than 500 mL for clear, ground-water-fed streams.
3. Process the sample following the steps described in "Sample Processing Procedures" (Section 4.5).
4.3.6 Determining light availability
Light availability is a major factor affecting plant productivity in aquatic systems. The amount of sun-light that reaches the stream surface is influenced by local climate, canopy, and stream size. The area of the stream exposed to light (open canopy) and the amount of riparian shading are measured as part of the habitat characterization (CANSHADE and spherical densio-meter estimates; see Fitzpatrick and others, 1998). Water clarity is an important factor once the light reaches the water surface because particles in water (sediment and plankton) absorb, reflect, and scatter wavelengths of light. The amount of light available for algal growth influences the structure of algal, inverte-brate, and fish communities. Therefore, quantitative measurements of water clarity are important for evalu-ating the biological community structure of streams in relation to water quality.
Light meters and underwater sensors (for exam-ple, LI-COR™ 250 meter with LI-COR™ 192SA underwater quantum sensor) are used in the NAWQA
program to obtain a direct measure of the solar energy available for algal growth. Measurements of the photo-synthetically active radiation (PAR) (400–700 nm wavelength) available to the algal community are taken so that reach-specific factors can be distinguished from the effects of large-scale human and natural factors influencing water quality.
Water clarity can be determined using several methods. Descriptive terms (for example, clear, slightly turbid, turbid, and very turbid) are frequently used but are subjective and difficult to apply consistently. Secchi discs, although widely used in lakes and reservoirs, are not practical in most streams because pools are typi-cally not deep enough to take a reading. Moreover, Sec-chi disc readings are considered subjective as a result of operator differences associated with viewing through the reflective surface of the water. Turbidity tubes are less subjective, but require careful reading and interpretation, because particles in the tube tend to settle out. Instruments (for example, Hach™ Model 2100P Turbidimeter) that measure water clarity in stan-dard nephelometric turbidity units (NTUs), or light meters that measure decreases in PAR are now widely used for measuring water clarity.
Collecting light measurements:1. Assemble a light meter and underwater light sen-
sor to read and record the PAR, in units of photon flux density [micromoles (of photons) s-1 m-2].
a. Attach the light sensor to a 1.5-m piece of 1.3-cm polyvinyl chloride (PVC) pipe by feeding the sensor cord through the pipe.
b. Secure the sensor (pointing up) to the bottom of the pipe with duct tape.
c. Mark the pipe at 5-cm intervals from the top of where the sensor is attached.
d. If necessary, modify the PVC pipe to ensure that it remains plumb and steady while light readings are taken. Helpful modifications include adding weight to the bottom of the pipe or a bubble level to the top of the pipe.
2. Locate a pool in the reach from which light read-ings can be taken. Ideally, the pools should be shaded if complete cloud cover is not available on the day of sampling. If pools are not present in the reach, locate a pool outside the reach (for example, a bridge scour) that can be assigned to
Field Protocols 21

the reach where community sampling was con-ducted. Otherwise, locate the deepest portion of the reach that can be safely waded. [Note: if the stream is not well mixed, then light readings should be taken at a second or third location in the reach.]
3. Take light readings quickly because the amount of available light at the surface is sensitive to changes in the wind, cloud cover, and disturbance at the water surface. [Note: it may be necessary to take up to three series of depth readings per loca-tion because of these factors; calculate an aver-age of multiple readings for each depth at each pool location.]
4. Lower the sensor into the water and take the first light reading about 1 cm below the air/water interface.
5. Continue lowering the sensor and take a reading at every 5- or 10-cm interval until the sensor reaches the stream bottom or the meter reads 1 percent of the first (subsurface) light reading, whichever comes first. The objective is to maxi-mize the number of light readings at each pool location.
6. Record the beginning time of the light readings, the depth (in centimeters as indicated by the depth interval on the PVC pipe), and the light reading for all measurements taken at each pool location on the Quantitative Targeted Habitat Per-iphyton Sample Field Data Sheet.
4.4 Qualitative multihabitat sampling methods
Periphyton are sampled qualitatively from multi-ple instream habitats for the purpose of documenting the presence (excluding abundance) of algal taxa throughout the reach. Discrete collections of micro- and macroalgae are taken by scraping, brushing, and siphoning periphyton from submerged substrates in five different habitats (epilithic, epidendric, epiphytic, epipsammic, and epipelic). The QMH sample is formed by combining the discrete collections for each of the micro- and macroalgal sample components.
4.4.1 Microalgae
Although examples of the five habitats might be present in the reach, these habitats will not be equally
abundant. Therefore, to ensure that periphyton taxa associated with a particular habitat are adequately rep-resented in the microalgal sample component, separate discrete collections are taken for each habitat. The dis-crete habitat collections then are processed with the equally weighted composite (EWC) method to create a single composited QMH microalgal sample component (see "Sample Processing Procedures," Section 4.5).
Collecting the qualitative microalgal sample compo-nent:
1. Identify the epilithic, epidendric, epiphytic, epip-sammic, and epipelic habitats present in the reach.
2. Obtain five 125-mL bottles and label by habitat as (1) epilithic, (2) epidendric, (3) epiphytic, (4) episammic, and (5) epipelic. These bottles can be cleaned and reused again at other sampling sites.
3. Scrape, brush, or siphon periphyton from each of these habitats (if present) and place in the appro-priate habitat bottle.
4. Process the discrete habitat collections following the equal EWC method described in "Sample Processing Procedures" (Section 4.5).
4.4.2 Macroalgae
Common examples of macroalgae (fig. 4) include filamentous growth forms (for example, Cla-dophora), plantlike algae with leaf-like structures, cushion and mat-forming filaments (for example, Vaucheria), round or flattened colonies (for example, Nostoc and Rivularia), short turf-forming filaments (for example, Audouinella), gelatinous masses, and short, tubular strands. Additional information and illus-tration necessary for identifying macroalgae can be found in Biggs and Kilroy (2000), Entwistle and others (1997), and Terrell and Perfretti (1996).
Collect macroalgae from each of the habitats present throughout the reach and place in an appropri-ately sized sample bottle (typically 125 or 250 mL). Preserve with buffered formaldehyde and place a label on the bottle. Record notes regarding the color and growth form (for example, mat-forming, upright fila-ments, leaf-like structures, and gelatinous masses) of algae found on the Qualitative Multihabitat Periphyton Sample Field Data Sheet.
22 Revised Protocols for Sampling Algal, Invertebrate, and Fish Communities as Part of the National Water-Quality Assessment Program

Field Protocols 23
a. Cladophora, a common green alga with branched filaments.
b. Zygnema, like Spirogyra, is green alga with unbranched filaments that grows in slow-flowing backwaters in open environments.
c. Audouinella, short, upright, pink or blue-green filaments that cover rocks, like velvet, in swift flows. d. Vaucheria, a cushion to mat-forming yellow-green alga.
e. Nostoc, round, flattened blue-green algal colonies.
f. Rivularia, a colonial blue-green alga.
Figure 4. Examples of common macroalgae (photographs a, c, e, and f by J. Sonneman; b and d by B. Biggs).

4.5 Sample processing procedures
The goal of processing a composited algal sample in the field is to prepare subsamples for various laboratory analyses (table 3). Successful execution of the processing procedures described here to produce high-quality subsamples for analysis is dependent on measuring and tracking various volumes as the sample is processed. At least two subsamples are taken from each RTH and PHY sample for the purpose of determining CHL A and AFDM in the laboratory. However, AFDM frequently is undetectable in PHY samples unless the sample is collected from a highly eutrophic stream. Instead of measuring AFDM for PHY samples, a measure of carbon is obtained in the laboratory by analyzing the subsample for POC. POC is determined by subtracting particulate inorganic carbon from total particulate carbon. The remaining volume of RTH microalgal sample component (now the ID subsample) is preserved for taxonomic analysis. DTH and QMH samples are only preserved for taxonomic analysis. The major tasks associated with processing certain algal samples (fig. 5) in the field are as follows:
1. Accurately measure sample, subsample, preser-vative, and decant volumes as required during sample processing. [Note: this is important to ensure proper laboratory processing.]
2. Homogenize the sample to create a uniform sus-pension of algae from which CHL A and AFDM subsamples are taken. [Note: this step is not nec-essary for PHY samples.]
3. Filter the CHL A and AFDM or POC subsamples onto glass fiber filters.
4. Preserve the ID subsample with buffered formal-dehyde for taxonomic analysis.
5. Prepare processed samples for shipping to the laboratory.
6. Record site and sample information for each sam-ple collected on a field data sheet.
4.5.1 Quantitative microalgae
Each RTH sample is processed in the field to pre-pare subsamples that will be analyzed for CHL A and AFDM, and taxonomic identification. DTH samples are processed only for taxonomic identification. Phy-
toplankton samples are processed to prepare subsam-ples that will be analyzed for CHL A, POC, and taxonomic identification. After determining the origi-nal sample volume, the subsamples are prepared by fol-lowing the procedures described below for homogenizing, filtering, preserving, and packaging.
Processing the quantitative microalgal sample compo-nent:[Note: if processing a DTH sample, skip to step number 10.]
1. Measure the sample volume to the nearest milliliter.
2. Calibrate the pipette. [Note: the calibration is important, especially if the tip has been trimmed to enlarge the opening for extracting dense per-iphyton material.]
3. Assemble the filtration apparatus by attaching the filter base with rubber stopper to the filtering flask. Join the flask and a hand-operated vacuum pump (with gage) using a section of tubing (fig. 6a). [Note: if POC filters are prepared as part of dissolved organic carbon sample proces-sing (not discussed in this report), then a Teflon filter apparatus must be used.]
4. Place a 47-mm glass fiber filter (for example, Whatman™ GF/F) on the filter base and wet with deionized water. Use a 25-mm baked glass fiber filter for POC. [Note: wetting the filter will help keep it in place in windy weather. Attach the filter funnel to the base.]
5. Homogenize the microalgal sample component. [Note: a battery-powered stirrer (fig. 6b) works well for this purpose.] Cut algal filaments, if present, into pieces about 2 mm in length. Homogenization is not necessary for PHY sam-ples because subsamples are taken directly from a cone or churn splitter.
6. Shake the sample component vigorously for about 30 seconds to ensure that it is well mixed before extracting subsamples.
7. Extract two 5-mL aliquots of homogenized microalgal sample using the pipette and dispense onto the wetted glass-fiber filter (fig. 6c). [Note: for the PHY CHL A subsample it will be neces-sary to filter a 50- to 500-mL subsample (depend-
24 Revised Protocols for Sampling Algal, Invertebrate, and Fish Communities as Part of the National Water-Quality Assessment Program

Field Protocols 25
Homogenize sample(not necessary for PHY)
Remove 10 mL aliquots eachfor CHL A, AFDM, or POC
subsample analysis
Filter each 10 mL aliquot ontoseparate filters
Prepare filters for shipping,place on dry ice
CHL A subsamplefilter
AFDM(POC if PHY)
subsample filter(s)
Label samples and preparebottles for shipping
Log samples into Bio-TDB and submit toANSP for analysis
IDsubsample bottle
Log samples into Bio-TDB and submit toNWQL for analysis within 3 weeks
What is thesample type?
QMH
Remainingsample
(ID SSV)
Measure SV
RTH, DTH, PHY
Measure SV
EWC Method
Microalgae Macroalgae
Preserve with formaldehyde(measure PV)
Is volume> 500 mL?
NOYES
Decant toreduce SSV to
< 500 mLMeasure ADV
Measure SVDTHRTH, PHY
Figure 5. Steps followed in the field to process algal samples in the National Water-Quality Assessment Program. Steps in dashed box are typically performed in the field office. <, less than; >, greater than; mL, milliliter; RTH, richest targeted habitat; DTH, depositional targeted habitat; PHY, phytoplankton; QMH, qualitative multihabitat; SV, sample volume; SSV, subsample volume; ADV, after decant volume; PV, preservative volume; EWC, equal weight composite, CHL A, chlorophyll a; POC, particulate organic carbon; AFDM, ash-free dry-mass; ID, identification; Bio-TDB, Biological Transactional Data Base; NWQL, National Water Quality Laboratory; ANSP, Academy of Natural Sciences of Philadelphia.

26 Revised Protocols for Sampling Algal, Invertebrate, and Fish Communities as Part of the National Water-Quality Assessment Program
a. Apparatus used to filter microalgal sample components: hand-operated pump, Erlenmeyer flask, tubing, filter funnel and base.
b. Homogenizing the microalgal sample component with a battery-powered stirrer.
c. CHL A or AFDM subsample filter removed from filter base withforceps.
d. Subsample filter folded in quarters and wrappedin aluminum foil.
e. Label placed on petri dish containing subsample filter and then frozen in a plastic bag.
f. Performing the EWC method to prepare the QMH microalgal sample component.
Figure 6. Major steps in processing microalgal sample components in the field (photographs by R. Frehs). CHL A, chlorophyll a; AFDM, ash-free dry mass; EWC, equal weight composite; QMH, qualitative multihabitat.

ing on PHY density as indicated by the color of the filtered sample) taken from a cone or churn splitter. For the PHY POC subsample, at least two 25-mm filters must be prepared by filtering a 30- to 100-mL subsample on each filter. The reduced subsample volume is necessary because of the smaller filter size. The filtered subsample should be a tan to light brown color on the filter.]
8. Filter the aliquots by using 10 psi (69 kPa).
a. Examine the filter. An adequate amount of microalgal biomass for analysis is indicated by the green or brown color of material retained on the filter (fig. 6c). Extract addi-tional 5.0-mL aliquots and filter until the desired level of biomass is obtained.
b. Determine the number of 5.0-mL aliquots fil-tered and record the subsample volume on the field data sheet (For example, 2 aliquots x 5.0 mL/aliquot = 10 mL subsample volume).
c. Rinse the funnel sides with deionized water; allow the water to be vacuumed completely before releasing the vacuum from the filtering apparatus.
d. Remove the filter from the funnel base with forceps.
e. Repeat the filtering steps for each subsample collected. [Note: additional subsamples might be collected and filtered as QC replicates for CHL A and AFDM analysis if required by the study.]
9. Prepare the filtered CHL A and AFDM or POC subsamples for shipping to the NWQL.
a. Fold each filter into quarters with filtered bio-mass inside. Wrap each filter in a small piece of aluminum foil and place in separate 47-mm plastic petri dishes (fig. 6d, e).
b. Seal the edge of the petri dish with plastic tape. Label the dish with the following required information: site, collection date, total sample area, sample volume, subsample volume, and sample identification code.
c. Place the labeled petri dishes in resealable plastic bags and pack in a cooler containing
dry ice. About 4.5 kg (10 pounds) of dry ice is needed for subsamples packed in a small cooler (< 2 gal). Insulate the cooler with newspaper to minimize sublimation of the dry ice.
d. Complete an Analytical Services Request (ASR) form for each sample that indicates which laboratory analyses are to be per-formed. Use NWQL Schedule 1632 [analysis for periphyton using U.S. Environmental Pro-tection Agency (USEPA) Fluorometric Method No. 445 for CHL A and AFDM deter-mination] for RTH samples. Use NWQL Schedule 1637 (analysis of CHL A in phy-toplankton) and NWQL Schedule 2631 (anal-ysis of carbon) for PHY samples.
e. Contact NWQL personnel to make them aware of plans to ship (via overnight shipping service) coolers containing dry ice and frozen CHL A and AFDM or POC subsample filters. Coolers should be shipped within a day or two after the subsamples are prepared because of a 25-day holding-time limit on the subsamples. Subsamples can be temporarily stored in freezers (at -20°C) at the field office over weekends.
10. Measure the volume of the remaining microalgal sample component (this represents the subsample volume of the ID subsample).
11. Preserve the ID subsample with a sufficient vol-ume of buffered formaldehyde according to the following table to obtain a final concentration of 3 to 5 percent buffered formalin. Record the pre-servative volume on the field data sheet.
12. Place a completed sample label (fig. 2) on the sample bottle.
13. If the volume of the preserved ID subsample (subsample volume + preservative volume) is > 500 mL, then the ID subsample must be decanted until volume is < 500 mL. [Note: this
Volume (mL)
Sample 25 50 100 125 200 250 300 350 400 450 475
Bufferedformaldehyde
1 2 4 6 8 11 14 16 18 22 23
Field Protocols 27

step is typically performed in the field office after sampling is completed.]
a. Record the "before decant volume" on the field data sheet. [Note: BDV = subsample vol-ume + preservative volume.]
b. Allow all of the algal biomass to settle to the bottom of the sample bottle. Four to seven days might be necessary for settling.
c. Attach one end of tubing to a Pasteur pipette and the other end to the filtering flask, which is attached to the vacuum pump.
d. Create a vacuum and insert the pipette tip into the sample bottle. Carefully siphon the excess liquid into the flask, making sure not to dis-turb the biomass settled on the bottom. Con-tinue siphoning until the sample volume is < 500 mL.
e. Measure the "after decant volume" of the ID subsample and record on the field data sheet.
4.5.2 Qualitative microalgae and macroalgae
The QMH micro- and macroalgal sample com-ponents are preserved and submitted to the laboratory only for taxonomic analysis. The microalgal sample component is prepared by using the EWC method to combine equal aliquots of the discrete collections taken from epilithic, epidendric, epiphytic, epipsammic, and epipelic habitats. The resulting composited microalgal sample component would contain about 20 percent of the periphyton from each habitat if all five habitats were sampled.
Using the EWC method to process the QMH microal-gal sample component:
1. Place the five habitat bottles on a flat surface and homogenize each with a battery-powered tissue homogenizer (fig. 6f). Allow the contents in each bottle to settle for several minutes.
2. Order the habitat bottles from least to greatest volume of biomass.
3. Beginning with the habitat bottle having the least volume (typically the epiphytic habitat bottle), remove 5-mL aliquots from the bottom of each habitat bottle and dispense into a 125- or 250-mL sample bottle.
4. Continue removing series of 5-mL aliquots until the habitat bottle with the least volume is < 5 mL.
5. After discarding the remaining discrete collec-tions, rinse the labeled habitat bottles with fil-tered stream water and reuse later. Measure the volume of the composited microalgal sample component and record it on the Qualitative Multi-habitat Periphyton Sample Field Data Sheet (Algae Tip 1).
6. Preserve the sample with buffered formaldehyde and place a completed sample label (fig. 2) on the sample bottle.
4.6 Quality-control recommendations
Additional (10–20 percent) subsample splits can be prepared for CHL A, AFDM or POC, and ID sub-samples to evaluate precision of subsample preparation and laboratory analysis. Replicated sampling within the reach can be used to evaluate the variance in algal com-munity structure. These QC samples are collected or prepared depending on the objectives of the study.
4.7 Field data sheets
Three different field data sheets are used to record information about the sampling site, the algal samples collected, and supporting sample data (for example, light measurements). The field data sheets are presented in the following order at the end of this sec-tion:
• Quantitative Targeted-Habitat Periphyton Sample Field Data Sheet (QTHP; 2 pages)
• Quantitative Phytoplankton Sample Field Data Sheet (QPS; 2 pages)
• Qualitative Multihabitat Periphyton Sample Field Data Sheet (QMH; 2 pages)
Algae Tip 1—Determining sample volumes: measurement by proxyMeasurement by proxy is a good technique for indirectly determining the volume of a sample. Applying this technique minimizes handling of the sample and reduces the chance for sample spillage. Obtain an empty bottle identical to the one contain-ing the algal sample. Fill the bottle with water until the volume level is equal to that in the sample bot-tle. Pour the water into a graduated cylinder and determine volume in milliliters.
28 Revised Protocols for Sampling Algal, Invertebrate, and Fish Communities as Part of the National Water-Quality Assessment Program

Information that is recorded on each field data sheet is organized into sections (table 4) that corre-spond to data-entry screens in Bio-TDB. Except for these section labels (for example, "Sample Header"), data fields or subsections that are shown in bold face are required for entry into Bio-TDB. Consult the Bio-TDB User Manual (Ruhl and Scudder, accessed April 26, 2002) for additional information on entering field data into the data base.
Before leaving the sampling site, the team leader should review the field data sheets for completeness and accuracy by comparing information on sample bot-tle/filter labels and field data sheets, especially in the "Sampling Information" section. All missing or incor-rect information should be completed or corrected. Field data sheets (blank and completed) should be printed on waterproof paper and stored in resealable bags for additional protection from water.
SectionThis section is used to
document
Completed on field data sheet?
QTHP QPS QMH
Sample header Where and when a sample was collected
Yes Yes Yes
Related sam-pling activities
Other sampling activitiesYes Yes Yes
Physical site conditions
Physical and chemical condi-tions at the time of sampling
Yes Yes Yes
Sampling infor-mation
How a sample is collected and processed in the field
Yes Yes Yes
Supporting information
Ancillary sampling informa-tion taken in conjunction with discrete collections
Yes Yes No
Table 4. Explanation of field data-sheet sections used to record information about algal sampling activities
[QTHP, quantitative targeted-habitat periphyton sample; QPS, quantitative phytoplankton sample; QMH, qualitative multihabitat sample]
Field Protocols 29

30 Revised Protocols for Sampling Algal, Invertebrate, and Fish Communities as Part of the National Water-Quality Assessment Program
Quantitative Targeted-Habitat Periphyton SampleField Data Sheet
SAMPLE HEADER
Station: Date (MM/DD/YYYY):/ /
Waterbody:
Station description:
Station ID: Reach: Start time: h
Collector (leader): End time: h
Sample and photographic notes:
RELATED SAMPLING ACTIVITIES (circle all that apply)
Water chemistry Discharge Habitat survey Tissues
Invertebrate survey Fish survey Bed sediment Other (specify):
PHYSICAL SITE CONDITIONS
Clouds: % Wind (circle): Calm Light Moderate Gusty
Precipitation (circle): None Rain Sleet Snow Precipitation intensity (circle): N/A Light Moderate Heavy
Other weather:
Beginning water measurements Ending water measurements
Time: Time:
Water temperature(°C):
Water temperature(°C):
pH: pH:
Dissolved oxygen(mg/L):
Dissolved oxygen(mg/L):
Specific conductance[(µS/cm) @ 25 °C]:
Specific conductance[(µS/cm) @ 25 °C]:
Turbidity(NTUs)
Turbidity(NTUs)
Discharge (ft3/s): Stream stage: ft @ time h
Riparian shading (circle): Shaded Partial Full sun
Water clarity (circle): Clear Slightly turbid Turbid Very turbid
Water color (circle): Black Brown Clear Dark green Light green Yellow
Physical site condition comments:
Page # Cumulative Page # .Date field data reviewed: / / by (initials)
Date entered into Bio-TDB: / / by (initials)Bio-TDB Sample ID
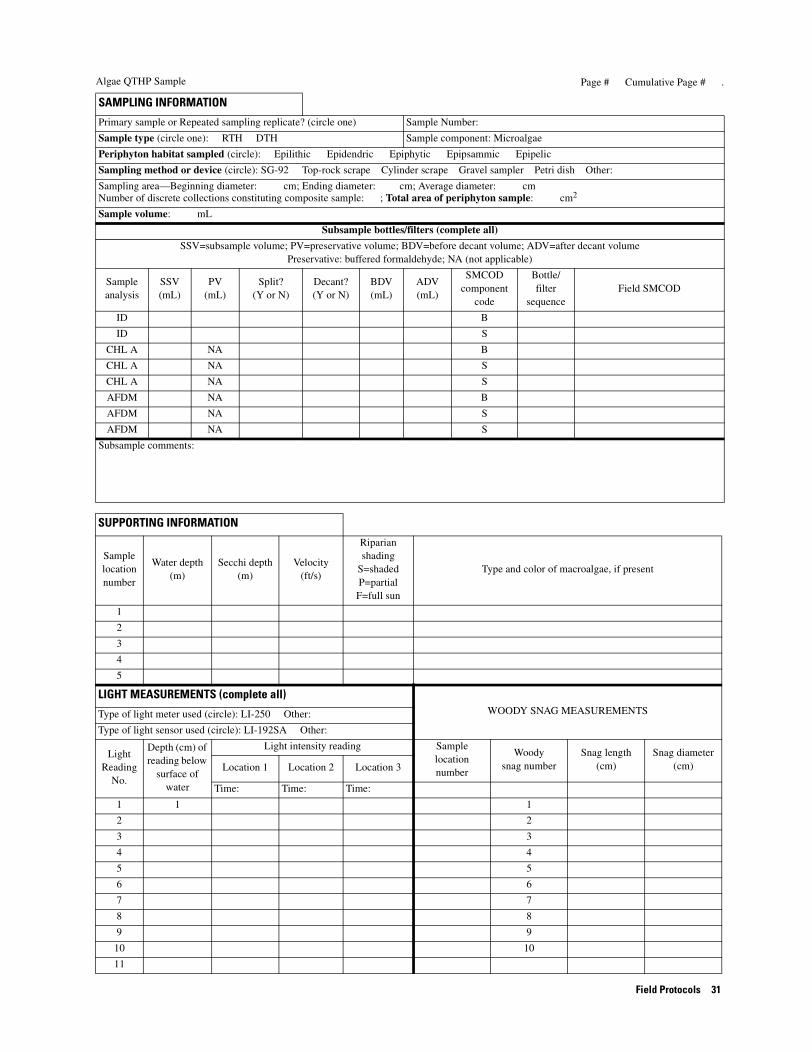
Field Protocols 31
SAMPLING INFORMATION
Primary sample or Repeated sampling replicate? (circle one) Sample Number:
Sample type (circle one): RTH DTH Sample component: Microalgae
Periphyton habitat sampled (circle): Epilithic Epidendric Epiphytic Epipsammic Epipelic
Sampling method or device (circle): SG-92 Top-rock scrape Cylinder scrape Gravel sampler Petri dish Other:
Sampling area—Beginning diameter: cm; Ending diameter: cm; Average diameter: cmNumber of discrete collections constituting composite sample: ; Total area of periphyton sample: cm2
Sample volume: mL
Subsample bottles/filters (complete all)
SSV=subsample volume; PV=preservative volume; BDV=before decant volume; ADV=after decant volumePreservative: buffered formaldehyde; NA (not applicable)
Sample analysis
SSV(mL)
PV(mL)
Split?(Y or N)
Decant?(Y or N)
BDV(mL)
ADV(mL)
SMCOD component
code
Bottle/filter
sequenceField SMCOD
ID B
ID S
CHL A NA B
CHL A NA S
CHL A NA S
AFDM NA B
AFDM NA S
AFDM NA S
Subsample comments:
Page # Cumulative Page # .Algae QTHP Sample
SUPPORTING INFORMATION
Sample location number
Water depth (m)
Secchi depth (m)
Velocity(ft/s)
Riparian shading
S=shadedP=partial F=full sun
Type and color of macroalgae, if present
1
2
3
4
5
LIGHT MEASUREMENTS (complete all)WOODY SNAG MEASUREMENTSType of light meter used (circle): LI-250 Other:
Type of light sensor used (circle): LI-192SA Other:
LightReading
No.
Depth (cm) of reading below
surface of water
Light intensity reading Samplelocationnumber
Woodysnag number
Snag length(cm)
Snag diameter(cm)Location 1 Location 2 Location 3
Time: Time: Time:
1 1 1
2 2
3 3
4 4
5 5
6 6
7 7
8 8
9 9
10 10
11

32 Revised Protocols for Sampling Algal, Invertebrate, and Fish Communities as Part of the National Water-Quality Assessment Program
Page # Cumulative Page # .Date field data reviewed: / / by (initials)
Date entered into Bio-TDB: / / by (initials)Bio-TDB Sample ID
Quantitative Phytoplankton SampleField Data Sheet
SAMPLE HEADER
Station: Date (MM/DD/YYYY):/ /
Waterbody:
Station description:
Station ID: Reach: Start time: h
Collector (leader): End time: h
Sample and photographic notes:
RELATED SAMPLING ACTIVITIES (circle all that apply)
Water chemistry Discharge Habitat survey Tissues
Invertebrate survey Fish survey Bed sediment Other (specify):
PHYSICAL SITE CONDITIONS
Clouds: % Wind (circle): Calm Light Moderate Gusty
Precipitation (circle): None Rain Sleet Snow Precipitation intensity (circle): N/A Light Moderate Heavy
Other weather:
Beginning water measurements Ending water measurements
Time: Time:
Water temperature(°C):
Water temperature(°C):
pH: pH:
Dissolved oxygen(mg/L):
Dissolved oxygen(mg/L):
Specific conductance[(µS/cm) @ 25 °C]:
Specific conductance[(µS/cm) @ 25 °C]:
Turbidity(NTUs)
Turbidity(NTUs)
Discharge (ft3/s): Stream stage: ft @ time h
Riparian shading (circle): Shaded Partial Full sun
Water clarity (circle): Clear Slightly turbid Turbid Very turbid
Water color (circle): Black Brown Clear Dark green Light green Yellow
Physical site condition comments:

Field Protocols 33
SAMPLING INFORMATION
Primary sample or Repeated sampling replicate? (circle one) Sample Number:
Sample type (circle one): PHY Sample component: Microalgae
Sampling method (circle): EDI/EWI Subsurface grab Other: ; if grab or other, collection depth is: cm
Sample volume: mL
Subsample bottles/filters (complete all)
SSV=subsample volume; PV=preservative volume; BDV=before decant volume; ADV=after decant volumePreservative: buffered formaldehyde; NA (not applicable)
Sample analysis
SSV(mL)
PV(mL)
Split?(Y or N)
Decant?(Y or N)
BDV(mL)
ADV(mL)
SMCOD component
code
Bottle/filter
sequenceField SMCOD
ID B
ID S
CHL A NA B
CHL A NA S
CHL A NA S
POC NA B
POC NA S
POC NA S
Subsample comments:
Page # Cumulative Page # .Algae QPS Sample
SUPPORTING INFORMATION
Location number
Water depth (m)
Velocity(ft/s)
Secchi depth (m)
1
2
3
4
5
6
7
8
9
10
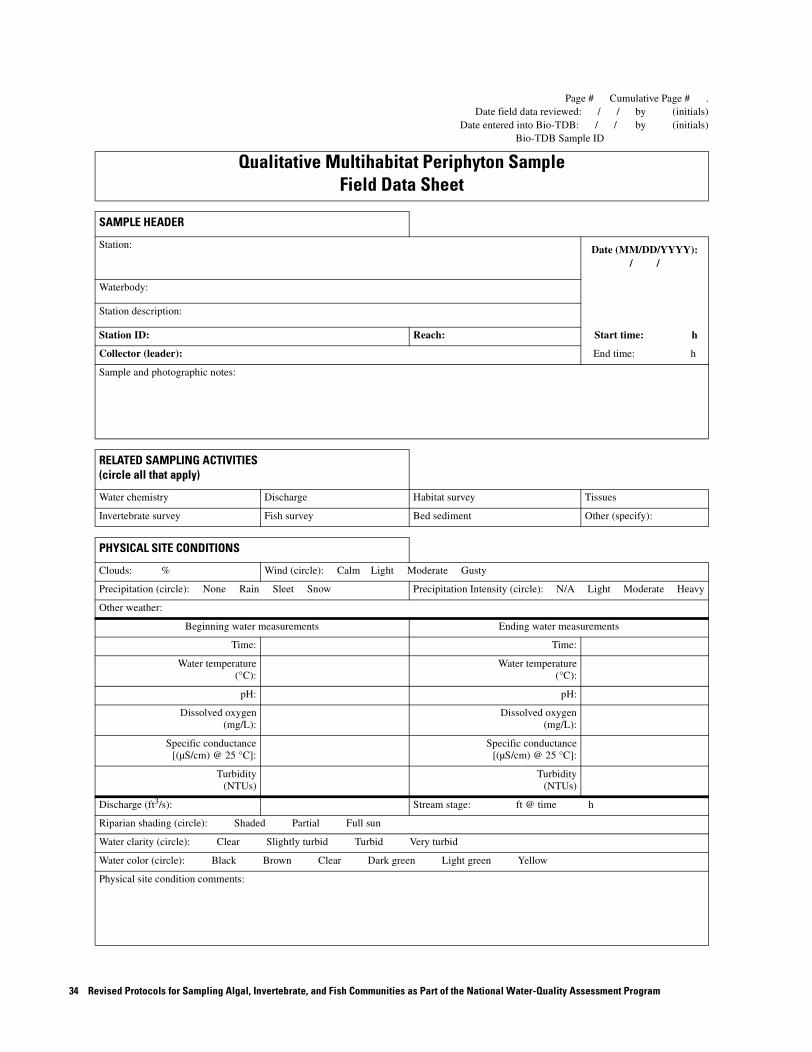
34 Revised Protocols for Sampling Algal, Invertebrate, and Fish Communities as Part of the National Water-Quality Assessment Program
Page # Cumulative Page # .Date field data reviewed: / / by (initials)
Date entered into Bio-TDB: / / by (initials)Bio-TDB Sample ID
Qualitative Multihabitat Periphyton SampleField Data Sheet
SAMPLE HEADER
Station: Date (MM/DD/YYYY):/ /
Waterbody:
Station description:
Station ID: Reach: Start time: h
Collector (leader): End time: h
Sample and photographic notes:
RELATED SAMPLING ACTIVITIES (circle all that apply)
Water chemistry Discharge Habitat survey Tissues
Invertebrate survey Fish survey Bed sediment Other (specify):
PHYSICAL SITE CONDITIONS
Clouds: % Wind (circle): Calm Light Moderate Gusty
Precipitation (circle): None Rain Sleet Snow Precipitation Intensity (circle): N/A Light Moderate Heavy
Other weather:
Beginning water measurements Ending water measurements
Time: Time:
Water temperature(°C):
Water temperature(°C):
pH: pH:
Dissolved oxygen(mg/L):
Dissolved oxygen(mg/L):
Specific conductance[(µS/cm) @ 25 °C]:
Specific conductance[(µS/cm) @ 25 °C]:
Turbidity(NTUs)
Turbidity(NTUs)
Discharge (ft3/s): Stream stage: ft @ time h
Riparian shading (circle): Shaded Partial Full sun
Water clarity (circle): Clear Slightly turbid Turbid Very turbid
Water color (circle): Black Brown Clear Dark green Light green Yellow
Physical site condition comments:
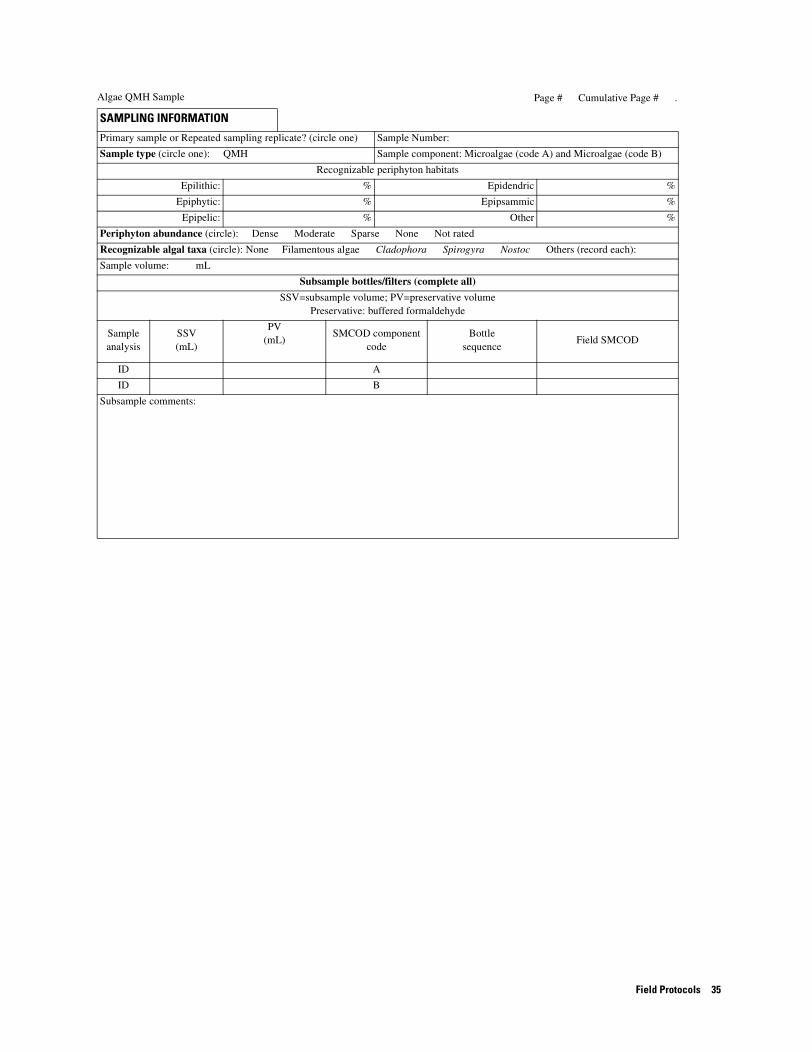
Field Protocols 35
SAMPLING INFORMATION
Primary sample or Repeated sampling replicate? (circle one) Sample Number:
Sample type (circle one): QMH Sample component: Microalgae (code A) and Microalgae (code B)
Recognizable periphyton habitats
Epilithic: % Epidendric %
Epiphytic: % Epipsammic %
Epipelic: % Other %
Periphyton abundance (circle): Dense Moderate Sparse None Not rated
Recognizable algal taxa (circle): None Filamentous algae Cladophora Spirogyra Nostoc Others (record each):
Sample volume: mL
Subsample bottles/filters (complete all)
SSV=subsample volume; PV=preservative volumePreservative: buffered formaldehyde
Sample analysis
SSV(mL)
PV(mL)
SMCOD component code
Bottlesequence
Field SMCOD
ID A
ID B
Subsample comments:
Page # Cumulative Page # .Algae QMH Sample

5. INVERTEBRATE SAMPLING PROTOCOLS
Stream invertebrate communities are sampled in the NAWQA Program following nationally consistent protocols. Invertebrate communities are characterized by using richness and abundance data derived from semi-quantitative and qualitative samples of these com-munities. These samples are collected from instream habitats that are present in the reach. The instream hab-itats are identified according to a hierarchical frame-work of geomorphic channel units, channel boundaries, and channel features. The invertebrate sampling proto-cols described herein present guidelines for identifying instream habitats, methods for semi-quantitatively and qualitatively sampling these habitats, and methods for processing collected samples in the field. These revised invertebrate sampling protocols are based on original guidance presented by Cuffney and others (1993).
5.1 Invertebrate sample types collected
Two types of invertebrate samples are collected in the NAWQA Program. A semi-quantitative sample is collected to provide a measure of relative abundance of the invertebrate taxa living in the RTH in the reach. The RTH theoretically supports the faunistically richest invertebrate community and is typically represented by a coarse-grained riffle or a woody snag. The semi-quantitative RTH sample consists of a series of discrete collections (for example, five Slack samples or 10 woody snag sections) that are processed and com-bined into a single composited sample. A QMH sample is collected to document the invertebrate taxa that are present throughout the sampling reach. A discrete QMH collection is taken from each of the different instream habitats that are present in the reach. These discrete collections are then processed and combined into a single composited sample. Both RTH and QMH samples are preserved and submitted to the NWQL for taxonomic analysis.
5.2 Identifying instream habitats for sampling
Before invertebrate sampling begins, crewmem-bers must identify and document the types of instream habitats present in the reach. This information is used to determine where RTH and QMH sampling is con-ducted in the reach. Instream habitat types are broadly defined on the basis of a hierarchical framework con-sisting of three tiers (table 1) that include (1) major geomorphic channel units, (2) major channel bound-
aries, and (3) major channel features (Cuffney and oth-ers, 1993). This instream hierarchy is applied to identify instream habitats in wadeable and nonwade-able streams. The following explanation of each tier in this hierarchy was taken or modified from Cuffney and others (1993):
• Tier 1 instream habitat hierarchy defines major geomorphic channel units (table 1) present in the reach, such as riffles, runs, and pools.
• Tier 2 relates the influence of major channel boundaries (table 1) to the distribution of inverte-brates (particularly in large rivers) by subdividing each of the major geomorphic units into main channel, channel margin, and island margin areas (Thorp, 1992). Margins, loosely defined as instream areas associated with the edges of main or secondary channels and islands, are typically depo-sitional, subhorizontal fluvial surfaces, with reduced current velocity as compared with the adjacent channel area. Margins are influenced heavily by the streambanks and typically contain elements directly derived from the streambank, such as root wads, woody snags, and terrestrial vegetation that trails into the water. Channels tend to be less influenced by the channel banks and rep-resent the main or secondary flow path of the river. The extent of the margin will be influenced by river stage, the size of the river, and channel characteris-tics. For example, margins might be (1) a substan-tial proportion of the width of small streams but only a very small proportion of the width of large rivers, (2) greatly reduced on the outside of stream meanders but extensive on the inside of stream meanders, and (3) abundant at low flows but inac-cessible at high flows. It is important to differenti-ate margins because marginal areas might contain richer communities of organisms than channel areas as a result of the increased complexity of the stream margin habitat. This circumstance is partic-ularly true of large, deep rivers.
• Tier 3 of the instream habitat hierarchy focuses on major channel features (table 1) that are important in the distribution of invertebrates and that can be sampled discretely. The six types of major channel features that can be sampled for invertebrates include: natural bed, manufactured bed, slough, macrophyte bed, woody snag, and bar. Natural bed refers to areas where natural bed materials predom-inate and where macrophytes are not a dominant feature. Manufactured bed refers to artificial sub-
36 Revised Protocols for Sampling Algal, Invertebrate, and Fish Communities as Part of the National Water-Quality Assessment Program

strates, such as revetments, levees, pilings, junk cars, tires, shopping carts, riprap, dams, weirs, and bridge piers. Bars are shallow, gently sloping sand or gravel ridges primarily associated with channel edges or major changes in water velocity. Bars can resemble islands when they are exposed at low flows and vegetated. However, islands typically have woody vegetation and are at an elevation equal to or above that of the surrounding flood-plain. Sloughs are remnants of abandoned river channels that are connected with the main channel even at normal low flows. Sloughs that are isolated at low flows tend to diverge biologically and chem-ically from conditions in the river and are not con-sidered here as an instream habitat. Woody snags refer to trees, branches, roots, or other woody debris of terrestrial origin that extend into the water column either from the streambank or streambed. Macrophyte beds are areas where emergent or sub-mergent aquatic plants dominate and invertebrate communities are expected to contain organisms dependent upon such plants.
Collectively, this three-tiered hierarchy describes 54 possible habitat types (table 5). However, sloughs are restricted to channel and island margins, so only 51 habitat types are available for qualitative and semi-quantitative sampling. Following the guidelines for establishing the size and location of the sampling reach (see Fitzpatrick and others, 1998) should lead to the inclusion of the majority of instream habitat types typical of the stream at a given location.
5.3 Semi-quantitative targeted-habitat methods for sampling wadeable and nonwadeable streams
The type of RTH sampled may vary with the geographic location of the stream and the longitudinal position of the sampling reach along that stream. Based on the instream habitat matrix presented in table 5, hab-itat types are assigned priority (fig. 7) to help crew-members identify the most appropriate RTH that will be semi-quantitatively sampled. Elements in each of the three hierarchical tiers that collectively define a particular habitat type are ranked from highest priority (level 1) to lowest priority (level 3 or 5 depending on the tier).
In general, invertebrate diversity and abundance increase with increasing particle size and then decline with particle size greater than the size of cobbles (Min-shall, 1984; Allan, 1995). Increasing substrate particle size results in more stable substrates and interstitial spaces that are available for colonization. Substrate sta-bility and the greater exchange of gasses and water are factors explaining why coarse-grained substrates are the faunistically richest areas in a stream. In most cir-cumstances, a "riffle, main-channel, natural-bed" habi-tat type is selected as the RTH for semi-quantitative sampling in wadeable streams ("natural bed" in this case refers to coarse-grained substrates). When this habitat type is not predominant in the reach (for exam-ple, a sandy-bottomed Coastal Plain stream) or cannot be sampled effectively (for example, nonwadeable streams), then woody snags are often selected as the RTH.
Field Protocols 37
Major geomorphic
channel units
Majorchannel
boundaries
Major channel features
Naturalbed
Manufacturedbed
SloughMacrophyte
bedWoodysnag
Bar
Riffle
Main channel
Channel margin
Island margin
Run
Main channel
Channel margin
Island margin
Pool
Main channel
Channel margin
Island margin
Table 5. Generalized matrix of the 51 instream habitats (as defined by major geomorphic channel units, channel boundaries, and channel features) that can be present in a sampling reach from which invertebrate samples are collected (from Cuffney and others, 1993). Open cells indicate habitats that are possible; shaded cells indicate habitats that are not possible
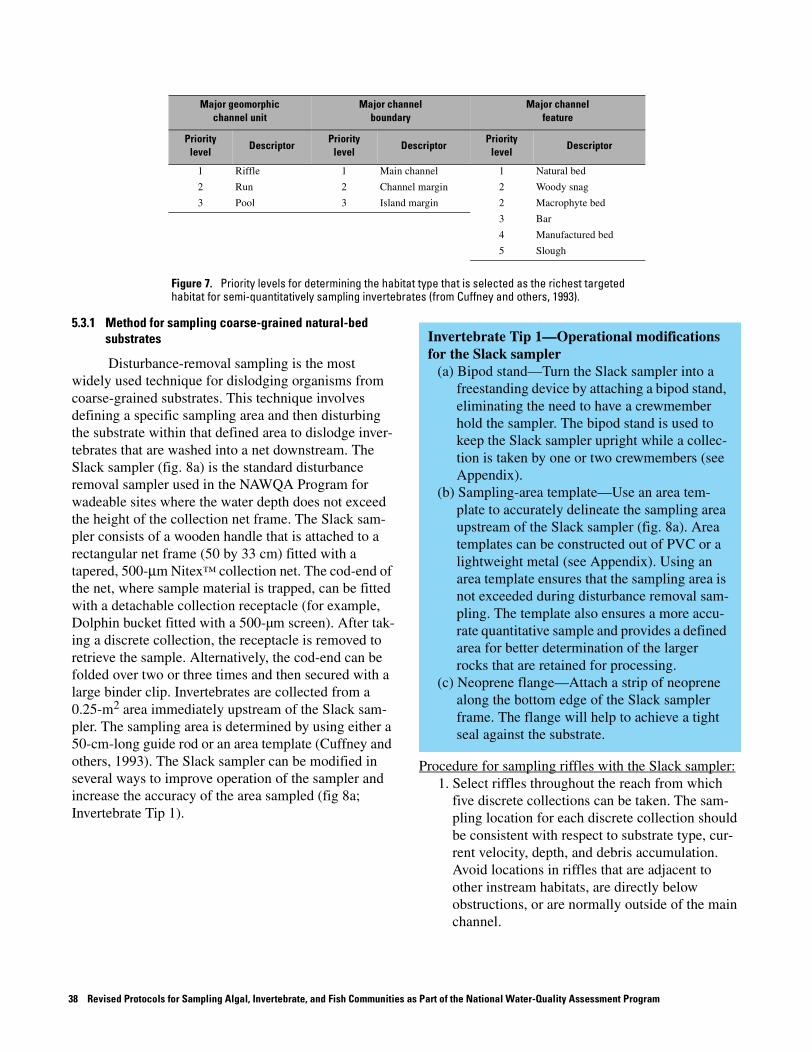
Major geomorphicchannel unit
Major channelboundary
Major channelfeature
Prioritylevel
DescriptorPriority
levelDescriptor
Prioritylevel
Descriptor
1 Riffle 1 Main channel 1 Natural bed
2 Run 2 Channel margin 2 Woody snag
3 Pool 3 Island margin 2 Macrophyte bed
3 Bar
4 Manufactured bed
5 Slough
Figure 7. Priority levels for determining the habitat type that is selected as the richest targeted habitat for semi-quantitatively sampling invertebrates (from Cuffney and others, 1993).
5.3.1 Method for sampling coarse-grained natural-bed substrates
Disturbance-removal sampling is the most widely used technique for dislodging organisms from coarse-grained substrates. This technique involves defining a specific sampling area and then disturbing the substrate within that defined area to dislodge inver-tebrates that are washed into a net downstream. The Slack sampler (fig. 8a) is the standard disturbance removal sampler used in the NAWQA Program for wadeable sites where the water depth does not exceed the height of the collection net frame. The Slack sam-pler consists of a wooden handle that is attached to a rectangular net frame (50 by 33 cm) fitted with a tapered, 500-µm Nitex™ collection net. The cod-end of the net, where sample material is trapped, can be fitted with a detachable collection receptacle (for example, Dolphin bucket fitted with a 500-µm screen). After tak-ing a discrete collection, the receptacle is removed to retrieve the sample. Alternatively, the cod-end can be folded over two or three times and then secured with a large binder clip. Invertebrates are collected from a 0.25-m2 area immediately upstream of the Slack sam-pler. The sampling area is determined by using either a 50-cm-long guide rod or an area template (Cuffney and others, 1993). The Slack sampler can be modified in several ways to improve operation of the sampler and increase the accuracy of the area sampled (fig 8a; Invertebrate Tip 1).
Procedure for sampling riffles with the Slack sampler:1. Select riffles throughout the reach from which
five discrete collections can be taken. The sam-pling location for each discrete collection should be consistent with respect to substrate type, cur-rent velocity, depth, and debris accumulation. Avoid locations in riffles that are adjacent to other instream habitats, are directly below obstructions, or are normally outside of the main channel.
Invertebrate Tip 1—Operational modifications for the Slack sampler
(a) Bipod stand—Turn the Slack sampler into a freestanding device by attaching a bipod stand, eliminating the need to have a crewmember hold the sampler. The bipod stand is used to keep the Slack sampler upright while a collec-tion is taken by one or two crewmembers (see Appendix).
(b) Sampling-area template—Use an area tem-plate to accurately delineate the sampling area upstream of the Slack sampler (fig. 8a). Area templates can be constructed out of PVC or a lightweight metal (see Appendix). Using an area template ensures that the sampling area is not exceeded during disturbance removal sam-pling. The template also ensures a more accu-rate quantitative sample and provides a defined area for better determination of the larger rocks that are retained for processing.
(c) Neoprene flange—Attach a strip of neoprene along the bottom edge of the Slack sampler frame. The flange will help to achieve a tight seal against the substrate.
38 Revised Protocols for Sampling Algal, Invertebrate, and Fish Communities as Part of the National Water-Quality Assessment Program

a. Slack sampler with area template and bipod stand.
b. Ponar grabs
c. Ekman grabs
d. D-frame kick net
Figure 8. Samplers used to collect invertebrate samples in the National Water-Quality Assessment Program (Photograph a. by D. Sun; b–d by Wildlife Supply Company).
2. Acquire each discrete collection by using a Slack sampler. Each collection is taken from a 0.25 m2 area immediately upstream of the Slack sampler (total area sampled = 1.25 m2).
3. Position the Slack sampler perpendicular to the direction of flow and press tightly against the stream bottom (see fig. 10a, section 5.5). [Note: make sure the water depth does not exceed the height of the sampler frame.]
4. Measure water depth, substrate type (dominant and codominant), percent substrate embedded-ness, and velocity for each discrete collection. Record these data on the "Semi-Quantitative Tar-geted Habitat Invertebrate Sample Field Data Sheet."
5. Remove large debris (for example, large cobble and woody debris) from the sampling area if > 50 percent of their surface is within the sampling area.
6. Inspect the debris for attached organisms. Remove organisms by hand picking, rinsing, or
gently scrubbing the particle surface (see fig. 10b, section 5.5) with stream water in front of the Slack sampler opening. Alternatively, the debris can be placed in a bucket and inspected at the time the sample is processed on the shore.
7. Disturb the sampling area by digging to a depth of about 10 cm (or as deeply as practical) with a hand rake (see fig. 10c, section 5.5). Avoid col-lecting excessive amounts of sand and pebbles in the collection net by raking in an upstream direc-tion. This technique dislodges organisms and allows most of the sand and pebbles to settle out in the sampling area. Avoid using a kicking tech-nique to disturb the sampling area because it results in more damage to organisms, forces more debris into the collection net, and often causes areas outside of the sampling area to be disturbed (especially when an area template is not used).
8. Retrieve the sampler by lifting it out of the water with a slight forward motion to ensure that none of the discrete collection is lost.
Field Protocols 39

9. Rinse the collected material into the cod-end of the net by carefully splashing water on the out-side of the net.
10. Transfer each discrete collection into a 19-L (5-gal) white plastic bucket (see fig. 10d, section 5.5). Inspect the inside of the collection net for organisms; place any invertebrates found in the discrete collection.
11. Process each discrete collection following the steps presented in "Sample Processing Proce-dures" (Section 5.5).
5.3.2 Method for sampling woody snags
Many wadeable streams throughout the Midwest and coastal regions of the United States do not have rif-fles with coarse-grained substrates present that can be semi-quantitatively sampled as the RTH. Under these circumstances, woody snags are often selected as the RTH that is sampled. Woody snags are submerged sec-tions of wood (branch or log) having a minimum dia-meter of 1 cm and are colonized by aquatic organisms; other organic (for example, leaf packs) and mineral debris also might be associated with woody snags.
Procedure for sampling woody snags:1. Identify at least five (if present) woody snag loca-
tions present throughout the reach. Woody snags that are suitable for sampling should have been submerged for an extended period during which there is clear evidence of invertebrate and peri-phyton colonization.
2. At each woody snag location, select at least two snags that will be sampled. [Note: depending on the size of the woody snags, additional snags might need to be sampled to obtain enough sam-ple material for laboratory processing.]
3. Place a collection net (for example, a Slack sam-pler) downstream of the woody snag to capture and minimize loss of mobile or loosely attached invertebrates.
4. Remove the woody snag by using a saw or lop-ping shears. If the woody snag is too large to cut and remove, it can be sampled in its place by brushing its surface with a small hand brush.
5. Determine the substrate type where the woody snag was positioned. Measure the depth from the
surface of the water to the woody snag and stream bottom, and current velocity. Record these data on the "Semi-Quantitative Woody Snag Inverte-brate Sample Field Data Sheet."
6. Remove attached organisms by handpicking, brushing, and rinsing the surface of each branch into a 19-L (5-gal) plastic bucket (see Inverte-brate Tip 2). After the initial brushing and rinsing process is complete, place the woody snags in a separate bucket for about 1 hour. As the snags dry in the bucket, missed organisms will crawl out of crevices and then can be collected. Add these organisms to the rest of the sample material.
7. Combine the sample material collected from each woody snag and process the composited sample following the steps presented in "Sample Pro-cessing Procedures" (Section 5.5).
8. Measure the length and diameter of each woody snag to determine the area sampled. If only a por-tion of the woody snag was sampled, then the length and width of the area sampled is measured. Record these data on the "Semi-Quantitative Woody Snag Invertebrate Sample Field Data Sheet." Discard all woody snag sections after measurements are obtained.
Invertebrate Tip 2—Using a pump sprayer to rinse samples
Use a 1-gallon, home and garden pump sprayer to rinse sample material from woody snags. Since these sprayers are not high pressure, they are not likely to damage organisms. Using these spray-ers during sample processing also can save time because the user does not have to continually refill a squirt bottle. The sprayer also can be used to dis-pense the 1-percent bleach solution for cleaning samplers and nets.
40 Revised Protocols for Sampling Algal, Invertebrate, and Fish Communities as Part of the National Water-Quality Assessment Program

5.3.3 Method for sampling fine-grained natural-bed substrates
In situations where coarse-grained natural-bed substrates or woody snags cannot be sampled, fine-grained natural-bed substrates (for example, sand) might be sampled as the RTH. Fine-grained sediments are typically sampled by using a grab sampler (fig. 8b, c). Grab samplers (for example, Ekman or Petite Ponar grabs) can be used in wadeable and nonwadeable streams. A hand or power winch is recommended for operating a weighted grab in deep water. All screening on the grab sampler must have mesh openings of 500 µm. Make sure all crewmembers understand how to safely operate grab samplers.
Procedure for sampling fine-grained sediments with a grab sampler:
1. Identify locations throughout the reach where five discrete collections of fine-grained sediment can be taken. [Note: in some nonwadeable streams it might be necessary to determine the location of these sediments by using a simple sonar unit, such as those used by sport fishermen to locate schooling fish (Cuffney and others, 1993)].
2. Carefully lower the grab sampler to the stre-ambed. In nonwadeable streams, lower the sam-pler to within about 3 m of the streambed. Stop lowering the sampler, then drop it to the bottom. [Note: this deployment technique will minimize disturbance of the substrate by the descending sampler (Cuffney and others, 1993)]. Depending on the type of grab sampler being used, the jaw release mechanism will disengage when the sam-pler hits the streambed (Petite Ponar grab) or when a weighted messenger is dropped down the deployment line (Ekman grab).
3. Recover the grab sampler and inspect to ensure that the discrete collection was not lost because of debris catching in the jaws of the sampler.
4. Measure water depth, substrate type (dominant and codominant), percent substrate embedded-ness, and velocity for each discrete collection. Record these data on the "Semi-Quantitative Tar-geted Habitat Invertebrate Sample Field Data Sheet."
5. Place the discrete collection in a 19-L (5-gal) white plastic bucket. Rinse sediment remaining inside the sampler into the bucket.
6. Repeat the collection procedure until all five dis-crete collections have been taken.
7. Process each discrete collection following the steps presented in "Sample Processing Proce-dures" (Section 5.5).
5.4 Qualitative multihabitat methods for sampling wadeable and nonwadeable streams
Discrete qualitative collections of invertebrates are made primarily using a D-frame kick net (fig. 8d). These collections are supplemented with visual collec-tions that involve handpicking invertebrates from vari-ous substrates (for example, large cobbles, woody debris, leaf packs, and root wads) because some fragile invertebrates are easily damaged (for example, hep-tageniid mayflies) or are tightly adhered to a substrate (for example, some caddisfly larvae and pupae). Grab samplers might be used to collect burrowing inverte-brates living in fine-grained sediments in nonwadeable streams. Sampling effort for collecting QMH samples is standardized by time; 1 hour is allocated for QMH sampling in each reach. After identifying which instream habitats (table 5) are present in the reach, the 1-hour time limit is divided by the number of these habitats to determine the timed sampling effort in each habitat. [Note: this sampling time does not include time spent inspecting the net or moving around to different habitats.] For example, if 10 different instream habitats were present in reach A, then the time spent intensively sampling each habitat would be 6 minutes.
Qualitative sampling in wadeable and nonwadeable streams:
1. Identify the number and type of instream habitats present in the reach.
2. Determine the sampling time for each instream habitat type by dividing 1 hour by the number of habitat types present in the reach.
3. Using a D-frame kick net (with a 500-µm mesh net), sample each instream-habitat type by vigor-ously kicking, jabbing, dipping, or sweeping the substrate with the kick net. Handpick inverte-brates from various substrates when necessary to collect fragile or tightly adhered invertebrates.
Field Protocols 41
Use a boat-operated grab sampler to collect bur-rowing invertebrates living in fine-grained sedi-ments found in nonwadeable streams.
4. Place each discrete collection into a 19-L (5-gal), white plastic bucket. If the amount of material from each discrete collection is minimal, it might be easier to composite these collections before processing the sample in the field.
5. Process the QMH sample following the steps pre-sented in "Sample Processing Procedures" (Sec-tion 5.5).
5.5 Sample processing procedures
The goal of processing invertebrate samples at the study site is to reduce the volume of sample and clean the composite sample that is submitted to the lab-oratory for analysis. Processing a single discrete collec-tion or composited sample in the field can produce up to four different sample components: large-rare, main-body, split, and elutriate (fig. 9). These four com-ponents are derived from processing procedures that are implemented to reduce the amount of extraneous organic and inorganic debris that accumulates during collection or when two or more discrete collections are composited. The major tasks associated with process-ing invertebrate samples in the field are as follows:
1. Rinse and remove large debris (for example, cob-bles, filamentous algae, leaves, and twigs) from each discrete collection.
2. Elutriate and sieve the discrete collection sample to separate invertebrates and organic debris (for example, detritus) from inorganic debris (for example, mineral sediments). Use 500-µm sieves [USA Standard Testing Sieve, American Society for Testing and Materials (ASTM) number 35 or Tyler equivalent 32 mesh] to elutriate and sieve samples. The invertebrates and organic debris form the main-body sample component; this com-ponent is required for laboratory analysis. The inorganic debris forms the elutriate sample com-ponent; this component is discarded in the field.
3. Remove large crayfish, hellgrammites, and mus-sels from each discrete collection. These organ-isms are removed because they can prey on or damage other invertebrates in the sample while the discrete collections are being processed.
These organisms are tracked separately as the large-rare sample component. This component is produced only if these organisms are present in the sample; it is not required for laboratory anal-ysis at the NWQL.
4. Reduce the volume of the main-body sample component, if necessary, to an acceptable volume (< 750 mL) that facilitates laboratory analysis. The sample volume is reduced by splitting the main-body sample component in half until an acceptable volume is obtained. One-half of the final split is designated as the main-body sample component and sent to the NWQL for analysis; the second half of the final split is designated as the split-sample component and is discarded in the field or retained at the field office, depending on study objectives.
5. Place the large-rare, main-body, and split (optional) sample components in labeled, stan-dardized bottle types and preserve with 10-percent buffered formalin.
6. Record site and sample information for each sam-ple collected on a field data sheet.
Processing an invertebrate sample in the field:1. Remove large debris (for example, cobbles, fila-
mentous algae, leaves, and twigs) from each dis-crete collection and inspect for attached invertebrates, especially small cryptic inverte-brates (for example, microcaddisflies and water penny beetle larvae).
a. Carefully remove any attached invertebrates by rinsing (fig. 10e) and place them in the main-body sample component (see Inverte-brate Tips 3 and 4).
b. Discard the large debris.
42 Revised Protocols for Sampling Algal, Invertebrate, and Fish Communities as Part of the National Water-Quality Assessment Program

Field Protocols 43
Discrete invertebratecollections in separate
buckets
Sieve to rinse out fine sediments
Composite discrete collections
Remove large debrisand visually inspect for
invertebrates
Main-bodysample componentvolume > 750 mL?
ProcessedLarge-rare sample component
Split sample component(discard in field or label, preserve,
and retain at field office)
Label samplecomponents andlog samples into
Bio-TDB
Prepare sample bottlesfor shipping and
submit to NWQL foranalysis
Elutriate each discretecollection
Elutriate sample component(discard in field)
YES
NO
Split main-bodymethod until
volume < 750 mL
Place sample components inbottles and preserve with 10%
buffered formalin
ProcessedMain-body sample component
Inspect bucket forinvertebrates
Discrete collections
Detritus and invertebrates retained on500 mm sieve
“Main-body sample component”
Inorganic debrisin buckets Invertebrates
Eluted organicdetritus and
invertebrates
Remove large rare invertebrates
Mussels, crayfish,hellgramites
Main-body sample component
Figure 9. Steps followed in the field to process invertebrate samples in the National Water-Quality Assessment Program. mL, milliliter; µm, micrometer; <, less than; >, greater than; %, percent; Bio-TDB, Biological Transactional Data Base; NWQL,National Water Quality Laboratory.

44 Revised Protocols for Sampling Algal, Invertebrate, and Fish Communities as Part of the National Water-Quality Assessment Program
a. Two crewmembers taking a discrete collection using Slack sampler.
b. Removing attached invertebrates from large cobbles with a hand brush just upstream of the Slack sampler opening.
c. Using a hand rake to disturb fine substratesto a depth of 0.1 m within the area template.
d. Transferring the discrete collection into a 19-L (5-gal) plastic bucket.
e. Rinsing pieces of large organic material using a dual wash bucket.
Figure 10. Key steps in the collection and processing of invertebrate samples. (Photographs a-f by D. Sun).

Field Protocols 45
f. Elutriating the discrete collection using a bucket and sieve.
g. Visually examining elutriate sample component for cryptic organisms such as caddisflies that make cases out of sand.
h. Picking large-rare organisms from the RTH sample.i. Sieving to remove fine sediment and evenly distribute material prior to splitting.
j. Using the sieve diameter splitting method to reduce sample volume to less than 750 mL.
k. Placing the main-body sample component into a standard sample bottle.
Figure 10. Key steps in the collection and processing of invertebrate samples—Continued.(Photographs g by J. Kennen, h by M. Ayers, i-k by D. Sun).
2. Elutriate each discrete collection onto a 500-µm mesh sieve to separate invertebrates and organic debris from the inorganic debris (fig. 10f). Doing this will minimize damage to organisms and maximize effective elutriation. However, if the volume of each discrete collection is < 250 mL, then it might be more efficient to composite all of the discrete collections and then elutriate the composited sample.
a. Place each discrete collection in a separate 19-L (5-gal) plastic bucket filled about one-third full with water.
b. Carefully stir the contents of each bucket by hand to suspend as much of the sample mate-rial as possible.
c. Swirl the suspended sample material and care-fully decant it onto a 500-µm sieve that is held over a dishpan. The dishpan provides secon-dary containment to catch any decanted sam-ple that is spilled outside of the sieve. Pour any sample spilled in the dishpan directly onto the sieve unless it includes a large volume of inorganic debris. [Note: use a large-diameter (30-cm) sieve to facilitate subsequent sieving of the sample to remove fine sediments.]
d. As decanting proceeds, watch the advancing inorganic sediment front to avoid pouring it onto the sieve (fig. 10f).
e. Stop decanting when the inorganic sediment front reaches the lip of the bucket.
f. If sample is spilled in the dishpan, then pour the dishpan water (except fine sediment) back into the 19-L (5-gal) bucket. Otherwise, dis-card the dishpan water.
g. Repeat elutriation about three to five times for each discrete collection until the inorganic debris (elutriate sample component) appears free of detritus and organisms. [Note: heavy organisms such as mollusks and some case-building caddisflies might settle too fast during decantation and will not be able to be elutriated.]
h. Set the elutriate sample component contained in the bucket aside for later inspection.
i. Repeat the bucket elutriation for each discrete collection by elutriating onto the same sieve.
j. The invertebrates and organic debris that are retained on the 500-µm sieve represent the composited main-body sample component.
3. Inspect the elutriate sample component remain-ing in the bucket for invertebrates, particularly heavy organisms such as mollusks and some case-building caddisflies that often do not decant onto the sieve during elutriation.
Invertebrate Tip 3—Separating invertebrates from filamentous algae and moss
Removing invertebrates from filamentous algae and moss is difficult. Doing this after elutria-tion and compositing makes the removal task even more difficult and can even confound laboratory processing if large clumps of filamentous algae are present in the submitted samples. However, organ-isms can be effectively removed from filamentous algae by gently agitating the algae or moss clumps for a few seconds in a bucket filled about one-third full with water. Periodically inspect the clumps to determine if more agitation is necessary. Pour the organisms remaining in the bucket onto the 500-µm sieve after elutriation.
Invertebrate Tip 4—Dual bucket sieving and washing technique
Large quantities of large debris (for example, leaves and woody debris) can be quickly removed from the main-body sample component by using a dual bucket sieving and washing technique. Prepare a 10-L (2.5-gal) dunking bucket by replacing the bottom with a 1.3-cm (0.5-in) wire mesh screen (fig. 10e); make sure the dunking bucket fits easily inside one of the 19-L (5-gal) buckets used to elutri-ate samples. Fill the 19-L (5-gal) bucket two-thirds full of water. Add portions of the main-body sample component to the dunking bucket while it is inside the 19-L (5-gal) bucket. Carefully work the dunking bucket to sieve the fine organic debris and inverte-brates, leaving behind the rinsed large debris. Care-fully pour the contents of the bucket into a 500-µm sieve and discard the large debris retained by the dunking bucket after it has been quickly scanned for invertebrates.
46 Revised Protocols for Sampling Algal, Invertebrate, and Fish Communities as Part of the National Water-Quality Assessment Program

a. Place a small amount of the elutriate sample component in a shallow white tray containing enough water to float debris to facilitate detec-tion of invertebrates. Alternatively, the elutri-ate sample component can be inspected in a sieve (fig. 10g).
b. If necessary, sieve the elutriate sample compo-nent through a pair of nested large-meshed (for example, 2- and 4-mm) sieves to separate the larger gravel and pebble material and expedite the inspection and removal of inver-tebrates.
c. Place cryptic invertebrates (for example, elmid beetle larvae and case-building caddis-flies) in the main-body sample component.
4. Inspect the main-body component for large rare invertebrates (for example, mussels, crayfish, and hellgrammites) (fig. 10h) that might prey upon or damage other invertebrates in the collection.
a. Remove only these organisms and place them in a separate bottle identified as the large-rare sample component. Match the bottle size to the size and quantity (typically no more than 20) of organisms. [Note: if these organisms are not present in the collection, then do not prepare a large-rare sample component.]
b. Do not add clumps of sample debris to the bottle. This debris often contains other inver-tebrates, especially early instar specimens, and interferes with laboratory analysis.
5. Wash the main-body sample component remain-ing on the 500-µm sieve by dipping and swirling the sieve repeatedly in the stream (fig. 10i) or a dishpan. Washing and sieving removes fine sedi-ment from the main-body sample component, which facilitates laboratory analysis.
6. Reduce the volume of main-body sample compo-nent if it exceeds 750 mL by using the sieve diameter splitting method (fig.10j).
a. Ensure that large debris and large-rare organ-isms have been removed from the main-body sample component.
b. Use a standard 20- or 30-cm diameter metal sieve marked with six equally spaced (30
degrees apart) diameters (see fig. 10k). The diameter markings are extended up the inside walls of the sieve and numbered 1 through 6.
c. Evenly distribute the main-body sample com-ponent on the 500-µm sieve by immersing the sieve in water, redistributing the sample, and then carefully lifting the sieve level out of the water so the sample remains in place on the sieve (fig. 10i).
d. Roll a die to select randomly which of the six diameters will be used to divide the sample in half.
e. Using a ruler and putty knife, divide the main-body sample component along the ran-domly selected diameter (fig.10j). Determine in an unbiased manner (for example, flipping a coin), which half becomes the new, reduced main-body sample component; the corre-sponding half is designated as the split sample component.
f. Repeat the sieve diameter splitting method on each new main-body sample component until a volume < 750 mL is obtained. Discard each split sample component that is produced up to the final split. Track and record the number of splits performed; this information is required to determine the total sample abundances for individual invertebrate taxa after laboratory analysis.
g. Place the final main-body sample component in a single appropriately sized wide-mouth plastic bottle (for example, Nalgene™) that does not exceed 1 L in capacity (fig. 10k). [Note: ensure that sufficient space remains in the bottle for adding buffered formalin to pre-serve the sample.]
h. The final split-sample component may be dis-carded in the field or preserved and retained at the study office if the integrity of the main-body sample component is compro-mised during shipping or laboratory analysis.
7. Preserve the large-rare, main-body, and split sam-ple components with 10-percent buffered forma-lin.
Field Protocols 47

a. Add enough 10-percent buffered formalin to bring the total volume to within 2 cm of the top of the bottle.
b. Cap the bottle and carefully invert it several times to mix the sample and buffered forma-lin.
c. Open the bottle and top off with additional 10-percent buffered formalin. This step mini-mizes large void spaces that can cause increased agitation of the sample (especially during shipping) and potentially damage frag-ile invertebrates.
8. Place a sample label on the outside of the main-body, split, and large-rare sample compo-nent bottles.
9. Record collection and sample information on the appropriate field data sheet corresponding to a particular sample type.
5.6 Field data sheets
Three different field data sheets are used to record site and sample information associated with invertebrate sample collection. The field data sheets are presented in the following order at the end of this sec-tion:
• Semi-Quantitative Targeted Habitat Invertebrate Sample Field Data Sheet (SQTH; 2 pages)
• Semi-Quantitative Woody Snag Invertebrate Sam-ple Field Data Sheet (SQWS; 2 pages)
• Qualitative Multihabitat Invertebrate Sample Field Data Sheet (QMH; 2 pages)
Information that is recorded on each field data sheet is organized into sections (table 6) that corre-spond to data entry screens in Bio-TDB. Except for these section labels (for example, "Sample Header"), data fields or subsections that are shown in bold face are required for entry into Bio-TDB. Consult the Bio-TDB User Manual (Ruhl and Scudder, accessed April 26, 2002) for additional information on entering field data into the data base.
Before leaving the sampling site, the team leader should review each field data sheet for completeness and accuracy by comparing information on sample bot-tle labels and field data sheets, especially in the "Sam-
pling Information" section. All missing or incorrect information should be completed or corrected. Supplies of each different field data sheet (blank and completed) should be stored in separate resealable bags for protec-tion from water.
SectionThis section is used to
document
Completed on field data sheet?
SQTH SQWS QMH
Sample header Where and when a sample was collected
Yes Yes Yes
Related sampling activities
Other sampling activitiesYes Yes Yes
Physical site conditions
Physical and chemical con-ditions at the time of sam-pling
Yes Yes Yes
Sampling information
How a sample is collected and processed in the field
Yes Yes Yes
Instream habitat types sampled
Which instream habitats were present and sampled by indicating the sampling gear used
Yes Yes Yes
Supporting information
Ancillary sampling infor-mation taken in conjunc-tion with discrete collections
Yes Yes No
Table 6. Explanation of field data-sheet sections used to record information about invertebrate sampling activities
[SQTH, semi-quantitative targeted habitat sample; SQWS, semi-quantitative woody snag sample; QMH, qualitative multihabitat sample]
48 Revised Protocols for Sampling Algal, Invertebrate, and Fish Communities as Part of the National Water-Quality Assessment Program

Field Protocols 49
Page # Cumulative Page # .Date field data reviewed: / / by (initials)
Date entered into Bio-TDB: / / by (initials)Bio-TDB Sample ID
Semi-Quantitative Targeted Habitat Invertebrate SampleField Data Sheet
SAMPLE HEADER
Station: Date (MM/DD/YYYY):/ /
Waterbody:
Station description:
Station ID: Reach: Start time: h
Collector (leader): End time: h
Sample and photographic notes:
RELATED SAMPLING ACTIVITIES (circle all that apply)
Water chemistry Discharge Habitat survey Tissues
Algae survey Fish survey Bed sediment Other (specify):
PHYSICAL SITE CONDITIONS
Clouds: % Wind (circle): Calm Light Moderate Gusty
Precipitation (circle): None Rain Sleet Snow Precipitation Intensity (circle): N/A Light Moderate Heavy
Other weather:
Beginning water measurements Ending water measurements
Time: Time:
Water temperature(°C):
Water temperature(°C):
pH: pH:
Dissolved oxygen(mg/L):
Dissolved oxygen(mg/L):
Specific conductance[(µS/cm) @ 25 °C]:
Specific conductance[(µS/cm) @ 25 °C]:
Turbidity(NTUs)
Turbidity(NTUs)
Discharge (ft3/s): Stream stage: ft @ time h
Riparian shading (circle): Shaded Partial Full sun
Water clarity (circle): Clear Slightly turbid Turbid Very turbid
Water color (circle): Black Brown Clear Dark green Light green Yellow
Physical site condition comments:

50 Revised Protocols for Sampling Algal, Invertebrate, and Fish Communities as Part of the National Water-Quality Assessment Program
SAMPLING INFORMATION
Primary sample or Repeated sampling replicate? (circle one) Sample Number: Mesh size: 500 µm
Number of discrete collections constituting composite: Total area of sample: cm2
Elutriation method (circle): Bucket Other: Sample-splitting method (circle): Not split Sieve diameter
Sample bottle (complete all)
Sample component
Preservative Split ratio Bottle sequence Field SMCOD
Large-rare 10% buffered formalin 1/1
Main-body 10% buffered formalin
Subbottle comments:
Page # Cumulative Page # .Invertebrate SQTH Sample
SUPPORTING INFORMATIONSubstrate type codes: (1) smooth bedrock/concrete/hardpan; (2) silt, clay, marl, muck, organic detritus; (3) sand; (4) fine/medium gravel; (5) coarse gravel; (6) Very coarse gravel; (7) small cobble; (8) large cobble; (9) small boulder; (10) large boulder/ irregular bedrock/irregular hardpan/irregular artificial surface
Velocity meter used (circle one): Pygmy AA Marsh McBirney Other:
Sample location number
Water depth (m)
Substrateembeddedness
(percent)
Velocity(ft/s)
Substrate type
Dominant Co-dominant
1
2
3
4
5
INSTREAM HABITAT TYPES SAMPLED
Indicate the habitat types sampled by entering the sampler code used. Enter NA if the habitat type is not present or NC if the habitat type was present but not sampled. Blackened cells indicated habitat type not possible. Sampler codes: (2) Slack sampler; (13) Standard Ekman; (17) Petite Ponar; Other (specify):
RiffleNatural
bedManufactured
bedSlough
Macrophytebed
Woodysnag
Bar
Main channel
Channel margin
Island margin
RunNatural
bedManufactured
bedSlough
Macrophytebed
Woodysnag
Bar
Main channel
Channel margin
Island margin
PoolNatural
bedManufactured
bedSlough
Macrophytebed
Woodysnag
Bar
Main channel
Channel margin
Island margin

Field Protocols 51
Page # Cumulative Page # .Date field data reviewed: / / by (initials)
Date entered into Bio-TDB: / / by (initials)Bio-TDB Sample ID
Semi-Quantitative Woody Snag Invertebrate SampleField Data Sheet
SAMPLE HEADER
Station: Date (MM/DD/YYYY):/ /
Waterbody:
Station description:
Station ID: Reach: Start time: h
Collector (leader): End time: h
Sample and photographic notes:
RELATED SAMPLING ACTIVITIES (circle all that apply)
Water chemistry Discharge Habitat survey Tissues
Algae survey Fish survey Bed sediment Other (specify):
PHYSICAL SITE CONDITIONS
Clouds: % Wind (circle): Calm Light Moderate Gusty
Precipitation (circle): None Rain Sleet Snow Precipitation Intensity (circle): N/A Light Moderate Heavy
Other weather:
Beginning water measurements Ending water measurements
Time: Time:
Water temperature(°C):
Water temperature(°C):
pH: pH:
Dissolved oxygen(mg/L):
Dissolved oxygen(mg/L):
Specific conductance[(µS/cm) @ 25 °C]:
Specific conductance[(µS/cm) @ 25 °C]:
Turbidity(NTUs)
Turbidity(NTUs)
Discharge (ft3/s): Stream stage: ft @ time h
Riparian shading (circle): Shaded Partial Full sun
Water clarity (circle): Clear Slightly turbid Turbid Very turbid
Water color (circle): Black Brown Clear Dark green Light green Yellow
Physical site condition comments:

52 Revised Protocols for Sampling Algal, Invertebrate, and Fish Communities as Part of the National Water-Quality Assessment Program
SAMPLING INFORMATION
Primary sample or Repeated sampling replicate? (circle one) Sample Number: Mesh size: 500 µm
Number of discrete collections constituting composite: Total area of sample: cm2
Elutriation method (circle): Bucket Other: Sample-splitting method (circle): Not split Sieve diameter
Sample bottle (complete all)
Sample component
Preservative Split ratio Bottle sequence Field SMCOD
Large-rare 10% buffered formalin 1/1
Main-body 10% buffered formalin
Subbottle comments:
Page # Cumulative Page # .Invertebrate SQWS Sample
SUPPORTING INFORMATIONSubstrate type codes: (1) smooth bedrock/concrete/hardpan; (2) silt, clay, marl, muck, organic detritus; (3) sand; (4) fine/medium gravel; (5) coarse gravel; (6) Very coarse gravel; (7) small cobble; (8) large cobble; (9) small boulder; (10) large boulder/ irregular bedrock/irregular hardpan/irregular artificial surface
Velocity meter used (circle one): Pygmy AA Marsh McBirney Other:
Sample location number
Woodysnag
number
Snaglength(cm)
Snagdiameter
(cm)
Velocity(ft/s)
SubstrateType
Water depth (m) from surface to:
Woody snag Bottom
1
2
3
4
5
6
7
8
9
10
INSTREAM HABITAT TYPES SAMPLED
Indicate the habitat types sampled by entering the sampler code used. Enter NA if the habitat type is not present or NC if the habitat type was present but not sampled. Blackened cells indicate habitat type not possible. Sampler codes: (27) Snag collection with Slack sampler; Other (specify):
RiffleNatural
bedManufactured
bedSlough
Macrophytebed
Woodysnag
Bar
Main channel
Channel margin
Island margin
RunNatural
bedManufactured
bedSlough
Macrophytebed
Woodysnag
Bar
Main channel
Channel margin
Island margin
PoolNatural
bedManufactured
bedSlough
Macrophytebed
Woodysnag
Bar
Main channel
Channel margin
Island margin
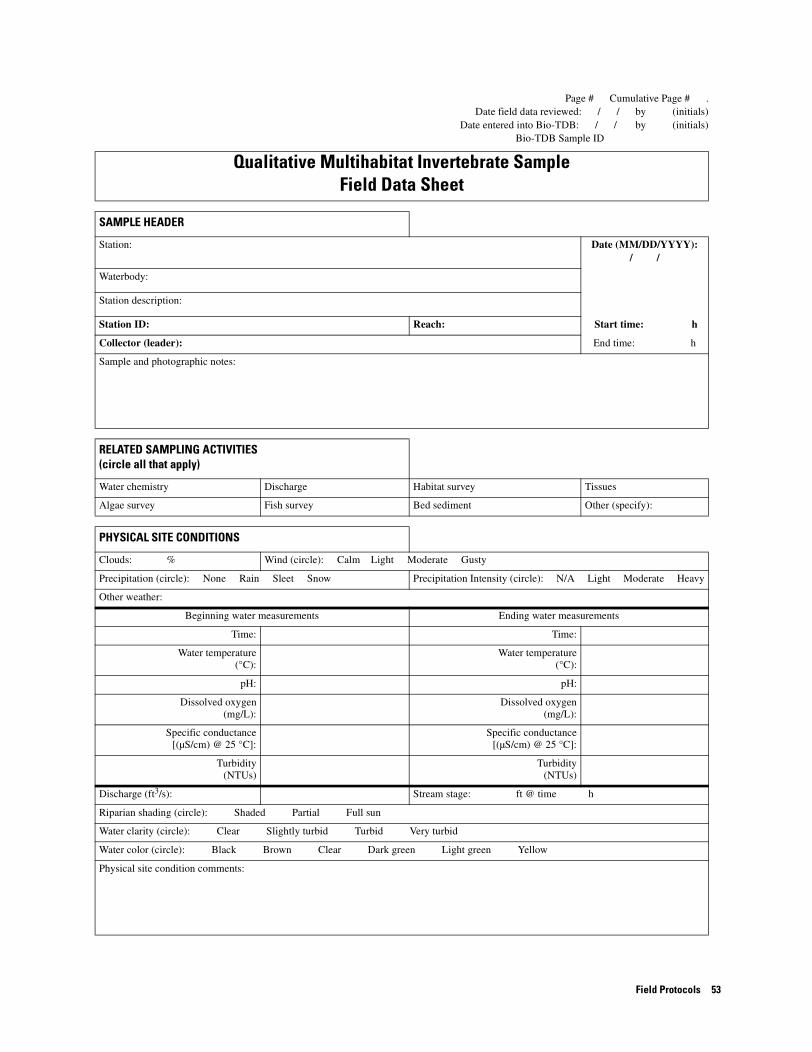
Field Protocols 53
Page # Cumulative Page # .Date field data reviewed: / / by (initials)
Date entered into Bio-TDB: / / by (initials)Bio-TDB Sample ID
Qualitative Multihabitat Invertebrate SampleField Data Sheet
SAMPLE HEADER
Station: Date (MM/DD/YYYY):/ /
Waterbody:
Station description:
Station ID: Reach: Start time: h
Collector (leader): End time: h
Sample and photographic notes:
RELATED SAMPLING ACTIVITIES (circle all that apply)
Water chemistry Discharge Habitat survey Tissues
Algae survey Fish survey Bed sediment Other (specify):
PHYSICAL SITE CONDITIONS
Clouds: % Wind (circle): Calm Light Moderate Gusty
Precipitation (circle): None Rain Sleet Snow Precipitation Intensity (circle): N/A Light Moderate Heavy
Other weather:
Beginning water measurements Ending water measurements
Time: Time:
Water temperature(°C):
Water temperature(°C):
pH: pH:
Dissolved oxygen(mg/L):
Dissolved oxygen(mg/L):
Specific conductance[(µS/cm) @ 25 °C]:
Specific conductance[(µS/cm) @ 25 °C]:
Turbidity(NTUs)
Turbidity(NTUs)
Discharge (ft3/s): Stream stage: ft @ time h
Riparian shading (circle): Shaded Partial Full sun
Water clarity (circle): Clear Slightly turbid Turbid Very turbid
Water color (circle): Black Brown Clear Dark green Light green Yellow
Physical site condition comments:
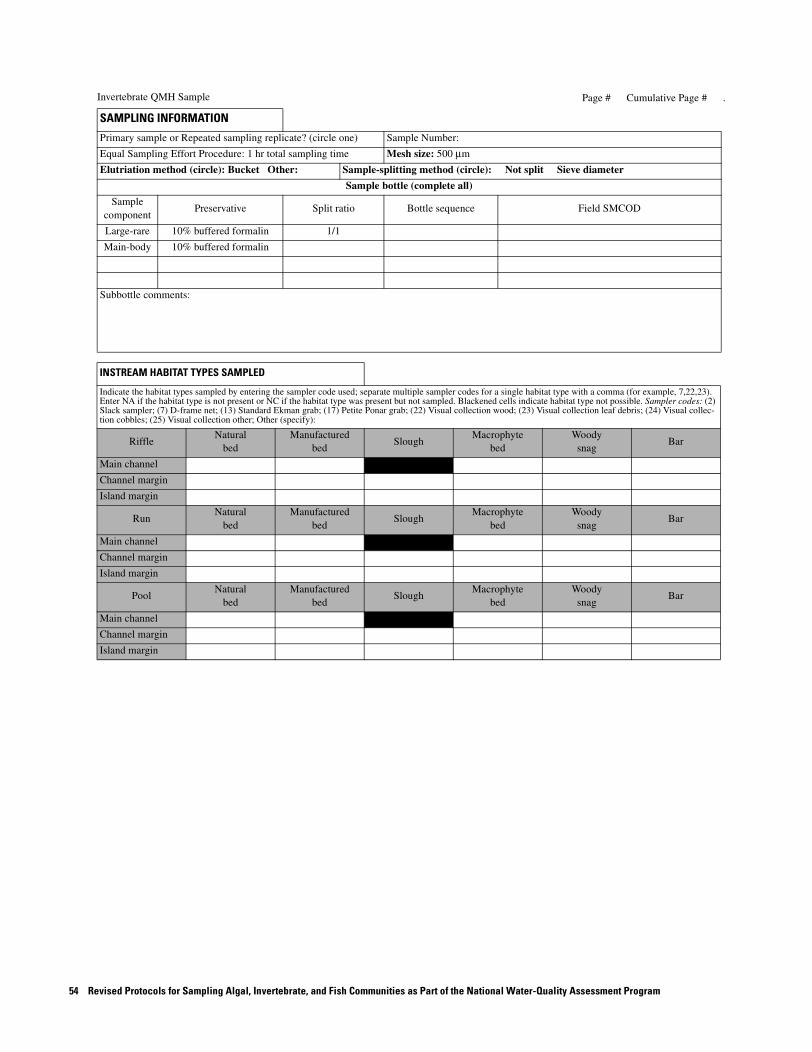
54 Revised Protocols for Sampling Algal, Invertebrate, and Fish Communities as Part of the National Water-Quality Assessment Program
SAMPLING INFORMATION
Primary sample or Repeated sampling replicate? (circle one) Sample Number:
Equal Sampling Effort Procedure: 1 hr total sampling time Mesh size: 500 µm
Elutriation method (circle): Bucket Other: Sample-splitting method (circle): Not split Sieve diameter
Sample bottle (complete all)
Sample component
Preservative Split ratio Bottle sequence Field SMCOD
Large-rare 10% buffered formalin 1/1
Main-body 10% buffered formalin
Subbottle comments:
Page # Cumulative Page # .Invertebrate QMH Sample
INSTREAM HABITAT TYPES SAMPLED
Indicate the habitat types sampled by entering the sampler code used; separate multiple sampler codes for a single habitat type with a comma (for example, 7,22,23). Enter NA if the habitat type is not present or NC if the habitat type was present but not sampled. Blackened cells indicate habitat type not possible. Sampler codes: (2) Slack sampler; (7) D-frame net; (13) Standard Ekman grab; (17) Petite Ponar grab; (22) Visual collection wood; (23) Visual collection leaf debris; (24) Visual collec-tion cobbles; (25) Visual collection other; Other (specify):
RiffleNatural
bedManufactured
bedSlough
Macrophytebed
Woodysnag
Bar
Main channel
Channel margin
Island margin
RunNatural
bedManufactured
bedSlough
Macrophytebed
Woodysnag
Bar
Main channel
Channel margin
Island margin
PoolNatural
bedManufactured
bedSlough
Macrophytebed
Woodysnag
Bar
Main channel
Channel margin
Island margin

6. FISH SAMPLING PROTOCOLS
The fish sampling protocols described in this report present methods for collecting a representative sample of the fish community from the stream. Such a sample contains most, if not all, species in the stream at the time of sampling in numbers proportional to their actual abundance. The reach is the representative por-tion of the stream that is sampled. Each reach contains various instream habitats consisting of different geo-morphic channel units, substrates, and hydrologic con-ditions. Fish species are distributed in the stream reach according to these instream habitats. No single fish col-lection gear or method is adequate to sample the diver-sity of habitats found in the reach. Therefore, two complementary methods are used for collecting fish: electrofishing and seining. Electrofishing is conducted in two separate passes of the reach; the fish collected from the first pass are processed before the second pass is conducted. Seining is performed after electrofishing. Three seine collections (hauls or kicks) are taken and combined before processing fish. The fish sampling protocols present techniques for applying these sam-pling methods and procedures for processing fish spe-cimens in the field to determine total length, weight, and external anomalies. These revised fish sampling protocols are based on the original guidance presented by Meador and others (1993) and the QA protocols by Walsh and Meador (1998).
6.1 Overview of sampling methods
6.1.1 Electrofishing
Electrofishing is the use of electricity to capture fish. A high-voltage potential is applied between two or more electrodes that are placed in the water. The volt-age potential is created with either direct current or alternating current; only direct current is used in the NAWQA Program. Direct current produces a unidirec-tional, constant electrical current. Pulsed direct current, a modified direct current, produces a unidirectional electrical current composed of a sequence of cyclic impulses (Meador and others, 1993).
The frequency of the pulses produced when using pulsed direct current can be adjusted by the oper-ator and usually ranges from 15 to 120 pulses per sec-ond (pps). High pulse frequencies (> 30 pps) have proven to be more effective in collecting fish but appear to cause spinal injuries, particularly in trout and salmon
species (Coffelt Manufacturing, Incorporated, cited in Meador and others, 1993). The injury rate depends on size; larger fish are more susceptible to injury than smaller fish (McMichael and others, 1998). Pulse rates < 30 pps have caused low incidence of injury, but are generally ineffective in collecting fish. Therefore, a pulse-rate range from 30 to 60 pps is recommended to provide maximum collection effectiveness with a mini-mum potential for damage to fish.
Water conductivity also affects the response of the fish to the electrical field and is the single most important limiting factor in electrofishing effectiveness (see Fish Tip 1). Low-conductivity water is highly resistant to the flow of electrical current, thereby reduc-ing the amount of electrical current traveling through the water and passing through the body of the fish. Under such conditions the electrical field is limited to the immediate area of the electrode. High-conductivity water produces the opposite effect by concentrating a narrow electrical field between the electrodes (Meador and others, 1993). The conductivity of the water must be measured prior to electrofishing to determine the appropriate output voltage for effective sampling. Although electrofishing is viewed as the single most effective method for sampling stream fish communities (Bagenal, 1978; Plafkin and others, 1989), it is biased toward collection of large-sized fish (Wiley and Tsai, 1983). Therefore, electrofishing alone should not be used to determine fish community structure (Reynolds, 1983).
Water clarity also affects electrofishing success and determines which techniques will be used. In clear streams, fish can see the electrofishing crew or boat.
Fish Tip 1—Settings for electrofishing gearAs a general rule, the output from the electro-
fishing gear should be about 3,000 watts. Voltage times amperage equals wattage. In low-conductivity water, high voltage and low amperage are needed to stun fish, while in high-conductivity water, low volt-age and high amperage are needed to achieve the same result. In high-conductivity water, output volt-age must be reduced to minimize potential damage to the fish. For electrofishing gear with both voltage adjustments and ammeters, achieving the proper output is straightforward. For electrofishing gear without ammeters, some pre-sampling experimenta-tion is necessary.
Field Protocols 55

Evasion will be the response to both the electrical field and the presence of the crewmembers. In turbid streams, stunned fish may be difficult to see. Also, streams with clay or silt substrates will require addi-tional amperage because the suspended particles create a situation similar to increased conductivity.
6.1.2 Seining
Seining is a common method for sampling stream fish communities (Bagenal, 1978; Nielsen and Johnson, 1983), and it is used to complement electro-fishing collections. Unlike electrofishing, seining is a highly effective method for sampling small-sized indi-viduals < 10-cm total length (Bayley and Herendeen, 2000). Seining is always conducted following electro-fishing, except for instances when seines are used as barriers to fish escaping an electrical current.
Seines are sampling devices that trap fish by enclosing or encircling them. Seines are manufactured in a variety of dimensions and mesh sizes. The NAWQA Program uses 6.4 mm as a standard mesh size for seines. Three sizes of seines are commonly used to sample fish communities: 3 x 1.2 m; 7.6 or 9.1 x 1.2 m; and about 30.5 to 61 x 1.8 m. The 3 x 1.2-m seine is referred to as a "common sense" seine (Hendricks and others, 1980; Bryan, 1984), a "minnow" seine, or a "standard ichthyological collection" seine, and is attached to two brails. The 7.6- or 9.1-m seine typically has a bag or pocket in the center of the seine (the bunt) and, thus, is referred to as a bag seine. As the bag seine is pulled through the water, fish are herded toward the center of the net and into the bag. A beach seine is typ-ically used along the shorelines of large bodies of water and is usually > 30 m long. Because of the greater length, larger dimension brails (usually 51 mm x 51 mm) are required for the beach seine to maximize sampling effectiveness and maintain durability.
Water clarity can have a profound effect on sein-ing success. In clear water, fish can see the seine and will actively avoid it either by swimming around the net or by swimming out of the bag and under any gaps between the lead line and stream bottom. The seine should be hauled immediately if the crewmembers see fish escaping the net. Additional crewmembers are used to herd fish back into the seine when the water is clear.
6.2 Sampling methods for wadeable streams
6.2.1 Electrofishing techniques for wadeable streams
Backpack and towed electrofishing gears are used for sampling fish in wadeable streams. Backpack electrofishing (with a single anode) is usually most effective in shallow (< 1 m), narrow (< 5 m wide) streams. Towed electrofishing gear (multiple anodes) is usually more effective in wide (> 5 m) wadeable streams with pools deeper than 1 m. Channel width, depth, and access should be considered before choos-ing between backpack and towed electrofishing meth-ods.
Electrofishing techniques for wadeable streams require an electrofishing crew consisting of three to six individuals. When using backpack electrofishing gear, one crewmember is designated as the operator; with towed gear, three crewmembers are designated as oper-ators. Regardless of the gear used, two crewmembers (or netters) are assigned to collect stunned fish with dip nets. One additional crewmember is sometimes needed to transfer netted fish into a flow-through holding bot-tle (or live cage). All crewmembers must wear polar-ized glasses to enhance their ability to see fish that have been stunned by the electrical field. Techniques for collecting samples using either backpack or towed electrofishing gear are generally similar in riffle-pool streams and meandering streams. Regardless of the electrofishing gear used, two separate electrofishing passes are made in the reach. The fish collected in the first pass are processed before the second electrofish-ing pass begins; fish community data for each pass are kept separate.
6.2.1.1 Sampling direction
Sampling begins at the downstream boundary of the sampling reach and proceeds upstream. Sampling in an upstream direction in wadeable streams is pre-ferred over sampling in a downstream direction (Hen-dricks and others, 1980). Disturbance caused by electrofishing crews walking in the stream increases turbidity, thereby greatly reducing visibility and collec-tion success. Also, sampling in an upstream direction allows stunned fish to drift downstream, thus facilita-ting their capture by the netters. The distance of the netters from the anode increases with current velocity and turbidity.
56 Revised Protocols for Sampling Algal, Invertebrate, and Fish Communities as Part of the National Water-Quality Assessment Program

6.2.1.2 Sampling all instream habitat features
All geomorphic channel units and instream habi-tat features, such as woody snags, undercut banks, macrophyte beds, or large boulders within the wade-able sampling reach, are sampled using pulsed direct current. This technique might require electrofishing from one shoreline to the other in a "zigzag" pattern, while consistently sampling all areas within the reach.
6.2.1.3 Electrofishing riffle-pool streams
Continuous application of electrical current — herding fish by the operator:
A common electrofishing technique is to apply a continuous electrical current to the water. Fish gener-ally respond to continuously applied electrical current by attempting to avoid exposure to the electrical field. Thus, continuous application of electricity can result in fish moving just ahead and away from the operator. The operator should be aware of this response and take advantage of natural barriers to herd fish into (for example, banks, bars, or shallow riffles) and facilitate their capture by the netters. However, upon reaching a barrier, fish will turn and attempt to evade the approaching electrical current. Therefore, netters should be alert when approaching barriers so as to avoid missing fleeing fish.
Intermittent application of electrical current — herding fish to the operator:
In runs or long pools, fish often evade the weak edge of the electrical field by fleeing upstream. One technique that is used to counter this response is to use an intermittent application of current and then herd fish back toward the operator. A crewmember (or two) moves upstream of the fish by getting out of the stream and walking up the bank. Once ahead of the fish, the crewmember returns to the stream and creates a distur-bance in the water that drives the fish downstream toward the operator. The electricity is turned off as the crewmember herds the fish back downstream. When the fish are visible and close to the anode, the electri-city is turned on to stun them.
Sampling shallow riffles:In sampling shallow riffles, the operator sweeps
the anode across the riffle from upstream to down-stream while walking across the riffle. Crewmembers, positioned downstream of the operator, hold dip nets or preferably a small seine on the bottom which allows the
streamflow to carry stunned fish into their nets. This technique minimizes escape and avoidance of the elec-trical field by benthic fish species (for example, darters and sculpins), which commonly inhabit riffles. These species may not be seen until the net is examined. Sculpins and darters do not have swim bladders. There-fore, unlike other species that do have swim bladders, species in these groups do not float when stunned, but rather roll along the bottom with the water current.
Sampling rocky riffles, cascades, and torrents:In sampling rocky, swift riffles, a crewmember
holds a dip net about 1 m below the anode. The opera-tor works the anode downstream through the swift cur-rent between rocks and through small plunge pools while the net is maintained on the bottom at a constant distance from the anode.
6.2.1.4 Electrofishing meandering streams
Electrofishing in meandering streams can be challenging because there are few natural barriers (for example, a shallow riffle) to hold herded fish. There-fore, the intermittent use of electrical current is more appropriate than continuous current. Intermittent elec-trical current acts as a herding stimulus to corral fish into holding areas along the banks. Block nets may be used to isolate the stream reach during electrofishing. However, there are several factors to consider before using block nets. Proper deployment of block nets is a time-consuming activity. The lead line must be anchored securely to the stream bottom to prevent fish from escaping under the net. The top of the net is usu-ally secured to trees or other structures on the stream bank so that it is taut and above the stream surface to prevent fish from jumping over the net. The potential for entanglement in the net mesh also could result in the mortality of small fish. If block nets are used, they must be used in the same manner during repeated sam-pling of the reach (see also Fish Tip 2).
Field Protocols 57

Sampling Instream Habitat:A different electrofishing technique is required
in areas of a meandering stream that have complex instream habitat (for example, submerged trees). Fish congregating near these habitat features either will dis-perse or will be difficult to remove after being stunned by continuous application of electricity. An effective technique for capturing fish associated with complex instream habitat is for the operator to approach the hab-itat feature with the electrical current off. Next, in quick succession, the anode is thrust close to the habitat feature, the electrical current turned on, and then the anode is withdrawn in a sweeping motion away from the habitat feature. This technique produces a physio-logical response by fish called galvanotaxis, where the electrical current forces fish to swim towards the anode (Meador and others, 1993).
6.2.2 Seining techniques for wadeable streams
Electrofishing in wadeable streams is comple-mented by various seining techniques using common sense and bag seines. Use of a particular seine depends on the geomorphic channel units, channel features, and instream habitats present in the sampling reach. Areas having submerged objects (for example, woody snags or cobbles) make seining difficult. Therefore, the potential for collecting a representative sample should be evaluated before seining these areas. Regardless of the seining techniques used, three seine collections are taken and combined before processing fish.
6.2.2.1 Seining riffles
Riffle dwelling species (for example, darters and sculpins) are sampled by using a kick seining technique (Hendricks and others, 1980; Matthews, 1986; Bramb-
lett and Fausch, 1991). Kick seining is an effective technique for collecting these species because it involves disturbing the substrate and letting the water current carry fish into a common sense seine. Two crewmembers enter the stream below a riffle and hold the seine in a vertical position above the water and per-pendicular to the flow at the downstream edge of a rif-fle. The crewmembers then thrust the brails and lead line of the seine to the stream bottom. The brails are slightly angled downstream so that the flow forms a slight pocket in the seine. Upstream of the seine, a third crewmember vigorously disturbs (or kicks) the sub-strate while moving toward the seine (see also Fish Tip 3). After reaching the seine, crewmembers lift the seine out of the water and sort fish from the collected debris. Three kick seine collections are made across the riffle. The fish from these collections are combined to form the sample.
6.2.2.2 Seining meandering streams
Meandering streams are sampled by using either a common sense or bag seine, depending on the chan-nel width and the type of electrofishing gear used. Gen-erally, if the reach is sampled with backpack electrofishing gear, then a common sense seine is used. If the reach is sampled with towed electrofishing gear, then a bag seine is used. Seining downstream has been demonstrated to be the most effective technique (Hen-dricks and others, 1980).
Seining speed should be slightly faster than the stream current. Faster seining speeds are avoided because water will be pushed in front of the seine, thereby forcing fish away from the seine. Maintaining the lead line in contact with the bottom and a substan-tial bow in the seine (accomplished by angling the brails back to keep the net bottom well forward of the net top) will minimize the potential for escaping fish until the net is beached or lifted. When the seine haul is finished, the seine is beached by dragging it onto the shore. When there is only a small shoreline area to beach the seine, the brails are brought close together at
Fish Tip 2—Crewmembers as barriers to fish movement
Use crewmembers as stationary or mobile bar-riers. Crewmembers are positioned across the reach upstream of the electrofishing operator. As the oper-ator approaches, the crewmembers create a splashing disturbance in the water that prevents fish from swimming past the barrier. Alternatively, crewmem-bers can become a mobile barrier by herding fish downstream to the operator. Use of a small seine as an additional barrier improves the efficiency of this technique.
Fish Tip 3—Kick seining and electrofishingIf kick seining alone is not effective, try using
backpack electrofishing gear to improve the capture of benthic species. Work the anode back and forth while a crewmember disturbs the substrate. Turn the power off when the anode reaches the seine.
58 Revised Protocols for Sampling Algal, Invertebrate, and Fish Communities as Part of the National Water-Quality Assessment Program

the shoreline and the lead line slowly pulled into shore by hand.
If the seine cannot be beached, the bottoms of the brails are brought as close to shore as possible. Then in one simultaneous motion, the seine is quickly stretched between the brails, lifted out of the water, and carried onto shore. Three seine hauls, each covering an area of about 30 m, are taken throughout (upper, middle, and lower sections) the reach. The fish from these hauls are combined to form the sample.
6.3 Sampling methods for nonwadeable streams
6.3.1 Electrofishing nonwadeable streams
Nonwadeable streams are sampled using electro-fishing boats. An electrofishing boat crew consists of a driver and one or two persons who collect the fish with dip nets. The driver should be skilled at maneuvering the boat as effectively as possible to allow crewmem-bers the best opportunity to capture stunned fish. As with wadeable electrofishing methods, all crewmem-bers should wear polarized sunglasses. Two separate electrofishing passes, one along each bank, are made in the reach. The fish collected in the first pass are pro-cessed before the second electrofishing pass begins; fish community data for each pass are kept separate.
6.3.1.1 Sampling direction and boat speed
Sampling begins at the upstream boundary of the sampling reach and proceeds downstream by maneu-vering the boat along one shoreline. The electrofishing boat is operated at a speed equal to or slightly greater than the current velocity. The shoreline sampled during the first pass can be decided by flipping a coin. Sam-pling is conducted downstream because fish are usually oriented upstream (into the current) and will either swim into the approaching electrical field or turn to escape downstream. In turning to escape downstream, fish orient themselves perpendicular to the electrical field, thereby exposing a greater surface area of the fish to the electrical field that renders them more suscepti-ble to capture. Also, when fish are stunned they are car-ried downstream by the flow, providing greater opportunity for capture. Sampling in a downstream direction is more efficient than sampling in an upstream direction (Ohio Environmental Protection Agency, 1987) in nonwadeable streams (see Fish Tip 4).
6.3.1.2 Electrofishing Techniques for Nonwadeable Streams
A continuous application of current while drift-ing downstream generally is used for most large, non-wadeable streams. In areas with clear or shallow water, intermittent application of current may be more effec-tive than continuous application. Fish are approached with the current off. When the anodes are in position near the fish, the current is applied.
6.3.1.3 Boat electrofishing techniques for sampling fish from instream habitat
Instream habitat features along the shoreline are sampled by maneuvering the boat close to the habitat feature with the electrical current off. As the anode is placed near the habitat feature, the electrical field is generated and the boat is backed away from the habitat feature (see Fish Tip 5). The fish thus are "pulled" away from the habitat feature to facilitate their capture. Captured fish are placed in a live well on the boat and processed after completion of the first electrofishing pass.
6.3.2 Seining nonwadeable streams
Nonwadeable streams can be sampled by using a beach seine in wadeable shoreline areas, if present. Like the bag seine, the exact length of the beach seine should be determined after consultation with local fish ecologists. Three seine hauls should be taken from accessible parts of the upper, middle, and lower sec-
Fish Tip 4—Boat positionPosition the boat so the bow is angled down-
stream and toward the bank. This allows the boat operator to reverse direction (generally upstream and away from the banks) and not pass over stunned fish. Periodically, the boat should be slowed to less than current speed so that fish drifting with the current may be more easily observed.
Fish Tip 5—Current application timeWhen boat electrofishing, the duration for
applying electrical current should be increased at submerged structures. Fish located in deeper water (2–3 m) may require 5–10 seconds of current before a response is observed. This duration increases as water temperature decreases.
Field Protocols 59

tions of the nonwadeable sampling reach. The fish from these hauls are combined to form the sample.
6.3.2.1 Beach seining
Beach seining is conducted by keeping one end of the seine stationary on the shore while the remainder of the seine is deployed into the water so that it is roughly perpendicular to the shoreline. The seine is swung in a downstream direction while pivoting on the stationary beach end.
6.3.2.2 Shoreline seining
The shoreline is seined by pulling the seine downstream along the bank. Keep one end of the seine near the shoreline and the other end extended out from the bank and angled downstream. The angle will pre-vent fish associated with the shallow water near the bank from escaping the net by fleeing directly into deeper water. To obtain a good seine haul, the lead line must remain in contact with the river bottom through-out the haul. If the site is too deep to wade at the extremes of the net, another site should be used. If another site cannot be found, the seine should only be used where the water is shallow enough to ensure con-stant bottom contact. If seining is not possible or can-not be conducted safely, an alternative method can be used.
6.4 Alternative sampling methods
Although electrofishing and seining represent the standard methods for collecting a representative fish community sample from a reach, there may be occa-sions when these methods cannot be used effectively. For example, electrofishing is ineffective when specific conductivity is < 20 µS/cm. Likewise, seining is ham-pered when a large number of woody snags and other types of irregular debris are present in the reach that would prevent maintaining the lead line on the stream bottom. When physical conditions in the reach prohibit the use of these standard methods, alternative sampling methods (for example, hoop netting, minnow traps) may be proposed. However, proposed alternative sam-pling methods must be discussed with the study team leader and regional biologist on an individual basis to ensure appropriate application and compliance with State regulations regarding their use. Alternative sam-pling methods are described in Bagenal (1978), Nielsen
and Johnson (1983), Bryan (1984), and Meador and others (1993).
6.5 Sample processing procedures
The goal of processing collections of fish in the field is to collect information on taxonomic identifica-tion, length, weight, abundance, and the presence of external anomalies (fig. 11) with minimal harm to specimens that will be released alive back into the stream. The major steps in processing collections of fish from each electrofishing pass and group of seine hauls or kicks include the following:
1. Sort fish into identifiable and unidentifiable groups. Process threatened and endangered (T&E) fish species first before other identifiable species. Preserve unidentifiable species and return them to the field office for identification.
2. Hold and anesthetize fish in a manner consistent with minimizing stress or death.
3. Identify and enumerate each identifiable species.
4. Measure total length and weigh at least 30 speci-mens of each species (excluding T&E species).
5. Examine up to 30 specimens of each species (excluding T&E species) for external anomalies.
6. Record data on the Fish Field Data Sheet.
7. Preserve selected specimens for identification in the laboratory or vouchering; release all other specimens alive back into the stream.
6.5.1 Handling and anesthetizing fish
All captured fish, excluding T&E species, are placed in a live cage or boat live well for subsequent processing and an effort is made to minimize stress or death to specimens. T&E species are identified, enu-merated, and released immediately to the stream. Regardless of the effort made to minimize handling and stress to fish, some mortality will occur (see Fish Tip 6). However, minimizing mortality involves recogniz-ing which species are sensitive to handling and pro-longed confinement and processing them first. Therefore, crewmembers should be thoroughly familiar with the fish species in their study area. Anesthetizing further minimizes stress to the fish and facilitates han-dling during processing. Carbon dioxide (CO2) (Sum-merfelt and Smith, 1990) and clove oil (Peake, 1998)
60 Revised Protocols for Sampling Algal, Invertebrate, and Fish Communities as Part of the National Water-Quality Assessment Program

Field Protocols 61
Can species beidentified in the
field?
YES NO
Preservespecimens
Identify andenumerate all
specimens
At least 30 individuals,each species
Measure total lengthWeighExamine for externalanomalies
Record data onFish Field Data
Sheet
Deposit in vouchercollection
Preservespecimens
VoucherSpecimens?
Record data onFish Field Data
Sheet
At least 30 individuals,each species
Measure total lengthWeighExamine for externalanomalies
Anesthetize,identify, and
enumerate allspecies
Is speciesthreatened orendangered?
Identify andenumerate all
specimens
Record data onFish Field Data
Sheet
Return all specimensto stream
Allow fish torecover from
anesthetic
YES NO
YESNO
Figure 11. Steps followed in the field to process fish collections in the National Water-Quality Assessment Program.

have been effectively used to anesthetize fish and there are no restrictions on their use. After examination, fish are placed in a container of ambient stream water and allowed to recover from the anesthetic before being released back into the stream. Fish should be released downstream of the sampling reach to minimize the potential for re-sampling and sample bias.
Anesthetizing fish with CO2:1. Place fish in a 19-L (5-gal) bucket containing
about 12 L of stream water. [Note: only a few fish should be anesthetized at a time to minimize potential mortality resulting from prolonged sedation.]
2. Add 350 mL of carbonated water or two CO2- producing tablets to the bucket. Determining CO2 dosage in the field can be difficult because by the time the fish have responded to the sedation, the concentration of CO2 may be too high. If the con-centration is too high (onset of sedation is rapid), the fish should be moved to native water or pro-cessed immediately.
3. Leave fish in the bucket until the desired level of sedation is achieved (about 2 to 5 minutes).
Clove oil at a concentration of 60 mg/L produced stage four anesthesia (total loss of swimming motion and weak opercular movement) after about 4 to 5 min-utes for walleye; fish recovered within 10 to 12 minutes after they were placed in ambient water (Peake, 1998).
Preparing a 30-L solution of 60 mg/L clove oil anesthetic:
1. Add 1.8 mL clove oil to 16.2 mL ethanol [Note: this solution can be prepared ahead of time and stored in a nonbreakable bottle.]
2. Add the clove oil/ethanol solution to 30 L of stream water.
6.5.2 Taxonomic identification and enumeration
Fish are taxonomically identified in the field and in the laboratory. Identifications are made by a crew-member who is familiar with the fish species com-monly found in the study area. Taxonomic nomenclature follows that established by the American Fisheries Society's Committee on Names of Fishes (Robins and others, 1991). An attempt is made in the field to identify all fish to the species level. Uncertain identifications require that those specimens be vouchered for later identification in the laboratory. Consult Walsh and Meador (1998) for additional gui-dance regarding taxonomic identification.
6.5.3 Length measurements
Length measurements (fig. 12) are determined by using a measuring board consisting of a linear metric scale on a flat wooden or plastic base with a stop at the zero point. Total length must be measured; stan-dard length is optional. Total length measurements are recorded individually for up to 30 individuals of each species collected from the reach. These 30 individuals are selected from the total number of individuals to rep-resent the range of lengths present in the sample for a particular species.
Determining total length:1. Place fish with the body positioned on its right
side, the head facing the observer's left, and the mouth closed (as in fig. 12).
2. Push the snout of the fish against the measuring board stop.
3. Measure total length as the distance from the closed mouth to the extreme tip of the caudal fin, when the lobes of the caudal fin are squeezed together.
4. Record total length to the nearest millimeter on the Fish Field Data Sheet.
Standard length measurements are optional and should only be taken to address specific study objec-tives. For example, standard length is important in tax-onomic studies because it is unaffected by caudal fin anomalies. Standard length is the length from the tip of the closed mouth to the posterior end of the fleshy cau-dal peduncle (fig. 12).
Fish Tip 6—Portable aerated containersUse multiple, portable aerated containers for
holding and separating each species. Each container has a single species or several easily identifiable spe-cies. A single aerator pump can be modified to feed multiple containers through individual lines and air stones.
62 Revised Protocols for Sampling Algal, Invertebrate, and Fish Communities as Part of the National Water-Quality Assessment Program
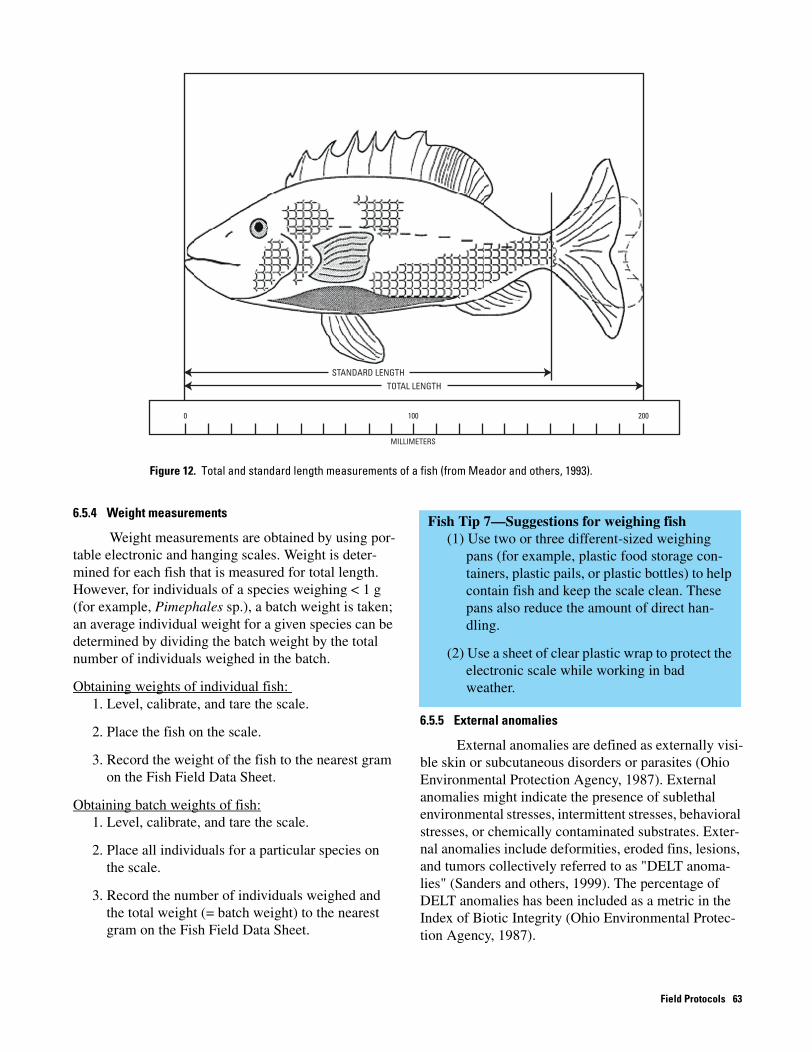
TOTAL LENGTHSTANDARD LENGTH
0 200100
MILLIMETERS
Figure 12. Total and standard length measurements of a fish (from Meador and others, 1993).
6.5.4 Weight measurements
Weight measurements are obtained by using por-table electronic and hanging scales. Weight is deter-mined for each fish that is measured for total length. However, for individuals of a species weighing < 1 g (for example, Pimephales sp.), a batch weight is taken; an average individual weight for a given species can be determined by dividing the batch weight by the total number of individuals weighed in the batch.
Obtaining weights of individual fish: 1. Level, calibrate, and tare the scale.
2. Place the fish on the scale.
3. Record the weight of the fish to the nearest gram on the Fish Field Data Sheet.
Obtaining batch weights of fish:1. Level, calibrate, and tare the scale.
2. Place all individuals for a particular species on the scale.
3. Record the number of individuals weighed and the total weight (= batch weight) to the nearest gram on the Fish Field Data Sheet.
6.5.5 External anomalies
External anomalies are defined as externally visi-ble skin or subcutaneous disorders or parasites (Ohio Environmental Protection Agency, 1987). External anomalies might indicate the presence of sublethal environmental stresses, intermittent stresses, behavioral stresses, or chemically contaminated substrates. Exter-nal anomalies include deformities, eroded fins, lesions, and tumors collectively referred to as "DELT anoma-lies" (Sanders and others, 1999). The percentage of DELT anomalies has been included as a metric in the Index of Biotic Integrity (Ohio Environmental Protec-tion Agency, 1987).
Fish Tip 7—Suggestions for weighing fish(1) Use two or three different-sized weighing
pans (for example, plastic food storage con-tainers, plastic pails, or plastic bottles) to help contain fish and keep the scale clean. These pans also reduce the amount of direct han-dling.
(2) Use a sheet of clear plastic wrap to protect the electronic scale while working in bad weather.
Field Protocols 63

All fish that are individually measured and weighed also are examined for the presence of DELT anomalies (fig. 13). Noting and recording other exter-nal anomalies, such as anchor worm (Lernaea spp.), blackspot (Uvulifer ambloplitis and Crassiphiala bluboglossa), and popeye disease are optional. How-ever, because of a lack of consistent inverse relation to environmental quality across broad geographic areas, these optional external anomalies must not be included with the DELT anomaly metric. Accurate identification of all external anomalies requires adequate training; their presence is denoted with a two-letter code (table 7). Caution should be exercised not to include injuries that might have resulted from the collection methods (for example, electrofishing).
Deformities are skeletal anomalies that affect the head, spinal vertebrae, and fins. For example, scoliosis is a type of spinal curvature (fig. 13a). Eroded fins are reductions in fin surface area and hemorrhaging along fin rays, which can be caused by chronic disease, para-site infestation or poor water quality (fig. 13b). How-ever, eroded fins also can be caused by other factors, such as mechanical erosion during spawning. Hatchery-raised fish stocked in streams also may have eroded fins as a result of prolonged holding under crowded conditions in concrete-lined raceways. Lesions are defined as tissue alterations that include ulcerated, reddened tissue, open sores, or exposed tis-sue (fig. 13c).
However, obvious predator-caused injuries (for example, lamprey scars) should not be diagnosed as
lesions. Tumors are defined as circumscribed growths of tissue growing independently of the structural devel-opment of the fish and serving no physiological func-tion (fig. 13d).
Examining fish for DELT external anomalies:1. Examine up to 30 specimens of each species for
the presence of DELT external anomalies. To minimize the handling of fish that are to be released alive, examine for DELT anomalies while the fish are being enumerated or measured for length and weight.
2. Document any observed DELT anomalies on the Fish Field Data Sheet by recording a checkmark under the appropriate DELT code (see table 7) for each specimen examined.
3. If a specimen was examined and no DELT anom-alies were observed, place a checkmark under the "AA" (No anomalies) code for that specimen on the Fish Field Data Sheet.
4. Other optional anomalies (see table 7) can be documented depending on the objectives of the study.
64 Revised Protocols for Sampling Algal, Invertebrate, and Fish Communities as Part of the National Water-Quality Assessment Program
Table 7. Two-letter codes used to denote external anomalies in fish (Ohio Environmental Protection Agency, 1987)
[DELT, deformities, eroded fins, lesions, and tumors]
Code Description
DELT anomalies
AA No anomalies
DE Deformities
ER Eroded fins
LE Lesions
TU Tumors
Optional
AL Anchor worm
BL Black spot
CL Leeches
FU Fungus
IC Ich
NE Blind in one or both eyes, includes missing and grown-over eyes
PA Other external parasites not previously specified
PE Popeye disease

a. Example of deformities (DE) showing a normal spine (top) and curved spine (bottom). b. Example of severe eroded
fins (ER).
c. Example of body surface lesions (LE) (note reddened area in front of fins).
d. Example of raised tumors (TU) on the body surface.
Figure 13. Deformities, eroded fins, lesions, and tumors noted on fish. (Photographs a, c by M. Meador, b by Leetown Science Center, and d by M. Mac).
6.5.6 Preserving fish specimens and vouchering
Fish specimens are preserved in the field and returned to the laboratory for identification and depos-ited in a voucher collection. Some species, such as those in the minnow genus Notropis, are similar in appearance and cannot be positively identified in the field. Even taxonomic experts may have difficulty iden-tifying these similar species because confirmatory characteristics are either internal (for example, pharyn-geal teeth) or require exact counts of meristic charac-teristics (for example, the number of lateral line scales or anal fin rays). Therefore, specimens that are not pos-itively identified in the field are preserved, labeled, and returned to the laboratory for later identification. Some identifiable specimens also might be preserved and deposited in a voucher collection. Walsh and Meador (1998) provide guidance and criteria for the selection of specimens for vouchering. A confirmation report is requested for all fish that are deposited in a voucher collection. The confirmation report contains the same information as the sample label and lists the confirmed identification of each specimen in the voucher collec-
tion. After revising the field data sheet, the data are entered into Bio-TDB.
Preserving fish specimens:1. Euthanize specimens with an overdose of anes-
thetic (for example, CO2).
2. Place all specimens of a particular species or sim-ilar looking unknown species, in a sample bottle. Ensure that there is sufficient space in the jar for adding a necessary volume of 10-percent buff-ered formalin to preserve tissues.
3. For fish specimens longer than 100 mm total length, make a small incision along the right side of the body to allow buffered formalin to pene-trate the body cavity.
4. Place a completed sample label inside each bot-tle. If the species is unidentifiable or uncertain, make sure each label contains a unique voucher ID code (for example, unknown sp. 1, unknown sp. 2, Notropis sp. 1, Notropis sp. 2). [Note: doing this will facilitate revision of the field data
Field Protocols 65

sheet after positive identification has been made and recorded in the confirmation report.]
5. Add enough 10-percent buffered formalin to fill the sample bottle. Wear safety goggles and gloves to protect from splashing formalin. Tightly seal the bottle lid to ensure that the preservative does not leak.
6. Leave fish in the buffered formalin for 2 to 7 days to ensure proper preservation of tissues.
7. After fish specimens are returned to the labora-tory and properly preserved, they are prepared for long-term preservation and storage (see Walsh and Meador, 1998).
6.6 Field data sheet
A single, two-page field data sheet (see end of this section) is used to record site and sample informa-tion associated with fish community sampling. Infor-mation that is recorded on each field data sheet is organized into sections (table 8) that correspond to data entry screens in Bio-TDB. Except for these section labels (for example, "Sample Header"), data fields or subsections that are shown in bold face are required for entry into Bio-TDB. Consult the Bio-TDB User Man-ual (Ruhl and Scudder, accessed April 26, 2002) for additional information on entering field data into the data base.
Before leaving the sampling site, the team leader should review the field data sheets for completeness and accuracy. All missing or incorrect information should be completed or corrected. The supply of field data sheets (blank and completed) should be stored in separate resealable bags for protection from water.
Section This section is used to document
Sample header Where and when a sample was collected
Related sampling activities Other sampling activities
Physical site conditions Physical and chemical conditions at the time of sampling
Sampling information Sampling methods and effort, and fish speci-men data, such as identification, abundance, length, weight, and external anomalies
Table 8. Explanation of field data-sheet sections used to record information about fish sampling activities
66 Revised Protocols for Sampling Algal, Invertebrate, and Fish Communities as Part of the National Water-Quality Assessment Program

Field Protocols 67
Page # Cumulative Page # .Date field data reviewed: / / by (initials)
Date entered into Bio-TDB: / / by (initials)Bio-TDB Sample ID
Fish Community SampleField Data Sheet
SAMPLE HEADER
Station: Date (MM/DD/YYYY):/ /
Waterbody:
Station description:
Station ID: Reach: Start time: h
Collector (leader): End time: h
Sample and photographic notes:
RELATED SAMPLING ACTIVITIES (circle all that apply)
Water chemistry Discharge Habitat survey Tissues
Invertebrate survey Algae survey Bed sediment Other (specify):
PHYSICAL SITE CONDITIONS
Clouds: % Wind (circle): Calm Light Moderate Gusty
Precipitation (circle): None Rain Sleet Snow Precipitation Intensity (circle): N/A Light Moderate Heavy
Other weather:
Beginning water measurements Ending water measurements
Time: Time:
Water temperature(°C):
Water temperature(°C):
pH: pH:
Dissolved oxygen(mg/L):
Dissolved oxygen(mg/L):
Specific conductance[(µS/cm) @ 25 °C]:
Specific conductance[(µS/cm) @ 25 °C]:
Turbidity(NTUs)
Turbidity(NTUs)
Discharge (ft3/s): Stream stage: ft @ time h
Riparian shading (circle): Shaded Partial Full sun
Water clarity (circle): Clear Slightly turbid Turbid Very turbid
Water color (circle): Black Brown Clear Dark green Light green Yellow
Physical site condition comments:

68 Revised Protocols for Sampling Algal, Invertebrate, and Fish Communities as Part of the National Water-Quality Assessment Program
SAMPLING INFORMATION
Primary sample or Repeated sampling replicate? (circle one) Sample Number:
Field SMCOD: Method code:Method codes: Electrofishing—(11A) backpack 1st pass; (11B backpack 2nd pass; (12A) towed 1st pass; (12B) towed 2nd pass; (13A) boat 1st pass; (13B) boat 2nd pass; Seining—(21A) haul; (22A) kick; (23A) beach.
Model: Output voltage: Seconds:
Beginning time: Ending time: Reach length: Number of seine hauls:
Comments about fish:
Fish Specimen DataTL=total length; SL=standard length; AA=no anomalies; DE=deformities; ER=eroded fins; LE=lesions; TU=tumors
Name AbundanceID
Field or Lab?
TL(mm)
SL(mm)
Wt(g)
DELT Anomalies (check if present) Voucher?
(Y or N)AA DE ER LE TU
Page # Cumulative Page # .
7. POST-FIELD ACTIVITIES
After returning from the field, sampling teams undertake several activities prior to shipping samples to a laboratory for analysis. These activities include log-ging site and sample information into Bio-TDB, repla-cing field labels, preparing packing lists and Analytical Services Request (ASR) forms, and preparing samples for shipping.
7.1 Logging samples into the Biological Transactional Data Base
Sampling teams are required to enter site and sample information into Bio-TDB as soon as possible after returning from the field. This process will allow sampling teams to produce automated sample labels, packing lists, and ASR forms in preparation for ship-ping samples to analytical laboratories. Sampling teams are strongly encouraged to demonstrate care when entering site and sample information into Bio-TDB. Members of a sampling team should practice entering samples into the Bio-TDB demonstration data base so they can be familiar with the different data fields and requirements for each sample medium. When a sample is logged into the data base, a Bio-TDB sample identification number (different from the SMCOD sample number) is assigned to it and then recorded on the corresponding field data sheet sample header.
7.2 Replacing field sample labels
Labeling samples with complete and accurate collection data is an essential step to ensure proper sample accounting and laboratory analysis. Careful attention to labeling samples accurately also eliminates discrepancies that sometimes occur when several dif-ferent kinds of samples are collected in a study. In the field, each bottle or filter for a particular sample is given an external label (fig. 2) that uniquely identifies its contents. The information on field labels is some-times difficult to read (especially by laboratory ana-lysts) if it is handwritten, or even lost because improper writing ink was used. Therefore, sampling teams must replace all field labels with labels produced by the automated Bio-TDB label function. Bio-TDB sample labels can only be produced if site and sample informa-tion has first been entered into the data base. The auto-mated Bio-TDB labels are required because all of the information on the label is clearly printed and based on
information entered into the data base, thereby mini-mizing discrepancies. Consult the Bio-TDB User Man-ual (Ruhl and Scudder, accessed April 26, 2002) for instructions on preparing automated labels.
7.3 Preparing packing lists and Analytical Services Request Forms
Packing lists are an accounting of the samples contained in each package and provide a quick means of determining the accuracy and completeness of a shipment. ASR forms convey important information (for example, NWQL labcodes or schedules) about the sample and how it is to be processed by the analytical laboratory. Laboratories will not log samples into their internal tracking systems or begin to process samples unless complete ASR forms are received for each sam-ple. Consult the Bio-TDB User Manual for instructions on producing automated packing lists and ASR forms.
7.4 Shipping samples to analytical laboratories
Shipping algal and invertebrate samples to ana-lytical laboratories requires careful consideration and planning. Several safety and transportation regulations relating to how samples are packed, labeled, and shipped must be observed by law. Each crewmember who is responsible for shipping samples must be trained in shipping hazardous materials (for example, formalin). This person should obtain the most current U.S. Department of Transportation (DOT; see http://hazmat.dot.gov, accessed April 26, 2002) and transportation agent (for example, Airborne or Federal Express) requirements on packing and shipping sam-ples. Failure to comply with these requirements might result in the shipment being returned to the customer or fines and penalties levied by the DOT or transportation agent. Consult USGS NWQL Rapi Note Nos. 01-033 (2001b) and 01-034 (2001c) for additional information regarding safe shipping regulations.
Packing and shipping samples:1. If necessary, add sample preservative to com-
pletely fill each sample bottle to minimize void space. [Note: void space increases agitation of sample debris that might damage delicate organ-isms such as mayflies during shipping.]
2. Clean sample bottle threads to ensure that bottle lids fit securely. Sand or other debris that is
Field Protocols 69

trapped in the threads might cause sample leak-age.
3. Stretch a strip of high-quality, plastic tape (for example, 3M Scotch™ Brand 471) around the lid-bottle seal to prevent or minimize leakage. Tape is wrapped in the direction of closing the lid. [Note: clear plastic or fiber box tape, mask-ing tape, duct tape, and electricians tape are not suitable tapes for sealing sample bottle lids and often result in considerable leakage.] Leaking sample preservatives represent a safety hazard to transportation workers and to laboratory person-nel responsible for receiving and processing sam-ples.
4. Protect the Bio-TDB generated sample bottle labels during shipping by covering with clear packing tape.
5. Place each sample bottle in a sturdy (for example, freezer quality) resealable plastic bag and expel the air. Doing this provides secondary containment of each sample and prevents cross-contamination of samples if bottles break during shipping and handling.
6. Prepare the exterior of a shipping container (for example, cooler) by affixing orientation arrows and all required safety and hazard information and labels.
7. Line the inside of the container with a layer of bubble packing or other suitable shock-absorbing material.
8. Line the container with two nested heavy-duty trash bags.
9. Place a layer of absorbent material (for example, multi-ply paper padding) in the bottom of the inner trash bag. Do not use styrofoam peanuts, shredded paper, or vermiculite.
10. Tightly pack sample bottles against each other inside the trash bag. Ensure that bottles and resealable plastic bags are upright. Highlight samples on the packing list as they are placed in the container. [Note: do not exceed volume limits specified for shipping hazardous materials.]
11. Place additional absorbent material around bot-tles as necessary to fill gaps and close both trash bags with a tie.
12. Place a layer of bubble packing on top of the trash bags along with internal shipping documents. Place shipping documents (safety information, packing lists, and ASR forms) for each container in a resealable plastic bag and put the bag on top of the packed samples. Safety documents include 24-hour emergency contact information for the receiving laboratory and a copy of all applicable documentation for shipping hazardous material (for example, buffered formalin).
13. Close the shipping container with heavy-duty tape.
14. Complete all required hazardous materials ship-ping paperwork.
SUMMARY
Protocols for sampling algal, invertebrate, and fish communities as part of the National Water-Quality Assessment (NAWQA) Program were revised based on several methodological and procedural modifications, additions, and deletions that resulted during the first 10 years of the Program. The coordinated sampling of aquatic biological communities, water chemistry, and physical attributes in the NAWQA Program provides an integrated approach to monitoring water quality. This integrated approach is implemented in a common spatial setting by sampling a defined length of stream called a "reach." The methods described herein were originally developed to address objectives of the NAWQA Program, but may be adapted for other water-quality investigations.
Several pre-field activities are performed prior to going into the field to sample. These activities include obtaining necessary collecting permits, organizing sup-plies and equipment, preparing sample preservatives, checking the condition of and repairing sampling gear, preparing a field activities plan, and becoming familiar with functions of the Biological Transactional Data Base. The safety of the sampling teams in the field is a high priority. Therefore, all crewmembers must wear personal flotation devices when required by a Job Haz-ard Analysis and be instructed on the safe handling and operation of sampling gear, vehicles, and boats used to
70 Revised Protocols for Sampling Algal, Invertebrate, and Fish Communities as Part of the National Water-Quality Assessment Program

collect samples. Special training and certification is obtained for certain operations (for example, operating electrofishing gear or a boat).
Algal sampling protocols for periphyton and phytoplankton describe methods for collecting com-posited quantitative and qualitative samples. Up to four different sample types might be collected to character-ize the algal community in the sampling reach. Three quantitative sample types include a richest-targeted habitat periphyton sample, a depositional-targeted hab-itat periphyton sample, and a phytoplankton sample. The quantitative samples are collected to measure algal community structure, chlorophyll a, and ash-free dry-mass. Instead of ash-free dry-mass, phytoplankton samples are analyzed for particulate organic carbon. A qualitative multihabitat periphyton sample can be col-lected for characterizing algal taxa richness throughout the sampling reach. Methods for collecting these sam-ple types depend on wadeability at the site and on the type of algal habitat present in the reach (for example, epilithic, epidendric, or epipsammic). For example, the SG-92 sampler is recommended for use when collect-ing a quantitative microalgal sample from epilithic sub-strates. Samples are processed in the field to prepare samples for laboratory analysis. Algal sample process-ing includes preserving sampling for taxonomic identi-fication and homogenizing and filtering samples for chlorophyll a and ash-free dry-mass or particulate organic carbon analysis. Field data sheets are used to record sampling information (for example, where and how samples are collected, and weather and site condi-tions) and ancillary data from measurements necessary for the interpretation of the biological data (for exam-ple, light availability and current velocity).
Invertebrate sampling protocols describe meth-ods for collecting a composited semi-quantitative and qualitative sample to characterize the invertebrate com-munity in the sampling reach. The semi-quantitative invertebrate sample is collected in the richest-targeted habitat (typically a riffle or woody snag) that theoreti-cally represents where the highest invertebrate taxa richness is found. This sample is collected to describe the community structure (for example, relative abun-dance, and taxonomic and functional metrics) of the invertebrate taxa found in the richest-targeted habitat. Similar to the algal protocols, a qualitative multihabitat invertebrate sample can be collected for characterizing invertebrate taxa richness throughout the reach. Meth-ods for collecting these samples depend on wadeability at the site and on the substrate particle size (for exam-
ple, coarse or fine-grained substrates). For example, the Slack sampler is used when collecting a semi-quantitative sample from wadeable, coarse-grained rif-fle habitats. Samples are processed in the field prior to preparing them for analysis at the laboratory. Inverte-brate sample processing includes washing and sieving sample debris to remove fine particles, elutriating to separate organic and inorganic materials, and preserv-ing invertebrates for identification. Sample splitting procedures also are used to reduce the sample to an appropriate volume (for example, < 750 mL) for effec-tive performance of laboratory processing methods. Field data sheets are used to record sampling informa-tion (for example, where and how sample are collected, and weather and site conditions) and ancillary data from measurements necessary for the interpretation of the biological data (for example, current velocity, sam-ple depth, and woody snag sampling areas).
Fish sampling protocols describe methods for collecting a representative sample of the fish commu-nity from the entire sampling reach. Two complemen-tary sampling methods are used at each site. The primary sampling method is electrofishing; the comple-mentary secondary method is seining. The techniques for applying these methods depend on wadeability at the site and the complexity of instream habitats present in the geomorphic channel units (for example, riffles, runs, pools) represented. For example, backpack or towed electrofishing gear and techniques are used in wadeable streams, whereas boat electrofishing gear is used in nonwadeable streams. Fish are processed in the field and released alive back into the stream whenever possible. Fish processing includes sorting, identifying, and counting each species, measuring total length, weighing, and examining for external anomalies (for example, deformities, eroded fins, lesions, and tumors). Data from these processing steps are recorded on field data sheets along with sampling information. Fish are anesthetized to minimize stress during processing and to ensure their safe return to the stream. Fish specimens are preserved when identification in the field is uncer-tain or not possible, or when specimens are needed for vouchering.
After returning from the field, information recorded on field data sheets is entered into the Biolog-ical Transactional Data Base from which formatted sample labels, packing lists, and Analytical Services Request forms are generated. Samples, which are con-tained in standardized bottles, are packed in approved containers to minimize damage during shipping to the
Summary 71

laboratory for analysis. These packing procedures also ensure that samples are not cross-contaminated and that shipping and laboratory personnel and the public are not exposed to leaking chemical preservatives.
72 Revised Protocols for Sampling Algal, Invertebrate, and Fish Communities as Part of the National Water-Quality Assessment Program
REFERENCES CITED
Allan, J.D., 1995, Stream ecology—Structure and function of running waters: New York, Chapman and Hall, 388 p.
Bagenal, Timothy, 1978, Methods for assessment of fish production in fresh waters: Oxford, Blackwell Scientific Publications, 365 p.
Barbour, M.T., Gerritsen, J., Snyder, B.D., and Stribling J.B., 1999, Rapid bioassessment protocols for use in streams and wadeable rivers: Periphyton, benthic macroinvertebrates, and fish (2nd ed.): U.S. Environmental Protection Agency Report, EPA 841–B–99–002.
Bayley, P.B., and Herendeen, R.A., 2000, The efficiency of a seine net: Transactions of the American Fisheries Society, v. 129, p. 901–923.
Biggs, B.J.F., and Kilroy, C., 2000, Stream periphyton monitoring manual: Christ Church, New Zealand, National Institute of Water and Atmospheric Research, ISBN 0-478-090990-4, 256 p.
Bramblett, R.G., and Fausch, K.D., 1991, Fishes, macroinvertebrates, and aquatic habitats of the Purgatoire River in Pinon Canyon, Colorado: Southwestern Naturalist, v. 36, p. 281–294.
Britton, L.J., and Greeson, P.E., 1987, Methods for collection and analysis of aquatic biological and microbiological samples: U.S. Geological Survey Techniques of Water-Resources Investigations, book 5, chap. A4, 363 p.
Bryan, C.F., ed., 1984, Warm water streams techniques manual—Fishes: Baton Rouge, La., Southern Division, American Fisheries Society.
Cuffney, T.F., Gurtz, M.E., and Meador, M.R., 1993, Methods for collecting benthic invertebrate samples as part of the National Water-Quality Assessment Program: U.S. Geological Survey Open-File Report 93-406, 66 p.
Cuffney, T.F., Meador, M.R., Porter, S.D., and Gurtz, M.E., 1997, Distribution of fish, benthic invertebrate, and algal communities in relation to physical and chemical conditions, Yakima River Basin, Washington, 1990: U.S. Geological Survey Water-Resources Investigations Report 96-4280, 94 p.
Entwistle, T.J., Sonneman, J.A., and Lewis, S.H., 1997, Freshwater algae of Australia —A guide to conspicuous genera: Potts Point, Australia, Sainty and Associates Pty Ltd., 252 p.
Fitzpatrick, F.A., Waite, I.R., D’Arconte, P.J., Meador, M.R., Maupin, M.A., and Gurtz, M.E., 1998, Revised methods for characterizing stream habitat in the National Water-Quality Assessment Program: U.S. Geological Survey Water-Resources Investigations Report 98-4052, 67 p.
Gilliom, R.J., Alley, W.M., and Gurtz, M.E., 1995, Design of the National Water-Quality Assessment Program—Occurrence and distribution of water-quality conditions: U.S. Geological Survey Circular 1112, 33 p.
Hendricks, M.L., Hocutt, C.H., and Stauffer, J.R., Jr., 1980, Monitoring of fish in lotic habitats, in Hocutt, C.H., and Stauffer, J.R., Jr., eds., Biological monitoring of fish: Lexington, Mass., Lexington Books, p. 205–231.
Hirsch, R.M., Alley, W.M., and Wilber, W.G., 1988, Concepts for a National Water-Quality Assessment Program: U.S. Geological Survey Circular 1021, 42 p.
Lane, S.L., and Fay, R.G., 1997, National field manual for the collection of water-quality data—Safety in field activities: U.S. Geological Survey Techniques of Water-Resources Investigations, book 9, chap. A9, 60 p.
Lazorchak, J.M., Klemm, D.J., and Peck, D.V., eds., 1998, Environmental Monitoring and Assessment Program—Surface waters: Field operations and methods for measuring the ecological condition of wadeable streams: U.S. Environmental Protection Agency Report, EPA 620–R–94–004F.
Leahy, P.P., Rosenshein, J.S., and Knopman, D.S., 1990, Implementation plan for the National Water-Quality Assessment Program: U.S. Geological Survey Open-File Report 90-174, 10 p.
Matthews, W.J., 1986, Fish faunal structure in an Ozark stream—Stability, persistence and a catastrophic flood: Copeia, v. 1986, p. 388–397.
McMichael, G.A., Fritts, A.L., and Pearsons, T.N., 1998, Electrofishing injury to stream salmonids; injury assessment at the sample, reach, and stream scales: North American Journal of Fisheries Management, v. 18, p. 894–904.
Meador, M.R., Cuffney, T.F., and Gurtz, M.E., 1993, Methods for sampling fish communities as a part of the National Water-Quality Assessment Program: U.S. Geological Survey Open-File Report 93-104, 40 p.
Minshall, G.W., 1984, Aquatic insect-substratum relationships, in Resh, V.H., and Rosenberg, D.M., eds., The ecology of aquatic insects: New York, Praeger Publishers, p. 358–400.
Nielsen, L.A., and Johnson, D.L., 1983, Fisheries techniques: Bethesda, Md., American Fisheries Society, 468 p.
References Cited 73
Ohio Environmental Protection Agency, 1987, Biological criteria for the protection of aquatic life—Standardized biological field sampling and laboratory methods for assessing fish and macroinvertebrate communities: Columbus, Ohio, Division of Water Quality Monitoring and Assessment, v. 3, 58 p.
Orth, D.J., 1983, Aquatic habitat measurements, in Nielsen, L.A., and Jonson, D.L., eds., Fisheries techniques, Chapter 4: Bethesda, Maryland, American Fisheries Society, p. 61–84.
Peake, Stephan, 1998, Sodium bicarbonate and clove oil as potential anesthetics for nonsalmonid fishes: North American Journal of Fisheries Management, v. 18, p. 919–924.
Plafkin, J.L., Barbour, M.T., Porter, K.D., Gross, S.K., Hughes, R.M., 1989, Rapid bioassessment protocols for use in streams and rivers: U.S. Environmental Protection Agency, EPA/444/4-89-001.
Porter, S.D., Cuffney, T.F., Gurtz, M.E., and Meador, M.R., 1993, Methods for collecting algal samples as part of the National Water-Quality Assessment Program: U.S. Geological Survey Open-File Report 93-409, 39 p.
Reynolds, J.B., 1983, Electrofishing, in Nielsen, L.A., and Johnson, D.L., eds., Fisheries techniques: Bethesda, Maryland., American Fisheries Society, p.147–163.
Robins, C.R., Bailey, R.M., Bond, C.E., Brooker, J.R., Lachner, E.A., Lea, R.N., and Scott W.B., 1991, Common and scientific names of fishes from the United States and Canada: Bethesda, Md., American Fisheries Society, Special Publication 20, 183 p.
Ruhl, P.M., and Scudder, B.C., NAWQA Biological Transactional Database (Bio-TDB) user manual—For Bio-TDB version 1.1.3, revised March 29, 2002, accessed April 26, 2002, at URL http://sun3dncrlg.er.usgs.gov/usgs/biotdb/
Sanders, R.E., Miltner, R.J., Yoder, C.O., and Rankin, E.T.,1999, The use of external deformities, erosion, lesions, and tumors (DELT anomalies) in fish assemblages for characterizing aquatic resources—A case study of seven Ohio streams, in Simon, T.P., Assessing the sustainability and biological integrity of water resources using fish communities: New York, CRC Press, 671 p.
Sorenson, S.K., Porter, S.D., Akers, K.B., Harris, M.A., Kalkhoff, S.J., Lee, K.L., Roberts, L.R., and Terrio, P.J., 1999, Water quality and habitat conditions in upper midwest streams relative to riparian vegetation and soil characteristics, August 1997—Study design, methods, and data: U.S. Geological Survey Open-File Report 99-202, 53 p.
Summerfelt, R.C., and Smith, L.S., 1990, Anesthesia, surgery, and related techniques, in Schreck, C.B., and Moyle, P.B., eds., Methods for fish biology: Bethesda, Md., American Fisheries Society, p. 213–272.
Terrell, C.R., and Perfetti, P.B., 1996, Water quality indicators guide—Surface waters: Dubuque, Iowa (Terrene Institute), Kendall/Hunt, p. 48–65.
Thorp, J.H., 1992, Linkage between islands and benthos in the Ohio River, with implications for riverine management: Canadian Journal of Fisheries and Aquatic Sciences, v. 49, no. 9, p. 1873–1882.
U.S. Geological Survey, 2001a, Occupational safety and health program requirements handbook: U.S. Geological Survey Manual SM 445-2-H, accessed April 26, 2002, at URL http://www.usgs.gov/usgs-manual/handbook/hb/445-2-h.html
U.S. Geological Survey, 2001b, Shipping reminder from the Central Region Safety Officer: National Water Quality Laboratory Rapi Note 01-033, accessed April 26, 2002, at URL http://wwwnwql.cr.usgs.gov/USGS/rapi-note/01-033.html
U.S. Geological Survey, 2001c, Update to 01-033, safe shipping reminder: National Water Quality Laboratory Rapi Note 01-034, accessed April 26, 2002, at URL http://wwwnwql.cr.usgs.gov/USGS/rapi-note/01-034.html
Walsh, S.J., and Meador, M.R., 1998, Guidelines for quality assurance and quality control of fish taxonomic data collected as part of the National Water-Quality Assessment Program: U.S. Geological Survey Water-Resources Investigations Report 98-4239, 33 p.
Ward, J.R., and Harr, C.A., eds., 1990, Methods for the collection and processing of surface-water and bed-material samples for physical and chemical analyses: U.S. Geological Survey Open-File Report 90-140, 71 p.
Wetzel, R.G., 1975, Limnology: Philadelphia, W.B. Saunders Company, p. 52.
Wilde, F.D., and Radtke, J.G., 1998, National field manual for the collection of water-quality data—Field measurements: U.S. Geological Survey Techniques of Water-Resources Investigations, book 9, chap. A6, 31 p.
Wiley, M.L., and Tsai, Chu-Fa, 1983, The relative efficiencies of electrofishing vs. seines in Piedmont streams of Maryland: North American Journal of Fisheries Management, v. 3, p. 243–253.
Yobbi, D.K., Yorke, T.H., and Mycyk, R.T., 1996, A guide to safe field operations: U.S. Geological Survey Open-File Report 95-777, 29 p.
74 Revised Protocols for Sampling Algal, Invertebrate, and Fish Communities as Part of the National Water-Quality Assessment Program

APPENDIX
Operational modifications for the Slack sampler
(a) Bipod Stand
Materials:
• 2–6-ft wooded tomato stakes• 1–3/8-in x 3-in-long hex bolt and 3/8-in hex nut• 3–5/16-in cut washers• 1–5/16-in lock washer• 1–6/32-in round head machine screw with fitted
nut and lock washer• 1–standard No. 20 screw clamp (hose clamp)• 1–1-in x 6-in-long (1/16-in thick) strip of galva-
nized steel
Constructing the bipod stand:1. Drill one end of the
strip of galvanized steel to the diameter of the hex bolt and the other end to the diameter of the small machine screw.
2. Drill each wooden tomato stake 28 cm from the top with a bit slightly larger than the hex bolt diameter.
3. Drill the center of the clamp strap to fit the machine screw.
4. Bend the strip of steel as indicated in the photo-graph.
5. Place one washer on the hex bolt, which is then passed through the end of steel strip with the larger diameter hole and through one of the wooden stakes.
6. Add a second washer to the hex bolt and then attach the other wooden stake.
7. Add a third washer, followed by the lock washer to the end of the hex bolt and secure with the hex nut.
8. Attach the screw clamp to the top end of the S-shaped steel strip with a machine screw.
9. The assembled bipod should support the upright handle of the Slack sampler (see photo and fig. 8a). The bipod is implemented by placing the Slack sampler in the stream, then sliding the opening of the screw clamp down over the top of the handle to about 1/3 the distance from the top of the handle. The wooden stakes are angled to support the Slack sampler. If needed, the screw clamp can be tightened to prevent the bipod appa-ratus from sliding.
(b) Area Template
Materials:• 1–5-ft length of ½-in PVC pipe• 2–PVC T connectors• some shock cord or ¼-in braided nylon rope• 2–spring clips
Constructing the area template:1. Cut the PVC piping into three equal segments.
2. Connect the PVC pipe with the two T-connectors to form two right angles. [Note: using T-connec-tors (instead of elbow connectors) and drilling a few holes into the PVC pipe will allow water to flow in the frame, preventing it from floating up during sampling.]
3. String the shock cord or braided nylon rope through all three segments of PVC piping. Keep some slack so that the apparatus can be collapsed and then tightened and clipped (tied snug if using rope) to the frame when in use.
Close-up of bipod attached to Slack sampler handle
Appendix 75