reviews1_12013,12017,12026,12030,12043,12052,12055
TRANSCRIPT

INDUSTRY ANALYSIS: PHARMACEUTICAL
INDUSTRY (Review 1)SUBMITTED BY GROUP 9 (GROUP 7 HEAVEN) on 27th December 2009MEMBERS:ASMITA PATEL (12017)ANISHA BARWAR (12013)KUNGA SANGMO (12030)KANUKURTI SAILESH (12026)SANDEEP RAO (12043)TENZIN TOPDHEN (12052) VEENA VISHWANATH (12055)

TOPICS COVERED AND ANALYSED SO FAR
1) Size of the industry2) Segmentation by:
Product &Differentiation
3) Top players in the Indian pharmaceutical industry4)Imports and Exports5)Past growth rates of the industry6)Basic dynamics of the industry (Value Chain analysis,
key processes.)7)External analysis8)Internal analysis

SIZE OF INDIAN PHARMACEUTICAL INDUSTRY
• The Indian Pharmaceutical Industry today is in the front rank of India’s science-based industries with wide ranging capabilities in the complex field of drug manufacture and technology.
• A highly organized sector, the Indian pharmaceutical industry is estimated to be worth $ 4.5 billion, growing at about 8 to 9 percent annually.
• Highly fragmented with more than 20,000 registered units. • Meets around 70% of the country's demand for bulk drugs, drug
intermediates, pharmaceutical formulations, chemicals, tablets, capsules, orals and injectibles.
• Approximately 250 large units and about 8000 Small Scale Units, which form the core of the pharmaceutical industry in India (including 5 Central Public Sector Units).
• In terms of the global market, India currently holds a 3.2% share.

SIZE OF INDIAN PHARMACEUTICAL INDUSTRY
• The Pharma Industry in India produces around 20% to 24% of the global generic drugs.
• The Indian Pharmaceutical Industry is one of the biggest producers of the active pharmaceutical ingredients (API) in the international arena.
• The Indian Pharma sector leads the science-based industries in the country
• The pharmaceutical sector has the capacity and technology pertaining to complex drug manufacturing.
• Around 40% of the total pharmaceutical produce is exported.
• 55% of the total exports constitute of formulations and the other 45% comprises of bulk drugs.
• The Indian Pharma Industry includes small scaled, medium scaled, large scaled players, which totals nearly 300 different companies.
• There are several other small units operating in the domestic sector.

Market Size (US$ mn) 8200
As % of total health expenditure 25.3
As % of GDP 1.3
As % of world market 1.6
Growth rate % 7.2
Per capita expenditure (US$) 8
Summary of Indian Pharmaceutical market in 2004
8.2 8.79.4
10.110.8 11.6
0
2
4
6
8
10
12
2004 2005 2006 2007 2008 2009
Indian pharmaceutical market currently
estimated at U$ 8.7 bn
Globally, India market ranks fourth in terms of
volume and the 13th largest by value
Predicted to grow by over 7 % to become a US$
11.6 bn opportunity by 2009
In 2005, Indian companies controlled 70 per
cent of the domestic market
Indian pharma majors launched more than 10
products per year, global MNCs averaged 1-2
annually.
US
$ b
n
Pharmaceutical market, 2004-2009
Indian Pharmaceutical Market – USD 11.6 billion opportunity
Source: Epsicom
Maximum New Product Launch
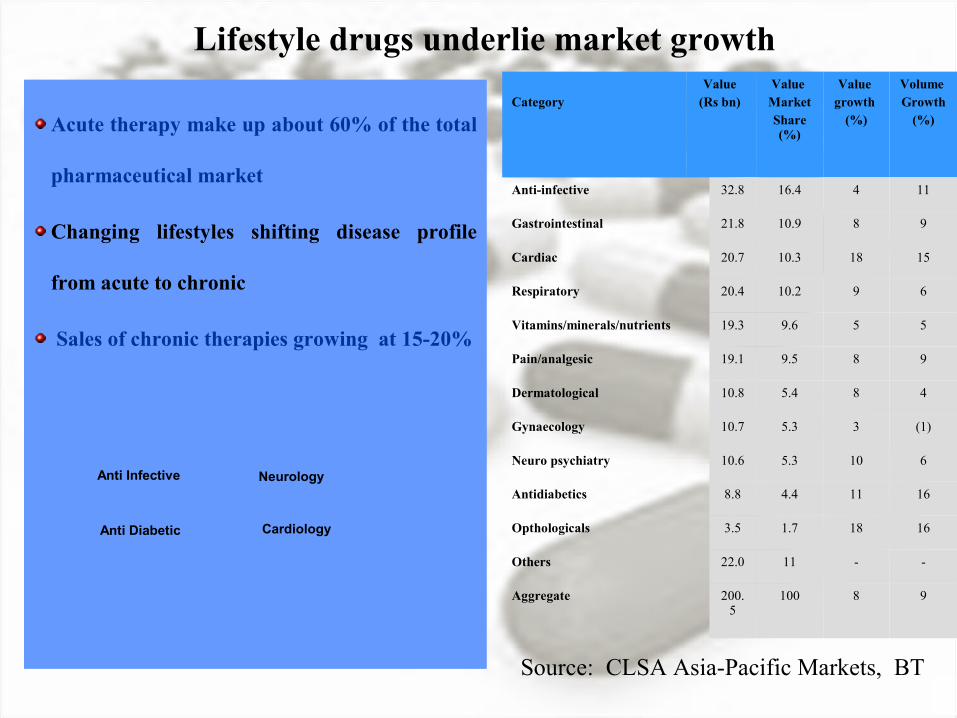
Acute therapy make up about 60% of the total
pharmaceutical market
Changing lifestyles shifting disease profile
from acute to chronic
Sales of chronic therapies growing at 15-20%
Category Value
(Rs bn) Value MarketShare (%)
Value growth
(%)
Volume Growth
(%)
Anti-infective 32.8 16.4 4 11
Gastrointestinal 21.8 10.9 8 9
Cardiac 20.7 10.3 18 15
Respiratory 20.4 10.2 9 6
Vitamins/minerals/nutrients 19.3 9.6 5 5
Pain/analgesic 19.1 9.5 8 9
Dermatological 10.8 5.4 8 4
Gynaecology 10.7 5.3 3 (1)
Neuro psychiatry 10.6 5.3 10 6
Antidiabetics 8.8 4.4 11 16
Opthologicals 3.5 1.7 18 16
Others 22.0 11 - -
Aggregate 200.5
100 8 9
Lifestyle drugs underlie market growth
Anti Diabetic Cardiology
Anti Infective Neurology
Source: CLSA Asia-Pacific Markets, BT
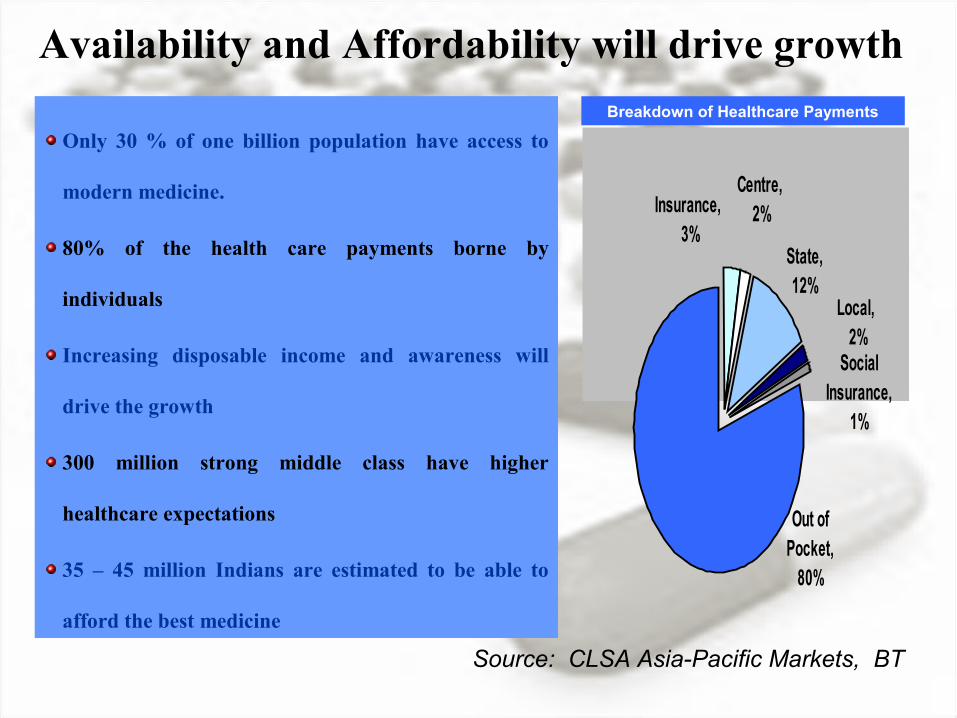
Out of Pocket,
80%
Local, 2%
Social Insurance,
1%
State, 12%
Insurance, 3%
Centre, 2%
Only 30 % of one billion population have access to
modern medicine.
80% of the health care payments borne by
individuals
Increasing disposable income and awareness will
drive the growth
300 million strong middle class have higher
healthcare expectations
35 – 45 million Indians are estimated to be able to
afford the best medicine
Availability and Affordability will drive growth
Breakdown of Healthcare Payments
Source: CLSA Asia-Pacific Markets, BT

INDUSTRY SEGMENTATION :BY PRODUCTS
Pharmaceutical sales include:
• Ethical (prescribed) DrugsA prescription drug is a licensed medicine that is regulated by legislation to require a prescription before it can be obtained.
•Over-the-counter (OTC) medicationsOver-the-counter (OTC) drugs are medicines that may be sold directly to a consumer without a prescription from a health care professional.
•Ethical drugs account for about 60% of total industry sales, with OTC products representing the balance.

ETHICAL OR PRESCRIBED DRUGS SEGMENT
The ethical sector can be further segmented into:
• Brand-name products
• Generic products.
• EXAMPLE:
• Generics are less-expensive equivalents of brand-name prescribed drugs, and may be produced and sold once the original drug's patent protection expires.
Medicine for Brand name products
Generic products
Allergy BRONICA® seratrodast
Vaccine Japanese Encephalitis Vaccine
( no generic product segment)
INDUSTRY SEGMENTATION :BY DIFFERENTIATION
• Three-quarters of industry sales consist of pharmaceuticals used in outpatient settings, with the balance administered in hospitals, nursing homes, and other inpatient facilities.
• About 70% of prescribed drugs is distributed through wholesalers to hospitals, health maintenance organizations (HMOs), and retail pharmacies.
• The remaining 30% is sold directly by manufacturers to physicians, hospitals, retailers, and others.
• The details of over the counter medications can not be predicted accurately.

TOP 10 PHARMACEUTICAL COMPANIES IN INDIA
RANK COMPANY REVENUE 2004 (Rs Crore)
REVENUE 2004 (USD MILLION)
1Ranbaxy
Laboratories4,461 1,026
2Dr. Reddy's
Laboratories1,933 444
3 Cipla 1,842 423
4 Nicholas Piramal 1,387 319
5 Aurobindo Pharma 1,260 290
6 GlaxoSmithKline 1,228 282
7 Lupin Laboratories 1,180 271
8Sun Pharmaceutical
Industries1,110 255
9 Cadila Healthcare 1,091 251
10 Wockhardt 980 225
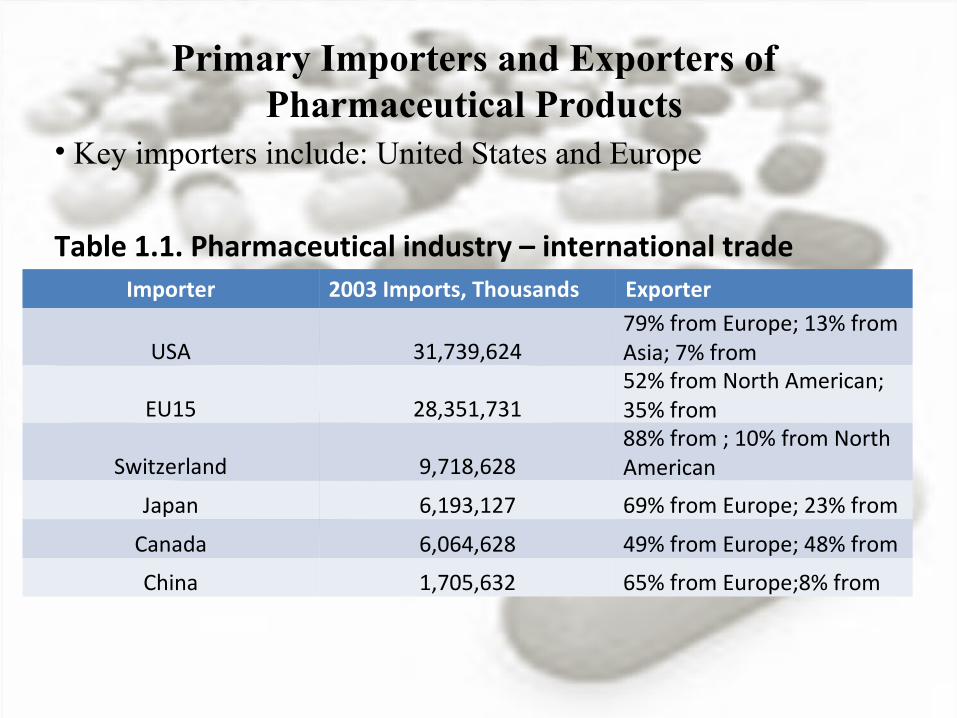
Primary Importers and Exporters of Pharmaceutical Products
• Key importers include: United States and Europe
Table 1.1. Pharmaceutical industry – international tradeImporter 2003 Imports, Thousands Exporter
USA 31,739,62479% from Europe; 13% from Asia; 7% from
EU15 28,351,73152% from North American; 35% from
Switzerland 9,718,62888% from ; 10% from North American
Japan 6,193,127 69% from Europe; 23% from
Canada 6,064,628 49% from Europe; 48% from
China 1,705,632 65% from Europe;8% from

Table 1.2. Changes in pharmaceutical imports between 1995 and 2003, percent change
Importer Exporter Percent Change, 1995to 2003
Japan Africa 270,477
China C&S America 16,370
China Africa 11,256
Canada Africa 1,036
USA Europe 487
USA N.America 431
USA Asia 395
China N.America 386
Switzerland Aisa 382
USA Oceana 367

Size Of Pharmaceutical Industry In India
• $8.2 Billion worth of formulations and bulk drugs sold in 2008*
• 20,000 registered drug manufacturers !
• Between 2007-08 and 2011-12, the Indian domestic pharmaceutical market is expected to grow at a CAGR of nearly 16%
• In terms of the global market, India currently holds a 3.2% share
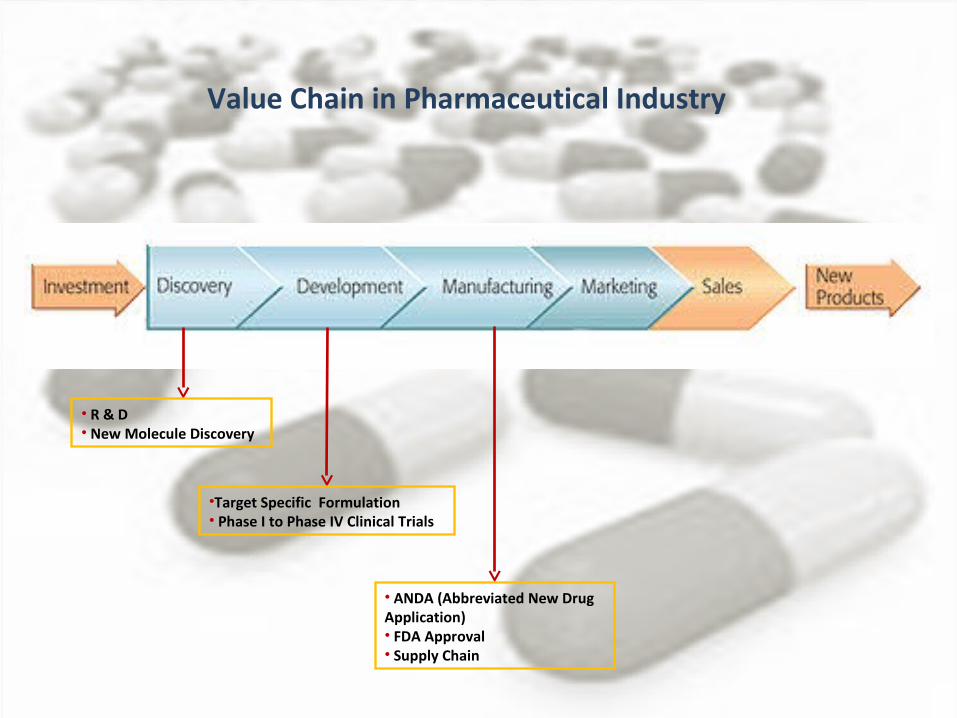
Value Chain in Pharmaceutical Industry
• R & D • New Molecule Discovery
•Target Specific Formulation• Phase I to Phase IV Clinical Trials
• ANDA (Abbreviated New Drug Application)• FDA Approval• Supply Chain
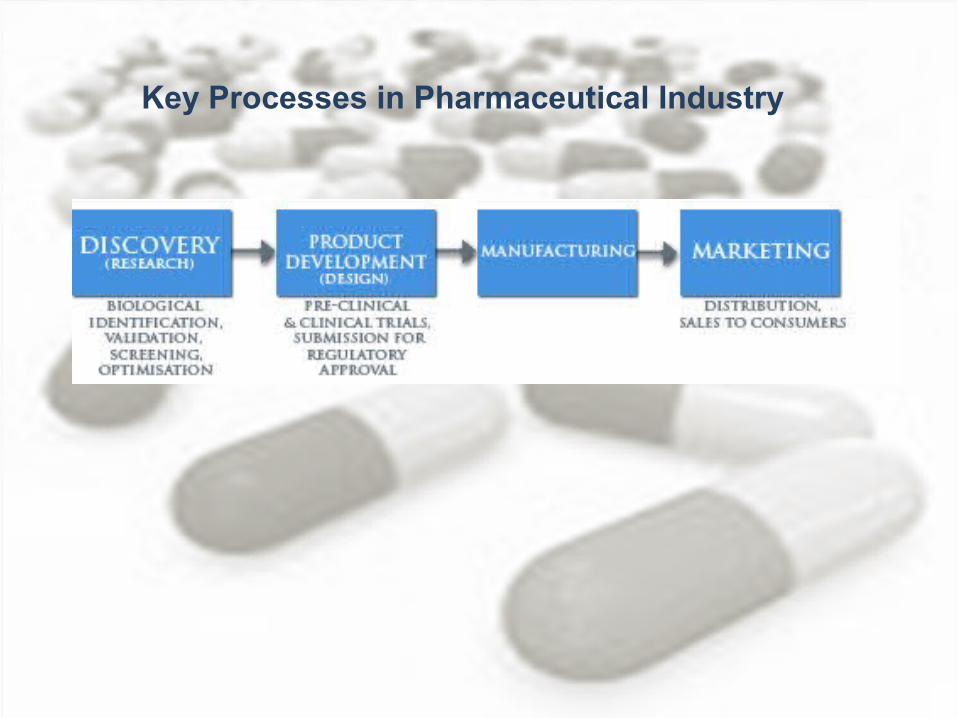
Key Processes in Pharmaceutical Industry

Key Processes in Pharmaceutical Industry
Discovery Development Manufacturing Marketing
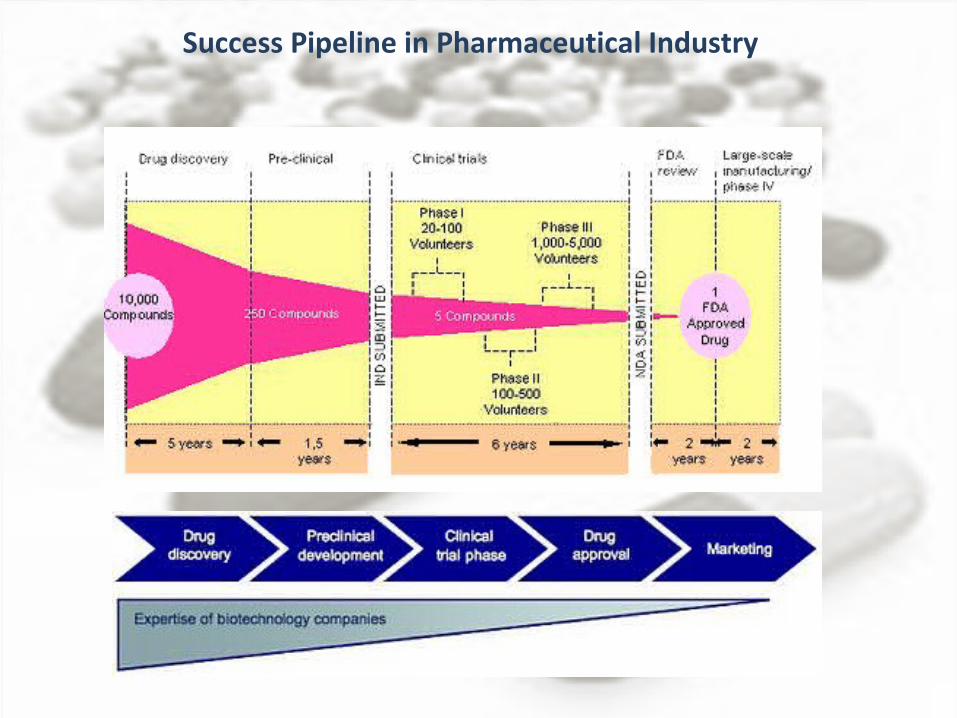
Success Pipeline in Pharmaceutical Industry

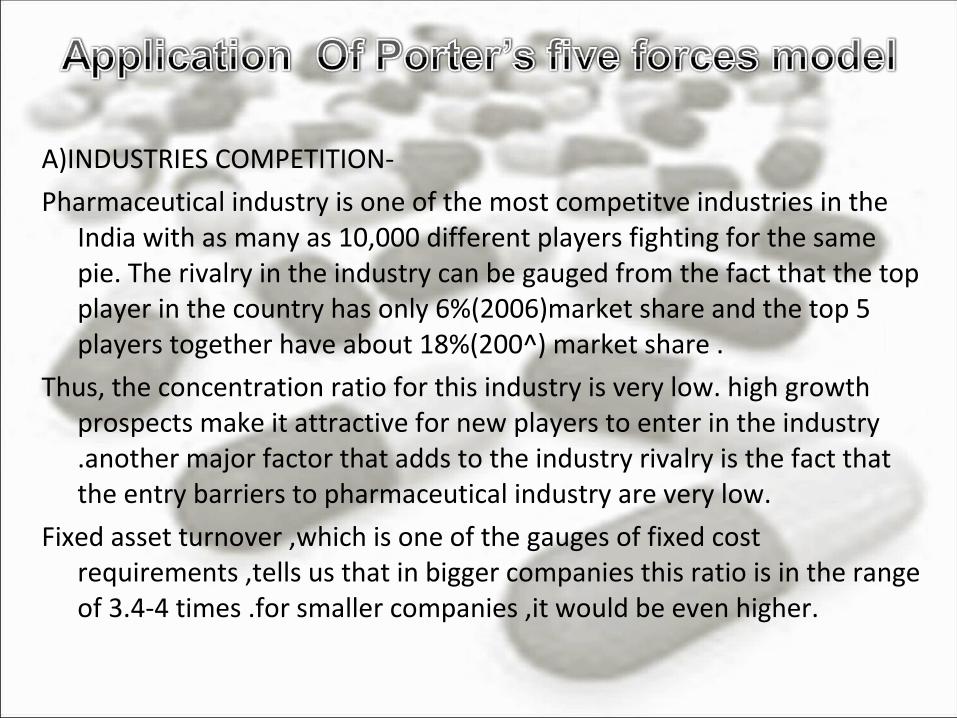
A)INDUSTRIES COMPETITION-
Pharmaceutical industry is one of the most competitve industries in the India with as many as 10,000 different players fighting for the same pie. The rivalry in the industry can be gauged from the fact that the top player in the country has only 6%(2006)market share and the top 5 players together have about 18%(200^) market share .
Thus, the concentration ratio for this industry is very low. high growth prospects make it attractive for new players to enter in the industry .another major factor that adds to the industry rivalry is the fact that the entry barriers to pharmaceutical industry are very low.
Fixed asset turnover ,which is one of the gauges of fixed cost requirements ,tells us that in bigger companies this ratio is in the range of 3.4-4 times .for smaller companies ,it would be even higher.

• Many small players that are focused on a particular region have a better hang of the distribution channel, making it easier to succeed, albeit in a limited way.
• The product differentiation is one key factor which gives competitive advantage to the firms in any industry . However pharmaceutical industry product differentiation is not possible since India has followed process patents till date ,with loss favoring imitators. Consequently product differentiation is not a driver ,cost competitiveness is .However ,companies like Pfizer and GlaxoSmithKline have created big brands over the years which act as product differentiation tools.
• Earlier it was easy for Indian pharmaceutical companies to imitate pharmaceutical products discovered by MNCs at a lower cost and make good profit .But today the scene is different with the arrival of patent regime which has forced Indian companies to rethink its strategies and to invest more on R&D ,also contact research has assumed more importance now.
B)BARGAINING POWER OF BUYERS –
The unique features of pharmaceutical industry is that the end user of the product is different from the influencer . The consumer has no choice but to buy what doctor says .however ,when we look at the buyer’s power, we look at the influence they have on the prices of the product .
In pharmaceutical industry .the buyers are scattered and they as such do not wield much power in the pricing of the products. However ,government with these policies ,plays an important role in regulating pricing through the NPPA (national pharmaceutical pricing authority).

C)BARGAINING POWER OF SUPPLIERS-
The pharmaceutical industry depends upon several organic chemicals .the chemical industry is again very competitive and fragmented. The chemicals used in the pharmaceutical industry are largely a commodity. The suppliers have very low bargaining power and the companies in the pharmaceutical industry can switch from their suppliers without incurring a very high cost .However ,what can happen is that the supplier can go for forward integration to become a pharmaceutical company. Companies like Orchid chemicals and Sashun chemicals were basically chemical companies who turned themselves into pharmaceutical companies.

D)BARRIERS TO ENTRY
Pharmaceutical industry is one of the most easily accessible industries for an entrepreneur in India. The capital requirement for the industries is very low, creating a regional distribution network is easy ,since the point of sales is restricted in this industry in India .however ,creating brand awareness and franchisee among doctors is the key for long term survival. Also ,quality regulations by the government may put some hindrance for establishing new manufacturing operations. The new patent regime has raised the barriers to entry .but it is unlikely to discourage new entrants ,as market for generics will be as huge.

E) THREAT OF SUBSTITUTES-
This is one of the great advantages of the pharmaceutical industry. Whatever happens demand for pharmaceutical products continues and the industry thrives . One of the key reasons for high competitiveness in the industry is that as an ongoing concern, pharmaceutical industry seems to have an infinite future .however ,in recent times the advances made in the field of biotechnology ,can prove to be a threat to the synthetic pharmaceutical industry

CONCLUSION OF PORTER’S FIVE FORCES
This model gives a fair idea about the industry in which the companies operates and the various external forces that influences it.
Going forward we foresee increasing .it will be between large players (with economies of scale) and it may be possible that some kind of oligopoly or cartels come into play. This is owing to the fact that the industry will move towards consolidation . The larger players in the industry will survive with their proprietary and strong franchisee .
In the Indian context , companies like Cipla , Ranbaxy and GlaxoSmithKline are likely to be the key players .smaller fringe players , who have no differentiating strength , are likely to either be acquired or ceases to exist . competition in the industry but the form of competition will be different
The barriers to entry will increase going forward .the change in the patent regime has made sure that new proprietary products come up with making imitation difficult . The players with huge capacity will be able to influence substantial power on the fringe players by their aggressive pricing thereby creating hindrance for the smaller players .Economics of scale will play an important part too. Besides this the government will have a bigger role to play.
Key Processes in Pharmaceutical Industry
Industry competition
•Pharma industry is one of the most competitive industries in the country •As many as 10,000 different players fighting for the same pie
•The top player in the country has only 6% market share
•Top five players together have about 18% market share
• The concentration ratio for this industry is very low.
•High growth prospects make it attractive for new players to enter in the industry.
Another major factor that adds to the industry rivalry is the fact that the entry barriers to pharma industry are very low. The fixed cost requirement is low but the need for working capital is high.

Key Processes in Pharmaceutical Industry
Growth Prospects
•An important fact is that pharma is a stable market
•Its growth rate generally tracks the economic growth of the country with some multiple (1.2 times average in India )
•Though volume growth has been consistent over a period of time, value growth has not followed in tandem.
• Product differentiation is one key factor, which gives competitive advantage to the firms in any industry.
• However, in pharma industry product differentiation is not possible since India has followed process patents till date, with laws favouring imitators or generics
• Product differentiation is not the driver, cost competitiveness is.
Ranbaxy analysis•Ranbaxy Laboratories Limited is India's largest pharmaceutical company.
•Ranbaxy exports its products to 125 countries with ground operations in 46 and manufacturing facilities in seven countries
• In 1998, Ranbaxy entered the United States, the world's largest pharmaceuticals market and now the biggest market for Ranbaxy, accounting for 29% of Ranbaxy's sales in 2009
• On June 11 2008, Daiichi-Sankyo acquired a 34.8% stake in Ranbaxy, for a value $2.4 billion. In November 2008, Daiichi-Sankyo completed the takeover of the company from the founding Singh family in a deal worth $4.6 billion by acquiring a 63.92% stake in Ranbaxy
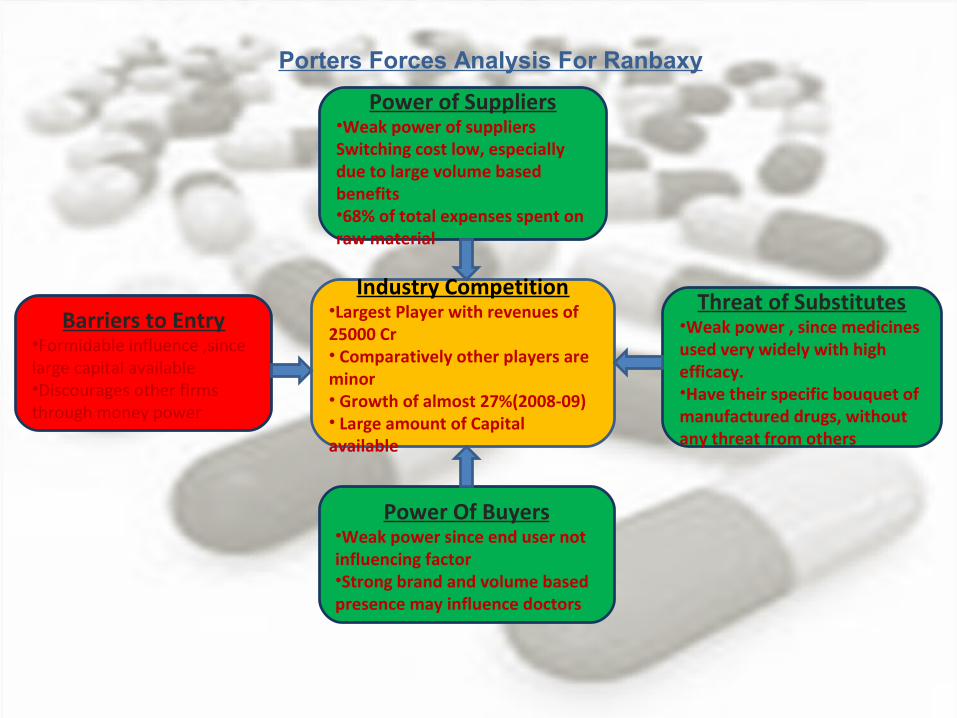
Porters Forces Analysis For Ranbaxy
Industry Competition•Largest Player with revenues of 25000 Cr• Comparatively other players are minor • Growth of almost 27%(2008-09)• Large amount of Capital available
Barriers to Entry•Formidable influence ,since large capital available•Discourages other firms through money power
Power Of Buyers•Weak power since end user not influencing factor•Strong brand and volume based presence may influence doctors
Power of Suppliers•Weak power of suppliersSwitching cost low, especially due to large volume based benefits•68% of total expenses spent on raw material
Threat of Substitutes•Weak power , since medicines used very widely with high efficacy.•Have their specific bouquet of manufactured drugs, without any threat from others

Ranbaxy
Core Competencies
•Employs around 6000 researchers , biochemists etc as it is mainly into drug discovery.
•Aggressive marketing company – fights for market shares at rock bottom prices
•Cost of Innovation – Solid drug discovery pipeline. Over 100 active molecules in pipeline.
•Wider global scope - It has subsidiaries world over. Manages to tap into domestic talent in every country .

Ranbaxy
Marketing Strategies
•Co – Marketing : A key part of Ranbaxy’s business strategy is to collaborate with partners with complementary skills – a mutually beneficial strategy for both parties - leverages Ranbaxy's significant marketing and distribution strengths to maximise patient coverage within the country
•More affordable drugs at low cost - penetrated the generics market through alliances and heavy investments in R&D. Made use of India’s low cost of innovation, production and labour.
•Ranbaxy invests about 9% of sales into R&D as it tries to increase its share in the branded drug segments thereby increasing its momentum in generic business through organic and inorganic routes.
•Its culture and expertise backed it to become the single largest source of clinical laboratory testing in South Asia offering an extensive range of diagnostic tests.

GlaxoSmithKline•One of the fastest growing pharma companies in India though it is a relatively new player.
•Branding via Marketing campaigns – They piggy back on the goodwill generated by strong marketing campaigns undertaken by sister concerns – GSK Health Care which has products like Horlicks
•Distribution network – caters to daily use low end drugs – lifestyle drugs – anti diabetic drugs , slimming and fitness drugs etc
•Outsources drug discovery to Contract research organizations. GSK is not much into drug discovery in India

GlaxoSmithKline Analysis
• Third largest pharma player globally with revenues of 45,000 Million USD*
• Seventh largest in India, with domestic revenues of 1700 Cr.
•GSK was formed in 2000 by the merger of GlaxoWellcome (formed from the mergers of Burroughs Wellcome & Company and Glaxo Laboratories), and SmithKline Beecham (from Beecham, and SmithKline).
• Entered Indian market on January 7th,2001 and has developed new R & D centres in Thane and Nasik
• Growth rate of 28 % , approx 6% of market share in India.
*money.cnn.com/magazines/fortune/global500/2009/snapshots/6782.htm
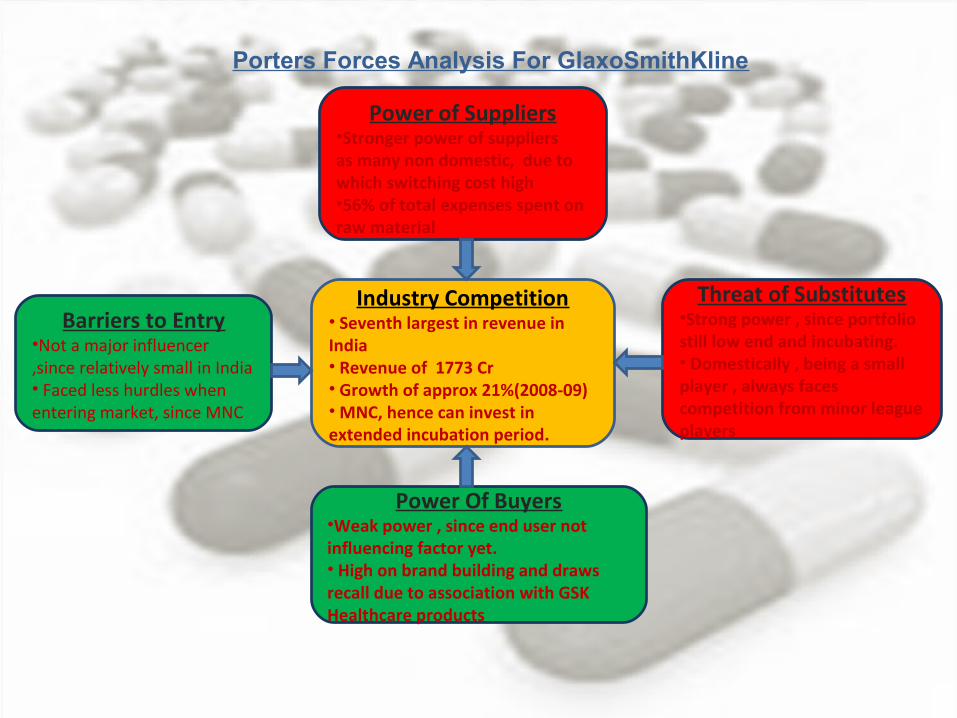
Porters Forces Analysis For GlaxoSmithKline
Industry Competition• Seventh largest in revenue in India• Revenue of 1773 Cr• Growth of approx 21%(2008-09)• MNC, hence can invest in extended incubation period.
Barriers to Entry•Not a major influencer ,since relatively small in India• Faced less hurdles when entering market, since MNC
Power Of Buyers•Weak power , since end user not influencing factor yet.• High on brand building and draws recall due to association with GSK Healthcare products
Power of Suppliers•Stronger power of suppliersas many non domestic, due to which switching cost high•56% of total expenses spent on raw material
Threat of Substitutes•Strong power , since portfolio still low end and incubating.• Domestically , being a small player , always faces competition from minor league players

• 1935: Dr K A Hamied sets up "The Chemical, Industrial and Pharmaceutical Laboratories Ltd." in a rented bungalow, at Bombay Central.
• 1941: As the Second World War cuts off drug supplies, the company starts producing fine chemicals, dedicating all its facilities for the war effort.
• 1952: Sets up first research division for attaining self-sufficiency in technological development
• 1960: Starts operations at second plant at Vikhroli, Mumbai, producing fine chemicals with special emphasis on natural products
• 1968: Cipla manufactures ampicillin for the first time in the country. • 1972: Starts Agricultural Research Division at Bangalore, for scientific cultivation of medicinal
plants. • 1976:Cipla launches medicinal aerosols for asthma. • 1980: Wins Chemexcil Award for Excellence for exports• 1982: Fourth factory begins operations at Patalganga, Maharashtra• 1984: Develops anti-cancer drugs, vinblastine and vincristine in collaboration with the
National Chemical Laboratory, Pune. Wins Sir P C Ray Award for developing inhouse technology for indigenous manufacture of a number of basic drugs.
• 1985: Cipla wins National Award for Successful Commercialisation of Publicly Funded R&D.
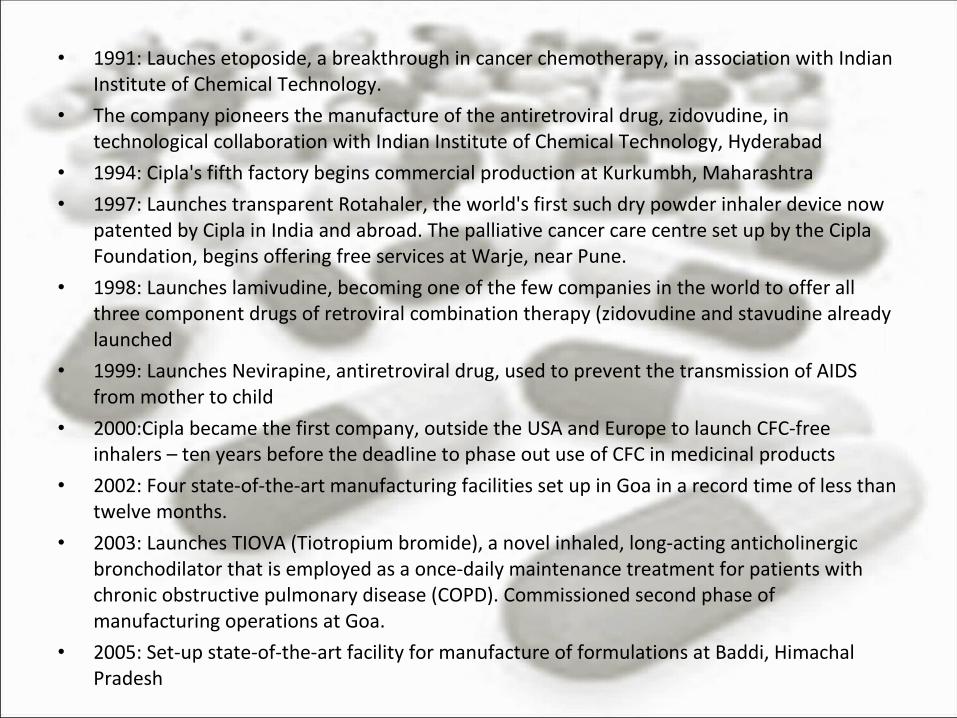
• 1991: Lauches etoposide, a breakthrough in cancer chemotherapy, in association with Indian Institute of Chemical Technology.
• The company pioneers the manufacture of the antiretroviral drug, zidovudine, in technological collaboration with Indian Institute of Chemical Technology, Hyderabad
• 1994: Cipla's fifth factory begins commercial production at Kurkumbh, Maharashtra
• 1997: Launches transparent Rotahaler, the world's first such dry powder inhaler device now patented by Cipla in India and abroad. The palliative cancer care centre set up by the Cipla Foundation, begins offering free services at Warje, near Pune.
• 1998: Launches lamivudine, becoming one of the few companies in the world to offer all three component drugs of retroviral combination therapy (zidovudine and stavudine already launched
• 1999: Launches Nevirapine, antiretroviral drug, used to prevent the transmission of AIDS from mother to child
• 2000:Cipla became the first company, outside the USA and Europe to launch CFC-free inhalers – ten years before the deadline to phase out use of CFC in medicinal products
• 2002: Four state-of-the-art manufacturing facilities set up in Goa in a record time of less than twelve months.
• 2003: Launches TIOVA (Tiotropium bromide), a novel inhaled, long-acting anticholinergic bronchodilator that is employed as a once-daily maintenance treatment for patients with chronic obstructive pulmonary disease (COPD). Commissioned second phase of manufacturing operations at Goa.
• 2005: Set-up state-of-the-art facility for manufacture of formulations at Baddi, Himachal Pradesh
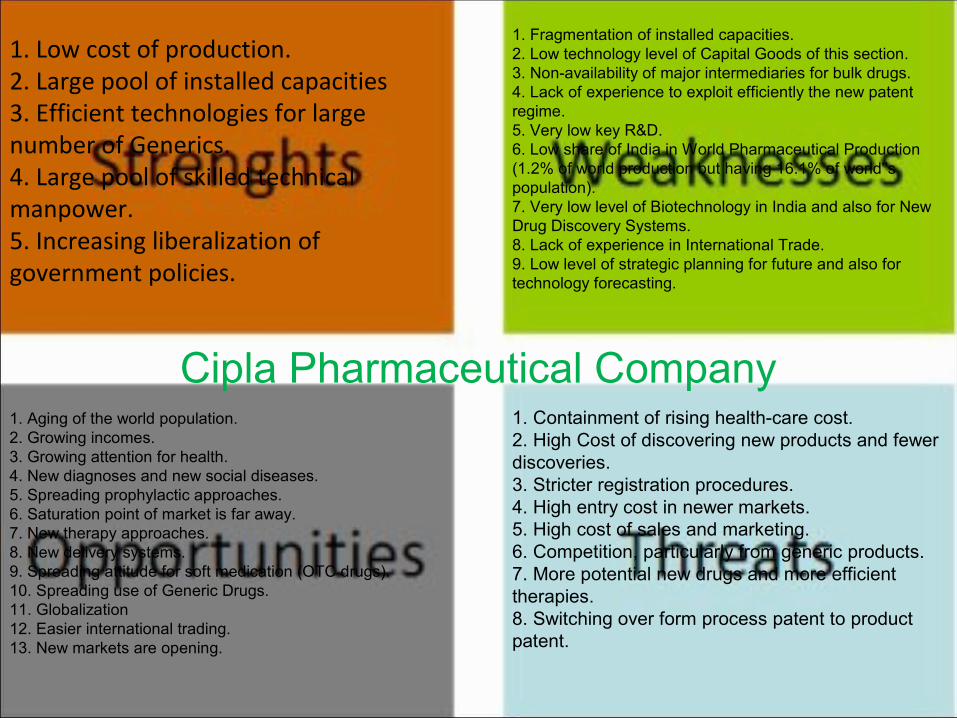
1. Low cost of production.2. Large pool of installed capacities3. Efficient technologies for large number of Generics.4. Large pool of skilled technical manpower.5. Increasing liberalization of government policies.
1. Fragmentation of installed capacities.2. Low technology level of Capital Goods of this section.3. Non-availability of major intermediaries for bulk drugs.4. Lack of experience to exploit efficiently the new patent regime.5. Very low key R&D.6. Low share of India in World Pharmaceutical Production (1.2% of world production but having 16.1% of world''s population).7. Very low level of Biotechnology in India and also for New Drug Discovery Systems.8. Lack of experience in International Trade.9. Low level of strategic planning for future and also for technology forecasting.
1. Containment of rising health-care cost.2. High Cost of discovering new products and fewer discoveries.3. Stricter registration procedures.4. High entry cost in newer markets.5. High cost of sales and marketing.6. Competition, particularly from generic products.7. More potential new drugs and more efficient therapies.8. Switching over form process patent to product patent.
1. Aging of the world population.2. Growing incomes.3. Growing attention for health.4. New diagnoses and new social diseases.5. Spreading prophylactic approaches.6. Saturation point of market is far away.7. New therapy approaches.8. New delivery systems.9. Spreading attitude for soft medication (OTC drugs).10. Spreading use of Generic Drugs.11. Globalization12. Easier international trading.13. New markets are opening.
Cipla Pharmaceutical Company

Porters Forces Analysis For CIPLA
Industry Competition•Largest Player with revenues of 25000 Cr• Comparatively other players are minor • Growth of almost 27%(2008-09)• Large amount of Capital available
Barriers to Entry•Formidable influence ,since large capital available•Discourages other firms through money power
Power Of Buyers•Weak power since end user not influencing factor•Strong brand and volume based presence may influence doctors
Power of Suppliers•Weak power of suppliersSwitching cost low, especially due to large volume based benefits•68% of total expenses spent on raw material
Threat of Substitutes•Weak power , since medicines used very widely with high efficacy.•Have their specific bouquet of manufactured drugs, without any threat from others


Brief Company History• Dr. Reddy's, founded in 1984 by Dr. K. Anji Reddy, has become India’s second biggest
pharmaceutical company.
• Dr. Anji Reddy had worked in the publicly-owned Indian Drugs and Pharmaceuticals Ltd. Reddy's manufactures and markets a wide range of pharmaceuticals in India and overseas. The company has more than 190 medications ready for patients to take, 60 active pharmaceutical ingredients for drug manufacture, diagnostic kits, critical care and biotechnology products.
• Dr. Reddy’s began as a supplier to Indian drug manufacturers, but it soon started exporting to other less-regulated markets that had the advantage of not having to spend time and money on a manufacturing plant that that would gain approval from a drug licensing body such as theU.S. Food and Drug Administration (FDA).
• Much of Reddy’s early success came in those unregulated markets, where process patents – not product patents – are recognized. With that money in the bank, the company could reverse-engineer patented drugs from more developed countries and sell them royalty-free in India and Russia.
• By the early 1990s, the expanded scale and profitability from these unregulated markets enabled the company to begin focusing on getting approval from drug regulators for their formulations and bulk drug manufacturing plants in more-developed economies. This allowed their movement into regulated markets such as the US and Europe.
• By 2007, Dr. Reddy’s had six FDA-plants producing active pharmaceutical ingredients in India and seven FDA-inspected and ISO 9001 (quality) and ISO 14001 (environmental management) certified plants making patient-ready medications – five of them in India and two in the UK.

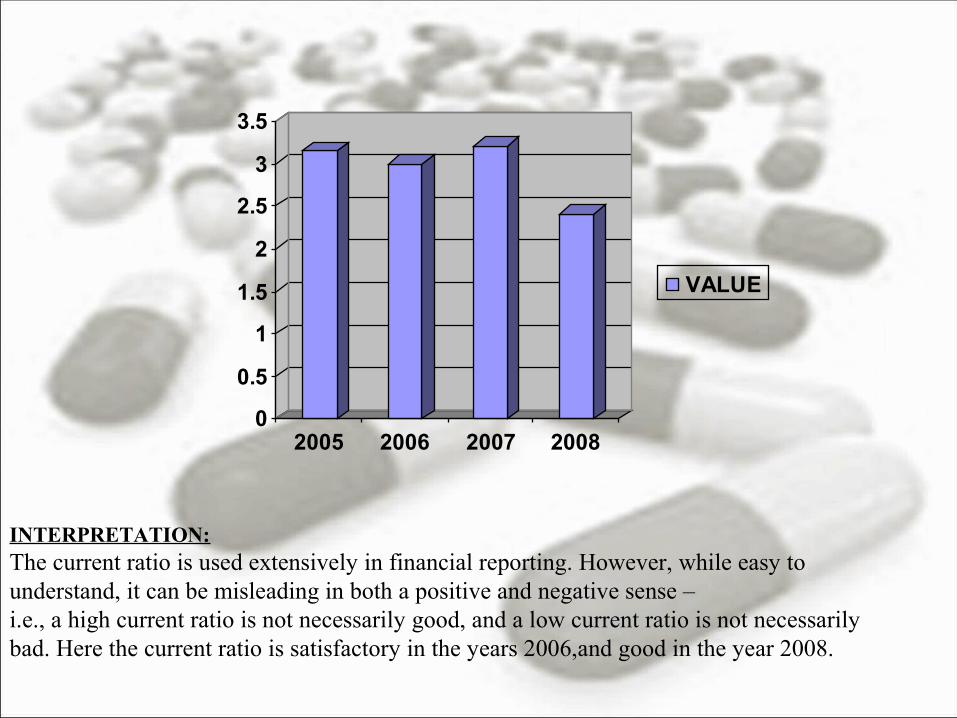
Dr. Reddy’s Ratio Analysis
Current Ratio
The current ratios of the consecutive four years are:
Year Value
2005 3.15
2006 3.00
2007 3.21
2008 2.41
0
0.5
1
1.5
2
2.5
3
3.5
2005 2006 2007 2008
VALUE
INTERPRETATION:The current ratio is used extensively in financial reporting. However, while easy to understand, it can be misleading in both a positive and negative sense – i.e., a high current ratio is not necessarily good, and a low current ratio is not necessarily bad. Here the current ratio is satisfactory in the years 2006,and good in the year 2008.

Year Value
2005 2.59
2006 2.43
2007 2.81
2008 1.94
Quick Ratio
The Quick Ratios of consecutive four years are:

0
0.5
1
1.5
2
2.5
3
2005 2006 2007 2008
value
INTERPRETATION:A higher ratio means a more liquid current position. It means the liquid current position of the company is good in 2007 (2.81) and satisfactory in 2005,2006,2008. Current yr ratio is very bad when it compared to the previous year.

Year value
2005 4.56
2006 10.26
2007 31.55
2008 12.58
Gross Profit Ratio
The Gross Profit Ratios of consecutive four years are:

0
5
10
15
20
25
30
35
2005 2006 2007 2008
values
INTERPRETATION:This ratio indicates the degree to which the selling price of good per unit or in whole may decline without resulting in losses from operations to the firm. when we observe the above ratios there is an increase in the profit margin from 2005-2007,but a vast decline in gross profit in the year 2008(12.58).

Year Values
2005 4.06
2006 10.08
2007 29.01
2008 13.57
Net Profit Ratio
The Net Profit Ratio of consecutive four years:

0
5
10
15
20
25
30
2005 2006 2007 2008
values
INTERPRETION:An increase in the ratio over the previous year indicates improvement in the operational efficiency of the business. The net profit ratio in 2007(29.01) is good and 2008(13.57) is comparatively good when compared to 2005 and 2006.

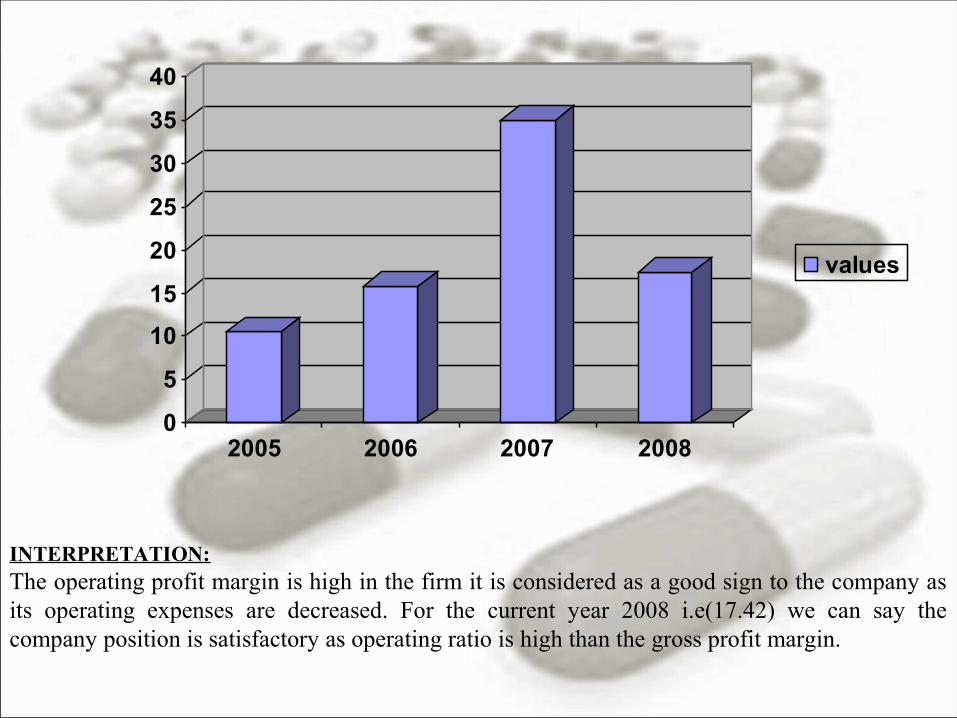
Year Value
2005 10.53
2006 15.82
2007 35.08
2008 17.42
Operating Profit Ratio
The Operating Profit Ratios for the consecutive four years are:
0
5
10
15
20
25
30
35
40
2005 2006 2007 2008
values
INTERPRETATION:The operating profit margin is high in the firm it is considered as a good sign to the company as its operating expenses are decreased. For the current year 2008 i.e(17.42) we can say the company position is satisfactory as operating ratio is high than the gross profit margin.

Year Value
2005 3.15
2006 9.33
2007 26.90
2008 9.87
Equity shares
The returns on equity shares for the consecutive four years are:

0
5
10
15
20
25
30
2005 2006 2007 2008
values
INTERPRETATION:
Generally, the higher this ratio, the more risky a creditor will perceive its exposure in your business, making it correspondingly harder to obtain credit. It is the return on the amount invested in the company in the form of equity share capital. The higher is the return will be more interest for the investor to invest in the company. Hence the current year return on equity(9.87) is satisfactory but not good when compared to the previous year

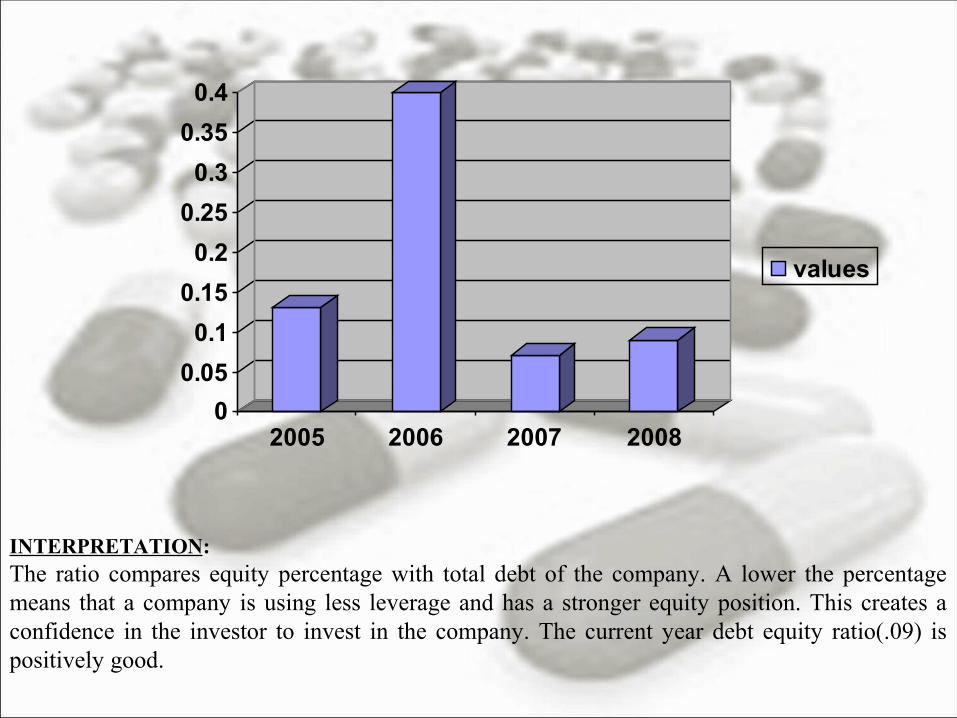
Year Value
2005 .13
2006 .40
2007 .07
2008 .09
Debt Equity Ratio
The Debt Equity Ratios of the four consecutive years are:
0
0.05
0.1
0.15
0.2
0.25
0.3
0.35
0.4
2005 2006 2007 2008
values
INTERPRETATION:The ratio compares equity percentage with total debt of the company. A lower the percentage means that a company is using less leverage and has a stronger equity position. This creates a confidence in the investor to invest in the company. The current year debt equity ratio(.09) is positively good.
CONCLUSION FOR RATIO ANALYSIS:
After the examination of the above ratios given above makes it clear that the overall performance of the company is much poorer in the current year as compared to previous year.

Wholly owned subsidiaries in US and EuropeJoint ventures in China and South AfricaMarkets pharmaceutical products in 115 countriesPartnerships with global pharmaceutical companies like Novartis, NOVO Nordisk, etc.Strong product portfolioManufacture and market over 250 medicines targeting a wide range of therapiesWide range of anti-cancer drugs developedOver 100 APIs developedSix New Chemical EntitiesLow cost base
High amount of revenues from overseasIndia - a rich source of Active Pharmaceutical Ingredients (APIs), hence major source of revenue is exports of APIs. May loose out to western world, especially Europe, where currency is much more stable than the Indian RupeeOver-reliance on partnershipsIn order to compete effectively in global markets, strategic partnerships required to develop products.Lack of resources similar to US and Europe based competitors to develop a drug to marketing stageGeneric drugs smallest focusSmallest portion of revenues from generics at around 20%Lack of patent legislation in India harms sales of its products
Take a drug all the way to marketTake a molecule from its pipeline all the way to the market place cost-effectively marketBuy back of the integrated drug development company from ICICI Ventures and CitigroupDomestic Generic drugs marketIn another 4-6 years, many product patents obtained after the 2004 legislation will go off providing an opportunity to the company increase its domestic footprint in Generics
High amount of revenues from overseasIndia - a rich source of Active Pharmaceutical Ingredients (APIs), hence major source of revenue is exports of APIs. May loose out to western world, especially Europe, where currency is much more stable than the Indian RupeeOver-reliance on partnershipsIn order to compete effectively in global markets, strategic partnerships required to develop products.Lack of resources similar to US and Europe based competitors to develop a drug to marketing stageGeneric drugs smallest focusSmallest portion of revenues from generics at around 20%Lack of patent legislation in India harms sales of its products
Dr. Reddy’s Pharmaceutical Company