review of the local property tax (lpt) -...
TRANSCRIPT

compressed
REVIEW OF THE LOCAL PROPERTY TAX (LPT) Don Thornhill July 2015

Review of the Local Property Tax
3
Contents Foreword ............................................................................................................................................. 5
Chapter 1: Executive Summary and Recommendations ..................................................................... 6
Recommendations .............................................................................................................................. 8
Chapter 2: Background ...................................................................................................................... 11
Policy significance of the LPT ............................................................................................................ 11
Property taxes and employment ....................................................................................................... 11
LPT and strengthening local government and local democracy ....................................................... 12
LPT and taxation equity ..................................................................................................................... 12
Chapter 3: Overview of the Local Property Tax ............................................................................... 13
Chapter 4: Analysis of the LPT yield .................................................................................................. 15
Nationally and by local authority area; recommendations in respect of exemptions, deferrals and
yield management. ............................................................................................................................ 15
LPT Collection and Number of Properties Returned by Tax Year...................................................... 15
Properties Returned and LPT collected by Local Authority and Valuation Band (2014)................... 15
Exemptions ........................................................................................................................................ 15
Deferrals ............................................................................................................................................ 16
Compliance ........................................................................................................................................ 17
Processing of returns by Revenue ..................................................................................................... 20
Compliance rates by local authority area.......................................................................................... 21
The Equalisation Fund ....................................................................................................................... 21
Management of the Yield .................................................................................................................. 21
Tables ................................................................................................................................................ 22
Chapter 5: Implications of recent property price developments and related issues ...................... 28
Options for change ............................................................................................................................ 31
Option 1 Proceed with revaluations in November 2016 as provided for in current legislation. ...... 33
Option 2: Freeze valuations at 2013 levels. ...................................................................................... 34
Option 3: Determine the mid-point of the 2013 and 2016 valuations as the taxable value. .......... 38
Option 4: Phase valuation adjustments over a three year period. .................................................. 39
Option 5: Widen valuation bands while proceeding with a revaluation in November 2016 ............ 40
Option 6: Proceed with the revaluation in November 2016 but legislate to set a limit on valuation
band movements............................................................................................................................... 42
Option 7: Allow relief for mortgages ................................................................................................. 42
Option 8 (a): Revaluation in November 2016; reduce central tax rate; retain local authority
discretion ........................................................................................................................................... 44
Option 8 (b): Revaluation in November 2016; determination of tax rate in each local authority
area; retain local authority discretion to adjust rates upwards by a factor of 15 percent. .............. 45
Overall conclusion and recommendation: ........................................................................................ 47

Review of the Local Property Tax
4
Role of local authorities .................................................................................................................... 48
The Equalisation Fund ....................................................................................................................... 48
Nomenclature change ....................................................................................................................... 48
Chapter 6: Other Issues ..................................................................................................................... 49
Properties damaged by pyrite ........................................................................................................... 49
Properties occupied by individuals who are disabled ........................................................................ 50
Deductibility of LPT for income or corporation tax purposes by landlords of rental properties ...... 51
Chapter 7: Review of the Local Property Tax – Economic Analysis .................................................. 52
Property Price Developments and Data ............................................................................................ 53
Property Price Register ...................................................................................................................... 54
Implications of Price Developments for Taxpayer Liabilities ............................................................ 57
Estimated Changes in LPT Liability by Valuation Band ...................................................................... 64
Considerations Regarding Approach Used ........................................................................................ 64
Appendices ........................................................................................................................................ 65
Appendix 1: Terms of Reference ....................................................................................................... 65
Appendix 2: List of written submissions received ............................................................................. 66
Appendix 3: Commentary and analysis on submissions received .................................................... 68
Appendix 4: LPT rates applied in each local authority area from 1 January 2015 ........................... 69
Appendix 5: Illustrative changes in property tax liabilities arising from a 41 per cent increase in value ........................................................................................................................................................... 70
Appendix 6:........................................................................................................................................ 73
Transition Matrices ........................................................................................................................... 73

Review of the Local Property Tax
5
Review of the Local Property Tax (LPT)
Foreword I was asked by the Minister for Finance to conduct a review to consider the operation of the Local Property Tax (LPT), and, in particular, any impacts on LPT liabilities due to property price developments. The review was to examine the operation of the LPT and to make recommendations in relation to issues that arose from the review. A copy of the terms of reference for the review is attached as Appendix 1.
The review was informed by the outcomes of a public consultation initiated by the Minister on March 20th 2015. Fifty one written submissions were received. I would like to thank all those organisations and individuals who made submissions.
Copies of all submissions made will be published on the Department of Finance’s website following publication of this report.
A full list of all respondents to the public consultation is contained in Appendix 2. A summary commentary and response to the proposals made in these submissions is outlined in Appendix 3.
In carrying out this review I received enthusiastic support from a working group of officials from the Department of Finance and from the Office of the Revenue Commissioners led by Mr Gary Tobin, Assistant Secretary, Tax Policy Division in the Department. Mr Tobin and the members of this team, Mr Des O’Leary, Mr Kevin Nolan, Ms Anita Kelly, Ms Martina Shaughnessy, Mr Brendan O’Connor and Mr Donal Lynch from the Department of Finance and Ms Jean Kennedy and Dr Keith Walsh from the Office of the Revenue Commissioners, provided me with essential and invaluable support including the provision of data, economic analysis, detailed briefing and discussions on operational and legislative aspects of the LPT and discussion of policy options. In particular, the Economics Division of the Department of Finance carried out an economic analysis of the impact of recent property price developments on LPT yield in order to assist with this review. This important analysis is included as Chapter 7 of this report.
I am very impressed by the knowledge and expertise of the officials who worked with me. I am also indebted to them for their commitment to this project and for the openness of their engagements with me. It was an unqualified pleasure to work with officials of such dedication and expertise.
I would also like to acknowledge the cooperation and inputs received from other officials in the Department of Finance, the Office of the Revenue Commissioners, the Departments of the Environment, Community and Local Government and Public Expenditure and Reform as well as the Pyrite Resolution Board.
I would like to thank the Minister for Finance, Mr Michael Noonan TD, for inviting me to undertake this review. The LPT was a major policy initiative. Its implementation has been hugely successful. The design of the legislative framework for the tax was an important contributor to the successful outcome.
In particular the successful response of the Office of the Revenue Commissioners and its staff to the challenging management task of setting up new tax assessment and collection arrangements affecting most taxpayers in the country has been remarkable.
Nonetheless, a review was opportune in order to take account of the experiences to date as well as to respond to the implications of developments in the property market.
Don Thornhill

Review of the Local Property Tax
6
Chapter 1: Executive Summary and Recommendations LPT Review 2015
1.1 The Minister for Finance commissioned this Review to consider the operation of the Local Property Tax (LPT), and in particular, any impacts on LPT liabilities due to recent property price developments. The review was informed by the outcomes of a public consultation initiated by the Minister on March 20th 2015. Fifty one written submissions were received.
1.2 The Programme of Financial Support for Ireland agreed with the EU and the IMF contained a commitment to introduce a property tax. The Government decided to introduce a Household Charge in 2012 as an interim measure in light of the complex issues involved in introducing a full property tax.
1.3 The introduction of the LPT in 2013 was the largest extension of self-assessment in the history of the
State, with over 1.3 million taxpayers obliged to file LPT Returns and pay the tax in respect of around 1.9 million properties. The first valuation date was 1 May 2013. The valuations declared for that date determined tax liabilities for 2013 (half year), 2014, 2015 and 2016. The next valuation date is due on 1 November 2016 which will determine tax liabilities for 2017, 2018 and 2019.
1.4 A recurring tax on residential properties is much more employment and enterprise “friendly” than
taxes on income. This is an important consideration in Ireland. Creating the conditions for full employment continues to be a priority policy challenge. High rates of income tax, particularly high marginal rates, act as a disincentive to effort and enterprise and deter some persons from taking up work. When income tax rates are high, workers or business owners face disincentives arising from declines in net benefits to them from additional individual effort or investment. In contrast a property tax liability is a fixed charge in any fiscal year and does not influence decisions to seek a job or apply for promotion, to work overtime or face additional business risks through additional investment and business expansion.
1.5 The LPT is producing a stable revenue yield for local authorities – although both yields (and tax rates)
are modest internationally. The charging structure for LPT is progressive. The basic rate of 0.18 percent applies up to property values of €1m with a higher rate of 0.25 percent applying on the portion of value above the €1m threshold. In addition to the progressive rate structure, and to the extent that better off people tend to own more valuable properties, the LPT is a progressive tax particularly over the life cycles of tax payers.
1.6 From 1 January 2015 local authorities have had discretion to vary the LPT rates by up to 15 percent. A
number of local authorities exercised this option. 1.7 By end 2015 and since its inception LPT is expected to have contributed over €1 billion to the funding
of local authorities. 1.8 The compliance rates for LPT for the years 2013, 2014 and 2015 are currently estimated by the Office
of the Revenue Commissioners at 97 percent, 97 percent and 96 percent of properties respectively. The numbers of compliant properties are estimated at 1.87m, 1.87m and 1.86m for 2013, 2014 and 2015 respectively. These are hugely impressive outcomes. Prior to the LPT there was not a comprehensive data base of residential properties in the State. The outcomes reflect positively on the professionalism of Revenue management and officials in respect of the strategic and operational management of the tax, public confidence in the Office of the Revenue Commissioners and the commitment of the great majority of tax payers to meeting their tax obligations.

Review of the Local Property Tax
7
1.9 Over the period May 2013 to May 2015, property prices increased nationally by 26 percent, according to the Central Statistics Office’s Residential Property Price Index. This overall increase masks the variation in increases across regions with properties in Dublin increasing by approximately 41 percent, with properties outside of Dublin increasing by 14 percent. Similarly there were substantial differences between the house and apartment indices nationally.
1.10 As a contribution to the Review, the Economics Division of the Department of Finance prepared
estimates of the potential implications for taxpayer liabilities of price developments as a result of price increases since May 2013. This paper, prepared by the Economics Division, is included in this report (Chapter 7).
1.11 The data sources used for the purpose of this exercise included CSO property price indices, aggregate data available from the Revenue Commissioners on the numbers of properties in each band and data on residential property price transactions from the Residential Property Price Register published by the Property Services Regulatory Authority. Using the methodology described in the paper the authors conclude that the analysis indicates large variation across the country in possible changes to tax liabilities. They estimate that:
48 percent of properties would remain in their original band and thus not generate any increase in tax liability,
35 percent of properties would have moved by one band, and thus generate an increased annual liability of €90 (assuming a tax rate of 0.18 )
10 percent of properties would have moved by two bands, generating an increased annual tax liability of €180 (at a tax rate of 0.18%) ; and,
The remainder [6 percent] would have moved by between three and six valuation bands – generating increased tax liabilities of between €270 and €540.
1.12 This illustrates the hypothetical situation that if a revaluation were to occur now there would be significant increases in tax liabilities for some taxpayers, with the bigger band jumps occurring for properties valued in the higher valuation bands in May 2013. The analysis also indicates a wide degree of regional variation in band changes with the largest band increases, and as a consequence tax liability increases under current legislation, mainly occurring in the Dublin area.
1.13 It is estimated that, if the price developments that had occurred between May 2013 and May 2015 had been reflected in LPT liabilities, the yield for tax year 2014 would have increased from around €480m to €620m – an increase of over 29 per cent. The same figures for tax year 2015, which includes the Local Adjustment Factor, is that the property tax yield would be €560 million after revaluation as compared to €435 million before.
1.14 The commissioning of this Review reflected concern about the impact on potential LPT liabilities
caused by significant property price developments. The desirability of achieving “relative stability”, both over the short and longer terms, in LPT payments of liable persons reflects a concern that, in the interests of fairness, tax liabilities and yields should not change significantly and unpredictably, and without reference to broad economic conditions (particularly changes in prices and incomes) or to policy changes. The projected tax increases arising from price changes of residential properties over the past few years and discussed in the previous paragraphs could not be regarded as “relatively stable”. On the other hand “relative stability” does not mean that tax liabilities for individuals or tax revenue yields for any tax should be frozen or fixed (in real or nominal prices) going forward. This would remove any flexibility for adjusting tax regimes to take account of economic circumstances or changing policy priorities and needs.

Review of the Local Property Tax
8
1.15 As part of the Review a wide variety of options for change to the Local Property Tax to limit the impact of recent large property price increases were considered. These included:
Proceed with revaluations in November 2016 as provided for in current legislation.
Freeze valuations at 2013 levels.
Determine the mid-point of the 2013 and 2016 valuations as the taxable value.
Phase valuation adjustments over a three year period.
Widen valuation bands while proceeding with a revaluation in November 2016
Proceed with the revaluation in November 2016 but legislate to set a limit on valuation band movements
Allow relief for mortgages
Proceed with the revaluation but legislate to allow for rate changes at (a) national level or (b) at the level of each local authority area.
1.16 Each of these options are considered in detail in the Report. A simple decision to freeze valuations at 2013 levels without accompanying policy and legal changes would be inequitable and open to legal challenges and is not recommended.
Recommendations The thirteen Recommendations arising from the Review are summarized as follows:
Recommendation 1: The exemption for residential properties purchased from builders/developers or unsold by them should not be renewed when the next revaluation takes place. Neither should the exemption for properties on unfinished housing estates and the exemption for ‘first-time buyers’. Recommendation 2: The existing deferral provisions should be continued and be reviewed and revised at frequent intervals in line with movements in the CPI so as to maintain their real value. Recommendation 3: The period of relief for income-stressed owner-occupiers who have outstanding mortgages should be extended beyond the end of 2017. Recommendation 4: For owner-occupiers over 80 years of age or those with stated certified long term illnesses and disabilities who are also living alone, it is recommended that consideration be given to raising the eligible income limit for deferrals to €20,000. Recommendation 5: It is recommended that the Revenue ‘estimate amount’ be treated, instead, as a ‘default’ self-assessment for LPT purposes. This approach is recommended on the understanding that it would be made clear to taxpayers that they would have an obligation to submit a return form if the Revenue “estimate amount” did not fall into the same valuation band as the liable persons self-assessment of the value of the property. Recommendation 6: It is recommended in order to simplify the current Government accounting system that direct payment of LPT receipts should be made by Revenue to the Local Government Fund rather than the current more complicated system.

Review of the Local Property Tax
9
Recommendation 7: A revised system of assessing local property tax liabilities is proposed. A minimum yield which must be raised by each local authority would be set centrally by Government as part of the process for setting the national budget. The Department of Finance and Revenue, using the LPT tax base data and other relevant information, would estimate the property tax rates to be applied in each local authority area in order to raise this minimum yield. Local authorities on receipt of this information could adjust this rate upwards by a factor of up to 15 percent. It is envisaged that the minimum yield for LPT could be set with reference to the historic and current amounts raised in each local authority area so that property tax bills should remain at stable levels.
It would be desirable that the technical work entailed in developing and putting in place the processes entailed in this process should not be done in a compressed time scale. It will be necessary to align the new processes with the arrangements for the settlement of local authority budgets and the development and testing of the methodology for updating the value of the property tax bases in each local authority area. To achieve this it may be necessary to delay the next revaluation from November 2016 to November 2018 or November 2019. Any legislative changes to defer the valuation date should be accompanied by the legislative changes necessary to reform the system as outlined above.
Acceptance of this recommendation could be accompanied by a changeover to a five, rather than three, year valuation period. This would reduce the compliance requirements for tax payers and reduce administrative costs for Revenue. However, a five year cycle could also raise concerns among the public about “valuation shocks” as the new valuation dates approach. Consideration might be given as to weighing up the pros and cons of these two approaches.
Recommendation 8: Local authorities should be more engaged in supporting the Office of the Revenue Commissioners in the LPT process and also to provide the general public and individual households with programmatic and other useful information on how they spend the public funds available to them and the proportionate contribution made by the LPT.
Recommendation 9: Over the medium term, the Government should consider moving to a system whereby local authorities retain 100 percent of the LPT revenues raised in their areas. Authorities with weaker tax bases would consequently need to receive supplementary Exchequer funding.
Recommendation 10: In line with the retention of 100 percent of LPT revenues by individual local authorities, LPT should be re-designated as the Local Council Tax (LCT) to emphasise that it is a tax raised to pay for local council services.
Recommendation 11: regarding properties damaged by pyrite, it is recommended that the exemption
continue in place but it be restricted to those properties that have been certified as having a damage
rating of ‘2’ or ‘1 with progression’; that pyrite damage continue to be proved by inspection and testing
by a competent person in accordance with a standard published by the National Standards Authority
of Ireland (NSAI); where liable persons elect not to incur the costs of testing they have the option of
submitting by way of self-assessment a value to Revenue for the property which in their view reflects
its current market value; where the Pyrite Resolution Board (PRB) is prepared to remediate a
property without carrying out laboratory testing, Revenue accept a confirmation of remediation from
the PRB in lieu of the NSAI certificate: and, where a party such as a guarantee company or a
builder/developer remediates a property or compensates the property owner in lieu of remediation,
Revenue accept confirmation of this from the party in lieu of the NSAI certificate.

Review of the Local Property Tax
10
Recommendation 12: reliefs for properties occupied by persons with disabilities - The changes
currently being administered by the Revenue under their care and management provisions should be
covered by amending legislation, as, it is understood, is the Minister’s intention; Additionally, with
regard to the relief by way of reduced chargeable value, increase the threshold to the lesser of the
increase in chargeable value or €50,000 which would ensure everyone who meets the qualifying
conditions could benefit from the relief by way of reduced chargeable value up to a maximum
reduction of €90 (one bandwidth). The relief would still only apply where the adaptations increase the
chargeable value of the property.
Recommendation 13: LPT payments should not be allowed as a deduction to landlords against income
or corporation tax.

Review of the Local Property Tax
11
Chapter 2: Background
2.1 Ireland’s EU-IMF Programme of Financial Support included a commitment to introduce a residential property tax. The Government decided to introduce a Household Charge in 2012 as an interim measure in light of the complex issues involved in introducing a full property tax1.
2.2 In February 2012, the Minister for the Environment, Community and Local Government established an
Inter-Departmental Group2 to consider the structures and modalities for a full property tax. The
Group’s terms of reference were to consider the design of an equitable property tax, informed by
previous work and international experience to replace the Household Charge.
2.3 The terms of reference of the Inter-Departmental Group provided that the property tax was to:
Meet the immediate financial requirements of the EU/ECB/IMF programme;
Provide a stable funding base for the local authority sector in the medium and longer terms, incorporating an appropriate element of local authority responsibility subject to any national parameters;
Be collected centrally by the most cost-efficient and effective means;
Facilitate easy and/or phased payments by households;
Be easily determined (e.g. on a self-assessment basis), and having regard to the information currently available (or to be made available through registrations for the Household Charge) on residential property and/or house ownership details; and
Ensure the maximum degree of fairness between and across both urban and rural areas.
2.4 The Inter-Departmental Group made 18 key recommendations dealing with both policy and the
administration of the tax3. The Government accepted the majority of the recommendations. These formed the basis of the Local Property Tax (LPT).
2.5 Following the enactment of the Finance (Local Property Tax) Act 2012 and the Finance (Local Property
Tax) (Amendment) Act 2013, the Local Property Tax (LPT) became payable from 1 July 2013.
Policy significance of the LPT 2.6 The Foreword of the 2013 Inter-Departmental Group observed that the importance of the LPT
transcended the requirements of the EU/ECB/IMF Programme. According to the Group “Establishing a local property tax addresses three long standing and important challenges in Irish public policy, the broadening of the tax base to include residential properties, the provision of a stable funding base for local government and the strengthening of democracy at local level”. These three challenges remain important.
Property taxes and employment 2.7 A recurring tax on residential properties is much more employment and enterprise “friendly” than
taxes on income. This is an important consideration in Ireland. Creating the conditions for full employment continues to be a priority policy challenge. High rates of income tax, particularly high marginal rates, act as a disincentive to effort and enterprise and deter some persons from taking up work or applying for promotion. When income tax rates are high, workers or business owners face
1 The administration and collection of Household Charge arrears was transferred to the Office of the Revenue Commissioners from July 2013 onwards. 2 I was appointed as Chair of that Group. 3http://www.environ.ie/en/Publications/LocalGovernment/Administration/FileDownLoad,31669,en.Pdf. Page 6

Review of the Local Property Tax
12
disincentives arising from declines in net benefits to them from additional individual effort or investment. In contrast a property tax liability is a fixed charge in any fiscal year and does not negatively influence decisions to seek a job, to apply for promotion, to work overtime or to expand a business.
LPT and strengthening local government and local democracy 2.8 The LPT is producing a stable revenue yield – although both yields (and tax rates) are modest
internationally4. There is scope to use the opportunity presented by the LPT to strengthen local
government and accountability at local level. These opportunities will be discussed later in the report.
LPT and taxation equity 2.9 There are two dimensions to tax equity. The first is the principle of horizontal equity. This principle
requires that tax payers in comparable situations should pay comparable amounts of tax. The
desirability of applying this principle in tax design is largely uncontested. It is a major influence in this
review.
2.10 The second dimension can be described as vertical equity. The essential concept informing vertical
equity is the view that those who are better off should contribute more than those who are not. Flat
rate taxes can meet this criterion but those who favour using taxes as an instrument for promoting
vertical equity generally advocate that tax structures should be progressive i.e. with higher rates of
direct5 taxes applying to higher values or incomes. Opinions differ as to the desirable extent of
progressivity of individual direct taxes and their impact on gross earnings, disposable incomes and
incentives for work. A further dimension is the view that from an equity and income distribution
perspective the impact of individual taxes (and social transfers) is less important than the overall
impact of the taxes and benefits which go to make up tax and transfer systems6.
2.11 The charging structure for LPT is progressive. The basic rate of 0.18 percent applies up to property
values of €1m with a higher rate of 0.25 percent applying on the portion of value above the €1m
threshold. In addition to the progressive rate structure, and to the extent that better off people tend
to own more valuable properties, the LPT is a progressive tax particularly over the life cycles of tax
payers.
4 Domestic rates account for approximately 4 percent of total tax revenues in Northern Ireland. In contrast the proportion of the total tax yield accounted for by the LPT is 1.2 percent. The average LPT tax charge in the State was €257. The average “rates” charge in Northern Ireland for 2014/15 was £825(€1,181). In Great Britain average Council Tax charges for 2014/15 were £1,051 (€1,505) in England, £1,115 (€1,597) in Wales and £989 (€1,416) in Scotland. (Sterling/Euro exchange rates as at 20.07.2015). 5 Such as taxes on incomes and profits 6 Commission on Taxation, 2009, p 39, Government Publications Sales Office. www.commissionontaxation.ie ; “Dimensions of Tax Design” p 33. The Mirrlees Review, Institute of Fiscal Studies, London 2010. www.ifs.org.uk/mirrleesReview

Review of the Local Property Tax
13
Chapter 3: Overview of the Local Property Tax
3.1 The revenues from the LPT support the provision of local services by local authorities which are responsible for a range of services including, among others, housing, recreational amenities such as public parks, libraries, open spaces and other leisure amenities, planning and development, fire and emergency services, maintenance and cleaning of streets, and street lighting. Revenues from the LPT are remitted to local authorities. Revenue does not receive a fee for collecting and remitting LPT.
3.2 The LPT is an annual self-assessed tax charged on the market value of almost all residential properties in the State7. The liable persons, who are legally responsible for payment of the tax, are, for the most part, the owners of residential properties, including rental properties. In the case of life tenancies or long leases over 20 years, the tenants are the liable persons.
3.3 Revenue is responsible for all administration, collection, enforcement and audit aspects of LPT. Revenue offers a range of payment methods, including one single payment or phased payments over the year, such as deductions at source from wages and direct debits. Compliance is supported by a range of enforcement and collection arrangements including “mandatory deduction at source”, i.e. mandatory deduction of LPT from income streams of LPT liable persons who do not comply with the self-assessment regime for the tax.
3.4 Residential property owners and others (such as long term and life tenants) who are liable for payment
of LPT (including those intending to apply for deferral of payments) self-assess and declare the market value of their property to Revenue. For assessment purposes, property values are structured according to valuation bands of €50,000 in width, with an initial band applying to properties valued between €0 and €100,000. Tax liabilities are calculated by applying the tax rate (0.18 percent) to the mid-point of the band. Houses valued over €1m are chargeable to LPT on their estimated actual market value (at 0.18 percent on €1m and at 0.25 percent on the portion of the value over €1m) with no banding applied.
3.5 The introduction of LPT in 2013 was the largest extension of self-assessment in the history of the State,
with over 1.3 million taxpayers obliged to file LPT Returns and pay the tax in respect of around 1.9 million properties. The first valuation date was 1 May 2013. The valuations declared for that date determined tax liabilities for 2013 (half year), 2014, 2015 and 2016. Under current legislation, the next scheduled valuation date 1 November 2016 is intended to determine tax liabilities for 2017, 2018 and 2019.
3.6 In 2013 Revenue prepared valuation guidance which, taken together with the owner’s own knowledge of the property was designed to assist in assessing values. Revenue indicated that where the available guidance was used in an honest manner, the property valuation made by a property owner would be accepted. If Revenue has reason to believe that a valuation amount does not reflect the market value of a property, they may raise an assessment for a different amount. This assessment can be appealed by a property owner who doesn’t agree with the Revenue valuation. In addition, property owners were given opportunities, after returns were filed, to self-correct their valuations without penalty.
3.7 From 1 January 2015 local authorities have had discretion to vary the LPT rates by up to +/- 15 percent.
A number of local authorities exercised this option (see Appendix 4).
7 See table 4.5 for a list of the categories of exempt properties.

Review of the Local Property Tax
14
Deferrals 3.8 Voluntary deferral arrangements which allow for postponement of payment of LPT are designed to
provide relief to low income persons. If the taxpayer elects to defer payment the LPT remains due and
becomes a charge on the property. The deferral option is available in the following circumstances:
Where the annual gross income of the liable person does not exceed €15,000 (single) and €25,000 (couple). Marginal relief applies for owner-occupiers whose income is not more than €10,000 above the income limits to permit deferrals of up to 50 percent of the LPT liability.
For income-stressed owner-occupiers who have an outstanding mortgage, an adjusted gross income limit applies – where gross income less 80 percent of mortgage interest falls below €15,000 (single) and €25,000 (couple). The possibility of electing for this particular option will be available until the end of 2017 (when mortgage interest relief for income tax will also end). Marginal relief applies for owner-occupiers whose adjusted income is not more than €10,000 above the adjusted income limits to permit deferrals of up to 50 percent of LPT liability.
Where a liable person who was the sole owner of a property dies, that person’s personal representative 8may be eligible for a deferral for a maximum period of 3 years commencing with the date of death.
Where a person enters into a formal Debt Settlement Arrangement or a Personal Insolvency Arrangement, a deferral may apply for the period for which the arrangement is in place.
Where a person suffers an unexpected and unavoidable significant financial loss or expense, as a result of which he or she is unable to pay the LPT without causing excessive financial hardship. This category of deferral requires advance Revenue approval.
3.9 Interest is charged on deferred amounts but at a lower rate (i.e. 4 percent per annum) than the rate charged in default cases (i.e. 8 percent per annum). The deferred amount, including interest, is a charge on the property. Deferred LPT and interest have to be paid on the sale or transfer of the property9.
8 Executor or administrator of the estate 9 A person or couple on low incomes who receive either by way of inheritance or gift a residential property in relation to which LPT has already been deferred may in turn qualify for deferral or part deferral of the LPT charges on the property depending on their incomes.

Review of the Local Property Tax
15
Chapter 4: Analysis of the LPT yield
Nationally and by local authority area; recommendations in respect of exemptions, deferrals and yield management.
LPT Collection and Number of Properties Returned10 by Tax Year 4.1 Table 4.1 at the end of this chapter shows the collection for each of the three years to date in which
LPT has been in operation (half year basis in 2013). By end 2015 and since its inception LPT is expected
to have contributed over €1 billion to the funding of local authorities.
Properties Returned and LPT collected by Local Authority and Valuation Band (2014) 4.2 The tables at the end of this chapter show for 2014 (the first (and, to date, the last) full year of the tax)
the numbers of properties returned to the Revenue and the amounts of LPT revenues collected
respectively. These are disaggregated by valuation band and by local authority in which the properties
are located.
4.3 Tables 4.2, 4.3 and 4.4 at the end of this chapter show breakdowns by valuation bands for the
properties returned or otherwise accounted for by Revenue. Table 4.2 shows the distribution by
valuation band for the 1.68 million properties for which a return was filed for 1 May 2013. This excludes
local authority owned properties (where all properties are placed in the first valuation band) and
properties subject to “mandatory deduction at source” (see paragraph 3.3) cases. Tables 4.3 and 4.4
show the number of properties and the LPT collected for all 1.866 million properties now compliant
for 2014, with local authority owned and mandatory deduction at source cases included.
4.4 Not surprisingly, the more urbanised areas account for higher proportions of the properties on the
Revenue data base as well as for the yield. Over 40 percent of the yield, and over 27 percent of the
properties on the data base, are accounted for by the four Dublin local authorities. This is a
consequence of the extent of urbanisation, and the generally higher values of properties in these
areas, as compared with the rest of the country.
Exemptions 4.5 A number of categories of residential properties are exempted from the payment of LPT. Table 4.5 at
the end of this chapter shows the exemption categories and the total number (almost 42,000) of
properties as well as the numbers in each category, in respect of which exemption is claimed.
4.6 LPT, including the claiming of exemptions, operates on a self-assessment basis. The data in table 4.5
comprise the number of exemptions claimed but not necessarily approved by Revenue. Claimed
exemptions are subject to review as part of Revenue’s overall compliance programme. The numbers
in the table are not static and fluctuate as reviews establish invalid claims. For example, a review of
claims in respect of properties in unfinished housing estates established that 33 percent of the claims
were invalid. This high level of invalid claims may have been due to confusion about the different
criteria for LPT exemption vis-à-vis the Household Charge.
10 The term “returned” is used for convenience throughout the text as meaning properties which have been declared to the Revenue by way of a self- assessed valuation return. This includes properties returned, properties where exemptions or deferrals are in effect, local authority owned properties, properties in respect of which tax returns have not been made but where payments have been received and properties where mandatory deduction at source has been applied.

Review of the Local Property Tax
16
4.7 In line with property valuations, the general rule is that the status of a property on a valuation date
determines its status for the entire valuation period. Thus, a property that was exempt on 1 May 2013
continues to be exempt until the end of 2016, regardless of what happens to it in the intervening
period.
4.8 The exempt properties account for around 2.2 percent of taxable properties. Of these, over 60 percent
were accounted for by three categories of properties - properties situated in unfinished housing
estates, certain properties purchased during 201311 and properties owned as trading stock by
builders/developers that remain unsold as well as new and previously unused residential properties
purchased from them in the period 1 January 2013 to 31 October 2016. This is not an insignificant part
of the total tax base. The provision of exemptions for these categories reflected the very difficult
conditions prevailing in the economy and property markets at the time the tax was introduced. The
exemptions were introduced in part, to stimulate demand for housing. However, tax exemptions are
not costless and are paid for by other tax payers (through increased taxes or Exchequer borrowing
which in turns represents a claim on tax revenues) or through reduced expenditures on public
services12 . They can also give rise to inequities13. Furthermore, exemptions of particular classes of
properties cause inefficiencies and distortions in the use of property. For example, removal of the
exemption on the unsold trading stock of builders/developers would encourage the release of these
properties onto the housing market. This would be useful in those areas where supply, rather than
demand, is now a constraint.
Recommendation The exemption for residential properties purchased from builders/developers or unsold by them
should not be renewed. Neither should the exemption for properties on unfinished housing estates
and the exemption for ‘first-time buyers’14.
Deferrals 4.9 Almost 30,000 claims for deferral of property tax (para 3.7) in respect of individual properties have
been made to date. As can be seen from Table 4.6 at the end of this chapter, most of the deferrals
claimed have been made on income grounds. Deferrals account for approximately 1.3 percent of the
total property tax base.
4.10 The deferral provisions are important in addressing hardship while also protecting the general interest
of tax payers and the wider community. For example, an elderly person on low income who opts for
deferral need not pay LPT during her or his lifetime. The accumulated charge would however be liable
to be paid on the sale of the property or by people inheriting the property unless they too are eligible
to elect for deferral. The current options for deferrals do not provide for specified income limits for
elderly people living alone or for people living alone with stated certified disabilities and illnesses
which restrict their mobility and long term illnesses. It is recommended that consideration be given to
raising the income threshold for these groups.
11 See footnote 13. 12 Each 1 percent reduction in the property tax yield costs approximately €5m. 13 For example, purchasers of expensive properties who made the purchase between 2013 and 2016 will not be liable to pay LPT until 1 January 2017 – provided the property was purchased directly from a builder or property developer. 14 See footnote 13.

Review of the Local Property Tax
17
Recommendations The general, as well as the marginal, deferral provisions be continued and be reviewed and revised
in line with changes in the Consumer Price Index (CPI).
The period of relief for income-stressed owner-occupiers who have outstanding mortgages be
extended beyond the end of 2017.
For owner-occupiers over 80 years of age or those with stated certified long term illnesses and
disabilities, who are also living alone, it is recommended that consideration be given to raising the
eligible income limit for deferrals to €20,000.
Compliance 4.11 The compliance rates for LPT for the years 2013, 2014 and 2015 are currently estimated by the Office
of the Revenue Commissioners at 97 percent, 97 percent and 96 percent of properties respectively.
The compliance rates are based on returns filed for 2013 (including claims for deferrals and
exemptions), payment instructions rolled over from 2013 for 2014 and 2015 or new instructions
received for 2014 and 2015, as well as properties for which mandatory deduction at source (see
paragraph 3.3) has been applied and local authority owned properties.
4.12 The numbers of compliant properties are estimated at 1.87m, 1.87m and 1.86m for 2013, 2014 and
2015 respectively. The compliance rates are calculated on an expected Register of 1.95m properties.
The expected Register numbers are extrapolated from Central Statistics Office Census 2011
information. Revenue is continuing to work on validating the Register.
4.13 These are hugely impressive outcomes. Prior to the LPT there was not a comprehensive data base of
residential properties in the State. The outcomes reflect positively on the professionalism of Revenue
management and officials in respect of the strategic and operational management of the tax, public
confidence in the Office of the Revenue Commissioners and the commitment of the great majority of
tax payers to meeting their tax obligations. The compliance rates achieved are much higher than those
achieved in respect of the former Household Charge and by local authorities in regard to the collection
of commercial rates.
4.14 Voluntary compliance with the self-assessment regime is the bedrock of the compliance outcome
together with the provision of a range of payment options. Taxpayers can choose to have the tax
payments paid in a single sum or spread throughout the year, for example, by way of deductions from
regular payments to the tax payers such as salaries, pensions and payments from the Departments of
Social Protection and Agriculture, Food and the Marine.

Review of the Local Property Tax
18
Compliance promotion measures and strategies 4.15 In the absence of self-assessed returns for liable residential properties, Revenue pursue collection of
an ‘estimate amount’ of LPT, which is notified to the taxpayer. In the absence of a return or an election
by the taxpayer for a particular method of payment, mandatory deduction at source15 (see paragraph
3.3) is used as far as is possible as the default means of collection. Where LPT remains outstanding, a
charge (carrying an annual interest rate of 8 percent) attaches to the relevant property. The tax and
accrued interest must be paid when the property is sold or otherwise transferred.
4.16 In the case of self-employed and corporate taxpayers, Revenue will not issue a tax clearance certificate
where there is unpaid LPT. Late delivery of an LPT return is linked to the filing of an income tax (or
corporation tax) return, thus exposing a self-employed or corporate taxpayer to an income tax (or
corporation tax) surcharge.
4.17 Non-compliance with the LPT can take the form of failure to submit a return (containing a self-
assessment) or the submission of an undervaluation. The growing accumulation of sales data (for
example from the Residential Property Price Register, itself based on Revenue’s stamp duty data)
enables Revenue to address under-valuations.
4.18 Tax arrears arising from failure to submit returns or arising from under-valuations are subject to the
usual Revenue regime in respect of interest and penalties. Further information provided by Revenue
on the compliance work being undertaken by them is outlined in Box 4.1.
15 Deductions at source can be made in respect of salary payments, occupational pensions and payments from the Departments of Social Protection and Agriculture, Food and the Marine.

Review of the Local Property Tax
19
Box 4.1 Compliance activities by Revenue
Due to the scale of the return and payment compliance programmes during 2014 and 2015, Revenue’s resources were focused to a greater extent on the collection of outstanding LPT than on the verification of self-assessed property valuations. To date, Revenue has issued over half a million letters to non-compliant property owners in respect of both LPT and Household Charge liabilities. Approximately 31,000, 50,500 and 62,900 mandatory deductions from wages/pensions are in operation for 2013, 2014 and 2015 respectively. These figures can fluctuate as property owners regularise their affairs. A Household Charge compliance programme was carried out in 2014. This programme is continuing and €45 million has been collected in Household Charge arrears since early 2014. Compliance programme activity in relation to self-employed and corporate taxpayers includes the refusal of approximately 17,800 tax clearance certificate requests and the imposition of approximately 20,200 income tax and 140 corporation tax surcharges. In addition, approximately 1,000 cases were referred to the Sheriffs for enforcement.
Self-assessed property valuations are reviewed by Revenue and approximately 8,200 such valuations have been adjusted upwards, most of them by up to three valuation bands. Revenue is gradually devoting more resources to this area as fewer resources are needed for returns and payment compliance programmes.
Revenue also review exemptions claimed on a self-assessment basis. As a result of such reviews, for example, Revenue established that approximately 33 percent of claimants for exemption in respect of properties situated in unfinished housing estates were not eligible for the exemption. In the case of the ‘first-time buyer’ exemption, approximately 31 percent of claimants were not eligible for the exemption. These activities were underpinned by a comprehensive customer service programme. Close to 900,000 items of correspondence regarding LPT and Household Charge have been processed and 900,000 phone-calls have been handled. The scale and profile of the customer service operation has also contributed to the very high compliance rates achieved to date.

Review of the Local Property Tax
20
Processing of returns by Revenue 4.19 In preparation for the 1 May 2013 valuation date, Revenue started issuing return forms in March 2013
to all potential liable persons to complete and send back to Revenue by 7 May 2013. Liable persons
were required to notify Revenue of their self-assessment of the market value of their property,
whether they were eligible to claim an exemption/deferral and their preferred payment method. As
part of this return form, Revenue included an ‘estimate amount’, which amount was to become due
and payable in the absence of a self-assessment by the liable person.
4.20 This ‘estimate amount’ sent to property owners was also in line with valuation guidance provided by
Revenue to property owners to assist them in self-assessing the valuation band for their property.
Analysis of returns submitted to Revenue shows that for 46 percent of properties, the valuation band
returned was the same as the ‘estimate amount’, a further 37 percent of properties were valued one
band higher or lower and the remaining 17 percent of properties were valued at 2 or more bands from
the Revenue ‘estimate amount’.
4.21 The Revenue ‘estimate amount’ (and the Revenue valuation guidance) were based on an economic
model of property values developed by Revenue16. According to the Revenue, testing of the model’s
performance in 2013 and subsequently shows that it functions well in the majority of cases. Its
performance is within the internationally recognised standards for this type of model17. For the
reasons outlined in footnote 18, Revenue is confident that an updated valuation model would likely
be even more accurate and reliable than the 2013 iteration.
4.22 Having to issue documentation such as returns and guidance material and to process it when
completed and returned was a significant logistical task for Revenue. It is considered that the
administrative burden both on Revenue and on property owners could be reduced were the procedure
to be modified for the next valuation period.
4.23 During the preparation of this report it was suggested that the Revenue ‘estimate amount’ be treated,
instead, as a ‘default’ self-assessment. A liable person would not have to complete and submit a return
form unless he or she considered that the Revenue ‘estimate amount’ did not fall into the same
valuation band as his or her self-assessment of the market value of a property18. Exemptions, deferrals
and payment methods could continue unchanged through to the next valuation period unless the
liable person notified Revenue that this was not appropriate. This change would mean that many liable
persons would be relieved of the obligation to submit a return form to Revenue.
16 The model used is a hedonic econometric regression model based on data on property transactions from Revenue’s stamp duty system. This type of approach is often referred to as an Automated Valuation Model (AVM) or Computer Assisted Mass Appraisal (CAMA) when applied to systematic valuations of properties. These models are widely used in real estate valuation and property tax administration, including countries were the tax administration sets property values (rather than through self- assessment). 17 The 2013 iteration of the model was constructed with limited data available given the instability in the property market from the recession and the low number of properties being bought and sold. It is expected that an updated model in the future would benefit from more and improved data, from both the recovery in the property market and increases in numbers of transactions in the market in recent years, as well as the 2013 LPT returns which provide an extremely rich source of data not available previously. 18 Failure to alert the Revenue would attract interest and depending on the circumstances of the case, penalties, and possibly subject the taxpayer to enforcement proceedings.

Review of the Local Property Tax
21
Recommendation
That the Revenue ‘estimate amount’ be treated, instead, as a ‘default’ self-assessment. This
approach is recommended on the understanding that it would be made clear to taxpayers that they
would have an obligation to submit a return form if the Revenue “estimate amount” did not all into
the same valuation band as her or his self-assessment of the value of the property.
Compliance rates by local authority area 4.24 Table 4.7 at the end of this chapter shows the overall compliance rate nationally and for each local
authority. Variances from the overall national figures are also shown. The variances, by and large, are
not significant. According to the data for 2014, 9 local authority areas, Cork City, Donegal, Dublin City,
Kerry, Leitrim, Louth, Mayo, Sligo and Waterford show compliance rates below the national average.
Of these, 6 show variances of less than 2 percentage points. The highest variance rate of minus 4.8
percent is recorded in the case of Donegal. Compliance rates with variances of 2 percentage points or
more above the national averages were recorded in Fingal, Laois and South Dublin.
The Equalisation Fund 4.25 In accordance with the decisions taken by Government, local authorities will keep 80% of LPT collected
in their areas in 2015. The remaining 20% will be re-distributed by the Department of the Environment, Community and Local Government from the Local Government Fund to provide top-up funding to certain local authorities that have lower property tax bases, to ensure that no local authority will receive less income from LPT in 2015 than they received for General Purpose Grants (GPGs) in 2014. This equalisation from the Local Government Fund recognises that certain local authorities, whose property bases may not provide a sufficient level of LPT, do require extra support. The intention is that matters relating to equalisation levels and methods for future years will be reviewed as necessary and appropriate.
4.26 Table 4.8 at the end of this chapter shows the local authorities who benefited from the fund and the amounts to be provided in 2015. For a significant number of local authorities the value of the funding received from the Equalisation Fund was significantly greater than that raised locally. Interestingly, two of these local authority areas, Donegal and Leitrim had compliance rates below the national average in 2014 – see Table 4.7 at the end of this chapter.
Management of the Yield 4.27 At present, LPT receipts are paid by Revenue to the Exchequer. The legislation further provides that
from 2014, the Minister for Finance shall pay into the Local Government Fund an amount equivalent to the Local Property Tax paid into the Central Fund during that year. Historically, Motor Tax (MT) receipts (estimated at €1,157.5m for 2014) were paid into the Local Government Fund (LGF) and used to fund local authorities. LPT receipts are paid into the Exchequer and are then transferred to the LGF. These are taken into account in the calculation of return payments to the Exchequer.
4.28 This is an inefficient arrangement. It is recommended that LPT receipts be paid directly by the Revenue
into the LGF and that MT receipts be transferred to the Exchequer from the LGF.
Recommendation Direct payment of LPT receipts be made to the Local Government Fund

Review of the Local Property Tax
22
Tables
Table 4.1: LPT Collection and Number of Properties Returned by Tax Year
Tax Year 2013 Tax Year 2014 Tax Year 2015 (to April 2015)
LPT Collected (including Household Charge receipts)
€264m €522m €328m
Number of Properties returned
1.866m 1.866m 1.853m
Note: Based on preliminary Revenue estimates in June 2015. LPT receipts in the table include collection of Household Charge arrears of €2m, €37m and €6m in 2013, 2014 and 2015 (to date) respectively.
Table 4.2: Number of Properties by Valuation Band Returned on 1 May 2013
Number of Properties
(000s) (%)
€0-100,000 453.4 27.0
€100,001-150,000 469.1 27.9
€150,001-200,000 355.5 21.2
€200,001-250,000 169.0 10.1
€250,001-300,000 80.9 4.8
€300,001-350,000 47.6 2.8
€350,001-400,000 30.4 1.8
€400,001-450,000 20.5 1.2
€450,001-500,000 14.5 0.9
€500,001-550,000 9.8 0.6
€550,001-600,000 6.5 0.4
€600,001-650,000 5.1 0.3
€650,001-700,000 3.7 0.2
€700,001-750,000 3.1 0.2
€750,001-800,000 2.3 0.1
€800,001-850,000 1.7 0.1
€850,001-900,000 1.4 0.1
€900,001-950,000 1.1 0.1
€950,001-1,000,000 1.3 0.1
€1,000,000+ 3.7 0.2
Total 1,681 100
Note: Based on preliminary Revenue estimates in June 2015.
Review of the Local Property Tax
23
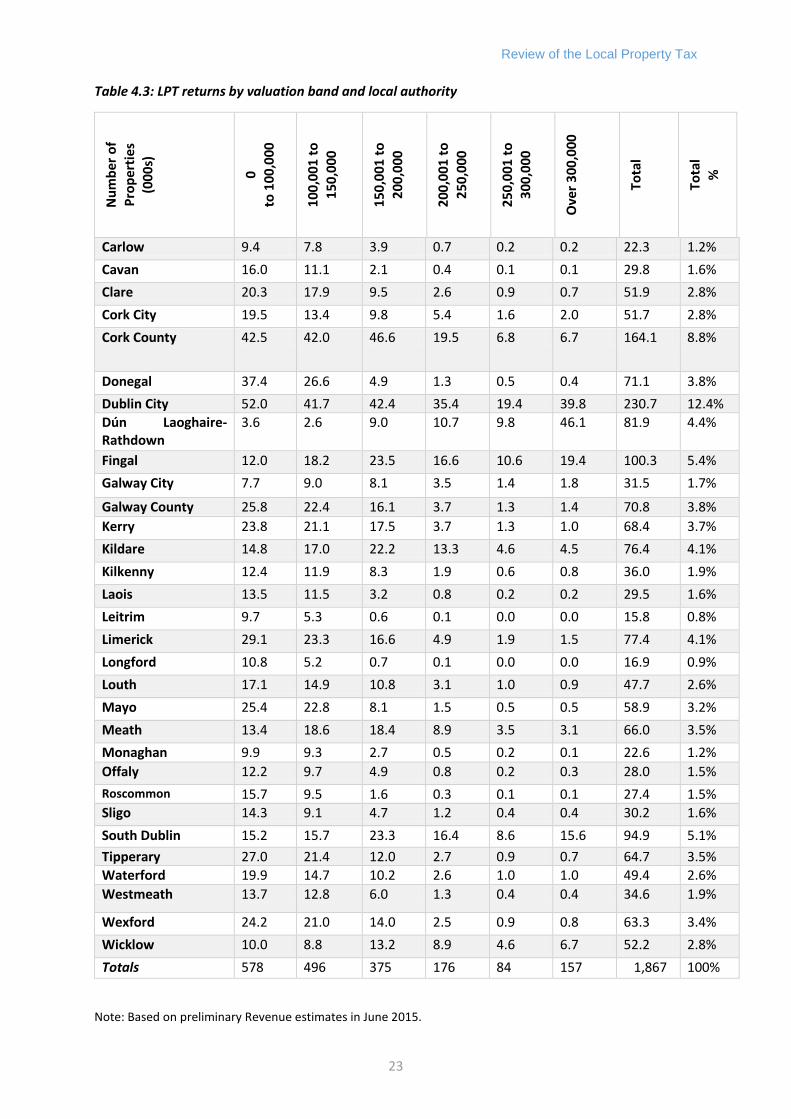
Table 4.3: LPT returns by valuation band and local authority
Nu
mb
er o
f P
rop
erti
es
(00
0s)
0 to
10
0,0
00
10
0,0
01
to
15
0,0
00
15
0,0
01
to
20
0,0
00
20
0,0
01
to
2
50
,00
0
25
0,0
01
to
3
00
,00
0
Ove
r 3
00
,00
0
Tota
l
Tota
l %
Carlow 9.4 7.8 3.9 0.7 0.2 0.2 22.3 1.2%
Cavan 16.0 11.1 2.1 0.4 0.1 0.1 29.8 1.6%
Clare 20.3 17.9 9.5 2.6 0.9 0.7 51.9 2.8%
Cork City 19.5 13.4 9.8 5.4 1.6 2.0 51.7 2.8%
Cork County 42.5 42.0 46.6 19.5 6.8 6.7 164.1 8.8%
Donegal 37.4 26.6 4.9 1.3 0.5 0.4 71.1 3.8%
Dublin City 52.0 41.7 42.4 35.4 19.4 39.8 230.7 12.4%
Dún Laoghaire-Rathdown
3.6 2.6 9.0 10.7 9.8 46.1 81.9 4.4%
Fingal 12.0 18.2 23.5 16.6 10.6 19.4 100.3 5.4%
Galway City 7.7 9.0 8.1 3.5 1.4 1.8 31.5 1.7%
Galway County 25.8 22.4 16.1 3.7 1.3 1.4 70.8 3.8%
Kerry 23.8 21.1 17.5 3.7 1.3 1.0 68.4 3.7%
Kildare 14.8 17.0 22.2 13.3 4.6 4.5 76.4 4.1%
Kilkenny 12.4 11.9 8.3 1.9 0.6 0.8 36.0 1.9%
Laois 13.5 11.5 3.2 0.8 0.2 0.2 29.5 1.6%
Leitrim 9.7 5.3 0.6 0.1 0.0 0.0 15.8 0.8%
Limerick 29.1 23.3 16.6 4.9 1.9 1.5 77.4 4.1%
Longford 10.8 5.2 0.7 0.1 0.0 0.0 16.9 0.9%
Louth 17.1 14.9 10.8 3.1 1.0 0.9 47.7 2.6%
Mayo 25.4 22.8 8.1 1.5 0.5 0.5 58.9 3.2%
Meath 13.4 18.6 18.4 8.9 3.5 3.1 66.0 3.5%
Monaghan 9.9 9.3 2.7 0.5 0.2 0.1 22.6 1.2%
Offaly 12.2 9.7 4.9 0.8 0.2 0.3 28.0 1.5%
Roscommon 15.7 9.5 1.6 0.3 0.1 0.1 27.4 1.5%
Sligo 14.3 9.1 4.7 1.2 0.4 0.4 30.2 1.6%
South Dublin 15.2 15.7 23.3 16.4 8.6 15.6 94.9 5.1%
Tipperary 27.0 21.4 12.0 2.7 0.9 0.7 64.7 3.5%
Waterford 19.9 14.7 10.2 2.6 1.0 1.0 49.4 2.6%
Westmeath 13.7 12.8 6.0 1.3 0.4 0.4 34.6 1.9%
Wexford 24.2 21.0 14.0 2.5 0.9 0.8 63.3 3.4%
Wicklow 10.0 8.8 13.2 8.9 4.6 6.7 52.2 2.8%
Totals 578 496 375 176 84 157 1,867 100%
Note: Based on preliminary Revenue estimates in June 2015.

Review of the Local Property Tax
24
Table 4.4: LPT collected by valuation band and Local Authority
LPT
Co
llect
ed
€
mill
ion
0
to 1
00
,00
0
10
0,0
01
to
1
50
,00
0
15
0,0
01
to
2
00
,00
0
20
0,0
01
to
2
50
,00
0
25
0,0
01
to
30
0,0
00
Ove
r 3
00
,00
0
Tota
l
Tota
l %
Carlow 0.7 1.6 1.1 0.3 0.1 0.2 3.9 0.8%
Cavan 1.2 2.3 0.6 0.2 0.1 0.1 4.4 0.9%
Clare 1.5 3.8 2.8 1.0 0.4 0.5 10.1 2.1%
Cork City 1.0 2.8 2.9 2.1 0.8 1.6 11.0 2.3%
Cork County 2.9 8.8 13.6 7.4 3.2 4.8 40.6 8.4%
Donegal 2.8 5.5 1.5 0.5 0.2 0.3 10.8 2.2%
Dublin City 1.8 8.9 12.6 13.6 8.9 34.1 79.9 16.5%
Dún Laoghaire-Rathdown
0.1 0.6 2.7 4.1 4.6 39.9 52.0 10.7%
Fingal 0.5 3.9 6.9 6.4 5.0 15.5 38.2 7.9%
Galway City 0.5 1.9 2.4 1.3 0.6 1.3 8.1 1.7%
Galway County 2.0 4.8 4.8 1.4 0.6 1.0 14.5 3.0%
Kerry 1.7 4.5 5.2 1.4 0.6 0.7 14.1 2.9%
Kildare 1.0 3.5 6.6 5.0 2.2 3.2 21.5 4.4%
Kilkenny 0.8 2.5 2.5 0.8 0.3 0.6 7.4 1.5%
Laois 0.9 2.4 0.9 0.3 0.1 0.2 4.9 1.0%
Leitrim 0.7 1.1 0.2 0.1 0.0 0.0 2.1 0.4%
Limerick 2.0 5.0 4.9 1.9 0.9 1.1 15.7 3.2%
Longford 0.7 1.1 0.2 0.1 0.0 0.0 2.1 0.4%
Louth 1.3 2.8 3.1 1.2 0.5 0.6 9.4 1.9%
Mayo 2.0 4.8 2.4 0.6 0.3 0.4 10.4 2.1%
Meath 0.9 3.9 5.4 3.4 1.6 2.2 17.4 3.6%
Monaghan 0.7 1.9 0.8 0.2 0.1 0.1 3.8 0.8%
Offaly 0.9 2.0 1.4 0.3 0.1 0.2 4.9 1.0%
Roscommon 1.2 2.0 0.5 0.1 0.1 0.1 4.0 0.8%
Sligo 1.0 1.9 1.4 0.5 0.2 0.3 5.3 1.1%
South Dublin 0.5 3.4 6.9 6.3 4.0 10.5 31.6 6.5%
Tipperary 1.9 4.5 3.5 1.0 0.4 0.5 11.8 2.4%
Waterford 1.4 2.9 2.8 1.0 0.5 0.7 9.3 1.9%
Westmeath 1.1 2.6 1.7 0.5 0.2 0.3 6.4 1.3%
Wexford 1.7 4.4 4.1 1.0 0.4 0.5 12.1 2.5%
Wicklow 0.5 1.9 3.9 3.4 2.1 5.3 17.1 3.5%
Totals 38 104 110 67 39 126 485 100%
Note: Based on preliminary Revenue estimates in June 2015; LPT receipts exclude Household Charge receipts.

Review of the Local Property Tax
25
Table 4.5 Exemption categories and number of properties at end June 2015
EXEMPTION CATEGORY
End June 2015
Number (000s)
%
Charitable bodies (recreational activities) 0.2 0.5
Charitable/Public bodies (special needs accommodation) 4.5 10.7
Registered nursing homes 0.5 1.2
Properties vacated because of long-term mental/physical infirmity
5.6 13.4
Residence of a severely incapacitated person 1.8 4.3
Properties fully chargeable to commercial rates 2.1 5.0
Unfinished housing estates 4.3 10.3
Significant pyrite damage 1.1 2.6
Certain properties purchased between 1 January 2013 and 31 December 2013
9.9 23.6
Trading stock of builder/developer – unsold at 1 May 2013 or sold in the period 1 January 2013 to 31 October 2016
11.9 28.4
TOTALS
41.9
100
Table 4.6: Number of Properties by Deferral Category (2014)
Deferral Category Number of Properties %
Executor/Administrator of an Estate 3.9
Significant/Unexpected Financial Loss 1.1
Below Income Threshold 94.2
Insolvent Liable Person 0.8
Total 100
Note: Based on preliminary Revenue estimates in June 2015.

Review of the Local Property Tax
26
Table 4.7 Compliance data - percentage rate by local authority
Local Authority 2013 Variance from
Overall Rate 2014 Variance from
Overall Rate 2015 (to date)
Variance from Overall Rate
Carlow 98.1 1.1 98.5 1.5 98.1 2.1
Cavan 97.3 0.3 98 1.0 95.9 -0.1
Clare 97.7 0.7 98.4 1.4 97.7 1.7
Cork City 95.2 -1.8 95.4 -1.6 95.1 -0.9
Cork Co 97.9 0.9 98.2 1.2 97.8 1.8
Donegal 92.7 -4.3 92.2 -4.8 90.4 -5.6
Dublin City 95.2 -1.8 94.8 -2.2 94.1 -1.9
DLR 97.1 0.1 97 0.0 97.2 1.2
Fingal 98.7 1.7 99.7 2.7 99.6 3.6
Galway City 96.9 -0.1 97.3 0.3 96.7 0.7
Galway Co 97.6 0.6 98 1.0 97.2 1.2
Kerry 96 -1.0 96.1 -0.9 95.3 -0.7
Kildare 97 0.0 98 1.0 97.7 1.7
Kilkenny 96.8 -0.2 97.7 0.7 97 1.0
Laois 98.9 1.9 99 2.0 99.5 3.5
Leitrim 94.5 -2.5 94.4 -2.6 93.6 -2.4
Limerick City &
Co
96.5 -0.5 97 0.0 95.9 -0.1
Longford 97.9 0.9 97.4 0.4 96 0.0
Louth 95.9 -1.1 96.1 -0.9 95.2 -0.8
Mayo 96.1 -0.9 95.7 -1.3 95.2 -0.8
Meath 96.6 -0.4 97.9 0.9 97 1.0
Monaghan 96.6 -0.4 97.2 0.2 96.4 0.4
Offaly 96.6 -0.4 97.5 0.5 96.5 0.5
Roscommon 97.2 0.2 97.6 0.6 96.8 0.8
Sligo 96.7 -0.3 96.3 -0.7 95.4 -0.6
South Dublin 99 2.0 99.3 2.3 98.7 2.7
Tipperary 99 2.0 98.9 1.9 97.8 1.8
Waterford City
& Co
96 -1.0 96.5 -0.5 95.6 -0.4
Westmeath 96.5 -0.5 97.3 0.3 96.6 0.6
Wexford 98.4 1.4 98.1 1.1 97.4 1.4
Wicklow 97.9 0.9 98.5 1.5 98 2.0
Overall 97 97 96

Review of the Local Property Tax
27
Table 4.8 Contributions from the Equalisation Fund
Provisional 2015 LPT Income for Local Authorities where LPT Receipts are less than 2014 Funding Levels
LPT yield raised in that local authority area
Contribution from
Equalisation Fund
Total Provisional
LPT Funding to be
Provided in 2015
€m €m €m
Carlow 4.08 2.09 5.35
Cavan 4.53 4.84 8.46
Donegal 11.03 13.9 22.72
Galway County 14.96 0.53 12.51
Kilkenny 7.69 3.2 9.36
Laois 5.03 3.61 7.63
Leitrim 2.19 6.53 8.28
Limerick (Unified) 16.20 1.67 14.63
Longford 2.18 6.38 8.12
Louth 9.70 0.48 8.24
Mayo 8.57 8.92 17.49
Monaghan 3.93 7.11 10.25
Offaly 5.06 2.62 6.66
Roscommon 4.09 5.83 9.11
Sligo 5.44 5.65 9.99
Tipperary (Unified)
12.25 12.96 22.76
Waterford (Unified)
9.59 8.85 16.52
Westmeath 6.58 4.85 10.12
Wexford 12.54 1.86 11.89
Total 147.74 101.89 220.08
Source: Derived from data provided by the Department of Environment, Community and Local Government19
19 Derived from Table A at www.environ.ie/en/Publications/LocalGovernment/FileDownLoad,38851,3n.docx

Review of the Local Property Tax
28
Chapter 5: Implications of recent property price developments and related issues
5.1 In addition to examining the operation of the LPT, the terms of reference require that the review, and the recommendations arising from it, have particular regard to
• Recent residential property price developments,
• The overall yield from LPT and its contribution to total tax revenue on an ongoing basis, and
• The desirability of achieving relative stability, both over the short and longer terms, in LPT
payments of liable persons.
5.2 These three important issues are interconnected and are addressed in the discussion and resulting
recommendations.
5.3 Over the period May 2013 to May 2015, property prices increased nationally by 26 percent, according to the Central Statistics Office’s Residential Property Price Index. This overall increase masks the variation in increases across regions with properties in Dublin increasing by approximately 41 percent, with properties outside of Dublin increasing by 14 percent. Similarly there were substantial differences between the houses and apartment indices nationally. The chart below shows price developments since May 2013 for each of the sub-indices of the Residential Property Price Index (RPPI) with each index rebased to 100 in May 2013.
Figure 1: CSO Residential Property Price Index developments, May 2013 – May 2015, May 2013 = 100 Source: Central Statistics Office Notes: The overall national index is not displayed as it broadly mirrored the national-houses index given the high weighting of houses in the index.

Review of the Local Property Tax
29
5.4 Recent price developments projected forward have implications for:
(i) LPT liabilities,
(ii) The aggregate LPT yield and
(iii) Impact on LPT liabilities
5.5 The Economics Division of the Department of Finance has prepared estimates of the potential implications on taxpayer liabilities of price developments as a result of price increases since May 2013. This paper prepared by the Economics Division is included in this report (Chapter 7). The data sources used for the purpose of this exercise included CSO property price indices, aggregate data available from the Revenue Commissioners on the numbers of properties in each band and data on residential property price transactions from the Residential Property Price Register published by the Property Services Regulatory Authority. Using the methodology described in the paper the authors conclude that the analysis indicates large variation across the country in possible changes to tax liabilities. They estimate that:
48 percent of properties would remain in their original band and thus not generate any increase in tax liability,
35 percent of properties would have moved by one band, and thus generate an increased annual liability of €90 (assuming a tax rate of 0.18 percent )20,
10 percent of properties would have moved by two bands, generating an increased annual tax liability of €180 (at a tax rate of 0.18 percent) ; and,
The remaining 7 percent would have moved by between three and six valuation bands – generating increased tax liabilities of between €270 and €54021.
5.6 This illustrates the hypothetical situation that if a revaluation were to have occurred in May 2015 there would be significant increases in tax liabilities for some taxpayers, with the bigger band jumps occurring for properties valued in the higher valuation bands in May 2013. The analysis also indicates a wide degree of regional variation in band changes with the largest step movements through the bands, and as a consequence tax liability increases under current legislation, mainly occurring in the Dublin area.
Illustration of extent of LPT increases 5.7 The table at Appendix 5 illustrates the range of tax liabilities for properties in different price ranges
based on a 41 per cent price increase. The data are consistent with the summary of the results in paragraph 7.5 of the Department of Finance modelling exercise (Chapter 7). The table illustrates that, assuming a price increase since May 2013 of 41 per cent, some properties placed in valuation bands 1 and 2 (€0-€100,000) and (€100,001 to €150,000) in May 2013, and all properties placed in the higher valuation bands, would see increases in LPT liabilities. Some properties placed in valuation band 14 (€700,000- €750,000) would, without legislative change, be valued for LPT purposes at more than €1m. These properties would incur additionally higher tax liabilities due to the progressive tax charge for properties above that price level22. Finally, the table at Appendix 5 illustrates the impact of a price increase of 41 percent on the tax liabilities incurred on a sample of properties valued at €1m or more
20 Some local authorities have decreased the tax rate – see table at Appendix 4. 21 The increase in liabilities for properties originally in band one would be larger in each of the above situations. 22 Properties at above €1m in value are taxed at the standard rate (0.18% in 2013) up to €1m and at 0.25% on the excess of the value over €1m.

Review of the Local Property Tax
30
in May 2013. The table illustrates that, under the assumptions used, properties in this price range would incur significant increased tax liabilities proportionately and absolutely.
5.8 The discussion in paragraph 5.5, which is based on price movements that have already taken place,
shows that almost half of LPT tax payers would not have incurred any increase in tax liabilities as a result of price movements to date, if LPT liabilities were to be determined by May 2015 values. As a rule of thumb, properties which have increased in value by €50,000 or less would not have generated an increased tax liability – assuming that they are not close to the top of their initial valuation band.
5.9 In the Dublin area (the area of highest price increases) only some properties valued in the first band would come into this category. Some higher value properties in rural areas, experiencing lower price increases, would not incur tax increases.
5.10 This discussion and analysis does not, however, take account of price movements between now and November 2016. Residential price movements show considerable volatility not just from year to year but quarter to quarter. Any forward projections would be highly conjectural and run the possible risk of providing a poor basis for policy making. They could also be a distraction from what ideally should be the objective of this review which is to recommend a charging structure and basis for assessment which, while responsive to broad economic developments, particularly in regard to prices and incomes, as well as to policy changes and requirements, produces tax yields and liabilities which are relatively stable over time. A set of relevant criteria for this purpose are proposed below.
Impact on LPT yield 5.11 The paper from the Department of Finance in Chapter 7 projects that, if the price developments that
had occurred between May 2013 and May 2015 had been reflected in LPT liabilities, the yield for tax year 2014 would have increased from around €480m to €620m – an increase of over 29 per cent.
The overall yield from LPT and its contribution to total tax revenue on an ongoing basis 5.12 Table 5.1 shows the revenue yield from the LPT for 2013 (half year), 2014 and 2015 (projected) in euro
and expressed as a percentage of total tax revenues. Projections for the LPT yield, derived from projections in the Spring Statement of the Ministers for Finance and Public Expenditure and Reform, are also included in Table 5.1.
5.13 The Spring Economic Statement 23 made by the Ministers for Finance and Public Expenditure and Reform project a 40 per cent increase in total tax revenues over the period up to 2020 (see Table 5.1 below). Various assumptions can be made as to what would be a stable proportion of the total tax yield for LPT on a continuing basis. Table 5.1 below illustrates an assumption that it remains as a constant proportion of the total tax yield projected in the Spring Statement.
23 http://www.finance.gov.ie/sites/default/files/SES.pdf

Review of the Local Property Tax
31
Table 5.1: LPT revenues and as a % of total tax revenues in 2013 and following years.
Year Total Tax Revenues(€m)
Total LPT Revenues(€m)
LPT Revenues as % of total revenues
2013 37,805 318 (half year) Not applicable
2014 41,280 491 1.2
Estimated Projections
2015 43,300 520 1.2
2016 45,290 544 1.2
2017 45,865 550 1.2
2018 49,925 599 1.2
2019 50,835 610 1.2
2020 52,875 635 1.2
Note: (i) Actual data for 2013 and 2014. Projections for 2015-2020: Source - Spring Statement,
Ministers for Finance and Public Expenditure and Reform, April 2015
(www.finance.Gov.ie/sites/default/files/SES.pdf)
(ii)LPT data projected forward for illustrative purposes and by assuming a constant share of
total revenues
The desirability of achieving relative stability, both over the short and longer terms, in LPT payments of liable persons.
5.14 The commissioning of this review reflected concern about the impact of property price developments on potential LPT liabilities caused by property price developments. The desirability of achieving “relative stability”, both over the short and longer terms, in LPT payments of liable persons reflects a concern that, in the interests of fairness, tax liabilities and yields should not change significantly and unpredictably, and without reference to broad economic conditions (particularly changes in prices and incomes) or to policy changes.
5.15 The projected tax increases arising from price changes of residential properties over the past few years and discussed in the previous paragraphs could not be regarded as “relatively stable”.
5.16 On the other hand “relative stability“ does not mean that tax liabilities for individuals or tax revenue yields for any tax should be frozen or fixed in (real or nominal prices) going forward. This would remove any flexibility for adjusting tax regimes to take account of economic circumstances or changing policy priorities and needs.
Options for change 5.17 Effectively, the policy options entail consideration of amending the basis of assessment (including
valuations) and/or the charging (i.e. rates) structures of the tax24. The options listed below in Table 5.2 were selected for detailed consideration.
24 LPT liabilities for any residential property are calculated by multiplying the value of the residential property by the rate of tax- as reflected in the following equation (LPT charge) = ( Property value) X (tax rate)

Review of the Local Property Tax
32
Table 5.2 Options
OPTIONS:
1 Proceed with revaluations in November 2016 as provided for in current legislation.
2 Freeze valuations at 2013 levels.
3 Determine the mid-point of the 2013 and 2016 valuations as the taxable value.
4 Phase valuation adjustments over a three year period.
5 Widen valuation bands while proceeding with a revaluation in November 2016
6 Proceed with the revaluation in November 2016 but legislate to set a limit on valuation band movements
7 Allow relief for mortgages
8 Proceed with the revaluation in November 2016 and at subsequent three year intervals But: Legislate to allow for rate changes at (a) national level or (b) at the level of each local authority area.
5.18 It is appropriate to have regard to a set of relevant evaluation criteria. The criteria used in this review are that proposals for change should reasonably and in so far as is possible satisfy tests of:
➢ Transparency: particularly transparent assessment for taxpayers;
➢ Fairness: Taxpayers with liabilities for properties of comparable market values and in the
same local authority areas should incur comparable liabilities. They also have a legitimate expectation of being able to project forward with reasonable confidence their future tax liabilities on these properties. Taxpayers with higher value properties in the same local authority area should pay more;
➢ Efficient administration and collection: Entailing transparent and efficient collection and
administration – both as regards compliance costs for taxpayers and costs incurred by the Revenue Commissioners;
➢ Stability : Provides stability in projecting and meeting the revenue needs of local authorities; and
➢ Responsiveness: Over time, has regard to changing economic circumstances and policy requirements. In effect, a challenge would be to “future proof” the charging structure so that it was capable of relatively easy adjustment in the event of significant volatility in residential property prices.

Review of the Local Property Tax
33
Option 1 Proceed with revaluations in November 2016 as provided for in current legislation.
5.19 Under this option the current legal provisions would remain in place. LPT liabilities for 2017, 2018 and
2018 would be based on market values self-assessed by taxpayers on 1 November 2016.
5.20 Even if there were to be no further price increases between now and 1 November 2016, this option
would result in substantial liability increases for many taxpayers as discussed and illustrated above and in the accompanying Appendix 5. There would also be substantial increases in LPT yields. A summary evaluation of this option is outlined in Table 5.3
Table 5.3: Evaluation of Option 1 – no legislative change
Criterion Evaluation
Transparency : This criterion is satisfied.
The option would retain the transparency of the current valuation requirements for taxpayers
Fairness: The criterion is not satisfied.
While properties of comparable market values would incur comparable liabilities this option does not meet the legitimate expectations of tax payers in regard to projecting forward their future tax liabilities. Many taxpayers would face very substantial increases in tax liabilities which they are likely to perceive as unfair.
Efficient administration and collection: This criterion is satisfied
Stability: This criterion is not satisfied.
Under current circumstances some local authorities would benefit from substantial windfall gains. This illustrates the sensitivity of LPT yields for local authorities to fluctuating property price movements.
Responsiveness: This criterion is not satisfied.
The dominant driver of LPT yields would be residential property price movements. The changes in tax liabilities would not be responsive to wider economic circumstances.

Review of the Local Property Tax
34
Conclusion 5.21 Option 1 does not represent a satisfactory way forward. Those taxpayers whose properties have
increased substantially in value would perceive the liability increases as unfair. The scale of the increases likely to be experienced by some tax payers simply as a result of increases in property values, and without reference to broader economic developments, particularly in regard to prices and incomes, as well as to the financing needs of local authorities, could undermine the credibility of the LPT. On the positive side it might provide some protection against speculative price increases if potential purchasers were to factor in the cost of future LPT liabilities into purchase prices they were prepared to offer.
Alternative approaches:
Option 2: Freeze valuations at 2013 levels.
5.22 This could involve deferring a revaluation of properties until the next valuation date in the legislatively
determined cycle i.e. until 1 November 2019. Subject to any changes in the applicable LPT rates, liabilities would remain unchanged until 2020. The option is evaluated in Table 5.4.

Review of the Local Property Tax
35
Table 5.4: Evaluation of Option 2 – freeze valuations at those submitted in May 2013.
Criterion Evaluation
Transparency: This criterion is not satisfied particularly in the medium and longer term.
The option would retain the transparency of the current valuation requirements for those properties where 1 May 2013 market valuations have been submitted to the Revenue. The valuation of new properties or of significantly improved existing properties would be problematical. Artificial valuations would need to be assigned to post 2013 properties. Estimating these valuations might be perceived to be technically complex, subjective and lacking in transparency. The experience with local authority domestic rates (described in paragraph 5.24) is far from encouraging.
Fairness: The criterion is not satisfied.
Properties of comparable market values might not incur comparable liabilities depending on the date on which they were first valued – either 1 May 2013 or later. This option would not have the flexibility to adjust tax liabilities for shifts within local and regional areas in the relative values of properties – arising for example from economic developments and public and other investments in amenities (such as schools) and infrastructure (road and public transport). Owners of pre 2013 properties in areas of declining relative values would be adversely discriminated against. Arising from these considerations there would be risks of constitutional challenges to the tax; see paragraph 5.25 for further discussion. It does meet the legitimate expectations of most taxpayers in regard to projecting forward their future tax liabilities- except for properties which were valued after May 2013. For these properties, there would be continued uncertainty about future valuations.
Efficient administration and collection: This criterion is partially satisfied.
The situation for “2013 properties" would be unchanged. Compliance and collection would be more problematical for new properties.
Stability: This criterion is not satisfied.
The LPT yields for local authorities would essentially be frozen, as opposed to being relatively stable, assuming no tax rate changes.
Responsiveness: This criterion is not satisfied.
The valuation basis would not be responsive to changing economic circumstances and policy requirements

Review of the Local Property Tax
36
Conclusion 5.23 The main shortcomings to this option are not fully described in Table 5.4; if revaluations are deferred,
the experience in Ireland and in other jurisdictions is that it becomes more difficult to legislate for revaluation as changes in relative and absolute property prices become more significant. There is a strong likelihood that a deferral of the valuation date of 1 November 2016 would be followed by further deferrals as has been the case in England, Scotland and Wales. This would lead to a gradual accumulation of distortions and growing unfairness.
5.24 The experience of local authority rates which households were obliged to pay until the late 1970s25is relevant. The basis for rateable valuations was set out in the Valuation (Ireland) Act of 1852. This set the net annual value over and above rates, cost of repairs, insurance and maintenance for each property. The valuations fixed by The Griffith Valuation, which was completed in 1865, were still in force as a basis for rates until the late 1970s except in so far as they were subsequently revised. Any local authority could apply to have a general revaluation done every 14 years, but only two ever did. Dublin City was revalued in 1908-15 and Waterford City was revalued in 1924-26. As a result valuations in Dublin increased by 15 per cent and Waterford by 48 per cent. New and improved properties were subject to an annual revision but the “taxable values” were fixed at a lower than market levels in an effort to achieve some uniformity with existing valuations. From 1947, the practice was to arbitrarily fix valuations for new properties at about one third of the current net rental value for rented properties and at 1 percent of the capital value for owner occupied houses. Public confidence in the system declined and ultimately the popular and political response was to abolish the tax as it had become, and was perceived to be, increasingly unfair and detached from reality.
5.25 Freezing the valuations could potentially expose the LPT to Constitutional challenge particularly after a period during which there were significant changes both relatively and absolutely in the prices of residential properties. In 1982 the High Court found that local authority rates on agricultural land were unconstitutional. This decision was upheld by the Supreme Court in 198426. Key factors in the Supreme Court Judgement included the failure of the State to take action in addressing anomalies arising from the use of historic values for the determination of rates which, in the opinion of the Court, constituted a failure to protect property rights. The Court also indicated that within a county area reasonable uniformity of valuations was essential for justice and that the lack of any such “reasonable uniformity” leads to an unjust attack on property rights.
5.26 In England, Scotland and Wales valuations for Council Taxes were set in 1991. Complaints about the unfairness of the valuation base have grown particularly in respect of changes in relative valuations at local and regional level. Subsequent plans to carry out Council Tax revaluations have however been deferred by successive British Governments. Council Taxes do not apply to Northern Ireland. It retains the old rating system, though it is now based on capital value rather than annual rental value. The last valuation for Rates in Northern Ireland was carried out in 2007 (based on 2005 capital values). A peculiar feature of the rating system in Northern Ireland, which may be illustrative of a gradual accumulation of distortions and growing unfairness (paragraph 5.23 above), is that the maximum capital value for a residential property (for rating purposes) is £400,000. For any residential property valued at more than this, the additional value is disregarded when calculating the rates liability27. This gives rise to obvious inequities.
25 The popular understanding is that rates on households were abolished in the 1970s. Technically rates were not abolished but the obligation to pay them was removed from households and taken on by Central Government. 26 Brennan V Attorney General; [1983] ILRM 449(HC), [1984] ILRM 355 (SC)
27 http://www.nidirect.gov.uk/rates-calculation.pdf?rev=2

Review of the Local Property Tax
37
5.27. In the light of the analysis in Table 5.4, and the considerations discussed in paragraphs 5.23 to 5.26, deferring the valuation date (in effect “freezing” valuations at 2013 levels) is not recommended. It is not a sustainable way forward.

Review of the Local Property Tax
38
Option 3: Determine the mid-point of the 2013 and 2016 valuations as the taxable value.
5.28 This option would require taxpayers to value their properties in November 2016 but the liabilities for
the three years, 2017 to 2019, would be determined by the midpoint or average of the 2013 and 2016 valuation estimates. This would moderate the impact of residential price changes (increases and decreases). The option is evaluated in Table 5.5.
Table 5.5: Evaluation of Option 3: Determine the mid-point of the 2013 and 2016 valuations as being
the taxable value.
Criterion Evaluation
Transparency: This criterion is partially satisfied
The option would retain the transparency of the current valuation requirements for those properties where 1 May 2013 market value valuations have been submitted to the Revenue. The determination of a 2013 valuation for new properties would be problematical. Arbitrary and artificially subjective approaches would inevitably be required.
Fairness: The criterion is partially satisfied.
Properties of comparable market values would incur similar liabilities though the situation of properties with valuation dates after 1 May 2013 would be problematical and runs the risk of unequal treatment of comparable properties. This option would not fully adjust tax liabilities for shifts at local and regional levels in the relative values of properties – arising for example from economic developments and public and other investments in amenities (such as schools) and infrastructure (road and public transport). Owners of pre 2013 properties in areas of declining relative values would be less adversely discriminated against than would be the case under Option 2. It goes some distance to meeting the legitimate expectations of most taxpayers in regard to projecting forward their future tax liabilities but the impact on the tax liabilities for some tax payers could still be considerable.
Efficient administration and collection: This criterion is partially satisfied.
Calculation of tax liabilities would be more complex for taxpayers than under Options 1 and 2. Compliance and collection would be more problematical for new (post 2013) properties.
Stability: This criterion is partially satisfied
The impact on revenue yields would be intermediate between Options 1 and 2.
Responsiveness: This criterion is not satisfied.
Yields and liabilities would be essentially driven by property prices – albeit moderated as compared with option 1.

Review of the Local Property Tax
39
Conclusion 5.29 This option goes some distance to moderating the higher tax charges which would arise for some
properties under Option 1. Taxable valuations would be less transparent that under Option 1 and distortions would inevitably arise over time.
Option 4: Phase valuation adjustments over a three year period.
5.30 Under this option taxpayers would submit revaluations to the Revenue for their properties in November 2016 but only one third of the increase in property value would be used to determine tax liabilities in 2017 with the impact of the remaining two thirds being phased in evenly over 2018 and 2019. A summary evaluation is provided in Table 5.6.
Table 5.6: Option 4: Stagger valuation adjustments over a three year period
Criterion Evaluation
Transparency: This criterion is partially satisfied.
The option would retain the transparency of the current valuation requirements for those properties where 1 May 2013 market value valuations have been submitted to the Revenue. The determination of a 2013 valuation for new properties or for significantly improved older properties could be problematical.
Fairness: The criterion is partially satisfied.
Properties of comparable market values would incur similar liabilities. Inequities could arise in regard to comparisons of pre and post 2013 properties. This option would not fully adjust tax liabilities for shifts at local and regional levels in the relative values of properties – arising for example from economic developments and public and other investments in amenities (such as schools) and infrastructure (road and public transport). Owners of pre 2013 properties in areas of declining relative values would be less adversely discriminated against than would be the case under Option 2 and Option 3. It only goes some modest distance to meeting the legitimate expectations of most taxpayers in regard to projecting forward their future tax liabilities but the impact on the tax liabilities for some tax payers could still be considerable.
Efficient administration and collection: This criterion is not satisfied.
Calculation of tax liabilities would be more complex for taxpayers than under Options 1, 2 and 3. Compliance and collection would be more problematical for new properties.
Stability: This criterion is partially satisfied.
The impact on revenue yields would be intermediate between Options 1 and 2.
Responsiveness: This criterion is partially satisfied.
Yields and liabilities would be essentially driven by property prices – albeit moderated.

Review of the Local Property Tax
40
Conclusion The option is essentially a more complex variant of Option 3 and only partially meets the evaluation
criteria.
Option 5: Widen valuation bands while proceeding with a revaluation in November 2016
5.31 The analysis carried out by the Economics Division of the Department of Finance suggests that 46 percent of properties would remain in the same band and additional 36 percent would move only by one band under the price changes used in the model. This prima facie suggests that widening the bands would have the potential to moderate the impact of property price increases on tax liabilities. However, as already discussed by the Inter- Departmental Group on the Design of the LPT wider bands (for example to €100,000) would significantly increase the liability “step” between bands and pose challenges for compliance and transparency28. This option is evaluated in Table 5.7.
28 http://www.environ.ie/en/Publications/LocalGovernment/Administration/FileDownLoad,31669,en.Pdf (Section 3.6).

Review of the Local Property Tax
41
Table 5.7: Evaluation of Option 5 – Proceed with the revaluation in November 2016 but legislate for wider valuation bands
Criterion Evaluation
Transparency: This criterion is satisfied.
The option would retain the transparency of the current valuation requirements for taxpayers.
Fairness: The criterion is only partially satisfied.
Properties of comparable market values would incur comparable liabilities. It does not meet the legitimate expectations of tax payers in regard to projecting forward their future tax liabilities. Notwithstanding the wider bands some taxpayers could face substantial disproportionate increases in tax liabilities which they are likely to perceive as unfair.
Efficient administration and collection: This criterion is only partially satisfied
The wider bands would create challenges for compliance by taxpayers and follow up from Revenue which could negatively impact under the Fairness criterion.
Stability: This criterion is not satisfied.
Under current circumstances some local authorities could benefit from substantial windfall gains. This illustrates the sensitivity of LPT yields for local authorities to property price movements.
Responsiveness: This criterion is not satisfied.
The dominant driver of LPT yields would be residential property price movements. It would not be responsive to wider economic circumstances. More positively, it might provide some protection against speculative price increases as potential purchasers factor in the cost of LPT charges into their bidding prices though the impact would be weaker than in the case of Option 1.
Conclusion This option does not meet the evaluation criteria.

Review of the Local Property Tax
42
Option 6: Proceed with the revaluation in November 2016 but legislate to set a limit on valuation band movements
5.32 This option would over time introduce a high degree of artificiality into tax valuations, compounding the challenges posed by devising a fair valuation for post 2013 properties and would militate against Transparency and Efficiency in compliance and administration and fairness and, over time, would also fail to meet the Fairness criterion. A variant with comparable shortcomings would be to cap the value of any increases arising in 2019 in percentage or absolute value terms. Over time this would, in effect, lead to distortions resulting from a growing disconnection between real valuations and LPT liabilities.
Option 7: Allow relief for mortgages
5.33 Mortgage interest payments are currently taken into account when assessing gross income levels for deferral of LPT. This provision which is due to expire in 2017 should be continued as it represents a relief for “mortgage stressed” households with limited incomes. With this exception, the value of mortgages or mortgage interest relief are not taken into account in assessing liability.
5.34 Allowing the value of mortgages against the value of the properties would alter the basis of the LPT. The LPT (through the linkage with market value) is a tax on the amenity value of the property to the taxpayer, including the particular qualities of the property itself such as size, design and other aesthetic features, insulation, the site on which it is located. It also, importantly encompasses the characteristics of the neighbourhood and area in which the residential property is located (including school, shopping and transport access).
5.35 Allowing mortgage values to be deducted from the value of the property (i.e. using unencumbered value as the basis of assessment) would break that link and would discriminate against those tax payers without mortgages. It could also distort behaviour by encouraging taxpayers to take out larger mortgages than needed and would indirectly divert the flow of mortgage finance from less well-off mortgage applicants. An evaluation of this option is presented in Table 5.8.

Review of the Local Property Tax
43
Table 5.8: Revalue in November 2016 but allow mortgage reliefs
Criterion Evaluation
Transparency: This criterion is satisfied.
This option would be transparent for taxpayers once they had estimated the net value of their properties.
Fairness: The criterion is not satisfied
Properties of comparable market values would not incur comparable liabilities. Only c. 36 percent of residential properties are mortgaged. If the existing valuation provisions were carried forward, this option would not meet the legitimate expectations of tax payers in regard to projecting forward their future tax liabilities in the sense that the tax liabilities will not be conditioned by the financing needs of local authorities and general fiscal policy.
Efficient administration and collection: This criterion is only partially satisfied.
There would be additional complication for some tax payers and for revenue in determining tax liabilities.
Stability: This criterion is not satisfied.
Local authorities would not have stability in projecting yields over a three year period as these would be driven by changes in property values and changes in the values of mortgages taken out by taxpayers.
Responsiveness: This criterion is not satisfied.
Yields and liabilities would be driven by property price fluctuations and changes in the values of mortgages taken out by taxpayers and not by general economic and fiscal conditions.
Conclusion
5.36 This option does not satisfy the evaluation criteria and, as discussed above, would have other undesirable effects.
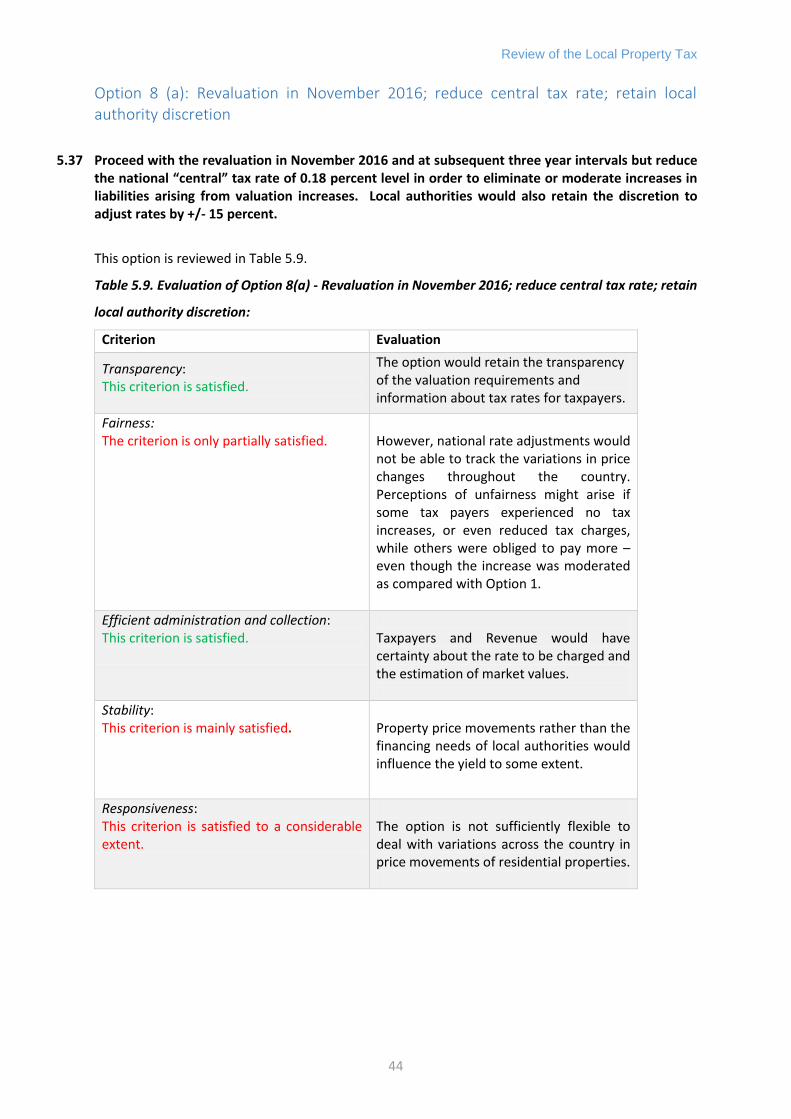
Review of the Local Property Tax
44
Option 8 (a): Revaluation in November 2016; reduce central tax rate; retain local authority discretion
5.37 Proceed with the revaluation in November 2016 and at subsequent three year intervals but reduce the national “central” tax rate of 0.18 percent level in order to eliminate or moderate increases in liabilities arising from valuation increases. Local authorities would also retain the discretion to adjust rates by +/- 15 percent.
This option is reviewed in Table 5.9.
Table 5.9. Evaluation of Option 8(a) - Revaluation in November 2016; reduce central tax rate; retain
local authority discretion:
Criterion Evaluation
Transparency: This criterion is satisfied.
The option would retain the transparency of the valuation requirements and information about tax rates for taxpayers.
Fairness: The criterion is only partially satisfied.
However, national rate adjustments would not be able to track the variations in price changes throughout the country. Perceptions of unfairness might arise if some tax payers experienced no tax increases, or even reduced tax charges, while others were obliged to pay more – even though the increase was moderated as compared with Option 1.
Efficient administration and collection: This criterion is satisfied.
Taxpayers and Revenue would have certainty about the rate to be charged and the estimation of market values.
Stability: This criterion is mainly satisfied.
Property price movements rather than the financing needs of local authorities would influence the yield to some extent.
Responsiveness: This criterion is satisfied to a considerable extent.
The option is not sufficiently flexible to deal with variations across the country in price movements of residential properties.

Review of the Local Property Tax
45
Conclusion
5.38 This option goes a considerable distance to satisfying the evaluation criteria. The principal shortcoming arises because of regional and local variations in the changes in prices of residential properties. Consequently, there would be significant proportionate variations in the tax changes experienced by taxpayers in different parts of the country. This shortcoming would be addressed by providing for rate changes at the level of each local authority. This approach is outlined in Option 8 (b).
Option 8 (b): Revaluation in November 2016; determination of tax rate in each local authority area; retain local authority discretion to adjust rates upwards by a factor of 15 percent.
5.39 Proceed with the revaluation in November 2016 and at subsequent three year intervals but
legislate to allow for the annual determination of the tax rate in each local authority area by Government. A minimum yield which must be raised by each local authority would be set centrally by Government. Local authorities would have the discretion to adjust rates upwards by a factor of 15 percent.
5.40 Under this approach tax rates could be structured having regard to wider economic circumstances,
particularly movements in prices and incomes, and wider Budgetary and public policy (e.g. in regard to the financing of local authorities). A step by step illustration of a possible approach to achieving this outcome is provided below.
5.41 Illustration of Option 8: Proceed with the revaluation in November 2016 and subsequent years but legislate to allow for the annual determination of the tax rate for each local authority area. A minimum yield which must be raised by each local authority would be set centrally by Government. Local authorities would have the discretion to adjust rates upwards by a factor of 15 percent.
Box 5.1
Step 1 Government would set the aggregate target national yield from LPT as part of the national Budgetary process
Step 2 This would be apportioned between local authority areas having regard to historical yields. This would in effect set a target minimum yield for each local authority.
Step 3 The Department of Finance and Revenue, using the LPT tax base data and other relevant information, would estimate the property tax rates to be applied in each local authority area in order to raise this minimum yield. Final rates would be determined by Government. Local authorities on receipt of this information could adjust this rate upwards by a factor of up to 15 percent.
Step 4 Revenue request households to self-assess and return current market values, and to apply LPT rate as decided. Local authorities could adjust the rates upwardly by a factor of 15 percent.
This option is evaluated in Table 5.10

Review of the Local Property Tax
46
Table 5.10. Evaluation of Option 8 (b): Proceed with the revaluation in November 2016 and
subsequent years but legislate to allow for the annual determination of tax rate at the level of each
local authority.
Criterion Evaluation
Transparency: This criterion is satisfied.
The option would retain the transparency of the valuation requirements and information about tax rates for taxpayers.
Fairness: The criterion is satisfied.
Properties of comparable market values located in the same local authority areas would incur comparable liabilities. It meets the legitimate expectations of tax payers in regard to projecting forward their future tax liabilities in the sense that the tax liabilities will be conditioned by the financing needs of local authorities and general fiscal policy rather than being driven exclusively by changes in property values.
Efficient administration and collection: This criterion is satisfied.
There would be some additional modest costs in determining tax rates in each local authority area before the commencement of the next valuation cycle.
Stability: This criterion is satisfied.
Local authorities would have stability in projecting yields over a three year period.
Responsiveness: This criterion is satisfied.
Under this option LPT yields would be determined by policy decisions at national and local authority levels having regard to economic and budgetary factors.
Implications of this option 5.42 Setting property tax rates for each individual local authority area would emphasise very strongly the
local character of the tax and would mark significant progress in meeting the three challenges identified by the Inter-Departmental Group and outlined earlier in this report (ref paragraph 2.6). This option would allow significant flexibility so as to better align LPT rates with property price developments in local authority areas, while also continuing to provide a significant local source of funding for local authority sources.

Review of the Local Property Tax
47
Possible deferral of the valuation date 5.43 It would be desirable that the technical work entailed in developing and putting in place the processes
outlined in the box above should not be done in a compressed time scale29. It will be necessary to align the new processes with the arrangements for the settlement of local authority budgets and the development and, particularly the testing, of the methodology for updating the value of the property tax bases in each local authority area. To achieve this it may be necessary to delay the next revaluation from November 2016 to November 2018 or November 2019.
5.44 Acceptance of this recommendation could be accompanied by a changeover to a five, rather than three, year valuation period. This would reduce the compliance requirements for tax payers and reduce administrative costs for Revenue. However, a five year cycle could also raise concerns among the public about “valuation shocks” as the new valuation dates approach. Consideration might be given as to weighing up the pros and cons of these two approaches.
Overall conclusion and recommendation: 5.45 The LPT charge on any residential property is calculated by multiplying the estimated market value of
the property by the tax rate. The conclusions drawn from the analysis in this chapter are that there
are serious shortcomings in the current system of applying a central rate (with some local
modifications) to periodically reviewed market value estimates. This system does not offer relative
stability to taxpayers, local authorities or central government. Some taxpayers, depending on where
their properties are located, would be faced by significantly increased tax charges driven by property
price changes and some local authorities would incur windfall revenue gains. Attempts to adjust this
system by freezing or adjusting valuations are not a way forward. Adjustments attempted by freezing
or otherwise “managing” the valuations would cause inequities between taxpayers, damage
transparency and in some cases could be open to legal challenge.
5.46 A new system is recommended whereby a minimum level of LPT revenues in each local authority area
would be determined by Government, ideally having regard to the apportionment between local
authority areas of the historic yield. This in turn would in turn allow for the estimation of LPT rates for
each local authority area and the application of these by taxpayers and Revenue. Local authorities
could adjust this rate upwards by a factor of up to 15 percent.
5.47 In order to allow this new system to be put into place and tested, as well as to align the new system
with the processes for the determination of local authority budgets, it may be necessary to delay the
next valuation date from November 2016 to November 2018 or November 2019.
This new system is recommended – with a possible interim deferral of the next valuation date until November 2018 or November 2019. In order to provide policy clarity and stability, and to avoid risks of legal challenges arising from the deferral of the valuation dates, it is strongly recommended, and indeed it should be an intrinsic part of the change over to the new system, that the legislative changes establishing the new system and providing for the deferral of the valuation date from November 2016 be made concurrently30.
29 Particularly steps 1, 2 and 3. 30 Legislating for the intention to update the valuation base would address the issue of failure of the State to act which was a major factor in the 1982 and 1984 judgements referred to earlier.
Review of the Local Property Tax
48
Role of local authorities 5.48 It is notable that despite representing a new and potentially stable source of revenues for local
authorities there appears to be little evidence of support or “ownership” of the tax at local authority level. It is recommended that the local authorities collectively engage with the Office of the Revenue Commissioners, who collect the tax on their behalf, to identify and agree how they could assist Revenue in administering the tax.31 In addition, it would be timely for local authorities to communicate to the general body of tax payers in their areas and to individual households programmatic and other useful information on how they spend the public funds available to them and the proportionate contribution made by the LPT. This practice of communicating such information to households is widespread in other countries. However, perhaps as a result of the “cultural changes” consequential on the substitution of Exchequer funding for local authority household rates, it does not appear to have been the practice in this jurisdiction.
The Equalisation Fund 5.49 It would be important, particularly if there is significant variation in tax rates between different areas
that tax payers have the assurance that local taxes raised in their areas are spent locally. The retention of 100 percent of the LPT revenues in each local authority area would enhance accountability at local level, and thereby strengthen local democracy.
5.50 In that regard, it is recommended that consideration be given to phasing out the Equalisation Fund mechanism and providing from the Exchequer, on the basis of need, the supplementary funding to those local authorities who are judged not to be able meet their funding needs from their own resources. It is not intended to contest the “solidarity principle” underpinning the provision of financial support for local authorities with weaker tax bases. Rather, it is recommended that this should be done, on the basis of need, from the Exchequer rather than from local taxes.
Nomenclature change 5.51 If this option is accepted, consideration might be given, consistent with the increased local character
of the tax, to re designate the Local Property Tax (LPT) as the Local Council Tax (LCT).
Recommendations Local authorities to be more engaged in supporting the Office of the Revenue Commissioners and
also to provide the general public and individual households with programmatic and other useful
information on how they spend the public funds available to them and the proportionate
contribution made by the LPT.
Local authorities to retain 100 percent of the LPT revenues raised in their areas. Authorities with
weaker tax bases to receive supplementary Exchequer funding as needed.
Consideration be given to re-designate the Local Property Tax (LPT) as the Local Council Tax (LCT).
31 A possible role for the local authorities might be to investigate, at the request of the Revenue, claims for exemptions or valuation reductions resulting from pyrite damage or other structural issues.

Review of the Local Property Tax
49
Chapter 6: Other Issues
Properties damaged by pyrite
Properties occupied by individuals who are disabled
Deductibility of LPT as an expense for Landlords
Properties damaged by pyrite 6.1 Certain properties that are proved to have been significantly damaged by pyrite are eligible for a
temporary exemption from LPT. Pyrite damage can be proved only by the laboratory testing of the
hard-core infill material taken from underneath the property. Currently the cost of inspection and
testing (in the region of €2,000) to avail of the LPT exemption must be borne by the property owner,
unless the property is remediated by the Pyrite Resolution Board (PRB). The cost of exemption and
testing is generally considerably greater than the annual tax charge.
Recommendations It is recommended that:
the exemption continue in place but it be restricted to those properties that have been certified as having a damage rating of ‘2’ or ‘1 with progression’;
pyrite damage continue to be proved by inspection and testing by a competent person in accordance with a standard published by the National Standards Authority of Ireland (NSAI); where liable persons elect not to incur the costs of testing they have the option of submitting by way of self-assessment a value to Revenue for the property which in their view reflects its current market value;
where the PRB is prepared to remediate a property without carrying out laboratory testing, Revenue accept a confirmation of remediation from the PRB in lieu of the NSAI certificate:
where a party such as a guarantee company or a builder/developer remediates a property or compensates the property owner in lieu of remediation, Revenue accept confirmation of this from the party in lieu of the NSAI certificate.
Review of the Local Property Tax
50
Properties occupied by individuals who are disabled
Summary of issues The Finance (Local Property Tax) (Amendment) Act 2013 introduced provisions to provide some
measure of relief for individuals who are permanently incapacitated to such an extent that they cannot maintain themselves by earning an income from working and whose condition is so severe that it dictates the type of property they can live in.
An exemption from the Local Property Tax (LPT) applies to a residential property purchased, built or adapted to make it suitable for occupation by a permanently and totally incapacitated individual as their sole or main residence subject to certain conditions which are publicised by Revenue32
It became apparent that the effect of some of the conditions to avail of this relief excluded some people from obtaining relief whose circumstances were, in substance, the same as those who were eligible for relief33. The Minister decided to correct the anomalies and inequities involved. These anomalies are currently being addressed administratively by the Revenue Commissioners under its care and management functions.
The Finance (Local Property Tax) (Amendment) Act 2013 also introduced relief by way of reduced
chargeable value for residential properties that have been adapted for occupation by a disabled person where the adaptation work increases the market value of the property, subject to the conditions publicised by Revenue.
Recommendation 6.2 I have concluded that, while the administrative changes introduced by the Minister were warranted,
it would be appropriate to make a further amendment in relation to the issue of reduced chargeable value. The relevance of a threshold linked to local authority grant limits is questionable where local authority grants are no longer a necessary requirement to avail of the relief. While a threshold is appropriate, a threshold of €50,000 (equivalent to one bandwidth) is more relevant and apt. This still ensures the relief will be limited to one bandwidth but also allows for more equitable treatment of homeowners in comparable situations. This would not amount to a significant expansion of current provisions in relation to incapacitated persons but it would be more equitable by ensuring all intended recipients can avail of the relief. Accordingly, it is recommended that:
The changes currently being administered by the Revenue under their care and management provisions should be covered by amending legislation, as, it is understood, is the Minister’s intention; Additionally, with regard to the relief by way of reduced chargeable value, increase the threshold to the lesser of the increase in chargeable value or €50,000 which would ensure everyone who meets the qualifying conditions could benefit from the relief by way of reduced chargeable value up to a maximum reduction of €90 (one bandwidth). The relief would still only apply where the adaptations increase the chargeable value of the property.
32 www.revenue.ie/en/tax/lpt/extension-reliefs-disabled- incapacitated.html 33 The conditions applied under the legislation were that eligibility for the exemption is limited to situations where there is a receipt of an award from a Court or the Injuries Board or where a public trust fund is established or that eligibility for relief by way of reduced chargeable value is limited to situations where adaptation works have been grant aided or approved for grant aid from a local authority. The purpose of these requirement was to provide an objective and independently verifiable eligibility test.

Review of the Local Property Tax
51
Deductibility of LPT for income or corporation tax purposes by landlords of rental properties
6.3 The Inter-Departmental Group34 which reported in 2012 on the Design of the Property Tax 35 recommended that LPT be allowed as a tax deduction to landlords of residential properties as a deduction against income tax or corporation tax on profits from rental income. The Group took the view that LPT is “a genuine expense of the transaction under which rents are received” and as a consequence agreed that “there would be an equity argument for allowing, at least a portion of, LPT (including the NPPR addition36) paid in respect of a rented property to be deductible for tax purposes in the same way as commercial rates are deductible for tax purposes”. The Group recommended that consideration be given to phasing in deductibility over a period of years having regard to the pressures on the public finances. To date, LPT has not been allowed as a deduction.
6.4 On further consideration, this recommendation in favour of deductibility does not rest easily with the
concept of the LPT as a tax on the amenity value of residential properties rather than as a business cost. Owners and tenants of rental properties both derive value from the amenity value of these properties (the owner in the form of the rent and the tenant from living in the property). This contrasts with the situation regarding local authority rates on commercial properties. Owner occupiers are not allowed to claim LPT as a deduction against income tax. It is not appropriate on conceptual and equity grounds that they should. There is a need to ensure equity between owners of all residential properties – whether owner occupiers or landlords. I recommend, after further reflection, that it would be inappropriate to allow LPT as a deduction against the taxation of income from rents on residential properties.
Recommendation LPT should not be allowed as a deduction in computing net profits from the letting of residential
properties for income and corporation tax purposes.
34 I was chair of this group and was a party to its recommendations. 35 http://www.environ.ie/en/PublicationsDocuments/FileDownLoad,31669,en.Pdf, Chapter 5, Section 5.2 36 When the group reported the Non Principal Private Residence (NPPR) charge was still in force. That charge has since been abolished.

Review of the Local Property Tax
52
Chapter 7: Review of the Local Property Tax – Economic Analysis Analysis of Recent Property Price Developments and Implications for Tax Liabilities and Revenue Yield (This report was prepared by Brendan O’Connor and Donal Lynch of the Economics Division in the Department of Finance, and underpins the analysis in Chapter 5; the authors would like to extend their thanks to David Hegarty, Gavin Murphy and Dr Keith Walsh for their valuable comments.)
Introduction
7.1 This report sets out estimates of the potential implications for taxpayer liabilities of property price developments since the first market value estimates for local property tax (LPT) purposes were made in May 2013.
7.2 Over the period May 2013 to May 2015, property prices increased nationally by 26 per cent, according to the Residential Property Price Index produced by the Central Statistics Office. This overall increase masks considerable regional variation; prices in Dublin increased by approximately 41 per cent while properties outside of Dublin increased by 14 per cent.
7.3 Taxpayer filings with the Revenue Commissioners in May 2013 provide information on the number of properties within each €50,000 wide valuation band. However, the filings do not provide the exact market values at that time as taxpayers were only asked to place their property within a valuation band.
7.4 While there is no single source of data on actual property values in May 2013, we use a range of sources to estimate a representative sample of market values at that time. We take account of changes in property prices by rolling forward these values based on price developments since the original valuation period. The implications of these price changes for taxpayer liabilities can then be estimated.
7.5 On the basis of this approach, we estimate that if a revaluation were to take place based on price changes to May 2015:
• 48% of properties would remain in their original valuation band; • 35% of properties would move up by one valuation band; • 10% of properties would move up by two bands; and, • The remainder would move up by between three and six valuation bands.
7.6 This indicates that if a revaluation were to occur today there would be significant increases in tax liabilities for some taxpayers, with properties in the higher valuation bands in May 2013 experiencing the largest number of band movements. The analysis also indicates a wide degree of regional variation in band changes, with the largest movements in bands mainly occurring in the Dublin area.
7.7 This report continues as follows:
• From paragraph 7.8 to 7.26 recent price developments and available data in the property sector are discussed. This section also describes an estimation methodology used to generate a sample of property values in May 2013 which are then assigned to valuation bands for comparison with taxpayer filings with the Revenue Commissioners;
• Paragraphs 7.27 to 7.46 roll forward property values based on recent market trends and consider the implications for taxpayer liabilities; and,
• Paragraphs 7.47 to 7.65 estimate the possible impact of property price changes for LPT revenue.

Review of the Local Property Tax
53
Property Price Developments and Data Residential Property Price Index
7.8 The following paragraphs discuss the two main sources of data on property price developments, namely the Residential Property Price Index and the Property Price Register, and describes a method that uses these data sources to construct a sample of property prices in May 2013, the time period used for Local Property Tax valuation purposes. Changes in residential property prices are provided by the Central Statistics Office (the CSO) through the monthly Residential Property Price Index (RPPI). The RPPI reports property price changes by type, i.e. houses and apartments, both on a national basis and for Dublin. A sub index for national price developments excluding Dublin is also produced.37
7.9 The RPPI is a hedonic, Laspeyres-type index constructed on the basis of mortgage drawdowns and as such does not include residential property purchases by cash buyers. This means that while the index is the most appropriate available source on property price changes, it does not capture all transactions. As a result, its representativeness of the whole residential property market may vary over time, in line with the total proportion of transactions made up of mortgages. The RPPI is not seasonally adjusted. There is also a lag, typically of one to three months between when the sale closes on a property and when the mortgage is drawn down which affects the real time nature of the index.
7.10 By definition, as each index and sub-index represent an average change, the RPPI does not show price changes for each individual property. The index masks the diversity of price paths of properties with particular characteristics such as number of bedrooms, floor area, etc. However differences in these characteristics are controlled for by the CSO in constructing the index. Similarly, not revealed in the RPPI sub-indices are the differing price paths across the different regions, i.e. within Dublin and across counties.
7.11 Over the period May 2013 to May 2015,38 property prices increased nationally by 26 per cent. This overall increase masks the variation in increases across regions with properties in Dublin increasing by approximately 41 per cent, while properties outside of Dublin increased by 14 per cent. Similarly there were substantial differences between the houses and apartments indices on a national basis. Figure 1 below shows price developments since May 2013 for each of the sub-indices of the RPPI with each index rebased to 100 in May 2013.
37 The CSO use three month moving averages for the RPPI series in order to smooth out short-term volatility in the series and highlight longer-term trends. 38 The level of property prices in December 2014 was higher than each of the first three months of 2015.

Review of the Local Property Tax
54
Figure 1: CSO Residential Property Price Index developments, May 2013 – May 2015, May 2013 = 100 Source: Central Statistics Office Notes: The overall national index is not displayed as it broadly mirrored the national-houses index given the high weighting of houses in the index.
Property Price Register
7.12 The Property Services Regulatory Authority (PSRA) publishes a Residential Property Price Register (“the property register”). The property register includes information on date of sale, price and address for all residential properties transacted in Ireland since 1 January 2010, as declared to the Revenue Commissioners for stamp duty purposes. In addition, it identifies whether the price shown represents the full market price and whether the property was a second-hand or new dwelling. In the case of the latter, prices are recorded on a VAT exclusive basis.
7.13 As of February 201539 there were over 136,000 transactions recorded in the property register. This compares with the overall stock of residential properties of 2 million according to the 2011 Census and 1.85 million according to property tax filings with the Revenue. The total number of property transactions on the register therefore represents as much as 7% of the total stock.40 The breakdown of properties recorded in the property register on an annual basis from 2010 to 2014 is presented in the table below.
Year Number of Observations
2010 20,900
2011 18,200
2012 25,100
2013 29,700
2014 42,100
Total 2010-2014 136,000
Table 1: Observations from PSRA Property Price Register, 2010-2014
39 The construction and cleaning of the data set took place in spring 2015. 40 This ignores where particular properties are transacted multiple times.

Review of the Local Property Tax
55
Estimating a distribution of market values in May 2013
7.14 As described later in the Chapter, the Revenue Commissioners hold considerable data on the numbers of properties in each property tax valuation band in May 2013, both nationally and at a county level. The data is based on property owners’ own valuations at that time. However as property owners were not asked for an actual value estimate, but rather which valuation band of €50,000 the valuation fell within, the usefulness of this data source in modelling the impact of recent property price changes is limited. While a single sample point from a band could be rolled forward by reference to recent price growth, for instance the mid-point of a band, the wide range of variation of actual prices within each band would result in very large estimation errors. Instead we use an alternative approach based on a sample of the overall stock of property values based on the property register.
7.15 For the purposes of analysing the property register data, it was necessary to undertake some cleaning and adjustments to the data. Whilst this approach required an element of judgement, it was necessary in order to draw reasonable analytical inferences from the data.
• Firstly, some 6,500 transactions that were marked as being conducted at a price not equivalent to “Full Market Value” were removed.
• Secondly, an exercise was undertaken to remove errors, which included incorrect prices, double or multiple entries of the same properties, and single entries that represented multiple transactions (e.g. if an apartment complex was transacted).
• Thirdly, a further 300 entries were removed where the value was below €10,000, a threshold below which the transaction may not relate to a finished property.
• This leaves a total sample size after data cleaning of 128,700 properties.
Number of Observations
Total observations 136,000
Remove properties marked “Not Full Value”
129,600
Remove errors & multiples 129,000
Remove all properties less than €10,000 128,700
Table 2: Steps in data cleaning exercise
7.16 In addition to removing some observations to enable a more accurate and representative sample, it was also necessary to add back the VAT onto the “VAT exclusive” price at which new dwellings in the register were recorded. This affected some 19,000 entries in the register.
7.17 Having cleaned the property register data, all remaining observations from 2010-2014 were rebased to May 2013 prices using the CSO RPPI. In order to capture some degree of the variation in property prices across the country, the sample was split into three regions and an applicable index from the RPPI was applied as follows:
I. Dublin houses and apartments were rebased using the Dublin house and apartment price indices respectively.
II. Houses and apartments in the Dublin commuter counties of Kildare, Meath and Wicklow, as well as Cork City and Galway City, were rebased according to the national house and apartment price indices respectively.
III. Properties in all other areas were rebased using the ‘National excluding Dublin’ index.
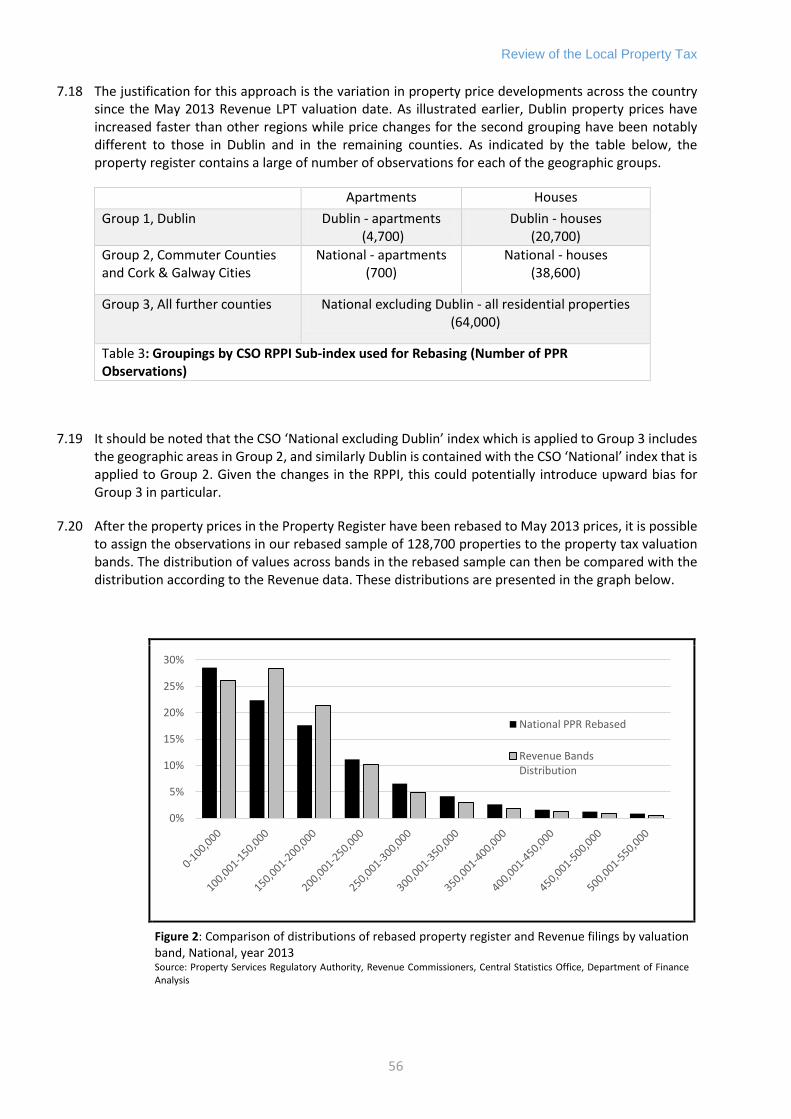
Review of the Local Property Tax
56
7.18 The justification for this approach is the variation in property price developments across the country since the May 2013 Revenue LPT valuation date. As illustrated earlier, Dublin property prices have increased faster than other regions while price changes for the second grouping have been notably different to those in Dublin and in the remaining counties. As indicated by the table below, the property register contains a large of number of observations for each of the geographic groups.
Apartments Houses
Group 1, Dublin Dublin - apartments (4,700)
Dublin - houses (20,700)
Group 2, Commuter Counties and Cork & Galway Cities
National - apartments (700)
National - houses (38,600)
Group 3, All further counties National excluding Dublin - all residential properties (64,000)
Table 3: Groupings by CSO RPPI Sub-index used for Rebasing (Number of PPR Observations)
7.19 It should be noted that the CSO ‘National excluding Dublin’ index which is applied to Group 3 includes the geographic areas in Group 2, and similarly Dublin is contained with the CSO ‘National’ index that is applied to Group 2. Given the changes in the RPPI, this could potentially introduce upward bias for Group 3 in particular.
7.20 After the property prices in the Property Register have been rebased to May 2013 prices, it is possible to assign the observations in our rebased sample of 128,700 properties to the property tax valuation bands. The distribution of values across bands in the rebased sample can then be compared with the distribution according to the Revenue data. These distributions are presented in the graph below.
Figure 2: Comparison of distributions of rebased property register and Revenue filings by valuation band, National, year 2013 Source: Property Services Regulatory Authority, Revenue Commissioners, Central Statistics Office, Department of Finance Analysis
0%
5%
10%
15%
20%
25%
30%
National PPR Rebased
Revenue BandsDistribution

Review of the Local Property Tax
57
7.21 As can be seen, the total distribution in the rebased property register sample is broadly similar to the distribution based on filings with the Revenue Commissioners. There is a slightly higher incidence of properties in Bands 2 and 3 in the Revenue distribution, with a compensating higher incidence of properties in other valuation bands in the rebased property register sample. Factors influencing these differential patterns include the impact of local authority owned housing (discussed below), as well as a relatively higher frequency with which different value properties are transacted.
7.22 For Dublin the rebased property register distribution has a significantly lower incidence of properties in the first valuation band relative to the Revenue distribution. Thereafter the distributions are broadly similar. The deviation in the first valuation band may be explained by the higher incidence of local authority owned housing in Dublin, which accounts for some 51,000, or 35% of the total stock of 149,000 local authority owned units in the country.
7.23 Local authority owned units are very unlikely to have transacted over the period 2010-2014 and as such will not be represented on the property register. Furthermore all local authority owned properties were assigned to the first valuation band until 2016 under Section 17 (6) of the Finance (Local Property Tax) Act 2012, thus creating a temporary disconnect between a market value distribution of property values and the distribution of filings with Revenue.
7.24 When these factors – the impact of local authority owned housing and the higher frequency with which different valued properties are transacted - are taken into account, it is evident that the rebased property register is broadly representative of the Revenue filings in May 2013 for both the National and Dublin distributions.
7.25 The actual variation of values within the Revenue valuation band filings is not known. This limits the usefulness of the Revenue distribution in modelling the impact of recent price changes. However, on the basis that the rebased property price register data appears to be broadly representative of the actual Revenue filings in terms of variation across bands, it appears reasonable to use variation within bands from the rebased property register data as a proxy for variation within the Revenue bands. In other words, the estimated distribution of property values within a given valuation band in the rebased sample will be used as a proxy for the actual distribution of values within the same band in the Revenue distribution41.
7.26 We now proceed to use the variation within bands in the rebased sample to roll forward the full population of property values from the Revenue filings to take account of recent price changes. We then use these estimates to analyse the impact that price changes could have on taxpayer liabilities if a revaluation for property tax purposes were to take place now using the existing band and rate structure.
Implications of Price Developments for Taxpayer Liabilities
7.27 Up until this point, we generated a distribution of estimated market values in May 2013 prices based on a sample of 128,700 properties from the property register. When assigned to valuation bands, the sample was shown to be broadly representative of the valuation bands distribution based on filings with the Revenue Commissioners.
7.28 Now we apply price changes since the May 2013 valuation to the sample from the property register to estimate the impact of price changes on taxpayer liabilities. This involves three steps:
41 An analysis of the Property Price Register indicates that properties are uniformly distributed within bands such that it would be expected that 2% of properties in each €50k band would be expected to lie within each €1k sub-interval.
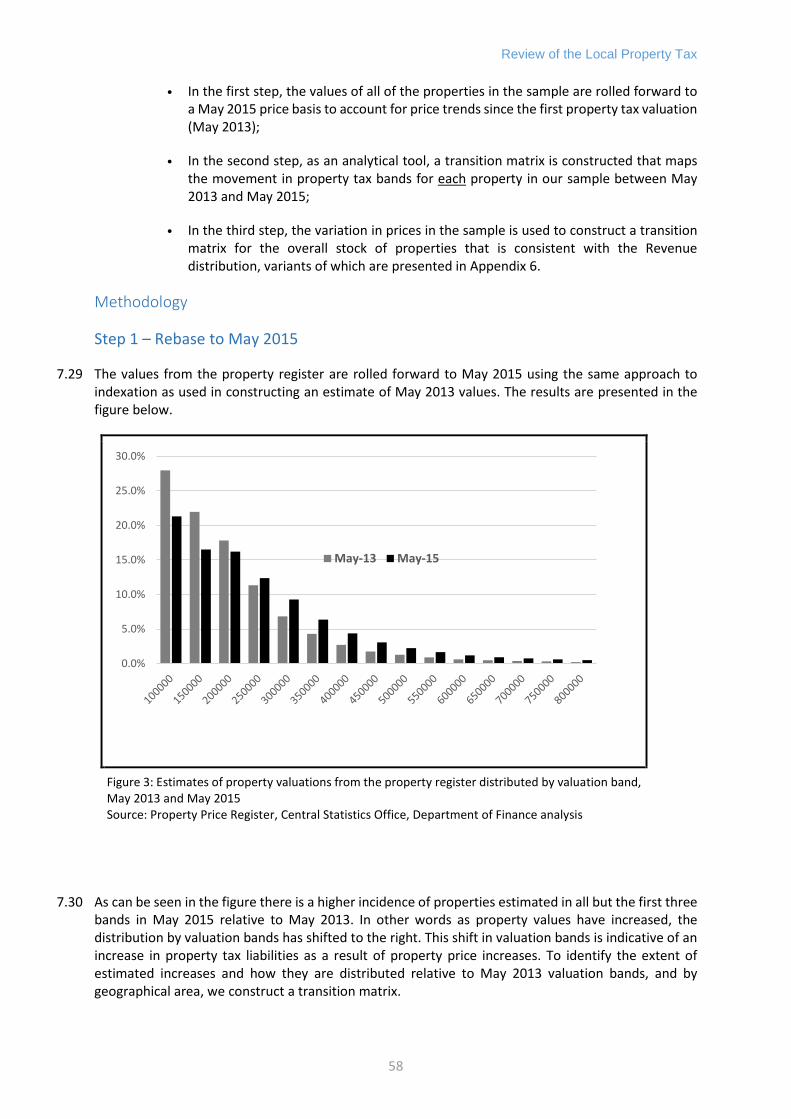
Review of the Local Property Tax
58
• In the first step, the values of all of the properties in the sample are rolled forward to a May 2015 price basis to account for price trends since the first property tax valuation (May 2013);
• In the second step, as an analytical tool, a transition matrix is constructed that maps the movement in property tax bands for each property in our sample between May 2013 and May 2015;
• In the third step, the variation in prices in the sample is used to construct a transition matrix for the overall stock of properties that is consistent with the Revenue distribution, variants of which are presented in Appendix 6.
Methodology
Step 1 – Rebase to May 2015
7.29 The values from the property register are rolled forward to May 2015 using the same approach to indexation as used in constructing an estimate of May 2013 values. The results are presented in the figure below.
Figure 3: Estimates of property valuations from the property register distributed by valuation band, May 2013 and May 2015 Source: Property Price Register, Central Statistics Office, Department of Finance analysis
7.30 As can be seen in the figure there is a higher incidence of properties estimated in all but the first three bands in May 2015 relative to May 2013. In other words as property values have increased, the distribution by valuation bands has shifted to the right. This shift in valuation bands is indicative of an increase in property tax liabilities as a result of property price increases. To identify the extent of estimated increases and how they are distributed relative to May 2013 valuation bands, and by geographical area, we construct a transition matrix.
0.0%
5.0%
10.0%
15.0%
20.0%
25.0%
30.0%
May-13 May-15
Review of the Local Property Tax
59
Step 2 - Transition Matrix for Sample
7.31 A transition matrix is a useful analytical tool that maps the movements in property prices across valuation bands between two time periods. The rows in a transition matrix represent the property valuation bands in May 2013 while the columns indicate the bands in May 2015. Thus the entries across a row in the transition matrix show the ‘transitions’ of properties in a given valuation band in 2013 to valuation bands in May 2015 as a result of changes in property values over the period.
7.32 For instance row 1 of a transition matrix will report the movements in properties that were valued in Band 1 in May 2013 (i.e. properties valued less than €100,000), by allocating properties to various valuation bands based on their valuation changes over the period. Rows 2 to 20 of the transition matrix will report similar results for properties that were valued in Bands 2 to 20 in May 2013.
7.33 A transition matrix is first constructed for the property register sample. The next step in involves applying population weights from the Revenue distribution to convert from a matrix based on the sample to a transition matrix for the full population of residential properties.
Step 3 – Transition Matrix for Population
7.34 In constructing the transition matrix for the overall stock of properties, the variation in prices in the sample is used to construct a transition matrix for the overall stock of properties that is consistent with the Revenue distribution. Separate estimates are made for Dublin and the rest of the country, referred to as ‘national outside Dublin’, which are then summed to create a national transition matrix. Variants of these ‘population’ transition matrices are presented in Appendix 6.
7.35 The tables in Appendix 6 present the results of the transition matrix analysis. Nine tables are presented, three for the national distribution, three for Dublin and three for national outside Dublin which show:
• First, the total number of properties that are estimated to have ‘transitioned’;42
• Second, the share of properties that have transitioned as a percentage of the total stock,43 and;
• Third, the share of transitions as a percentage of the stock in each Revenue valuation band in 2013.44
7.36 The results indicate large variation in possible changes to tax liabilities by geographic area suggesting large variation in tax liabilities across the geographic and value distributions.
National Transitions
7.37 The National transition matrices (Appendix 6 Tables 1-3) indicates that:
• 48% of properties remain in their original band; 45
• 35% of properties move up by one band;
42 Tables 1, 4 and 7 for National, Dublin, and National Outside Dublin respectively. 43 Tables 2, 5 and 8 for National, Dublin, and National Outside Dublin respectively. 44 Tables 3, 6 and 9 for National, Dublin, and National Outside Dublin respectively. 45 This is calculated as the sum of the diagonal from the first cell (Band 1 May 2013, Band 1 May 2015) to the last cell (Band 20 May 2013, Band 20 May 2015) in Table 3. The figures in the transition tables assume that social housing properties (which are deemed to be in Band 1 in May 2013) remain in Band 1 on revaluation.

Review of the Local Property Tax
60
• 10% of properties move up by two bands; and,
• The remainder move up by between three and six valuation bands.
7.38 A more detailed inspection of band movements from May 2013 shows that for properties that were valued in the first five bands in 2013, (i.e. properties with 2013 market values below €300,000 and which accounted for 92 per cent of the overall stock) the maximum number of band movements is estimated at three.46 These are modelled to have occurred for properties that were in Bands 4 to 6 in 2013 (i.e. properties valued between €200,000 and €300,000). However as shown in the Table below, which is taken from Table 3 in Appendix 6, the majority of properties in each of these 2013 valuation bands are estimated to have moved up by two bands or less.
Table 4:
Example of estimated band movements for properties in Bands 4, 5 and 6 in May 2013. (From Transition Matrix 3)
2014 Valuation Band Band 4 Band 5 Band 6 Band 7 Band 8 Total
200-250k 250-300k 300-350k 350-400k 400-450k
2013 Valuation Band
Band 4 200-250k 15% 50% 34% 1% 100%
No change One band Two band Three bands
Band 5 250-300k 8% 28% 48% 15% 100%
No change One band Two band Three bands
7.39 The remaining five per cent of properties nationally are those that had a market value greater than €350,000 in 2013. Some properties within this group (those that were valued between €550,000 and €750,000 in 2013) will have jumped by as much as six bands. However this group of properties only represent approximately one per cent of the overall stock.
Dublin
7.40 In Dublin the transition matrices (Appendix 6 Tables 4-6) indicate that:
• 14% of properties remain in their original band; 47
• 31% of properties move up to the next band;
• 33% of properties move up by two bands;
• 13% of properties move up by three bands; and,
• 10% move up by between four and six valuation bands.
46 It should be noted that price increases applied in this analysis are average changes, thus actual properties will be more dispersed in terms of band changes relative to the results presented herein, and will include band movements of more than 3 bands. 47 This is calculated as the sum of the diagonal from the first cell (Band 1 May 2013, Band 1 May 2015) to the last cell (Band 20 May 2013, Band 20 May 2015) in Table 6.
Review of the Local Property Tax
61
7.41 In Dublin the largest estimated movements in bands are for properties that were valued in Bands 6 to 14 in 2013, in other words properties valued between €300,000 and €750,000 at that time. Some properties in this group are estimated to have moved up by between four and six valuation bands. Sizeable jumps are found for the majority of properties in each of these bands. For instance:
• In Band 7 (€350,000 to €400,000) 83% of properties are estimated to have moved up by three bands or more;
• In Band 8 (€400,000 to €450,000) 100% of properties are estimated to have moved up by three bands or more; and,
• In Band 12 (€600,000 to €650,000) 84% of properties are estimated to have moved up by five bands or more.
7.42 It is unsurprising that some properties in Dublin are estimated to have seen greater movement in valuation bands compared with the overall national transitions. This is both a function of the higher incidence of higher value properties in Dublin and the higher average rate of property price increase in the region. The implication of the former is that given an equivalent proportionate increase in property prices, higher valued properties will move up a greater number of valuation bands than lower value properties.
7.43 On the other hand, large movements through valuation bands for higher value properties result in similar proportional changes in the property tax liability as occurs for smaller band movements for relatively lower value properties. For instance, the changes in liability for movements of five to six bands for properties originating in Bands 11, 12 and 13 are in the range of 37% to 52%, which is similar to the 35% to 53% change in liability for properties originating in Bands 7 and 8 that moved up by three to four bands.
7.44 It should also be noted that properties in Bands 7 to 14 in 2013 values accounted for 15 per cent of the stock of properties in the Dublin area. Nationally there were only five per cent of properties in these valuation bands in 2013, the majority of which were in Dublin. As noted above, over three quarters of properties in Dublin are found to have moved up by no more than two valuation bands, with thirty per cent of all properties modelled to move up by just one band.
National Outside Dublin
7.45 The National Outside Dublin transition matrices (Appendix 6 Tables 7-9) indicate that:
• 61% of properties remain in their original band; 48
• 37% of properties move up by one band;
• The remaining 2% of properties move up by between two and five bands.
7.46 The combination of lower property values – 95% of properties were estimated to be in the first four bands as of May 2013 – and more moderate property price increases, leads to estimates that the vast bulk of properties either experience no band movement or a single band jump. Roughly one quarter of 1% of properties are found to move up by three bands or more.
48 This is calculated as the sum of the diagonal from the first cell (Band 1 May 2013, Band 1 May 2015) to the last cell (Band 20 May 2013, Band 20 May 2015) in Table 9.

Review of the Local Property Tax
62
Yield Estimates
7.47 Using the distribution of property values estimated previously, and set out in Appendix 6, it is possible to generate a projection of the revenue yield which would result if the current property tax regime (i.e. the current valuation band and rate structure) was maintained and applied to updated property values.
7.48 In what follows, we describe a method for generating a yield estimate associated with the estimated updated property values. This involves applying the current property tax regime to the May 2015 estimated property value distribution.
Yield Estimation Method
7.49 The method used for calculating transition matrices involved using variation within bands from the property register as a proxy for variation within bands in the Revenue distribution in 2013, and using this proxy to roll forward the Revenue bands into a 2014 price basis. We therefore start by constructing a 2013 yield purely on the basis of the Revenue distribution, i.e. assuming no deferrals, exemptions or non-payment, and comparing with actual collections that year. This acts as a benchmark to test the accuracy of estimate projections and indicates the appropriateness of the yield estimation methodology used. The differential is then incorporated when estimating a May 2015 yield based on recent price changes.
7.50 Next, the estimated 2015 property price distribution from the national transition matrix is used to estimate a yield at May 2015. This method involves multiplying the number of properties estimated to be in each band at May 2015 by the applicable property tax due for that band.
7.51 The estimated yield for May 2015 is then adjusted to account for a range of factors including exemptions, deferrals, local authority owned housing and non-compliance. The impact of the local adjustment factor rate changes adopted by some Local Authorities in 2015 is also considered.
Step 1: Calibration
7.52 The transition matrices (Appendix 6) provide the number of properties in each valuation band as of May 2013 (as well as 2015). By multiplying the number of properties in each band by the property tax liability for that band in 2013, an estimated yield can be calculated.
7.53 For example, for the first band the property tax due of €90 (0.18% times the midpoint of 0-100k band) is multiplied by the 572,500 properties declared to be in this band in May 2013 for an estimated revenue yield from Band 1 properties of €52 million. The same process is then applied to each subsequent band and the total summed to estimate the full LPT liability. This yields an initial, indicative LPT liability estimate based on May 2013 values of €520 million.
7.54 The estimated figure of €520 million is in excess of the actual liability of approximately €500 million for 2014 indicated by the Revenue Commissioners (€489m LPT declared, including deferrals, and €12m LPT exempt) in the Local Property Tax (LPT) Statistics,49 representing a 5% over-estimate. Possible explanations for the difference include work items currently being processed, the measurement of valuations for exempt properties and late or partial payment for some properties (for mandatory deduction at source (see paragraph 3.3) cases in particular, payment for 2014 may be ongoing).
7.55 It should be noted that these actual and estimated figures are before deferrals and exemptions are taken into account and also do not adjust for any local adjustment factor applied by local authorities.
49 Local Property Tax (LPT) Statistics Preliminary – 22 April 2015.

Review of the Local Property Tax
63
Step 2: Yield Estimate
7.56 Rolling forward to an estimate based on May 2015 property prices, the same process can be used with some alterations. An adjustment is made to account for Local Authority housing which, as highlighted previously, was assigned a deemed valuation in the first band. To estimate the LPT liability for May 2015 property values these Local Authority properties (almost 150,000 properties) are assumed to remain assigned to Band 1.
7.57 The 2015 property price distribution from the national transition matrix, as presented in Appendix 6, is used to estimate a yield at May 2015. This method involves multiplying the number of properties estimated in each band at May 2015 by the applicable property tax due for that band. After accounting for Local Authority housing, this approach leads to an estimated indicative LPT liability of €670 million based on May 2015 property values. This compares to the initial indicative €520 million liability estimate for May 2013 noted above.
7.58 When adjusted to take account of the 2013 calibration process, incorporating the expectation of a small (i.e. 4.4%) overestimate, the point estimate for LPT liability in May 2015 prices is reduced to approximately €640 million. This represents an increase of €140 million (28%) over the actual €500 million liability for 2014 based on May 2013 valuations, and provides an illustration of the potential tax revenue impact of the recent price developments in the property market.
7.59 Further adjustment for exemptions and deferrals, assuming their proportions remain consistent at 2% and 1% of properties respectively, would suggest that the point estimate for the indicative LPT collection would be closer to €620 million. This compares to the €480 million LPT actually collected for 2014, again an increase of €140 million.
7.60 The revenue yield estimate does not account for the Local Adjustment Factor (LAF) of up to 15% which a Local Authority can apply to the basic rate of property tax within its own area from 2015 onwards. The Revenue Commissioners estimate that the LAFs set by Local Authorities for 2015 will have the impact of reducing LPT collected by €45 million from €480 million to €435 million. If each Local Authority holds their LAF constant and the impact of the LAF were to grow in line with the estimated increase in LPT collection in Dublin and outside of Dublin, an indicative estimate of the possible impact of the LAF can be made. Based on these two assumptions, the LAF impact after a May 2015 revaluation would be of the order of €60 million, reducing the estimated indicative LPT liability from €620 million to €560 million. Thus after accounting for the LAF, LPT collection could be expected to increase by €125 million, from €435 million based on May 2013 property valuations to €560 million based on May 2015 valuations.
Table 5: Estimates of LPT liability based on May 2015 valuations compared to 2013 values.
Estimated Tax Revenue impact
Actual Liability (based on May-13 valuations)
Indicative Liability (based on roll forward to May 15 values)
LPT Liability for 2014 €500m €640m
LPT Liability for 2014 (excluding exemptions and
deferrals)
€480m €620m
LPT Liability for 2015 (following Local Adjustment
Factor and excluding exemptions and deferrals)
€435m €560m
Review of the Local Property Tax
64
Estimated Changes in LPT Liability by Valuation Band
7.61 The estimated total LPT liability from the first three bands decreases as the number of properties valued between €0 and €200,000 has fallen between May 2013 and May 2015. However an increased liability is indicated for all other bands.
7.62 The largest increase in property tax liability is estimated for those properties valued over €1 million (i.e. Band 20). The yield from properties in Band 20 increase by €30 million (650%) between May 2013 and May 2015. Due to the high liability applicable to these high value properties, a small absolute increase in the number of properties liable results in a large increase in total tax liability. By comparison, the next highest liability increases of €22-25 million, for Bands 4, 5 and 6, arise from the large volume of properties in those bands.
Considerations Regarding Approach Used
7.63 A conservative element built into the approach used is the non-incorporation of the currently exempt properties which may become liable in 2017. As of this year it is estimated that 14,000 properties are exempt on the grounds of falling within the first time buyer exemption in 2013, or properties that were purchased for the first time after 2013.
7.64 The approach also relies on a conservative assumption that the average LPT liability per property in Band 20 (i.e. properties valued over €1m) will remain constant. Unlike all other bands, properties in Band 20 do not have a fixed LPT liability (i.e. a band mid-point times a rate). Instead, the first €1m is charged at the standard rate (e.g. €1m times the 0.0018% = €1,800) and an ad valorem charge is applied to the increment above €1 million. In the absence of point estimates for properties valued above €1 million it is assumed that the total LPT liability for this band in both periods equals the current average payment times the estimated volume of properties in Band 20 in May 2015.
7.65 As outlined earlier, there may be some upward bias in the estimated yield arising from the use of the various CSO indices for the different regions. This may lead to an overestimate in terms of the estimated yield. Though it would seem unlikely, an increase in exemptions would depress the liability estimate. Any increases in the rate of deferrals would increase the gap between liability and LPT collected in a given year.

Review of the Local Property Tax
65
Appendices
Appendix 1: Terms of Reference
To review the operation of the Local Property Tax (LPT) and to make recommendations in relation to issues
that arise from the review. In particular the Review will have regard to
• Recent residential property price developments,
• The overall yield from LPT and its contribution to total tax revenue on an ongoing basis and
• The desirability of achieving relative stability, both over the short and longer terms, in LPT payments of
liable persons.
Since the introduction of the LPT, a number of issues have arisen in relation to its efficient and effective
administration, which will be addressed in the Review and on which recommendations may be made.
In addition the Review will also consider arrangements for the level and efficiency of the transfer of receipts
to the Local Government system.
It is intended that the Review be presented to the Minister for Finance no later than summer 2015.

Review of the Local Property Tax
66
Appendix 2: List of written submissions received
Organisations that made submissions: 1. Chambers Ireland
2. Citizens Information Board
3. Construction Industry Federation
4. Fianna Fáil
5. IBEC
6. IPAV
7. Irish Property Owners Association
8. Louth County Council
9. Property Industry Ireland
10. Rathgar Residents Association
11. Sinn Féin
12. Social Justice Ireland
13. Society of Chartered Surveyors Ireland
Individuals who made submissions:
14. Cllr Catherine Ardagh
15. Mr Mark Atterbury
16. Mr Anthony Behan
17. Ms Eithne Boyd
18. Mr Noel Brady
19. Mr Shane Brennan
20. Mr Richard Bruton T.D. (on behalf of a constituent)
21. Cllr Jack Chambers
22. Mr Brendan Connors
23. Mr Seán de Siúin
24. Mr Kieran Dooley
25. Mr Jim Fox
26. Dr Berna Grist BL
27. T N Kerins
28. Mr Denis Kingston
29. Cllr James Lawless
30. Mr Denis Leonard
31. Mr John Loughran
32. Ms Iris Lyle
33. Mr Peter Lynch
34. Mr Tomás Malone
35. Mr Anthony J Mangan
36. Mr Mark Mc Mahon
37. Ms Michelle Mulherrin T.D.
38. Ms Teresa Nolan
39. Mr Donal Ó Brolcháin
40. M O’Byrne

Review of the Local Property Tax
67
41. Mr John O’Donnell
42. Mr Bryan O’Grady
43. Mr John Pentony
44. Mr Neil Ruane
45. Mr Patrick Ryan
46. Mr Anthony Seale
47. Mr Frank Smyth
48. Mr Niall Sudway
49. Voluntary Silent Charity Worker
50. Mr Patrick Walsh
51. Mr Des Wynne

Review of the Local Property Tax
68
Appendix 3: Commentary and analysis on submissions received
General Issues highlighted The following is a summary of the main issues and concerns that were raised in the 51 submissions:
Proposals related to property price increases Fourteen submissions specifically addressed the issue of dealing with the implications of increased property
values for LPT liabilities. Among the proposed measures were; no revaluation in November 2016, limits on
increases related to inflation, flat rates of LPT, adjusted valuation bands and averaging of increases over time.
The implications of property price developments are considered in this report and recommendations made to
address them.
Basis of assessment Thirteen submissions favoured changing the basis of determination of LPT liabilities to site value, floor area or
variations thereof. These approaches were fully discussed by the Interdepartmental Group which reported on
‘Design of a Local Property Tax’ published by the Department of the Environment, Community and Local
Government50. The LPT (through the linkage with market value) is a tax on the amenity value of the property
to the taxpayer, including the particular qualities of the property itself such as size, design and other aesthetic
features, insulation, the site on which it is located as well as the characteristics of the area in which it is located
(including school, shopping and transport access). The report of this Group recommended a market value basis
of assessment. I have reconsidered these considerations and remain of the view that market value is the most
appropriate and equitable basis on which to determine LPT liabilities.
Ability to Pay Five submissions discussed adjustments relating to ability to pay LPT, including suggestions for the introduction of exemption provisions, allowances for mortgages, and reliefs relating to environmental measures. Reliefs should be designed to address clear economic and social policy needs. Reliefs, including exemptions, have to be paid for by taxpayers not benefiting from them or by reductions in public expenditure51. I do not favour departing from the scheme recommended in the Report of the interdepartmental Group. As referred to elsewhere in the report, I have recommended some changes to the deferral provisions and that the provisions for deferrals be kept under review and adjusted as necessary in line with Consumer Price Index changes in order to ensure that they address situations of hardship leading to inability to pay.
Abolish/replace with alternative system Abolition of the tax and/or its replacement by an alternative system for raising revenue was proposed in 5 submissions. These suggestions raise policy issues which are outside the scope of the terms of reference of this report. In the very short period during which it has been in force the LPT has proven to be a stable source of revenue for local authorities. High compliance rates have been achieved.
Specific Issues A number of respondents made submissions on issues including Pyrite, liability for properties located in
managed estates, estates not taken in charge by local authorities, allowances for stamp duty already paid,
allowance for sales made in between valuation dates, allowance for remoteness of location and lack of
availability of services. Some of these issues are addressed in the Report. Others have been addressed in the
2012 Inter-Departmental Group Report on the Design of the Local Property Tax. Issues such as allowance for
remoteness of location and lack of availability of services are amenable to being reflected in the self-assessed
valuations submitted by taxpayers.
50
http://www.environ.ie/en/PublicationsDocuments/FileDownLoad,31669,en.Pdf. 51 http://www.environ.ie/en/PublicationsDocuments/FileDownLoad,31669,en.Pdf page 61
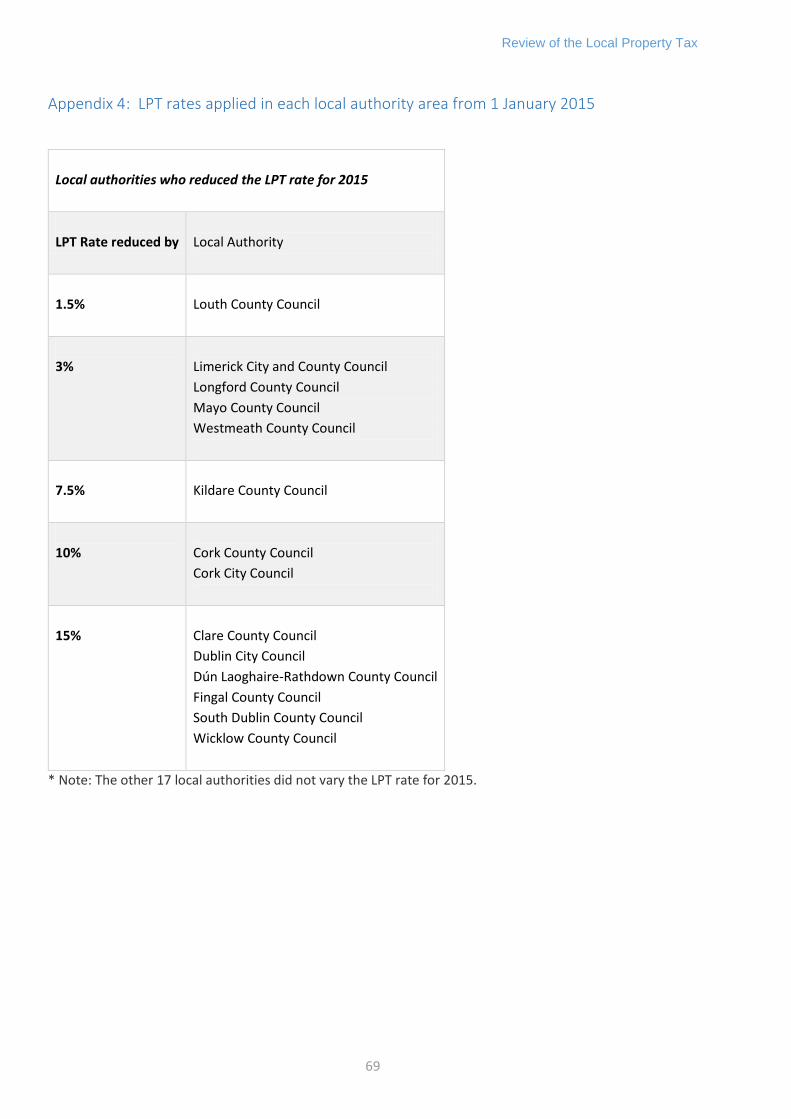
Review of the Local Property Tax
69
Appendix 4: LPT rates applied in each local authority area from 1 January 2015
Local authorities who reduced the LPT rate for 2015
LPT Rate reduced by
Local Authority
1.5%
Louth County Council
3%
Limerick City and County Council
Longford County Council
Mayo County Council
Westmeath County Council
7.5%
Kildare County Council
10%
Cork County Council
Cork City Council
15%
Clare County Council
Dublin City Council
Dún Laoghaire-Rathdown County Council
Fingal County Council
South Dublin County Council
Wicklow County Council
* Note: The other 17 local authorities did not vary the LPT rate for 2015.

Review of the Local Property Tax
70
Appendix 5: Illustrative changes in property tax liabilities arising from a 41 per cent increase in value
Illustrative changes in property tax liabilities - 41% increase in value
Val
uat
ion
Ban
d N
um
ber
Ran
ge/v
alu
e
Bo
tto
m o
f ra
nge
Top
of
ran
ge
Mid
po
int
Sam
ple
pro
pe
rty
valu
es
Tax
du
e o
n 2
01
3 v
alu
atio
n
(sta
nd
ard
rat
e)
Sam
ple
pro
pe
rty
valu
e 4
1%
pri
ce in
cre
ase
20
13
-20
16
Exce
ss o
f in
cre
ase
d v
alu
atio
n
ove
r €
1m
Tax
du
e o
n il
lust
rati
ve
incr
eas
ed
val
uat
ion
Incr
eas
e in
Tax
liab
ility
% in
cre
ase
in t
ax d
ue
1 <100,000 50000
20000 90 28,200 90 0 0
50000 90 70,500 90 0 0
100000 90 141,000 225 135 150
2 100,001 -150,000
100,001
150,000 125,000 100,001 225 141,001 225 0 0
125,000 225 176,250 315 90 40
150,000 225 211,500 405 180 80
3 150,001- 200,000
150,001 200,000 175,000 150,001 315 211,501 405 90 29
175,000 315 246,750 405 90 29
200,000 315 282,000 495 180 57
4 200,001-250,000
200,001 250,000 225,000 200,001 405 282,001 495 90 22
225,000 405 317,250 585 180 44
250,000 405 352,500 675 270 67
5 250,001-300,000
250,001 300,000 275,000 250,001 495 352,501 675 180 36
275,000 495 387,750 675 180 36
300,000 495 423,000 765 270 55
6 300,001-350,000
300,001 350,000 325,000 300,001 585 423,001 765 180 31
325,000 585 458,250 855 270 46
350,000 585 493,500 855 270 46
7 350,001-400,000
350,001 400,000 375,000 350,001 675 493,501 855 180 27
375,000 675 528,750 945 270 40
400,000 675 564,000 1,035 360 53

Review of the Local Property Tax
71
Illustrative changes in property tax liabilities - 41% increase in value V
alu
atio
n B
and
Nu
mb
er
Ran
ge/v
alu
e
Bo
tto
m o
f ra
nge
Top
of
ran
ge
Mid
po
int
Sam
ple
pro
pe
rty
valu
es
Tax
du
e o
n 2
01
3 v
alu
atio
n
(sta
nd
ard
rat
e)
Sam
ple
pro
pe
rty
valu
e 4
1%
pri
ce in
cre
ase
20
13
-20
16
Exce
ss o
f in
cre
ase
d v
alu
atio
n
ove
r €
1m
Tax
du
e o
n il
lust
rati
ve
incr
eas
ed
val
uat
ion
Incr
eas
e in
Tax
liab
ility
% in
cre
ase
in t
ax d
ue
8 400,001-450,000
400,001 450,000 425,000 400,001 765 564,001 1,035 270 35
425,000 765 599,250 1,035 270 35
450,000 765 634,500 1,125 360 47
9 450,001-500,000
450,001 500,000 475,000 450,001 855 634,501 1,125 270 32
475,000 855 669,750 1,215 360 42
500,000 855 705,000 1,305 450 53
10 500,001- 550,000
500,001 550,000 525,000 500,001 945 705,001 1,305 360 38
525,000 945 740,250 1,305 360 38
550,000 945 775,500 1,395 450 48
11 550,001-600,000
550,001 600,000 575,000 550,001 1035 775,501 1,395 360 35
575,000 1035 810,750 1,485 450 43
600,000 1035 846,000 1,485 450 43
12 600,001-650,000
600,001 650,000 625,000 600,001 1,125 846,001 1,485 360 32
625,000 1,125 881,250 1,575 450 40
650,000 1,125 916,500 1,665 540 48
13 650,001-700,000
650,001 700,000 675,000 650,001 1,215 916,501 1,665 450 37
675,000 1,215 951,750 1,755 540 44
700,000 1,215 987,000 1,755 540 44
14 700,001-750,000
700,001 750,000 725,000 700,001 1,305 987,001 1,755 450 34
725,000 1,305 1,022,250 22,250 1,856 551 42
750,000 1,305 1,057,500 57,500
1,944 639 49
15 750,001-800,000
750,001 800,000 775,000 750,001 1,395 1,057,501 57,501 1,944 549 39
775,000 1,395 1,092,750 92,750 2,032 637 46
800,000 1,395 1,128,000 128,000 2,120 725 52

Review of the Local Property Tax
72
Illustrative changes in property tax liabilities - 41% increase in value V
alu
atio
n B
and
Nu
mb
er
Ran
ge/v
alu
e
Bo
tto
m o
f ra
nge
Top
of
ran
ge
Mid
po
int
Sam
ple
pro
pe
rty
valu
es
Tax
du
e o
n 2
01
3 v
alu
atio
n
(sta
nd
ard
rat
e)
Sam
ple
pro
pe
rty
valu
e 4
1%
pri
ce in
cre
ase
20
13
-20
16
Exce
ss o
f in
cre
ase
d v
alu
atio
n
ove
r €
1m
Tax
du
e o
n il
lust
rati
ve
incr
eas
ed
val
uat
ion
Incr
eas
e in
Tax
liab
ility
% in
cre
ase
in t
ax d
ue
16 800,001-850,000
800,001 850,000 825,000 800,001 1,485 1,128,001 128,001 2,120 635 43
825,000 1,485 1,163,250 163,250 2,208 723 49
850,000 1,485 1,198,500 198,500 2,296 811 55
17 850,001 - 900,000
850,001 900,000 875,000 850,001 1,575 1,198,501 198,501 2,296 721 46
875,000 1,575 1,233,750 233,750 2,384 809 51
900,000 1,575 1,269,000 269,000 2,473 898 57
18 900,001-950,000
900,001 950,000 925,000 900,001 1,665 1,269,001 269,001 2,473 808 49
925,000 1,665 1,304,250 304,250 2,561 896 54
950,000 1,665 1,339,500 339,500 2,649 984 59
19 950,001-1,000,000
950,001 1,000.000 975,000 950,001 1,755 1,339,501 339,501 2,649 894 51
975,000 1,755 1,374,750 374,750 2,737 982 56
1,000,000 1,755 1,410,000 410,000 2,825 1,070 61
1,200,000 Actual 1,200,000 2,300 1,692,000 692,000 3,530 1,230 53
1,500,000 Actual 1,500,000 3,050 2,115,000 1,115,000 4,588 1,538 50
2,000,000 Actual 2,000,000 4,300 2,820,000 1,820,000 6,350 2,050 48
3,000,000 Actual 3,000,000 6,800 4,230,000 3,230,000 9,875 3,075 45
5,000,000 Actual 5,000,000 11,800 7,050,000 6,050,000 16,925 5,125 43
10,000,000 Actual 10,000,000 24,300 14,100,000 13,100,000 34,550 10,250 42

Review of the Local Property Tax
73
Appendix 6: Transition Matrices
A transition matrix is a useful analytical tool that maps the movements in property prices across valuation bands between two time periods. In the transition matrices below, the rows represent the property valuation bands in May 2013 while the columns indicate the bands in May 2015. Thus the entries across a row in the transition matrix show the ‘transitions’ of properties from a given valuation band in 2013 to valuation bands in May 2015 as a result of changes in property values over the period.
For instance, take Table 1 below. Row 1 of the transition matrix will report the movements in properties that were valued in Band 1 in May 2013 (i.e. 572,500 properties valued less than €100,000). Of these, 479,100 are estimated to remain within in Band 1, while 93,400 are estimated to have ‘transitioned’ to Band 2. Rows 2 to 20 of the transition matrix will report similar results for properties that were valued in Bands 2 to 20 in May 2013.
Table 2 reports these transitions as a proportion of the housing stock. Row 1 reports that 31% of the housing stock were valued in Band 1 in May 2013. This is calculated from the figures in Table 1 as 572,500 divided by the total stock of 1,847,500. As of May 2015 valuations, the 31% of the housing stock is sub categorised into 25.9% remaining in Band 1 and 5.1% moving to Band 2. Rows 2 to 20 of the transition matrix will report similar results for properties that were valued in Bands 2 to 20 in May 2013.
Table 3 considers the transitions within each May 2013 band as of May 2015. Row 1 indicates that 84% of properties in Band 1 in May 2013 are estimated to remain in Band 1 based on May 2015 valuations. This is calculated from Table 1, Row 1 as 479,100 divided by the total 572,500 initially in this band. The remaining 16% of properties originally in Band 1 are estimated to move to Band 2. Rows 2 to 20 of the transition matrix will report similar results for properties that were valued in Bands 2 to 20 in May 2013.

Review of the Local Property Tax
74
Table 1: Transition Matrix for National properties, Band Movements by Number of Properties, May 2013 to May 2015
May-15 Band
1 Band
2 Band
3 Band
4 Band
5 Band
6 Band
7 Band
8 Band
9 Band
10 Band
11 Band
12 Band
13 Band
14 Band
15 Band
16 Band
17 Band
18 Band
19 Band
20 Total May 2013
May-13 0-100k
100-150k
150-200k
200-250k
250-300k
300-350k
350-400k
400-450k
450-500k
500-550k
550-600k
600-650k
650-700k
700-750k
750-800k
800-850k
850-900k
900-950k
950k-1m
1m+
Band 1 0-100k 479,100 93,400 572500
Band 2 100-150k 247,200 229,400 14,600 491300
Band 3 150-200k 126,800 199,300 45,300 371400
Band 4 200-250k 26,000 86,200 59,800 1,800 173800
Band 5 250-300k 6,700 23,400 40,100 12,700 82900
Band 6 300-350k 1,500 9,800 18,600 17,900 300 48100
Band 7 350-400k 100 4,300 7,100 16,100 3,000 30600
Band 8 400-450k 1,500 2,400 10,300 6,400 100 20600
Band 9 450-500k 900 1,300 4,900 9,100 200 16400
Band 10 500-550k 500 700 500 6,000 2,300 100 9900
Band 11 550-600k 200 300 400 2,600 3,000 - 6500
Band 12 600-650k 100 200 400 800 3,000 600 - 5200
Band 13 650-700k - 200 200 100 1,900 1,300 - 3700
Band 14 700-750k - 200 100 200 900 1,700 3100
Band 15 750-800k 100 - 200 1,900 2300
Band 16 800-850k 100 - 1,600 1700
Band 17 850-900k 100 1,400 1400
Band 18 900-950k 1,100 1100
Band 19 950k-1m 1,300 1300
Band 20 1m+ 3,700 3700
Total May 2015 479100 340600 356200 239900 138200 84700 51900 35600 26500 19800 15000 12100 10100 6900 5400 4300 3400 2800 2500 12700 1847500
Source: Own Calculations from Revenue and Property Price Register Data Note: The shaded diagonal indicates the estimated properties in Band X at May 2013 valuations and remaining in Band X at May 2015 valuations. Properties are rounded to the nearest hundred with a dash (-) indicating rounded down to zero.
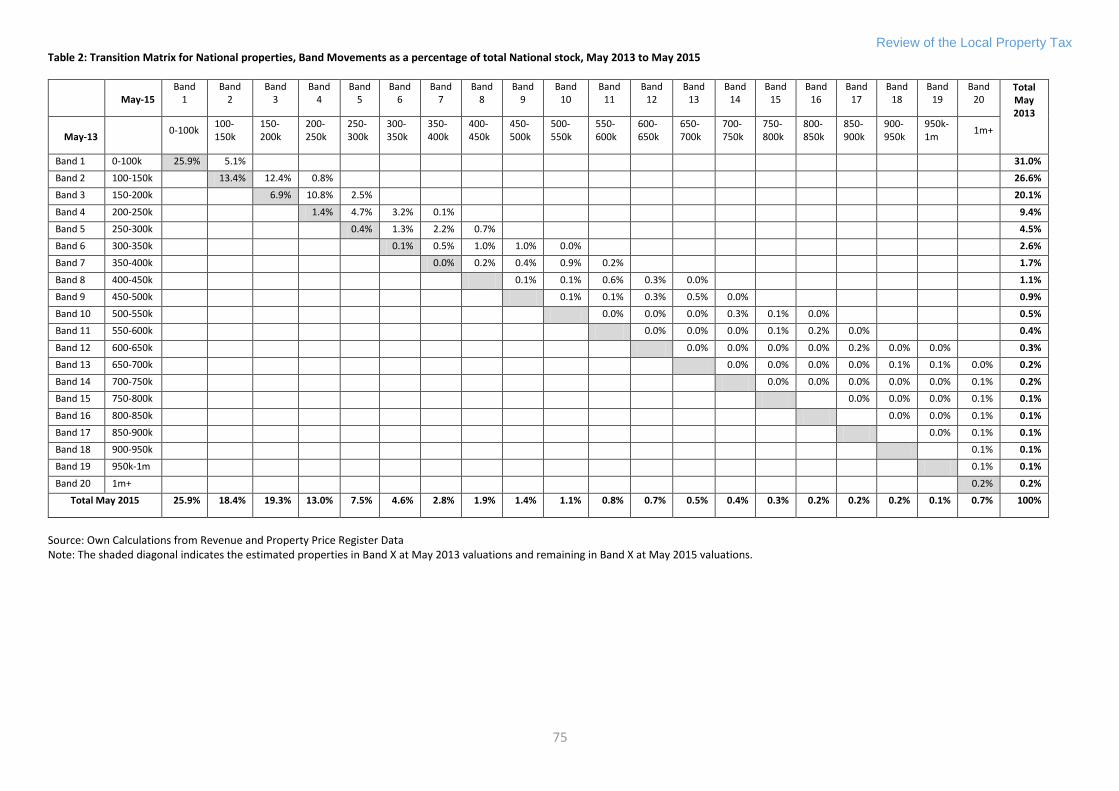
Review of the Local Property Tax
75
Table 2: Transition Matrix for National properties, Band Movements as a percentage of total National stock, May 2013 to May 2015
May-15 Band
1 Band
2 Band
3 Band
4 Band
5 Band
6 Band
7 Band
8 Band
9 Band
10 Band
11 Band
12 Band
13 Band
14 Band
15 Band
16 Band
17 Band
18 Band
19 Band
20 Total May 2013
May-13 0-100k
100-150k
150-200k
200-250k
250-300k
300-350k
350-400k
400-450k
450-500k
500-550k
550-600k
600-650k
650-700k
700-750k
750-800k
800-850k
850-900k
900-950k
950k-1m
1m+
Band 1 0-100k 25.9% 5.1% 31.0%
Band 2 100-150k 13.4% 12.4% 0.8% 26.6%
Band 3 150-200k 6.9% 10.8% 2.5% 20.1%
Band 4 200-250k 1.4% 4.7% 3.2% 0.1% 9.4%
Band 5 250-300k 0.4% 1.3% 2.2% 0.7% 4.5%
Band 6 300-350k 0.1% 0.5% 1.0% 1.0% 0.0% 2.6%
Band 7 350-400k 0.0% 0.2% 0.4% 0.9% 0.2% 1.7%
Band 8 400-450k 0.1% 0.1% 0.6% 0.3% 0.0% 1.1%
Band 9 450-500k 0.1% 0.1% 0.3% 0.5% 0.0% 0.9%
Band 10 500-550k 0.0% 0.0% 0.0% 0.3% 0.1% 0.0% 0.5%
Band 11 550-600k 0.0% 0.0% 0.0% 0.1% 0.2% 0.0% 0.4%
Band 12 600-650k 0.0% 0.0% 0.0% 0.0% 0.2% 0.0% 0.0% 0.3%
Band 13 650-700k 0.0% 0.0% 0.0% 0.0% 0.1% 0.1% 0.0% 0.2%
Band 14 700-750k 0.0% 0.0% 0.0% 0.0% 0.0% 0.1% 0.2%
Band 15 750-800k 0.0% 0.0% 0.0% 0.1% 0.1%
Band 16 800-850k 0.0% 0.0% 0.1% 0.1%
Band 17 850-900k 0.0% 0.1% 0.1%
Band 18 900-950k 0.1% 0.1%
Band 19 950k-1m 0.1% 0.1%
Band 20 1m+ 0.2% 0.2%
Total May 2015 25.9% 18.4% 19.3% 13.0% 7.5% 4.6% 2.8% 1.9% 1.4% 1.1% 0.8% 0.7% 0.5% 0.4% 0.3% 0.2% 0.2% 0.2% 0.1% 0.7% 100%
Source: Own Calculations from Revenue and Property Price Register Data Note: The shaded diagonal indicates the estimated properties in Band X at May 2013 valuations and remaining in Band X at May 2015 valuations.

Review of the Local Property Tax
76
Table 3: Transition Matrix for National properties, Band Movements as a percentage of properties in band, May 2013 to May 2015
May-15 Band
1 Band
2 Band
3 Band
4 Band
5 Band
6 Band
7 Band
8 Band
9 Band
10 Band
11 Band
12 Band
13 Band
14 Band
15 Band
16 Band
17 Band
18 Band
19 Band
20 Total May 2013
May-13 0-100k
100-150k
150-200k
200-250k
250-300k
300-350k
350-400k
400-450k
450-500k
500-550k
550-600k
600-650k
650-700k
700-750k
750-800k
800-850k
850-900k
900-950k
950k-1m
1m+
Band 1 0-100k 84% 16% 100%
Band 2 100-150k 50% 47% 3% 100%
Band 3 150-200k 34% 54% 12% 100%
Band 4 200-250k 15% 50% 34% 1% 100%
Band 5 250-300k 8% 28% 48% 15% 100%
Band 6 300-350k 3% 20% 39% 37% 1% 100%
Band 7 350-400k 0% 14% 23% 53% 10% 100%
Band 8 400-450k 7% 12% 50% 31% 0% 100%
Band 9 450-500k 6% 8% 30% 55% 1% 100%
Band 10 500-550k 5% 7% 5% 60% 23% 1% 100%
Band 11 550-600k 3% 5% 6% 39% 46% 1% 100%
Band 12 600-650k 1% 5% 7% 15% 58% 12% 1% 100%
Band 13 650-700k 1% 4% 6% 3% 50% 35% 0% 100%
Band 14 700-750k 0% 7% 4% 5% 28% 56% 100%
Band 15 750-800k 6% 2% 8% 84% 100%
Band 16 800-850k 4% 1% 94% 100%
Band 17 850-900k 4% 96% 100%
Band 18 900-950k 100% 100%
Band 19 950k-1m 100% 100%
Band 20 1m+ 100% 100%
Source: Own Calculations from Revenue and Property Price Register Data Note: The shaded diagonal indicates the estimated properties in Band X at May 2013 valuations and remaining in Band X at May 2015 valuations.
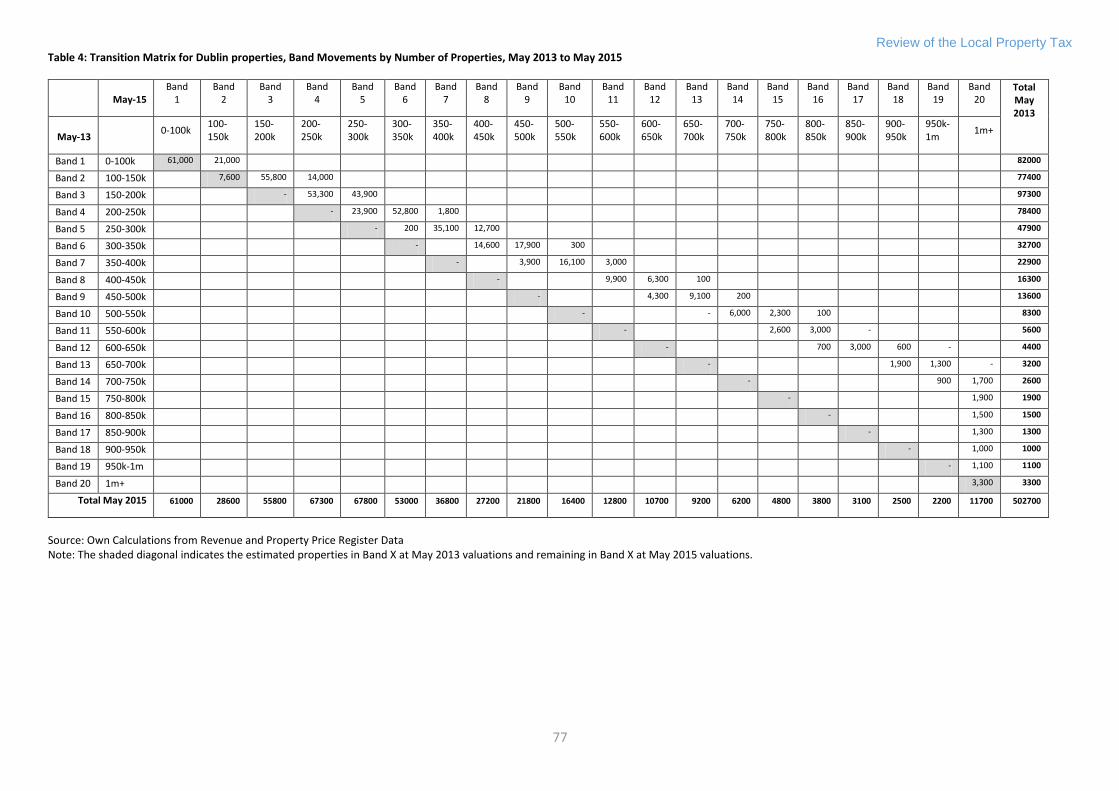
Review of the Local Property Tax
77
Table 4: Transition Matrix for Dublin properties, Band Movements by Number of Properties, May 2013 to May 2015
May-15 Band
1 Band
2 Band
3 Band
4 Band
5 Band
6 Band
7 Band
8 Band
9 Band
10 Band
11 Band
12 Band
13 Band
14 Band
15 Band
16 Band
17 Band
18 Band
19 Band
20 Total May 2013
May-13 0-100k
100-150k
150-200k
200-250k
250-300k
300-350k
350-400k
400-450k
450-500k
500-550k
550-600k
600-650k
650-700k
700-750k
750-800k
800-850k
850-900k
900-950k
950k-1m
1m+
Band 1 0-100k 61,000 21,000 82000
Band 2 100-150k 7,600 55,800 14,000 77400
Band 3 150-200k - 53,300 43,900 97300
Band 4 200-250k - 23,900 52,800 1,800 78400
Band 5 250-300k - 200 35,100 12,700 47900
Band 6 300-350k - 14,600 17,900 300 32700
Band 7 350-400k - 3,900 16,100 3,000 22900
Band 8 400-450k - 9,900 6,300 100 16300
Band 9 450-500k - 4,300 9,100 200 13600
Band 10 500-550k - - 6,000 2,300 100 8300
Band 11 550-600k - 2,600 3,000 - 5600
Band 12 600-650k - 700 3,000 600 - 4400
Band 13 650-700k - 1,900 1,300 - 3200
Band 14 700-750k - 900 1,700 2600
Band 15 750-800k - 1,900 1900
Band 16 800-850k - 1,500 1500
Band 17 850-900k - 1,300 1300
Band 18 900-950k - 1,000 1000
Band 19 950k-1m - 1,100 1100
Band 20 1m+ 3,300 3300
Total May 2015 61000 28600 55800 67300 67800 53000 36800 27200 21800 16400 12800 10700 9200 6200 4800 3800 3100 2500 2200 11700 502700
Source: Own Calculations from Revenue and Property Price Register Data Note: The shaded diagonal indicates the estimated properties in Band X at May 2013 valuations and remaining in Band X at May 2015 valuations.

Review of the Local Property Tax
78
Table 5: Transition Matrix for Dublin properties, Band Movements as a percentage of total Dublin stock, May 2013 to May 2015
May-15 Band
1 Band
2 Band
3 Band
4 Band
5 Band
6 Band
7 Band
8 Band
9 Band
10 Band
11 Band
12 Band
13 Band
14 Band
15 Band
16 Band
17 Band
18 Band
19 Band
20 Total May 2013
May-13 0-100k
100-150k
150-200k
200-250k
250-300k
300-350k
350-400k
400-450k
450-500k
500-550k
550-600k
600-650k
650-700k
700-750k
750-800k
800-850k
850-900k
900-950k
950k-1m
1m+
Band 1 0-100k 12.1% 4.2% 16.3%
Band 2 100-150k 1.5% 11.1% 2.8% 15.4%
Band 3 150-200k 10.6% 8.7% 19.4%
Band 4 200-250k 4.8% 10.5% 0.4% 15.6%
Band 5 250-300k 0.0% 7.0% 2.5% 9.5%
Band 6 300-350k 2.9% 3.6% 0.1% 6.5%
Band 7 350-400k 0.8% 3.2% 0.6% 4.6%
Band 8 400-450k 2.0% 1.3% 0.0% 3.2%
Band 9 450-500k 0.9% 1.8% 0.0% 2.7%
Band 10 500-550k 0.0% 1.2% 0.5% 0.0% 1.7%
Band 11 550-600k 0.5% 0.6% 0.0% 1.1%
Band 12 600-650k 0.1% 0.6% 0.1% 0.0% 0.9%
Band 13 650-700k 0.4% 0.3% 0.0% 0.6%
Band 14 700-750k 0.2% 0.3% 0.5%
Band 15 750-800k 0.4% 0.4%
Band 16 800-850k 0.3% 0.3%
Band 17 850-900k 0.3% 0.3%
Band 18 900-950k 0.2% 0.2%
Band 19 950k-1m 0.2% 0.2%
Band 20 1m+ 0.6% 0.6%
Total May 2015 12.1% 5.7% 11.1% 13.4% 13.5% 10.5% 7.3% 5.4% 4.3% 3.3% 2.6% 2.1% 1.8% 1.2% 1.0% 0.8% 0.6% 0.5% 0.4% 2.3% 100%
Source: Own Calculations from Revenue and Property Price Register Data Note: The shaded diagonal indicates the estimated properties in Band X at May 2013 valuations and remaining in Band X at May 2015 valuations.

Review of the Local Property Tax
79
Table 6: Transition Matrix for Dublin properties, Band Movements as a percentage of properties in band, May 2013 to May 2015
May-15 Band
1 Band
2 Band
3 Band
4 Band
5 Band
6 Band
7 Band
8 Band
9 Band
10 Band
11 Band
12 Band
13 Band
14 Band
15 Band
16 Band
17 Band
18 Band
19 Band
20 Total May 2013
May-13 0-100k
100-150k
150-200k
200-250k
250-300k
300-350k
350-400k
400-450k
450-500k
500-550k
550-600k
600-650k
650-700k
700-750k
750-800k
800-850k
850-900k
900-950k
950k-1m
1m+
Band 1 0-100k 74% 26% 100%
Band 2 100-150k 10% 72% 18% 100%
Band 3 150-200k 55% 45% 100%
Band 4 200-250k 30% 67% 2% 100%
Band 5 250-300k 0% 73% 26% 100%
Band 6 300-350k 44% 55% 1% 100%
Band 7 350-400k 17% 70% 13% 100%
Band 8 400-450k 61% 39% 1% 100%
Band 9 450-500k 32% 67% 2% 100%
Band 10 500-550k 0% 72% 27% 1% 100%
Band 11 550-600k 46% 54% 1% 100%
Band 12 600-650k 16% 68% 14% 1% 100%
Band 13 650-700k 58% 41% 0% 100%
Band 14 700-750k 33% 67% 100%
Band 15 750-800k 100% 100%
Band 16 800-850k 100% 100%
Band 17 850-900k 100% 100%
Band 18 900-950k 100% 100%
Band 19 950k-1m 100% 100%
Band 20 1m+ 100% 100%
Source: Own Calculations from Revenue and Property Price Register Data Note: The shaded diagonal indicates the estimated properties in Band X at May 2013 valuations and remaining in Band X at May 2015 valuations.

Review of the Local Property Tax
80
Table 7: Transition Matrix for National Outside Dublin properties, Band Movements by Number of Properties, May 2013 to May 2015
May-14 Band
1 Band
2 Band
3 Band
4 Band
5 Band
6 Band
7 Band
8 Band
9 Band
10 Band
11 Band
12 Band
13 Band
14 Band
15 Band
16 Band
17 Band
18 Band
19 Band
20 Total May 2013
May-13 0-100k
100-150k
150-200k
200-250k
250-300k
300-350k
350-400k
400-450k
450-500k
500-550k
550-600k
600-650k
650-700k
700-750k
750-800k
800-850k
850-900k
900-950k
950k-1m
1m+
Band 1 0-100k 418,200 72,400 490500
Band 2 100-150k 239,700 173,600 600 413900
Band 3 150-200k 126,800 146,000 1,400 274100
Band 4 200-250k 26,000 62,300 7,000 - 95400
Band 5 250-300k 6,700 23,100 5,100 - 34900
Band 6 300-350k 1,500 9,800 4,000 - 15400
Band 7 350-400k 100 4,300 3,200 - 7700
Band 8 400-450k - 1,500 2,400 400 - 4300
Band 9 450-500k - 900 1,300 500 2800
Band 10 500-550k - 500 700 500 1600
Band 11 550-600k - 200 300 400 - - 900
Band 12 600-650k - 100 200 400 100 800
Band 13 650-700k - - 200 200 100 - 500
Band 14 700-750k - - 200 100 200 - 500
Band 15 750-800k - 100 - 200 400
Band 16 800-850k - 100 - 100 200
Band 17 850-900k - 100 100 200
Band 18 900-950k - 100 100
Band 19 950k-1m - 200 200
Band 20 1m+ 400 400
Total May 2015 418200 312000 300400 172600 70400 31700 15000 8300 4700 3400 2200 1400 900 700 600 500 400 300 300 1000 1344800
Source: Own Calculations from Revenue and Property Price Register Data Note: The shaded diagonal indicates the estimated properties in Band X at May 2013 valuations and remaining in Band X at May 2015 valuations.
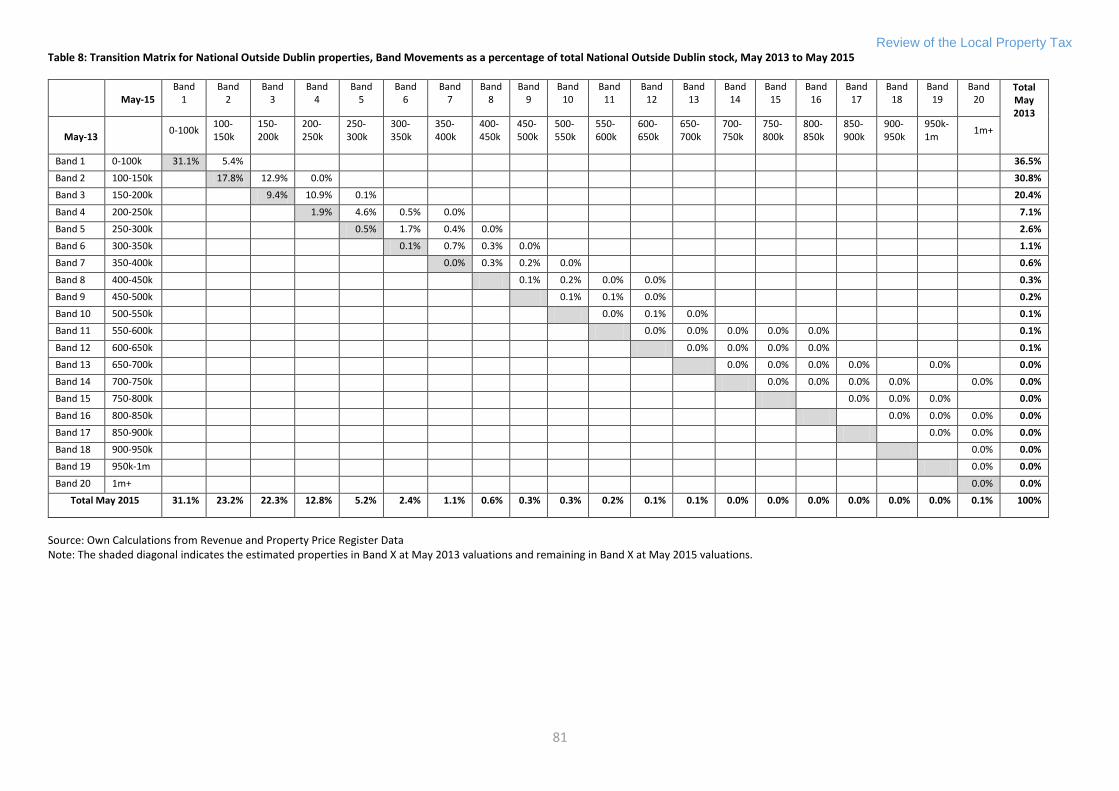
Review of the Local Property Tax
81
Table 8: Transition Matrix for National Outside Dublin properties, Band Movements as a percentage of total National Outside Dublin stock, May 2013 to May 2015
May-15 Band
1 Band
2 Band
3 Band
4 Band
5 Band
6 Band
7 Band
8 Band
9 Band
10 Band
11 Band
12 Band
13 Band
14 Band
15 Band
16 Band
17 Band
18 Band
19 Band
20 Total May 2013
May-13 0-100k
100-150k
150-200k
200-250k
250-300k
300-350k
350-400k
400-450k
450-500k
500-550k
550-600k
600-650k
650-700k
700-750k
750-800k
800-850k
850-900k
900-950k
950k-1m
1m+
Band 1 0-100k 31.1% 5.4% 36.5%
Band 2 100-150k 17.8% 12.9% 0.0% 30.8%
Band 3 150-200k 9.4% 10.9% 0.1% 20.4%
Band 4 200-250k 1.9% 4.6% 0.5% 0.0% 7.1%
Band 5 250-300k 0.5% 1.7% 0.4% 0.0% 2.6%
Band 6 300-350k 0.1% 0.7% 0.3% 0.0% 1.1%
Band 7 350-400k 0.0% 0.3% 0.2% 0.0% 0.6%
Band 8 400-450k 0.1% 0.2% 0.0% 0.0% 0.3%
Band 9 450-500k 0.1% 0.1% 0.0% 0.2%
Band 10 500-550k 0.0% 0.1% 0.0% 0.1%
Band 11 550-600k 0.0% 0.0% 0.0% 0.0% 0.0% 0.1%
Band 12 600-650k 0.0% 0.0% 0.0% 0.0% 0.1%
Band 13 650-700k 0.0% 0.0% 0.0% 0.0% 0.0% 0.0%
Band 14 700-750k 0.0% 0.0% 0.0% 0.0% 0.0% 0.0%
Band 15 750-800k 0.0% 0.0% 0.0% 0.0%
Band 16 800-850k 0.0% 0.0% 0.0% 0.0%
Band 17 850-900k 0.0% 0.0% 0.0%
Band 18 900-950k 0.0% 0.0%
Band 19 950k-1m 0.0% 0.0%
Band 20 1m+ 0.0% 0.0%
Total May 2015 31.1% 23.2% 22.3% 12.8% 5.2% 2.4% 1.1% 0.6% 0.3% 0.3% 0.2% 0.1% 0.1% 0.0% 0.0% 0.0% 0.0% 0.0% 0.0% 0.1% 100%
Source: Own Calculations from Revenue and Property Price Register Data Note: The shaded diagonal indicates the estimated properties in Band X at May 2013 valuations and remaining in Band X at May 2015 valuations.

Review of the Local Property Tax
82
Table 9: Transition Matrix for National Outside Dublin properties, Band Movements as a percentage of properties in band, May 2013 to May 2015
May-15 Band
1 Band
2 Band
3 Band
4 Band
5 Band
6 Band
7 Band
8 Band
9 Band
10 Band
11 Band
12 Band
13 Band
14 Band
15 Band
16 Band
17 Band
18 Band
19 Band
20 Total May 2013
May-13 0-100k
100-150k
150-200k
200-250k
250-300k
300-350k
350-400k
400-450k
450-500k
500-550k
550-600k
600-650k
650-700k
700-750k
750-800k
800-850k
850-900k
900-950k
950k-1m
1m+
Band 1 0-100k 85% 15% 100%
Band 2 100-150k 58% 42% 0% 100%
Band 3 150-200k 46% 53% 0% 100%
Band 4 200-250k 27% 65% 7% 0% 100%
Band 5 250-300k 19% 66% 14% 0% 100%
Band 6 300-350k 10% 64% 26% 0% 100%
Band 7 350-400k 2% 56% 42% 1% 100%
Band 8 400-450k 34% 56% 10% 0% 100%
Band 9 450-500k 33% 47% 19% 100%
Band 10 500-550k 28% 42% 30% 100%
Band 11 550-600k 20% 36% 42% 1% 1% 100%
Band 12 600-650k 10% 32% 49% 10% 100%
Band 13 650-700k 7% 31% 40% 22% 1% 100%
Band 14 700-750k 1% 40% 25% 33% 1% 100%
Band 15 750-800k 38% 12% 50% 100%
Band 16 800-850k 31% 10% 59% 100%
Band 17 850-900k 34% 66% 100%
Band 18 900-950k 100% 100%
Band 19 950k-1m 100% 100%
Band 20 1m+ 100% 100%
Source: Own Calculations from Revenue and Property Price Register Data Note: The shaded diagonal indicates the estimated properties in Band X at May 2013 valuations and remaining in Band X at May 2015 valuations.

83