review of the financial plan of the city of new york ... · review of the financial plan of the...
TRANSCRIPT

Review of the Financial Plan of the City of New York
Report 8-2018
Kenneth B. Bleiwas, Deputy Comptroller
December 2017

Message from the Comptroller
December 2017
As the State’s chief financial officer, I have a constitutional and statutory responsibility to monitor the finances of the City of New York.
This report discusses the economic, fiscal and social challenges facing New York City in an effort to promote an informed discussion. I encourage every City stakeholder to learn more about these issues and to participate fully in the public debate. Thomas P. DiNapoli State Comptroller

Contents
1
I. Executive Summary .................................................................................... 3
II. Economic Trends ........................................................................................ 7
III. Financial Plan Reconciliation .................................................................... 9
IV. Revenue Trends ........................................................................................ 11
V. Expenditure Trends .................................................................................. 16
VI. Federal and State Issues .......................................................................... 22
VII. Semi-Autonomous Entities ...................................................................... 24
1. Health and Hospitals Corporation ..................................................... 24
2. Metropolitan Transportation Authority .............................................. 25
3. Department of Education ................................................................... 25
4. New York City Housing Authority ..................................................... 26

2

I. Executive Summary
3
On November 21, 2017, the City of New York released a modification (see Figure 1) to its four-year financial plan covering fiscal years 2018 through 2021 (“the November Plan”). The November Plan includes modest changes to the City’s revenue and expenditure forecasts for FY 2018 based on trends during the first four months of the fiscal year, a citywide savings program, and savings from better-than-expected pension fund investment earnings in FY 2017.
The November Plan projects budget gaps of $3.2 billion in FY 2019, $2.3 billion in FY 2020 and $1.6 billion in FY 2021. Although the City is not currently projecting a surplus in FY 2018, the out-year gaps are smaller than those projected in June 2017, reflecting the impact of the citywide savings program and lower pension costs.
The gaps are relatively small as a share of City fund revenues (averaging 3.5 percent) and are manageable under current conditions. Moreover, the November Plan also includes substantial reserves, which, if not needed for other purposes, could be used to narrow the budget gaps. The general reserve totals $1.2 billion in FY 2018 and $1 billion in each subsequent year. The City also has a capital stabilization reserve of $250 million annually.
Closing the out-year budget gaps could become more challenging if the City also has to address cuts in federal or State aid. The State Division of the Budget recently increased its estimate of the FY 2019 budget gap (by $360 million) to more than $4.4 billion because tax receipts have fallen short of expectations. If the shortfall continues, the size of the projected budget gap could increase further.
The Governor is scheduled to release his executive budget for FY 2019 in mid-January 2018. In the past, the Governor has proposed gap-closing actions that would have impacted the City’s budget. While some of these proposals
were not included in the adopted budget, others were enacted into law. The November Plan does not anticipate the potential impact of such actions, but it does assume that State education aid to the City will increase by $465 million in FY 2019.
The federal government has taken or contemplates actions that could have adverse impacts on the City’s budget and its residents. For example, the House of Representatives and the Senate have approved a tax plan that will cost nearly $1.5 trillion over 10 years.
The bill reduces corporate and personal income tax rates, but it also limits the deductibility of state and local taxes and mortgage interest. As a result, federal taxes and the cost of home ownership will increase for many City residents. The bill also eliminates the health insurance mandate under the Affordable Care Act, which could increase the number of uninsured and raise health insurance premiums.
With the enactment of the tax bill, the size of the federal deficit will likely grow, increasing pressure on Congress to reduce future spending. A reduction in federal funding could have a direct impact on the City’s budget. The November Plan anticipates the receipt of $8.3 billion in FY 2018, which represents nearly 10 percent of the operating budget. A loss in federal funding at the State level could affect the amount of aid the City receives from the State.
The local economy remains strong and, although job growth has slowed, the City continues to post solid job gains. The City has added 630,000 jobs over the past seven years (the largest expansion on record), and is on pace to add another 74,000 jobs in 2017. This year will be the eighth consecutive year of job growth, tying the record for the longest period of job expansion in the post–World War II era.

4
Despite the strength of the City’s economy, nonproperty tax collections have underperformed. For example, the City had assumed that business tax collections would increase by 9.1 percent in FY 2018, but collections declined instead by 8.9 percent during the first four months of the fiscal year (after declining for two consecutive years). Although the City lowered its forecast by $240 million in FY 2018, the out-year forecasts were left unchanged.
The November Plan assumes business tax collections will exceed last year’s level by $337 million in FY 2018 despite the sharp decline during the first four months of the fiscal year. Some have speculated that the weakness could be related to a behavioral response in anticipation of changes to the federal tax code. If that is true, collections could pick up in the second half of FY 2018. Collections also could benefit from higher securities industry profits, which totaled $17.8 billion through the first three quarters of 2017, higher than for all of 2016.
Unless business tax collections improve, even the revised forecast for FY 2018 is unlikely to be met. Any additional shortfall, however, would likely be offset in FY 2018 by a reduction in the property tax reserve and by unplanned audit revenue.
The Office of the State Comptroller (OSC) has identified budget risks that could increase the size of the FY 2019 budget gap by as much as $821 million (see Figure 2). More than one-third of the risk stems from the potential for lower business and sales tax collections, which the City has acknowledged in FY 2018 but has not reflected in the out-years of the financial plan.
Other risks include the last payment ($150 million in FY 2019) of sales tax revenue to the State as it recoups savings that accrued to the City from refinancing bonds of the Sales Tax
Asset Receivable Corporation. In addition, costs for housing the homeless and overtime in the uniformed agencies could be higher than planned. The City also anticipates proceeds from the sale of additional taxi medallions, but the market remains weak.
The Health and Hospitals Corporation also continues to face serious financial challenges. The Corporation is taking steps to mitigate the problem, but changes in federal health policies could further complicate the Corporation’s financial outlook.
Over the next few months, the City will take actions to close the FY 2019 budget gap. In the past, the City has relied heavily on budget surpluses to balance the following year’s budget. Although the November Plan does not project a surplus for FY 2018, the City will likely free up unneeded reserves as the year progresses. The City will also look to its agencies for additional opportunities for efficiencies.
In conclusion, the City’s economy is strong, the FY 2018 budget is balanced and the out-year gaps are manageable under current conditions. Changes in federal fiscal policies, however, constitute the greatest risk to the City since the Great Recession.

5
FIGURE 1 New York City Financial Plan (in millions)
Source: NYC Office of Management and Budget
FY 2018 FY 2019 FY 2020 FY 2021 Revenues Taxes General Property Tax $ 25,812 $ 27,448 $ 28,810 $ 29,930 Other Taxes 29,931 31,337 32,554 33,786 Tax Audit Revenue 850 721 721 721 Subtotal: Taxes $ 56,593 $ 59,506 $ 62,085 $ 64,437
Miscellaneous Revenues 6,757 6,659 6,877 6,864 Unrestricted Intergovernmental Aid - - - - - - - - - - - - Less: Intra-City Revenue (2,053) (1,745) (1,745) (1,750) Disallowances Against Categorical Grants (15) (15) (15) (15) Subtotal: City Funds $ 61,282 $ 64,405 $ 67,202 $ 69,536
Other Categorical Grants 1,023 869 860 855 Inter-Fund Revenues 672 668 604 604 Federal Categorical Grants 8,342 7,087 6,927 6,915 State Categorical Grants 14,667 14,894 15,407 15,789 Total Revenues $ 85,986 $ 87,923 $ 91,000 $ 93,699
Expenditures Personal Service Salaries and Wages $ 27,377 $ 28,741 $ 29,526 $ 30,164 Pensions 9,587 9,748 9,687 9,610 Fringe Benefits 9,962 10,658 11,527 12,287 Subtotal: Personal Service $ 46,926 $ 49,147 $ 50,740 $ 52,061
Other Than Personal Service Medical Assistance 5,915 5,915 5,915 5,915 Public Assistance 1,594 1,605 1,617 1,617 All Other 29,833 27,771 27,784 28,048 Subtotal: Other Than Personal Service $ 37,342 $ 35,291 $ 35,316 $ 35,580
Debt Service 6,501 7,156 7,712 8,174 FY 2017 Budget Stabilization (4,180) - - - - - - - - - Capital Stabilization Reserve 250 250 250 250 General Reserve 1,200 1,000 1,000 1,000 Subtotal $ 88,039 $ 92,844 $ 95,018 $ 97,065
Less: Intra-City Expenses (2,053) (1,745) (1,745) (1,750) Total Expenditures $ 85,986 $ 91,099 $ 93,273 $ 95,315
Gap to be Closed $ - - - $ (3,176) $ (2,273) $ (1,616)

6
FIGURE 2 OSC Risk Assessment of the New York City Financial Plan (in millions)
1 Wage increases at the projected inflation rate after the expiration
of current agreements could increase the City’s costs beyond the resources it has set aside for this purpose by $84 million in FY 2018, $276 million in FY 2019, $686 million in FY 2020 and nearly $1.2 billion in FY 2021. The agreements have yet to be negotiated. As a result, the actual cost could be less or greater than the estimate based on the projected inflation rate.
2 The November Plan includes a general reserve of $1.2 billion in FY 2018 and $1 billion in each of fiscal years 2019 through 2021, which, if not needed, could be used to help close the projected budget gaps. In addition, the Capital Stabilization Reserve has a balance of $250 million in each of fiscal years 2018 through 2021.
3 The Retiree Health Benefits Trust, which the City has used in the past as a rainy-day fund, has a balance of nearly $4.3 billion (net of any prepayments).
Better/(Worse)
FY 2018 FY 2019 FY 2020 FY 2021
Gaps Per NYC Financial Plan $ - - - $ (3,176) $ (2,273) $ (1,616)
Debt Service 125 - - - - - - - - -
Miscellaneous Revenues 50 50 50 50
Special Education Medicaid Reimbursement (64) (64) (64) (64)
Uniformed Agency Overtime (75) (125) (125) (125)
Homeless Shelters (125) (125) (125) (125)
Tax Revenues - - - (300) (300) (300)
Sales Tax Asset Receivable Corporation - - - (150) - - - - - -
Sale of Taxi Medallions - - - (107) (257) (367)
Revenue from HHC Development Opportunities - - - - - - (100) - - -
OSC Risk Assessment1 (89) (821) (921) (931)
Potential Gaps Per OSC2,3 $ (89) $ (3,997) $ (3,194) $ (2,547)
II. Economic Trends
7
New York City’s economy has experienced its largest job expansion in the post–World War II era. Since 2009, the City has added 630,000 jobs and is on pace to add another 74,000 jobs in 2017. Job growth has been driven by the business services, health care, and leisure and hospitality sectors, which together have accounted for 60 percent of the jobs added during this period. While job growth has slowed, the City’s economy remains strong. Moderate job growth is expected to continue, but changes in federal policies could affect the City’s economy.
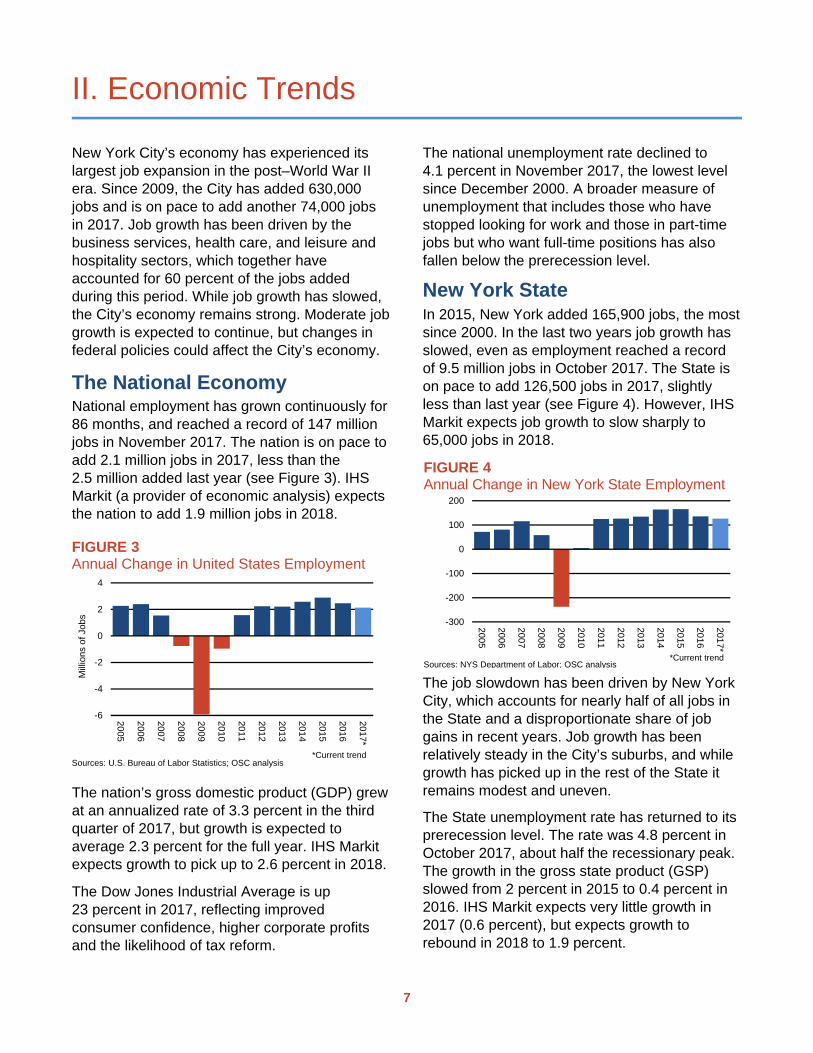
The National Economy National employment has grown continuously for 86 months, and reached a record of 147 million jobs in November 2017. The nation is on pace to add 2.1 million jobs in 2017, less than the 2.5 million added last year (see Figure 3). IHS Markit (a provider of economic analysis) expects the nation to add 1.9 million jobs in 2018.
The nation’s gross domestic product (GDP) grew at an annualized rate of 3.3 percent in the third quarter of 2017, but growth is expected to average 2.3 percent for the full year. IHS Markit expects growth to pick up to 2.6 percent in 2018.
The Dow Jones Industrial Average is up 23 percent in 2017, reflecting improved consumer confidence, higher corporate profits and the likelihood of tax reform.
The national unemployment rate declined to 4.1 percent in November 2017, the lowest level since December 2000. A broader measure of unemployment that includes those who have stopped looking for work and those in part-time jobs but who want full-time positions has also fallen below the prerecession level.
New York State In 2015, New York added 165,900 jobs, the most since 2000. In the last two years job growth has slowed, even as employment reached a record of 9.5 million jobs in October 2017. The State is on pace to add 126,500 jobs in 2017, slightly less than last year (see Figure 4). However, IHS Markit expects job growth to slow sharply to 65,000 jobs in 2018.
The job slowdown has been driven by New York City, which accounts for nearly half of all jobs in the State and a disproportionate share of job gains in recent years. Job growth has been relatively steady in the City’s suburbs, and while growth has picked up in the rest of the State it remains modest and uneven.
The State unemployment rate has returned to its prerecession level. The rate was 4.8 percent in October 2017, about half the recessionary peak. The growth in the gross state product (GSP) slowed from 2 percent in 2015 to 0.4 percent in 2016. IHS Markit expects very little growth in 2017 (0.6 percent), but expects growth to rebound in 2018 to 1.9 percent.
-6
-4
-2
0
2
4
2005
2006
2007
2008
2009
2010
2011
2012
2013
2014
2015
2016
2017*
Sources: U.S. Bureau of Labor Statistics; OSC analysis*Current trend
FIGURE 3Annual Change in United States Employment
Mill
ions
of J
obs
-300
-200
-100
0
100
200
2005
2006
2007
2008
2009
2010
2011
2012
2013
2014
2015
2016
2017*
Sources: NYS Department of Labor; OSC analysis*Current trend
FIGURE 4Annual Change in New York State Employment

8
New York City Employment reached a record of 4.4 million jobs in October 2017, but job growth has slowed as the labor market has tightened. In October 2017, the unemployment rate ticked up to 5 percent, climbing from a 41-year low of 4 percent in March 2017 as more people entered the work force, encouraged by strong economic growth.
The City is on track to add 74,000 jobs in 2017, the smallest gain since 2010 (see Figure 5). Nonetheless, 2017 will be the eighth consecutive year of job growth, tying the record for the longest period of job expansion in the post–World War II era. Both the City and OSC expect job growth to slow further in 2018 (to 49,000 jobs and 60,000 jobs, respectively).
According to the U.S. Census Bureau, the median household income in New York City increased to $58,856 in 2016, and it now exceeds the prerecession level for the first time in eight years (after accounting for inflation).
The City continues to benefit from solid job growth, but not every employment sector is growing (see Figure 6). While health care, leisure and hospitality, and educational services are likely to add more jobs in 2017 than last year, growth in other sectors has weakened.
Health care is on pace to add 22,300 jobs in 2017, bringing the total number of jobs in this sector to almost 520,000. Since 2010, when the Affordable Care Act was passed, health care has added 103,800 jobs, an increase of 25 percent. Changes in federal health policy, however, could have an impact on the sector.
The financial activities sector is on track to add 5,300 jobs in 2017, including 1,300 jobs in the securities industry (the fourth consecutive year of job growth). Despite the job gains, the securities industry is still 6 percent smaller than before the 2008 financial crisis. Industry profits totaled $17.8 billion through the first three quarters of 2017, more than all of last year.
Retail, manufacturing, and wholesale trade have all lost jobs in 2017. The retail sector (which had been contributing more than 10,000 additional jobs annually between 2009 and 2014) is likely to lose jobs for the second consecutive year. Job losses may be tied to structural changes in the retail sector (e.g., more online purchases).
-10,000 0 10,000 20,000
Wholesale Trade
Manufacturing
Retail Trade
Information
Trans., Warehousing, & Utilities
Government
Other Services
Financial Activities
Construction
Social Assistance
Educational Services
Leisure & Hospitality
Business Services
Health Care
FIGURE 6Estimated Job Gains in 2017
Sources: NYS Department of Labor; OSC analysis
-150
-100
-50
0
50
100
150
2005
2006
2007
2008
2009
2010
2011
2012
2013
2014
2015
2016
2017*
Tho
usan
ds o
f Job
s
Sources: NYS Department of Labor; OSC analysis *Current trend
FIGURE 5Annual Change in New York City Employment

III. Financial Plan Reconciliation
9
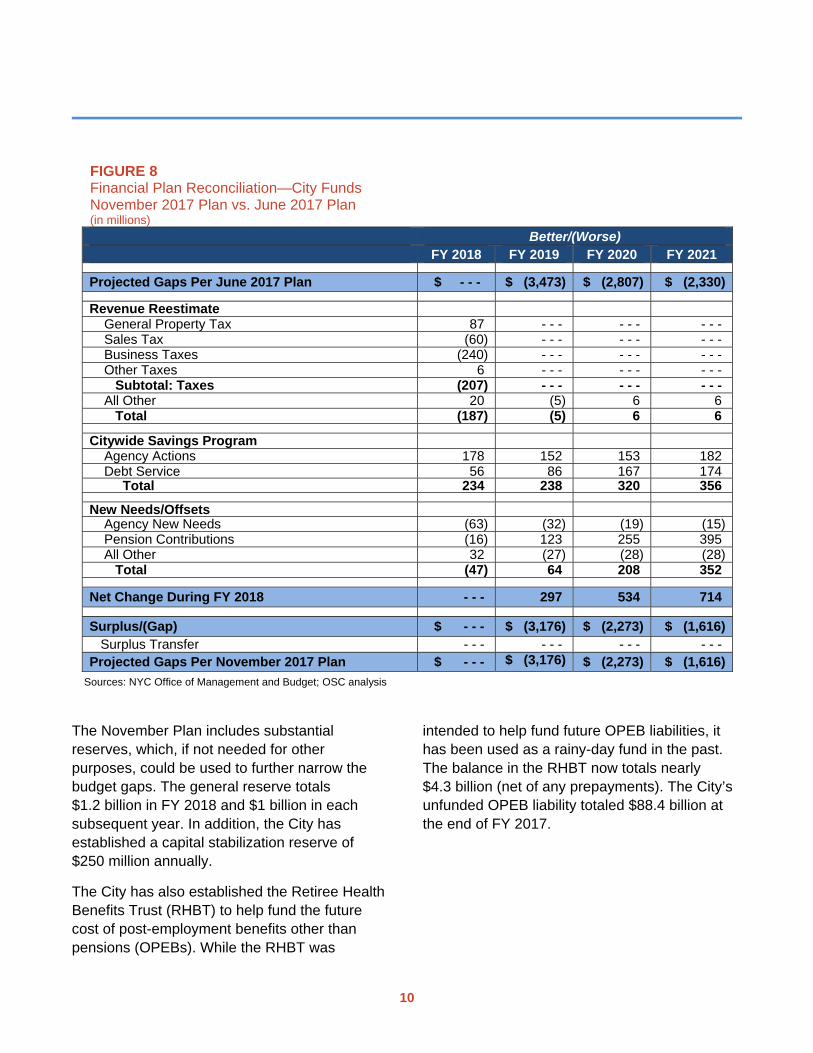
The November Plan incorporates a relatively small number of changes since the FY 2018 budget was adopted in June 2017 (see Figure 8, next page). For example, while the City lowered its revenue forecast by a net of $187 million in FY 2018, it made virtually no change in its revenue forecast for subsequent years.
The change in FY 2018 largely reflects a reduction in collections from the business tax ($240 million) and the sales tax ($60 million), which were both weaker than expected. The shortfall is partly offset by a reduction in the property tax reserve for delinquencies, refunds and tax abatements ($87 million).
While there is no net change in the City’s overall forecast of personal income tax collections, the City lowered its forecast of estimated payments by $171 million. The shortfall is offset by an increase in anticipated payments from the State to correct for underpayments in prior years.
The City’s agencies identified new spending needs, but they are modest in size ($63 million in FY 2018 and smaller amounts in subsequent years) and are more than offset by the citywide savings program.
The citywide savings program is expected to generate $234 million in FY 2018 and higher amounts in subsequent years, a total of more than $1.1 billion over four years. Most of the savings will come from lower debt service and lower fringe benefits costs. Only a small portion ($50 million over four years) will come from efficiencies.
The City also benefited from better-than-expected pension fund investment earnings in FY 2017, which allowed the City to reduce planned contributions by $123 million in FY 2019, growing to $395 million by FY 2021. The pension funds earned 13 percent on their investments in FY 2017, considerably more than the assumed rate of return (7 percent).
The November Plan projects budget gaps of $3.2 billion in FY 2019, $2.3 billion in FY 2020 and $1.6 billion in FY 2021. Even though the City is not currently projecting a surplus in FY 2018, the out-year gaps are smaller than those projected in June 2017. In addition, the gaps are relatively small as a share of City fund revenues, averaging only 3.5 percent.
In the years following the recession, the City has relied on budget surpluses to balance the following year’s budget without making cuts to agency programs. In most years the surplus was driven by unanticipated nonproperty tax collections, but that has changed in recent years.
Nonproperty tax collections (excluding audits) exceeded the City’s expectations by $1.4 billion in FY 2013 and by about $2.4 billion in each of fiscal years 2014 and 2015 (see Figure 7). In FY 2016, nonproperty tax collections were higher by just $362 million, accounting for only a small share of the $4 billion surplus, and were lower than initially forecast by $1 billion in FY 2017.
The City has lowered its forecast of nonproperty tax collections by $300 million in FY 2018. If collections continue to disappoint, closing the out-year budget gaps could be more challenging, especially if the City also has to address cuts in federal or State aid.
-1.5-1.0-0.50.00.51.01.52.02.53.0
2013
2014
2015
2016
2017
2018*
Bill
ions
of D
olla
rs
Fiscal Year
FIGURE 7Nonproperty Tax Collections:Initial Forecast Compared to Actual
Note: Excludes audits.Sources: NYC Office of Management and Budget; NYC Comptroller; OSC analysis
*City forecast
10
The November Plan includes substantial reserves, which, if not needed for other purposes, could be used to further narrow the budget gaps. The general reserve totals $1.2 billion in FY 2018 and $1 billion in each subsequent year. In addition, the City has established a capital stabilization reserve of $250 million annually.
The City has also established the Retiree Health Benefits Trust (RHBT) to help fund the future cost of post-employment benefits other than pensions (OPEBs). While the RHBT was
intended to help fund future OPEB liabilities, it has been used as a rainy-day fund in the past. The balance in the RHBT now totals nearly $4.3 billion (net of any prepayments). The City’s unfunded OPEB liability totaled $88.4 billion at the end of FY 2017.
FIGURE 8 Financial Plan Reconciliation—City Funds November 2017 Plan vs. June 2017 Plan (in millions)
Better/(Worse) FY 2018 FY 2019 FY 2020 FY 2021
Projected Gaps Per June 2017 Plan $ - - - $ (3,473) $ (2,807) $ (2,330)
Revenue Reestimate General Property Tax 87 - - - - - - - - - Sales Tax (60) - - - - - - - - - Business Taxes (240) - - - - - - - - - Other Taxes 6 - - - - - - - - - Subtotal: Taxes (207) - - - - - - - - - All Other 20 (5) 6 6 Total (187) (5) 6 6
Citywide Savings Program Agency Actions 178 152 153 182 Debt Service 56 86 167 174 Total 234 238 320 356
New Needs/Offsets Agency New Needs (63) (32) (19) (15) Pension Contributions (16) 123 255 395 All Other 32 (27) (28) (28) Total (47) 64 208 352
Net Change During FY 2018 - - - 297 534 714
Surplus/(Gap) $ - - - $ (3,176) $ (2,273) $ (1,616) Surplus Transfer - - - - - - - - - - - - Projected Gaps Per November 2017 Plan $ - - - $ (3,176) $ (2,273) $ (1,616)
Sources: NYC Office of Management and Budget; OSC analysis

IV. Revenue Trends
11
The November Plan assumes revenues, including federal and State categorical aid, will total $86 billion in FY 2018. Locally generated revenues (i.e., City funds) will account for 71 percent ($61.3 billion) of this amount, with tax collections making up the largest share.
City fund revenues are expected to increase by only 1.6 percent in FY 2018, but the City expects growth to accelerate to 5.1 percent in FY 2019 on the strength of nonproperty tax collections. While property tax collections have been strong in recent years and show no sign of weakening, nonproperty tax collections declined last year for the first time since FY 2010 (see Figure 9).
Nonproperty tax collections were weaker than expected during the first four months of FY 2018. As a result, the City lowered its forecast for business tax collections by $240 million in FY 2018. Nonetheless, it still assumes revenues will increase by $337 million even though collections have been lower than last year. Unless conditions improve, collections are unlikely to reach the City’s revised forecast.
However, any additional shortfall in FY 2018 would likely be offset by unneeded property tax reserves and higher audit and miscellaneous revenues. Thus, in the aggregate, the City’s tax forecasts for FY 2018 are reasonable.
Since the City did not reflect current tax collection trends in FY 2019 or beyond, OSC is concerned that there is the potential for significant revisions. Based on current trends and the changes the City made to FY 2018, business and sales tax collections could be lower by $300 million annually beginning in FY 2019.
In addition, sales tax collections will be lower by $150 million in FY 2019 as the State recoups savings that accrued to the City from refinancing bonds of the Sales Tax Asset Receivable Corporation at lower interest rates. Other risks include the receipt of $731 million from the sale of taxi medallions and $100 million in FY 2020 from development opportunities at properties leased to the Health and Hospitals Corporation.
-4-202468
101214
2010
2011
2012
2013
2014
2015
2016
2017
2018
*
2019
*
2020
*
2021
*
Nonproperty Property
FIGURE 9Annual Change in Property and Nonproperty Tax Collections
Fiscal YearNote: Nonproperty includes audits.Sources: NYC Office of Management and Budget; OSC analysis
Per
cent
Cha
nge
*City forecast

12
The November Plan is based on the trends shown in Figure 10 and discussed below.
1. General Property Tax Strong growth in property values has helped drive revenue growth throughout the current economic expansion. The November Plan assumes that property tax revenues will grow by 5.5 percent in FY 2018 to $25.8 billion.
Growth is driven by higher values for large residential properties, which grew by 10 percent. Values for one-, two- and three-family homes grew by more than 8 percent, and values for commercial properties grew by 6 percent.
Revenue growth rates for future years are based upon conservative assumptions, creating the potential for higher revenue. The City is scheduled to release the preliminary property tax roll for FY 2019 in January 2018, which will shed light on the growth in property values.
The City maintains a reserve for delinquencies, refunds and tax abatements. It has been the City’s practice to reduce the reserve as the year
4 Adjusted to account for changes in how the State reimbursed the
City for benefits provided to home owners and renters under the School Tax Relief program.
progresses. Last year, the reserve was reduced by $400 million. In November, the City reduced the reserve by $87 million, leaving a balance of more than $1.8 billion. OSC expects the City to reduce the reserve further as the year progresses, perhaps by as much as $300 million.
2. Personal Income Tax The growth in personal income tax collections has slowed in each of the past two fiscal years, following strong growth after the recession. Last year, collections increased by just 0.9 percent.4 The November Plan assumes collections will increase by 2.3 percent in FY 2018, reaching $11.8 billion.
While withholding from workers’ paychecks has been in line with the City’s expectations, estimated payments from capital gains and other nonwage income fell by 5 percent in the first four months of FY 2018. As a result, the City lowered its forecast by $171 million. Some of the weakness could be related to changes in taxpayer behavior in anticipation of changes in federal tax policies. If that is the case, collections could pick up in the second half of the fiscal year.
0
2
4
6
8
10
12
14
2010
2011
2012
2013
2014
2015
2016
2017
2018*
2019*
2020*
2021*
FIGURE 11Personal Income Tax Collections
Fiscal Year
Sources: NYC Comptroller; NYC Office of Management and Budget
Bill
ions
ofD
olla
rs
*City forecast
FIGURE 10 Trends in City Fund Revenues (in millions)
FY 2017 FY 2018
Annual
Growth FY 2019 FY 2020 FY 2021
Average
Three-Year
Growth Rate General Property Tax $ 24,475 $ 25,812 5.5% $ 27,448 $ 28,810 $ 29,930 5.1% Personal Income Tax 11,064 11,841 7.0% 12,073 12,624 13,166 3.6% Sales Tax 7,017 7,259 3.4% 7,881 8,245 8,592 5.8% Business Taxes 5,450 5,787 6.2% 6,224 6,375 6,615 4.6% Real Estate Transaction Taxes 2,533 2,298 -9.3% 2,359 2,462 2,510 3.0% Other Taxes 2,827 2,746 -2.9% 2,800 2,848 2,903 1.9% Tax Audits 1,296 850 -34.4% 721 721 721 -5.3% Subtotal: Taxes 54,662 56,593 3.5% 59,506 62,085 64,437 4.4% Miscellaneous Revenues 5,123 4,704 -8.2% 4,914 5,132 5,114 2.8% Grant Disallowances 558 (15) NA (15) (15) (15) 0.0% Total 60,343 61,282 1.6% 64,405 67,202 69,536 4.3%
Note: Growth in personal income tax collections in FY 2018 would be 2.3 percent after adjusting for changes in the School Tax Relief Program. Sources: NYC Office of Management and Budget; OSC analysis

13
The shortfall in estimated payments was offset in FY 2018 by an increase in State payments to the City for distributional errors. All personal income tax payments are made directly to the State, and each month the State remits to the City an estimate of its share. Each year, the State makes adjustments to correct for distributional errors in prior years.
The City had assumed that such payments would decline by 31.5 percent in FY 2018, but they declined by less than 2 percent in the first four months of the fiscal year. While the City raised its forecast by $196 million, it still expects payments to decline in FY 2018 (by 7.5 percent).
The City expects securities industry bonuses to increase by 3.9 percent for work performed in 2017. Industry compensation experts have suggested that bonuses could be higher, which would benefit personal income tax collections. OSC will release its own bonus estimate based on trends in personal income tax collections in March 2018.
3. Sales Tax The City’s June 2017 financial plan assumed that sales tax collections would increase by 4.5 percent in FY 2018, faster than the average of the past three years. However, collections were lower than expected during the first four months of the fiscal year, which the City attributes to weaker-than-expected wage growth.
As a result, the City lowered its forecast for FY 2018 by $60 million to $7.3 billion, but it made no adjustment to its out-year forecasts. The November Plan assumes collections will grow by 5.7 percent in FY 2019 (see Figure 11), which seems optimistic given current trends. OSC believes sales tax collections could be lower by $60 million annually beginning in FY 2019.
4. Business Taxes In April 2015, the State enacted legislation that combined the City’s banking and general corporation taxes. The change was expected to be revenue-neutral, but collections declined during the following two fiscal years (see Figure 12), despite strength in corporate profits. In total, collections fell short of expectations by $1 billion during the two-year period.
Collections have continued to fall short of expectations in FY 2018. The June Plan had assumed that collections would increase by 9.1 percent, but collections declined instead by 8.9 percent during the first four months of the fiscal year. As a result, the City lowered its forecast for FY 2018 by $240 million.
0
1
2
3
4
5
6
7
2009
2010
2011
2012
2013
2014
2015
2016
2017
2018*
2019*
2020*
2021*
FIGURE 12Business Tax Collections
Fiscal Year
Sources: NYC Comptroller; NYC Office of Management and Budget
Bill
ions
ofD
olla
rs
*City forecast
0
1
2
3
4
5
6
2013
2014
2015
2016
2017
2018*
2019*
Fiscal Year
Note: Excludes the impact of the sales tax intercept starting in FY 2016.Sources: NYC Office of Management and Budget; OSC analysis
*City forecast
Per
cent
Cha
nge
FIGURE 11Sales Tax Growth

14
Despite the weakness, the City still expects collections to increase by $337 million in FY 2018 and by nearly $1.2 billion during the financial plan period. Some have speculated that the weakness could be related to taxpayers adjusting to the new law, complicated by anticipated changes in federal tax policies. If so, collections could pick up in the second half of the fiscal year.
There is little evidence at this time to suggest that collections will exceed last year’s level. Any additional shortfall, however, would likely be offset in FY 2018 by a reduction in the property tax reserve and unplanned audit revenue.
While the City has acknowledged that collections have been weaker than expected in FY 2018, it did not revise its out-year forecasts. Until collections stabilize, OSC believes the City’s adjustment in FY 2018 should extend to the out-years of the financial plan, lowering collections by $240 million annually beginning in FY 2019.
5. Real Estate Transaction Taxes Revenues from real estate transaction taxes declined in FY 2017 for the first time since 2010 (see Figure 13). Collections were lower mostly because there was a reduction in the number of large commercial property transactions.
The November Plan continues to assume that collections will decline in FY 2018 by $235 million to $2.3 billion, as lower demand from foreign buyers reduces the number of commercial transactions for the second consecutive year. During the first four months of the fiscal year, collections were in line with the City’s expectations. However, recent sales data suggests that the drop in commercial transactions may be easing, which could result in a smaller decline than the City has projected.
6. Audit Revenue Each year, the Department of Finance conducts audits of individuals and businesses to ensure compliance with the tax code. Collections reached a record $1.3 billion in FY 2017. The November Plan assumes collections will decline to $850 million in FY 2018 and then to about $720 million annually thereafter. While collections are likely to be lower than in FY 2017, they could exceed the City’s forecasts.
7. Asset Sales The State authorized the sale of 2,000 additional taxi medallions in 2012. After the sale of 350 medallions in FY 2014, the City has repeatedly postponed the sale of the remaining 1,650 medallions because the growing presence of alternatives to taxis, such as Uber and Lyft, has significantly impacted the market.
The average sale price for a taxi medallion peaked at $1 million in calendar year 2014, but it was nearly cut in half by 2016. Weakness in market conditions has continued, with the average sale price declining in 2017 to $350,000 as of November 2017.
0.0
0.5
1.0
1.5
2.0
2.5
3.0
3.5
2009
2010
2011
2012
2013
2014
2015
2016
2017
2018*
2019*
2020*
2021*
Bill
ions
of D
olla
rs
Fiscal Year
FIGURE 13Real Estate Transaction Tax Collections
Sources: NYC Comptroller; NYC Office of Management and Budget
*City forecast

15
The November Plan assumes the remaining medallions will be sold at an average price of $728,000 (more than double the market price), generating $731 million during the financial plan period ($107 million in FY 2019, $257 million in FY 2020 and $367 million in FY 2021). Until the City tests the market, there is a risk that the expected amount may not be realized.
The City expects to receive $100 million in FY 2020 from development opportunities at properties leased to the Health and Hospitals Corporation. The City intends to transfer the proceeds to the Corporation to help balance its budget. If these development opportunities do not materialize as expected, the City may be called upon to make up the difference, or the Corporation may be required to implement deeper cuts than already planned.

V. Expenditure Trends
16
The November Plan assumes expenditures will total $86 billion in FY 2018, including programs funded with federal and State categorical grants. The portion funded with locally generated revenue (i.e., City funds) will total $61.3 billion.
After adjusting for surplus transfers, which can mask expenditure trends, City-funded spending is projected to grow by 8.7 percent in FY 2018. Excluding reserves and savings from prior years’ expenses, spending would increase by 5.6 percent (three times faster than the projected local inflation rate), driven by the cost of labor agreements and higher costs for employee fringe benefits and debt service.
The City has reduced its forecast of City-funded spending in the November Plan by a net of $187 million in FY 2018 and by larger amounts in subsequent years. In FY 2018, the reduction largely reflects the impact of the citywide savings program ($234 million) and unplanned agency spending ($63 million). In subsequent years, the City also benefited from higher-than-planned pension fund investment earnings in FY 2017, which reduced planned contributions for fiscal years 2019 through 2021.
The full-time work force (including jobs funded by federal and State categorical grants) increased by 28,032 employees between fiscal years 2012 and 2017 (see Figure 14). These additions increased the work force to the highest level since the 1975 fiscal crisis (295,455 full-time employees, of which 248,349 were City-funded).
The November Plan assumes the addition of 7,612 employees during FY 2018, with hiring concentrated in the health and welfare agencies and civilian employees at the Police Department. Despite the growth in the City-funded work force in recent years, the City has failed to meet its hiring targets, resulting in unplanned savings. OSC expects this trend to continue in FY 2018.
A review of the City’s expenditure forecasts finds that overtime costs in the uniformed agencies and the cost of housing the homeless could be higher than planned. However, these costs could be partly offset in FY 2018 by debt service savings from refundings and new issuances since interest rates remain at historically low levels. OSC also notes that the current round of collective bargaining ends in FY 2018, and the cost of future agreements could be greater than assumed in the November Plan.
0
80
160
240
32019
7919
8019
8119
8219
8319
8419
8519
8619
8719
8819
8919
9019
9119
9219
9319
9419
9519
9619
9719
9819
9920
0020
0120
0220
0320
0420
0520
0620
0720
0820
0920
1020
1120
1220
1320
1420
1520
1620
1720
18 *
Tho
usan
ds o
f Em
ploy
ees
Fiscal Year
City-Funded Other
FIGURE 14Full-Time Work Force Has Reached Record Levels
Sources: NYC Office of Management and Budget; OSC analysis
* City forecast
Note: Staffing levels are as of June 30 of each fiscal year.

17
The November Plan is based on the trends shown in Figure 15 and discussed below.
1. Collective Bargaining The City has reached labor agreements with all of the major unions that represent nearly all of the City’s work force for the 2010-2017 round of collective bargaining. The cost of these agreements ($13.8 billion) during the contract period (fiscal years 2014 through 2018) will be partly offset by savings from resources that had been set aside by the City in its labor reserve prior to reaching new wage agreements ($3.5 billion), and from health insurance savings ($4.4 billion) from a separate agreement between the City and its unions. The net cost is expected to total $5.9 billion during the contract period.
5 The labor agreement covering most civilian employees expired in
September 2017.
However, the cost of the agreements will continue to grow beyond the current contract period as the City compensates members of the United Federation of Teachers and other employees for the time they went without wage increases provided to most other municipal unions in 2009 and 2010. The net budgetary impact will peak at $4 billion in FY 2021.
The November Plan includes resources to fund annual wage increases of 1 percent after the expiration of the current round of collective bargaining.5 The actual cost of the next round of collective bargaining will be determined through negotiation or arbitration, and could be higher than assumed in the November Plan. Wage increases at the projected inflation rate, for example, would increase costs by $84 million in FY 2018, $276 million in FY 2019, $686 million in FY 2020 and nearly $1.2 billion in FY 2021.
FIGURE 15 Trends in City-Funded Spending (in millions)
FY 2017 FY 2018
Annual
Growth FY 2019 FY 2020 FY 2021
Average
Three-Year
Growth Rate
Salaries and Wages $ 17,305 $ 18,647 7.8% $ 19,977 $ 20,698 $ 21,166 4.3%Pension Contributions 9,249 9,443 2.1% 9,604 9,543 9,466 0.1%Medicaid 5,895 5,813 -1.4% 5,813 5,813 5,813 0.0%Debt Service 5,820 6,237 7.2% 6,899 7,460 7,930 8.3%Health Insurance 4,463 4,797 7.5% 5,308 5,822 6,428 10.2%Other Fringe Benefits 2,748 2,781 1.2% 2,965 3,251 3,399 6.9%Energy 711 760 6.9% 780 811 849 3.8%Judgments and Claims 616 552 -10.4% 567 585 600 2.8%Public Assistance 626 708 13.1% 713 719 719 0.5%Retiree Health Benefits Trust 100 - - - NA - - - - - - - - - NAOther 13,064 14,274 9.3% 13,705 13,523 13,532 -1.8%Subtotal 60,597 64,012 5.6% 66,331 68,225 69,902 3.0%Prior Years’ Expenses (401) - - - NA - - - - - - - - - NAGeneral Reserve - - - 1,200 NA 1,000 1,000 1,000 NACapital Stabilization Reserve - - - 250 NA 250 250 250 NATotal $ 60,196 $ 65,462 8.7% $ 67,581 $ 69,475 $ 71,152 2.8%
Note: Debt service has been adjusted for surplus transfers. Sources: NYC Office of Management and Budget; OSC analysis

18
2. Health Insurance To help fund wage increases for municipal employees, the City and the Municipal Labor Committee reached an agreement in May 2014 to generate health insurance savings for the City’s budget. Under the agreement, the City and the unions agreed to generate a cumulative total of $3.4 billion during fiscal years 2015 through 2018 and $1.3 billion in recurring savings beginning in FY 2018.
The City met the target for fiscal years 2015 through 2017, and is on track to realize the FY 2018 target. Despite these savings, the City-funded cost of health insurance will reach $6.4 billion by FY 2021 (see Figure 16), $2.1 billion (50 percent) more than before the agreement took effect in FY 2014.
More than three-quarters of the $3.4 billion in cumulative savings has come from lower-than-planned increases in health insurance premiums and other administrative actions. Cost-containment initiatives are expected to account for one-fifth of the total ($687 million), mostly from higher co-payments.
6 The pension funds gained, on average, 8.6 percent annually on
investments during fiscal years 2014 through 2017, compared to the expected annual gain of 7 percent.
The City is expected to seek additional health insurance savings with the assistance of the municipal unions to help fund wage increases in the next round of bargaining. The State Department of Financial Services recently approved an application from the City’s primary insurer to increase health insurance premiums for active employees by 6.8 percent in FY 2019. The increase is slightly less than assumed in the November Plan (7 percent), which could generate some savings.
3. Pension Contributions After rising rapidly between fiscal years 2003 and 2012, the growth in City-funded pension contributions slowed during the following two years. The slower rate of growth reflected the impact of changes in assumptions and methodologies used to calculate City pension contributions, better-than-expected investment earnings, and savings from lower-cost pension plans for employees hired after March 31, 2012.
Pension contributions resumed growing in FY 2015, rising from $8.1 billion in FY 2014 to $9.2 billion in FY 2017 before leveling off (see Figure 17). This trend reflects revised mortality tables to account for longer life expectancies, offset in part by higher-than-expected investment earnings during fiscal years 2014 through 2017.6
The November Plan assumes that pension contributions will remain relatively level during the financial plan period, averaging $9.5 billion (14.5 percent of City fund revenues). These estimates could be revised based on actual investment fund performance and the recommendations of an independent actuarial consultant, which is conducting a biennial audit of the pension system as required by the City Charter. The consultant is expected to issue preliminary findings in early 2018, and will issue a final report sometime in 2019.
01234567
2015
2016
2017
2018*
2019*
2020*
2021*
Bill
ion
s o
f D
olla
rs
Fiscal Year
FIGURE 16Health Insurance Costs Continue to Grow
Sources: NYC Comptroller; NYC Office of Management and Budget; OSC analysis
*City forecast
City-Funded

19
In the four years since the City adopted new financial reporting standards for pension liabilities in FY 2014, the financial condition of the City’s five actuarial pension systems has improved. In the aggregate, the pension systems had enough assets to fund (on a market-value basis) 71 percent of their accrued pension liabilities as of the end of FY 2017. During this period, the City’s unfunded net liability declined by $3.6 billion to $56.3 billion.
4. Debt Service Debt service is projected to increase by 36 percent ($2.1 billion) between fiscal years 2017 and 2021 to reach $7.9 billion (see Figure 18). This represents an annual average growth rate of 8 percent, more than twice the rate of growth between fiscal years 2011 and 2017. Debt service costs were held down during this period by historically low interest rates, which reduced the cost of borrowing and allowed the City to realize substantial savings by refinancing outstanding debt at lower rates.
Figure 18 also shows that debt service as a share of tax revenue (i.e., the debt burden) would rise from 11.1 percent in FY 2017 to 12.7 percent in FY 2021. Although debt service would account for a larger share of tax revenue, the share would remain below 15 percent, a level that is considered high. To prevent debt service from rising too quickly as a share of tax revenues, the City has created an annual capital stabilization reserve of $250 million.
Although the opportunity to refinance outstanding debt in the future will likely be reduced, debt service could still be lower than assumed in the November Plan. The City has historically fallen short of its capital commitment targets, and interest rates, while rising, are likely to stay below the levels assumed by the City. For FY 2018, OSC estimates that the City could realize savings of $125 million from lower-than-expected variable interest rates.
0
2
4
6
8
10
2001
2002
2003
2004
2005
2006
2007
2008
2009
2010
2011
2012
2013
2014
2015
2016
2017
2018
*
2019
*
2020
*
2021
*
Bill
ions
of D
olla
rs
Fiscal Year
FIGURE 17Pension ContributionsCity-Funded
Sources: NYC Comptroller; NYC Office of Management and Budget; OSC analysis
*City forecast

20
Changes in federal tax policy, however, could affect the City’s borrowing costs. A reduction in the top tax rate, for example, could reduce the appeal of tax-exempt bonds and could require higher interest rates to attract investors.
Congress has also eliminated the ability of municipal bond issuers to refund bonds on a tax exempt basis more than 90 days in advance of their call date, which would reduce the amount of savings to the City from refinancing outstanding debt. The City estimates that it has realized savings of $425 million from such advance refundings since 2013.
5. Uniformed Overtime Overtime costs in the four uniformed agencies reached $1.4 billion in 2017, setting a new record. While overtime exceeded the City’s initial estimate by $351 million, these unplanned costs were mostly offset by hiring delays and by savings in other personal service costs.
The November Plan assumes overtime will decline by $244 million to $1.2 billion in FY 2018. However, overtime exceeded the City’s forecast by $126 million through the first five months of the fiscal year (although it was about the same level as last year).
As in past years, unplanned overtime costs could be offset at least partly by savings in other personal service costs or by the receipt of unplanned federal and State categorical grants. Thus, OSC estimates that overtime could be higher than planned on a net basis by $75 million in FY 2018 and $125 million annually thereafter.
6. Homeless Services The number of homeless people residing in shelters operated by the Department of Homeless Services (DHS) remains at historic levels despite City efforts to prevent homelessness and to create permanent housing. In October 2017, the caseload totaled 60,274 (see Figure 19), only slightly lower than the peak reached in November 2016.
The cost of homeless services has increased in recent years, growing from $1 billion in FY 2013 to a record $1.8 billion in FY 2017. The November Plan assumes that the cost will decline to $1.6 billion in FY 2018 ($889 million in City funds), but the forecast is based on the assumption that the single-adult shelter population will decline. The single-adult shelter population, however, continues to rise, reaching
02468101214161820
0123456789
10
2000
2001
2002
2003
2004
2005
2006
2007
2008
2009
2010
2011
2012
2013
2014
2015
2016
2017
2018*
2019*
2020*
2021*
Bill
ion
s o
f D
olla
rs
Fiscal Year
Debt Service (Left Axis) Debt Burden (Right Axis)
Note: Debt service amounts are adjusted for prepayments and defeasances.Sources: NYC Comptroller; NYC Office of Management and Budget; OSC analysis
*City forecast
FIGURE 18Debt Service City-funded
Percentage

21
a record level of 14,308 individuals in October 2017. Until the caseload begins to decline, OSC believes the City-funded cost of sheltering homeless people could be higher than assumed in the November Plan by $125 million annually beginning in FY 2018.
7. Public Assistance The largest public assistance programs in New York State are the Family Assistance (FA) and Safety Net Assistance (SNA) programs. The FA program, which is fully federally funded, provides five years of lifetime benefits to low-income families with children. The SNA program, which is funded by the State and the City, provides benefits to families that have exhausted their federal benefits and to low-income individuals who are ineligible for federal benefits.
The public assistance caseload totaled 368,425 individuals as of October 2017 (see Figure 20). While the caseload has grown since the beginning of the fiscal year, it was lower by 6,460 compared to one year earlier. The November Plan assumes that the caseload will reach 371,000 by the end of FY 2018 and then remain at this level through FY 2021. The City-funded 7 The November Plan assumes that the federal and State
governments will fund $887 million of public assistance costs in FY 2018 and $898 million in FY 2021.
cost of public assistance is expected to total $708 million in FY 2018 and increase slightly to $719 million by FY 2021.7
8. Medical Assistance Medicaid provides health insurance to low-income children and adults, and is the largest payer of long-term care. It also provides subsidies to health care providers, such as the Health and Hospitals Corporation, which serve large numbers of low-income patients and uninsured patients.
The November Plan assumes that the City-funded share of Medicaid will total $5.8 billion in FY 2018 (9 percent of City-funded revenue) and will remain at that level because the State has assumed financial responsibility for the growth in the local share. These estimates assume there will be no changes in federal and State policies.
0
10,000
20,000
30,000
40,000
50,000
60,000
70,000
Apr-07
Oct-0
7A
pr-08O
ct-08
Apr-09
Oct-0
9A
pr-10O
ct-10
Apr-11
Oct-1
1A
pr-12O
ct-12
Apr-13
Oct-1
3A
pr-14O
ct-14
Apr-15
Oct-1
5A
pr-16O
ct-16
Apr-17
Oct-1
7
Num
ber
of P
eopl
e
Source: NYC Department of Homeless Services
FIGURE 19Homeless Shelter Population Remains Elevated
250,000
270,000
290,000
310,000
330,000
350,000
370,000
390,000
Apr-14
Jul-14
Oct-1
4
Jan-15
Apr-15
Jul-15
Oct-1
5
Jan-16
Apr-16
Jul-16
Oct-1
6
Jan-17
Apr-17
Jul-17
Oct-1
7
Num
ber
of P
eopl
e
Source: NYC Human Resources Administration
FIGURE 20Public Assistance Caseload Is Rising

VI. Federal and State Issues
22
1. Changes in Federal Tax Policy The U.S. House of Representatives and the U.S. Senate have approved a tax plan that represents the greatest change in the federal tax code in 31 years. The legislation reduces corporate and personal income taxes by a net of nearly $1.5 trillion over 10 years.
While the bill reduces tax rates, it caps the deductibility of state and local taxes at $10,000 for taxpayers filing jointly, and limits the deductibility of mortgage interest. These changes will increase federal taxes and the cost of home ownership for many City residents. As a result, home values could decline, reducing real estate transaction tax collections as well as property tax valuations.
The bill also eliminates the ability of municipal issuers to refund tax-exempt debt more than 90 days in advance of the call date, which will reduce the amount of savings the City could realize from refinancing outstanding debt.
In addition, the bill eliminates the individual mandate under the Affordable Care Act (ACA), which requires individuals to have health insurance or to pay a penalty.8 The Congressional Budget Office estimates that eliminating the mandate will save the federal government $338 billion over 10 years by eliminating subsidies to low-income individuals, which will be used to fund tax cuts. However, repealing the individual mandate could also increase the number of uninsured people by 13 million by 2027 and could increase insurance premiums by 10 percent annually.
8 The penalty for not purchasing insurance is 2.5 percent of
household income, or $695 per adult, whichever is greater, up to $2,085 annually.
With the enactment of the tax bill, the size of the federal deficit will likely grow, increasing pressure on Congress to reduce future spending. The President and congressional leaders have already indicated that the cost of entitlement programs will be evaluated. The November Plan anticipates the receipt of $8.3 billion in federal funding in FY 2018, which represents nearly 10 percent of the City’s operating budget. A loss in federal funding at the State level could affect the amount of aid the City receives from the State.
2. Federal Budget Congress recently passed a continuing resolution to fund the federal government through December 22, 2017. Without a new budget agreement, the federal government could shut down operations.
In September 2017, the Congress temporarily suspended the debt limit through December 8, 2017. On December 9, 2017, the debt limit was increased to reflect cumulative borrowing incurred during the three-month suspension period but was not raised to allow for any additional borrowing. Without an increase in the debt limit, the federal government could run out of cash by the end of March 2018, even after taking into account extraordinary measures being utilized by the Treasury to preserve cash.
3. Federal Health Care Reform Congress has yet to reauthorize the Children’s Health Insurance Program (CHIP), which expired on September 30, 2017. The House has passed legislation to fund the program for five more years, but the Senate has not acted on a similar proposal. New York State has funding to provide services through at least December 31, 2017.

23
In New York State, CHIP provides health insurance to more than 350,000 children (over 130,000 live in the City) in low-income families who are not otherwise eligible for Medicaid. The federal government covers most of the cost.9 The State estimates that it would lose nearly $1.1 billion in federal CHIP funding annually if the program is not reauthorized.
On October 12, 2017, the Secretary of the U.S. Department of Health and Human Services ended federal payments that permitted insurance companies to lower the cost of out-of-pocket health care expenses for low-income individuals.
Congress has made a number of attempts to repeal and replace the Affordable Care Act. In May 2017, for example, the U.S. House of Representatives approved legislation that would have cost New York State $6.9 billion over four years. An estimated 1.1 million City residents would have been at risk of losing Medicaid coverage, and another 460,000 could have lost coverage through insurance plans offered through the State’s health insurance exchange. While a number of legislative proposals were introduced in the U.S. Senate to roll back or repeal the ACA, none were passed. Since then, Congress and the President have taken steps to undermine the ACA.
4. State Budget The State Division of the Budget recently increased its estimate of the State’s FY 2019 budget gap by $360 million to more than $4.4 billion ($1.7 billion assuming adherence to a goal of limiting the annual growth in State operating funds to 2 percent) because tax receipts had fallen short of expectations. If the shortfall continues, the size of the projected budget gap could increase further.
9 The ACA increased the federal matching rate for New York State
from 65 percent to 88 percent beginning on October 1, 2015, and ending on September 30, 2019.
The Governor is scheduled to release his executive budget for FY 2019 in mid-January 2018. In the past, some of the gap-closing actions proposed by the Governor would have impacted the City’s budget. While some of these proposals were excluded from the budgets that were ultimately adopted, others were enacted into law. The November Plan does not anticipate the potential impact of such actions, but it does assume that State education aid to the City will increase by $465 million in FY 2019.
Last year, the State increased funding for charter schools for the current school year, but the State budget requires future increases to be paid by the City. The City estimates that, if increases are not offset by changes in State education aid to the City, the cost to the City could be $101 million in FY 2019, rising to $417 million in FY 2021. Such costs are not reflected in the November Plan.

VII. Semi-Autonomous Entities
24
1. Health and Hospitals Corporation The Health and Hospitals Corporation (the largest municipal hospital system in the country) continues to face serious financial challenges. Factors contributing to the crisis include large numbers of uninsured patients, increased competition for Medicaid patients and high overhead costs. In addition, federal supplemental Medicaid payments are scheduled to decline beginning in federal fiscal year 2018 under the Affordable Care Act on the assumption that more people will have health insurance.
In recent years, the City has increased its financial support to the Corporation ($1.8 billion in FY 2018) and has allowed the Corporation to delay payments it owed to the City for prior-year expenses. The City has also prepaid subsidies to the Corporation to provide the Corporation with additional budgetary flexibility.
The Corporation ended FY 2017 with a cash balance of about $600 million, but the balance is misleading since the City had prepaid $300 million in subsidies that were due in FY 2018. Also, the Corporation had not reimbursed the City for $621 million in obligations that the City had incurred on its behalf in prior years. (The Corporation subsequently made a $137 million payment).
The Corporation is implementing a transformation plan to improve its financial situation, which is expected to generate $6.7 billion over the next four years. More than half of the resources would come from actions within the Corporation’s control. The remainder would come from increases in federal and State aid ($3 billion), although such increases now appear less likely and could necessitate changes in the transformation plan.
In June 2015, the Corporation initiated a staffing reduction plan to reduce personnel costs. The number of full-time-equivalents (FTEs) declined by 4,474 between November 2015 and
September 2017 (see Figure 21), a reduction of 9 percent. The number of FTEs in the Corporation’s hospitals declined by 10 percent, and dropped by 11 percent at the six diagnostic and treatment centers and by 13 percent at the long-term care facilities. Staff reductions and a comprehensive hospital restructuring initiative are expected to yield savings of $544 million annually by FY 2020.
In just FY 2017 alone, the Corporation reduced staffing by 2,466 positions. About 32 percent of the cut was in direct clinical care and another 68 percent occurred across management, housekeeping and other nonpatient care positions, such as lab technicians. The number of physicians, physician assistants, nurses, aides and orderlies declined by 18 percent in FY 2017. The effects of the staffing reductions on the quality of care at the Corporation’s facilities remain to be seen.
The Corporation has not revised its accrual financial plan since October 2016. At that time, it projected budget gaps that grow from $1.2 billion in FY 2018 to $1.8 billion by FY 2020. It has not updated its cash financial plan since May 2017. The Corporation’s failure to update its financial plans on a regular basis makes it difficult to discern whether the Corporation is making progress or falling behind in its efforts to address its financial problems.
4041424344454647484950
Jun-15
Aug-15
Oct-15
Dec-15
Feb-16
Apr-16
Jun-16
Aug-16
Oct-16
Dec-16
Feb-17
Apr-17
Jun-17
Aug-17
Tho
usan
ds o
f Ful
l-Tim
e-E
quiv
alen
ts
FIGURE 21Health and Hospitals Corporation Staffing
Sources: Health and Hospitals Corporation; OSC analysis

25
2. Metropolitan Transportation Authority In November 2017, the Metropolitan Transportation Authority (MTA) released a revised four-year financial plan that projects positive year-end cash balances through 2019, but budget gaps that grow from $352 million in 2020 to $643 million in 2021.
These estimates assume slow uninterrupted growth in the regional economy, $1.3 billion in unidentified efficiencies, and new sources of funding for the Subway Action Plan (SAP). They also assume biennial fare and toll increases of 4 percent in both 2019 and 2021 (fares and tolls already increased by 4 percent in 2017).
Phase 1 of the SAP is intended to stabilize and improve the deteriorating subway system. Phase 1 is expected to increase the operating budget by $1.5 billion over five years and the capital budget by $348 million over three years.
The MTA’s financial plan assumes that the State will fund half of the operating cost ($767 million over five years), and that another funding source will fund the other half. While the Governor has made a commitment to fund the State’s share, the funding has not yet been appropriated. The MTA has indicated that the SAP will be revised to the extent that funding is not received. In the meantime, the MTA is funding the SAP with the expectation of being reimbursed.
Phase 2 of the SAP is intended to modernize the subway system. In July 2017, the MTA estimated the cost of Phase 2 at $8 billion with the expectation that it would be included in the MTA’s 2020-2024 capital program. The sources of funding, however, were not identified. More recently, the MTA has indicated that Phase 2 will be addressed over multiple capital programs and that the projected cost has not been finalized.
Although the State is committed to contributing $8.5 billion to the 2015-2019 capital program, it has not yet identified the source of $7.3 billion of its commitment. Under State law, the State
commitment could be met through MTA bonds backed by an existing or new State revenue source. The Governor has announced the State’s intention to contribute an additional $1 billion to the current capital program, but the source of funding has not been identified.
In addition, nearly one-quarter ($7.6 billion) of the MTA’s capital program is funded by the federal government, but there is uncertainty regarding the size of the federal commitment. For example, the President has proposed eliminating the New Starts program, which the MTA assumes will fund one-third ($2 billion) of the estimated cost of Phase 2 of the Second Avenue Subway.
A recent report by OSC concluded that without new sources of funding, the condition of the transit system could fall further into disrepair or fares and tolls could increase faster than planned. The Governor and the Mayor have both expressed support for new revenue sources for the MTA, but they disagree on the approach. Given the importance of the transit system to the State and City economies, the State Comptroller has urged the State and the City to work together to prevent negative outcomes.
3. Department of Education The November Plan assumes that New York State will fund 36 percent of the $32.5 billion projected cost of the Department of Education in FY 2019, with the remainder funded by the City (57 percent) and the federal government and other sources (7 percent).
The City expects State education aid to increase by $465 million in FY 2019. Increases in State education aid have varied over the years, ranging from a reduction of $518 million in FY 2010 during the recession to the largest one-year increase of $955 million in FY 2008. A shortfall in anticipated State education aid could result in an increase in City funding or a reduction in planned services.
26
Each year, the Department of Education submits Medicaid reimbursement claims for eligible services provided to special education students. However, the department has had difficulty substantiating such claims to the federal government.
The November Plan anticipates the receipt of $97 million annually in Medicaid reimbursements. As of November 21, 2017, the department has submitted claims expected to generate $33 million in federal Medicaid revenue for FY 2017. Until the department demonstrates that it can meet its annual target, the remaining $64 million remains at risk.
4. New York City Housing Authority The New York City Housing Authority (NYCHA) manages approximately 176,000 apartments that house nearly 400,000 residents, which amounts to 8 percent of the City’s rental apartments. As of March 2017, nearly 257,000 families were waiting for apartments to become available.
NYCHA is scheduled to release a revised financial plan on December 20, 2017, one year after the last revision. The December 2016 financial plan projected surpluses of $21 million in 2017 and $61 million in 2018, and these estimates assumed the receipt of $140 million in 2017 and $133 million in 2018 from the sale of development rights. However, NYCHA has not yet reached agreements to realize these resources.
Federal funds make up 59 percent ($1.9 billion) of NYCHA’s operating budget (87 percent of the portion not funded with rent proceeds). The capital budget also relies heavily on federal funding. Given the uncertainty regarding the federal budget, it remains to be seen whether NYCHA will receive federal funding at the levels anticipated in its financial plan.
In November 2017, the City Department of Investigation reported that between 2013 and 2016 NYCHA had not met the federal requirement to annually inspect about 55,000 apartments where lead-based paint hazards might be present. During that time, it also failed to adhere to the City requirement that it annually inspect for lead paint at such apartments where children younger than six years old live.
Nonetheless, NYCHA certified to the federal government that it was in compliance with all applicable federal requirements. The City expects a federal monitor to be appointed to supervise NYCHA’s compliance with lead paint inspections.

27

Contact Office of the New York State Comptroller 110 State Street, 15th Floor Albany, New York 12236
(518) 474-4015
www.osc.state.ny.us
Prepared by the Office of the State Deputy Comptroller for the City of New York