review of the commonwealth government securities...
TRANSCRIPT

Submission to the
Review of the CommonwealthGovernment Securities Market
by
The Commonwealth Bank of Australia
December 2002

TABLE OF CONTENTS Page
Executive Summary� 2
Pricing Other Financial Products� 5
Referencing Other Financial Products� 11
Managing Financial Risk� 13
Providing A Long-Term Investment Vehicle� 15
Implementing Monetary Policy� 18
Providing A Safe Haven In Times Of Financial Volatility� 19
Attracting Foreign Capital Inflow� 22
Promoting Australia As A Global Financial Centre� 24
Appropriate Size Of The Commonwealth Government Securities Market� 26
Options Available To The Commonwealth�
Option 1 :-� Wind down the Commonwealth Securities market 28
Option 2 :-� Consolidate Commonwealth and State government debt markets 31
Option 3 : � Maintain the Commonwealth Government market and fund theCommonwealth unfunded superannuation liability
32
Glossary of terms� 39
Bibliography� 40

6 December 2002
Page 2
Review of the Commonwealth Government Securities Market
EXECUTIVE SUMMARY
Introduction. The Commonwealth Government Securities (CGS) market has fallen from apeak of $115bn outstanding in 1996 to the current level of about $55bn,largely as a result of fiscal consolidation and a series of asset sales. As aconsequence of this significant reduction, some have questioned theongoing role of the CGS market in the Australian financial system.
We believe that the CGS market is a fundamental pillar of Australian debtand investment capital markets. The ongoing viability, efficiency and costcompetitiveness of those markets is, in our view, contingent upon the CGSmarket being sustained in some form.
An understanding of the various interdependencies within financial marketsis a crucial part of any assessment of the ongoing value in preserving aCGS market.
The Commonwealth Bank of Australia favours the retention of the CGSmarket and would welcome the opportunity to discuss our views in greaterdetail.
Key considerations. This Submission specifically responds to the issues and questions raisedwithin the Discussion Paper. It examines and identifies issues that webelieve should be taken into account as part of the Commonwealth‘sdeliberations on this fundamental issue.
Pricing other financial products. It is generally accepted that efficient debt markets need effectivebenchmarks.
For an instrument to be accepted as a benchmark in Australian debt andinvestment markets, it must ideally be: risk free, liquid, relevant to all users,domestically oriented, AUD denominated, transparently priced across a fullterm structure and a homogeneous investable instrument.
In our view only the CGS market satisfies these key criteria.
Referencing other financialproducts.
Furthermore, Australian capital markets would not operate as effectively oras efficiently with an alternative benchmark. To suggest otherwiseseriously undervalues the effectiveness of the mechanism by whichmarkets interact with each other. This interaction and interdependency hasgenerated the base liquidity and pricing benefits enjoyed by the broaderinvestor and borrowing community over the past twenty years.
Managing financial risk. The risk-free and highly-liquid nature of the CGS market and associatedderivative markets has provided the full spectrum of market participantswith an important vehicle for managing financial risk.
If the CGS market were to be abolished or significantly wound down, we donot believe that a replacement market would provide the same degree ofcost-effective, broad-based market acceptance.
Providing a long-terminvestment vehicle.
Although investment portfolio allocations to CGS specifically (and fixedinterest generally) is currently low by historical standards, this in partreflects a prolonged period of excess returns in other asset classes. In ourview recent market corrections (particularly in offshore markets) shouldensure a return to allocations more consistent with historic norms.
This return to CGS should be particularly apparent amongst the moreconservative investors such as retirees who typically invest in funds thathave much higher allocations to CGS than the overall average.
CGS usually represent the largest single credit exposure within a fixedinterest or balanced investment portfolio. There is still significant excess

6 December 2002
Page 3
capacity for CGS within the investment market. This capacity is, in part, aconsequence of the clear supply gap in the domestic debt market.
Furthermore the removal of the CGS market would create a fiduciarydilemma for most fund managers governed by mandates that oblige themto invest a portion of their funds under management in so called risk-freeassets (ie CGS) and restrict them from dealing in alternative products.
It is also arguable that the elimination of the CGS market may furtherescalate the flow of funds offshore.
Providing a safe haven in timesof financial market volatility.
The CGS market is widely accepted as a safe haven during periods offinancial-market instability. The CGS market replicates the role thatGovernment bond markets play in other developed financial markets. Onlythe CGS market has the required characteristics to act as a safe-haven.
Implementing monetary policy. We believe that there would be only a limited impact of the Reserve Bankof Australia’s (RBA) ability to implement monetary policy from removing theCGS market. There is a sufficiency of private sector paper currentlyavailable for the RBA’s liquidity and policy activities.
The RBA does differentiate between government and non-government riskin conducting open market operations. In this context we note that bankbills are currently only used for intra-day repurchase agreements.
Attracting foreign capital flows. Global investors are an important component of the CGS market. Offshoreholdings increased from about 10% in the mid 1980s to a peak of 40% in1998. There has been a small net decline since then towards 35%.
If the CGS market were eliminated it is likely that some funds would betransferred to other Australian dollar (AUD) denominated assets. But theadditional element of (credit) risk may inhibit offshore investor interest.
For investors linked to global government bond indices, the decision isstraightforward. Eliminating the CGS market would result in Australiahaving a zero-weighting in global bond indices. These fund managerswould permanently shift funds out of Australia.
Promoting Australia as a globalfinancial centre.
In our view the existence of a government bond market provides Australiawith a major regional competitive advantage. Apart from Japan, no otherAustralasian market is included in the various global bond indices. We alsonote that Australia, along with Singapore, is the highest-rated sovereign creditwithin the Asian region. Global fund managers, as a consequence, have abenchmark driven need to participate in Australian financial markets, therebyadding to liquidity.
The existence of the CGS market offers diversification benefits to domesticand international investors. The low correlation of returns on AUD debt withEuro-denominated debt in particular has lifted the attractiveness of Australianmarkets for global fund managers looking to offset the loss of currencydiversification resulting from monetary union in Europe.
We also note that AXISS Australia, the government body charged withpromoting Australia as a global financial centre, has stated that a liquidCommonwealth Government yield curve is a “core element” of Australia’sfinancial market infrastructure.
Client feedback. Domestic and international client feedback overwhelmingly supports theretention of the CGS market. The pay down of the CGS market is not seenas supportive of foreign investment in Australia. Nor is it perceived asconsistent with the development of Australia as a regional financial centre.
Disclosure The Commonwealth Bank of Australia is a shareholder in the SydneyFutures Exchange

6 December 2002
Page 4
Other Considerations
Impact on cost of funds forprivate sector.
An assumption running through the Discussion Paper is that eliminatingpublic debt will reduce private sector capital costs. We believe that costsmay in fact rise. Borrowers, investors and financial intermediaries useCGS, interest-rate swaps and other instruments to manage interest-raterisk. Without an effective underlying risk-management medium, we wouldexpect the cost of executing transactions associated with managing theserisks to increase. The increase would largely reflect increased bid/offerspreads as a consequence of a less transparent price-discovery process.
Option 1 The elimination of the CGS market will result in the removal of the liquid,benchmark, risk-free rate from Australian financial markets. We believe thatthis will result in an increase in the risk profile of investors’ asset portfolios,and a rise in the cost of capital. One of the implications will be a furtheroutflow of funds from fixed-income portfolios to overseas assets.
Our preferred option is the retention of a liquid CGS market. If theGovernment did decide to follow a second-best option and eliminate theCGS market, we believe the best method would be to retire CGS debt whenit matures. This approach would allow financial markets time to develop analternative to the CGS market. We also believe that repurchasing debt on-market would be an expensive exercise, as highlighted by the experiencewith previous reverse tenders.
There will be a re-entry premium to be paid if the Commonwealth exits thedebt market, and then wishes to return at a future date. We note that theDiscussion Paper suggests that the costs could be up to 30bpts annually.In our view the direct cost to the Government of shutting and re-opening theCGS market is a second-order issue. More important are the externalitiesinvolved with removing the liquid, benchmark, risk-free rate from thedomestic financial market infrastructure.
Option 2 The option of combining the Commonwealth and State government bondmarkets has two advantages. It would increase the liquidity of the bondmarket, and it would most likely reduce the cost of capital for the States.
The combined amount on issue is currently of sufficient critical mass towarrant consideration as a surrogate benchmark. State government budgetpositions and current fiscal policies, however, suggest that this sector isunlikely to require substantial new debt issuance in the foreseeable future.The maintenance of a minimum critical mass on issue would, therefore, becrucial to the acceptance of Semi-government bonds as a substitutebenchmark market
We note that the Commonwealth and State governments decided not toproceed down this path in 2001.
Option 3 The Discussion Paper assumes that the only alternative use for Budgetsurpluses is to offset unfunded superannuation liabilities. Other options areworthy of consideration.
Furthermore Governments have a role to play because of weaknesses inthe market system. Keynes perhaps best summed it up as “the importantthing for government is not to do the things which individuals are doingalready…..but to do those things which at present are not done at all”.
In this context we believe that the economic costs of eliminating theremaining debt are likely to offset the potential benefits. And that debtelimination arguably sits at odds with the broader theoretical role ofgovernment.

6 December 2002
Page 5
PRICING OTHER FINANCIAL PRODUCTS
Question 1: Are CGS used extensively as the primary benchmark for pricing thedebt securities of other issuers?
Response: CGS and associated derivative products are used extensively as theprincipal benchmarks for the pricing of fixed-rate debt securities. CGS is thekey benchmark in both the primary and secondary markets. It is the keybenchmark across a broad spectrum of issuers and transaction types.
Primary and secondary-market pricing referenced to other financial marketsproducts such as interest-rate swaps are also used. The use of alternativeproducts is considered largely ancillary to, and dependent upon, the use ofCGS and associated derivative markets.
Table 1: Benchmark Profiles
Primary Markets Secondary Markets
Product Pricing CGS* Swap** CGS* Swap**
Semi Government � �
Corporate � � � �
RMBS Fixed � � �
CMBS Fixed � � � �
Credit Wrapped Fixed � � � �
Debt/Equity Hybrids � �
* Reference to CGS & associated derivative markets ** Reference to Bank Bill Swap Reference Rate as distinct from fixed rate
Question 2: (part 1) Is the interest rate swap curve used widely for pricing debt securities?
Response: The swap curve is not as widely used as the CGS curve for pricing fixed-ratedebt securities.
The swap curve is used principally to provide another dimension tocomparative-value assessments, and not as a preferred benchmark for price-setting purposes.
Question 2: (part 2) If not, are there obstacles to using the swap curve in the future?
Response: For an instrument to be accepted as a domestic benchmark it must be:� risk free;� universally accepted by prospective users;� liquid and freely tradeable;� domestically oriented and AUD denominated;� transparent in its pricing;� comprehensive in term structure coverage;� supported by an underlying homogeneous instrument;� investable.
On the above criteria, the swap curve has several significant structuralimpediments that may permanently limit its acceptance as a surrogate orreplacement benchmark. In particular:
� Swaps contain inherent credit risk and therefore, unlike CGS, cannot rightlybe considered “risk free”.

6 December 2002
Page 6
There are structural impedimentsto the swap curve acting as areplacement benchmark.
� Swaps are not universally used by all market participants.� Swaps are less liquid than CGS (and associated derivative markets) even
though swaps turnover is notionally higher than that for physical CGS.� Swaps are not a homogeneous product, with each swap transaction being
the unique product of a bilateral agreement between counterparties.� Swaps lack the observable price transparency of CGS and associated
derivatives.� Swaps are an effective measure of relative value rather than a market
benchmark.� Swaps cannot be invested in (ie they are not a physical instrument).
Swaps contain credit risk andcannot be considered “risk free”.
Unlike the CGS market with its homogeneous credit risk, swapcounterparties vary in credit quality. As such, any swap rate includes acredit-risk and documentation component that the CGS market does not.
Swaps are not universally used. Fund manager mandate constraints inhibit the broad-based use of swaps inportfolio management. Furthermore the inability to invest in a physical swapinstrument will continue to further limit the acceptance of the swap marketamongst the broader fund industry.
Swaps are less liquid than CGS. Swap turnover is greater than CGS physical turnover. But the uniquebilateral over-the-counter nature of each swap transaction ensures that theswap market is perceived as inherently less liquid than the homogeneousphysical CGS and its associated exchange-traded derivative markets.According to Australian Financial Markets Association (AFMA) data thecombined turnover of the CGS physical market and associated futurescontracts is more than ten times that of the interest-rate swaps market. Asan example of the relatively greater liquidity, the bid/offer spread for CGS istypically around 2bpts while that for swaps is often around 6bpts.
Swaps lack the same degree ofobservable price transparencyas CGS.
The CGS market has a large number of active participants who freely priceCommonwealth of Australia risk to each other on reciprocal demand. Thispromotes a highly-liquid, price-transparent market capable of being used as aneffective market benchmark, including providing underlying support for theexchange-traded futures market.
The swap curve, in contrast, is not an homogenous product and reflects a seriesof prospective over-the-counter bilateral obligations between consentingcounterparties. Participation is contingent upon each player having counterpartycredit limits available on mutually-acceptable terms. Swap trade sizes tend to besignificantly larger than for CGS.
The Sydney Futures Exchange (SFE) has recently launched three-and-ten-yearinterest rate swap futures contracts. Australian markets have, historically, notalways embraced new futures contracts. The last successful futures contacttaken up by the market was the three-year bond contract over fifteen years ago.Similar futures contracts in the US for USD interest-rate swaps and Agencysecurities remain significantly less liquid than futures contracts based onTreasuries. The Commonwealth Bank of Australia is shareholder in the SFE.
Swaps are an effective measureof relative value.
The swap curve does not play a lead role in the final price-setting process forprimary fixed-rate debt securities. But it is used extensively as an alternativemeasure of relative value between different types (ie fixed and floating rate) ofdebt securities, particularly in the secondary market.
Swaps are not investable. A fundamental obstacle to the swap market being used for pricing debt securitiesis that, unlike physical debt securities, swaps are not investable. Nor can they beused as collateral. Dealing in swaps involves incremental transaction costs and isthus a less efficient risk management tool than CGS.
This lack of investability has significant implications for the funds-managementindustry. They would be effectively precluded from transacting in a product thatthey are potentially benchmarked against.

6 December 2002
Page 7
When an investor buys a bond they acquire a freely tradeable asset with a seriesof known, fixed cash flows at known future dates in exchange for a known up-front payment. The supply of bonds is also finite at the time of purchase.
Swaps are not a physical instrument. Under an interest-rate swap contractcounterparties agree to exchange a series of cash flows at known future dates.There is no up-front exchange of principal or consideration. There are also nosupply constraints to swaps (other than availability of counterparty credit limits).Instrument transfer is effected by negotiation of terms and conditions unique tothe individual swap.
Implications for fund managers A significant implication of all of these factors for funds management is thatportfolios would become administratively complex in what should be thesimplest and most straightforward type of portfolio. A swap contract can’t besold, as a physical bond is sold. The investment impact can only be closedout by entering into an offsetting contract or executing a swap termination.Thus, the processing of inflows and outflows over time, and implementationof active investment management decisions, will result in a plethora oftransactions that would need to be monitored, revalued and administered.Many fund managers would be reluctant to use swaps extensively for thesereasons.
Question 3: (part 1) What other options are available for pricing debt securities?
Alternative options to CGS forpricing debt securities.
Efficiently pricing fixed rate debt securities without a CGS curve requires thewide acceptance of another reference benchmark curve to reflect terminterest rates. Alternatives to the CGS market and the domestic swap curveinclude:� Semi-government bond curve (Semi’s);� Supranationals (Supra);� Australian major bank curve (Bank);� US Treasury curve (UST).
Question 3: (part 2) How effective are they?
The likely effectiveness of a prospective benchmark needs to be evaluated inthe context of the benchmark characteristics previously defined
Table 2: Benchmark Characteristics
Characteristics CGS Swap Semi Supra Bank UST
Risk Free � ? (1)
Liquid � � � ? ? �
Relevant to all Users �
Domestically oriented � � � �
Transparent Pricing � � �
Full Term Structure � � � �
Homogenous Instrument � �
Investable � � � � �
(1) Risk free to US benchmarked participants only
Semi-government bonds. The Semi-government bond market offers a virtually risk-free domesticAustralian dollar yield curve. It is certainly closest in representation and creditquality to the CGS yield curve although we note that the credit ratings arediscrete and unique to each issuing entity.
We also note that Semi-Government bonds enjoy the same Real Time Gross

6 December 2002
Page 8
Settlement (RTGS) status as CGS.
Pricing of Semi-government bonds is transparent and readily accessiblethrough the agency of each issuing authority’s dealer panel. As aconsequence, the Semi-government market is perceived as liquid. Most StateGovernment issuing authorities support dealer panel members price-makingobligations through access to stock lending facilities. We note that this facilityis not currently available from Commonwealth Treasury for CGS.
Semi-government authorities issue across a broad term structure, includingsome issues with maturities significantly longer than current CGS issuance (egQueensland Treasury Corporation have issues maturing in 2019 and 2021currently outstanding).
Each issuing State Government authority is rated, managed, borrows andinvests as a separate legal entity under the direction of their respective StateTreasuries. As a consequence, the Semi-government bond market is not ashomogeneous as the CGS market.
The domestic and international investor base for Semi-government bonds isdeep. We also note that some State borrowing authorities have active offshoreissuance programs structured to specifically accommodate offshore investorinterest in this market.
The combined amount on issue in this sector is currently of sufficient criticalmass to warrant consideration as a surrogate benchmark. State Governmentbudget positions and current fiscal policies, however, suggest that this sector isunlikely to require substantial new debt issuance in the foreseeable future. Themaintenance of a minimum critical mass on issue would, therefore, be crucialto Semi’s acceptance as a substitute benchmark market.
The Semi-government market is closest in characteristic to the CGS market.Although there are some governance issues that need to be addressed, it haspotential to fulfil some of the benchmark functions of the CGS market. The lackof homogeneity, however, would be a significant structural impediment to thismarket assuming benchmark status.
Supranationals. Supranational issuance into the Australian domestic market is a relativelyrecent phenomenon. Despite their generally very high credit quality (AAA)we believe it is difficult to rationalise using Supranational bonds to replaceCGS as a domestic risk free benchmark.
Broadly speaking, the risk-free status of CGS in the Australian market isderived from the credit rating of the Commonwealth of Australia (AAA) as asovereign local currency borrower with a capacity to levy taxes.Supranational borrowers, in contrast, are very well capitalised foreigncorporate entities with sovereign shareholders that access the Australianmarket on a largely opportunistic basis. Furthermore each Supranational is aseparate legal entity with a unique and distinct internationally orientedMission Statement.
Selected supranational issues do enjoy the same RTGS status as CGS.
Pricing in Supranational issues is less transparent than for CGS and Semis.Most issues trade more like corporate bonds. As such pricing betweenintermediaries is generally on an “if suits“ basis. Given the largelyopportunistic nature of most Supranational issuance, most borrowers haveincomplete term structures in the domestic market. The amount on issue inthis sector also lacks sufficient critical mass to warrant consideration as asurrogate benchmark.
We do not believe the Supranational bond market can be viewed as being ashomogeneous as the CGS market and as such is unlikely to be accepted byusers as an effective surrogate benchmark.

6 December 2002
Page 9
Major Australian Banks. As the highest-rated non-government group of corporate entities in thedomestic market, Australian banks collectively enjoy a prominent positionwithin the Australian financial system. They dominate the domestic swapmarket. This dominance means that there is already a high degree ofexposure to the credit of Australian banks across the financial system.
Pricing in Australian bank issues is significantly less transparent and lessliquid than for CGS. Pricing between intermediaries is on an “if suits“ basis.The amount on issue in this sector also lacks sufficient critical mass towarrant consideration as a surrogate benchmark.
In addition, almost all debt-security issuance by major Australian banks hasbeen for terms of five years and under. There are currently no longer-datedissues in the market for any borrower from this sector.
We do not believe that a greater level of term issuance by major Australianbanks will be viewed as being as a replacement benchmark.
US Treasury curve. The US Treasury curve represents a globally-accepted, liquid, risk-freebenchmark priced in US dollars.
Although the US and other global factors heavily influence the Australianmarket, the US Treasury curve has limited domestic applicability. The USTreasury curve reflects US economic/political fundamentals, not Australian.Its adoption as a benchmark would marginalise the domestic markets.
Furthermore, the use of any foreign benchmark directly introduces currencyexposure to the risk-management process and, as a consequence, wouldclearly increase the cost of transacting for all users.
We do not consider the US Treasury market to be a viable alternativedomestic benchmark.
Liquidity of the CGS market. A key factor behind the importance of a government bond market to thedomestic market is the greater liquidity of CGS. Recent activity statisticsoffer an insight into changes in investor behaviour.
An increase in velocity ofturnover has sustained CGSmarket liquidity.
Although the average dailyturnover of CGS has fallensignificantly, the velocity (def-ined as turnover divided bystock of underlying debt) ofthis market has provedremarkably resilient.
This resilience has sustainedthe markets’ underlyingliquidity and viability during aperiod when the amount onissue has fallen.
This trend was supported by amatching surge in CGSRepurchase Agreement(repo) activity.
Fig. 1:
BOND TURNOVER(daily average)
0
1
2
3
4
5
1993/94 1995/96 1997/98 1999/00 0
1
2
3
4
5
Co mmo nwealth
State
Direct bo nds
A sset-backed
Source: AFM A
$ bn $ bn

6 December 2002
Page 10
Institutional investors playing abigger role in CGS market.
According to data from the Australian Prudential Regulation Authority(APRA), domestic banks held less than $6bn of CGS at the end of March2002, suggesting that domestic and international institutional investors areagain significant participants in this key benchmark product.
Table 3: Bond Market Turnover Ratios
Sector 98/99 99/00 00/01
Financials 3.9 2.2 3.9
Corporate 9.0 4.4 3.8
Non Residential 1.9 1.3 0.9
Asset Backed 0.9 1.4 0.7
Total Private 2.7 2.3 2.1
CGS 7.9 8.1 8.9
This trend was supported inpart by the broadening of thebase of eligible RTGSsecurities. In contrast,although turnover in corporateand non-government paperhas continued to grow, tradingvelocity has dropped offmarkedly.
This drop-off is synonymouswith institutional investorsdeveloping a buy-and-holdmentality in relation to theirnon-CGS holdings. Source: AFMA
Significantly, this trend is also clearly apparent in the non-resident category,which includes Supranationals.

6 December 2002
Page 11
REFERENCING OTHER FINANCIAL PRODUCTS
Question 1: (part 1) Is the yield on CGS commonly used as a reference benchmark forcomparing the yields on other debt securities?
Response: The CGS curve is actively used to reference bonds and other financialinstruments. It is the base upon which all related ancillary market pricingand liquidity is built. As a consequence, the CGS market (and associatedderivative market) is rightly perceived as the “primary benchmark”.
Market participants take the level relative to swap into consideration in thepricing and decision making process. But the “risk-free” CGS rate isunambiguously the primary reference benchmark both directly (through thephysical CGS market) or indirectly (via the CGS futures market).
In addition, many market transactions are executed on an Exchange forPhysical (EFP) basis. Under this arrangement, a physical security is boughtor sold in exchange for an agreed volume of CGS futures contracts at adefined price. This type of transaction is particularly prevalent in theprofessional market as a means of managing or shifting risk amongstmarket participants. It is a core component of market liquidity.
All Semi-government, corporate debt and derivative instruments arereferenced to the CGS and associated derivative curve.
Australian capital markets wouldnot operate as effectively or asefficiently with an alternativebenchmark.
Australian capital markets would not, in our view, operate as effectively oras efficiently with an alternative benchmark. To suggest otherwise seriouslyundervalues the mechanism by which domestic interest-rate marketsinteract with each other. This interaction provides the base liquidity andpricing benefits that the broader investor and borrowing community hasenjoyed over the last twenty years.
The interdependent relationship of the various market sectors, and thecrucial role the CGS market plays, is clearly illustrated in Diagram 1.
Diagram 1: Financial Market Interdependencies
Commonwealth Government Bond Market
3-yr Futures Contract 10-yr Futures Contract
Swaps & Options Semi Government Bonds Corporate Bonds
Investors
Wholesale
Borrowers
Retail

6 December 2002
Page 12
Benchmarking fixed interestinvestment portfolios
The fixed interest investment process at most major fund managers isbased upon valuations that build from the CGS yield curve as the defaultrisk-free investment universe. The relative attractiveness of other assets isdetermined by evaluating their yield premium over similar duration CGS.
Question 1: (part 2) Are there any major obstacles that hampers the swap curve or someother benchmark being used as a reference benchmark?
We have addressed this question more fully in our response to PricingOther Financial Products, Question 2 parts 1 & 2.
Response:
The swap curve has significantstructural impediments limiting itscapacity to become areplacement benchmark.
In summary, we believe the swap curve has several significant structuralimpediments that may permanently limit its capacity to be accepted as asurrogate or replacement benchmark. In particular:� Swaps contain inherent credit risk and, therefore, cannot rightly be
considered “risk free” like CGS.� Swaps are not universally used by market participants.� Swaps are arguably less liquid than CGS even though in isolation market
turnover in swaps is notionally higher than CGS.� Swaps are not a homogeneous product with each swap transaction being
a unique bilateral agreement between counterparties.� Swaps lack the same degree of observable price transparency as CGS.� Swaps are an effective measure of relative value rather than a market
benchmark.� Swaps cannot be invested in (ie they are not a physical instrument).
The swap curve is itselfbenchmarked to the CGSmarket.
In addition, we also note that the existing swap curve is itself benchmarkedto the CGS market. And that interest-rate swap transactions (includingterminations) are frequently transacted on an EFP basis.
Furthermore, the liquidity available through the CGS futures market heavilyinfluences the stability of the swaps market. If the CGS futures contractwas unavailable for hedging, the stability and liquidity of the swaps marketmay be affected considerably, with potentially adverse consequences forpricing.

6 December 2002
Page 13
MANAGING FINANCIAL RISK
The CGS market has two important characteristics: status as a risk-freebenchmark, and a high degree of liquidity. These characteristics mean thatthe CGS and associated derivative markets play a key role in managingfinancial risk.
A liquid futures market has developed around the CGS market andcurrently plays an integral role in managing financial risk. In fact, Australiahas what is arguably the most liquid sovereign debt market in the world(see Table 4).
Table 4: Liquidity Ratios
Market Physical Market Futures Market Total
US 14 5 19Japan 4 5 9Italy 5 1 6UK 4 4 7
Canada 15 1 16Sweden 18 6 24Korea 1 0 1
Australia 8 20 28Singapore 4 0 4
Source: AXISS Australia
If the CGS market is abolished or significantly scaled back, the key issue is“what might act as a satisfactory substitute?”
Question 1: (part 1) Is there scope for the Treasury bond futures market to be replaced bya futures market based on an alternative instrument?
Response:
Alternative instruments wouldneed to develop the risk-freestatus and liquidity enjoyed byCGS.
The key features of the Treasury bond futures contract supporting itsbroad-based acceptance by risk mangers and traders are:� underlying support by a risk-free asset;� liquidity; and� price transparency through an exchange-traded medium.
These features provide a high level of confidence to the participants in thecontract. Alternative instruments would need to develop thesecharacteristics.
A quick development of an alternative futures market is unlikely. Thedevelopment of a liquid universally accepted bond futures market was anextended process. A deep physical market for CGS assisted thisdevelopment. The depth of the CGS market has attracted a large numberof traders thereby helping to further boost liquidity for the futures contract.
Question 1: (part 2) What could hamper an alternative futures market from developing?
Response: A potential alternative to the CGS futures contract is one based on interest-rate swaps. A swap contract would require the same level of support frommarket participants. There needs to be confidence around thetransparency of the settlement process and understanding of the dynamicsaffecting the pricing of the contract.

6 December 2002
Page 14
It would take a considerableperiod of time for any CGSreplacement to gainacceptance.
Gaining confidence in a swap (or another replacement) contract will taketime. A further unknown is whether foreign market participants would use acontract based off a derivative or synthetic curve. These concerns meanthat any swap contract would suffer for an extended period from a lack ofliquidity and may never evolve into a satisfactory alternative to the CGSmarket.
Australian markets have, historically, not always embraced new futurescontracts. The last successful futures contact taken up by the market was theThree-Year Bond Contract over fifteen years ago. Similarly-styled futurescontracts in the US for USD interest-rate swaps and Agency securities remainsignificantly less liquid than futures contracts based on Treasuries.
Question 2: Is the interest rate swap market sufficiently liquid at maturities longerthan five years to facilitate interest rate risk management?
Response: AFMA have observed that less than 20% of swaps outstanding have amaturity of greater than five years. Participation at the long end of theswap curve is generally deal driven and therefore flow is often sporadic. Asa consequence, bid/offer spreads at the long end of the swap curve tend tobe noticeably wider than for shorter maturities.
Furthermore, without an effective long-dated risk-free reference rate, thedevelopment of the long-dated domestic capital market will be significantlyimpaired.
Question 3: Would the viability of the interest rate swap market be affectedsignificantly by winding down the CGS market?
Response:
The interest-rate swap marketwould be significantly lessefficient without CGS
The interest-rate swap market would still be viable without the CGS market.But it would be significantly less efficient. Without a CGS market, the three-year and ten-year bond futures contracts could not exist in their current form.The CGS futures contracts are the primary market used to hedge swapmarket risk. Without a viable alternative, the liquidity of the interest-rate swapmarket would decline. This decline would lead to wider bid/offer spreads,increasing transaction costs.
Question 4: If alternate risk management tools were not available, what would bethe likely impact of this on the cost of capital for corporate bondissuers?
Response:
The loss of an efficientbenchmark will have anadverse impact on the cost ofmanaging financial risk.
The removal of highly effective interest-rate benchmark will have anadverse impact on the cost of managing financial risk. And this cost willultimately be borne by the broader community.
In this context we believe it is reasonable to conclude that the average costof finance will increase across the wholesale and retail sector. A directimpact is difficult to quantify. But we note that a 10bpt increase in the costof funds across the stock of private sector (household and corporate) debtequates to a least $1.6bn a year incremental cost to these sectors (basedon a stock of debt of $1,651bn).
Financial institutions use swaps for managing the interest-rate risk in theirbalance sheets. Anything that inhibits that ability to hedge, and/orincreases the price of hedging, will ultimately be reflected in the price ofdebt. An increase in hedging costs and an associated reduction in liquiditywill inhibit to some extent the flow of cost-effective innovations that are afeature of Australian financial markets. The increase in the price ofhedging, and a decline in liquidity in the domestic financial market, wouldalso lead to more issuers raising capital in offshore capital markets.

6 December 2002
Page 15
PROVIDING A LONG-TERM INVESTMENT VEHICLE
Access to a “risk-free” asset isessential.
There is a potential welfare lossassociated with scaling backthe bond market.
Access to an investable “risk-free” asset is critical for not only the fixedincome market but for investors more generally.
This risk-free role is an essential component of any benchmark for pricingother financial products, it provides an objective assessment of wheremarkets believe interest rates are heading, and it provides a safe havenduring turbulent times.
There is no doubt that having a generic, Australian, risk-free investmentmedium assists the development of an efficient capital market.
It is difficult to quantify the “value” of the bond market to the economy. Butsome work by the US Federal Reserve concludes that “the pool of availableinvestment opportunities may be significantly affected by the retirement ofgovernment debt, and there is a potential welfare loss associated with suchan effect”. The US work produces a range of estimates of that welfare loss.Depending on the degree of investor risk aversion, the rise in wealthrequired to compensate for the removal of (US) Treasuries from theinvestment opportunity set lies in a 0.1-0.9% of wealth range (see A.Bomfim (2001)).
Question 1: What is the significance of CGS as a long-term investment vehicle,particularly for institutional investors such as superannuation fundsand life offices?
Response:
The CommonwealthGovernment is the largest singleissuing entity in which peopleinvest.
Allocations to CGS understatetheir importance to the market.
CGS represents the largestsingle exposure by themanaged-funds industry.
Government bonds are a vital component in the menu of availableinvestment opportunities for all investors. They are vital not only tosuperannuation funds and life offices, but also other managed investmentvehicles and general insurers.
Investment institutions offer to the market a range of products, covering thefull spectrum of risk-return characteristics to meet a variety of investorneeds. An allocation to the default-risk-free CGS market is an importantingredient for the majority of those products. The Commonwealthgovernment is typically the largest single issuing entity in which peopleinvest (either directly or indirectly). In conjunction with various combinationsof other assets, the allocation to CGS (and similar assets priced off CGS)creates an appropriate overall portfolio risk-return outcome for differentinvestors.
It is worth examining the available data on fund allocations to CGS moreclosely before drawing firm conclusions about what they are telling us.CGS accounts for “less than 5%” of the total investments of superannuationfunds and life offices. But it is incorrect to infer from this, as the DiscussionPaper does, that “CGS may not be a crucial instrument in the investmentstrategy of the superannuation sector at the moment”.
ABS data (ABS (2002)) shows that at a level of 3% of total assets, theCommonwealth Government is the largest and most significant individualexposure in the superannuation and managed-funds sector. Someindividual Australian equity investments might come close to this level ofexposure. But we believe that even the largest individual share take-upfalls short of the amount invested in Government bonds. This outcomereflects the low-risk, high-liquidity characteristics of CGS and reveals thatthey are a highly significant investment.
CGS are very important for risk-averse investors.
CGS are more significant for those investors at the conservative end of therisk spectrum than they are for the overall average position. Thesuperannuation system (and managed funds more generally) serviceinvestors at different stages of life with different risk profiles.

6 December 2002
Page 16
The aging population will seethe proportion of “conservative”investors rise.
Younger and more risk-tolerant investors tend to havegreater allocations to equities,often investing only in equitiesas their time horizon extendsfor decades. Moreconservative investors, suchas many retirees, invest infunds that have much higherallocations to CGS than theoverall average. The agingpopulation will see theproportion of conservativeinvestors rise. Conservativefunds tend to have anallocation of 70% to incomeassets, the most significantbeing CGS.
It is also worth noting in thisconnection that the totalallocation of funds to fixedinterest overall is quite low atthe moment. The share of“long-term securities” in totalsuperannuation assets hasfallen from around 20% in thelate 1980s/early 1990s toaround 8% at present. Thisfall in part reflects theentrance into the managed-funds system of a largernumber of younger and morerisk-tolerant investors. Theirportfolio allocations areintentionally focussed ongrowth assets rather thanincome assets.
Figs 2-3:
DEMOGRAPHIC SHIFTS(age group's share of population)
0
20
40
60
1999 2009 2019 2029 2039 20490
20
40
60
25-64 years
0-4 years
5-24 yearsOver 65 years
% %
0% 10% 20% 30% 40% 50%
Cash & deposits
Loans
Short term
Long term
Equities
Property
Other
Overseas
M ar-2002Jun-2000Jun-1995
ASSET ALLOCATION SHARES(life offices, super & public unit trusts)
CGS is still the critical asset forduration management and forthe processing of fund inflowsand outflows.
CGS also plays an importantrole in managing a fixed-interestportfolio.
Within the broad “long-term securities” category, CGS remains thedominant allocation. The allocation has fallen from a peak of 60% in themid-1990’s to 40% presently. But it remains double the proportion of long-term securities in CGS held in 1990. Corporate bond exposure hasdefinitely increased in recent times, but largely at the expense of Semi-government holdings rather than CGS. In 1993 the proportion of long-termsecurities in CGS and semis was similar (at just over 40% each); but now,while the CGS proportion is still just over 40%, Semis have slipped below20% and corporates have increased to match the CGS level.
The point needs to be made again in this context, however, that the CGSallocation is exposure to the one issuer, the one source of risk – whereascorporate exposure is diversified and much less liquid than CGS holdings.
Also, simply looking at CGS holdings in aggregate does not recognise therole that changing the maturity of specific securities has for themanagement of fixed-interest portfolios. Corporate holdings tend to bemaintained for longer periods of time (as evidenced by the turnover andvelocity statistics noted elsewhere in this submission).
CGS is still the critical asset for duration management and for theprocessing of fund inflows and outflows. This is because the CGS sectoroffers the liquidity and pricing transparency required for use in the activemanagement of fixed interest portfolios.

6 December 2002
Page 17
Question 2: Is there currently an unmet demand for CGS within the superannuationsector?
Response:
There is an unmet demand forCGS.
Yes. The allocation to CGS is currently quite low by historical standardsand would undoubtedly be higher if there were more CGS on issue.
Some funds invest in line with bond indices that reflect the amount ofsecurities on issue and thus have reduced their exposure to CGS in recentyears. There is concern within the industry, however, that this trend isdistorting the risk-return profile of investment portfolios and many fundswould prefer to have larger allocations to CGS than are currently consistentwith the index. There is absolutely no doubt that if CGS weightings in themajor domestic bond indices increased, then the allocation in institutionalfunds would be higher than is currently the case.
More importantly, the demandfor CGS is expected to increasein the future.
More importantly, the demand for CGS is expected to increase in the future.The long-running adjustment phase in overall super-fund allocationsbetween sectors does seem to have run its course. The overall proportionof assets invested in equities rose sharply from 30% to around 45% duringthe mid-to-late 1990s, but appears to have stabilised since then. Similarly,the proportion held in overseas assets rose from 10% in 1992 to 20% in1999, and has held at the higher figure in recent years. The allocation tolonger-term fixed interest, which as previously noted has fallen over thepast decade, appears to have bottomed out at around 8%.
With greater stability in the allocation to different assets, it follows thatgrowth in super and other managed investments will increase the demandfor bonds (including CGS) in the coming years.
Question 3: What is the potential to develop alternative long-term investmentinstruments?
Response:
The liquid, risk-freecharacteristics of the CGSmarket will be difficult toreplicate.
The risk free and liquid character of CGS is a key determinant in structuringa risk-adjusted investment portfolio. Although alternative long-terminvestment instruments will no doubt be developed, no issuer can providethe liquidity and risk-free characteristics that the national governmentprovides in an advanced and mature economy like Australia. Whatever thesubstitute, the overall investment profile of superannuation funds and lifecompany investments would be made more risky by the absence ofappropriate exposures to CGS.
The simplest and most attractive alternative from an institutional investorperspective would be for other issuers already active in the AUD debtmarket to take over the role of providing a liquid, low-risk yield curve. Othersuggested alternatives involve some degree of intermediation, whether viaswaps, or currency hedging. Credit risk increases as soon as another partygets involved. One suggestion involves providing some form of collateral tocover for the possibility of counterparty losses. In any event mostalternatives lack the simplicity and liquidity of the CGS market.
In this context we note that fixed interest unit trusts are required by theCorporations Act, 2001 to be liquid offerings. CGS, although not the onlyliquid instrument, still play a crucial role in meeting that obligation

6 December 2002
Page 18
IMPLEMENTING MONETARY POLICY
Question: The Government would appreciate views from stakeholders on thedeclining importance of CGS in the operation of monetary policy.
Response: Monetary policy is one of the key instruments of economic management.Whether the winding down of the CGS market will have an impact on theability to run economic policy in general and monetary policy in particularshould be a key focus of the Discussion Paper.
In a narrow technical sense we believe that there would be only a limitedimpact on the Reserve Bank of Australia’s (RBA) ability to implementmonetary policy. The increase in the range of issuers that the RBA willaccept for Repo’s has reduced the importance of CGS. In our view,provided the RBA is willing to use them, there is a sufficiency of private-sector paper.
The RBA differentiates between government and non-government risk inconducting open market operations. In this context we note that bank billsare only used for intra-day repurchase agreements.
Other Issues:
Changes in the perceived risk ofinvesting in a particular security.
One issue that should be considered is whether RBA trading in a particularprivate-sector security changes the perceived risk from investing in thatsecurity. Some unintended benefits may flow to the issuer/holder of thosesecurities (and unintended costs to others) as a result.
Reduced effectivenessof fiscal policy.
The global environment is characterised by very low inflation. At theextreme, there is a risk that any cyclical reduction in inflation during aneconomic downturn tips over into deflation. Monetary policy loses itseffectiveness in this scenario – witness Japan. The other arms ofeconomic policy, including fiscal policy, need to be able to respond quicklyand decisively. It is arguable that the lack of a government bond marketmay constrain the ability of fiscal policy to respond.
Impact on cost of funds toprivate sector: - a de factopermanent tightening ofmonetary policy?
An assumption running through the Discussion Paper is that eliminatingpublic debt will reduce capital costs. We believe that costs may in fact rise.The cost of executing an interest-rate swap transaction is a function of risk.Without an effective hedging tool for the swaps market, bid/ask swapspreads will be wider. Financial institutions use interest-rate swaps formanaging the interest-rate risk in their balance sheets. The inability tohedge and/or an increase in the price of hedging will reflect in higher costsfor borrowers. This increase in costs is, in some ways, equivalent to a de-facto tightening in monetary policy.
A side issue is that any increase in hedging costs could well mean thatlenders/intermediaries become less innovative, inhibiting the developmentof financial solutions available to clients.
To the extent that longer-term rates rise relative to short-term rates, theremay be a shift in favour of financing at the short end. The higher cost ofhedging could well lead to a higher proportion of issuance of floating-ratebonds. These developments would leave investors more vulnerable tochanges in interest rates. The need for more active management offinancing positions will involve some costs for businesses and maydiscourage some capex plans.

6 December 2002
Page 19
PROVIDING A SAFE HAVEN IN TIMES OF FINANCIAL VOLATILITY
Question 1: What is the importance of the CGS market in providing a safe havenduring periods of financial instability?
Response:
A safe-haven asset needs to bea low-risk, highly liquid asset.
One of the key features of financial-market operations is the retreat to “safehavens” during periods of financial-market instability.
A safe haven will have a number of key features. First, it will be low risk,and preferably credit-risk free. At times of heightened risk aversion,investors want to be in no doubt about the borrowers’ ability to repay funds.Second, it must be liquid. During periods of heightened risk aversion,investors will want to be easily able to transfer funds in and out of the safe-haven asset.
The CGS market is widelyaccepted as a safe haven.
The CGS market is widely accepted as a safe haven during periods offinancial-market instability. The Australian CGS market is replicating therole that government bond markets play in other developed financialmarkets. The Government’s ability to tax its citizens underpins the CGSmarket standing as a risk-free rate.
The other key feature of the CGS market that lies behind its safe-havenrole is its high degree of liquidity. Although the CGS market has shrunkdramatically over the past six years, the Commonwealth remains by somedistance the biggest issuer in the Australian market.
Looking at the value ofphysical bonds outstandingunderestimates the ability ofCGS to act as a risk mitigant.The derivatives market,based on CGS, also plays avery important role. Takinginto account the physicalmarket, futures and options,total trading in CGS has risenmodestly over the past fiveyears. Although trading inphysical bonds has declinedin recent years in line with thereduction of debt on issue,this has been more thanoffset by the rise in trading inbond futures.
Fig. 4:
16
21
26
31
1997-98 1998-99 1999-00 2000-01 2001-02
PHYSICAL CGS TURNOVER(% of total)
%
Question 2: (part 1) What evidence is there of the role of CGS as a safe haven?
Response: A key indicator of the importance of CGS as a safe haven is the movementin credit spreads. When the spread between credit products and CGSrises, it means that the market is demanding a higher return for higher riskproducts.
The chart on the following page shows the 5-year CGS yields comparedwith the 5-year A-rated corporate bond as calculated by CBASpectrum*.; aproxy for the average credit in the Australian corporate bond market.
*CBASpectrum is a proprietary credit model developed by the CommonwealthBank of Australia.

6 December 2002
Page 20
A compelling argument on theneed for safe havens wasprovided during the Asianfinancial crisis.
As the chart indicates, thespread widens during periodswhen the direction of CGSyields falls, and vice versa(note that on Fig. 5 yields areshown inverted). Investorsare indicating their preferencefor a liquid, risk-free rateduring periods of investor riskaversion.
Another indication of theinvestor preference for CGSin times of financial-marketstress is to examine tradingvolume of bond futurescontracts (see Fig. 6). Thereis a notable rise in the volumeof trading in bond futuresduring periods of financial-market stress.
Another compelling argumenton the need for safe havenswas provided during theAsian financial crisis of thelate 1990s. The lack of aliquid bond market saw majorcapital outflows from someAsian economies during theAsian crisis. These outflowsput exchange rates undersignificant downwardpressure and imposedsignificant adjustment costson domestic economies.
Figs 5-6:
40
50
60
70
80
90
100
110
Jan-00 Jul-00 Jan-01 Jul-01 Jan-02 Jul-02
4.0
4.5
5.0
5.5
6.0
6.5
7.0
7.5
CREDIT SPREAD & RATE DIRECTION
Spread (lhs)
Direction(inverse, rhs)
Bpts %
3
5
7
9
11
M ar-98 M ar-99 M ar-00 M ar-01 M ar-02
VOLUME OF TRADED XM1
LTCM Brazillian crisis
US equity market vo latility'
Question 3: What other possible alternative safe havens exist and how appropriateare they?
Response The CGS market ideally fits therequirements needed for asafe haven. It is both liquidand is the benchmark risk-freeasset. There is other AAA-rated debt available in thedomestic market. But this debtcontains an element of creditor other risk unique to theinstrument and/or issuer (egprepayment risk on ResidentialMortgage Backed Securities).Assets rated AAA generallyoutperform lower-rated assetsduring periods of financial-market instability. Investorsstill prefer CGS to other AAA-rated assets during periods ofheightened risk aversion. Forexample, AAA-rated corporate-bond spreads widened in the
Fig. 7:
0
15
30
45
60
Jan-99 Jan-00 Jan-01 Jan-02
AAA CORPORATE BOND SPREADS
Source: RBA
Bpts

6 December 2002
Page 21
second half of last year around September 11 (see Fig. 7).
Just as important as credit risk is the greater liquidity available in the CGSmarket. Despite the big reduction that has taken place in CGS on issue inrecent years, the Commonwealth Government remains by some distancethe biggest issuer in the domestic market (see Fig. 8). Note that the chartonly takes into account physical bonds on issue. The liquidity advantage ofthe CGS market is substantially greater once derivative turnover is takeninto account.
Of course, in the absence of aCGS market investors couldalways take the option toconvert their assets into cash.
The substitution of cash forCGS would involve areduction in returns forinvestors and the assumptionof bank-credit risk. Soeliminating the CGS marketreduces returns available onassets, and by removing therisk-free asset, increases therisk in investing in Australianassets. This alteration in therisk/return trade-off wouldmake the Australian bondmarket relatively lessattractive than offshore bondmarkets. Accordingly we
Fig. 8:
0 20 40 60
CGS
QTC
TCorp
TCV
WATC
CBA
SAFA
GE Capital
ADB
Euro fima
DSL
IBRD
Fannie M ae
AAA DOMESTIC OUTSTANDINGS(by Issuer (at least $1b outstanding))
$ bn
would expect to see an asset re-allocation towards overseas debt markets.

6 December 2002
Page 22
ATTRACTING FOREIGN CAPITAL INFLOW
The small size of our market is certainly a factor influencing internationalfund managers to either reduce the quantum of their Australian dollarholdings or seek alternative international investment markets.
Question 1: Would the absence of a CGS market affect Australia’s attractivenessto foreign investors
Response:
Those who invest on the basisof Australia’s fundamentals arelikely to stay.
Global investors are animportant component of theCGS market. The offshoreshare increased from about10% in the mid 1980s to apeak of 40% in 1998. Therehas been a small net declinesince then towards 35%.
The increase in the proportionof foreign ownership of theCGS market, however, distortsthe picture of overseasparticipation in the Australianfinancial market. Although theproportion of overseasownership is higher, there hasbeen a big decline in CGS onissue. The absolute amountof CGS owned by foreign
Fig. 9:
0
10
20
30
40
50
Mar-86 Mar-90 Mar-94 Mar-98 Mar-020
10
20
30
40
50
OFFSHORE OWNERSHIP OF CGS(% of total)% %
investors has declined. Although a portion of these funds has beendirected towards other Australian investments such as corporate bonds,overseas interest in the Australian financial market has already declined.
Those who follow global bondindices will leave.
For the group of investors that follow global government bond indices thedecision is straightforward. Eliminating the CGS market would result inAustralia having a zero weighting in global indices. These fund managerswould shift funds out of Australia.
Any reduction in perceivedliquidity would be asignificant negative.
A key attraction of the CGS market is its liquidity. Many global investorshave a large pool of funds under management. They need liquid markets inwhich to invest. A significantly diminished CGS will reduce theattractiveness of Australian capital markets to offshore investors.
As noted elsewhere in this submission, the CGS market remains by far thebiggest domestic debt market, despite the contraction over the past fewyears. It is certainly one of the most liquid in the world relative to its size(see Table 4).
A related attraction of the CGS market for overseas investors is that itprovides a safe haven. The importance of having a safe-haven asset in acountry’s portfolio was reinforced by the events surrounding the Long TermCapital Management (LTCM) crisis in 1998. By offering a liquid risk-freeasset, the risk profile of investing within Australia is reduced. The lack of asafe-haven asset might accentuate fund outflows during difficult times.
Other Issues: A factor working against the substitution of private debt for governmentdebt is that investors demand a risk premium for “names” they areunfamiliar with. While the Australian Government is clearly well known,company-specific names are a different proposition. Investors will bereluctant to transfer funds from Government paper to company paperwithout appropriate compensation.

6 December 2002
Page 23
Australian dollar debt spreads rose relative to the US in 2002. The rise wasmore a reflection of Australian economic outperformance rather than anyrise in risk premium. But a lift in the premium as the bond market windsdown would be a factor that could see credit spreads widen further.
Question 2: How important are global bond indices for foreign investment inAustralia?
Response: A significant proportion of global fund managers use global bond indices.The lower the weighting the Australian bond market has within globalindices, the lower the participation of these investors within Australianmarkets.
Other Issues: The government’s financing requirements are not contributing to Australia’scurrent account deficit. But the financing of the gap between nationalsavings and national investment that the current account deficit representsrequires accessible and acceptable investment options in which foreigninvestors can place funds. There is still a role for CGS as one of thoseinvestment options. The cost of servicing our net foreign liabilities will behigher if we have to do so entirely through higher-risk assets.
Any reduction in foreign capital inflows weakens one side of the AUDmarket and may accentuate volatility and the size of falls when the currencyis under downward pressure. Big moves in the currency, and high levels ofvolatility, can damage economic prospects.

6 December 2002
Page 24
PROMOTING AUSTRALIA AS A GLOBAL FINANCIAL CENTRE
Australia’s position as a financial centre will be influenced by:� legislated growth in superannuation finds and the investment activity
surrounding those funds;� private and public equity and debt financing required over time;� Australia’s relative attractiveness as an investment to global investors;
and� the existence of financial assets and instruments which can be traded
by investors on a short and long-term basis.
The absence of a liquid CGS market is likely to adversely impact Australia’sattractiveness as a global financial centre.
Question 1: (part 1) Does the CGS market play a significant role in promoting Australia asa global financial centre?
Response:
The CGS market is an importantcomponent of AUD activity.
There is no doubt that the CGS market plays a key role in Australia’s statusas a regional financial centre being higher than should otherwise be expectedbased on the relative size of its economy and markets.
In addition to fixed-income investors, currency investors and other marketparticipants are attracted to the AUD market by the ability to arbitrage andhedge their positions using amongst other things risk free CGS assets. Thecurrency market and bond markets enjoy a symbiotic relationship – manyglobal currency managers invest their currency positions in risk-free CGS,and global fixed-income investors must buy or sell AUD to execute their CGStrades.
It is difficult to believe that these activities will not be significantly curtailed bythe absence of a risk-free CGS curve. It should be noted that numerousinternational financial intermediaries have scaled back their Australianoperations as a direct result of the reduction in the size of the CGS market.
Australia attracts certain levels of foreign capital as a result of its inclusion ininternational indices. The demise of the CGS market would likely result inAustralia being removed from the indices. This will reduce global focus onAustralia as an investment medium as well as the level of resourcing whichinternational financial institutions devote to Australia.
The CGS market is a “core”component of Australia’sfinancial-market infrastructure.
Australian debt markets have quite a high level of foreign participation. Thisparticipation is particularly evident in the government bond market. AXISSAustralia, the government body charged with promoting Australia as a globalfinancial centre, makes much of this participation (Axiss (2000)). It arguesthat a liquid Commonwealth Government yield curve is a “core element” ofAustralia’s financial market infrastructure. It;� means that we are included in global bond indices, so global fund
managers are in a sense forced to participate in Australian markets;
� gives Australia a major competitive advantage – apart from Japan, noother Asia Pacific market is included in the indices;
� delivers synergies from being seen as part of the $-bloc; and
� offers diversification benefits – the low correlation of returns on AUD debtwith Euro-denominated debt in particular has enhanced the appeal ofAustralian markets to global fund managers looking to offset the loss ofcurrency diversification in Europe.
The composition of theAustralian market is wellbalanced.
Furthermore, Australia is one of the better-balanced markets globally. Thereis no indication that the demands the public or financial sectors are inhibitingor crowding out the borrowing demands of the corporate sector.

6 December 2002
Page 25
Table 5: Domestic Debt on Issue in Selected Countries (end 2001)
Sector Total Public Financial Corporate (USDbn) (USDbn) % total (USDbn) % total (USDbn) % total
USA 15,377 8,557 56 4,367 28 2,453 16Japan 5,847 4,440 76 714 12 693 12Europe 5,319 3,211 60 1,751 33 357 7UK 921 411 45 289 31 221 24Canada 564 396 70 97 17 71 13China 332 227 68 97 29 8 2Brazil 311 262 84 47 15 2 1Sth Korea 293 77 26 98 33 118 40Denmark 247 73 30 161 65 13 5Australia 171 63 37 62 36 46 27Sweden 159 81 51 57 36 21 13Total 29,541 17,798 60 60 26 4,003 14Source: BIS & AXISS Australia
Question 1: (part 2) Would the absence of a CGS market affect transaction costs andAustralia’s attractions as a centre for global financial services?
Response: Any loss in liquidity will affect both bid/offer spreads and the outright marginto global benchmarks. This margin represents a premium for the loss ofliquidity. The premium would result in the loss of a competitive advantagebecause Australian bid/offer spreads are currently quite narrow by regionalstandards.
Issuing costs in Australia are also relatively low. To the extent that theabsence of a government bond market boosts costs, the relativeattractiveness of Australia from a global perspective would decline.
A liquid CGS market underpinslow transaction costs.
The low transaction costs resulting from the liquid nature of the CGSmarket attracts foreign investors and more importantly intermediaries to theAustralian capital markets. Any loss in liquidity will affect both the bid/offerspreads paid and the outright margin to global benchmarks.
Financial intermediaries play a critical role in transferring and absorbingfinancial risk. Intermediaries will be active in liquid, sophisticated, low-costmarkets and it is likely that Australia’s status as a global financial centrewould be significantly diminished if intermediaries are inhibited in dealing inAustralian debt instruments.
Market infrastructure willdeteriorate.
The Discussion Paper contends with little supporting argument that “marketinfrastructure is unlikely to deteriorate significantly in the absence ofoutstanding CGS”. It should be noted, however, that market infrastructureis almost exclusively provided by the private sector. The private sector isunlikely to provide this infrastructure unless there is sufficient transactionalactivity to generate providers with an adequate return on their capitalinvested. Replacement or upgrading would depend entirely on transactionvolume expectations. At worst, significant parts of the market infrastructuremay be closed or out-sourced offshore.

6 December 2002
Page 26
APPROPRIATE SIZE OF THE COMMONWEALTH GOVERNMENT SECURITIES MARKET
The are a number of factors that need to be taken into account whendetermining the appropriate size of the government bond market. Theseinclude what level of issuance is needed to ensure that the CGS market cancontinue to act as a safe haven, to underpin a risk-free benchmark, attractcapital inflow and remain a long-term investment vehicle.
Question: The Government would appreciate views from stakeholders on theappropriate size of the CGS market in the event that the market is tobe maintained.
Offshore allocations driven byportfolio diversification.
The shift of funds by domestic managers offshore in recent years has beenpartly triggered by a desire to improve portfolio diversification. For offshoreinvestors managing to a benchmark, the reduction in the size of theGovernment debt has reduced the weighting of the Australian bond marketin global indices, and therefore the amount of funds invested in Australia tomatch the index.
A by-product of the reduction in Government bonds on issue is, therefore,reduced support for the AUD.
The reduction in CGS has(perversely) reduced support forthe AUD.
A case exists that some increase in government bonds on issue would be aplus for the AUD. By global standards, the amount of AustralianGovernment debt on issue is low. Accordingly, it is unlikely that investorswould attach a risk premium to Australian Government bonds for a rise innet issuance. Indeed the indications are that investors could comfortablyabsorb a significant rise in debt on issue.
The key question, then, is what level of debt is needed to maintain the otherkey characteristics of the CGS market, such as its use as a risk-freebenchmark and as a safe-haven investment? In short, what level ofissuance is needed to maintain an efficient CGS market?
Current levels of debt areenough to support an efficientmarket.
The current level of debt hasbeen enough to maintain anefficient market. Oneindication is the bid/offerspread for physical bonds.One would expect that lowliquidity would result in awidening in the bid/offerspread as market makersbecome more reluctant totake on risk. An examinationof the 2011 ACGB, up torecently the benchmark 10-year bond, indicates that thebid/offer has if anythingnarrowed over the pastcouple of years.
Another indication that the
Fig.10:
0.00
0.10
0.20
0.30
M ar-00 Sep-00 M ar-01 Sep-01 M ar-02 Sep-020.00
0.10
0.20
0.30
BID-OFFER SPREAD( for ACGB 2011)
Source: Bloomberg
bpts bpts
market remains efficient can be derived from the volatility of weekly yieldchanges. Intuitively volatility should be higher in illiquid and inefficientmarkets.
No notable structural risein bond volatility
A perspective on this can be obtained by examining weekly changes in thegeneric ten-year bond yield as calculated by Bloomberg (see Fig. 11)Utilising the ten-week moving average of the weekly change will provide asense of broad trends.
In mid November, bond volatility was relatively high. It was within the range

6 December 2002
Page 27
recorded over the pastdecade but it was at thehigher end of that range.Australian long-end yields aredriven by a combination ofglobal and domestic factors.The global impact can bepartially neutralised by acomparison of the spread ofvolatility of Australian and USyields. If the volatility of theAustralian market had risenrelative to the US market, thatmay reflect the developmentof a domestic liquiditypremium. There was nonotable increase in volatilityof the Australian marketrelative to the US market overthis period.
Fig. 11:
0
1
2
3
4
5
M ar-94 M ar-96 M ar-98 M ar-00 M ar-02
-2
-1
0
1
2
3
AUS-USspread
(inverse, rhs)
Vol (lhs)
10-YR YIELDS & US SPREAD VOL(average 10-week change)
As long as market participants remain comfortable with the efficiency of theCGS market, the futures market will remain liquid. This has, in turn,mitigated some of the reduced turnover in the physical CGS market.
The CGS market could still beefficient with eight benchmarklines.
What is the minimum amount of debt needed to maintain an efficient market?The key characteristic is that there will need to be enough liquid benchmarklines to define a yield curve. Clearly, the more benchmark lines available thegreater the credibility of the yield curve. At present the three- and ten-yearfutures are each underpinned by three bonds. With another two bonds in themid-part of the curve, the CGS market could remain efficient with a total ofeight benchmark stocks.
At an absolute minimum, it is possible that two bonds for each of the three-and ten-year futures could suffice. One bond, however would be too few as itwould increase the chances that the pricing of three-and ten-year futurecontracts could be driven by market factors related to a particular bond, asopposed to fundamental reassessment of movements in three- and ten-yearyields. Accordingly, with three maturities in the middle part of the curve, it ispossible that market could make do with as few as seven benchmark stocks.
The AOFM would need to be anactive participant in the market.
If there were to be a move to reduce the number of benchmark stocks, theAustralian Office of Financial Management (AOFM) would need to be evenmore active in repurchasing short-dated securities and issuing longer-datedsecurities to maintain a liquid CGS curve.
Minimum of $5bn outstandingneeded for each benchmark line.
The other key concern is the minimum amount of issuance needed tomaintain liquidity for each stock. The current level of $5bn for eachbenchmark line appears appropriate in meeting the needs of mostparticipants, and therefore maintaining an efficient market. As issuance isreduced from current levels, however, there will be a growing risk that theCGS market will become progressively less efficient. For example, asissuance declines it will become increasingly difficult to access physicalbonds to undertake repurchase agreements.
Minimum issuance needed forefficient market is $35-45bn.
We believe that an efficient market could be maintained with 7-9 benchmarklines, each containing around $5bn of issuance. Accordingly, we believe theCGS market could continue to play an important role if a minimum of $35-45bn remains on issue.

6 December 2002
Page 28
OPTIONS AVAILABLE TO THE COMMONWEALTH
Option 1: Wind down the Commonwealth Government Securities market
Question 1: What are the potential implications of winding down the CGS market?
Response:
Most of the implications ofwinding down CGS market arenegative.
The following outcomes are highly probable if the CGS market is wounddown:� a rise in risk profile of all Australian deposit taking institutions who will
not have the ability to invest a portion of their liquidity/capital in risk-freeCGS assets;
� a rise in the cost of capital in Australia given the removal of a risk-freebenchmark and additional lack of liquidity premium which investors willdemand;
� an outflow of the fixed-income portion of superannuation, life insuranceand other invested funds into offshore “risk-free” and liquid assets;
� a consequent increase in the risk profile of these funds as a result ofthe need to accept foreign exchange risk and/or counterparty risk withfinancial institutions with whom investors would transact currency hedgetransactions.
Other potential implications include:� superannuation, life insurance, and other invested funds are expatriated
to offshore management as portfolio-management discipline,economies of scale and cost dictate that the majority of funds bemanaged by the same managers as those managing the fixed-incomeand risk-free portion of the portfolios;
� run-down in domestic financial-market infrastructure such as futuresand bond markets, out flow of funds from the corporate-bond market,stock market, and commercial-property market if the majority of fundsare invested from offshore.
Question 2: What is the likely impact on the cost of capital?
Response: The implicit assumption of the Treasury Paper is that although there is achange in supply of AUD assets, there is no (or only minimal) change indemand. The New Zealand case provides an alternative illustration.
The New Zealand market isseen as relatively illiquid.
There are a number ofsimilarities between Australiaand New Zealand. BothGovernments have runBudget surpluses, resulting inlower debt (both in absoluteterms and as a proportion ofGDP). Both Australia andNew Zealand also run currentaccount deficits, and havecurrencies that historicallyhave close ties to commodity-price movements.
Such has been the decline ingovernment debt that theNew Zealand market is nowseen as relatively illiquid.Anecdotally, if offshore fundswant to take a position in the
Fig. 12:
-1.0
-0.5
0.0
0.5
1.0
1.5
2.0
M ar-94 M ar-96 M ar-98 M ar-00 M ar-02-1.0
-0.5
0.0
0.5
1.0
1.5
2.0
INFLATION DIFFERENTIALS(Aust vs NZ)
average
% %
New Zealand market it is often done via taking positions from a tender.

6 December 2002
Page 29
We examined how the markethas assessed the reduction inliquidity in New Zealandmarkets by examining theAUS/NZ 10-year spread.New Zealand core inflationhas been around 0.75pptslower, on average, thanAustralian inflation since1994. Despite New Zealandinflation being lower, theAUS/NZ spread has beentrending higher. The rise inthe spread up to around 1998reflected the drop inAustralian financial marketexpectations of inflation.Australian economic out-performance means that the
Fig. 13:
-1.5
-1.0
-0.5
0.0
0.5
1.0
1.5
Jan-96 Jan-98 Jan-00 Jan-02
AUS/NZ 10-YR SPREAD%
widening in the spread cannot be explained by growth differentials. Theonly logical explanation is that the level of the spread reflects a liquiditypremium for New Zealand bonds. Eyeballing the AUS/NZ 10-year spread(see Fig. 13) the rise in the premium looks to be worth 25-50bpts.
Question 3: (part 1) What is the most appropriate approach and timeframe to implement adecision to wind down the market, if this decision is made?
Response:
Buying back CGS will distortfixed-income markets.
The preferable method for winding down the CGS is for the government toretire outstanding CGS as they mature. This approach will give investorstime to adjust their investment strategies and identify alternative offshore or(if available) domestic investment alternatives.
Buying back outstanding CGS in a relatively short time frame will distortfixed-income markets. This distortion will have a fiscal cost to thegovernment as they will have to pay a premium to prise loose CGSholdings from investors not wishing to sell them.
It should be noted that the government cannot be assured that investorswill sell CGS (no matter what price is bid) as some CGS are held to matchlong-term liabilities – and suitable replacement assets may prove difficult tofind.
Question 3: (part 2) What are the likely re-entry costs (in the form of additional borrowingcosts) if the Commonwealth withdraws from the market?
Response: It is difficult to quantify the additional borrowing costs incurred should theCommonwealth close down the CGS market but then at some future timedecide to access the bond market. Factors determining the cost include:
� the length of time between the closure of the market and its re-establishment;
� the cost of re-establishing appropriate bureaucratic supervision andoperational infrastructure to manage the program;
� whether or not associated market infrastructure such as the futuresmarkets, settlement systems, and market intermediaries still exist; and
� the size and ongoing nature of the new borrowing requirement.
Setting aside these aspects, any new program will attract a liquiditypremium until the outstandings and ongoing issuing intentions of thegovernment are viewed by the market as providing optimum liquidity. Wedo not have strong views as to what the cost of shutting and re-opening theCGS market would be. We note that the Discussion Paper suggests that

6 December 2002
Page 30
the costs could be up to 30bpts per annum.
In our view, the direct cost of shutting and re-opening the CGS market is asecondary issue. The main issue, though, revolves around the externalitiesinvolved with eliminating the liquid, benchmark, risk-free rate from thedomestic financial markets. We believe that the elimination of the CGSmarket will result in a riskier, less liquid domestic financial market, oneresult of which will be a rise in the cost of capital.

6 December 2002
Page 31
Option 2: Consolidate Commonwealth and State government debt
One suggestion to help boost liquidity in the CGS market is to merge theCommonwealth and Semi-government bond markets. A benefit of thisOption is that it would potentially reduce the cost of capital for Stategovernments.
Question 1: (part 1) Is there merit in reconsidering the idea of consolidating Commonwealth,State and Territory government debt into one market; and
Response: Some discussion regarding the merger of the State and CommonwealthGovernment bond markets took place in 2001. At face value, such a planappeared to have some merit. For the States, it would most likely reducetheir borrowing costs. The extent of the reduction would vary dependingon a range of factors such as the credit rating of each State. In theDiscussion Paper, Treasury estimates that the reduction in State borrowingcosts could be worth up to $150mn if borrowing costs fall to the currentCommonwealth Government level.
The Commonwealth’s superior taxing powers mean that rating agencieswould view there being a lower risk of Commonwealth Government defaultthan any particular State default. State governments would thereforeprobably benefit if they were able to borrow using the Commonwealth’sname.
Merging Commonwealth andState bond markets would boostliquidity.
Merging the Commonwealth and State bond markets would boost the size,and therefore liquidity, of the overall market. Among other benefits, a moreliquid bond market could help attract foreign capital inflow. For example,boosting the size of the sovereign bond market will lead to a higherweighting in global-bond indices. Fund managers that follow these indices,particularly passive index managers, will need to increase their weighting tothe Australian market, with flow-on effects to the currency.
Commonwealth and Stategovernments decided not toproceed down this path in 2001
The concept of the Commonwealth borrowing on behalf of the States is not new.Indeed it was standard practice up to the late 1980s. The Commonwealth, asthe borrowing authority, raised the funds and then passed them on to the States.
However we note that the Commonwealth and State governments decidednot to proceed down this path in August 2001 as noted in Appendix 5 ofthe Discussion Paper
Question 1: (part 2) Does this option assist with the transition to reducing the supply ofGovernment debt?
Response: The key issue is that there is currently no effective alternative withindomestic financial markets to CGS in providing a liquid, risk-freebenchmark. It is possible that other benchmarks will develop over time.So, the longer that the CGS market can be maintained, the greater thechance that alternative benchmarks will emerge.
Nonetheless, consolidating the Commonwealth and State government bondmarkets is not our preferred option. It may increase the liquidity ofgovernment bond markets and reduce the cost of borrowing of Stategovernments. But we believe that it would be complex to administer.

6 December 2002
Page 32
Option 3: Maintain the Commonwealth Government Securities market and fundthe Commonwealth’s unfunded superannuation liabilities
This option considers only one use for surplus funds. Funding theCommonwealth’s unfunded superannuation liabilities is one potential use ofexcess funds worth examining. But we believe that there are other optionswarranting consideration. A review of these alternatives centres on definingthe role of government and the contribution of debt in fulfilling that role.
Governments have a role to play because of weaknesses in the marketsystem. Keynes perhaps best summed it up as “the important thing forgovernment is not to do the things which individuals are doingalready…..but to do those things which at present are not done at all”.
Costs of eliminating theremaining debt are likelyto offset the benefits.
In this context we believe that the economic costs of eliminating theremaining debt are likely to offset the benefits. And that debt eliminationarguably sits at odds with the broader role of government.
The potential costs of eliminating the CGS market include:� The loss of an important economic safety-valve;� The loss of an important economic policy instrument;
We should also consider the “nation building” role governments areexpected to fill.
The loss of an important economic safety-valve
Role of the CGS market. The CGS market as we know it had its beginnings in the swing intosustained Budget deficits in the 1970s. This swing was evident in mostcountries. Budget deficits were the norm for much of the twenty years thatfollowed. To state the obvious, the CGS market exists to cover anyshortfall between government revenue and government spending.
Accommodating cyclicalfunding needs.
This shortfall can occur courtesy of (transitory) cyclical influences and(longer-lasting) structural changes. The absence of a bond market wouldmake it difficult if not impossible to accommodate these structural andcyclical influences. At the very least, there would be significant costsassociated with resuscitating the bond market if and when required.
The business cycle is not dead. The business cycle is not dead. There will be periods of below-trendgrowth. And there is a range of issues looming on the horizon that couldhave some far-reaching implications for structural budget positions.
Forecasting Budget aggregatesis difficult – errors are common.
Forecasting the Budgetaggregates is difficult. Thedeficit/surplus is no morethan the difference betweentwo big numbers – spendingand revenue. Smalldivergences in either have amagnified impact on theoverall balance. A 0.1pptundershoot in revenues anda 0.1ppt overrun inexpenditures would, forexample, produce adeterioration in the Budgetbottom line of $330mn.
A comparison of actualBudget outcomes with thoseexpected at Budget time (see
Fig 15:
BUDGET BALANCE(outcome vs forecast)
-2
-1
0
1
2
1978/79 1983/84 1988/89 1993/94 1998/99-2
-1
0
1
2% ofGDP
% ofGDP
B udget o utco me wo rse than expected
B udget o utco me better than expected
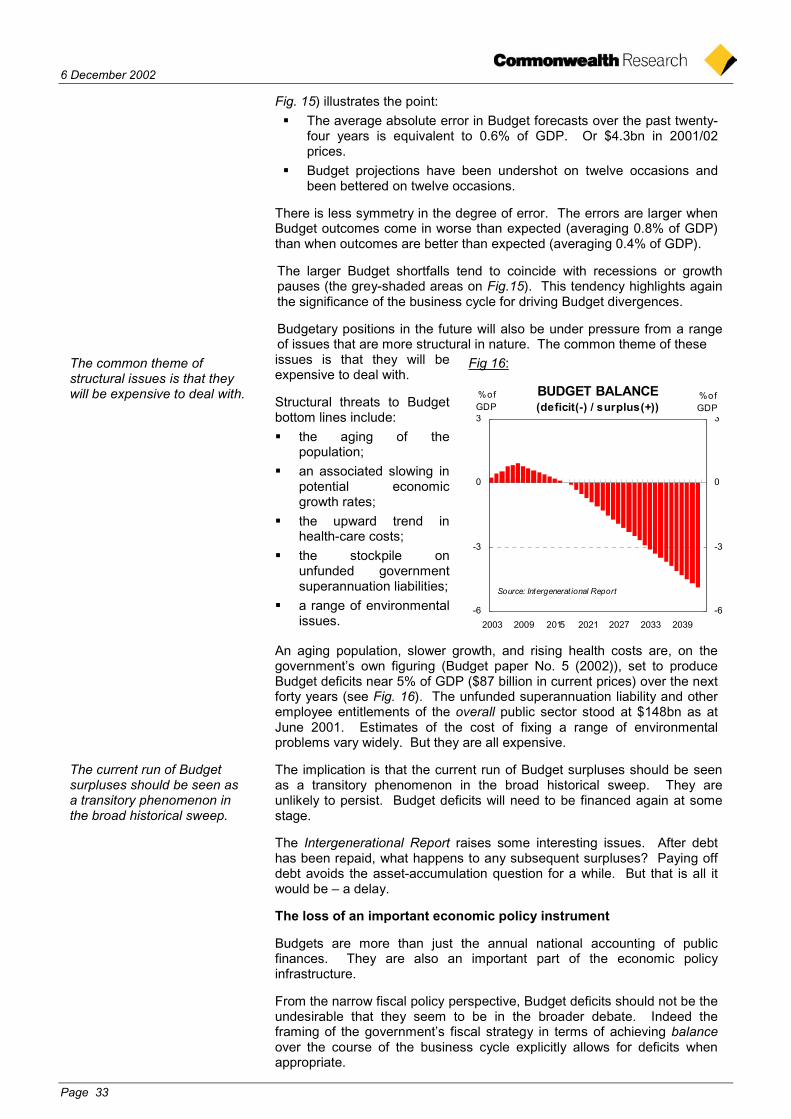
6 December 2002
Page 33
Fig. 15) illustrates the point:� The average absolute error in Budget forecasts over the past twenty-
four years is equivalent to 0.6% of GDP. Or $4.3bn in 2001/02prices.
� Budget projections have been undershot on twelve occasions andbeen bettered on twelve occasions.
There is less symmetry in the degree of error. The errors are larger whenBudget outcomes come in worse than expected (averaging 0.8% of GDP)than when outcomes are better than expected (averaging 0.4% of GDP).
The larger Budget shortfalls tend to coincide with recessions or growthpauses (the grey-shaded areas on Fig.15). This tendency highlights againthe significance of the business cycle for driving Budget divergences.
Budgetary positions in the future will also be under pressure from a rangeof issues that are more structural in nature. The common theme of these
The common theme ofstructural issues is that theywill be expensive to deal with.
issues is that they will beexpensive to deal with.
Structural threats to Budgetbottom lines include:� the aging of the
population;� an associated slowing in
potential economicgrowth rates;
� the upward trend inhealth-care costs;
� the stockpile onunfunded governmentsuperannuation liabilities;
� a range of environmentalissues.
Fig 16:
BUDGET BALANCE (deficit(-) / surplus(+))
-6
-3
0
3
2003 2009 2015 2021 2027 2033 2039-6
-3
0
3
% ofGDP
% ofGDP
Source: Intergenerational Report
An aging population, slower growth, and rising health costs are, on thegovernment’s own figuring (Budget paper No. 5 (2002)), set to produceBudget deficits near 5% of GDP ($87 billion in current prices) over the nextforty years (see Fig. 16). The unfunded superannuation liability and otheremployee entitlements of the overall public sector stood at $148bn as atJune 2001. Estimates of the cost of fixing a range of environmentalproblems vary widely. But they are all expensive.
The current run of Budgetsurpluses should be seen asa transitory phenomenon inthe broad historical sweep.
The implication is that the current run of Budget surpluses should be seenas a transitory phenomenon in the broad historical sweep. They areunlikely to persist. Budget deficits will need to be financed again at somestage.
The Intergenerational Report raises some interesting issues. After debthas been repaid, what happens to any subsequent surpluses? Paying offdebt avoids the asset-accumulation question for a while. But that is all itwould be – a delay.
The loss of an important economic policy instrument
Budgets are more than just the annual national accounting of publicfinances. They are also an important part of the economic policyinfrastructure.
From the narrow fiscal policy perspective, Budget deficits should not be theundesirable that they seem to be in the broader debate. Indeed theframing of the government’s fiscal strategy in terms of achieving balanceover the course of the business cycle explicitly allows for deficits whenappropriate.
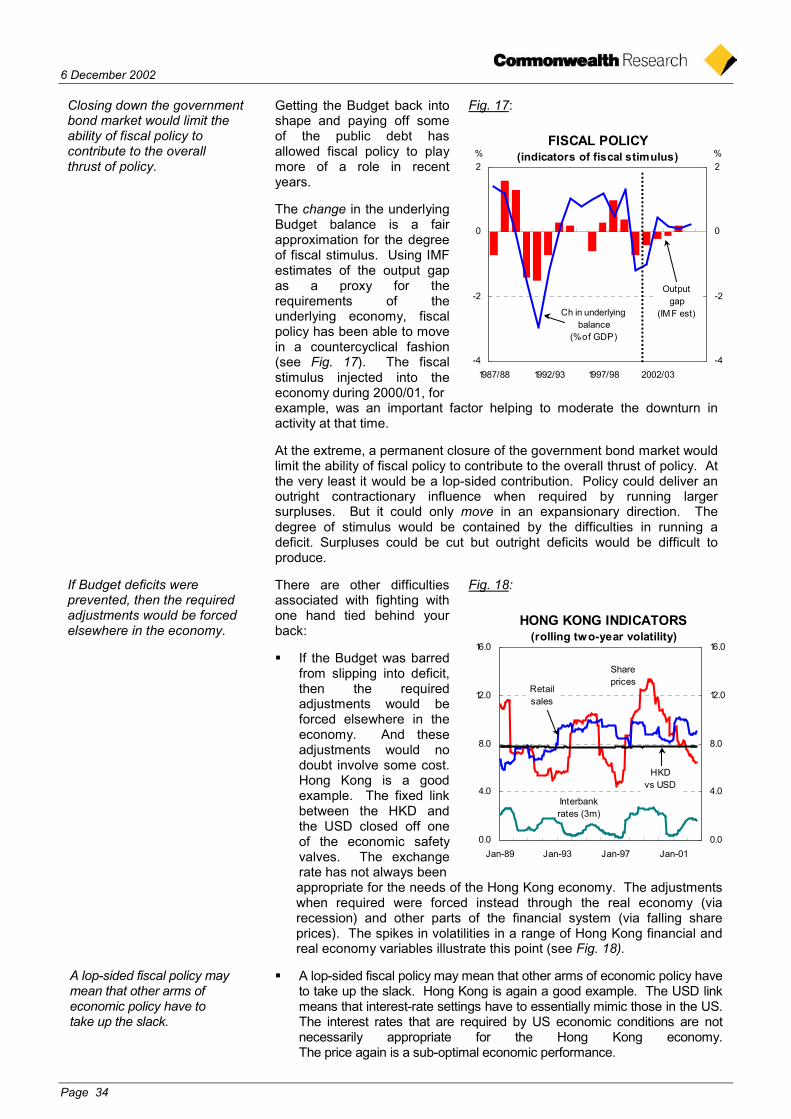
6 December 2002
Page 34
Closing down the governmentbond market would limit theability of fiscal policy tocontribute to the overallthrust of policy.
Getting the Budget back intoshape and paying off someof the public debt hasallowed fiscal policy to playmore of a role in recentyears.
The change in the underlyingBudget balance is a fairapproximation for the degreeof fiscal stimulus. Using IMFestimates of the output gapas a proxy for therequirements of theunderlying economy, fiscalpolicy has been able to movein a countercyclical fashion(see Fig. 17). The fiscalstimulus injected into theeconomy during 2000/01, for
Fig. 17:
FISCAL POLICY(indicators of fiscal stimulus)
-4
-2
0
2
1987/88 1992/93 1997/98 2002/03-4
-2
0
2
Output gap
(IMF est)Ch in underlying balance
(% of GDP)
% %
example, was an important factor helping to moderate the downturn inactivity at that time.
At the extreme, a permanent closure of the government bond market wouldlimit the ability of fiscal policy to contribute to the overall thrust of policy. Atthe very least it would be a lop-sided contribution. Policy could deliver anoutright contractionary influence when required by running largersurpluses. But it could only move in an expansionary direction. Thedegree of stimulus would be contained by the difficulties in running adeficit. Surpluses could be cut but outright deficits would be difficult toproduce.
If Budget deficits wereprevented, then the requiredadjustments would be forcedelsewhere in the economy.
There are other difficultiesassociated with fighting withone hand tied behind yourback:
� If the Budget was barredfrom slipping into deficit,then the requiredadjustments would beforced elsewhere in theeconomy. And theseadjustments would nodoubt involve some cost.Hong Kong is a goodexample. The fixed linkbetween the HKD andthe USD closed off oneof the economic safetyvalves. The exchangerate has not always been
Fig. 18:
HONG KONG INDICATORS(rolling two-year volatility)
0.0
4.0
8.0
12.0
16.0
Jan-89 Jan-93 Jan-97 Jan-010.0
4.0
8.0
12.0
16.0
Share prices
Interbankrates (3m)
Retailsales
HKDvs USD
appropriate for the needs of the Hong Kong economy. The adjustmentswhen required were forced instead through the real economy (viarecession) and other parts of the financial system (via falling shareprices). The spikes in volatilities in a range of Hong Kong financial andreal economy variables illustrate this point (see Fig. 18).
A lop-sided fiscal policy maymean that other arms ofeconomic policy have totake up the slack.
� A lop-sided fiscal policy may mean that other arms of economic policy haveto take up the slack. Hong Kong is again a good example. The USD linkmeans that interest-rate settings have to essentially mimic those in the US.The interest rates that are required by US economic conditions are notnecessarily appropriate for the Hong Kong economy.The price again is a sub-optimal economic performance.
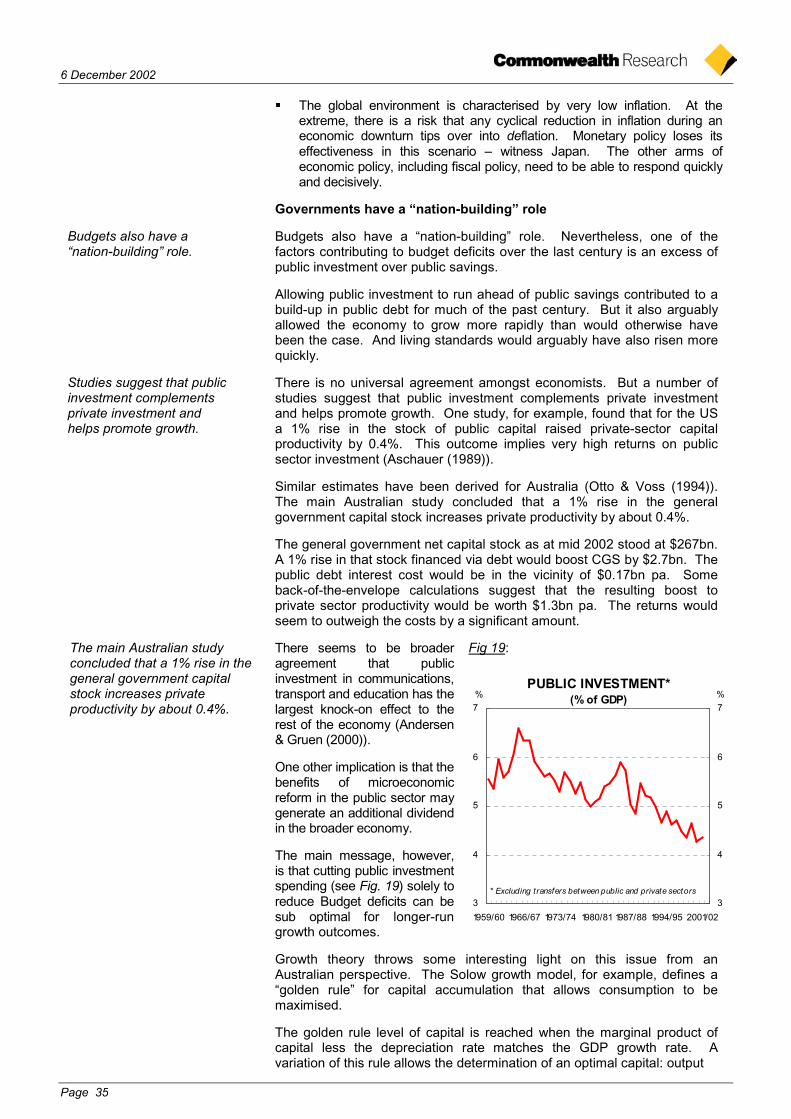
6 December 2002
Page 35
� The global environment is characterised by very low inflation. At theextreme, there is a risk that any cyclical reduction in inflation during aneconomic downturn tips over into deflation. Monetary policy loses itseffectiveness in this scenario – witness Japan. The other arms ofeconomic policy, including fiscal policy, need to be able to respond quicklyand decisively.
Governments have a “nation-building” role
Budgets also have a“nation-building” role.
Budgets also have a “nation-building” role. Nevertheless, one of thefactors contributing to budget deficits over the last century is an excess ofpublic investment over public savings.
Allowing public investment to run ahead of public savings contributed to abuild-up in public debt for much of the past century. But it also arguablyallowed the economy to grow more rapidly than would otherwise havebeen the case. And living standards would arguably have also risen morequickly.
Studies suggest that publicinvestment complementsprivate investment andhelps promote growth.
There is no universal agreement amongst economists. But a number ofstudies suggest that public investment complements private investmentand helps promote growth. One study, for example, found that for the USa 1% rise in the stock of public capital raised private-sector capitalproductivity by 0.4%. This outcome implies very high returns on publicsector investment (Aschauer (1989)).
Similar estimates have been derived for Australia (Otto & Voss (1994)).The main Australian study concluded that a 1% rise in the generalgovernment capital stock increases private productivity by about 0.4%.
The general government net capital stock as at mid 2002 stood at $267bn.A 1% rise in that stock financed via debt would boost CGS by $2.7bn. Thepublic debt interest cost would be in the vicinity of $0.17bn pa. Someback-of-the-envelope calculations suggest that the resulting boost toprivate sector productivity would be worth $1.3bn pa. The returns wouldseem to outweigh the costs by a significant amount.
The main Australian studyconcluded that a 1% rise in thegeneral government capitalstock increases privateproductivity by about 0.4%.
There seems to be broaderagreement that publicinvestment in communications,transport and education has thelargest knock-on effect to therest of the economy (Andersen& Gruen (2000)).
One other implication is that thebenefits of microeconomicreform in the public sector maygenerate an additional dividendin the broader economy.
The main message, however,is that cutting public investmentspending (see Fig. 19) solely toreduce Budget deficits can besub optimal for longer-rungrowth outcomes.
Fig 19:
PUBLIC INVESTMENT*(% of GDP)
3
4
5
6
7
1959/60 1966/67 1973/74 1980/81 1987/88 1994/95 2001/023
4
5
6
7% %
* Excluding transfers between public and private sectors
Growth theory throws some interesting light on this issue from anAustralian perspective. The Solow growth model, for example, defines a“golden rule” for capital accumulation that allows consumption to bemaximised.
The golden rule level of capital is reached when the marginal product ofcapital less the depreciation rate matches the GDP growth rate. Avariation of this rule allows the determination of an optimal capital: output

6 December 2002
Page 36
The “golden rule”. ratio (Browne & Hellerstein(1997)). The optimaloutcome for Australia wouldappear to be a ratio around4.3 (see Fig. 20. Under thismodel the actual ratio atpresent is 2.8. Theimplication is that the capitalstock is short of optimallevels. Similar results areevident from US calculations.
These calculations throw thedownward trend in publiccapex evident in manycountries into sharp relief. Itis an open issue whether thistrend has been pushed toofar in the name of balancingthe government’s books.
Fig 20:
CAPEX & THE GOLDEN RULE(10-yr rolling averages)
-2
0
2
4
6
1969/70 1975/76 1981/82 1987/88 1993/94 1999/00-2
0
2
4
6
Actual K:O ratio
"Golden Rule"K:O ratio
Shortfall
Many of the benefits of publicinvestment accrue over longertime periods and should befunded accordingly.
A related issue follows as to how public investment spending should befinanced. A reasonable case can be made on intergenerational equitygrounds that the community should meet the costs of government spendingover the period that the benefits accrue.
So public consumption (current spending) should theoretically be financedout of taxation. But many of the benefits (direct and indirect) of publicinvestment accrue over longer time periods. Nobody expects privateinvestment to be financed out of current incomes. And there doesn’t seemto be any reason why public capital spending should be either.
If public investment is to be financed via borrowing, then the governmentbond market is almost certainly the cheapest and easiest way to do it.
Another related issue follows from concerns that rising government debt“Crowding out/crowding in”is really an argumentabout extremes.
puts upward pressure on realinterest rates and so “crowdsout” private investment.
So reductions in governmentdebt could stimulate anincrease in private investment.And there is certainly someevidence in recent trends tosupport this contention. Thereduction in US net publicsector borrowing during the1990s, for example, wasassociated with a decline inlong-term interest rates and ashift towards sizeable netborrowing by the private sector(see Fig. 21). This borrowingfuelled a significant rise in USbusiness investment spending.
Fig. 21:
-10
0
10
20
1985 1987 1989 1991 1993 1995 1997 1999 20015.0
8.3
11.7
15.0% %
Privatenet lending (lhs)
Publicnet lending
(lhs)
Business investment
(rhs)
US NET LENDING & "CROWDING IN"(% of GDP)
But “crowding out/crowding in” is really an argument about extremes. Veryhigh levels of public debt no doubt lead to sub-optimal levels of privateinvestment. By extension, very low levels of public debt may lead to over-investment by the private sector that is just as damaging.
The rise in US business investment during the 1990s, for example, containedmany of the elements of a speculative bubble (see Fig. 21). The deflation ofthat bubble has imposed significant costs on the US economy.

6 December 2002
Page 37
Very low levels of public debtmay lead to over-investmentby the private sector and aconsequent painful correction.
A simple scatter diagram ofpotential growth rates versusgeneral government net debt(see Fig. 22) also providessome tentative evidence thatthere is an optimal level ofdebt that maximises growth.
Shrinking bond suppliesbeyond a certain minimumpoint would see bond yieldsincreasingly diverge from theunderlying fundamentals. Tothe extent that bond yieldsinfluence hurdle rates ofreturn, the whole capexdecision-making processcould be distorted.
Fig. 22:
GROWTH AND NET DEBT
1.5
2.0
2.5
3.0
3.5
4.0
-100 -50 0 50 100 150Gen gov net debt (% o f GDP )
Source: OECD
Even if the Government decides not to make any changes to current fiscalarrangements, we believe that many of the concerns raised in the
The Government already runs asignificant asset portfolio: theRBA-managed foreign reserveportfolio.
Discussion Paper areoverstated. The governmentalready holds a significantasset portfolio and has takenon aspects of the fund-manager role. The RBA, forexample, manages foreignexchange reserves (largelyinvested in foreigngovernment securities) worthUSD20bn. And it hasmanaged them quitesuccessfully. Those RBAholdings, as a share of GDP,are relatively small on a globalscale.
Concerns about insulatinginvestment decisions fromdirect government control arein our view also overstated. Ifthe Government set up astatutory fund with atransparent reporting
Fig. 23:
F X R E S E R V E S( % o f G D P )
0 2 5 5 0 7 5 10 0
U S A
U K
G e rm a n y
F ra n c e
It a ly
Ire la n d
C a n a d a
N e t h
A u s t ra l ia
B e lg
S p a in
N o r w a y
F in la n d
A u s t r ia
S w e d e n
J a p a n
N Z
D e n m a rk
S w it z
T h a i la n d
M a la ys ia
H K
S in g a p o re
process, this would preserve autonomy and independence. A number ofstatutory authorities, such as APRA and the RBA, operate successfully atarms length from the government.
Other regions are able to run anasset portfolio withoutgovernance issues.
As set out in the Discussion Paper, other regions are able to overcomegovernance issues associated with running an asset fund. Queensland, forexample, has run a net asset position for some time. Countries such asNorway, Hong Kong, Singapore and Ireland also run asset funds withminimal governance concerns.
Questions as to the composition of the asset portfolio come down to theinvestment aim of the investor. What risk/return characteristics an investorwould look to from an asset portfolio depends upon the risk appetite of theinvestor. The Social Security and Trust funds run by the US Treasury, forexample, are only mandated to purchase debt securities with USGovernment guarantees.
Most of the benefit to be gained from reducing Government debt hasalready been made. The differential in the AUS/US spread now largelyreflects cyclical differences in the relative performance of the US and

6 December 2002
Page 38
Australian economies, although there is a premium for the greater liquidityof the US bond market. Rating agencies have also indicated that areduction in debt will not lead to any improvement in Australia'’ credit rating.S&P’, for example, noted that the current level of government debt is not anissue for the level of credit rating.

6 December 2002
Page 39
Glossary of terms
ABS Australian Bureau of Statistics
AFMA Australian Financial Markets Association
AOFM Australian Office of Financial Management
APRA Australian Prudential Regulation Authority
AUD Australian dollar
Axiss Axiss Australia
bpts basis points
CBA Commonwealth Bank of Australia
CBASpectrum A proprietary credit model developed by the Commonwealth Bank ofAustralia
CGS Commonwealth government securities
Discussion Paper Commonwealth Treasury Discussion Paper on the Review of theCommonwealth Government Securities Market
EFP Exchange for physical
EUR Euro
FUM funds under management
HKD Hong Kong dollar
IMF International Monetary Fund
LTCM Long Term Capital Management
QTC Queensland Treasury Corporation
RBA Reserve Bank of Australia
Repo’s Repurchase Agreements
RTGS Real Time Gross Settlement System
S&P Standard and Poors
Semi’s Semi-government bonds
SFE Sydney Futures Exchange
Supra’s Supranational bonds
Treasuries US government Treasury bonds
USD US dollar

6 December 2002
Page 40
Bibliography
A. Bomfim “Optimal Portfolio Allocation in a World Without TreasurySecurities”. FRB Finance and Economics Discussion Series 2001-11.
ABS (cat no 5655.0) Managed Funds, June 2002.
Axiss Australia “The Australian Debt Securities Markets” 2000
Budget Paper No. 5 Intergenerational Report 2002-03.
D. Aschauer “Is Public Expenditure Productive?” in Journal of MonetaryEconomics 23(2). 1989
G. Otto & G. Voss “Public Capital and Private Sector Productivity” inEconomic Record 70(208). 1994
P. Andersen & D. Gruen “Australian Macroeconomic Performance andPolicies in the 1980s” in RBA Conference Volume The Australian Economyin the 1990s. 2000
L. Browne & R. Hellerstein “Are We Investing too Little?” in FRB NewEngland Economic Review Nov/Dec. 1997

6 December 2002
Page 41