review of the basin plan water recovery scenarios for the … · iv under the 2750 gl water...
TRANSCRIPT

Review of the Basin Plan Water Recovery Scenarios for the Lower Lakes, South Australia:
Hydrological and Ecological Consequences
Dr Theresa M. Heneker and Jason S. Higham
March 2012
DENR Technical Report 2012

This publication may be cited as:
Heneker T.M. and Higham J.S., 2012. Review of the Basin Plan Water Recovery Scenarios for the Lower Lakes, South Australia:
Hydrological and Ecological Consequences. South Australian Department for Environment and Natural Resources, Adelaide.
Department of Environment and Natural Resources
GPO Box 1047
Adelaide SA 5001
http://www.environment.sa.gov.au
© Department of Environment and Natural Resources. Apart from fair dealings and other uses permitted by the Copyright Act 1968 (Cth), no part of this publication may be reproduced, published, communicated, transmitted, modified or commercialised without the prior written permission of the Department of Environment and Natural Resources.
Disclaimer
While reasonable efforts have been made to ensure the contents of this publication are factually correct, the Department of Environment and Natural Resources makes no representations and accepts no responsibility for the accuracy, completeness or fitness for any particular purpose of the contents, and shall not be liable for any loss or damage that may be occasioned directly or indirectly through the use of or reliance on the contents of this publication. Reference to any company, product or service in this publication should not be taken as a Departmental endorsement of the company, product or service.
i
Acknowledgements
Invaluable contributions were provided by the Murray-Darling Basin Authority in the form of data and briefings.
Members of the South Australian scientific community, the Goyder Institute for Water Research as well as a number of experts within the South Australian Government have provided feedback on draft material and presentations from analysis and report drafts. This feedback has greatly improved the presentation and interpretation contained within the report.
Much of our understanding of this internationally recognised wetland has come from scientists at Flinders University, The University of Adelaide, CSIRO, SARDI Aquatic Sciences, the CLLAMMecology Research Cluster, the Department for Water and the Department of Environment and Natural Resources.
The authors wish to thank Mr Ian Webster for providing an external review of the draft report and the departmental staff who provided internal reviews and comment. These reviews assisted with improving the final report.

ii
Foreword
The Coorong, Lakes Alexandrina and Albert wetland is one of Australia's most important wetlands, having been designated a Wetland of International Importance under the Ramsar Convention on Wetlands in 1985.
In addition to the conservation and environmental importance of the site, the well-being of the Ngarrindjeri people is linked to its health with nationally important middens, burial sites and other sacred places which provide evidence of Ngarrindjeri occupation over many thousands of years.
Years of drought and over-use of water resulted in these significant wetlands being severely affected: the lakes disconnected from the Coorong; communities and industries were put under significant stress and native species risked being lost forever.
The extremes of climate and rainfall, and the history of drought in our nation, are well known. While the extent of the problems facing the Coorong, Lower Lakes and Murray Mouth region (CLLMM) may have only become obvious relatively recently, ecological degradation has been taking place for decades.
Everyone should be concerned with the state of the Murray-Darling Basin – and the Coorong and Lower Lakes in particular.
Over-allocation of water across the entire Murray-Darling Basin has played a significant part in the degradation of the CLLMM. Because the issue is so contested South Australia believes the development of a Murray-Darling Basin Plan must be based on sound science.
To this end, the South Australian Government has undertaken its own scientific analysis of the implications for the Coorong, Lower Lakes and Murray Mouth of the Murray-Darling Basin Authority’s proposed 2750 GL water recovery target. This analysis will be used to inform the South Australian Government’s response to the draft Basin Plan.
The Australian and State Governments have together already allocated more than $186 million in funding to support the projects and actions outlined in the State Government’s Long-Term Plan for the Coorong, Lower Lakes and Murray Mouth. For the Long-Term Plan to be effective, the need to secure adequate environmental flows through a Basin Plan is vital.
A healthy Coorong, Lower Lakes and Murray Mouth region will depend on everyone accepting responsibility for its future. This document has been written to allow the draft Basin Plan to be assessed as to whether it will protect the essential attributes of this internationally important wetlands.
Allan Holmes
Chief Executive,
Department of Environment and Natural Resources

iii
Executive Summary
This report was prepared to support the South Australian Government's response to the Proposed Basin Plan.
The Proposed Basin Plan was released for public consultation by the Murray-Darling Basin Authority (MDBA) in November 2011 and included an environmental water recovery target of 2750 GL. Considerable hydrological modelling was undertaken by the MDBA to support the proposed recovery volume and demonstrate potential outcomes. Sensitivity analyses, which varied water availability for environmental use (2400 and 3200 GL), were also undertaken to gauge the capacity to meet environmental outcomes.
Water recovery under the Proposed Basin Plan will provide for an increase in environmental flows throughout the Basin, including to the Coorong, Lower Lakes and Murray Mouth (CLLMM) site. This report provides an assessment of the implications of the potential changes to the Lower Lakes that may result from the MDBA’s modelled environmental water recovery and delivery. The report also considers the effect of the modelling approach and assumptions on the results, and the ability to implement the modelled flow regime.
Modelling Approach
The modelling approach used by the MDBA is considered sound, and the outcomes indicative of what could be achieved through the delivery of the proposed volumes. However, it would be extremely difficult to ‘operationalise’ the approach to achieve the modelled outcomes in practice.
The actual delivery of water to achieve environmental benefits will depend on how the Commonwealth Environmental Water Holder manage and prioritise the water recovered, as well as the ability to forecast natural events and enhance these using regulated releases.
The modelling has made a series of assumptions regarding policy constraints including the degree of protection for unregulated flows from re-regulation and supplementary access. If such constraints remain unaddressed, some of the modelled outcomes may not be achievable.
The results represent one possible option for water delivery of the proposed volume, and should not be used as an absolute representation of “what will happen”.
Assessment of Modelled Outcomes for the Lower Lakes
Water level, barrage outflow and salinity are critical parameters in the assessment of effects on the Lower Lakes.
The critical assumptions linked to the representation of these parameters are the lake operating strategy and the ability to model the volume and salinity of lake inflow. The analyses demonstrate that the modelling results are sensitive to these assumptions, highlighting a danger in placing too much emphasis on absolute values. Understanding the sensitivity of the results allowed the identification of periods where the site is likely to be at risk under each water recovery scenario.
iv
Under the 2750 GL water recovery scenario:
There is the potential to provide benefits for the Lower Lakes. However, those benefits depend on the assumptions underpinning the modelling.
The additional flow provided to the site should reduce the risk of extremely low water levels and high salinity levels.
Not all of the South Australian defined EWRs for Lake Alexandrina salinity are met. The site remains at risk from elevated salinity levels during dry periods with the potential to exceed 1500 EC in Lake Alexandrina and to reach 1500 to 2000 EC in Lake Albert. This will adversely impact on the lifecycles of aquatic plants and animals in Lake Alexandrina and Lake Albert.
The MDBA’s salt export target of two million tonnes per year as a 10 year rolling average is not met, particularly during dry periods.
The risk of water levels falling below the threshold value of 0.0m AHD, which indicates increased risk of acidification, is reduced despite the likely over estimation of water levels during dry periods.
The number and duration of periods with no barrage outflow is reduced, which improves connectivity between the Lower Lakes and the Coorong.
It is recommended that flow, lake level, and salinity targets be included in the Proposed Basin Plan as these will be crucial to ensure that the CLLMM region remains a healthy and resilient Wetland of International Importance.
In comparison to 2750 GL, the analysis of the 2400 GL water recovery scenario showed an increased risk to the Lower Lakes during dry periods in terms of falling below 0.0m AHD, reaching elevated salinity levels in Lake Alexandrina and Lake Albert, reduced salt export, and an increased frequency and duration of periods with no barrage outflow.
The 3200 GL water recovery scenario shows that an increase in recovered environmental water would likely provide improved security for the Lower Lakes. The improvement is demonstrated by maintaining minimum water levels above 0.0m AHD, reducing the likelihood of elevated salinities in Lake Alexandrina and Lake Albert, and enhancing hydrological connection between the Lower Lakes and the Coorong.
For the 2750 GL water recovery scenario, there will likely be periods (up to 2% of the modelled period) when salinity levels are above thresholds. The provision of additional flow under the 3200 GL water recovery scenario has the potential to prevent elevated salinities and benefit the lifecycle of the plants and animals.

v
Table of Contents
ACKNOWLEDGEMENTS ....................................................................................................................I
FOREWORD II
EXECUTIVE SUMMARY....................................................................................................................III
1. INTRODUCTION .......................................................................................................................1
1.1 BACKGROUND ................................................................................................................................... 1 1.2 OBJECTIVES AND METHODOLOGY ................................................................................................. 1
2. INITIAL EVALUATION OF HYDROLOGICAL MODELLING AND WATER RECOVERY SCENARIOS .............................................................................................................................4
2.1 HYDROLOGICAL MODELLING........................................................................................................... 4 2.2 OVERVIEW OF WATER RECOVERY SCENARIOS........................................................................... 4
2.2.1 Without Development Conditions ........................................................................................... 5 2.2.2 Baseline Conditions ............................................................................................................... 5 2.2.3 Water Recovery Scenarios..................................................................................................... 5
2.3 EVALUATION OF BASELINE CONDITIONS....................................................................................... 6 2.4 COMPARISON OF 2800 GL AND 2750 GL WATER RECOVERY SCENARIOS................................ 7
3. ASSESSMENT METHOD FOR WATER RECOVERY SCENARIOS........................................8
3.1 HYDROLOGICAL ASSESSMENT ....................................................................................................... 8 3.2 ENVIRONMENTAL WATER REQUIREMENTS................................................................................... 8
3.2.1 South Australian Government EWRs ..................................................................................... 8 3.2.2 MDBA EWRs.......................................................................................................................... 9
3.3 ECOLOGICAL ANALYSIS ................................................................................................................. 10 3.3.1 Vegetation ............................................................................................................................ 11 3.3.2 Macroinvertebrates .............................................................................................................. 11 3.3.3 Fish ...................................................................................................................................... 12 3.3.4 Assessment Metrics ............................................................................................................. 12
4. ANALYSIS OF BASELINE CONDITIONS WITH 2750 GL WATER RECOVERY ..................13
4.1 ANALYSIS OF FLOW REGIME ......................................................................................................... 13 4.2 ANALYSIS OF WATER LEVEL VARIATION ..................................................................................... 21 4.3 ANALYSIS OF SALINITY................................................................................................................... 26
4.3.1 Lake Alexandrina ................................................................................................................. 26 4.3.2 Lake Albert ........................................................................................................................... 32 4.3.3 Salt Export............................................................................................................................ 37
4.4 SOUTH AUSTRALIAN EWRS ........................................................................................................... 39 4.4.1 Discussion............................................................................................................................ 39
4.5 MDBA EWRS ..................................................................................................................................... 43
5. SENSITIVITY ANALYSIS - 2400 GL AND 3200 GL WATER RECOVERY ............................45
5.1 ANALYSIS OF FLOW REGIME ......................................................................................................... 45 5.2 ANALYSIS OF WATER LEVEL VARIATION ..................................................................................... 52 5.3 ANALYSIS OF SALINITY................................................................................................................... 57
5.3.1 Lake Alexandrina ................................................................................................................. 57 5.3.2 Lake Albert ........................................................................................................................... 63 5.3.3 Salt Export............................................................................................................................ 66
5.4 SOUTH AUSTRALIAN EWRS ........................................................................................................... 67
vi
5.5 MDBA EWRS ..................................................................................................................................... 71
6. ECOLOGICAL ASSESSMENT ...............................................................................................73
6.1 PERIODS OF NO BARRAGE OUTFLOW ......................................................................................... 73 6.1.1 Baseline Conditions and 2750 GL Water Recovery ............................................................. 73 6.1.2 Sensitivity Analysis - 2400 GL and 3200 GL Water Recovery.............................................. 74 6.1.3 Implications of Periods of No Barrage Outflow..................................................................... 74
6.2 WATER LEVEL VARIATION.............................................................................................................. 74 6.2.1 Baseline Conditions and 2750 GL Water Recovery ............................................................. 74 6.2.2 Sensitivity Analysis - 2400 GL and 3200 GL Water Recovery.............................................. 75 6.2.3 Implications of Water Level Variation ................................................................................... 75
6.3 SALINITY ASSESSMENT.................................................................................................................. 75 6.3.1 Baseline Conditions and 2750 GL Water Recovery ............................................................. 75 6.3.2 Sensitivity Analysis - 2400 GL and 3200 GL Water Recovery.............................................. 76 6.3.3 Implications of Salinity Assessment ..................................................................................... 76
6.4 GENERAL DISCUSSION OF ECOLOGICAL IMPLICATIONS .......................................................... 78
7. CONCLUSIONS AND KEY FINDINGS ...................................................................................80
7.1 GENERAL MODELLING OUTCOMES .............................................................................................. 80 7.2 ASSESSMENT OF MODELLED OUTCOMES FOR THE LOWER LAKES ....................................... 80 7.3 WATER RECOVERY OF 2750 GL .................................................................................................... 81 7.4 SENSITIVITY ANALYSIS - 2400 GL AND 3200 GL WATER RECOVERY........................................ 82
8. REFERENCES ........................................................................................................................83
APPENDIX A MODELLING APPROACH - PROPOSED BASIN PLAN ....................................86
APPENDIX B EVALUATION OF BASELINE CONDITIONS......................................................93
APPENDIX C COMPARISON OF 2800 GL AND 2750 GL WATER RECOVERY ...................100
vii
List of Figures
Figure 1 Coorong, Lower Lakes and Murray Mouth Region ...................................................................... 3 Figure 2 Additional Barrage Outflow - Baseline Conditions vs BP 2750 GL (1895-96 to 200-09)........... 14 Figure 3 Additional Barrage Outflow - Baseline Conditions vs BP 2750 GL (1895-96 to 1915-16)......... 14 Figure 4 Additional Barrage Outflow - Baseline Conditions vs BP 2750 GL (1994-95 to 200-09)........... 15 Figure 5 Annual Barrage Outflow Frequency Curve - Baseline Conditions vs BP 2750 GL.................... 15 Figure 6 Length of Periods of No Barrage Outflow - Baseline Conditions ............................................... 16 Figure 7 Length of Periods of No Barrage Outflow - BP 2750 GL ........................................................... 17 Figure 8 Periods of No Barrage Outflow – Baseline Conditions .............................................................. 18 Figure 9 Periods of No Barrage Outflow – BP 2750 GL........................................................................... 18 Figure 10 Intra-Annual Distribution of Periods with No Barrage Outflow - Baseline Conditions.............. 20 Figure 11 Intra-Annual Distribution of Periods with No Barrage Outflow - BP 2750 GL .......................... 20 Figure 12 Water Level Variation - Baseline Conditions............................................................................ 21 Figure 13 Water Level Variation - BP 2750 GL........................................................................................ 22 Figure 14 Daily Water Level Frequency Curve - Baseline Conditions vs BP 2750 GL............................ 22 Figure 15 Length of Periods where Water Level < 0m AHD - Baseline Conditions................................. 23 Figure 16 Water Level Variation - Baseline Conditions vs BP 2750 GL (1900-01 to 1904-05) ............... 24 Figure 17 Water Level Variation - Baseline Conditions vs BP 2750 GL (1911-12 to 1916-17) ............... 24 Figure 18 Water Level Variation - Baseline Conditions vs BP 2750 GL (2004-05 to 2008-09) ............... 25 Figure 19 Lake Alexandrina Salinity - Baseline Conditions vs BP 2750 GL (1895-96 to 2008-09) ......... 27 Figure 20 Lake Alexandrina Salinity - Baseline Conditions vs BP 2750 GL (1975 to 2008-09) .............. 27 Figure 21 Daily Lake Alexandrina Salinity Frequency Curve - Baseline vs BP 2750 GL (1895-96 to
2008-09)................................................................................................................................... 28 Figure 22 Length of Periods with Lake Alexandrina Salinity > 1500 EC - Baseline Conditions .............. 29 Figure 23 Length of Periods with Lake Alexandrina Salinity > 1000 EC - Baseline Conditions .............. 30 Figure 24 Length of Periods with Lake Alexandrina Salinity > 1000 EC - BP 2750 GL........................... 30 Figure 25 Assessment of Limit of Acceptable Change (5-Yr Annual Rolling Average < 700 EC) -
Baseline Conditions vs BP 2750 GL........................................................................................ 31 Figure 26 Lake Albert Salinity - Baseline Conditions vs BP 2750 GL (1895-96 to 2008-09)................... 33 Figure 27 Lake Albert Salinity - Baseline Conditions vs BP 2750 GL (1975 to 2008-09) ........................ 33 Figure 28 Length of Periods with Lake Albert Salinity > 2500 EC - Baseline Conditions ........................ 35 Figure 29 Length of Periods with Lake Albert Salinity > 2000 EC - Baseline Conditions ........................ 35 Figure 30 Length of Periods with Lake Albert Salinity > 2000 EC - BP 2750 GL .................................... 36 Figure 31 Salt Export through the Barrages (Million Tonnes per Year as 10-Year Rolling Average) -
Baseline Conditions vs BP 2750 GL........................................................................................ 38 Figure 32 Additional Barrage Outflow for 1000 EC Target - Baseline Conditions ................................... 41 Figure 33 Additional Barrage Outflow for 1000 EC Target - BP 2750 GL................................................ 41 Figure 34 Additional Barrage Outflow for 1500 EC Target - Baseline Conditions ................................... 42 Figure 35 Additional Barrage Outflow for 1500 EC Target - BP 2750 GL................................................ 42 Figure 36 Flow Target Representation of Salt Export through the Barrages - Baseline Conditions vs
BP 2750 GL.............................................................................................................................. 43 Figure 37 Change in Barrage Outflow - BP 2400 GL to BP 2750 GL ...................................................... 46 Figure 38 Change in Barrage Outflow - BP 2750 GL to BP 3200 GL ...................................................... 46 Figure 39 Annual Barrage Outflow Frequency Curve - Baseline vs BP 2750 GL, BP 2400 GL and
BP 3200 GL (1895-96 to 2008-09)........................................................................................... 47 Figure 40 Length of Periods of No Barrage Outflow - BP 2400 GL ......................................................... 48

viii
Figure 41 Length of Periods of No Barrage Outflow - BP 3200 GL ......................................................... 48 Figure 42 Periods of No Barrage Outflow – BP 2400 GL......................................................................... 49 Figure 43 Periods of No Barrage Outflow – BP 3200 GL......................................................................... 49 Figure 44 Intra-Annual Distribution of Periods with No Barrage Outflow - BP 2400 GL .......................... 51 Figure 45 Intra-Annual Distribution of Periods with No Barrage Outflow - BP 3200 GL .......................... 51 Figure 46 Water Level Variation - BP 2400 GL........................................................................................ 52 Figure 47 Water Level Variation - BP 3200 GL........................................................................................ 53 Figure 48 Daily Water Level Frequency Curve - Baseline Conditions vs BP 2750 GL, BP 2400 GL
and BP 3200 GL (1895-96 to 2008-09) ................................................................................... 54 Figure 49 Water Level Variation - Baseline Conditions vs BP 2750 GL, BP 2400 GL and
BP 3200 GL (1900-01 to 1904-05)........................................................................................... 55 Figure 50 Water Level Variation - Baseline Conditions vs BP 2750 GL, BP 2400 GL and
BP 3200 GL (1911-12 to 1916-17)........................................................................................... 55 Figure 51 Water Level Variation - Baseline Conditions vs BP 2750 GL, BP 2400 GL and
BP 3200 GL (2004-05 to 2008-09)........................................................................................... 56 Figure 52 Lake Alexandrina Salinity - BP 2400 GL vs BP 2750 GL (1895-96 to 2008-09) ..................... 58 Figure 53 Lake Alexandrina Salinity - BP 2750 GL vs BP 3200 GL (1895-96 to 2008-09) ..................... 58 Figure 54 Daily Lake Alexandrina Salinity Frequency Curve - Baseline vs BP 2750 GL, BP 2400 GL
and BP 3200 GL (1895-96 to 2008-09) ................................................................................... 59 Figure 55 Daily Lake Alexandrina Salinity Frequency Curve (0 to 20% Salinity Exceedance) -
Baseline vs BP 2750 GL, BP 2400 GL and BP 3200 GL (1895-96 to 2008-09) ..................... 59 Figure 56 Length of Periods with Lake Alexandrina Salinity > 1000 EC - BP 2400 GL........................... 61 Figure 57 Length of Periods with Lake Alexandrina Salinity > 1000 EC - BP 3200 GL........................... 61 Figure 58 Assessment of Limit of Acceptable Change (5-Yr Annual Rolling Average < 700 EC) -
Baseline vs BP 2750 GL, BP 2400 GL and BP 3200 GL ........................................................ 62 Figure 59 Lake Albert Salinity - BP 2400 GL vs BP 2750 GL (1895-96 to 2008-09) ............................... 63 Figure 60 Lake Albert Salinity - BP 2750 GL vs BP 3200 GL (1895-96 to 2008-09) ............................... 64 Figure 61 Length of Periods with Lake Albert Salinity > 2000 EC - BP 2400 GL .................................... 65 Figure 62 Salt Export through the Barrages (Million Tonnes per Year as 10-Year Rolling Average) -
Baseline Conditions vs BP 2750 GL, BP 2400 GL and BP 3200 GL ...................................... 66 Figure 63 Additional Barrage Outflow for 1000 EC Target - BP 2400 GL................................................ 69 Figure 64 Additional Barrage Outflow for 1500 EC Target - BP 2400 GL................................................ 69 Figure 65 Additional Barrage Outflow for 1000 EC Target - BP 3200 GL................................................ 70 Figure 66 Additional Barrage Outflow for 1500 EC Target - BP 3200 GL................................................ 70 Figure 67 Flow Target Representation of Salt Export through the Barrages - Baseline Conditions vs
BP 2750 GL, BP 2400 GL and BP 3200 GL ............................................................................ 71

ix
List of Tables
Table 1 Lake Alexandrina Inflow and Barrage Outflow Statistics - Baseline vs BP 2750 GL (1895-96 to 2008-09).......................................................................................................................... 13
Table 2 Statistics for Periods of No Barrage Outflow - Baseline Conditions vs BP 2750 GL (1895-96
to 2008-09)............................................................................................................................... 16 Table 3 Periods of No Barrage Outflow (>30 Days) - Baseline Conditions (1895-96 to 2008-09) .......... 19 Table 4 Periods of No Barrage Outflow (>30 Days) – BP 2750 GL (1895-96 to 2008-09) ...................... 19 Table 5 Water Level Statistics - Baseline vs BP 2750 GL (1895-96 to 2008-09) .................................... 23 Table 6 Lake Alexandrina Salinity Statistics - Baseline Conditions vs BP 2750 GL................................ 26 Table 7 Daily Lake Alexandrina Salinity within Critical Ranges - Baseline vs BP 2750 GL..................... 28 Table 8 Duration of Lake Alexandrina Salinity above Threshold Values - Baseline vs BP 2750 GL
(1895-96 to 2008-09) ............................................................................................................... 29 Table 9 Annual Average Lake Alexandrina Salinity within Critical Ranges - Baseline vs BP 2750 GL.. 31 Table 10 Lake Albert Salinity Statistics - Baseline Conditions vs BP 2750 GL........................................ 32 Table 11 Daily Lake Albert Salinity within Critical Ranges - Baseline Conditions vs BP 2750 GL .......... 34 Table 12 Duration of Lake Albert Salinity above Threshold Values - Baseline vs BP 2750 GL (1895-
96 to 2008-09).......................................................................................................................... 34 Table 13 Assessment of South Australian Environmental Water Requirements - Baseline vs
2750 GL Water Recovery ........................................................................................................ 40 Table 14 Assessment of MDBA Environmental Water Requirements – Baseline Conditions vs
2750 GL Water Recovery ........................................................................................................ 44 Table 15 Lake Alexandrina Inflow Statistics - Baseline Conditions vs BP 2750 GL, BP 2400 GL and
BP 3200 GL (1895-96 to 2008-09)........................................................................................... 45 Table 16 Barrage Outflow Statistics - Baseline Conditions vs BP 2750 GL, BP 2400 GL and
BP 3200 GL (1895-96 to 2008-09)........................................................................................... 45 Table 17 Statistics for Periods of No Barrage Outflow - Baseline vs BP 2750 GL, BP 2400 GL and
BP 3200 GL (1895-96 to 2008-09)........................................................................................... 47 Table 18 Periods of No Barrage Outflow (>30 Days) – BP 2400 GL (1895-96 to 2008-09) .................... 50 Table 19 Periods of No Barrage Outflow (>30 Days) – BP 3200 GL (1895-96 to 2008-09) .................... 50 Table 20 Water Level Statistics - Baseline vs BP 2750 GL, BP 2400 GL and BP 3200 GL (1895-96
to 2008-09)............................................................................................................................... 53 Table 21 Lake Alexandrina Salinity Statistics - Baseline vs BP 2750 GL, BP 2400 GL and
BP 3200 GL (1895-96 to 2008-09)........................................................................................... 57 Table 22 Daily Lake Alexandrina Salinity within Critical Ranges - Baseline vs BP 2750 GL,
BP 2400 GL and BP 3200 GL (1895-96 to 2008-09)............................................................... 60 Table 23 Duration of Salinity in Lake Alexandrina above Threshold Values - Baseline vs
BP 2750 GL, BP 2400 GL and BP 3200 GL (1895-96 to 2008-09) ......................................... 60 Table 24 Annual Average Lake Alexandrina Salinity within Critical Ranges - Baseline vs
BP 2750 GL, BP 2400 GL and BP 3200 GL (1895-96 to 2008-09) ......................................... 62 Table 25 Lake Albert Salinity Statistics - Baseline vs BP 2750 GL, BP 2400 GL and BP 3200 GL
(1895-96 to 2008-09) ............................................................................................................... 63 Table 26 Daily Lake Albert Salinity within Critical Ranges - Baseline vs BP 2750 GL, BP 2400 GL
and BP 3200 GL....................................................................................................................... 64 Table 27 Duration of Salinity in Lake Albert above Threshold Values - Baseline vs BP 2750 GL, BP
2400 GL and BP 3200 GL (1895-96 to 2008-09)..................................................................... 65

x
Table 28 Assessment of South Australian Environmental Water Requirements - Baseline vs 2750, 2400 and 3200 GL Water Recovery ........................................................................................ 68
Table 29 Assessment of MDBA Environmental Water Requirements - Baseline vs 2750, 2400 and 3200 GL Water Recovery ........................................................................................................ 72

1
1. Introduction
1.1 Background
The development of infrastructure to manage the river systems across the Murray-Darling Basin in order to support towns, transportation, and agriculture has occurred since European settlement. The Commonwealth River Murray Waters Act 1915 was the first legislative agreement between New South Wales, Victoria and South Australia to share and administer the available water resources, although this was principally to ensure economic and social outcomes as well as to mitigate the impacts of floods and droughts.
The observed environmental impacts of such sustained and extensive development have led to a long history of water reform across the Basin. As a series of reforms that have included a Cap on Diversions (based on 1993-94 development levels) and The Living Murray Initiative have been implemented, the impacts and effects of over allocation and extraction have become clearer. The recent drought, at the end of a decade of generally below average water availability, highlighted the need to address these ongoing issues for both the benefit of the environment and consumptive users. This led to the development of the Commonwealth Water Act 2007.
The objectives of the Act include the enabling of the Commonwealth, in conjunction with the Basin States, to manage the Basin water resources in the national interest (s3(a)), and to ensure the return to environmentally sustainable levels of extraction for water resources that are over-allocated or overused (s3(d)(i)). It establishes the Murray-Darling Basin Authority (MDBA), with the powers necessary to develop and implement new Basin-wide water planning and management arrangements, including legally enforceable limits on the amount of water that can be taken for consumptive use (MDBA 2011b). The Basin Plan is the mechanism for implementing these new sustainable diversion limits (SDLs), in addition to other measures to allow for the integrated management of the Basin.
The Proposed Basin Plan (MDBA 2011a) was released for public consultation by the Murray-Darling Basin Authority (MDBA) in November 2011. It included an environmental water recovery target of 2750 GL, which will result in a reduction in long-term average diversions for consumptive purposes across the Basin. This reduction will result in a Basin-wide long-term average sustainable diversion limit (SDL) of 10,873 GL/year (MDBA 2011a).
1.2 Objectives and Methodology
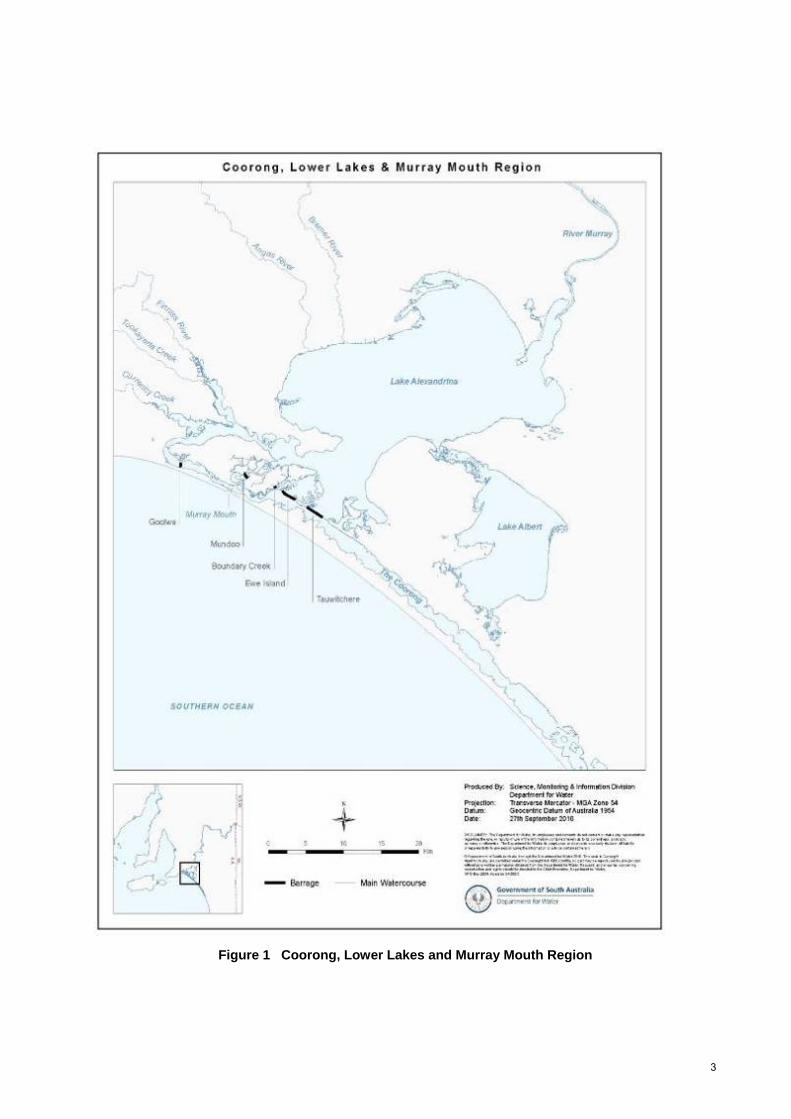
The Coorong, Lower Lakes and Murray Mouth (CLLMM) region is a Ramsar Convention-listed Wetland of International Importance, and one of six Icon Sites in the Murray-Darling Basin identified by the then Murray-Darling Basin Commission (DEH 2000). The “Ramsar Convention” refers to the Convention on Wetlands, an intergovernmental treaty adopted on 2 February 1971 in the Iranian city of Ramsar, and is now usually written as “Convention on Wetlands (Ramsar, Iran, 1971)” (Ramsar 2007). The CLLMM is one of the MDBA’s Key Environmental Assets upon which it basing its assessment of the proposed water recovery target (MDBA 2012).
The Lower Lakes (Figure 1) are the largest permanent lakes in South Australia, covering approximately 400 km2 with a volume of around 2000 GL at full supply. Lake Alexandrina is the larger of the two lakes, which is connected to Lake Albert, a terminal lake, via The Narrows. The majority of freshwater flows originate from the River Murray, with minor contributions from the tributaries of the Eastern Mount Lofty Ranges. Lake Alexandrina is separated from the Coorong by a series of barrages, which are used to manage upstream water levels through controlled releases.

2
Water recovery under the Proposed Basin Plan will provide for an increase in environmental flows throughout the Basin, including to the CLLMM site. In support of the proposed recovery target and the potential outcomes that may be achieved, considerable hydrological modelling has been undertaken by the MDBA (MDBA 2012; MDBA 2011b). A scenario representing without development conditions was modelled first, followed by a Baseline Conditions scenario representing current water availability for the environment and against which potential changes as a result of water recovery can be assessed. These were followed by a series of water recovery scenarios:
2750 GL water recovery target (BP 2750 GL) as specified in the Proposed Basin Plan
2800 GL water recovery (BP 2800 GL), which was a target proposed by the MDBA prior to the eventual release of the Proposed Basin Plan
2400 GL (BP 2400 GL) and 3200 GL (BP 3200 GL) water recovery that were modelled as a means of gauging the capacity to meet environmental outcomes with varying level of water availability for environmental use.
The characteristics of each of the above scenarios are discussed in detail in Section 2.2.
This investigation was initiated to examine the potential changes that may result from the various levels of water recovery, whilst considering the effect of the modelling approach and assumptions on the results and the ability to implement the modelled flow regimes. This investigation was required in order to support the South Australian Government's response to the Proposed Basin Plan.
There are two distinct components that represent separate analyses and quantification of the potential hydrological changes and ecological consequences from the proposed water recovery scenarios.
The primary objectives and required outcomes from the hydrological analysis were as follows:
1. Analyse the Proposed Basin Plan water recovery scenario of BP 2750 GL and compare with Baseline Conditions to quantify potential changes to hydrological metrics (flow, flow level and salinity), specified Environmental Water Requirements (EWRs) at the CLLMM site and the potential to meet proposed salt export targets.
2. Analyse BP 2400 GL and BP 3200 GL to quantify the sensitivity, with respect to BP 2750 GL, of a 400 GL decrease or increase in the proposed water recovery volume on hydrological metrics, EWRs and the potential to meet proposed salt export targets.
Based on the results from the hydrological analysis, the primary objective and required outcome from the ecological analysis was to interpret the potential ecological implications for biota of the region based on information contained within Lester et al. (2011a), specifically the implications for aquatic biota that are reliant on the Lower Lakes as habitat.
3
Figure 1 Coorong, Lower Lakes and Murray Mouth Region

4
2. Initial Evaluation of Hydrological Modelling and Water Recovery Scenarios
2.1 Hydrological Modelling
The MDBA has undertaken extensive hydrological modelling to underpin the Proposed Basin Plan, which is described in detail in MDBA (2011c) and MDBA (2012). The hydrological modelling does not directly inform the setting of the proposed SDL and hence the water recovery volume required to achieve this. Instead, hydrological modelling was used to simulate how the water recovered under the Proposed Basin Plan may be used and hence evaluate the potential outcomes from that recovery and delivery.
It is important to consider the modelling approach and assumptions used when evaluating any modelling results. As such, an analysis of the modelling approach used to evaluate the potential outcomes under the Proposed Basin Plan was undertaken and is presented in Appendix A. This includes a description of the hydrological modelling framework and the specific representation of the Lower Lakes. Key assumptions in relation to the approach used and the results for Lower Lakes are as follows:
The modelling approach that has been used by the MDBA should be considered robust in what could indicatively be achieved if each of the volumes above were recovered using a pro-rata portfolio recovery approach, but would be extremely difficult to operationalise or the outcomes repeated in practice.
Each modelled water recovery scenario represents just one of many possible realisations for the recovery and delivery of environmental water across the Basin under the Proposed Basin Plan.
The CLLMM EWRs are not explicitly included as a key environmental asset demand during the modelling process. The approach used assumes that CLLMM EWRs are largely met by baseflows and return flows from upstream sites.
In years where CLLMM demands are not fully supplied, the iterative approach allowed the provision of additional water from upstream if available. This generally only occurred during drier years when the available environmental water was insufficient to facilitate a watering event at an upstream site.
The modelling results should be used to evaluate the potential to achieve the desired environmental outcomes at the Lower Lakes, as well as allow an understanding of the ongoing level of risk of not achieving them.
2.2 Overview of Water Recovery Scenarios
In December 2011, the MDBA provided the results from each of scenarios from Section 1.2 that were modelled to support the Proposed Basin Plan. Each scenario is uniquely identified as follows:
Without Development - run #844
Baseline Conditions - run #845
BP 2800 GL - run #847
BP 2750 GL - run #865
BP 2400 GL - run #859
BP 3200 GL - run #863

5
2.2.1 Without Development Conditions
‘Without development’ represents flow and system conditions that are as near to natural conditions as possible. It is generated by removing all infrastructure (including locks and weirs, dams, storages, barrages and irrigation and environmental works) as well as all diversions for consumptive purposes (including irrigation, direct stock and domestic, town water supply, and industrial) from the system. However, the input flow data has not been corrected for land use changes and on-farm development. This data is largely generated from rainfall-runoff models with the effects of land use change largely included implicitly in the measured data used to calibrate the models.
2.2.2 Baseline Conditions
A standard approach for the objective evaluation of different water management scenarios is to use hydrological modelling. This requires the generation of a set of Baseline Conditions that represent the current state of the system to provide a basis against which changes to that system can be assessed. In terms of the Proposed Basin Plan, comparisons between alternative water recovery scenarios and Baseline Conditions can show potential outcomes and benefits as a result of a changed level of diversion.
The Baseline Conditions generally apply the current parameters of the system such as infrastructure (dams, locks, barrages), operating rules, water sharing rules under the MDB Agreement and diversions across the full modelled period. Baseline Conditions for the Proposed Basin Plan have a number of key assumptions are as follows (MDBA 2011c):
Diversions reflect water usage under water sharing arrangements at June 2009, that is, the level of development under the Murray Darling Basin Ministerial Cap for all Basin States unless the current water sharing arrangements have a usage level lower than the Cap level, for example, the New South Wales Water Sharing Plans.
Water recovery under The Living Murray (TLM) and Water for Rivers for the Snowy River is included; however, Water Recovery under other programs such as the Commonwealth Government programs for Sustainable Rural Water Use and Infrastructure and Restoring the Balance in the Murray Darling Basin, New South Wales Government River Environmental Restoration program and Northern Victorian Irrigation Renewal Program are not included.
2.2.3 Water Recovery Scenarios
The four water recovery scenarios that have been modelled by the MDBA to underpin the Proposed Basin Plan are described as follows:
1. BP 2800 GL - Prior to the release of the Proposed Basin Plan in November 2011, the MDBA proposed a water recovery target of 2800 GL.
This scenario corresponds to a long-term average annual reduction in watercourse diversions of 2800 GL/year Basin-wide, of which 450 GL/year is recovered from the Northern Basin, 2288 GL/year from the Southern Basin and 69 GL/year from the disconnected rivers (MDBA 2012). It is proposed that the SDL for each valley consists of a reduction required for in-valley environmental water requirements and the sourcing of a proportion of a shared reduction volume from the Northern (catchment upstream of Menindee lakes) and Southern Basins that is required to meet the Barwon-Darling and River Murray environmental requirements. The assumed contribution from each valley towards the shared reduction is based on a pro-rata recovery for each Entitlement Type (high security, low security and supplementary). The actual contribution by individual

6
valleys to the shared reduction will be dependent on the outcome of the water recovery program.
2. BP 2750 GL - The figure of 2750 GL that was finally included in the Proposed Basin Plan represents a reduction of 50 GL in the water to be recovered from the Condamine-Balonne system in the Northern Basin, upstream of Menindee Lakes. This decision was made by the MDBA after considering any impact or reductions in downstream flow delivery. It was concluded that that this change in the Condamine-Balonne system had little impact on the environmental flow indicators downstream of its confluence with the Barwon-Darling (MDBA 2012).
3. BP 2400 GL and BP 3200 GL - As a means of gauging the capacity to meet environmental outcomes with a varying level of water availability for environmental use, two additional scenarios of +/- 400 GL (in relation to the originally proposed 2800 GL scenario) were also assessed (MDBA 2012). The 400 GL change in volume was applied to the Southern Connected System only, resulting in a basin-wide scale of change of 2400 GL and 3200 GL. Understanding the sensitivity of water recovery and delivery potential in this system is most important given this is the location of the largest environmental water needs.
2.3 Evaluation of Baseline Conditions
It is necessary to consider the representativeness of Baseline Conditions in relation to observed data and/or the outcomes that should be anticipated given the current operation of the system in order to provide a reference for the potential changes under the Proposed Basin Plan.
The nature of Baseline Conditions and the water recovery and delivery assumptions described in Appendix A, lead to a number of points that should be considered when evaluating the model results:
Model outputs will not necessarily be an exact replicate of what was actually observed at a given time. Most of the current infrastructure and operating rules have only been in place since 1975, from which point the majority of observed data is available. In general, modelled data will more closely represent more recent observations.
The inclusion of water recovery under TLM means that conditions observed in the Lower Lakes under Baseline Conditions may not be as severe as what actually occurred. This is particularly relevant in relation to the recent drought, where water levels may not be as low, nor salinities as high as those observed due to the assumed delivery of TLM environmental water allocations.
The difference between the model scenarios is as important as the absolute values. This is because it is expected that any model errors will cancel each other out and provide a good estimates of expected changes.
In consideration of the above, an analysis of the available hydrological time-series (flow, water level and salinity) for the Lower Lakes under Baseline Conditions was undertaken and compared with observed data to quantify the potential sensitivity of the model results. This analysis is presented in Appendix B, with the key points as follows:
The assumed lake operating strategy significantly influences the modelled water level, barrage outflow and salinity response. The rules based approach used to model a variable water level regime for ecological outcomes is likely to be more representative of future operations than those that have historically occurred. However, the specific application of this operating strategy has likely resulted in the lowering of water levels

7
from a preferred minimum level of around 0.4m AHD to almost 0.1m AHD in some years under Baseline Conditions. Given a dual requirement to maintain water security, this is not expected to occur in practice.
During periods of significantly reduced water availability the absolute water levels as represented under Baseline Conditions may be over estimated as a result of higher inflow volumes to Lake Alexandrina than would likely be expected to occur. This has been estimated to be in the order of 0.2 to 0.3m per year.
Salinity in Lake Alexandrina is likely to have been under estimated during very low flow periods under Baseline Conditions due to the over estimation of lake level as well as a potential under estimation of salt inflow. This may be in the order of around 200 EC per year.
Overall, understanding the sensitivity of the results allows the identification of periods where there is likely to be a risk of water levels falling too low or salinity rising too high. This approach is used during the assessment of the results from the water recovery scenarios.
2.4 Comparison of 2800 GL and 2750 GL Water Recovery Scenarios
Prior to the release of the Proposed Basin Plan in November 2011, the MDBA proposed a water recovery target of 2800 GL. The figure of 2750 GL that was finally included in the Proposed Basin Plan represented a reduction of 50 GL in the water to be recovered from parts of the Northern Basin, upstream of Menindee Lakes.
Advice from the MDBA indicated that the decision was made to reduce the water recovery target by 50 GL following an assessment of the benefits of this water in meeting downstream water requirements. The additional recovery was considered to provide limited benefits, particularly with respect to long-term average metrics.
The majority of results presented by the MDBA in support of the Proposed Basin Plan, including those contained in the principal hydrological modelling report released (MDBA 2012) are from BP 2800 GL. Given that the Proposed Basin Plan contains a water recovery target of 2750 GL, the preferred approach for this investigation was to solely focus on the results from this scenario. However, prior to this, an analysis of the available hydrological time-series (flow, water level and salinity) from BP 2750 GL and BP 2800 GL was undertaken to quantify differences and hence inter-changeability of these scenarios. The results from this analysis are presented in Appendix C, with the key points as follows:
There is little difference between the aggregated statistics of both scenarios.
While the total difference in lake inflow and barrage outflow volumes between the two scenarios is small, in some instances there are larger variations. The analysis shows that this may be a result of a sequencing change to the delivery of environmental water rather than an overall reduction in volume reaching the site.
The differences between the scenarios are unlikely to cause significant changes to the resulting hydrology and salinity regime in the Lower Lakes. Hence for the analysis undertaken in this report the scenarios can be considered to be effectively inter-changeable. However, before this conclusion can be applied to the Coorong, the effects of the variations on the Coorong itself need to be analysed separately.

8
3. Assessment Method for Water Recovery Scenarios
The assessment of the potential changes to conditions in the Lower Lakes as a result of the Proposed Basin Plan water recovery scenarios has considered hydrological metrics, EWRs and an ecological analysis of target values that support biota.
3.1 Hydrological Assessment
An assessment of the inflow to the Lower Lakes, barrage outflow, water level and salinity was undertaken of the model results for Baseline Conditions and each water recovery scenario to quantify the potential changes to the Lower Lakes.
This analysis included an assessment of the modelled time-series for each variable to produce standard statistics, as well as a number of other critical metrics. These included:
events where water levels drop below 0.0m AHD and -0.5m AHD to permit barrage releases in future years and avoid widespread acidification risks
periods with no barrage outflow to maintain habitat and population connectivity
periods with 1000 EC and 1500 EC daily salinity exceedance in Lake Alexandrina to support the suite of biota
ability to meet proposed salt export targets as defined under the Basin Salinity Management Strategy (MDBC 2001).
The MDBA generally only model salinity for the full River Murray System from 1975 due to lack of observed data to use as input for model boundary conditions. Heneker (2010) developed a flow-salinity relationship for the inflow to Lake Alexandrina, which preserved the historical characteristics of salt inflows and allowed the assessment of salinity response within the Lower Lakes to be extended to the full modelled period of 1895-96 to 2008-09. To evaluate the periods with 1000 EC and 1500 EC daily salinity exceedance above, the BIGMOD model setup for the Basin Plan Baseline Conditions was re-run, recalculating only the salinity of Lake Alexandrina inflow using the relationship from Heneker (2010).
Further descriptions of these metrics are discussed in the relevant sections later in this report.
3.2 Environmental Water Requirements
Environmental Water Requirements (EWRs) for the CLLMM site have been defined by both the South Australian Government and the MDBA. For transparency, the ability of the water recovery scenarios to meet both sets of requirements has been assessed.
3.2.1 South Australian Government EWRs
In July 2008, the Commonwealth Government instigated the Murray Futures Program for South Australia. As part of this program, the Department of Environment and Natural Resources (DENR) has the responsibility to develop a long-term plan for the CLLMM Ramsar site. A component of this long-term plan was the development of an EWR that would support the desired ecological character for the region. The first iteration of this work was based on ecological first principles and was completed in 2011 (Lester et al. 2011b).
Lester et al. (2011a) found that much of the aquatic vegetation in the Lower Lakes have preferred salinity ranges less than 1500 EC, with some species preferring salinity less than 1000 EC. The salinity in Lake Albert is consistently and often significantly higher than in Lake

9
Alexandrina given the nature of their connection. Indicatively, when the salinity in Lake Alexandrina is 1000 EC, the corresponding salinity in Lake Albert is in the order of 1700 EC. For 1500 EC in Lake Alexandrina, this increases to 2500 to 2700 EC in Lake Albert. There are limited opportunities to directly manage salinity in Lake Albert and in particular, reduce salinity quickly. As such, managing the salinity within Lake Albert is critical to the health of this lake and contributed to the salinity level specified as part of the EWR definition below.
In order to maintain the Ramsar-nominated ecological character and meet the requirements of the Water Act 2007, a set of flow-related objectives for the CLLMM region were defined as follows:
A maximum salinity of 1000 μS cm-1 EC in Lake Alexandrina should be maintained in 95% of years, never exceeding 1500 μS cm-1 EC (with the additional caveat that the 5% of years where this is not met not be sequential).
An average annual salinity of 700 μS cm-1 EC in Lake Alexandrina is the long-term average and should be the target for most years.
High barrage outflows to the Coorong of 6000 and 10,000 GL per year should be maintained at their current frequency of every 3 and 7 years respectively.
In order to meet the target of 1000 μS cm-1 EC in Lake Alexandrina, the minimum barrage outflow in any given year (FX) should be the maximum of (Heneker 2010):
1. 650 GL
2. 4000 GL - FX-1
3. 6000 GL - FX-1 - F*X-2 (where F*
X-2 is min(FX-2, 2000 GL))
A similar set of parameters is also given to meet the 1500 μS cm-1 EC target.
In addition to the flow related objectives, the flora and fauna of Lake Alexandrina require a variable flow regime. The recommended water level regime varied seasonally between 0.35 and 0.75m AHD with higher water levels every three years to induce flooding of surrounding riparian zones. The latter involved a variation between 0.5 and 0.83m AHD.
A minimum water level in Lake Alexandrina of 0.0m AHD (Pollino et al. 2011) is also included as an indicator of increased risk for broad scale acidification of the Lower Lakes.
3.2.2 MDBA EWRs
The CLLMM EWRs developed by the MDBA for the Basin Plan (MDBA 2011c) primarily focused around the maintenance of a range of healthy estuarine, marine and hypersaline conditions in the Coorong, including healthy populations of keystone species such as Ruppia tuberosa in South Lagoon and Ruppia megacarpa in North Lagoon. There were no explicit requirements to maintain the ecological health of the Lower Lakes; however, the EWRs included a barrage outflow target for both salt export and the maintenance of an open Murray Mouth. In addition, a variable water level regime that avoided acidification issues was required.
For the Coorong and Murray Mouth, the EWRs were defined as:
maximum salinity in the Coorong South Lagoon of 130 g/L
salinity in Coorong South Lagoon less than 100 g/L in 95% of years
maximum salinity in Coorong North Lagoon of 50 g/L
three year rolling average barrage flow of greater than 1,000 GL/yr in 100% of years
three year rolling average barrage flow of greater than 2,000 GL/yr in 95% of years

10
long-term barrage flow of greater than 5100 GL/yr.
For the River Murray and Lower Lakes, the EWRs were defined as:
10-year rolling average flow of 3,200 GL/year for 100% of years
minimum water level in Lake Alexandrina and Lake Albert of 0.0m AHD.
The MDBA have defined the 10-year rolling average flow of 3,200 GL/year as a surrogate for meeting the salt export target of two million tonnes per year, also as a 10-year rolling average.
3.3 Ecological Analysis
In order to assess the local ecological condition within the CLMM region, a linked suite of indicator species specific to the region were developed (Lester et al. 2011a). The objective of this work was to identify the requirements of species, assemblages and processes that were indicative of the presently described ecological character for the site as a healthy and resilient wetland of international importance. This included species and assemblages for the CLLMM that were:
likely to be directly affected by hydrodynamic parameters (for example, water levels and water quality)
considered to be key species or assemblages within the region (primarily based on previous research in the region or expert opinion)
threatened and thus considered to be a Matter of National Significance under the Commonwealth Environmental Protection and Biodiversity Conservation Act 1999
considered to be sensitive to environmental change (i.e. analogous to the canary in the coal-mine).
Some invasive species were also included as indicators. This ensured that the potential for changes in the distribution of both pest as well as native species would be assessed when considering the effects of environmental water provisions. This information has largely been selected here for use in determining metrics to assess the water recovery scenarios. For further information on the indicator selection methodology, the species included or the linkages to the various objectives and outcomes sought to demonstrate a healthy and resilient wetland of international importance see Lester et al. (2011a).
Where Lester et al. (2011a) considered indicators to be representative of the ecological outcomes required to ensure the site was healthy and resilient, the requirements of each indicator in relation to the following suite of environmental conditions was collated:
salinity
turbidity
the annual return frequency of barrage flows and/or floodplain inundation
connectivity
water level
the timing of events.
For vegetation, macroinvertebrates and fish, a short summary of the species identified as indicators is provided below. The inclusion of relevant ecological processes has not been undertaken for this assessment.
11
To assist in assessing the absolute and relative changes of different water recovery scenarios on the biota of the site in comparison to Baseline Conditions, the relevant information and tables (referred to as ‘trade-off tables’) that provide a summary of the known tolerances for each indicator for several of the parameters above was used (as developed by Lester et al. 2011a).
3.3.1 Vegetation
Lester et al. (2011a) selected vegetation indicators species and assemblages to cover a range of possible aquatic vegetation in the CLLMM region, from the terrestrial edge of the ‘floodplain’ to the lower edge of the euphotic zone (the zone within which light penetrates the water column). The vegetation indicators selected for the Lower Lakes included samphire & saltmarsh communities, paperbark woodlands (Melaleuca halmaturorum), lignum (Muehlenbeckia florulenta), diverse reed beds, water ribbons (Triglochin procerum), ribbonweed (Vallisneria australis), water milfoil (Myriophyllum spp.), and the spiny rush (Juncus acutus) a highly invasive and undesirable species previously recorded in the region. Phillips and Muller (2006), recognised that submerged macrophytes in the lakes such as water ribbons and ribbonweed, are key to the ecological condition of the region and so could be considered as ‘Ramsar significant biota’ for the region and form a key species in the assessment of the implications of the proposed water recovery target in the Proposed Basin Plan.
The information presented in showed that many of the vegetation indicators, particularly the aquatic vegetation found in the Lower Lakes, had preferred salinity ranges of less than approximately 1500 S cm-1EC, with water ribbons having the lowest preferred salinity of less than approximately 1000 S cm-1EC.
Lester et al. (2011a) found that vegetation indicators showed a wide variation in the preferred Annual Return Frequency (ARF) for lake water levels (particularly for ARFs for water levels >0.7 m AHD). Most species and assemblages were considered to be at risk when ARFs extended to between 5 and 10+years, with 3 years or lower being the thresholds for the preferred frequency of flooding around the Lower Lakes for most indicators.
For lake levels, Muller (2010) found that:
most vegetation indicators preferred lake water levels between 0.6 and 0.85m AHD, or greater
between 0.2 and 0.6m AHD, some vegetation indicators were either in preferred or marginal ranges.
Muller (2010) suggested that the operating range for the Lower Lakes as a part of the EWR for the site as described by Lester et al. (2011b) is between 0.35 and 0.65m AHD, with regular increases to 0.85m AHD. This is where most vegetation indicators are within their preferred or marginal ranges.
3.3.2 Macroinvertebrates
Of the 19 selected macroinvertebrate indicator taxa selected by Lester et al. (2011a) to cover the gradient of freshwater, estuarine, marine and hypersaline habitats within the CLLMM region, nine were freshwater species. There was a lack of available specific knowledge and local data for many of the Lower Lakes macroinvertebrate taxa, such that much of the rationale for this group was drawn from research and management undertaken elsewhere in Australia. The freshwater macroinvertebrate indicator species considered were the freshwater mussel (Velesunio ambiguus), freshwater crayfish (Cherax destructor), mayfly larvae (Ephemeroptera), stonefly larvae (Plecoptera), caddisfly larvae (Trichoptera), amphipods (Amphipoda), segmented worms (Oligochaeta), hydra (Hydra spp.), freshwater limpets (Ancylidae).

12
Minimum water level targets were not established for the Lower Lakes primarily because it was difficult to determine whether water level is a driving factor, as there are other critical variables that relate to water quality and flow.
3.3.3 Fish
Of the 17 indicator species identified in Lester et al. (2011a), to cover the range of freshwater, estuarine and marine habitats across the site, as well as different strategies for using the site (for example, migratory versus resident) 10 were freshwater, while three of these species were linked to barrage opening for their life-history (being diadromous species). As a pest species, European carp (Cyprinus carpio) was also included as an indicator of decline in site conditions and/or fish communities.
The fish indicators that were considered included Murray cod (Macquaria peelii peelii), golden perch (Macquaria ambigua ambigua), bony herring (Nematolosa erebi), Australian smelt (Retropinna semoni), Murray hardyhead (Craterocephalus fluviatilis), Yarra pygmy perch (Nannoperca obscura), carp, congolli (Pseudaphritis urvillii). Additionally, Congolli and pouched lamprey (Mordacia mordax) were species able to provide an indication of the potential implications for connectivity between the freshwater and marine elements of the site.
3.3.4 Assessment Metrics
The information compiled by Lester et al. (2011a) was used to identify thresholds for each of the flow-related parameters for the region and describe the recommended Environmental Water Requirements for the site (Lester et al. 2011b). The key findings of Lester et al. (2011a; 2011b) provide the basis for this ecological analysis. An assessment of the ecological implications has been undertaken using the following metrics:
maximum salinity in Lake Alexandrina of ~1000 and 1500 μS cm-1EC
maintenance of average daily water level in Lake Alexandrina between 0.35 and 0.85m AHD
periods of no barrage flow do not exceed 3 years in duration, preferably less than one year.

13
4. Analysis of Baseline Conditions with 2750 GL Water Recovery
The analysis below compares the results of the Baseline Conditions model run with those of BP 2750 GL. This provides an indicative assessment of the potential enhancement of the baseline sequence of Lake Alexandrina inflows and barrage outflows, and the consequential water level and salinity response.
4.1 Analysis of Flow Regime
Heneker (2010) showed that the intra-annual distribution of inflow including the inflow rate to Lake Alexandrina did not significantly affect the total annual barrage outflow, and either the salinity response or resulting lake level variation. It was concluded that the total annual volumes reaching the Lower Lakes and the subsequent barrage outflow was critical to ecosystem health. Hence the EWRs from Section 3.2 were developed based on annual flow targets and the analysis here also considers an annual timescale.
A summary of annual flow statistics for Lake Alexandrina inflow and barrage outflow is shown in Table 1. This highlights a significant improvement to the mean and median barrage outflows as well as a new minimum barrage outflow of 450 GL under BP 2750 GL.
Table 1 Lake Alexandrina Inflow and Barrage Outflow Statistics - Baseline vs BP 2750 GL (1895-96 to 2008-09)
Lake Inflow (GL) Barrage Outflow (GL) Statistics
Baseline BP 2750 GL Baseline BP 2750 GL
Mean 5685 7650 4860 6830
Median 3945 6310 3155 5490
Minimum 530 1125 0 450
Maximum 42125 43690 41215 42800
10th Percentile 1420 2395 570 1600
90th Percentile 10460 12725 9520 11880
Figure 2 shows the additional barrage outflows under BP 2750 GL, which indicates an increase in all years when compared to Baseline Conditions. Figures 3 and 4 then highlight two low flow periods where the annual barrage outflows have been significantly increased.
Figure 5 shows the potential change in the barrage outflow frequency curve, highlighting increases to all but the highest two percent of annual outflow totals. Despite the improvement, there remains six years with a barrage outflow less than 1000 GL, including three consecutive years, indicating the potential for salinity levels to exceed those recommended in Section 3.2.

14
0
5000
10000
15000
20000
25000
30000
35000
40000
45000
1895‐96
1900‐01
1905‐06
1910‐11
1915‐16
1920‐21
1925‐26
1930‐31
1935‐36
1940‐41
1945‐46
1950‐51
1955‐56
1960‐61
1965‐66
1970‐71
1975‐76
1980‐81
1985‐86
1990‐91
1995‐96
2000‐01
2005‐06
Barrage
Outflow (G
L/year)
Water Year
Additional Outflow: 2750 GL Water Recovery
Baseline Conditions Barrage Outflow
Figure 2 Additional Barrage Outflow - Baseline Conditions vs BP 2750 GL (1895-96 to 200-09)
0
1000
2000
3000
4000
5000
6000
7000
8000
9000
10000
1895‐96
1896‐97
1897‐98
1898‐99
1899‐00
1900‐01
1901‐02
1902‐03
1903‐04
1904‐05
1905‐06
1906‐07
1907‐08
1908‐09
1909‐10
1910‐11
1911‐12
1912‐13
1913‐14
1914‐15
1915‐16
Barrage
Outflow (G
L/year)
Water Year
Additional Outflow: 2750 GL Water Recovery
Baseline Conditions Barrage Outflow
Figure 3 Additional Barrage Outflow - Baseline Conditions vs BP 2750 GL (1895-96 to 1915-16)

15
0
1000
2000
3000
4000
5000
6000
7000
8000
9000
10000
11000
12000
1994‐95
1995‐96
1996‐97
1997‐98
1998‐99
1999‐00
2000‐01
2001‐02
2002‐03
2003‐04
2004‐05
2005‐06
2006‐07
2007‐08
2008‐09
Barrage
Outflow (G
L/year)
Water Year
Additional Outflow: 2750 GL Water Recovery
Baseline Conditions Barrage Outflow
Figure 4 Additional Barrage Outflow - Baseline Conditions vs BP 2750 GL (1994-95 to 200-09)
0
5000
10000
15000
20000
25000
30000
35000
40000
45000
0 10 20 30 40 50 60 70 80 90 100
Barrage
Outflow (G
L/year)
% Years Flow Greater than Indicated
Baseline Conditions (1895‐96 to 2008‐09)
2750 GL Water Recovery (1895‐96 to 2008‐09)
Median Annual OuflowBP 2750 GL = 5490 GLBaseline = 3155 GL
Figure 5 Annual Barrage Outflow Frequency Curve - Baseline Conditions vs BP 2750 GL
16
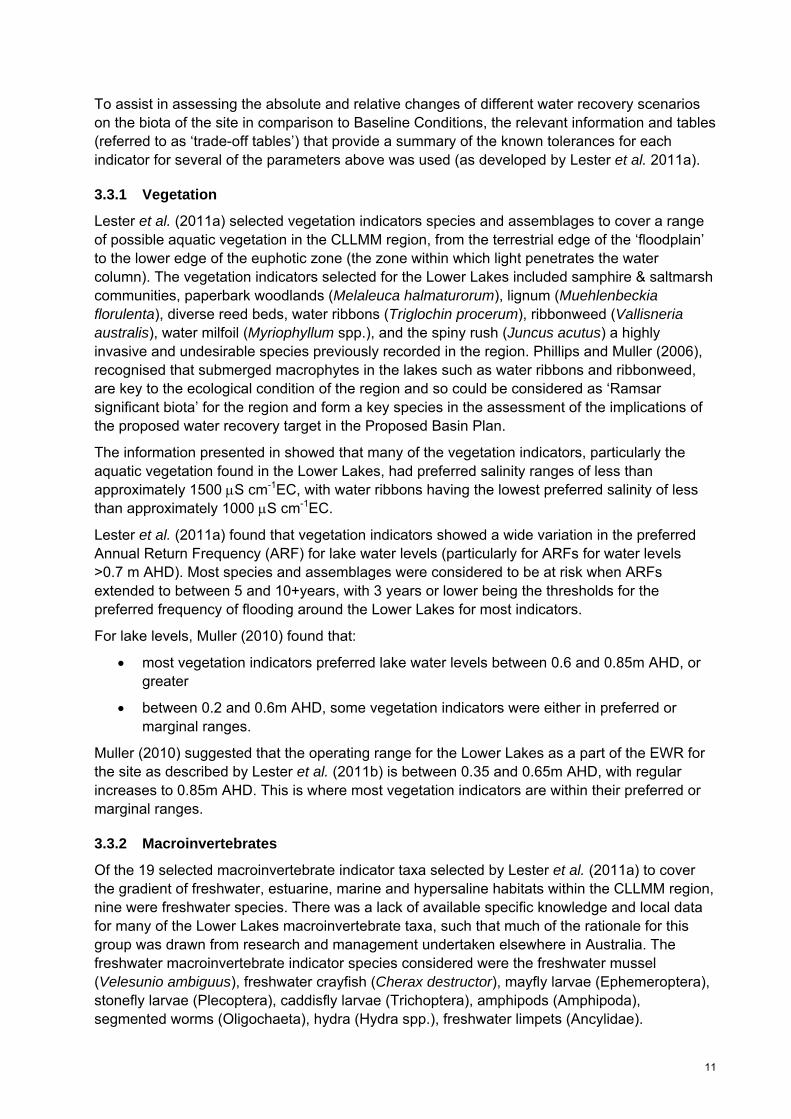
A analysis of the frequency and duration of periods of no barrage outflow was undertaken, with the statistics from this analysis shown in Table 2. There are a number of very short periods (less than five days) of no barrage outflow, which would be unlikely to occur under normal barrage operating conditions. These have been removed from the calculations. All periods of no outflow are shown in Figure 6 for Baseline Conditions and Figure 7 under BP 2750 GL.
BP 2750 GL potentially provides a significant improvement in reducing the number and duration of periods with no barrage outflow. In terms of the maximum duration, this is reduced from around two years to four months. It should be noted that the end of the analysis period is midway through a drought sequence. If extended by a year, the maximum duration of no barrage outflow under Baseline Conditions would also be extended by a year.
Table 2 Statistics for Periods of No Barrage Outflow - Baseline Conditions vs BP 2750 GL (1895-96 to 2008-09)
No Barrage Outflow Statistics
Baseline BP 2750 GL
No. Periods > 5 days 31 19
Mean Duration (days) 115 50
Median Duration (days) 60 35
Maximum Duration (days) 650 125
0
100
200
300
400
500
600
700
1 2 3 4 5 6 7 8 9 10 11 12 13 14 15 16 17 18 19 20 21 22 23 24 25 26 27 28 29 30 31 32 33 34 35
Length of Period (days)
Period
Periods of No Barrage Outflow ‐ Baseline Conditions (1895‐96 to 2008‐09)
NoBarrage Outflow ‐ Baseline Conditions31 periods > 5 daysMeanduration ‐ 115 daysMedian duration ‐ 60 daysMaximum duration ‐ 650 days
Figure 6 Length of Periods of No Barrage Outflow - Baseline Conditions

17
0
20
40
60
80
100
120
140
1 2 3 4 5 6 7 8 9 10 11 12 13 14 15 16 17 18 19 20 21
Length of Period (days)
Period
Periods of No Barrage Outflow ‐ 2750 GL Water Recovery (1895‐96 to 2008‐09)
NoBarrage Outflow ‐ 2750 GL Water Recovery19 periods > 5 daysMeanduration ‐ 50 daysMedian duration ‐ 35 daysMaximum duration ‐ 125 days
Figure 7 Length of Periods of No Barrage Outflow - BP 2750 GL
In addition to the length of periods of no barrage outflow, an analysis of the distribution of these periods across the modelled record was undertaken. Figures 8 and 9 show the distribution for Baseline Conditions and BP 2750 GL respectively. This highlights the uneven distribution over time, with multiple occurrences within periods of around 10 years. Under BP 2750 GL, these multiple occurrences with no barrage outflow within 10 year periods continue to occur at similar intervals but the number and length of those periods is reduced.
A period of 30 days or more with no barrage outflow may have an impact on the downstream environment of the Coorong with closure between June and January being particularly critical for fish migration (Lester et al. 2011a). Tables 3 and 4 list the periods of no barrage outflow that are greater than 30 days under Baseline Conditions and BP 2750 GL. In some cases there are only a small number of days between these no flow periods, indicating that the no flow period may actually be longer and in practice may encompass one or two separate periods.
Figures 10 and 11 then compare the intra-annual distribution of the periods with no barrage outflow from Tables 3 and 4 under Baseline Conditions and BP 2750 GL respectively. Highlighted is the critical period of July to January for connection between Lake Alexandrina and the Coorong.

18
1895
1899
1903
1907
1911
1915
1919
1923
1927
1931
1935
1939
1943
1947
1951
1955
1959
1963
1967
1971
1975
1979
1983
1987
1991
1995
1999
2003
2007
Year
Periods of No Barrage Outflow ‐ Baseline Conditions
Figure 8 Periods of No Barrage Outflow – Baseline Conditions
1895
1899
1903
1907
1911
1915
1919
1923
1927
1931
1935
1939
1943
1947
1951
1955
1959
1963
1967
1971
1975
1979
1983
1987
1991
1995
1999
2003
2007
Year
Periods of No Barrage Outflow ‐ 2750 GL Water Recovery
Figure 9 Periods of No Barrage Outflow – BP 2750 GL

19
Table 3 Periods of No Barrage Outflow (>30 Days) - Baseline Conditions (1895-96 to 2008-09)
No Barrage Outflow
Period Length (days) 01/1898 - 05/1898 120
01/1899 - 03/1899 42
06/1898 - 07/1898 46
12/1899 - 03/1900 87
06/1902 - 07/1903 412
11/1914 - 07/1915 262
01/1920 - 04/1920 102
06/1929 - 07/1929 60
02/1930 - 03/1930 33
06/1930 - 07/1930 58
12/1938 - 03/1939 99
02/1941 - 03/1941 37
06/1941 - 07/1941 61
01/1942 - 03/1942 63
01/1944 - 03/1944 71
06/1944 - 08/1944 68
09/1944 - 08/1945 348
06/1946 - 07/1946 32
11/1967 - 05/1968 197
01/1983 - 03/1983 84
01/2003 - 04/2003 97
06/2003 - 07/2003 56
06/2004 - 07/2004 52
11/2006 - 08/2007 290
09/2007 - 06/2009 651
Table 4 Periods of No Barrage Outflow (>30 Days) – BP 2750 GL (1895-96 to 2008-09)
No Barrage Outflow
Period Length (days) 01/1900 - 03/1900 62
06/1901 - 07/1901 43
01/1903 - 03/1903 55
01/1915 - 05/1915 105
06/1920 - 07/1920 33
01/1945 - 05/1945 119
12/2006 - 04/2007 123
06/2007 - 07/2007 36
01/2008 - 05/2008 117
06/2008 - 08/2008 77
06/2009 - 06/2009 30

20
Figure 10 Intra-Annual Distribution of Periods with No Barrage Outflow - Baseline Conditions
Figure 11 Intra-Annual Distribution of Periods with No Barrage Outflow - BP 2750 GL

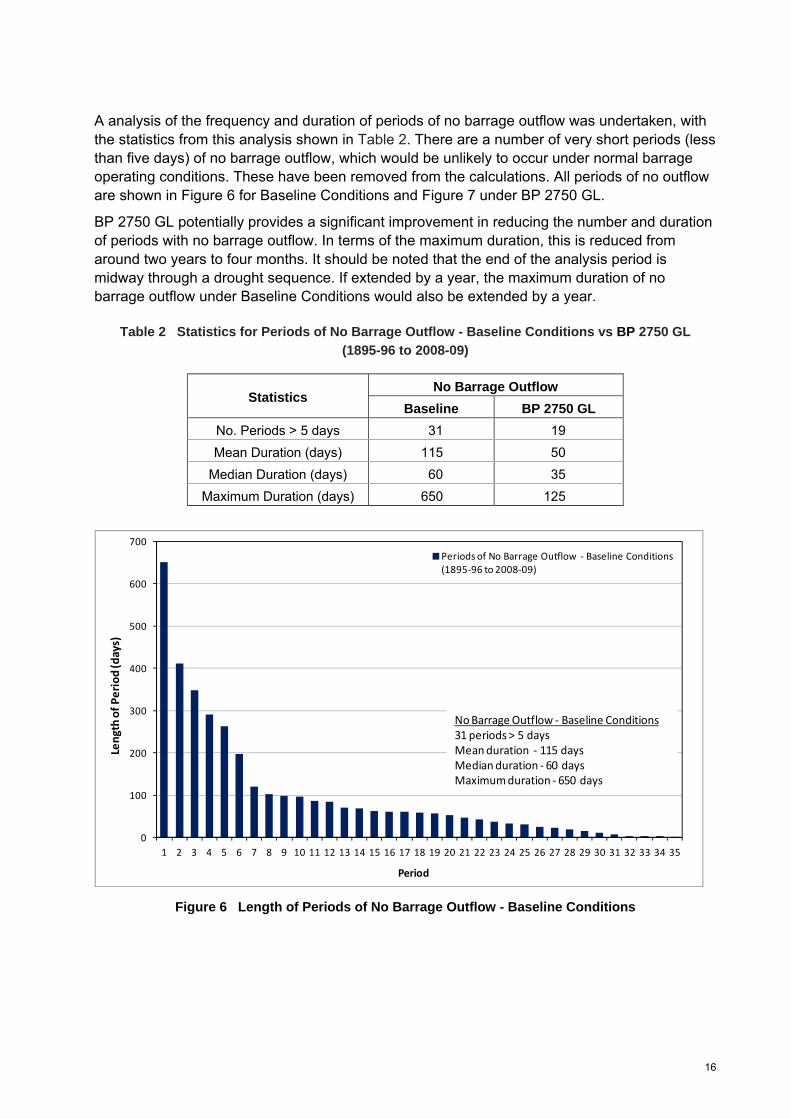
21
4.2 Analysis of Water Level Variation
Modelled water levels under Baseline Conditions are not always as low as those observed during some periods, particularly during the recent drought (refer Section 2.3). An analysis of the model results as presented was analysed first, followed by consideration of sensitivity of the results to the over estimation of water level.
A variable water level regime similar to that proposed in Lester et al. (2011b) has been incorporated by the MDBA into BIGMOD and was used in all modelled to support the Proposed Basin Plan. This intra-annual variation is observable in the water level profile under Baseline Conditions shown in Figure 12.
‐0.6
‐0.4
‐0.2
0
0.2
0.4
0.6
0.8
1
1.2
1895
1899
1903
1907
1911
1915
1919
1923
1927
1931
1935
1939
1943
1947
1951
1955
1959
1963
1967
1971
1975
1979
1983
1987
1991
1995
1999
2003
2007
Water Level (m AHD)
Year
Baseline Conditions
Figure 12 Water Level Variation - Baseline Conditions
Figure 12 also highlights a number of periods where water levels fall below the preferred minimum operating level of 0.35m AHD as well as the critical water levels of 0.0m AHD and -0.5m AHD at which point there is the potential for significant acidification issues. Figure 13 shows the reduction and/or elimination of these periods of low water level under BP 2750 GL and the occurrence of events below 0.0m AHD.
The daily water level frequency curve in Figure 14 confirms this with a reduction from 4% to 0% in the percentage of days where the water level is likely to fall below 0.0m AHD. In terms of the water levels below preferred operating level of 0.35m AHD, the percentage of days reduces from 15% to 8%.
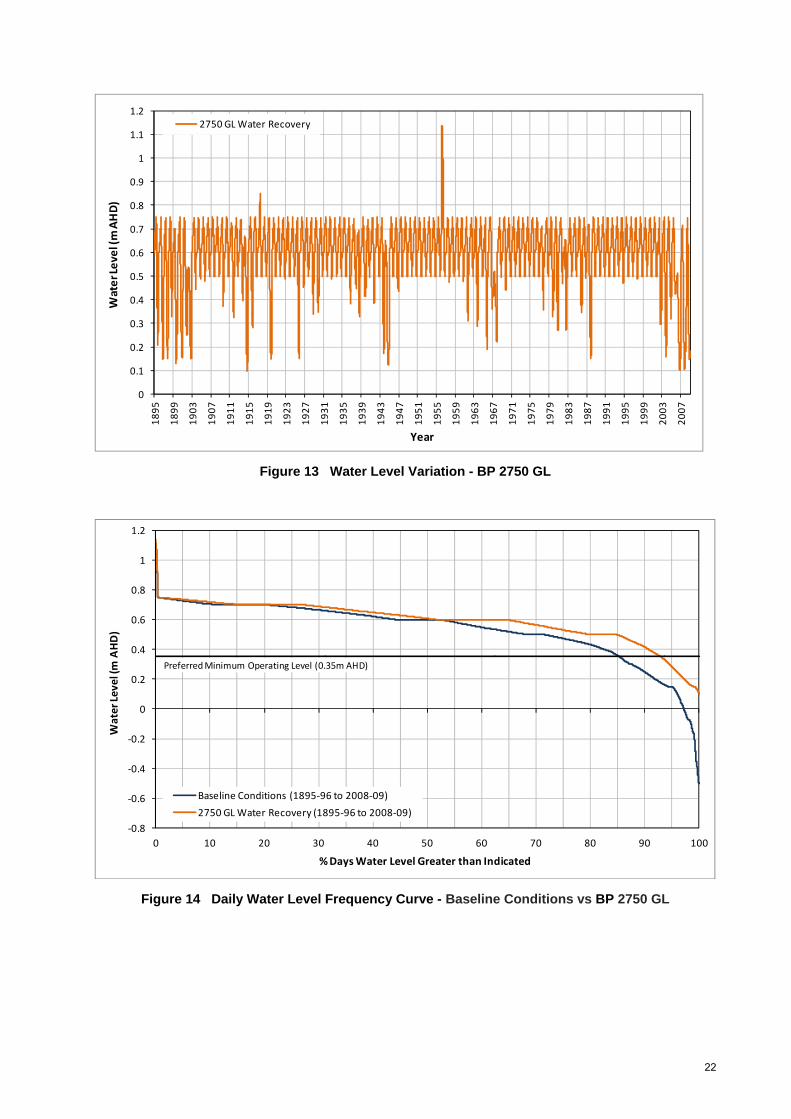
22
0
0.1
0.2
0.3
0.4
0.5
0.6
0.7
0.8
0.9
1
1.1
1.2
1895
1899
1903
1907
1911
1915
1919
1923
1927
1931
1935
1939
1943
1947
1951
1955
1959
1963
1967
1971
1975
1979
1983
1987
1991
1995
1999
2003
2007
Water Level (m AHD)
Year
2750 GL Water Recovery
Figure 13 Water Level Variation - BP 2750 GL
‐0.8
‐0.6
‐0.4
‐0.2
0
0.2
0.4
0.6
0.8
1
1.2
0 10 20 30 40 50 60 70 80 90 100
Water Level (m AHD)
% Days Water Level Greater than Indicated
Baseline Conditions (1895‐96 to 2008‐09)
2750 GL Water Recovery (1895‐96 to 2008‐09)
Preferred Minimum Operating Level (0.35m AHD)
Figure 14 Daily Water Level Frequency Curve - Baseline Conditions vs BP 2750 GL
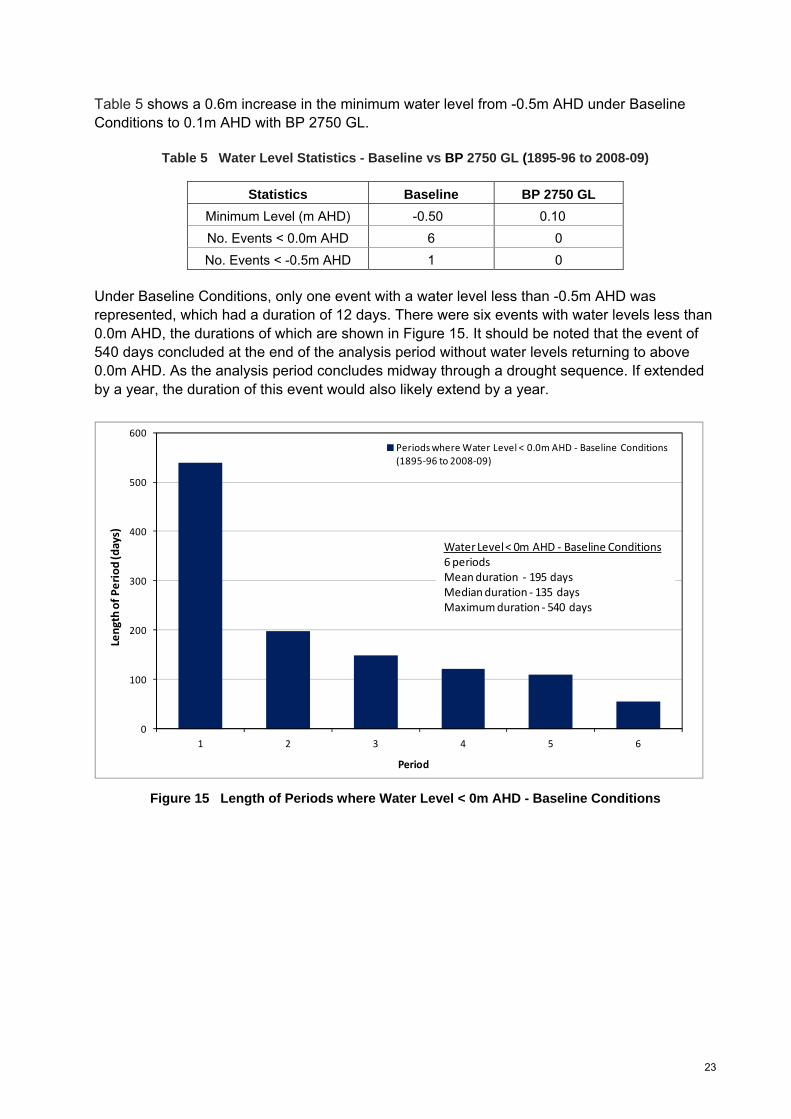
23
Table 5 shows a 0.6m increase in the minimum water level from -0.5m AHD under Baseline Conditions to 0.1m AHD with BP 2750 GL.
Table 5 Water Level Statistics - Baseline vs BP 2750 GL (1895-96 to 2008-09)
Statistics Baseline BP 2750 GL
Minimum Level (m AHD) -0.50 0.10
No. Events < 0.0m AHD 6 0
No. Events < -0.5m AHD 1 0
Under Baseline Conditions, only one event with a water level less than -0.5m AHD was represented, which had a duration of 12 days. There were six events with water levels less than 0.0m AHD, the durations of which are shown in Figure 15. It should be noted that the event of 540 days concluded at the end of the analysis period without water levels returning to above 0.0m AHD. As the analysis period concludes midway through a drought sequence. If extended by a year, the duration of this event would also likely extend by a year.
0
100
200
300
400
500
600
1 2 3 4 5 6
Length of Period (days)
Period
Periods where Water Level < 0.0m AHD ‐ Baseline Conditions (1895‐96 to 2008‐09)
Water Level < 0m AHD ‐ Baseline Conditions6 periods Meanduration ‐ 195 daysMedian duration ‐ 135 daysMaximum duration ‐ 540 days
Figure 15 Length of Periods where Water Level < 0m AHD - Baseline Conditions

24
Figures 16 to 18 show the improvement in minimum water levels for three periods where water levels fell below 0.0m AHD under Baseline Conditions.
‐0.6
‐0.5
‐0.4
‐0.3
‐0.2
‐0.1
0
0.1
0.2
0.3
0.4
0.5
0.6
0.7
0.8
0.9
07/1900 07/1901 07/1902 07/1903 07/1904
Water Level (m
AHD)
Date (month, year)
Baseline Conditions
2750 GL Water Recovery
Figure 16 Water Level Variation - Baseline Conditions vs BP 2750 GL (1900-01 to 1904-05)
‐0.6
‐0.5
‐0.4
‐0.3
‐0.2
‐0.1
0
0.1
0.2
0.3
0.4
0.5
0.6
0.7
0.8
0.9
07/1911 07/1912 07/1913 07/1914 07/1915 07/1916
Water Level (m
AHD)
Date (month, year)
Baseline Conditions
2750 GL Water Recovery
Figure 17 Water Level Variation - Baseline Conditions vs BP 2750 GL (1911-12 to 1916-17)

25
‐0.6
‐0.5
‐0.4
‐0.3
‐0.2
‐0.1
0
0.1
0.2
0.3
0.4
0.5
0.6
0.7
0.8
0.9
07/2004 07/2005 07/2006 07/2007 07/2008
Water Level (m
AHD)
Date (month, year)
Baseline Conditions
2750 GL Water Recovery
Figure 18 Water Level Variation - Baseline Conditions vs BP 2750 GL (2004-05 to 2008-09)
Consideration of the potential impact of an over estimation of around 0.2m per year during low inflow periods (Section 2.3), leads to the following:
Potential for water levels to fall below 0.0m AHD during 10 to 15 additional years, and below -0.5m AHD in one additional year under Baseline Conditions.
It is unlikely that water levels would fall below -0.5m AHD under BP 2750 GL.
Potential for water level to fall below 0.0m AHD in around 10 years under BP 2750 GL. A number of these occurrence are in years when water levels were shown to be lower than 0.0m AHD under Baseline Conditions and as such, the risk of falling below this level has been reduced through the provision of additional environmental water.
The implementation of the variable water level regime as part of a lake operating strategy may have also contributed to the modelled water levels being close to the critical level of 0.0m AHD on a number of occasions (refer Appendix B). In reality, the majority of periods shown to be close to 0.0m AHD under BP 2750 GL are likely to be preventable by the adaptive management of barrage outflows and lake levels, as opposed to the strict application of a variable lake level regime.

26
4.3 Analysis of Salinity
Sections 4.1 and 4.2 both showed significant improvements in the magnitude of annual inflows to Lake Alexandrina, annual barrage outflows and minimum water levels. With BP 2750 GL there is potential to eliminate periods where water levels fall below the critical water levels of 0.0m AHD and -0.5m AHD at which point there is the potential for significant acidification issues. However, salinity is also a critical parameter for the assessment of ecosystem health in the Lower Lakes, as well as a measure of the magnitude of salt export.
As discussed in Section 3.1, the flow to salinity relationship (Heneker 2010) has been used to model and assess the salinity response in the Lower Lakes for each water recovery scenario. This has also allowed assessment over the longer period of 1895-96 to 2008-09, although results for both the MDBA assessment period (1975 to 2008-09) and the full modelled record are presented below in most cases.
4.3.1 Lake Alexandrina
Table 6 shows the salinity statistics for Lake Alexandrina under Baseline Conditions and BP 2750 GL. The mean and median annual salinity is reduced by around 200 EC and 100 EC respectively as a result of the additional flow through the lake and increased barrage discharge. The largest change is the reduction in maximum salinity, again confirming that the additional flow that BP 2750 GL may provide reduces the risk of elevated salinity as seen during the recent drought.
Table 6 Lake Alexandrina Salinity Statistics - Baseline Conditions vs BP 2750 GL
Lake Alexandrina Salinity (EC)
1975 to 2008-09 1895-96 to 2008-09 Statistics
Baseline BP 2750 GL Baseline BP 2750 GL
Mean 870 665 830 640
Median 725 615 755 615
Minimum 315 315 280 280
Maximum 3400 1555 3400 1555
10th Percentile 475 425 455 415
90th Percentile 1380 960 1265 890
Figure 19 compares the salinity in Lake Alexandrina under Baseline Conditions and BP 2750 GL for the period 1895-96 to 2008-09. Evident is the reduction of the significantly elevated salinity levels of the recent drought period, as well as the lowering of other peaks greater than 1000 EC under Baseline Conditions. Figure 20 provides this comparison for the MDBA assessment period (1975 to 2008-09).

27
0
200
400
600
800
1000
1200
1400
1600
1800
2000
2200
2400
2600
2800
3000
3200
3400
36001895
1899
1903
1907
1911
1915
1919
1923
1927
1931
1935
1939
1943
1947
1951
1955
1959
1963
1967
1971
1975
1979
1983
1987
1991
1995
1999
2003
2007
Lake
Alexandrina Salinity (EC)
Year
Baseline Conditions
2750 GL Water Recovery
Figure 19 Lake Alexandrina Salinity - Baseline Conditions vs BP 2750 GL (1895-96 to 2008-09)
0
200
400
600
800
1000
1200
1400
1600
1800
2000
2200
2400
2600
2800
3000
3200
3400
3600
1975 1976 1978 1980 1982 1984 1986 1988 1990 1992 1994 1996 1998 2000 2002 2004 2006 2008
Lake
Alexandrina Salinity (EC)
Year
2750 GL Water Recovery
Baseline Conditions
Figure 20 Lake Alexandrina Salinity - Baseline Conditions vs BP 2750 GL (1975 to 2008-09)

28
As discussed in Section 3.2, the EWRs developed by the South Australian Government specify critical salinity levels of 1000 EC and 1500 EC for ecological health. Figure 21 presents the daily frequency curve for salinity in Lake Alexandrina, which indicates a reduction from 25% to 5% in the number of days that salinity is likely to be greater than 1000 EC with BP 2750 GL.
0
200
400
600
800
1000
1200
1400
1600
1800
2000
2200
2400
2600
2800
3000
3200
3400
0 10 20 30 40 50 60 70 80 90 100
Lake
Alexandrina Salinity (EC)
% Days Salinity Greater than Indicated
Baseline Conditions (1895‐96 to 2008‐09)
2750 GL Water Recovery (1895‐96 to 2008‐09)
Figure 21 Daily Lake Alexandrina Salinity Frequency Curve - Baseline vs BP 2750 GL (1895-96 to 2008-09)
The reduction in the percentage of time that Lake Alexandrina is likely to experience higher salinity levels that are greater than both 1000 EC and 1500 EC under BP 2750 GL is shown in more detail in Table 7. It also shows that for each scenario, the time within each salinity range is generally similar for both the full modelled period from 1895-96 to 2008-09 and the MDBA assessment period from 1975 to 2008-09.
Table 7 Daily Lake Alexandrina Salinity within Critical Ranges - Baseline vs BP 2750 GL
Time within Salinity Range (%)
1975 to 2008-09 1895-96 to 2008-09 Salinity Range
Baseline BP 2750 GL Baseline BP 2750 GL
< 700 EC 46 67 42 66
700 - 1000 EC 33 24 35 29
1000 - 1500 EC 13 8 18 5
> 1500 EC 8 <1 5 <0.5
Table 8 presents the number and duration of those periods where the daily salinity in Lake Alexandrina exceeds both 1000 EC and 1500 EC under Baseline Conditions and BP 2750 GL for the period 1895-96 to 2008-09. The number of periods where the salinity is greater than

29
1000 EC and 1500 EC is reduced under BP 2750 GL and the duration of these higher salinity events is also reduced.
Table 8 Duration of Lake Alexandrina Salinity above Threshold Values - Baseline vs BP 2750 GL
(1895-96 to 2008-09)
Lake Alexandrina Salinity
Baseline BP 2750 GL Salinity
Threshold (EC) No. Periods
Mean Duration (days)
No. Periods Mean Duration
(days)
< 700 49 360 58 475
>700 49 490 58 240
> 1000 21 450 10 205
> 1500 7 280 1 90
* Note: A period with salinity >1500 EC is contained within a period of salinity >1000 EC and both are within a period
of salinity >700 EC.
Figure 22 shows the length of each of the events where the salinity in Lake Alexandrina exceeds 1500 EC under Baseline Conditions. Under BP 2750 GL there is only one period that is 90 days in length.
0
100
200
300
400
500
600
700
800
900
1000
1 2 3 4 5 6 7
Length of Period (days)
Period
Periods where Lake Alexandrina Salinity > 1500 EC ‐ Baseline Conditions (1895‐96 to 2008‐09)
Salinity > 1000 EC ‐ Baseline Conditions7 periods Meanduration ‐ 280 daysMedian duration ‐ 210 daysMaximum duration ‐ 915 days
Figure 22 Length of Periods with Lake Alexandrina Salinity > 1500 EC - Baseline Conditions
Figures 23 and 24 then show the length of each of the events where the salinity exceeds 1000 EC under Baseline Conditions and BP 2750 GL, again confirming the reduced number and length of these events.

30
0
200
400
600
800
1000
1200
1400
1600
1800
2000
2200
1 2 3 4 5 6 7 8 9 10 11 12 13 14 15 16 17 18 19 20 21
Length of Period (days)
Period
Periods where Lake Alexandrina Salinity > 1000 EC ‐ Baseline Conditions (1895‐96 to 2008‐09)
Salinity > 1000 EC ‐ Baseline Conditions21 periods Meanduration ‐ 450 daysMedian duration ‐ 305 daysMaximum duration ‐ 2015 days
Figure 23 Length of Periods with Lake Alexandrina Salinity > 1000 EC - Baseline Conditions
0
100
200
300
400
500
600
700
800
900
1000
1 2 3 4 5 6 7 8 9 10
Length of Period (days)
Period
Periods where Lake Alexandrina Salinity > 1000 EC ‐ 2750 GL Water Recovery (1895‐96 to 2008‐09)
Salinity > 1000 EC ‐ 2750 GL Water Recovery10 periods Meanduration ‐ 205 daysMedian duration ‐ 160 daysMaximum duration ‐ 945 days
Figure 24 Length of Periods with Lake Alexandrina Salinity > 1000 EC - BP 2750 GL

31
Table 9 shows that the percentage of years that the average annual salinity in Lake Alexandrina is greater than both 1000 EC and 1500 EC is reduced under BP 2750 GL.
Table 9 Annual Average Lake Alexandrina Salinity within Critical Ranges - Baseline vs BP 2750 GL
% Years with Annual Average Salinity within Range
1975-76 to 2008-09 1895-96 to 2008-09 Salinity Range
Baseline BP 2750 GL Baseline BP 2750 GL
< 700 EC 47 68 44 70
700 - 1000 EC 32 23 36 26
1000 - 1500 EC 12 9 15 4
> 1500 EC 9 0 5 0
Figure 25 presents the five-year annual rolling average of salinity in Lake Alexandrina under Baseline Conditions and BP 2750 GL. The current Limit of Acceptable Change under the RAMSAR definition for Lake Alexandrina states that this should be below 700 EC. Under Baseline Conditions, this value is often exceeded for extended periods whereas under BP 2750 GL it is likely that this criteria can be met more often.
0
200
400
600
800
1000
1200
1400
1600
1800
2000
1895‐96
1900‐01
1905‐06
1910‐11
1915‐16
1920‐21
1925‐26
1930‐31
1935‐36
1940‐41
1945‐46
1950‐51
1955‐56
1960‐61
1965‐66
1970‐71
1975‐76
1980‐81
1985‐86
1990‐91
1995‐96
2000‐01
2005‐06
5‐Year Rolling Average
Lake Alexandrina Salinity (EC)
Water Year
Baseline Conditions
2750 GL Water Recovery
Limit of Acceptable Change5‐Yr Annual Rolling Average ‐ 700 EC
Figure 25 Assessment of Limit of Acceptable Change (5-Yr Annual Rolling Average < 700 EC) - Baseline Conditions vs BP 2750 GL

32
4.3.2 Lake Albert
Salinity in Lake Albert is consistently and often significantly higher than that in Lake Alexandrina given the nature of their narrow connection. Table 10 presents salinity statistics for Lake Albert under Baseline Conditions and BP 2750 GL. As for Lake Alexandrina, the mean and median annual salinity is reduced, in this case by around 300 EC and 200 EC respectively. The reduction in maximum salinity is again most significant, with the additional flow under BP 2750 GL maintaining higher water levels and reducing the risk of disconnection and elevated salinity as seen during the recent drought.
Table 10 Lake Albert Salinity Statistics - Baseline Conditions vs BP 2750 GL
Lake Albert Salinity (EC)
1975 to 2008-09 1895-96 to 2008-09 Statistics
Baseline BP 2750 GL Baseline BP 2750 GL
Mean 1730 1385 1695 1375
Median 1480 1295 1550 1330
Minimum 1005 970 830 785
Maximum 8045 2850 8045 2850
10th Percentile 1185 1110 1210 1115
90th Percentile 2465 1775 2310 1685
Figure 26 compares the salinity in Lake Albert under Baseline Conditions and BP 2750 GL for the period 1895-96 to 2008-09. Evident is a reduction of the significantly elevated salinity levels of the recent drought period as well as the lowering of other peaks that are greater than 2000 EC under Baseline Conditions. However, the salinity in Lake Albert under BP 2750 GL is still likely to regularly exceed 1500 EC and approach 2000 EC. Figure 27 provides this comparison for the MDBA assessment period (1975 to 2008-09).

33
0
1000
2000
3000
4000
5000
6000
7000
8000
9000
1895
1899
1903
1907
1911
1915
1919
1923
1927
1931
1935
1939
1943
1947
1951
1955
1959
1963
1967
1971
1975
1979
1983
1987
1991
1995
1999
2003
2007
Lake
Albert Salinity (EC)
Year
Baseline Conditions
2750 GL Water Recovery
Figure 26 Lake Albert Salinity - Baseline Conditions vs BP 2750 GL (1895-96 to 2008-09)
0
1000
2000
3000
4000
5000
6000
7000
8000
9000
1975 1976 1978 1980 1982 1984 1986 1988 1990 1992 1994 1996 1998 2000 2002 2004 2006 2008
Lake
Albert Salinity (EC)
Year
2750 GL Water Recovery
Baseline Conditions
Figure 27 Lake Albert Salinity - Baseline Conditions vs BP 2750 GL (1975 to 2008-09)
Table 11 shows the percentage of time that the daily salinity in Lake Albert is likely to be within a number of defined critical ranges. These salinity ranges presented are higher than those to which the salinity in Lake Alexandrina was assessed, given the salinity relationship between the two lakes. There is a large decrease in the percentage of days that the salinity in Lake Albert is between 1500 EC and 2500 EC. In addition, the risk of extremely high salinity levels that are greater than 2500 EC is reduced, although not eliminated, under BP 2750 GL.

34
Table 11 Daily Lake Albert Salinity within Critical Ranges - Baseline Conditions vs BP 2750 GL
Time within Salinity Range (%)
1975 to 2008-09 1895-96 to 2008-09 Salinity Range
Baseline BP 2750 GL Baseline BP 2750 GL
< 1000 EC 0 2 1 2
1000 - 1500 EC 53 76 43 73
1500 - 2000 EC 29 16 36 22
2000 - 2500 EC 9 4 14 2
> 2500 EC 9 2 6 1
Table 12 presents the number and duration of those periods where the daily salinity in Lake Albert exceeds each of the threshold salinity levels from Table 11. The number and duration of periods where the salinity is greater than 1500 EC, 2000 EC, and 2500 EC are all significantly reduced. The number of periods less than 1000 EC increases with BP 2750 GL, which means that due to the salinity fluctuating around 1000 EC, there are a higher number of periods greater than 1000 EC, although the mean duration of each of these is less.
Table 12 Duration of Lake Albert Salinity above Threshold Values - Baseline vs BP 2750 GL
(1895-96 to 2008-09)
Lake Albert Salinity
Baseline BP 2750 GL Salinity
Threshold (EC) No. Periods
Mean Duration (days)
No. Periods Mean Duration
(days)
< 1000 2 140 8 105
>1000 3 13785 9 4530
> 1500 43 540 38 265
> 2000 23 360 6 180
> 2500 13 190 2 115
* Note: A period with salinity >2500 EC is contained within a period of salinity >2000 EC, both are within a period of
salinity >1500 EC and all are within a period of salinity > 1000 EC.
Figure 28 shows the length of each of the events where the salinity in Lake Albert exceeds 2500 EC under Baseline Conditions. Under BP 2750 GL there are only two events where the salinity is likely to exceed 2500 EC (durations of 145 and 90 days). Figures 29 and 30 then show the number and duration of events where the salinity is greater than 2000 EC under Baseline Conditions and BP 2750 GL, again highlighting the potential reduction in the extremely high salinity events.

35
0
100
200
300
400
500
600
700
800
900
1000
1 2 3 4 5 6 7 8 9 10 11 12 13
Length of Period (days)
Period
Periods where Lake Albert Salinity > 2500 EC ‐ Baseline Conditions (1895‐96 to 2008‐09)
Salinity > 2500 EC ‐ Baseline Conditions13 periods Meanduration ‐ 190 daysMedian duration ‐ 160 daysMaximum duration ‐ 935 days
Figure 28 Length of Periods with Lake Albert Salinity > 2500 EC - Baseline Conditions
0
200
400
600
800
1000
1200
1400
1600
1800
2000
2200
1 2 3 4 5 6 7 8 9 10 11 12 13 14 15 16 17 18 19 20 21 22 23
Length of Period (days)
Period
Periods where Lake Albert Salinity > 2000 EC ‐ Baseline Conditions (1895‐96 to 2008‐09)
Salinity > 2000 EC ‐ Baseline Conditions23 periods Meanduration ‐ 360 daysMedian duration ‐ 190 daysMaximum duration ‐ 2010 days
Figure 29 Length of Periods with Lake Albert Salinity > 2000 EC - Baseline Conditions

36
0
100
200
300
400
500
600
1 2 3 4 5 6
Length of Period (days)
Period
Periods where Lake Albert Salinity > 2000 EC ‐ 2750 GL Water Recovery (1895‐96 to 2008‐09)
Salinity > 2000 EC ‐ 2750 GL Water Recovery6 periods Meanduration ‐ 180 daysMedian duration ‐ 105 daysMaximum duration ‐ 560 days
Figure 30 Length of Periods with Lake Albert Salinity > 2000 EC - BP 2750 GL

37
4.3.3 Salt Export
The Commonwealth Water Act 2007 requires the Basin Plan to include a Water Quality and Salinity Management Plan, which must identify the key causes of water quality degradation in the Murray-Darling Basin, as well as contain water quality and salinity objectives and targets for the water resources across the Basin.
MDBA (2010a) stated that the Plan would build on existing frameworks including the Basin Salinity Management Strategy 2001-2015 (MDBC 2001) and include a Basin-wide target to export a long-term minimum of two million tonnes a year (10-year rolling average) of salt out of the Basin, which is necessary for the Basin to continue as a freshwater system. This salt-load target applies at the barrages and is based on the Basin Salinity Management Strategy target tonnage of 1.8 million tonnes per year with a 10% allowance for salt intrusion between Morgan and the barrages (MDBA 2010b).
In MDBA (2012), the salt export achieved under each of the Proposed Basin Plan water recovery scenarios is specified as a long term annual average rather than the 10-year rolling average specified in the Proposed Basin Plan. The long term annual average was estimated to be around 1.66 million tonnes per year under Baseline Conditions, increasing to 1.96 million tonnes under BP 2800 GL. The likely export value under BP 2750 GL would be expected to be similar but was not explicitly stated. These estimates were made by extending estimates of barrage outflow salinity to 1895-96 through the use of modelled outcomes for the MDBA salinity assessment period (1975 to 2008-09) with a comparison of flow conditions during this period and the long term period of 1895 to 2009.
By applying the daily salinity from 1895-96 until 2008-09 generated using the flow-salinity relationship of Heneker (2010) (refer Section 4.3.1) to daily barrage outflows, a separate estimate of both the long term annual average salt export and the annual salt export as a 10-year rolling average was made. For Baseline Conditions, the long term annual average was estimated at 1.58 million tonnes, increasing to 2.02 million tonnes under BP 2750 GL, which is comparable with the results presented in MDBA (2012). This does not however, reflect the salt export target expressed in the Proposed Basin Plan.
Figure 31 shows the estimated annual salt export expressed as a 10-year rolling average. Under Baseline Conditions the target of two million tonnes per year is rarely met. Under BP 2750 GL, this is improved; however, there are still extended periods where the desired salt export target is unlikely to be met. This highlights the unreliable nature of long term averages; that is, a long-term average may be satisfied but there may be periods where conditions may result in degradation.
The results presented in Figure 31 differ from those presented in the Guide (MDBA 2010a). It is understood that the barrage outflow salinity used to generate the salt export values in the Guide was generated using a constant value of 600 EC for the salinity of inflow to Lake Alexandrina. This simplification was originally part of an approach to estimate salt inflow to the model of the Coorong, which required data prior to the commencement of the MDBA assessment period (1975). While this assumption has little impact on the salinity results for the Coorong, it does mean that the salt export rates are over estimated during higher flow periods. During such periods, including the recent return to higher flow conditions, the salinity is likely to be lower than 600 EC. As such, the results presented in Figure 31 are likely to be more representative of the potential salt export under BP 2750 GL.

38
0
0.5
1
1.5
2
2.5
3
3.5
4
1904‐05
1909‐10
1914‐15
1919‐20
1924‐25
1929‐30
1934‐35
1939‐40
1944‐45
1949‐50
1954‐55
1959‐60
1964‐65
1969‐70
1974‐75
1979‐80
1984‐85
1989‐90
1994‐95
1999‐00
2004‐05
Salt Export (M
illion Tonnes\Yr, 10‐Yr Rolling Average)
Water Year
Baseline Conditions
2750 GL Water Recovery
Minimum Export Target
Figure 31 Salt Export through the Barrages (Million Tonnes per Year as 10-Year Rolling Average)
- Baseline Conditions vs BP 2750 GL

39
4.4 South Australian EWRs
An assessment of the South Australian EWRs for the CLLMM (as defined in Section 3.2) is presented in Table 13, which shows that:
under Baseline Conditions, an average salinity greater than 1000 EC is likely in Lake Alexandrina in 30% of years and greater than 1500 EC in 5% of years
BP 2750 GL reduces the likelihood of a 1000 EC exceedance to 5% of years, hence meeting the flow target for this EWR
the flow target for the 1500 EC EWR is not met in 2% of years under BP 2750 GL, with these two years occurring consecutively at the modelled period.
Figures 32 and 33 highlight the reduction in the number of years where 1000 EC is likely to be exceeded in Lake Alexandrina under BP 2750 GL.
Figures 34 and 35 then show that 1500 EC is unlikely to be exceeded under BP 2750 GL in any year except during a repeat of the recent drought.
4.4.1 Discussion
The results from Figures 32 and 33 suggest that in only four years over the full modelled record would the salinity be likely to exceed 1000 EC. However, the results in Section 4.3.1 indicated that there is potential for this to occur in up to ten years. This is likely to be due to the implementation of the intra-annually variable water level regime and its strictly implemented rules-based approach in BIGMOD.
The assumed operating regime for the Lower Lakes under which the flow regimes were specified to maintain salinity at less than 1000 EC and 1500 EC in Heneker (2010) was not the intra-annually variable level regime defined as an EWR, or used in the modelling for the Proposed Basin Plan. While some sensitivity testing was undertaken at the time the flow rules were developed, the operating strategy now proposed is significantly different, which results in a significantly altered water level and salinity response as shown in Appendix B.
As discussed in Section 4.2, the strict implementation of the variable water level regime as necessary in a modelling framework is likely to have resulted in lower than necessary and desirable water levels by the end of summer. The salinity peaks greater than 1000 EC that are not identified by evaluation of the EWR flow rules appear to occur due to these lower than necessary water levels. These levels appear to have been caused in part through the continuation of barrage releases early in the water year and hence drawing water levels lower than would occur in practice. It is likely that forecasts would have indicated limited water availability for those years and a more cautious approach would be taken in practice. As such, the evaluation of the flow regime as defined in the EWRs provides a good indication of the risk of Lake Alexandrina salinity exceeding specified levels, if the variable water level operating regime for the Lower Lakes is implemented in line with likely practice.

40
Table 13 Assessment of South Australian Environmental Water Requirements - Baseline vs 2750 GL Water Recovery
Target Environmental Water
Requirement Requirement Definition Baseline Target
2750 GL Scenario
Lower Lakes
Lake Alexandrina salinity
<1000 EC for 95% of all years
Barrage outflow
Greater of three targets:
1. 650 GL
2. 4000 GL – FX-1
3. 6000 GL – FX-1 – F*X-2 (where F*X-2 is min (FX-2, 2000 GL))
70% 95% 95%
Maintain desired ecological character of Lower Lakes through managing water quality
Lake Alexandrina salinity
<1500 EC for all years
Barrage outflow
Greater of three targets:
1. 650 GL
2. 4000 GL – FX-1
3. 6000 GL – FX-1 – F*X-2 (where F*X-2 is min (FX-2, 2000 GL))
95% 100% 98%
Coorong & Murray Mouth
Barrage outflow
6,000 GL/yr, 1 in 3 years 6,000 GL/yr 27% 33% 48%
Maintain current frequency of ecosystem states associated with high flows Barrage outflow
10,000 GL/yr, 1 in 7 years 10,000 GL/yr 10% 14% 18%
Legend
EWR improved but not met under scenario
EWR met under scenario

41
0
5000
10000
15000
20000
25000
30000
35000
40000
45000
1895‐96
1900‐01
1905‐06
1910‐11
1915‐16
1920‐21
1925‐26
1930‐31
1935‐36
1940‐41
1945‐46
1950‐51
1955‐56
1960‐61
1965‐66
1970‐71
1975‐76
1980‐81
1985‐86
1990‐91
1995‐96
2000‐01
2005‐06
Barrage
Outflow (G
L/year)
Water Year
1000 EC Target Deficit
Baseline Conditions Barrage Outflow
Figure 32 Additional Barrage Outflow for 1000 EC Target - Baseline Conditions
0
5000
10000
15000
20000
25000
30000
35000
40000
45000
1895‐96
1900‐01
1905‐06
1910‐11
1915‐16
1920‐21
1925‐26
1930‐31
1935‐36
1940‐41
1945‐46
1950‐51
1955‐56
1960‐61
1965‐66
1970‐71
1975‐76
1980‐81
1985‐86
1990‐91
1995‐96
2000‐01
2005‐06
Barrage
Outflow (G
L/year)
Water Year
1000 EC Target Deficit
2750 GL Water Recovery Barrage Outflow
Figure 33 Additional Barrage Outflow for 1000 EC Target - BP 2750 GL

42
0
5000
10000
15000
20000
25000
30000
35000
40000
45000
1895‐96
1900‐01
1905‐06
1910‐11
1915‐16
1920‐21
1925‐26
1930‐31
1935‐36
1940‐41
1945‐46
1950‐51
1955‐56
1960‐61
1965‐66
1970‐71
1975‐76
1980‐81
1985‐86
1990‐91
1995‐96
2000‐01
2005‐06
Barrage
Outflow (G
L/year)
Water Year
1500 EC Target Deficit
Baseline Conditions Barrage Outflow
Figure 34 Additional Barrage Outflow for 1500 EC Target - Baseline Conditions
0
5000
10000
15000
20000
25000
30000
35000
40000
45000
1895‐96
1900‐01
1905‐06
1910‐11
1915‐16
1920‐21
1925‐26
1930‐31
1935‐36
1940‐41
1945‐46
1950‐51
1955‐56
1960‐61
1965‐66
1970‐71
1975‐76
1980‐81
1985‐86
1990‐91
1995‐96
2000‐01
2005‐06
Barrage
Outflow (G
L/year)
Water Year
1500 EC Target Deficit
2750 GL Water Recovery Barrage Outflow
Figure 35 Additional Barrage Outflow for 1500 EC Target - BP 2750 GL

43
4.5 MDBA EWRs
An assessment of the MDBA defined EWRs for the CLLMM that are flow related or specifically for the Lower Lakes (as defined in Section 3.2) is presented in Table 14, which shows that:
Under Baseline Conditions neither of the barrage outflow targets are met.
BP 2750 GL provides enough flow to satisfy the three-year 2000 GL rolling average but not the three-year 1000 GL rolling average, indicating extreme salinity risks for the Coorong may potentially remain.
The 10-year rolling average flow target is met in 78% of years under Baseline Conditions. This improves to 99% of years under BP 2750 GL as shown in Figure 36. The MDBA have defined this as indicator of meeting the salt export target (two million tonnes per year as a 10-year rolling average). However, based on a comparison of the analysis in Section 4.3.3 and the results in Figure 36, it is likely an under estimation of the flow required to meet this target. This may be due in part to the assumptions regarding the salinity of barrage outflow that was prepared for the Guide to the Basin Plan (MDBA 2010a) as discussed in Section 4.3.3.
Under Baseline Conditions the water level in Lake Alexandrina and Lake Albert falls below 0.0m AHD in 6% of years, reducing to no years under BP 2750 GL. The sensitivity of this was discussed in Section 4.2.
0
2000
4000
6000
8000
10000
12000
14000
16000
1904‐05
1909‐10
1914‐15
1919‐20
1924‐25
1929‐30
1934‐35
1939‐40
1944‐45
1949‐50
1954‐55
1959‐60
1964‐65
1969‐70
1974‐75
1979‐80
1984‐85
1989‐90
1994‐95
1999‐00
2004‐05
Barrage
Outflow as 10
‐Yr Rolling Average
(GL)
Water Year
Baseline Conditions
2750 GL Water Recovery
Minimum Flow Target
Figure 36 Flow Target Representation of Salt Export through the Barrages
- Baseline Conditions vs BP 2750 GL

44
Table 14 Assessment of MDBA Environmental Water Requirements – Baseline Conditions vs 2750 GL Water Recovery
Target Environmental Water Requirement Notes Without
Development Baseline Target
2750 GL
Scenario
Lower Lakes
Salt export: Provide sufficient flows to
enable export of salt and nutrients from the
Basin through an open Murray Mouth
10 yr rolling average flow >3200 GL/yr in
100% of years
Flow target indicative of salt export
target of 2 million tonnes per year 100% 78% 100% 99%
Provide a variable lake level regime to
support a healthy and diverse riparian
vegetation community and avoid
acidification
Lake Albert and Lake Alexandrina water
levels >0.0m AHD in 100% of years 100% 94% 100% 100%
Coorong & Murray Mouth
Maximum salinity of 130 g/L in South
Lagoon of the Coorong 67 g/L 291 g/L 130 g/L 122 g/L
Maximum salinity in South Lagoon of
Coorong < 100 g/L in 95% of years 100% 82% 95% 96%
Maximum period of salinity > 130g/L in
South Lagoon of the Coorong 0 days 323 days 0 days 0 days
Maximum salinity of 50 g/L in North
Lagoon of the Coorong 50 g/L 148 g/L 50 g/L 59 g/L
Maximum period of salinity > 50g/L in
North Lagoon of the Coorong 0 days 148 days 0 days 91 days
Barrage outflow: long-term annual average
> 5100 GL/yr 11670 GL/yr 4860 GL/yr 5100 GL/yr 6830 GL/yr
Barrage outflow: 3-yr rolling average
>1000 GL/yr in 100% of years
Indicator of low flow conditions that may
have extreme salinity risks for Coorong 100% 94% 100% 99%
Maintain a range of health estuarine,
marine and hypersaline conditions in the
Coorong, including health populations of
keystone species such as Ruppia tuberosa
in South Lagoon and Ruppia megacarpa in
North Lagoon
Barrage outflow: 3-yr rolling average
>2000 GL/yr in 100% of years
Indicator of low flow conditions that may
have salinity risk for Coorong 100% 79% 95% 98%
Legend
EWR met under scenario
EWR improved but not met under scenario

45
5. Sensitivity Analysis - 2400 GL and 3200 GL Water Recovery
The analysis below tests the sensitivity of the water recovery volume in providing outcomes for the Lower Lakes. Results of the Baseline Conditions model run are compared with those of BP 2400 GL, BP 2750 GL, and BP 3200 GL. As for the results presented in Section 4, this analysis was carried out at an annual timescale.
5.1 Analysis of Flow Regime
A summary of the annual flow statistics for Lake Alexandrina inflow and barrage outflow is shown in Table 15. BP 2400 GL reduces the mean barrage outflow by around 300 GL/year, while BP 3200 GL increases this measure by approximately the same amount. Given the stress on the Lower Lakes during low flow periods, the increase in the minimum annual Lake Alexandrina inflow and barrage outflow, particularly under BP 3200 GL may provide significant benefits.
Table 15 Lake Alexandrina Inflow Statistics - Baseline Conditions vs BP 2750 GL, BP 2400 GL and BP 3200 GL (1895-96 to 2008-09)
Lake Inflow (GL) Statistics
Baseline BP 2400 GL BP 2750 GL BP 3200 GL
Mean 5685 7335 7650 7960
Median 3945 5975 6310 6490
Minimum 530 1045 1125 1625
Maximum 42125 43500 43690 43930
10th Percentile 1420 2390 2395 2685
90th Percentile 10460 12395 12725 13120
Table 16 Barrage Outflow Statistics - Baseline Conditions vs BP 2750 GL, BP 2400 GL and BP 3200 GL (1895-96 to 2008-09)
Barrage Outflow (GL) Statistics
Baseline BP 2400 GL BP 2750 GL BP 3200 GL
Mean 4860 6515 6830 7140
Median 3155 5140 5490 5650
Minimum 0 275 450 785
Maximum 41215 42605 42800 43045
10th Percentile 570 1515 1600 1890
90th Percentile 9520 11515 11880 12290
The increase and decrease in the statistics of BP 2400 GL and BP 3200 GL in comparison to BP 2750 GL in Table 15 does not always translate into similar variations at an annual timescale. That is, the annual barrage outflow does not always increase from BP 2400 GL to BP 2750 GL, nor from BP 2750 GL to BP 3200 GL. This is shown in Figures 37 and 38. In most years there is an increase in barrage outflow for the increase in water recovered; however in some years the annual barrage outflow reduces. This is likely to result from differing decisions with respect to the allocation of environmental water allocations during the demand sequence generation (refer Appendix A). With reduced water availability under BP 2400 GL some watering events

46
upstream of South Australia that provided inflow to the Lower Lakes under BP 2750 GL, may not now be possible to deliver. Hence the water is held back or used for another purpose. Conversely, BP 3200 GL may provide enough water for additional watering events upstream of South Australia, which reduces the volume reaching the Lower Lakes.
‐400
‐200
0
200
400
600
800
1000
1200
1400
1600
1895‐96
1900‐01
1905‐06
1910‐11
1915‐16
1920‐21
1925‐26
1930‐31
1935‐36
1940‐41
1945‐46
1950‐51
1955‐56
1960‐61
1965‐66
1970‐71
1975‐76
1980‐81
1985‐86
1990‐91
1995‐96
2000‐01
2005‐06
Difference in Barrage
Outflow (GL/year)
Water Year
Change in Barrage Outflow ‐ 2400 GL to 2750 GL Water Recovery
Figure 37 Change in Barrage Outflow - BP 2400 GL to BP 2750 GL
‐400
‐200
0
200
400
600
800
1000
1200
1400
1600
1895‐96
1900‐01
1905‐06
1910‐11
1915‐16
1920‐21
1925‐26
1930‐31
1935‐36
1940‐41
1945‐46
1950‐51
1955‐56
1960‐61
1965‐66
1970‐71
1975‐76
1980‐81
1985‐86
1990‐91
1995‐96
2000‐01
2005‐06
Difference in Barrage
Outflow (GL/year)
Water Year
Change in Barrage Outflow ‐ 2750 GL to 3200 GL Water Recovery
Figure 38 Change in Barrage Outflow - BP 2750 GL to BP 3200 GL
Figure 39 shows that barrage outflow frequency curves for all three water recovery scenarios are very similar.
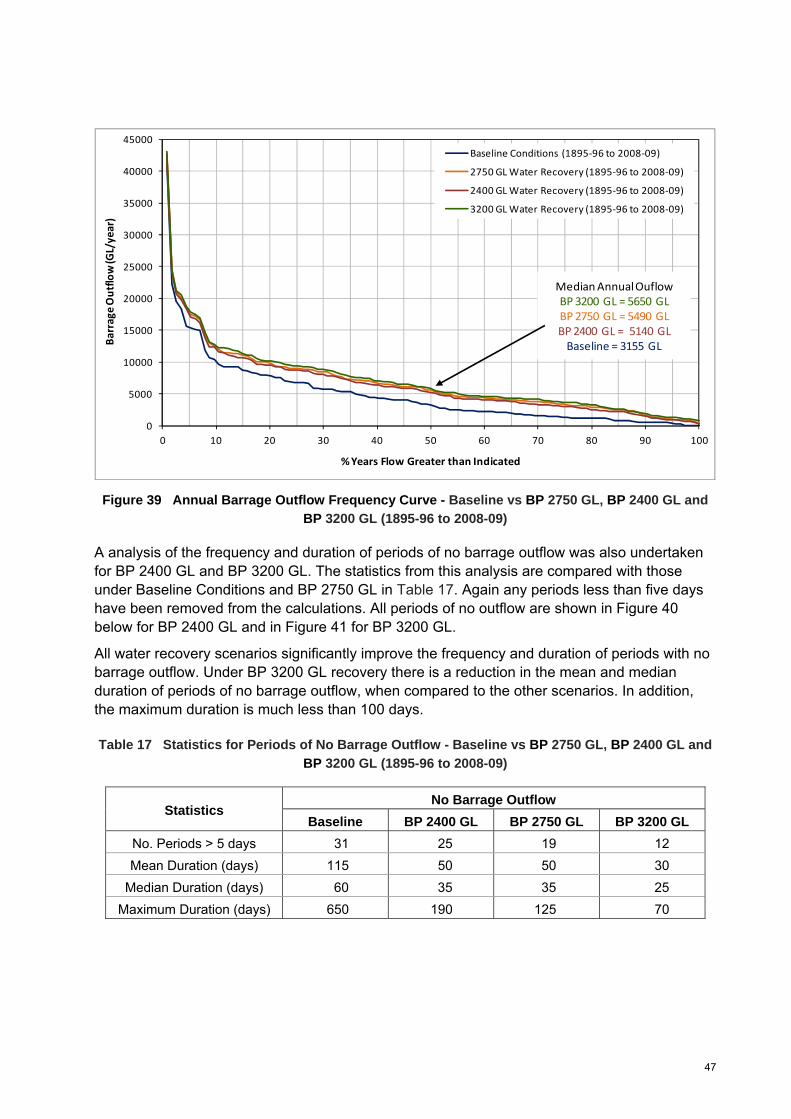
47
0
5000
10000
15000
20000
25000
30000
35000
40000
45000
0 10 20 30 40 50 60 70 80 90 100
Barrage
Outflow (G
L/year)
% Years Flow Greater than Indicated
Baseline Conditions (1895‐96 to 2008‐09)
2750 GL Water Recovery (1895‐96 to 2008‐09)
2400 GL Water Recovery (1895‐96 to 2008‐09)
3200 GL Water Recovery (1895‐96 to 2008‐09)
Median Annual OuflowBP 3200 GL = 5650 GL BP 2750 GL = 5490 GLBP 2400 GL = 5140 GLBaseline = 3155 GL
Figure 39 Annual Barrage Outflow Frequency Curve - Baseline vs BP 2750 GL, BP 2400 GL and BP 3200 GL (1895-96 to 2008-09)
A analysis of the frequency and duration of periods of no barrage outflow was also undertaken for BP 2400 GL and BP 3200 GL. The statistics from this analysis are compared with those under Baseline Conditions and BP 2750 GL in Table 17. Again any periods less than five days have been removed from the calculations. All periods of no outflow are shown in Figure 40 below for BP 2400 GL and in Figure 41 for BP 3200 GL.
All water recovery scenarios significantly improve the frequency and duration of periods with no barrage outflow. Under BP 3200 GL recovery there is a reduction in the mean and median duration of periods of no barrage outflow, when compared to the other scenarios. In addition, the maximum duration is much less than 100 days.
Table 17 Statistics for Periods of No Barrage Outflow - Baseline vs BP 2750 GL, BP 2400 GL and
BP 3200 GL (1895-96 to 2008-09)
No Barrage Outflow Statistics
Baseline BP 2400 GL BP 2750 GL BP 3200 GL
No. Periods > 5 days 31 25 19 12
Mean Duration (days) 115 50 50 30
Median Duration (days) 60 35 35 25
Maximum Duration (days) 650 190 125 70

48
0
20
40
60
80
100
120
140
160
180
200
1 2 3 4 5 6 7 8 9 10 11 12 13 14 15 16 17 18 19 20 21 22 23 24 25 26 27 28 29
Length of Period (days)
Period
Periods of No Barrage Outflow ‐ 2400 GL Water Recovery (1895‐96 to 2008‐09)
NoBarrage Outflow ‐ 2400 GL Water Recovery25 sequences > 5 daysMeanduration ‐ 50 daysMedian duration ‐ 35 daysMaximum duration ‐ 190 days
Figure 40 Length of Periods of No Barrage Outflow - BP 2400 GL
0
10
20
30
40
50
60
70
80
1 2 3 4 5 6 7 8 9 10 11 12 13
Length of Period (days)
Period
Periods of No Barrage Outflow ‐ 3200 GL Water Recovery (1895‐96 to 2008‐09)
NoBarrage Outflow ‐ 3200 GL Water Recovery12 periods > 5 daysMeanduration ‐ 30 daysMedian duration ‐ 25 daysMaximum duration ‐ 70 days
Figure 41 Length of Periods of No Barrage Outflow - BP 3200 GL

49
An analysis of the distribution of periods of no barrage outflow across the modelled record was also undertaken under BP 2400 GL and BP 3200 GL and is shown in Figures 42 and 43 respectively. As for the Baseline Conditions and BP 2750 GL, there are often multiple periods of no barrage outflow within selected 10 year periods.
1895
1899
1903
1907
1911
1915
1919
1923
1927
1931
1935
1939
1943
1947
1951
1955
1959
1963
1967
1971
1975
1979
1983
1987
1991
1995
1999
2003
2007
Year
Periods of No Barrage Outflow ‐ 2400 GL Water Recovery
Figure 42 Periods of No Barrage Outflow – BP 2400 GL
1895
1899
1903
1907
1911
1915
1919
1923
1927
1931
1935
1939
1943
1947
1951
1955
1959
1963
1967
1971
1975
1979
1983
1987
1991
1995
1999
2003
2007
Year
Periods of No Barrage Outflow ‐ 3200 GL Water Recovery
Figure 43 Periods of No Barrage Outflow – BP 3200 GL

50
Tables 18 and 19 list the periods of no barrage outflow that are greater than 30 days under BP 2400 GL and BP 3200 GL respectively. As for BP 2750 GL, under BP 2400 GL there are some cases where there are only a small number of days between these periods, which indicates that the no flow period may actually be longer and in practice may encompass one or two separate periods.
Table 18 Periods of No Barrage Outflow (>30 Days) – BP 2400 GL (1895-96 to 2008-09)
No Barrage Outflow
Period Length (days) 01/1900 - 03/1900 56
06/1901 - 07/1901 47
06/1902 - 07/1902 54
01/1903 - 04/1903 92
01/1915 - 04/1915 93
01/1920 - 05/1920 123
06/1920 - 07/1920 34
02/1968 - 03/1968 35
01/1983 - 03/1983 46
12/2006 - 04/2007 107
06/2007 - 07/2007 40
01/2008 - 05/2008 126
06/2008 - 08/2008 86
12/2008 - 06/2009 187
Table 19 Periods of No Barrage Outflow (>30 Days) – BP 3200 GL (1895-96 to 2008-09)
No Barrage Outflow
Period Length (days) 01/1900 - 03/1900 54
01/1920 - 03/1920 59
06/1920 - 07/1920 34
06/2008 - 08/2008 70
06/2009 - 06/2009 30
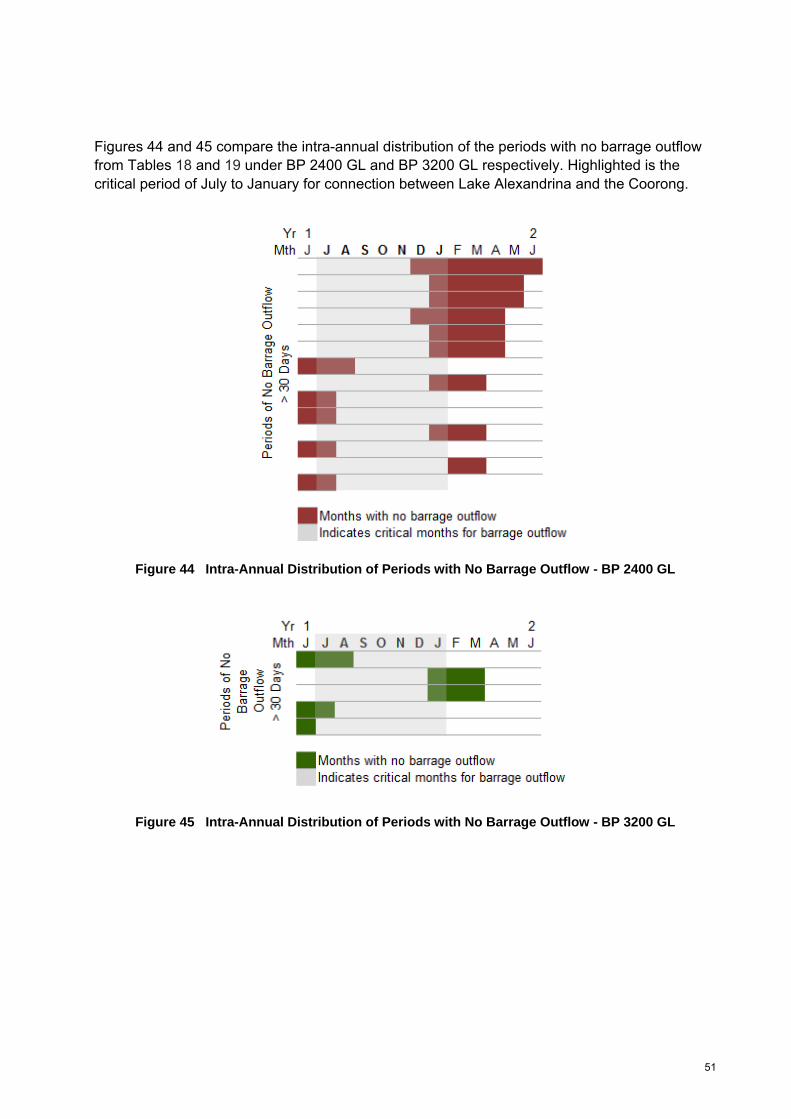
51
Figures 44 and 45 compare the intra-annual distribution of the periods with no barrage outflow from Tables 18 and 19 under BP 2400 GL and BP 3200 GL respectively. Highlighted is the critical period of July to January for connection between Lake Alexandrina and the Coorong.
Figure 44 Intra-Annual Distribution of Periods with No Barrage Outflow - BP 2400 GL
Figure 45 Intra-Annual Distribution of Periods with No Barrage Outflow - BP 3200 GL

52
5.2 Analysis of Water Level Variation
As discussed in Section 4.2, a variable water level regime similar to that proposed in Lester et al. (2011b) has been incorporated by the MDBA into BIGMOD and was used in all Basin Plan model runs. This variation is shown in Figures 46 and 47 for BP 2400 GL and BP 3200 GL respectively. Under BP 3200 GL, water levels do not fall quite as low as under BP 2400 GL.
0
0.1
0.2
0.3
0.4
0.5
0.6
0.7
0.8
0.9
1
1.1
1.2
1895
1899
1903
1907
1911
1915
1919
1923
1927
1931
1935
1939
1943
1947
1951
1955
1959
1963
1967
1971
1975
1979
1983
1987
1991
1995
1999
2003
2007
Water Level (m AHD)
Year
2400 GL Water Recovery
Figure 46 Water Level Variation - BP 2400 GL

53
0
0.1
0.2
0.3
0.4
0.5
0.6
0.7
0.8
0.9
1
1.1
1.21895
1899
1903
1907
1911
1915
1919
1923
1927
1931
1935
1939
1943
1947
1951
1955
1959
1963
1967
1971
1975
1979
1983
1987
1991
1995
1999
2003
2007
Water Level (m AHD)
Year
3200 GL Water Recovery
Figure 47 Water Level Variation - BP 3200 GL
In comparison with Baseline Conditions, the results in Table 20 show a steady increase in the minimum water level with increasing water recovery. Under all water recovery scenarios there are no periods where the water level falls below 0.0m AHD and none show the extremely low water level events that occurred during the recent drought.
Table 20 Water Level Statistics - Baseline vs BP 2750 GL, BP 2400 GL and BP 3200 GL (1895-96 to 2008-09)
Statistics Baseline BP 2400 GL BP 2750 GL BL 3200 GL
Minimum Level (m AHD) -0.50 0.02 0.10 0.15
No. Events < 0.0m AHD 6 0 0 0
No. Events < -0.5m AHD 1 0 0 0
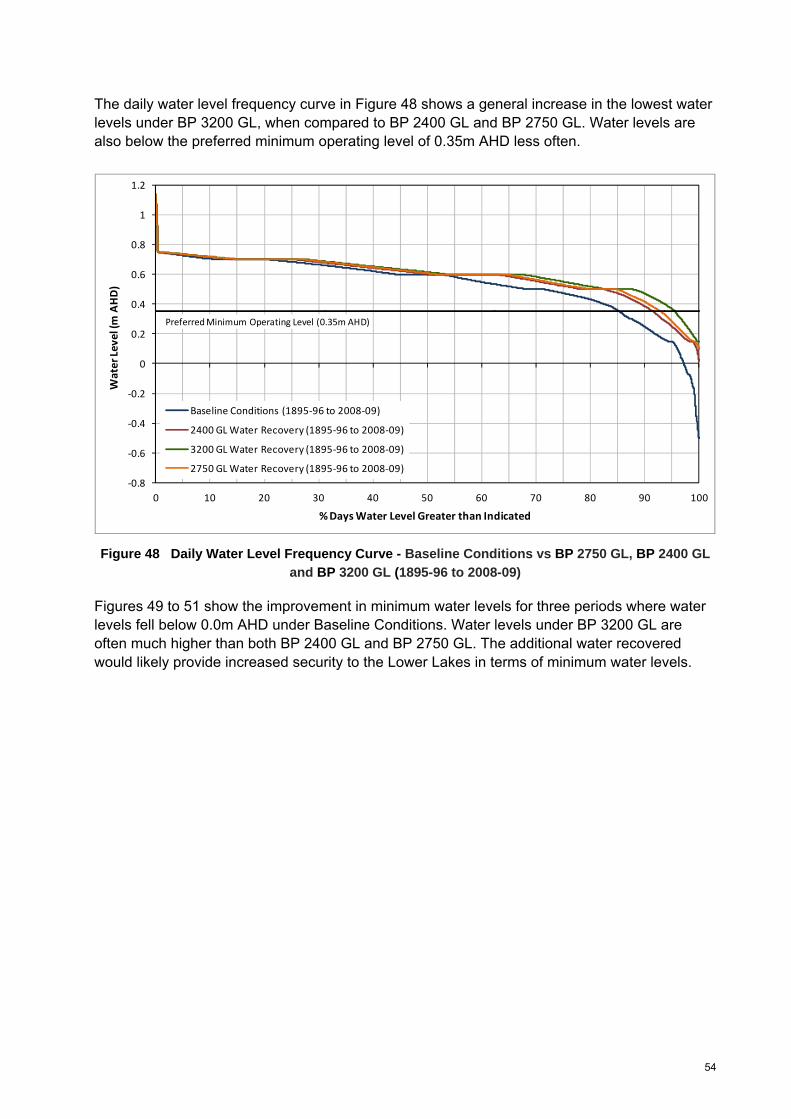
54
The daily water level frequency curve in Figure 48 shows a general increase in the lowest water levels under BP 3200 GL, when compared to BP 2400 GL and BP 2750 GL. Water levels are also below the preferred minimum operating level of 0.35m AHD less often.
‐0.8
‐0.6
‐0.4
‐0.2
0
0.2
0.4
0.6
0.8
1
1.2
0 10 20 30 40 50 60 70 80 90 100
Water Level (m
AHD)
% Days Water Level Greater than Indicated
Baseline Conditions (1895‐96 to 2008‐09)
2400 GL Water Recovery (1895‐96 to 2008‐09)
3200 GL Water Recovery (1895‐96 to 2008‐09)
2750 GL Water Recovery (1895‐96 to 2008‐09)
Preferred Minimum Operating Level (0.35m AHD)
Figure 48 Daily Water Level Frequency Curve - Baseline Conditions vs BP 2750 GL, BP 2400 GL and BP 3200 GL (1895-96 to 2008-09)
Figures 49 to 51 show the improvement in minimum water levels for three periods where water levels fell below 0.0m AHD under Baseline Conditions. Water levels under BP 3200 GL are often much higher than both BP 2400 GL and BP 2750 GL. The additional water recovered would likely provide increased security to the Lower Lakes in terms of minimum water levels.

55
‐0.6
‐0.5
‐0.4
‐0.3
‐0.2
‐0.1
0
0.1
0.2
0.3
0.4
0.5
0.6
0.7
0.8
0.9
07/1900 07/1901 07/1902 07/1903 07/1904
Water Level (m AHD)
Date (month, year)
Baseline Conditions
2750 GL Water Recovery
2400 GL Water Recovery
3200 GL Water Recovery
Figure 49 Water Level Variation - Baseline Conditions vs BP 2750 GL, BP 2400 GL and BP 3200 GL (1900-01 to 1904-05)
‐0.6
‐0.5
‐0.4
‐0.3
‐0.2
‐0.1
0
0.1
0.2
0.3
0.4
0.5
0.6
0.7
0.8
0.9
07/1911 07/1912 07/1913 07/1914 07/1915 07/1916
Water Level (m
AHD)
Date (month, year)
Baseline Conditions
2750 GL Water Recovery
2400 GL Water Recovery
3200 GL Water Recovery
Figure 50 Water Level Variation - Baseline Conditions vs BP 2750 GL, BP 2400 GL and
BP 3200 GL (1911-12 to 1916-17)

56
‐0.6
‐0.5
‐0.4
‐0.3
‐0.2
‐0.1
0
0.1
0.2
0.3
0.4
0.5
0.6
0.7
0.8
0.9
07/2004 07/2005 07/2006 07/2007 07/2008
Water Level (m AHD)
Date (month, year)
Baseline Conditions
2750 GL Water Recovery
2400 GL Water Recovery
3200 GL Water Recovery
Figure 51 Water Level Variation - Baseline Conditions vs BP 2750 GL, BP 2400 GL and BP 3200 GL (2004-05 to 2008-09)
Consideration of the potential impact of an over estimation of around 0.2m per year during low inflow periods (Section 2.3), leads to the following:
As under BP 2750 GL, it is unlikely that water levels would fall below -0.5m AHD with either BP 2400 GL or BP 3200 GL.
There is potential for water levels to fall below 0.0m AHD in around 15 to 20 years under BP 2400 GL, reducing to around 10 years under BP 3200 GL. However, as discussed in Section 4.2 for BP 2750 GL, in practice it is likely that the majority of periods below 0.0m AHD would likely be preventable by the adaptive management of barrage outflow and lake level, particularly with the additional flows under BP 3200 GL.

57
5.3 Analysis of Salinity
Sections 5.1 and 5.2 both showed significant improvements in the magnitude of annual inflows to Lake Alexandrina, annual barrage outflows, and minimum water levels. BP 3200 GL in particular has the potential to significantly reduce the number and duration of periods with no barrage outflow. These improvements will have a consequential effect on the salinity in Lake Alexandrina and Lake Albert.
As in Section 4.3 the flow to salinity relationship (Heneker 2010) has been used to model and assess the salinity response in the Lower Lakes for each water recovery scenario, allowing an assessment over the full period from 1895-96 to 2008-09.
5.3.1 Lake Alexandrina
Table 21 shows the salinity statistics for Lake Alexandrina under Baseline Conditions and each of water recovery scenarios. There is a general decrease in all statistics with increasing water recovery as a result of the additional flow through the lake and increased barrage outflow. The almost 200 EC reduction in the maximum salinity under BP 3200 GL in comparison to BP 2750 GL also confirms that the increased flow further reduces the risk of the elevated salinity levels seen during the recent drought.
Table 21 Lake Alexandrina Salinity Statistics - Baseline vs BP 2750 GL, BP 2400 GL and BP 3200 GL (1895-96 to 2008-09)
Lake Alexandrina Salinity (EC) Statistics
Baseline BP 2400 GL BP 2750 GL BP 3200 GL
Mean 830 660 640 625
Median 755 630 615 600
Minimum 280 280 280 280
Maximum 3400 1885 1555 1380
10th Percentile 455 420 415 405
90th Percentile 1265 930 890 865
Figure 52 compares the salinity in Lake Alexandrina under BP 2400 GL and BP 2750 GL for the period 1895-96 to 2008-09. While the salinity time-series are very similar, the peak salinity during drier periods is higher due to the lower barrage outflows under the 2400 GL scenario.
Figure 53 then compares the salinity in Lake Alexandrina under BP 2750 GL and BP 3200 GL for the same period. Again the salinity time-series are very similar; however, the peak salinity during drier periods is further reduced by the additional inflow and barrage outflow available with BP 3200 GL.

58
0
200
400
600
800
1000
1200
1400
1600
1800
2000
1895
1899
1903
1907
1911
1915
1919
1923
1927
1931
1935
1939
1943
1947
1951
1955
1959
1963
1967
1971
1975
1979
1983
1987
1991
1995
1999
2003
2007
Lake
Alexandrina Salinity (EC)
Year
2400 GL Water Recovery
2750 GL Water Recovery
Figure 52 Lake Alexandrina Salinity - BP 2400 GL vs BP 2750 GL (1895-96 to 2008-09)
0
200
400
600
800
1000
1200
1400
1600
1895
1899
1903
1907
1911
1915
1919
1923
1927
1931
1935
1939
1943
1947
1951
1955
1959
1963
1967
1971
1975
1979
1983
1987
1991
1995
1999
2003
2007
Lake
Alexandrina Salinity (EC)
Year
2750 GL Water Recovery
3200 GL Water Recovery
Figure 53 Lake Alexandrina Salinity - BP 2750 GL vs BP 3200 GL (1895-96 to 2008-09)

59
As discussed in Section 3.2, 1000 EC and 1500 EC are critical salinity levels for ecological health. Figure 54 presents the daily frequency curve for salinity in Lake Alexandrina, which shows very similar results for each of the water recovery scenarios, except at the higher salinity levels. Figure 55 highlights the reduction in salinity for the highest 5% of values, including no days greater than 1500 EC under BP 3200 GL.
0
200
400
600
800
1000
1200
1400
1600
1800
2000
2200
2400
2600
2800
3000
3200
3400
0 10 20 30 40 50 60 70 80 90 100
Lake
Alexandrina Salinity (EC)
% Days Salinity Greater than Indicated
Baseline Conditions (1895‐96 to 2008‐09)
2400 GL Water Recovery (1895‐96 to 2008‐09)
3200 GL Water Recovery (1895‐96 to 2008‐09)
2750 GL Water Recovery (1895‐96 to 2008‐09)
Figure 54 Daily Lake Alexandrina Salinity Frequency Curve - Baseline vs BP 2750 GL, BP 2400 GL and BP 3200 GL (1895-96 to 2008-09)
0
200
400
600
800
1000
1200
1400
1600
1800
2000
2200
2400
2600
2800
3000
3200
3400
0 1 2 3 4 5 6 7 8 9 10 11 12 13 14 15 16 17 18 19 20
Lake
Alexandrina Salinity (EC)
% Days Salinity Greater than Indicated
Baseline Conditions (1895‐96 to 2008‐09)
2400 GL Water Recovery (1895‐96 to 2008‐09)
3200 GL Water Recovery (1895‐96 to 2008‐09)
2750 GL Water Recovery (1895‐96 to 2008‐09)
Figure 55 Daily Lake Alexandrina Salinity Frequency Curve (0 to 20% Salinity Exceedance)
- Baseline vs BP 2750 GL, BP 2400 GL and BP 3200 GL (1895-96 to 2008-09)

60
The percentage of time that Lake Alexandrina is likely to experience higher salinity levels that are greater than both 1000 EC and 1500 EC under each of the water recovery scenarios is shown in more detail in Table 22. Consistent with the results presented so far, there is a decrease in the occurrence of periods within the higher salinity ranges with increasing water recovery.
Table 22 Daily Lake Alexandrina Salinity within Critical Ranges - Baseline vs BP 2750 GL,
BP 2400 GL and BP 3200 GL (1895-96 to 2008-09)
Time within Salinity Range (%) Salinity Range
Baseline BP 2400 GL BP 2750 GL BP 3200 GL
< 700 EC 42 63 66 70
700 - 1000 EC 35 30 29 27
1000 - 1500 EC 18 6 5 3
> 1500 EC 5 1 <0.5 0
Table 23 presents the number and duration of periods where the daily salinity in Lake Alexandrina exceeds both 1000 EC and 1500 EC under Baseline Conditions and each of the water recovery scenarios for the period 1895-96 to 2008-09. The number of periods when the salinity is greater than 1000 EC and 1500 EC is progressively reduced with increasing water recovery, and the duration of the higher salinity events is also reduced.
Table 23 Duration of Salinity in Lake Alexandrina above Threshold Values - Baseline vs BP 2750 GL, BP 2400 GL and BP 3200 GL (1895-96 to 2008-09)
Lake Alexandrina Salinity
Baseline BP 2400 GL BP 2750 GL BP 3200 GL Salinity Threshold
(EC) No. Periods
Mean Duration
(days)
No. Periods
Mean Duration
(days)
No. Periods
Mean Duration
(days)
No. Periods
Mean Duration
(days)
< 700 49 360 58 455 58 475 55 525
>700 49 490 58 265 58 240 55 230
> 1000 21 450 12 235 10 205 8 175
> 1500 7 280 2 165 1 90 0 0
* Note: A period with salinity >1500 EC is contained within a period of salinity >1000 EC and both are within a period
of salinity >700 EC.
Figures 56 and 57 show the length of each of the events where the salinity in Lake Alexandrina exceeds 1000 EC under BP 2400 GL and BP 3200 GL. Under BP 2750 GL, there were 10 periods with a mean duration of 205 days and a maximum duration of 945 days. BP 3200 GL has the potential to reduce the number of periods above 1000 EC but more importantly, to reduce the mean and maximum durations.
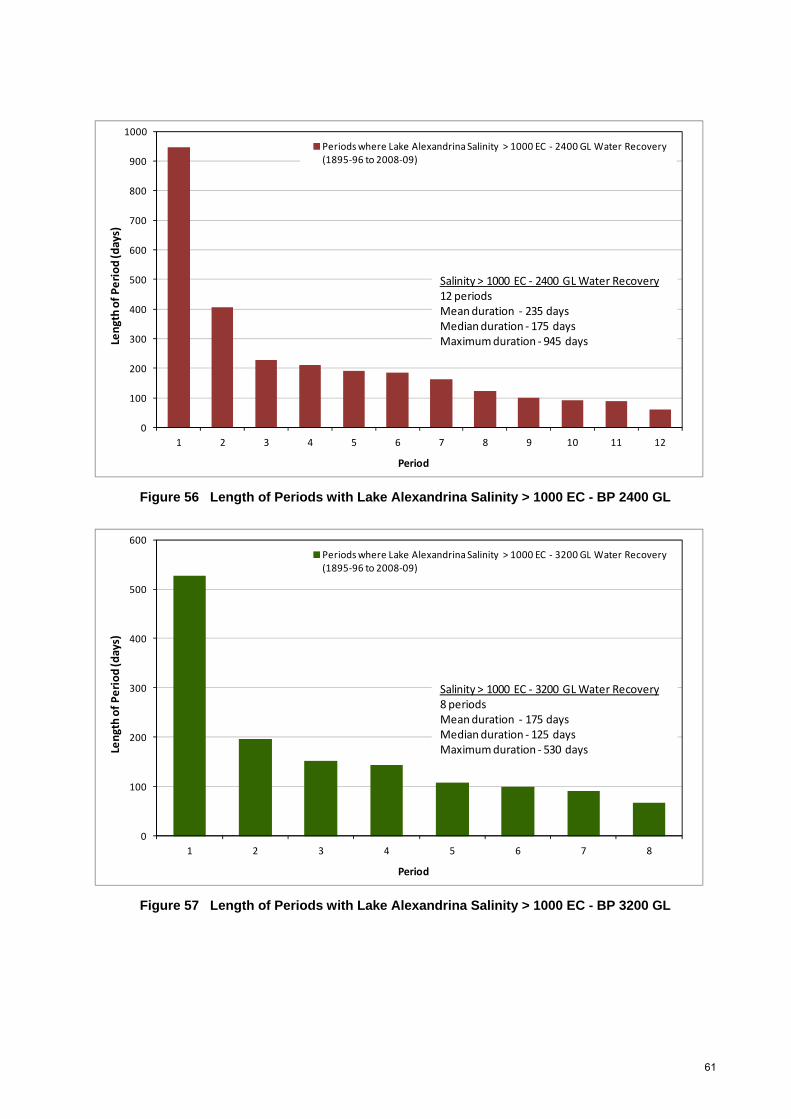
61
0
100
200
300
400
500
600
700
800
900
1000
1 2 3 4 5 6 7 8 9 10 11 12
Length of Period (days)
Period
Periods where Lake Alexandrina Salinity > 1000 EC ‐ 2400 GL Water Recovery (1895‐96 to 2008‐09)
Salinity > 1000 EC ‐ 2400 GL Water Recovery12 periods Meanduration ‐ 235 daysMedian duration ‐ 175 daysMaximum duration ‐ 945 days
Figure 56 Length of Periods with Lake Alexandrina Salinity > 1000 EC - BP 2400 GL
0
100
200
300
400
500
600
1 2 3 4 5 6 7 8
Length of Period (days)
Period
Periods where Lake Alexandrina Salinity > 1000 EC ‐ 3200 GL Water Recovery (1895‐96 to 2008‐09)
Salinity > 1000 EC ‐ 3200 GL Water Recovery8 periods Meanduration ‐ 175 daysMedian duration ‐ 125 daysMaximum duration ‐ 530 days
Figure 57 Length of Periods with Lake Alexandrina Salinity > 1000 EC - BP 3200 GL

62
Table 24 shows that the percentage of years that the average annual salinity in Lake Alexandrina is greater than both 1000 EC and 1500 EC progressively reduces with increasing water recovery.
Table 24 Annual Average Lake Alexandrina Salinity within Critical Ranges - Baseline vs BP 2750 GL, BP 2400 GL and BP 3200 GL (1895-96 to 2008-09)
% Years with Annual Average Salinity within Range Salinity Range
Baseline BP 2400 GL BP 2750 GL BP 3200 GL
< 700 EC 44 68 70 74
700 - 1000 EC 36 26 26 25
1000 - 1500 EC 15 5 4 2
> 1500 EC 5 1 0 0
Figure 58 presents the five-year annual rolling average of salinity in Lake Alexandrina under Baseline Conditions and each of the water recovery scenarios. The current Limit of Acceptable Change under the RAMSAR definition for Lake Alexandrina states that this should be below 700 EC. Under Baseline Conditions, this value is often exceeded for extended periods. Under each water recovery scenario it is likely that this criteria can be met more often, particularly under BP 3200 GL, although there is little difference with BP 2750 GL.
0
200
400
600
800
1000
1200
1400
1600
1800
2000
1895‐96
1900‐01
1905‐06
1910‐11
1915‐16
1920‐21
1925‐26
1930‐31
1935‐36
1940‐41
1945‐46
1950‐51
1955‐56
1960‐61
1965‐66
1970‐71
1975‐76
1980‐81
1985‐86
1990‐91
1995‐96
2000‐01
2005‐06
5‐Year Rolling Average
Lake Alexandrina Salinity (EC)
Water Year
Baseline Conditions
2750 GL Water Recovery
2400 GL Water Recovery
3200 GL Water Recovery
Limit of Acceptable Change5‐Yr Annual Rolling Average ‐ 700 EC
Figure 58 Assessment of Limit of Acceptable Change (5-Yr Annual Rolling Average < 700 EC)
- Baseline vs BP 2750 GL, BP 2400 GL and BP 3200 GL

63
5.3.2 Lake Albert
Table 25 presents salinity statistics for Lake Albert under Baseline Conditions, and each of the water recovery scenarios. There is a 30 EC decrease in the mean salinity and around a 300 EC decrease in the maximum salinity with increasing water recovery.
Table 25 Lake Albert Salinity Statistics - Baseline vs BP 2750 GL, BP 2400 GL and BP 3200 GL (1895-96 to 2008-09)
Lake Albert Salinity (EC) Statistics
Baseline BP 2400 GL BP 2750 GL BP 3200 GL
Mean 1695 1405 1375 1345
Median 1550 1355 1330 1310
Minimum 830 795 785 780
Maximum 8045 3270 2850 2510
10th Percentile 1210 1125 1115 1100
90th Percentile 2310 1735 1685 1630
Figure 59 compares the salinity in Lake Albert under BP 2400 GL and BP 2750 GL for the period 1895-96 to 2008-09. While the salinity time-series are very similar, the peak salinity during drier periods is higher due to the lower barrage outflows under BP 2400 GL.
Figure 60 then compares the salinity in Lake Albert under BP 2750 GL and BP 3200 GL for the same period. Again the salinity time-series are very similar; however, the peak salinity during drier periods is further reduced under BP 3200 GL.
0
500
1000
1500
2000
2500
3000
3500
1895
1899
1903
1907
1911
1915
1919
1923
1927
1931
1935
1939
1943
1947
1951
1955
1959
1963
1967
1971
1975
1979
1983
1987
1991
1995
1999
2003
2007
Lake
Albert Salinity (EC)
Year
2400 GL Water Recovery
2750 GL Water Recovery
Figure 59 Lake Albert Salinity - BP 2400 GL vs BP 2750 GL (1895-96 to 2008-09)

64
0
500
1000
1500
2000
2500
3000
1895
1899
1903
1907
1911
1915
1919
1923
1927
1931
1935
1939
1943
1947
1951
1955
1959
1963
1967
1971
1975
1979
1983
1987
1991
1995
1999
2003
2007
Lake
Albert Salinity (EC)
Year
2750 GL Water Recovery
3200 GL Water Recovery
Figure 60 Lake Albert Salinity - BP 2750 GL vs BP 3200 GL (1895-96 to 2008-09)
Table 26 shows the percentage of time that the daily salinity in Lake Albert is likely to be within a number of defined critical salinity ranges. There is little difference between the results for the three water recovery scenarios, other than a gradual decrease in the occurrence and duration of higher salinity levels. However, the potential elimination of periods of salinity greater than 2500 EC in Lake Albert under BP 3200 GL may be of higher importance than the small percentage change suggests.
Table 26 Daily Lake Albert Salinity within Critical Ranges - Baseline vs BP 2750 GL, BP 2400 GL and BP 3200 GL
Time within Salinity Range (%) Salinity Range
Baseline BP 2400 GL BP 2750 GL BP 3200 GL
< 1000 EC 1 2 2 2
1000 - 1500 EC 43 70 73 77
1500 - 2000 EC 36 25 22 20
2000 - 2500 EC 14 2 2 1
> 2500 EC 6 1 1 <0.1
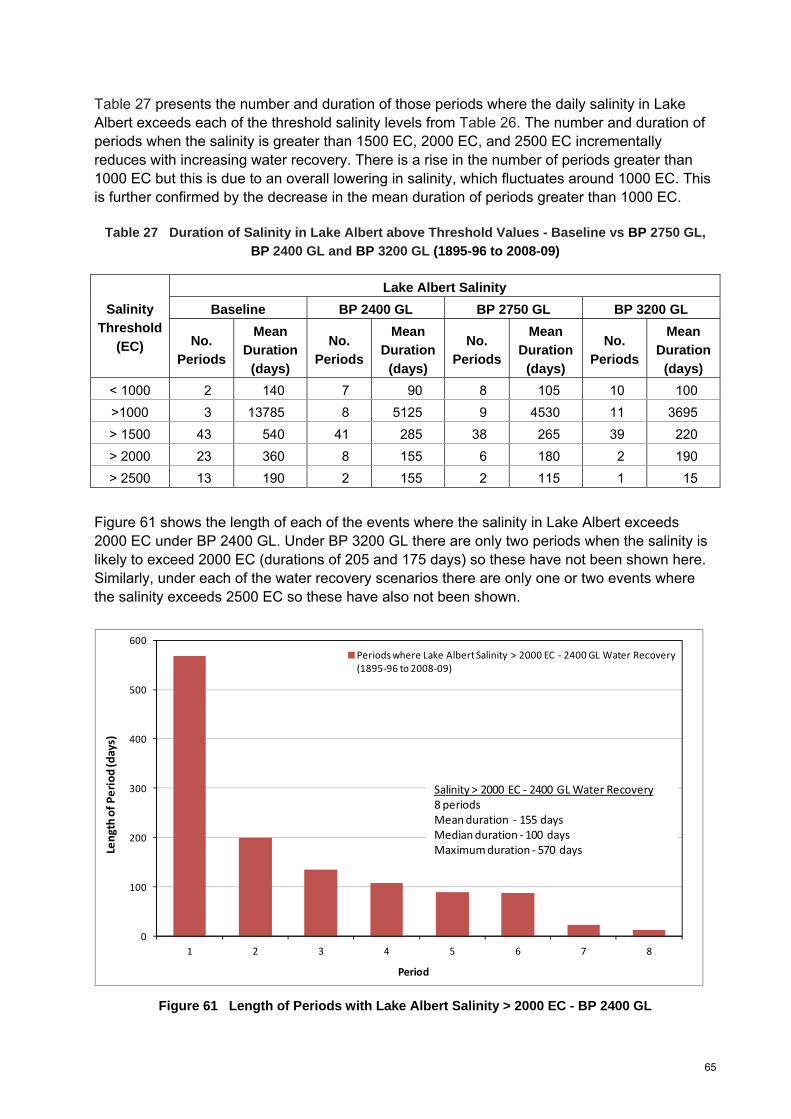
65
Table 27 presents the number and duration of those periods where the daily salinity in Lake Albert exceeds each of the threshold salinity levels from Table 26. The number and duration of periods when the salinity is greater than 1500 EC, 2000 EC, and 2500 EC incrementally reduces with increasing water recovery. There is a rise in the number of periods greater than 1000 EC but this is due to an overall lowering in salinity, which fluctuates around 1000 EC. This is further confirmed by the decrease in the mean duration of periods greater than 1000 EC.
Table 27 Duration of Salinity in Lake Albert above Threshold Values - Baseline vs BP 2750 GL, BP 2400 GL and BP 3200 GL (1895-96 to 2008-09)
Lake Albert Salinity
Baseline BP 2400 GL BP 2750 GL BP 3200 GL Salinity Threshold
(EC) No. Periods
Mean Duration
(days)
No. Periods
Mean Duration
(days)
No. Periods
Mean Duration
(days)
No. Periods
Mean Duration
(days)
< 1000 2 140 7 90 8 105 10 100
>1000 3 13785 8 5125 9 4530 11 3695
> 1500 43 540 41 285 38 265 39 220
> 2000 23 360 8 155 6 180 2 190
> 2500 13 190 2 155 2 115 1 15
Figure 61 shows the length of each of the events where the salinity in Lake Albert exceeds 2000 EC under BP 2400 GL. Under BP 3200 GL there are only two periods when the salinity is likely to exceed 2000 EC (durations of 205 and 175 days) so these have not been shown here. Similarly, under each of the water recovery scenarios there are only one or two events where the salinity exceeds 2500 EC so these have also not been shown.
0
100
200
300
400
500
600
1 2 3 4 5 6 7 8
Length of Period (days)
Period
Periods where Lake Albert Salinity > 2000 EC ‐ 2400 GL Water Recovery (1895‐96 to 2008‐09)
Salinity > 2000 EC ‐ 2400 GL Water Recovery8 periods Meanduration ‐ 155 daysMedian duration ‐ 100 daysMaximum duration ‐ 570 days
Figure 61 Length of Periods with Lake Albert Salinity > 2000 EC - BP 2400 GL
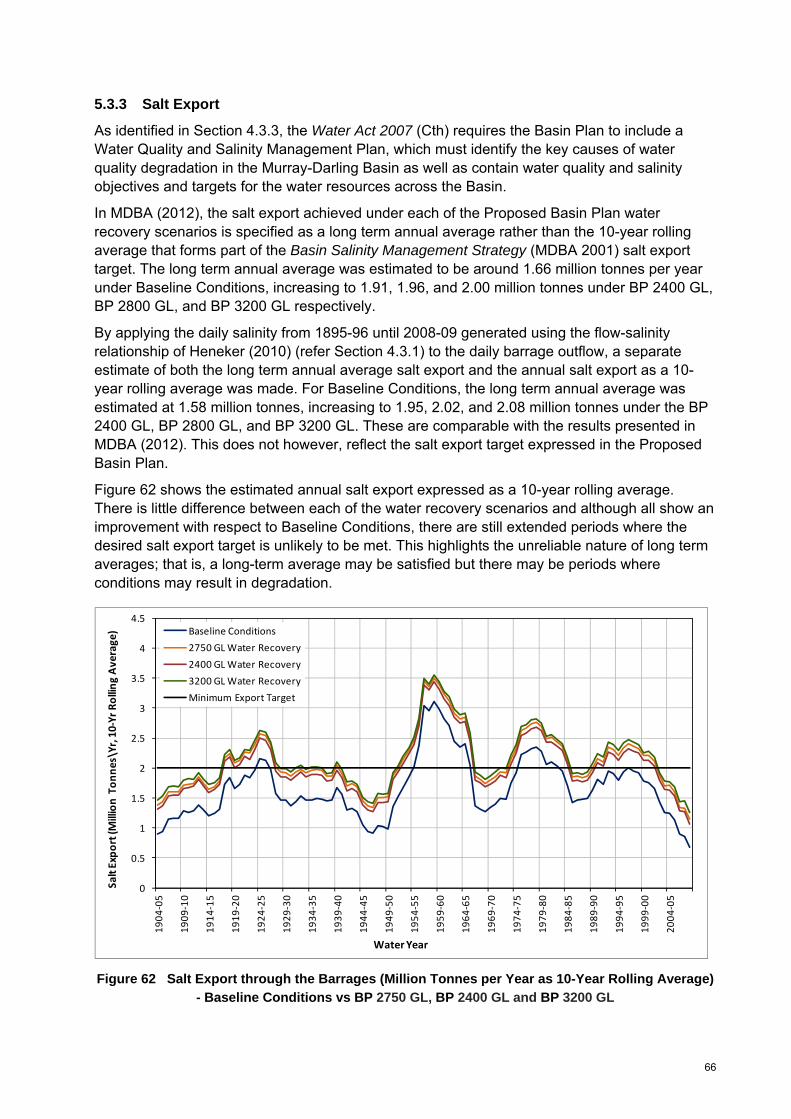
66
5.3.3 Salt Export
As identified in Section 4.3.3, the Water Act 2007 (Cth) requires the Basin Plan to include a Water Quality and Salinity Management Plan, which must identify the key causes of water quality degradation in the Murray-Darling Basin as well as contain water quality and salinity objectives and targets for the water resources across the Basin.
In MDBA (2012), the salt export achieved under each of the Proposed Basin Plan water recovery scenarios is specified as a long term annual average rather than the 10-year rolling average that forms part of the Basin Salinity Management Strategy (MDBA 2001) salt export target. The long term annual average was estimated to be around 1.66 million tonnes per year under Baseline Conditions, increasing to 1.91, 1.96, and 2.00 million tonnes under BP 2400 GL, BP 2800 GL, and BP 3200 GL respectively.
By applying the daily salinity from 1895-96 until 2008-09 generated using the flow-salinity relationship of Heneker (2010) (refer Section 4.3.1) to the daily barrage outflow, a separate estimate of both the long term annual average salt export and the annual salt export as a 10-year rolling average was made. For Baseline Conditions, the long term annual average was estimated at 1.58 million tonnes, increasing to 1.95, 2.02, and 2.08 million tonnes under the BP 2400 GL, BP 2800 GL, and BP 3200 GL. These are comparable with the results presented in MDBA (2012). This does not however, reflect the salt export target expressed in the Proposed Basin Plan.
Figure 62 shows the estimated annual salt export expressed as a 10-year rolling average. There is little difference between each of the water recovery scenarios and although all show an improvement with respect to Baseline Conditions, there are still extended periods where the desired salt export target is unlikely to be met. This highlights the unreliable nature of long term averages; that is, a long-term average may be satisfied but there may be periods where conditions may result in degradation.
0
0.5
1
1.5
2
2.5
3
3.5
4
4.5
1904‐05
1909‐10
1914‐15
1919‐20
1924‐25
1929‐30
1934‐35
1939‐40
1944‐45
1949‐50
1954‐55
1959‐60
1964‐65
1969‐70
1974‐75
1979‐80
1984‐85
1989‐90
1994‐95
1999‐00
2004‐05
Salt Export (M
illion Tonnes\Yr, 10‐Yr Rolling Average)
Water Year
Baseline Conditions
2750 GL Water Recovery
2400 GL Water Recovery
3200 GL Water Recovery
Minimum Export Target
Figure 62 Salt Export through the Barrages (Million Tonnes per Year as 10-Year Rolling Average) - Baseline Conditions vs BP 2750 GL, BP 2400 GL and BP 3200 GL

67
5.4 South Australian EWRs
An assessment of the South Australian EWRs for the CLLMM (as defined in Section 3.2) is presented in Table 28, which shows that:
under BP 2400 GL an average salinity greater than 1000 EC is likely in Lake Alexandrina in 10% of years and greater than 1500 EC in 3% of years, meeting neither of the flow targets for this EWR.
BP 3200 GL reduces the likelihood of a 1000 EC exceedance to 4% of years, hence meeting the flow target for this EWR and improving on the results under BP 2750 GL
the flow target for the 1500 EC EWR is not met in 3% of years under BP 2400 GL, reducing to 1% of years under BP 3200 GL..
Figures 63 and 64 show the number of years where 1000 EC and 1500 EC respectively is likely to be exceeded in Lake Alexandrina under BP 2400 GL. These figures show an increase in the number of years over the full modelled record that salinity is likely to exceed 1000 EC under BP 2400 GL when compared to BP 2750 GL.
Figures 65 and 66 then show an improvement in the number of years that 1000 EC and 1500 EC are likely to be exceeded in Lake Alexandrina under BP 3200 GL.
As for BP 2750 GL (Section 4.4), there are some differences between the number of years over the full modelled period that salinity would be likely to exceed 1000 EC under BP 2400 GL and BP 3200 GL when comparing the flow regime EWRs to the modelled salinity values. As discussed in Section 4.4.1, this is likely to be due to the implementation of the intra-annually variable water level regime and its strictly implemented rules-based approach in BIGMOD. Therefore, evaluation of the flow regime EWRs provides a good indication of the risk of Lake Alexandrina salinity exceeding specified levels, if the variable water level operating regime for the Lower Lakes is implemented in line with likely practice.

68
Table 28 Assessment of South Australian Environmental Water Requirements - Baseline vs 2750, 2400 and 3200 GL Water Recovery
Target Environmental Water
Requirement Requirement Definition Baseline Target
2400 GL Scenario
2750 GL Scenario
3200 GL Scenario
Lower Lakes
Lake Alexandrina salinity
<1000 EC for 95% of all years
Barrage outflow
Greater of three targets:
1. 650 GL
2. 4000 GL – FX-1
3. 6000 GL – FX-1 – F*X-2 (where F*X-2 is min (FX-2, 2000 GL))
70% 95% 90% 95% 96%
Maintain desired ecological character of Lower Lakes
through managing water quality
Lake Alexandrina salinity
<1500 EC for all years
Barrage outflow
Greater of three targets:
1. 650 GL
2. 4000 GL – FX-1
3. 6000 GL – FX-1 – F*X-2 (where F*X-2 is min (FX-2, 2000 GL))
95% 100% 97% 98% 99%
Coorong & Murray Mouth
Barrage outflow
6,000 GL/yr, 1 in 3 years 6,000 GL/yr 27% 33% 44% 48% 49%
Maintain current frequency of ecosystem states
associated with high flows
Barrage outflow
10,000 GL/yr, 1 in 7 years 10,000 GL/yr 10% 14% 17% 18% 20%
Legend
EWR improved but not met under scenario
EWR met under scenario

69
0
5000
10000
15000
20000
25000
30000
35000
40000
45000
1895‐96
1900‐01
1905‐06
1910‐11
1915‐16
1920‐21
1925‐26
1930‐31
1935‐36
1940‐41
1945‐46
1950‐51
1955‐56
1960‐61
1965‐66
1970‐71
1975‐76
1980‐81
1985‐86
1990‐91
1995‐96
2000‐01
2005‐06
Barrage
Outflow (G
L/year)
Water Year
1000 EC Target Deficit
2400 GL Water Recovery Barrage Outflow
Figure 63 Additional Barrage Outflow for 1000 EC Target - BP 2400 GL
0
5000
10000
15000
20000
25000
30000
35000
40000
45000
1895‐96
1900‐01
1905‐06
1910‐11
1915‐16
1920‐21
1925‐26
1930‐31
1935‐36
1940‐41
1945‐46
1950‐51
1955‐56
1960‐61
1965‐66
1970‐71
1975‐76
1980‐81
1985‐86
1990‐91
1995‐96
2000‐01
2005‐06
Barrage
Outflow (G
L/year)
Water Year
1500 EC Target Deficit
2400 GL Water Recovery Barrage Outflow
Figure 64 Additional Barrage Outflow for 1500 EC Target - BP 2400 GL

70
0
5000
10000
15000
20000
25000
30000
35000
40000
45000
1895‐96
1900‐01
1905‐06
1910‐11
1915‐16
1920‐21
1925‐26
1930‐31
1935‐36
1940‐41
1945‐46
1950‐51
1955‐56
1960‐61
1965‐66
1970‐71
1975‐76
1980‐81
1985‐86
1990‐91
1995‐96
2000‐01
2005‐06
Barrage
Outflow (G
L/year)
Water Year
1000 EC Target Deficit
3200 GL Water Recovery Barrage Outflow
Figure 65 Additional Barrage Outflow for 1000 EC Target - BP 3200 GL
0
5000
10000
15000
20000
25000
30000
35000
40000
45000
1895‐96
1900‐01
1905‐06
1910‐11
1915‐16
1920‐21
1925‐26
1930‐31
1935‐36
1940‐41
1945‐46
1950‐51
1955‐56
1960‐61
1965‐66
1970‐71
1975‐76
1980‐81
1985‐86
1990‐91
1995‐96
2000‐01
2005‐06
Barrage
Outflow (G
L/year)
Water Year
1500 EC Target Deficit
3200 GL Water Recovery Barrage Outflow
Figure 66 Additional Barrage Outflow for 1500 EC Target - BP 3200 GL

71
5.5 MDBA EWRs
An assessment of the MDBA defined EWRs for the CLLMM that are flow related or specifically for the Lower Lakes (as defined in Section 3.2) is presented in Table 29, which shows that:
Under BP 2400 GL the three-year 1000 GL rolling average barrage outflow target is not met, indicating extreme salinity risks for the Coorong may potentially remain. The three-year 2000 GL rolling average target is met, but at a higher level of risk than under BP 2750 GL.
BP 3200 GL is likely to provide enough flow to satisfy both the three-year 1000 GL and 2000 GL rolling average targets, reducing the risk of extreme salinity events in the Lower Lakes.
The 10-year rolling average flow target is met in 97% of years under BP 2400 GL, increasing to 99% of years under BP 3200 GL. There is little difference between the water recovery scenarios as shown in Figure 67. The MDBA have defined this as indicator of meeting the salt export target (two million tonnes per year as a 10-year rolling average). However, based on a comparison of the analysis in Section 5.3.3 and the results in Figure 67, it is likely an under-estimation of the flow required to meet this target. This may be due in part to the assumptions regarding the salinity of barrage outflow that was prepared for the Guide to the Basin Plan (MDBA 2010a) as discussed previously in Section 4.3.3.
Under all three water recovery scenarios, the risk of water levels in Lake Alexandrina and Lake Albert falling below 0.0m AHD is significantly reduced, with no modelled occurrences. The sensitivity of this was discussed in Section 4.2.
0
2000
4000
6000
8000
10000
12000
14000
16000
1904‐05
1909‐10
1914‐15
1919‐20
1924‐25
1929‐30
1934‐35
1939‐40
1944‐45
1949‐50
1954‐55
1959‐60
1964‐65
1969‐70
1974‐75
1979‐80
1984‐85
1989‐90
1994‐95
1999‐00
2004‐05
Barrage
Outflow as 10
‐Yr Rolling Average
(GL)
Water Year
Baseline Conditions
2750 GL Water Recovery
2400 GL Water Recovery
3200 GL Water Recovery
Minimum Flow Target
Figure 67 Flow Target Representation of Salt Export through the Barrages - Baseline Conditions vs BP 2750 GL, BP 2400 GL and BP 3200 GL

72
Table 29 Assessment of MDBA Environmental Water Requirements - Baseline vs 2750, 2400 and 3200 GL Water Recovery
Target Environmental Water
Requirement* Notes Baseline Target
2400 GL
Scenario
2750 GL
Scenario
3200 GL
Scenario
Lower Lakes
Salt export: Provide sufficient
flows to enable export of salt and
nutrients from the Basin through
an open Murray Mouth
10 yr rolling average flow >3200 GL/yr
in 100% of years
Flow target indicative of salt
export target of 2 million tonnes
per year
78% 100% 97% 99% 99%
Provide a variable lake level
regime to support a healthy and
diverse riparian vegetation
community and avoid acidification
Lake Albert and Lake Alexandrina
water levels >0m AHD in 100% of
years
94% 100% 100% 100% 100%
Coorong & Murray Mouth
Maximum salinity of 130 g/L in
Coorong South Lagoon 291 g/L 130 g/L 138 g/L 122 g/L 97 g/L
Maximum salinity in South Lagoon of
Coorong < 100 g/L in 95% of years 82% 95% 95% 96% 100%
Maximum period of salinity > 130g/L in
South Lagoon of the Coorong 323 days 0 days 64 days 0 days 0 days
Maximum salinity of 50 g/L in North
Lagoon of the Coorong 148 g/L 50 g/L 75 g/L 59 g/L 47 g/L
Maximum period of salinity > 50g/L in
North Lagoon of the Coorong 148 days 0 days 163 days 91 days 0 days
Barrage outflow: long-term annual
average > 5100 GL/yr 4860 GL/yr 5100 GL/yr 6515 GL/yr 6830 GL/yr 7140 GL/yr
Barrage outflow: 3-yr rolling average
>1000 GL/yr in 100% of years 94% 100% 99% 99% 100%
Maintain a range of health
estuarine, marine and
hypersaline conditions in the
Coorong, including health
populations of keystone species
such as Ruppia tuberosa in
South Lagoon and Ruppia
megacarpa in North Lagoon
Barrage outflow: 3-yr rolling average
>2000 GL/yr in 100% of years
Indicator of low flow conditions
that may have extreme salinity
risks for Coorong 79% 95% 96% 98% 99%
Legend
EWR improved but not met under scenario
EWR met under scenario

73
6. Ecological Assessment
The key findings of Lester et al. (2011a; 2011b) provide the basis for this ecological analysis. An assessment of the ecological implications has been undertaken using the following metrics:
maximum salinity in Lake Alexandrina of ~1000 and 1500 μS cm-1EC
maintenance of average daily water level in Lake Alexandrina between 0.35 and 0.85m AHD
periods of no barrage flow do not exceed 3 years in duration, preferably less than 1 year.
6.1 Periods of No Barrage Outflow
6.1.1 Baseline Conditions and 2750 GL Water Recovery
A considerable number of periods of no barrage outflow occur under Baseline Conditions, which prevents connectivity between the Lower Lakes and Coorong. The maximum duration of one of these events was 650 days, which is less than the threshold that would significantly risk populations of diadromous fish species such as Congolli in the region and macroinvertebrate species based on Lester et al. (2011a). However, the timing of this event is at the end of the modelled period and midway through a drought sequence that extended for another year.
The significance of this event as modelled is that given the duration, it would have posed increased risk to populations such as Congolli, Common galaxias, and lamprey dependent upon access to freshwater and marine habitats as a key component of their life-history. Lester et al. (2011a) indicated that if periods of closure were less than three years, species such as Congolli would likely to be able to persist as would macroinvertebrates.
BP 2750 GL indicated a significant reduction in the duration (maximum duration reducing from almost two years to approximately 4 months) and the frequency of no barrage outflow events (from 31 to 19 events) reducing the effect of these events on diadromous fish and their ability to access freshwater and marine habitats as well as macroinvertebrates.
One key point for further consideration is that there are only a small number of days between some of the periods of barrage closure identified under both Baseline Conditions and BP 2750 GL indicating that the no flow periods may actually be in effect, longer than indicated in the analysis. In practice, two separate periods may in fact essentially be a single period. Specific examples under Baseline Conditions include those events beginning in 1944, 2006 and 2007. The latter would result in an event of at least 941 days, increasing the risk further that impacts would reasonably be expected to manifest in macroinvertebrate biota of the Coorong and diadromous fish species. Similarly, under BP 2750 GL, the events occurring in 2008 could essentially be considered a single event, but the combined event length of 194 days is significantly less than one year.
While fish passage will be utilised by the Lower Murray fish community at any time during the year, the period between June and February each year is the priority period for provision of upstream and downstream fish passage for diadromous species (Lester et al. 2011a). An examination of the timing of the barrage closure events for the baseline conditions indicates that fish passage would have been affected in at least 17 years, primarily affecting Congolli (both upstream and downstream migration and the upstream migration of lampreys that occurs in winter each year Lester et al. 2011a).
74
An examination of the timing of the barrage closure events for BP 2750 GL indicates improvement, such that none of the events that do occur are within the priority period. Impacts on the downstream migration of Congolli and upstream migration of lamprey would still occur in some years (1901/02, 1920/21, 2007/08, 2008/09) while the upstream migration of species such as Congolli could be affected in 2006/07 with barrage closure occurring from December of that year. This is indicatively much less than under the Baseline and a sizeable improvement. The 2006/07-2008/09 period would appear to be a significant risk to connectivity under BP 2750 GL.
6.1.2 Sensitivity Analysis - 2400 GL and 3200 GL Water Recovery
The analysis of the frequency and duration of periods of no barrage outflow undertaken for BP 2400 GL and BP 3200 GL shows periods of no flow are sensitive to the recovery volume. All water recovery scenarios significantly improve the frequency and duration of periods with no barrage outflow. Under BP 2400 GL, the mean and median duration of periods of no barrage outflow remain the same as for BP 2750 GL, although the maximum duration and number of events increases relative to BP 2750 GL. The duration of these events would appear to have limited effect on migratory fish biota and macroinvertebrates given the duration is significantly less than one year. Under BP 3200 GL there is a reduction in the mean and median duration of periods of no barrage outflow, when compared to the other scenarios. In addition, the maximum duration is much less than 125 days observed under BP 2750 GL.
Similarly to Baseline Conditions and BP 2750 GL scenarios, the number of days between some of the periods of barrage closure identified under BP 2400 GL are such that two separate periods may in fact essentially be a single period, for example the events occurring in 1920 and 2008. The later would result in an event of at least 212 days.
An examination of the timing of the barrage closure events for BP 2400 GL indicates that fish passage would have been affected in at least 13 years. An examination of the timing of the barrage closure events for the 3200GL scenario indicates improvement relative to BP 2750 GL in that only four events occur that would affect fish passage.
6.1.3 Implications of Periods of No Barrage Outflow
For barrage flows, most of the fish indicators were not found in the Coorong and/or were not estuary-dependent, but for those that were, Average Recurrence Intervals (ARIs) > 5 for the return of barrage flows tended to result in populations for which persistence was possible, but such a long time without connection and exchange would put the majority of these species at risk (e.g. bony herring, mulloway and small-mouthed hardyhead). As for ARIs for flooding water levels in the Lakes, trade-offs for water levels in the Coorong were not assessed. Again, this was due to the likely dependence of fish indicators on the linked effect of water quality variables and dependence on littoral and riparian vegetation.
6.2 Water Level Variation
6.2.1 Baseline Conditions and 2750 GL Water Recovery
Under Baseline Conditions, water levels in the Lower Lakes fall below the target minimum ecological level (0.35m AHD) and the level identified as elevated risk of whole of water body acidification. Given water levels fall to below 0.35m AHD, submerged aquatic vegetation would be affected through desiccation, while the relatively complex riparian vegetation around the lake margins used by cryptic bird species, macroinvertebrates and fish would be largely separated from the water body, impacting on the ecology of the Lakes, It is likely that given lake levels recede below 0.0m AHD, localised areas of increased acidification hazard could result

75
potentially requiring localised management actions as undertaken in the region during the recent drought, specifically the later period of 2008-2010.
Under BP 2750 GL, there is a reduction in the number of periods where lake levels recede below 0.35m AHD (21 times), however the duration of these events is significantly less than the Baseline scenario. With a water recovery of BP 2750 GL there is potential to eliminate periods where water levels fall below the critical water levels of 0.0m AHD and -0.5m AHD at which point there is the potential for broader acidification of the water bodies requiring active management.
6.2.2 Sensitivity Analysis - 2400 GL and 3200 GL Water Recovery
The analysis of water levels in the Lower Lakes indicates that under BP 2400GL, 29 events occurred where water levels were less than 0.35m AHD, while under BP 3200 GL, there were 16 events.
Under all scenarios, two periods occur where water levels fall below 0.35m AHD for a number of years consecutively with recovery to a higher level occurring each year. The impact of falling below 0.35m AHD in a series of years with intermediate levels of recovery, in effect cycling lake levels is unknown at this stage.
6.2.3 Implications of Water Level Variation
As discussed in Section 3.3.1, Lester et al. (2011a) found that vegetation indicators showed a wide variation in the preferred ARF for lake water levels (particularly for ARFs for water levels >0.7 m AHD). Muller (2010) suggested that the operating range for the Lower Lakes as a part of the EWR for the site as described by Lester et al. (2011b) is between 0.3 and 0.65m AHD, with regular increases to 0.85m AHD. This is where most vegetation indicators are within their preferred or marginal ranges.
The analysis presented here indicates that there would be periodic impacts to vegetation communities under all recovery scenarios potentially linked to the way lake operations have been modelled to achieve a variable lake operating strategy, which included surcharging the lake to 0.85m AHD annually rather than every third year as described in Muller (2010).
6.3 Salinity Assessment
6.3.1 Baseline Conditions and 2750 GL Water Recovery
In the analysis of salinities in Lake Alexandrina, the baseline scenario results in a significant number of periods (7) where salinity exceeds 1500 EC and one period where salinities could exceed 3400 EC. Exceeding 1500 EC has been demonstrated to result in sub-lethal impacts to submerged aquatic vegetation, identified as an important component of the aquatic ecology of the Lakes (Lester et al. 2011a). Additionally, sub-lethal impacts could be expected to occur in the Yarra pygmy perch which has a modest salinity tolerance relative to other species, preferring 1000 EC. Yarra pygmy perch was considered by Lester et al. (2011a) to be one of the less-mobile species in the region, and so is more reliant on environmental conditions of sufficient quality. In contrast, BP 2750 GL results in only a single event exceeding 1500 EC of 90 days duration.
Under Baseline Conditions, there are 36 events where the salinity in Lake Albert exceeds 1500 EC while under BP 2750 GL this is reduced to 22 events. Of the events under Baseline Conditions, the modelled maximum salinity is 8045 EC while under BP 2750 GL this is significantly reduced to 2850 EC. The salinity modelled under the two scenarios reaches a level that could be expected to have sub-lethal effects on aquatic vegetation. Under Baseline
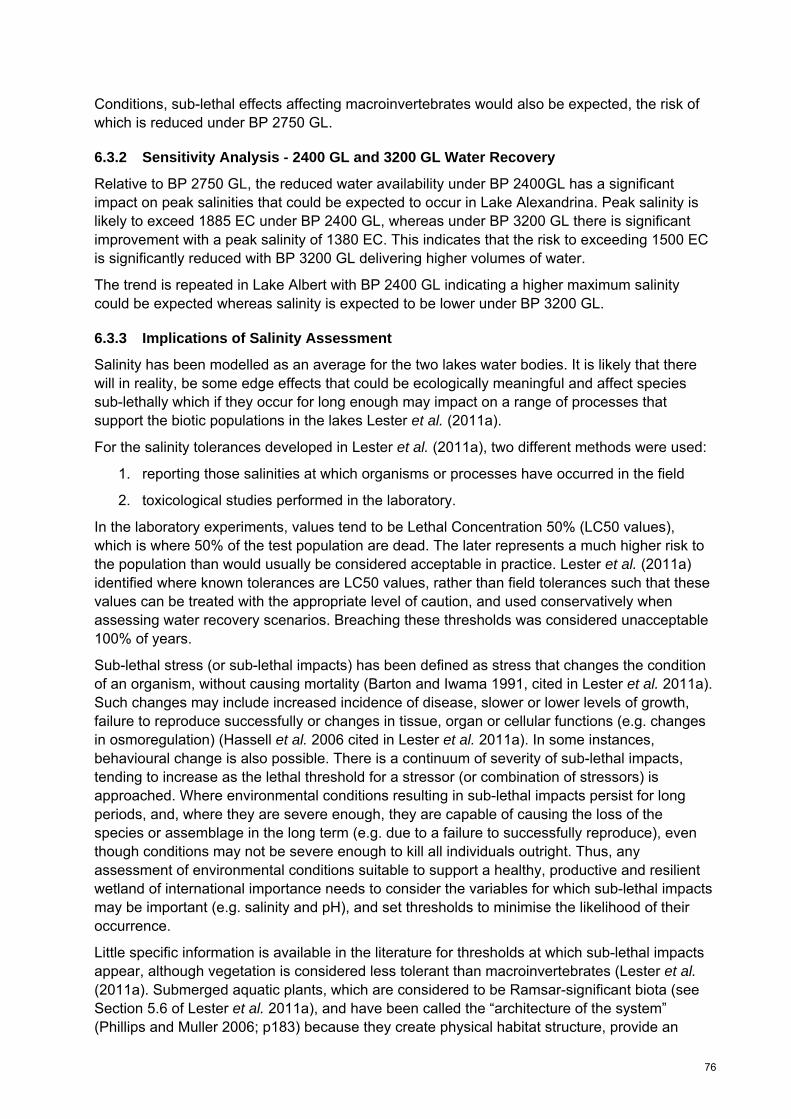
76
Conditions, sub-lethal effects affecting macroinvertebrates would also be expected, the risk of which is reduced under BP 2750 GL.
6.3.2 Sensitivity Analysis - 2400 GL and 3200 GL Water Recovery
Relative to BP 2750 GL, the reduced water availability under BP 2400GL has a significant impact on peak salinities that could be expected to occur in Lake Alexandrina. Peak salinity is likely to exceed 1885 EC under BP 2400 GL, whereas under BP 3200 GL there is significant improvement with a peak salinity of 1380 EC. This indicates that the risk to exceeding 1500 EC is significantly reduced with BP 3200 GL delivering higher volumes of water.
The trend is repeated in Lake Albert with BP 2400 GL indicating a higher maximum salinity could be expected whereas salinity is expected to be lower under BP 3200 GL.
6.3.3 Implications of Salinity Assessment
Salinity has been modelled as an average for the two lakes water bodies. It is likely that there will in reality, be some edge effects that could be ecologically meaningful and affect species sub-lethally which if they occur for long enough may impact on a range of processes that support the biotic populations in the lakes Lester et al. (2011a).
For the salinity tolerances developed in Lester et al. (2011a), two different methods were used:
1. reporting those salinities at which organisms or processes have occurred in the field
2. toxicological studies performed in the laboratory.
In the laboratory experiments, values tend to be Lethal Concentration 50% (LC50 values), which is where 50% of the test population are dead. The later represents a much higher risk to the population than would usually be considered acceptable in practice. Lester et al. (2011a) identified where known tolerances are LC50 values, rather than field tolerances such that these values can be treated with the appropriate level of caution, and used conservatively when assessing water recovery scenarios. Breaching these thresholds was considered unacceptable 100% of years.
Sub-lethal stress (or sub-lethal impacts) has been defined as stress that changes the condition of an organism, without causing mortality (Barton and Iwama 1991, cited in Lester et al. 2011a). Such changes may include increased incidence of disease, slower or lower levels of growth, failure to reproduce successfully or changes in tissue, organ or cellular functions (e.g. changes in osmoregulation) (Hassell et al. 2006 cited in Lester et al. 2011a). In some instances, behavioural change is also possible. There is a continuum of severity of sub-lethal impacts, tending to increase as the lethal threshold for a stressor (or combination of stressors) is approached. Where environmental conditions resulting in sub-lethal impacts persist for long periods, and, where they are severe enough, they are capable of causing the loss of the species or assemblage in the long term (e.g. due to a failure to successfully reproduce), even though conditions may not be severe enough to kill all individuals outright. Thus, any assessment of environmental conditions suitable to support a healthy, productive and resilient wetland of international importance needs to consider the variables for which sub-lethal impacts may be important (e.g. salinity and pH), and set thresholds to minimise the likelihood of their occurrence.
Little specific information is available in the literature for thresholds at which sub-lethal impacts appear, although vegetation is considered less tolerant than macroinvertebrates (Lester et al. (2011a). Submerged aquatic plants, which are considered to be Ramsar-significant biota (see Section 5.6 of Lester et al. 2011a), and have been called the “architecture of the system” (Phillips and Muller 2006; p183) because they create physical habitat structure, provide an
77
environment conducive to respiration and to carbon and nutrient cycling, while also creating a direct and indirect source of food and generating organic matter and oxygen via photosynthesis (Phillips and Muller 2006). Thus the loss of this assemblage from the ecosystem would significantly alter the ecological character of the region because of a loss of food resources and reduced habitat quality for other biota (Nielsen and Brock 2009).
Upper lethal salinity thresholds for most freshwater plant species are between 3 and 4 gL-1
(Nielsen et al. 2003a; Nielsen and Brock 2009 cited in Lester et al. 2011a). Above these salinities, species that are sensitive to salinity tend to be replaced with species that are relatively salinity-tolerant species (Lester et al. 2011a). Although different species have different responses to increasing salinity, Nielsen et al. (2003a) outline that for salinities above 1 g L-1 (~1500 μS cm-1 EC) adverse impacts on aquatic plants begin to occur, such as:
reduced growth rates (James and Hart 1993)
reduced development of roots and leaves (Nielsen et al. 2003b)
suppression of sexual and asexual reproduction (James and Hart 1993; Warwick and Bailey 1997; 1998)
the prevention of flower and tuber development (Warwick and Bailey 1996)
reduction in the emergence of plants from dormant propagules in wetland sediments (Brock et al. 2005; Nielsen et al. 2003b; 2007; 2008).
At salinities approaching threshold values, aquatic species are less likely to successfully germinate. Where this occurs, it can be delayed, resulting in a reduced growing season and if the season becomes sufficiently short, the plant may not reach maturity and will therefore be unable to set seed, resulting in the depletion of the seedbank through time and decreasing the overall resilience of the wetland (Sim et al. 2006).
For aquatic faunal assemblages, the majority of work that has been undertaken has focussed on identifying LD50 thresholds that result in mortality of a species. As for vegetation, however, lower concentrations are likely to result in impairment of survival, growth and reproduction (Hoffman and Parsons 1991). Analogous to vegetation seed banks, so where long-term recruitment is affected, there is a depletion of “biotic reservoirs” occurs (Nielsen et al. 2003a; pg 662) (for example resistant spores or egg banks), which then decreases the resilience of an assemblage and lowers its ability to respond to freshwater flow events (particularly floods). It is important to also note that sub-lethal effects are also possible for conditions below preferred tolerance ranges, not just for high salinities (for example, increased incidence of disease of euryhaline fish species at low salinities (Wedderburn et al. 2008)).
The available data suggest that aquatic biota is adversely affected by salinities exceeding approximately 1 g L-1 (Hart et al. 1991; Nielsen et al. 2003b; McEvoy and Goonan 2003). The available literature suggested that many species and assemblages have salinity tolerances in the order of 1000 μS cm-1 EC, particularly for the appearance of sub-lethal effects that would lower the resilience of the wetland ecosystems through time. This is true of submerged aquatic vegetation and freshwater invertebrate taxa, in particular. By the time salinities of 1500 μS cm-1 EC were reached, sub-lethal impacts would certainly be operating for many species and assemblages, and some indicator taxa would be at risk of local extinction. Permanently elevated salinities could be expected to have impacts on even the most tolerant species, particularly through sub-lethal effects. Arguably, environmental water provisions that seek to meet the objectives of the Water Act 2007 (Cth) would seek to avoid these.

78
6.4 General Discussion of Ecological Implications
Lester et al. (2011a) used literature searches to identify critical thresholds, where possible, for water quality (focusing on salinity), flow regime (indicating an ARF), connectivity (specifying intra-site connections and timing), and water levels (links to water quality [e.g. acidification and salinity] and connectivity) for the Lower Lakes (and Coorong). This allowed the indicators they identified for ecological condition to be directly related to the hydrodynamics and flow regime of the Lower Lakes (and Coorong), and the various trade-offs associated with increasing salinities and decreasing flows to be highlighted. Therefore, the different outcomes, in terms of the biota, arising from a range of possible environmental water recovery volumes to be assessed.
Critically, Lester et al. (2011a) cautioned that identifying critical thresholds for some indicators was difficult because the available information varied across the different indicators such that a heavy reliance was placed on previous work for identifying thresholds, with most of the hydrological conditions that were investigated (e.g. links to salinity and water levels) considered separately, as very few studies have been done that consider multiple factors simultaneously. Where tolerances are known, for almost all taxa, only a single stressor (or condition) has been considered. However, interactions between potential stressors are also known to be important because it is likely interactions between stressors will be synergistic (Lester et al. 2011a). The thresholds developed by Lester et al. (2011a) have been interpreted here as being maxima, and as such, a conservative approach to interpreting the modelling has been taken when assessing the Basin plan scenarios.
Ribbonweed (Vallisneria australis) and water milfoil (Myriophyllum spp.), are submerged macrophytes that occur in the lakes. Phillips and Muller (2006) recognised that these species are important to the ecological condition of the region and recommended that they should be considered as ‘Ramsar significant biota’ for the region and form a key species in the assessment of the implications of the proposed environmental water provision in the Basin plan. Its tolerance is comparatively sensitive to even modest increases in salinity. Based on published thresholds for sub-lethal effects, it together with Yarra Pygmy perch, are the species that form part of the sites ecological character, most at risk from salinity and water levels being outside the proposed environmental water requirements described in Lester et al., (2011). The periods of impact that would occur under Baseline conditions are significantly ameliorated under the 2750GL scenario.
Ribbonweed and water milfoil are also at risk due to water levels falling below the 0.3m AHD level under BP 2750 GL. The number of events is significantly reduced relative to Baseline Conditions and while it is possible that actual operations would limit these periods in both duration and magnitude, BP 2750 GL results in a number of periods where the modelled level is lower than the proffered water level range for the lakes vegetation.
Arguably, the greatest benefit to Lower Lakes biota that occurs under the BP 2750 GL scenario is as a result of the improved connectivity between the Lower Lakes and the Coorong. The duration and timing of the periods of barrage closure are comprehensively reduced, limiting the impacts it would have on diadromous fish and estuarine macroinvertebrates relative to Baseline Conditions.
Under BP 2750 GL, the period from 2006-07 to 2008-09, and hence any future low flow period, would appear to remain as a significant risk to
connectivity between the Lower Lakes and the Coorong
salinities that result in sub-lethal effects to aquatic biota in Lake Alexandrina and Albert
water levels that do not support the vegetation communities and adversely affect habitat accessibility.

79
These outcomes appear sensitive to the volume of provision with the sensitivity testing reducing the number of events and duration of events with BP 2400 GL indicating these would be exacerbated and BP 3200 GL indicating they would be mitigated but not prevented. The metrics used here are conservative but the water quality measures are also averaged over the water body and do not account for edge effects and spatial differences that occur within the site. As such, BP 2750 GL while providing some benefits to the ecology of the CLLMM region, still poses considerable risk to the ecology of the site, focussed around drought periods especially those as severe as the period from 2006-07 to 2008-09.

80
7. Conclusions and Key Findings
The MDBA has undertaken considerable hydrological modelling to underpin the Proposed Basin Plan. This modelling was used to simulate how the water recovered may be used and hence evaluate the potential outcomes from that recovery and delivery. It did not directly inform the setting of the proposed SDL nor the water recovery volume required to achieve this.
Water recovery scenarios BP 2750 GL and BP 2800 GL were modelled and compared with a set of defined Baseline Conditions. BP 2750 GL represents the target defined in the Proposed Basin Plan that was released by the MDBA in November 2011, which is a 50 GL decrease from BP 2800 GL, which was proposed prior to this release.
Scenarios BP 2400 GL and BP 3200 GL were modelled as part of a sensitivity analysis to gauge the capacity to meet environmental outcomes with varying level of water availability for environmental use. The hydrological and ecological implications and potential changes of each of these scenarios have been analysed for the Lower Lakes.
7.1 General Modelling Outcomes
The modelling undertaken by the MDBA during the preparation of the Proposed Basin Plan provides limited information on which to assess the likely environmental outcomes that may be provided in South Australia. This partially relates to limitations in the modelling approach itself, but also due to a number of major assumptions around which the sensitivity is yet to be tested.
The modelling approach that has been used by the MDBA should be considered robust in what could indicatively be achieved if each of the volumes above were recovered using a pro-rata portfolio recovery approach, but would be extremely difficult to operationalise or the outcomes repeated in practice. It is concluded that:
In the case of BP 2750 GL, the results represent one possible option for water delivery from the recovery of 2750 GL and should not be used as an absolute representation of “what will happen with 2750 GL water recovery”.
The final delivery of water to achieve environmental benefits will be significantly dependent on how the Commonwealth Environmental Water Holder manages and prioritise the water recovered, as well as the ability to forecast natural events and enhance these using regulated releases.
The ability to deliver environmental benefits will also be dependent on a number of policy constraints. The modelling has assumed that it is possible to build on naturally occurring unregulated flow events using environmental water as well as a degree of protection for environmental flows from re-regulation and supplementary access. This has allowed the reuse of these flows in multiple locations but without policy changes to reflect these assumptions, some of the outcomes may not be achievable.
7.2 Assessment of Modelled Outcomes for the Lower Lakes
The results and outcomes from the modelled water recovery scenarios are dependent on the assumptions used. Both water level and salinity are critical parameters in the assessment of changes to conditions in the Lower Lakes with critical assumptions for the representation of these parameters being the lake operating strategy and the ability to model the volume and salinity of lake inflow. The results have been shown to be sensitive to these assumptions, highlighting the danger in placing too much emphasis on absolute values from model runs.
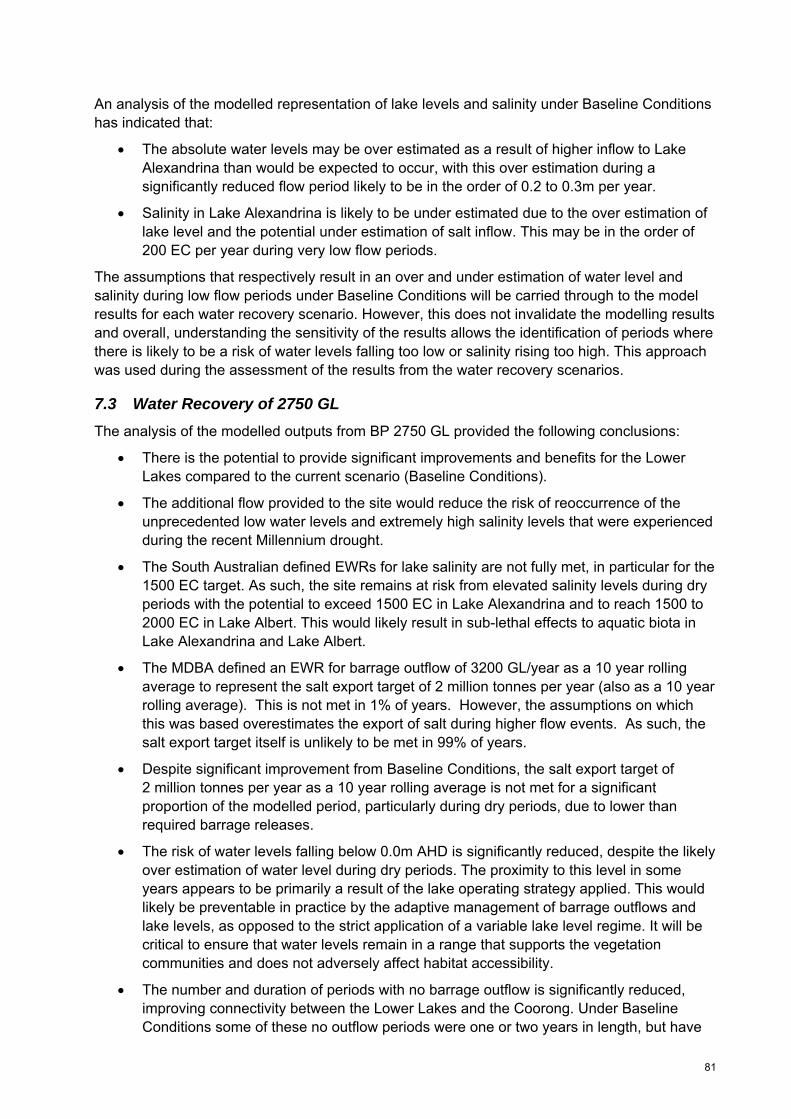
81
An analysis of the modelled representation of lake levels and salinity under Baseline Conditions has indicated that:
The absolute water levels may be over estimated as a result of higher inflow to Lake Alexandrina than would be expected to occur, with this over estimation during a significantly reduced flow period likely to be in the order of 0.2 to 0.3m per year.
Salinity in Lake Alexandrina is likely to be under estimated due to the over estimation of lake level and the potential under estimation of salt inflow. This may be in the order of 200 EC per year during very low flow periods.
The assumptions that respectively result in an over and under estimation of water level and salinity during low flow periods under Baseline Conditions will be carried through to the model results for each water recovery scenario. However, this does not invalidate the modelling results and overall, understanding the sensitivity of the results allows the identification of periods where there is likely to be a risk of water levels falling too low or salinity rising too high. This approach was used during the assessment of the results from the water recovery scenarios.
7.3 Water Recovery of 2750 GL
The analysis of the modelled outputs from BP 2750 GL provided the following conclusions:
There is the potential to provide significant improvements and benefits for the Lower Lakes compared to the current scenario (Baseline Conditions).
The additional flow provided to the site would reduce the risk of reoccurrence of the unprecedented low water levels and extremely high salinity levels that were experienced during the recent Millennium drought.
The South Australian defined EWRs for lake salinity are not fully met, in particular for the 1500 EC target. As such, the site remains at risk from elevated salinity levels during dry periods with the potential to exceed 1500 EC in Lake Alexandrina and to reach 1500 to 2000 EC in Lake Albert. This would likely result in sub-lethal effects to aquatic biota in Lake Alexandrina and Lake Albert.
The MDBA defined an EWR for barrage outflow of 3200 GL/year as a 10 year rolling average to represent the salt export target of 2 million tonnes per year (also as a 10 year rolling average). This is not met in 1% of years. However, the assumptions on which this was based overestimates the export of salt during higher flow events. As such, the salt export target itself is unlikely to be met in 99% of years.
Despite significant improvement from Baseline Conditions, the salt export target of 2 million tonnes per year as a 10 year rolling average is not met for a significant proportion of the modelled period, particularly during dry periods, due to lower than required barrage releases.
The risk of water levels falling below 0.0m AHD is significantly reduced, despite the likely over estimation of water level during dry periods. The proximity to this level in some years appears to be primarily a result of the lake operating strategy applied. This would likely be preventable in practice by the adaptive management of barrage outflows and lake levels, as opposed to the strict application of a variable lake level regime. It will be critical to ensure that water levels remain in a range that supports the vegetation communities and does not adversely affect habitat accessibility.
The number and duration of periods with no barrage outflow is significantly reduced, improving connectivity between the Lower Lakes and the Coorong. Under Baseline Conditions some of these no outflow periods were one or two years in length, but have

82
been potentially reduced to around three months. The water level regime will be critical to maintaining this connectivity.
Overall, the modelling results show the potential for significant improvement in the condition of the Lower Lakes under BP 2750 GL. However, the results are highly dependent on both Basin-wide assumptions such as the final water recovery portfolio, ability to deliver a flow regime similar to that proposed without perfect foresight and overcoming policy constraints, as well as assumptions specific to the management of the Lower Lakes such as the lake operating strategy. As such, the inclusion of flow, lake level and salinity targets in the Proposed Basin Plan will be crucial to ensuring that the CLLMM remains a Ramsar Convention-listed Wetland of International Importance.
7.4 Sensitivity Analysis - 2400 GL and 3200 GL Water Recovery
An analysis of the sensitivity of the water recovery volume in providing outcomes for the Lower Lakes was assessed.
From the analysis of BP 2400 GL it is concluded that:
There is an increased risk of falling below 0.0m AHD during dry periods when compared to BP 2750 GL, although it may be possible to manage this in practice.
The South Australian EWRs for salinity are not met for either the 1000 or 1500 EC target. As such, the site remains at risk from elevated salinity levels during dry periods.
The salt export target of two million tonnes per year as a 10 year rolling average is not met for a significant proportion of the modelled period, particularly during dry periods.
The number of periods of no barrage outflow are slightly higher in comparison to the 2750 GL scenario (25 vs 19 periods), although the average period duration is the same. However, the maximum period increased from 125 days to 190 days.
From the analysis of BP 3200 GL it is concluded that:
The additional flow provides increased security in terms of maintaining minimum water levels above 0.0m AHD.
There is the potential to reduce the risk of future peak salinity levels reaching 1500 EC in Lake Alexandrina and 2500 EC in Lake Albert. While the percentage decrease in the percentage of time at these high salinity levels is small (around 1 to 2%), the additional flow has the potential to prevent the occurrence of major ecological issues that occur when these levels are reached.
There is improvement in the connection between the Lower Lakes and the Coorong. The number of periods of no barrage outflow reduce in comparison to BP 2750 GL (from 19 to 12 periods). The mean duration reduces from 50 to 30 days and the maximum duration reduces from around three to two months.

83
8. References Barton BA and Iwama GK, 1991, Physiological changes in fish from stress in aquaculture with emphasis on the response and effects of corticosteroids, Annual Review of Fish Diseases, 1: 3-26.
Brock MA, Nielsen DL and Crossle K, 2005, Changes in biotic communities developing from freshwater wetland sediments under experimental salinity and water regimes, Freshwater Biology, 50: 1376-1390.
DEH 2000, Coorong and Lakes Alexandrina and Albert Ramsar Management Plan. South Australian Department for Environment and Heritage, Adelaide.
Environmental Protection and Biodiversity Conservation Act 1999 (Cth).
Hart BT, Bailey P, Edwards R, Hortle K, James K, McMahon A, Meredith C and Swadling K, 1991, A review of salt sensitivity of the Australian freshwater biota, Hydrobiologia, 210: 105-144.
Hassell KL, Kefford BJ and Nugegoda D, 2006, Sub-lethal and chronic salinity tolerances of three freshwater insects: Cloeon sp. and Centroptilum sp. (Ephemeroptera: Baetidae) and Chironomus sp. (Diptera: Chironomidae), Journal of Experimental Biology, 209: 4024-4032.
Heneker TM, 2010, Development of flow regimes to manage water quality in the Lower Lakes, South Australia, DFW Technical Report 2010/05, Government of South Australia, through Department for Water, Adelaide.
Higham JS, 2012, An analysis of MDBA modelling outputs for the draft Basin Plan: Hydrodynamic modelling of the Coorong and Murray Mouth. South Australian Department for Environment and Natural Resources, Adelaide.
James KR and Hart BT, 1993, Effect on salinity on four freshwater macrophytes, Australian Journal of Marine & Freshwater Research, 44: 769-777.
Lester RE, Fairweather PG and Higham JS (eds), 2011a, Determining the Environmental Water Requirements for the Coorong, Lower Lakes and Murray Mouth Region. Methods and Findings to date. A report prepared for the South Australian Department of Environment and Natural Resources, Adelaide.
Lester RE, Fairweather PG, Heneker TM, Higham JS and Muller KL, 2011b, Specifying an environmental water requirement for the Coorong and Lakes Alexandrina and Albert: A first iteration. Report prepared for the South Australian Department of Environment and Natural Resources, Adelaide.
McEvoy P and Goonan P, 2003, Salinity is not necessarily bad for biodiversity: case studies of invertebrates from South Australian streams and River Murray wetlands, Records of the South Australian Museum, 7: 131-134.
Muller KL, 2010, Material prepared to support the development of an Environmental Water Requirement for the Coorong, Lower Lakes and Murray Mouth region. Prepared for the SA Department of Environment and Natural Resources, Adelaide.
Murray-Darling Basin Authority, 2012, Hydrologic modelling to inform the proposed Basin Plan - methods and results, MDBA publication no: 17/12, Murray-Darling Basin Authority, Canberra.
Murray‐Darling Basin Authority, 2011a, Proposed Basin Plan – a draft for consultation. MDBA publication no: 192/11, Murray‐Darling Basin Authority, Canberra.

84
Murray-Darling Basin Authority, 2011b, The proposed “environmentally sustainable level of take” for surface water of the Murray-Darling Basin: Methods and outcomes, MDBA publication no: 226/11, Murray-Darling Basin Authority, Canberra.
Murray-Darling Basin Authority, 2011c, Modelling of the recovery of 2800 GL Basin-wide, Unpublished Draft, Murray-Darling Basin Authority, 5 September 2011.
Murray-Darling Basin Authority, 2011d, River management - challenges and opportunities, Murray-Darling Basin Authority, 25 November 2011.
Murray-Darling Basin Authority, 2011e, Preliminary analysis of the deliverability of environmental water requirements in the draft Basin Plan by the River Murray System. Murray-Darling Basin Authority, Trim Ref D11/2515.
Murray-Darling Basin Authority, 2010a, Guide to the Proposed Basin Plan: Overview, Murray-Darling Basin Authority, Canberra.
Murray-Darling Basin Authority, 2010b, Guide to the Proposed Basin Plan: Technical Background. Murray-Darling Basin Authority, Canberra.
Murray-Darling Basin Commission, 2001, Basin Salinity Management Strategy: 2001-2015. Report published by the Murray-Darling Basin Ministerial Council.
Murray-Darling Basin Commission, 2002, Setting up of MSM-BIGMOD Modelling Suite for the River Murray System. Technical Report 2002/5, Murray-Darling Basin Commission, Canberra.
Nielsen DL and Brock MA, 2009, Modified water regime and salinity as a consequence of climate change: prospects for wetlands of Southern Australia, Climate Change, 95: 523-533.
Nielsen DL, Brock MA, Rees GN and Baldwin DS, 2003a, Effects of increasing salinity on freshwater ecosystems in Australia, Australian Journal of Botany, 51: 655-665.
Nielsen DL, Brock MA, Crosslé K, Harris K, Healey M and Jarosinski I, 2003b, The effects of salinity on aquatic plant germination and zooplankton hatching from two wetland sediments, Freshwater Biology, 48: 2214-2223.
Nielsen DL, Brock MA, Petrie R and Crosslé, K, 2007, The impacts of salinity pulses on the emergence of plant and zooplankton from wetland seed and egg banks, Freshwater Biology, 52: 784-795.
Nielsen DL, Brock MA, Vogel M and Petrie R, 2008, From fresh to saline: a comparison of zooplankton and plant communities developing under a gradient of salinity with communities developing under constant salinity levels, Marine & Freshwater Research, 59: 549-559.
Phillips B, and Muller, K, 2006, Ecological Character Description: Coorong, Lakes Alexandrina and Albert, Wetland of International Importance. South Australian Department for Environment and Heritage, South Australian Government, Adelaide, 336pp.
Pollino CA, Lester RE, Podger GM, Black D and Overton IC, 2011, Analysis of South Australia’s environmental water and water quality requirements and their delivery under the Guide to the proposed Basin Plan. Goyder Institute for Water Research, Adelaide. pp141.
RAMSAR, 2007, What is the Ramsar Convention on Wetlands? Ramsar Information Paper No 2. Ramsar Secretariat, Gland, Switzerland. pp 5.
Water Act 2007 (Cth).
Warwick N and Bailey P, 1996, The effects of increasing salinity on wetlands, Trees & Natural Resources, 38: 9-10.
Warwick N and Bailey, P, 1997, The effects of increasing salinity on the growth and ion content of three non-halophytic wetland macrophytes, Aquatic Botany, 58: 73-88.

85
Warwick N and Bailey P, 1998, The effect of time exposure to NaCl on leaf demography and growth of two non-halophytic wetland macrophytes, Potamogeton tricarinatus F.Muell and A Benn. Ex A Benn. and Triglochin procera R.Br. Aquatic Botany, 62: 19-31.
Sim LL, Chambers JM and Davis JA, 2006, Ecological regime shifts in salinized wetland systems. I. Salinity thresholds for the loss of submerged macrophytes, Hydrobiologia, 573: 89-107.

86
APPENDIX A Modelling Approach - Proposed Basin Plan
A.1 Hydrological Modelling Framework
The MDBA adopted the Integrated River System Modelling Framework developed by CSIRO for the Murray-Darling Basin Sustainable Yields project as the modelling platform to assess the recovery and delivery of water under the Proposed Basin Plan. This links a suite of individual valley models that have been developed by the Basin States to the Monthly Simulation Model (MSM) and BIGMOD, which have been purpose built over many decades by the MDBA.
MSM is a monthly model that replicates the sharing and distribution of water under the Murray-Darling Basin Agreement. It is run first after which various outputs are passed through to BIGMOD. The South Australian component of the River Murray, including the Lower Lakes, is primarily represented by BIGMOD. BIGMOD (MDBC 2002) conceptualises and simulates the River Murray system by dividing the river into a number of river reaches. In each river reach, the major processes modelled include the routing of flow and salinity, losses, inflows, extractions, the operation of storages and weirs based on specified rules and the diversion of water into branches. It has been calibrated to available data and is regularly re-calibrated as new data or information becomes available or operating rules are changed.
A.1.1 Lower Lakes Representation
At the Lower Lakes, BIGMOD maintains a continuous water and salt balance with key requirements to provide a good representation of water levels and salinities as well as an ability to estimate the flow over the Barrages. The major components of the water balance are inflow (surface flows from the River Murray and Eastern Mount Lofty Ranges (EMLR) tributaries and groundwater inflow), barrage outflow, rainfall, evaporation, seepage, water supply and irrigation extractions.
Historically, there have been difficulties in calibrating models for the Lower Lakes due to a number of issues including upstream flow measurement inaccuracies, non-measurement of barrage outflows, non-metered diversions such as those to the Lower Murray Swamps and irregular recording of other diversions, unknown groundwater seepage rates, limited periods of estimated inflow data from the EMLR tributaries, and limited pan evaporation records. However, using available data on River Murray inflows, extractions, rainfall, and evaporation, BIGMOD has been calibrated to ensure a good reproduction of the historical rise and fall of lake levels over the period for which data is available (refer Heneker 2010).
A.1.2 Evaluation of Model Results
For each water recovery scenario, both MSM and BIGMOD model results were provided by the MDBA. In most modelling investigations, the MDBA will usually present flow and salinity results from BIGMOD in preference to MSM. There are a number of reasons for this including the following:
As a monthly model, MSM is coarser but there are also less reaches represented, which may influence the volume calculations in the routing of flow.
Until recently, MSM was limited to upstream of the South Australian Border. While MSM now implements routing from the Border to the Barrages, which was incorporated to allow the implementation of water level driven demands in the Lower Lakes, it is a very simplified system with only three reaches for the River Murray in South Australia.
The representation of the loss calculations in MSM and BIGMOD have been calibrated separately with significantly more time spent on the BIGMOD calibration. Hence the

87
volumes reaching the border and flowing through South Australia are likely to be more accurate.
For this investigation, only outputs from BIGMOD have been analysed and are presented to ensure consistency between all results contained in this report. This approach also ensures consistency with the subsequent analysis of the potential changes that may result from the various levels of water recovery on the Coorong and Murray Mouth (Higham 2012), which required assessment at a daily time-scale.
Some of the annual time-scale results presented in MDBA (2012) have been derived from MSM outputs while other daily time-scale results have been calculated from BIGMOD outputs. This has resulted in some differences between the annual statistics presented in this report in comparison with those in MDBA (2012).
A.2 Hydrological Modelling Approach
The MDBA has undertaken extensive hydrological modelling to underpin the Proposed Basin Plan, which is described in detail in MDBA (2011c) and MDBA (2012). Figure A1 describes the process undertaken (adapted from MDBA 2011c). The following then provides a discussion of the key features of this approach and assumptions, which should be taken into consideration when viewing the results.
The hydrological modelling undertaken for the Proposed Basin Plan does not directly inform the setting of the proposed SDL and hence the water recovery volume required to achieve this. Instead, hydrological modelling was used to simulate how the water recovered under the Proposed Basin Plan may be used and hence evaluate the potential outcomes from that recovery and delivery.
A.2.1 Environmental Water Requirements
A major input to the hydrological modelling process was the definition of EWRs for both key ecosystems assets and key ecosystem functions. Generally characterised as flow targets to represent local environmental objectives and ecological requirements, these are used to determine site specific flow demands and indicators for water delivery. During their development, the major focus was on high flow requirements (MDBA 2011b) due to their larger volumetric contribution. While a larger range of priorities (including low flow requirements) and sites will guide future environmental watering plans, it was assumed that those EWRs chosen should broadly represent the management and delivery of the major proportion of the future environmental water portfolio/account (MDBA 2011c).
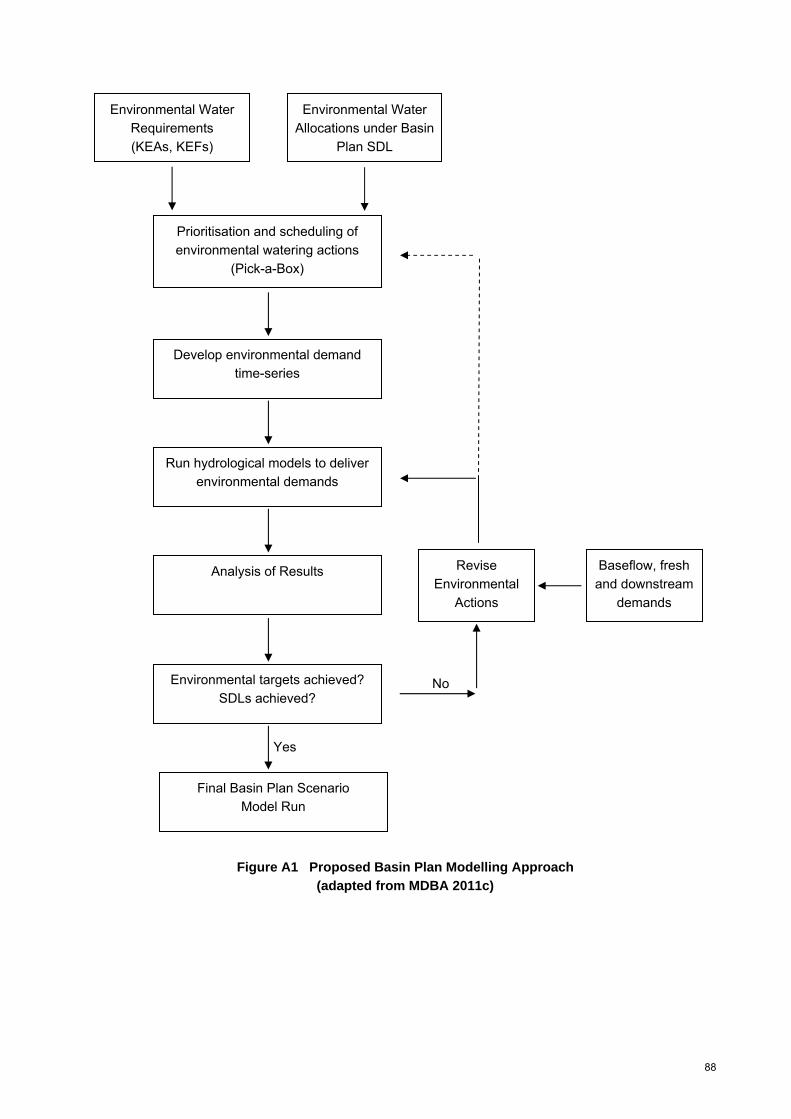
88
Figure A1 Proposed Basin Plan Modelling Approach (adapted from MDBA 2011c)
Prioritisation and scheduling of environmental watering actions
(Pick-a-Box)
Develop environmental demand time-series
Run hydrological models to deliver environmental demands
Analysis of Results
Environmental targets achieved? SDLs achieved?
Final Basin Plan Scenario Model Run
No
Yes
Revise Environmental
Actions
Baseflow, fresh and downstream
demands
Environmental Water Requirements (KEAs, KEFs)
Environmental Water Allocations under Basin
Plan SDL

89
A.2.2 Environmental Water Allocations
Following consultation on the Guide to the Basin Plan, a number of key policy decisions were announced by the Australian Government in relation to water recovery and its subsequent availability for delivery under the Proposed Basin Plan. These were:
1. Water recovered would be from the purchase of entitlements from willing sellers in order to meet specified SDLs, in combination with investment in infrastructure upgrades and efficiency programs.
2. Remaining irrigator water access rights would not be compromised as a result of the Basin Plan, that is, the existing reliability would not be reduced.
The incorporation of these decisions into the hydrological process and the associated assumptions are as follows:
1. Water Recovery - The inherent uncertainty regarding potential infrastructure changes and efficiency programs, and the complexity associated with representing these in models, meant that the full volume of water recovered under each scenario was modelled as a purchase of entitlements for the Commonwealth Environmental Water Holder (MDBA 2011c). This includes purchases for internal and shared downstream targeted reduction in diversions (where applicable).
This subsequently required revisions to the approach that was used to model the scenarios prepared for the Guide to the Proposed Basin Plan as well as the hydrological models themselves. These changes principally related to the simulation of an account to represent and deliver Held Environmental Water, that is, water available as an allocation against a water access, delivery or irrigation entitlement. Under the Guide (MDBA 2010b), water was delivered according to rules and triggers as Planned Environmental Water. This meant that there was potential to deliver a greater volume of water, if in storage, for environmental purposes than had been recovered under the assumed water recovery scenario.
2. Preservation of Entitlement Reliability - The available water delivered for environmental purposes in a given year is only that part of the allocation against the environmental entitlement that would have historically been used. It was principally done to ensure the existing reliability of entitlements and allocations against those entitlements by maintaining system behaviour such as storage levels and annual allocations. Additionally, it allowed the continued use of many existing models that represent usage rather than explicitly modelling availability via allocation (MDBA 2011c).
In reality, the restricted use of available allocations is artificial given that it is unlikely to represent how the Commonwealth Environmental Water Holder may want to use or may be expected to use allocations against their entitlements. It may also mean that there may be more water in storage that may potentially be delivered to meet EWRs but that this water is not utilised under the methodology applied by the MDBA.
These assumptions result in a less variable inter-annual distribution of environmental water availability than under previous modelling for the Guide.

90
A.2.3 Prioritisation and Scheduling of Environmental Watering Actions
An Environmental Watering Simulation Tool (often referred to as ‘Pick-a-Box’) was developed in order to prioritise environmental watering actions at key environmental assets and allow the generation of an environmental demand series. This tool was designed to co-ordinate watering events across multiple sites and valleys in the Basin as well as to overcome some of the deficiencies of the Integrated River System Modelling Framework (Yang 2010) used to link together the 24 river system models used to represent the Murray-Darling Basin. The deficiencies overcome included passing demands from downstream environmental assets such as the Riverland-Chowilla floodplain into upstream catchments (such as the Murrumbidgee and Goulburn) and the storages contained therein, which allowed water to be released.
The Environmental Watering Simulation Tool allows for a more operationally realistic and efficient use of available water in terms of the sequencing of events. However, the delivery of environmental water to particular sites during a given year is evaluated at the start of that year with foresight of the total volume of water that will become available and the pattern with which it should be released, rather than using triggers for watering and delivery as water becomes available.
The approach ensured that the watering of multiple sites could occur and hence the optimisation of environmental outcomes with the volumes available. Multiple site watering will be critical to the success of the Proposed Basin Plan as it replicates the natural flow regimes through the system. The approach also allowed for a modelling program as large as has been undertaken to be completed in a limited period of time. However, it is a limitation to the usefulness of the results in terms of what will potentially be achieved because it is not operationalisable and hence not repeatable.
The CLLMM EWRs are not explicitly included as a key environmental asset demand during the modelling process. The approach used assumes that CLLMM EWRs are largely met by baseflows and return flows from upstream sites. In years where CLLMM demands are not fully supplied, the iterative approach allows the provision of additional water from upstream if available. This generally only occurs during drier years when the available environmental water is insufficient to facilitate a watering event at an upstream site.
A.2.4 Iterative Evaluation using Hydrological Model
Once a demand time-series for environmental watering actions at the key environmental assets has been generated, this was run through the Integrated River System Modelling Framework and the results analysed. Through an iterative process, other EWRs (including baseflow, freshes and other downstream demands) were progressively included until the annual environmental account is used and a final Basin Plan model run is finalised for a given SDL and water recovery volume (MDBA 2011c).
Despite the above, MDBA (2011b) states that some analysis has been undertaken outside of the hydrological modelling framework and hence the consequential pattern of environmental delivery has not been modelled comprehensively. This includes the addition of available environmental water to optimise the reduction of maximum dry intervals for key wetlands and floodplains. The delivery of additional water for this purpose would also influence the volumes delivered to the CLLMM site, but no assessment was possible in this investigation due to insufficient information.

91
A.2.5 Other Assumptions
There are a number of other assumptions that influence the management of the recovered environmental water and its delivery that are described below.
1. System Constraints - The delivery of water throughout the River Murray system is limited by physical and operating constraints. Many of these constraints relate to specified channel or dam outlet capacities, which are often driven by the potential for third party impacts such as flooding to property and towns. In most cases, the current operating constraints (MDBA 2011b; MDBA 2011d) have been assumed during the modelling of the water recovery scenarios. Those that primarily affect the delivery of water to South Australia include:
25,000 ML/d downstream of Hume Dam to minimise overbank flows and the inundation of agricultural land.
9,000 ML/day at Balranald Weir, representing a maximum flow from the Murrumbidgee to the River Murray due to channel capacity, although increasing this may not result in significant benefits due to increased losses.
8,000 to 10,000 ML/d channel capacity at the Barmah Choke; however, this has been increased to 40,000 ML/day during key periods to allow the delivery of environmental flow.
9,300 ML/day at Weir 32, downstream of Menindee Lakes to prevent increased water loss to the environment occurring through the Great Darling Anabranch. Flows above 20,000 ML/d at Weir 32 may also result in inundation of private property including the township of Menindee.
10,000 ML/day release from Eildon Dam on the Goulburn system to minimise the inundation of private property.
20,000 ML/day at McCoys Bridge at the end of the Goulburn system, representing a channel capacity to maximise the efficiency of delivery to downstream areas and minimise flooding at Shepparton.
It has been acknowledged that these currently limit the ability to deliver medium to higher flow events, such as those between 40,000 and 80,000 ML/day to South Australia, and hence the environmental outcomes that can potentially be achieved through active water management.
2. Policy Constraints - The scale of the policy constraints that limit the deliverability of environmental water under the Proposed Basin Plan are as extensive as the system constraints described above. The management of water across the Murray-Darling Basin has historically occurred for primarily social and economic reasons, as reflected in the Murray-Darling Basin Agreement (Water Act 2007 (Cth) Schedule 1), with the current entitlement regime defined by the characteristics needed for consumptive use, that is, a secure supply from year to year (MDBA 2011d). The characteristics and delivery parameters for environmental outcomes are vastly different as these are based on providing inter- and intra-annual variability.
A significant issue includes the inability to build on naturally occurring unregulated flow with regulated releases of environmental water as well as the lack of protection for environmental flows from re-regulation or supplementary access. With the determination of the environmental flow sequences outside of the modelling framework, the results for the Proposed Basin Plan have assumed some ability to build on naturally occurring events and protect in-stream environmental flows to allow the reuse of these flows at

92
multiple locations, as well as the ability to order flows from specific storages for environmental watering purposes (MDBA 2011d). Without policy changes to reflect these assumptions, some of the outcomes projected under the Proposed Basin Plan may not achievable.
3. Carryover Provisions - The use of carryover provisions has been limited in the modelling undertaken, particularly as a result of the requirement to pre-process the environmental water available each year external to the modelling framework (MDBA 2012). The explicit carryover of environmental allocations will be an important mechanism for delivering water to key environmental assets, particularly during drier periods. While the under-delivery of available allocations against environmental entitlements (refer Section A.2.2) provides some "carryover" type function in terms of underpinning allocations in a following year (the "reliability" of entitlements), these are not explicitly for the environment.

93
APPENDIX B Evaluation of Baseline Conditions
A description of Baseline Conditions was provided in Section 2.2.2. As discussed, the nature of Baseline Conditions means that model outputs will not necessarily be an exact replicate of what was actually observed at a given time due to a combination of factors including changing infrastructure, operating rules or changed flow conditions such as the provision of additional water through programs such as TLM. This section compares observed data with the Baseline Conditions model results for the Lower Lakes, and discusses the differences and potential effects of these differences that should be considered when viewing the results from the Proposed Basin Plan water recovery scenarios.
Differences between observed conditions and a modelled representation of those conditions generally reflects either the model structure itself or differences in the input data or operating rules of the system. BIGMOD has been calibrated to ensure a good reproduction of the historical rise and fall of lake levels and changes in salinity over the period for which data is available (refer Heneker 2010). This means that when the input data and operating assumptions that are applied are consistent with what actually occurred, the model generally represents the system well.
B.1 Representation of Lake Alexandrina Water Level
A comparison between observed lake levels and those represented under Baseline Conditions is shown in Figure B1 for the period from 1978. Observed data is limited prior to 1978 and most of the infrastructure changes (including the construction of major storages) that would cause major changes to the flow regime had been completed by this time. While the differences may initially indicate potential issues, these are generally the result of a combination of differing lake level operating strategies, differing flow volumes entering Lake Alexandrina and during drought, the infrastructure construction and associated pumping, as discussed below.
‐1.1
‐1
‐0.9
‐0.8
‐0.7
‐0.6
‐0.5
‐0.4
‐0.3
‐0.2
‐0.1
0
0.1
0.2
0.3
0.4
0.5
0.6
0.7
0.8
0.9
1
1978 1980 1982 1984 1986 1988 1990 1992 1994 1996 1998 2000 2002 2004 2006 2008
Water Level (m
AHD)
Year
Observed Lake Alexandrina Water Level
Lake Alexandrina Water Level ‐ Baseline Conditions
Figure B1 Lake Alexandrina Water Level - Observed vs Baseline Conditions

94
B.1.1 Lake Operating Strategy
Historically, water levels in the Lower Lakes have been operated to maximise water security while preventing the flooding of land both adjacent to the Lake Alexandrina and Lake Albert as well as to the main channel upstream to Lock 1. Little consideration has been given to water level driven ecological outcomes. As a result, water levels have generally being held as high as possible (between 0.75 to 0.85m AHD) for as long as possible with only excess water released through the barrages. This is reflected by the observed data in Figure B1. Water levels are held high during winter and spring then reduce as inflow to Lake Alexandrina over summer and autumn is not generally sufficient to replace evaporative losses.
The EWRs for the Lower Lakes proposed by both the South Australian Government and the MDBA contain a requirement for a variable water level regime for ecological outcomes (refer Section 3.2). This water level regime recommends that water level vary seasonally between 0.35 and 0.75m AHD. With a changing focus towards achieving environmental outcomes where possible, this regime has been incorporated into BIGMOD for use in modelling the Basin Plan scenarios. The result is the annual cycling of water levels as is shown under Baseline Conditions in Figure B1.
Implementation of the variable water level regime for use in BIGMOD (or any other model) requires a rules-based specification. However, there may need to be some adjustment made to the rules used to take into account updated understanding of the operating limits for barrage releases as well as forecasted water availability for South Australia. For example, the implemented rules enable continued barrage releases of 2000 to 2500 ML/day, irrespective of the Lower Lakes being less than 0.4m AHD. There are often difficulties in releasing water through the barrages at this level, particularly in winter. Additionally, releases continue post-spring in some years, despite the overall water availability for the year being close to South Australia's full Entitlement Flow of 1850 GL and water levels not being around 0.75m AHD at this time of year.
In reality, some discretion may be used, with consideration given to longer term forecasting of water availability, which may then result in higher water levels during some periods (mainly prior to 2006) than as shown. It is unlikely that the Lower Lakes would be continued to be drawn down at the rates assumed in the model as there would be a risk that water levels would fall well below desirable levels by the end of summer, which appears to have resulted in some of the model results. In the case of water levels during 2006-07, the application of the variable water level regime under Baseline Conditions is likely to have lowered water levels more than would have occurred in practice.
The assumed lake operating strategy significantly influences the modelled water level. However, the differences with observed data as a result of the application of a variable water level regime should not be considered significant in the overall results for the Lower Lakes. As the variable water level regime has also been applied to all water recovery scenarios, a comparison with the Baseline Conditions should provide a good indication of potential improvements.
B.1.2 Inflow to Lake Alexandrina
The major input to the water balance of the Lower Lakes is River Murray inflow, which therefore directly affects the representation of water level. The major water level differences in Figure B1 which are not likely to be a result of the lake operating strategy occur post 2002. The difference in inflow to Lake Alexandrina from 2001-02 to 2008-09 is shown in Figure B2. In most years, a greater volume of water flowed into Lake Alexandrina under Baseline Conditions that actually

95
occurred. This is likely to have caused the major differences between the observed water level and those under Baseline Conditions.
Aside from the application of TLM water during some of these years, the difference in Lake Alexandrina annual inflow volumes may be the culmination of a number of model assumptions or rules. In order to effectively use a model such as BIGMOD to evaluate system or operational changes such as those in the Proposed Basin Plan, rules need to be included for existing management actions and policies (such as allocation or carryover rules) that can be applied in a systematic manner to a range of conditions. It is difficult to implement ad-hoc decisions or policies that change depending on the prevailing conditions but which are not necessarily based on triggers around explicit conditions.
‐200
‐100
0
100
200
300
400
500
600
700
800
900
2001‐02
2002‐03
2003‐04
2004‐05
2005‐06
2006‐07
2007‐08
2008‐09
Difference in Inflow to
Lake Alexandrina (GL/year)
Water Year
Change in Inflow to Lake Alexandrina ‐ Actual to Baseline Conditions
Figure B2 Inflow to Lake Alexandrina - Difference between Actual and Baseline Conditions
South Australia changed its allocation and carryover policies as well as the approach for accumulating critical human water needs, each year during the recent drought. Due to the unprecedented conditions, the State was required to adapt to the changing conditions without the benefit of experience from similar events. Over time, the experience gained can be used to prepare robust policies and associated implementation triggers that can be incorporated into models to ensure a better representation of Baseline Conditions.
No accumulation for critical human water needs, nor the withholding of Entitlement Flow for carryover, is currently included within BIGMOD. These volumes were in the order of hundreds of GL per year and are likely have contributed to the higher than expected water levels under Baseline Conditions.
In some cases, a component of the lower inflow under observed conditions may have resulted from similar ad-hoc decisions or changes to policies upstream of South Australia.
B.1.3 Infrastructure Construction During Drought
The unprecedented low water levels in the Lower Lakes during the recent drought revealed previously unforseen acidification issues. These issues resulted construction of infrastructure at Narrung and Clayton with associated pumping from Lake Alexandrina to manage water levels in

96
Lake Albert and the Goolwa Channel respectively. This pumping reduced the water levels in Lake Alexandrina than would otherwise have occurred, again contributing to the differences shown in Figure B1.
B.2 Periods of No Barrage Outflow
Barrage outflow is critical for the continuing export of salt from the Lower Lakes and hence maintaining salinity levels within appropriate ranges, for providing freshwater to the downstream environment of the Coorong and for fish migration between the Coorong and the Lower Lakes. As such, representation of the frequency and duration of periods with no barrage outflow is critical.
Limited historical information was available to allow a comparison with the representation under Baseline Conditions. However, the comparison would likely indicate an under estimation of the historical frequency and duration of periods with no barrage outflow due to the assumed lake operating strategy (Section B.1.1). Although the strategy itself requires further refinement, the modelled operating strategy used is more likely to be representative of future lake management.
The critical factor is then the representation of lake water levels, particularly any over estimation of the periods when lake levels rise above 0.3 to 0.4m AHD. Section B.1.1 showed that there was generally an over estimation of lower water levels under Baseline Conditions, but as these levels were still below the critical levels for barrage outflow, it is unlikely that the model results under estimate periods with no barrage outflow.
B.3 Representation of Lake Alexandrina Salinity
The salinity in Lake Alexandrina is directly affected by River Murray inflow (and hence barrage outflow), lake level and assumed salt load (both from the River Murray inflow and directly into Lake Alexandrina from groundwater or other sources).
The observed Lake Alexandrina salinity and that represented under Baseline Conditions is shown in Figure B3 from 1975 to 2009. The relationship between the observed salinity and that under Baseline Conditions changes across the period shown in Figure B3. BIGMOD only models salinity for the full River Murray System from 1975 due to lack of observed data to use as input for model boundary conditions. This period is referred to as the salinity benchmark period. Irrespective of this, limited observed data is available for Lake Alexandrina prior to 1975. As with the representation of lake level in Section B.1, there are some potentially significant differences between the observed salinity data and that under Baseline Conditions.
The magnitude of the modelled peaks in the first half of the record is lower than the observed data, as expected due in part to the implementation of the major SISs that were commissioned at Woolpunda and Waikerie in the early 1990s. In the second half of the record there is a good relationship between the observed and modelled data and the rise and fall in salinity, until the period of missing data from 1999. The latter indicates that the model performs well in modelling the changes in salinity in the lake due to inflows, barrage discharges, losses and inter-change with Lake Albert.

97
0
500
1000
1500
2000
2500
3000
3500
4000
4500
5000
5500
6000
6500
1975
1976
1977
1978
1979
1980
1981
1982
1983
1984
1985
1986
1987
1988
1989
1990
1991
1992
1993
1994
1995
1996
1997
1998
1999
2000
2001
2002
2003
2004
2005
2006
2007
2008
2009
Salinity (EC)
Year
Observed Lake Alexandrina Salinity
Lake Alexandrina Salinity ‐ Baseline Conditions
Figure B3 Lake Alexandrina Salinity - Observed vs Baseline Conditions
From 2003, Lake Alexandrina salinity under Baseline Conditions is much lower than that observed. The higher annual inflow and water level under Baseline Conditions than those observed explains a proportion of these lower levels. However, some of the under estimation during this lower flow period may be due to an under estimation of salt load inputs.
The estimates of salt inflows along each reach of the river are calibrated for each month based on observed data. This means that the calculated salt load in a given year is explicitly linked to the flow in that year also. This may result in an under or over estimation of salt load input in a given year if differing flow conditions are applied to the calibrated value. To overcome this, Heneker (2010) developed a flow-salinity relationship for the inflow to Lake Alexandrina, which preserved the historical characteristics of salt inflows to Lake Alexandrina and allowed the assessment of salinity response within the Lower Lakes to be extended to the full modelled period of 1895-96 to 2008-09.
Figure B4 compares salinity in Lake Alexandrina from the Basin Plan Baseline Conditions model run with model results obtained by re-running the BIGMOD model setup for the Basin Plan Baseline Conditions but with the salinity of Lake Alexandrina inflow calculated using the relationship from Heneker (2010). This highlights that:
The major differences in salinity representation between the two approaches occur since 2002.
During the lower flow period between 2002 and mid 2003 there is a larger increase in Lake Alexandrina salinity using the inflow to salinity relationship. This results in a salinity difference of around 400 EC.
The 400 EC difference is maintained over the period between mid-2003 and 2006.
From 2007 onwards there is again a larger increase in Lake Alexandrina salinity using inflow to salinity relationship that results in an additional 200 EC difference during each year, resulting in a net difference of around 1000 EC by mid-2009.

98
0
200
400
600
800
1000
1200
1400
1600
1800
2000
2200
2400
2600
2800
3000
3200
3400
3600
1975
1976
1977
1978
1979
1980
1981
1982
1983
1984
1985
1986
1987
1988
1989
1990
1991
1992
1993
1994
1995
1996
1997
1998
1999
2000
2001
2002
2003
2004
2005
2006
2007
2008
2009
Lake
Alexandrina Salinity (EC)
Year
Baseline Conditions ‐ Basin Plan Model Run
Replicated Baseline Flow Conditions using Lake Alexandrina Inflow to Salinity Relationship
Figure B4 Lake Alexandrina Salinity - Basin Plan Baseline Conditions vs Replicated Baseline
Flow Conditions using Lake Alexandrina Inflow to Salinity Relationship of Heneker (2010)
Further examination of the most recent BIGMOD calibration results have indicated that the calibrated salinity input to Lake Alexandrina during the recent drought may be under estimated. This does not invalidate the modelling results produced for the Basin Plan but highlights the difficulties in modelling salt inputs and salinity, particularly when assessing changing flow conditions.
B.4 Conclusions
Many of the differences between the observed data and Baseline Conditions are explained in the above. It is difficult to assess the consequential qualifications that should be placed on the Proposed Basin Plan results but it does highlight the danger of placing too much emphasis on absolute values from model runs.
Both water level and salinity are critical parameters in the assessment of impacts on the Lower Lakes. Based on the analysis above, it is likely that:
the absolute water levels as represented under Baseline Conditions may be over estimated during periods of reduced water availability as a result of higher inflow volumes to Lake Alexandrina than would be expected to occur
salinity in Lake Alexandrina is likely to be under estimated under Baseline Conditions due to the over estimation of lake level and the potential under estimation of salt inflow.
In terms of water level, the results do not simply imply an over estimation of water level equal to the difference between the observed data and those under Baseline Conditions (around 0.5m too high). However, the over estimation of water level under Baseline Conditions during a significantly reduced flow period is likely to be in the order of 0.2 to 0.3m per year.
It is more difficult to separate the effect of flow and water level on salinity with the effects from a potential under estimation of salt load inputs. From the analysis above, the difference in Lake Alexandrina salinity between results under Baseline Conditions with those using inflow to salinity relationship is around 200 EC per year during very low flow periods. A large annual

99
inflow and hence barrage outflow would likely reset the difference. To ensure a conservative approach to the analysis, the inflow to salinity relationship of Heneker (2010) has been used to model and assess the salinity response in the Lower Lakes for each water recovery scenario. This has also allowed assessment over the longer period of 1895-96 to 2008-09.
Overall, understanding the sensitivity of the results allows the identification of periods where there is likely to be a risk of water levels falling too low or salinity rising too high. This approach is used during the assessment of the results from the water recovery scenarios.

100
APPENDIX C Comparison of 2800 GL and 2750 GL Water Recovery
Prior to the release of the Proposed Basin Plan in November 2011, the MDBA proposed a water recovery target of 2800 GL. The figure of 2750 GL that was finally included in the Proposed Basin Plan represented a reduction of 50 GL in the water to be recovered from parts of the Northern Basin, upstream of Menindee Lakes.
Advice from the MDBA indicated that the decision was made to reduce the water recovery target by 50 GL following an assessment of the benefits of this water in meeting downstream water requirements. The additional recovery was considered to provide limited benefits, particularly with respect to long-term average metrics.
The EWRs in the Southern Basin are primarily supplied from within the Southern Basin itself and as such, much of the pre-processing and the development of an environmental demand sequence that was prepared for BP 2800 GL was used in the modelling of BP 2750 GL.
The high inter-annual flow variability of the Murray-Darling Basin means that changes in the high and low flow ranges may not be observable when only considering long-term averages. This is particularly important when considering flow that originates from the Northern Basin. As a result, an initial analysis of the results from both BP 2800 GL and BP 2750 GL was undertaken.
Table C1 presents an initial summary of the Lake Alexandrina inflow and barrage outflow statistics for both water recovery scenarios. These highlight the high variability in inflow and outflow as well as little observable difference between the scenarios. There is only a 10 GL difference in the annual average barrage outflow and 5 GL difference in the median.
Table C1 Lake Alexandrina Inflow and Barrage Outflow Statistics - BP 2800 GL vs BP 2750 GL
(1895-96 to 2008-09)
Lake Inflow (GL) Barrage Outflow (GL) Statistics
BP 2800 GL BP 2750 GL BP 2800 GL BP 2750 GL
Mean 7655 7650 6840 6830
Median 6300 6310 5485 5490
Minimum 1275 1125 490 450
Maximum 43730 43690 42840 42800
10th Percentile 2400 2395 1605 1600
90th Percentile 12725 12725 11880 11880
Figure C1 shows the annual inflow to Lake Alexandrina and Figure C2 shows the annual barrage outflows. At the scale shown, both show little difference inter-annual difference.

101
0
5000
10000
15000
20000
25000
30000
35000
40000
45000
1895‐96
1900‐01
1905‐06
1910‐11
1915‐16
1920‐21
1925‐26
1930‐31
1935‐36
1940‐41
1945‐46
1950‐51
1955‐56
1960‐61
1965‐66
1970‐71
1975‐76
1980‐81
1985‐86
1990‐91
1995‐96
2000‐01
2005‐06
Lake
Alexandrina Inflow (G
L/year)
Water Year
2800 GL Water Recovery
2750 GL Water Recovery
Figure C1 Annual Lake Alexandrina Inflows - BP 2800 GL vs BP 2750 GL
0
5000
10000
15000
20000
25000
30000
35000
40000
45000
1895‐96
1900‐01
1905‐06
1910‐11
1915‐16
1920‐21
1925‐26
1930‐31
1935‐36
1940‐41
1945‐46
1950‐51
1955‐56
1960‐61
1965‐66
1970‐71
1975‐76
1980‐81
1985‐86
1990‐91
1995‐96
2000‐01
2005‐06
Barrage
Outflow (G
L/year)
Water Year
2800 GL Water Recovery
2750 GL Water Recovery
Figure C2 Annual Barrage Outflows - BP 2800 GL vs BP 2750 GL
The difference in the annual inflow to Lake Alexandrina and barrage outflow are shown in Figures C3 and C4. Despite the total difference in inflow and outflow between the two scenarios being approximately 790 GL over 114 years, in a small number of instances there are larger variations. However, where there is a larger difference this is generally counter-acted the following year, that is, where there is a large positive difference in one year then a negative

102
difference in the successive year follows. This indicates that there may be a sequencing change rather than an overall reduction in volume reaching the site.
The differences between the scenarios are unlikely to cause significant changes to the resulting hydrology and salinity regime in the Lower Lakes. Hence for the analysis undertaken in this report the scenarios are considered to be effectively inter-changeable and it was considered appropriate to only use the results from BP 2750 GL. However, before this conclusion can be applied to the Coorong, the effects of the variations on the Coorong itself need to be analysed separately.
‐200
‐150
‐100
‐50
0
50
100
150
200
1895‐96
1900‐01
1905‐06
1910‐11
1915‐16
1920‐21
1925‐26
1930‐31
1935‐36
1940‐41
1945‐46
1950‐51
1955‐56
1960‐61
1965‐66
1970‐71
1975‐76
1980‐81
1985‐86
1990‐91
1995‐96
2000‐01
2005‐06
Difference in Lake Alexandrina Inflow (G
L/year)
Water Year
Inflow Difference (2800 GL ‐ 2750 GL)
Figure C3 Difference in Annual Lake Alexandrina Inflows - BP 2800 GL vs BP 2750 GL

103
‐150
‐100
‐50
0
50
100
150
1895‐96
1900‐01
1905‐06
1910‐11
1915‐16
1920‐21
1925‐26
1930‐31
1935‐36
1940‐41
1945‐46
1950‐51
1955‐56
1960‐61
1965‐66
1970‐71
1975‐76
1980‐81
1985‐86
1990‐91
1995‐96
2000‐01
2005‐06
Difference in Barrage
Outflow (GL/year)
Water Year
Outflow Difference (2800 GL ‐ 2750 GL)
Figure C4 Difference in Annual Barrage Outflows - BP 2800 GL vs BP 2750 GL