review of state variances in va disability … of state variances in va disability compensation...
TRANSCRIPT

Department of Veterans Affairs Office of Inspector General
Review of State Variances in VA
Disability Compensation Payments
Report No. 05-00765-137 May 19, 2005 VA Office of Inspector General
Washington, DC 20420

Review of State Variances in VA Disability Compensation Payments
Table of Contents
Page
Executive Summary ........................................................................................................ iIntroduction ...................................................................................................................... 1
Purpose............................................................................................................................. 1
Background ...................................................................................................................... 1Scope and Methodology .................................................................................................. 8
Results and Conclusions ..................................................................................10
Issue 1: Comparison of Average Annual VA Disability Compensation Payments and Percentages of Veterans Receiving Compensation by State................... 10
Issue 2: Influences of Demographic and Processing Factors on Average Annual Compensation Payments ................................................................................ 20
Issue 3: Rating Decisions for Certain Disabilities Influence Average Disability Compensation Payments ................................................................................ 35
Issue 4: Claims Development Consistency Is Needed ................................................ 46
Issue 5: VBA Needs to Reduce Error Rates and Strengthen Quality Improvement ... 55
Issue 6: Survey of Raters to Assess Factors That Affect the Consistency of Ratings from State to State ........................................................................ 58
Issue 7: Source and Consistency of Disability Examinations ..................................... 67
Issue 8: Fraudulent and Invalid VA Disability Compensation Claims ....................... 70 Recommendations.......................................................................................................... 74
Appendixes A. Summary of Selected Studies of the VA Disability Compensation Program
and Rating Schedule ............................................................................................... 75
B. Selected Reviews of VA’s Disability Programs and Schedule for Rating Disabilities .............................................................................................................. 82
C. Diseases Subject to Presumptive Service Connection ........................................... 84
D. VA Compensation Payment and Program Characteristics by State....................... 87
E. Survey of Rating Veterans Service Representatives and Decision Review Officers (March and April 2005).......................................................................... 152
F. Survey Responses for Highest and Lowest Average Compensation Payment States ............................................................................. 176
VA Office of Inspector General

I
Review of State Variances in VA Disability Compensation Payments
G. Income Verification Match Results for Veterans with Individual Unemployability by State–FY 2004..................................................................... 183 H. Summary of Monetary Benefits........................................................................... 185
Under Secretary for Benefits Comments.............................................................. 186
J. OIG Contact and Staff Acknowledgments........................................................... 191 K. Report Distribution............................................................................................... 192
VA Office of Inspector General

Review of State Variances in VA Disability Compensation Payments
Executive Summary
Introduction
In December 2004, the Chicago Sun-Times ran a series of articles highlighting low disability compensation payments for Illinois veterans compared to national data. In reaction to these articles, Congressman Dennis Hastert, Speaker of the House of Representatives; Congressman Lane Evans, Ranking Member of the House Veterans’ Affairs Committee; and numerous other members of the Illinois congressional delegation sent a December 10, 2004, letter to the Secretary of Veterans Affairs requesting a review of all factors that could be contributing to the disparity experienced by Illinois veterans as compared to veterans in other states. In response, the VA Secretary requested that the Office of Inspector General (OIG) determine why there are differences in the VA’s average monthly disability compensation payments made to veterans living in different states. Since then, Senators Richard J. Durbin and Barack Obama have also expressed interest in this issue.
Historical Perspective
A Chicago Sun-Times article presented the fiscal year (FY) 2003 ranking of average annual disability compensation payments by state. This particular ranking, obtained from the Veterans Benefits Administration (VBA), reflects an average rollup of all claims decisions made over several decades, which are still being paid. Illinois ranked 50th. Our review of more recent data for new claims decisions during the past 6 years shows that Illinois moved in state ranking from 44th in FY 1999 to 23rd in FY 2004.
Historical data for the 6-year period shows that the national variance from the low to high states increased from $3,383 in FY 1999 to $5,043 in FY 2004. In contrast, data for new claims decisions showed the variance increased from $2,915 in FY 1999 to $6,054 in FY 2004. For FY 2004 claims, New Mexico had the highest average annual amount of any state at $11,206. Merely removing New Mexico from the new claim state ranking reduced the national variance from $6,054 to $3,284, suggesting that state may be cause for concern.
Differences in average annual compensation payments by state is not necessarily indicative of a problem. For every state to have similar average payments, every factor that affects payments would have to be virtually identical within each state. Statistically, this would be unachievable. There are numerous factors that affect payments by state. Some of these are veteran demographic factors that are generally beyond VA influence, such as the percentage of military retiree populations in each state. Because of these factors, some variance is to be expected. On the other hand, there are factors that affect compensation payments that VA has direct influence over, such as disability rating
VA Office of Inspector General i
Review of State Variances in VA Disability Compensation Payments
decisions. A more definitive question is whether the magnitude of the variance from the highest average state payment to the lowest average state payment is within acceptable limits. The objective of this review was to determine why the variance exists and whether there is cause for concern.
Review Methodology
To accomplish our objective, we identified more than 20 possible demographic and benefit rating factors that might affect the average amount of disability compensation payments by state and extracted 6 years (FYs 1999–2004) of data from VBA information systems in order to analyze these factors. After analyzing and trending this data, we concluded that, because the majority of state average payments fell within a normal deviation from the national average payment, a detailed review of all states would not be beneficial in helping to explain whether the full range of the variance was problematic. Therefore, we selected two clusters of states—one cluster representing the six states with the highest average compensation payments and one representing the six states with the lowest payments. We then analyzed the demographic and claims processing factors to determine the extent to which these factors impacted the FY 2004 variances.
We also issued a questionnaire to 1,992 VA regional office (VARO) rating specialists and decision review officers (DROs) to gain their perspective on training and issues that affect the rating of disability claims. We evaluated 2,100 post-traumatic stress disorder (PTSD) claims folders at 7 VAROs, including 3 in the high cluster and 2 in the low cluster. We reviewed the quality and consistency of medical examinations used to support disability rating decisions, and we assessed the effectiveness of the VBA Statistical Technical Accuracy Review (STAR) program in identifying and reducing certain types of processing errors in rating decisions. We reviewed prior internal and external studies conducted during the last 50 years that addressed similar issues. Although many of these studies identified concerns with inconsistent rating decisions, the situation still exists. Previous and ongoing OIG investigative efforts involving benefits fraud were also considered as a factor impacting the amount of disability compensation payments.
FY 2004 State Ranking
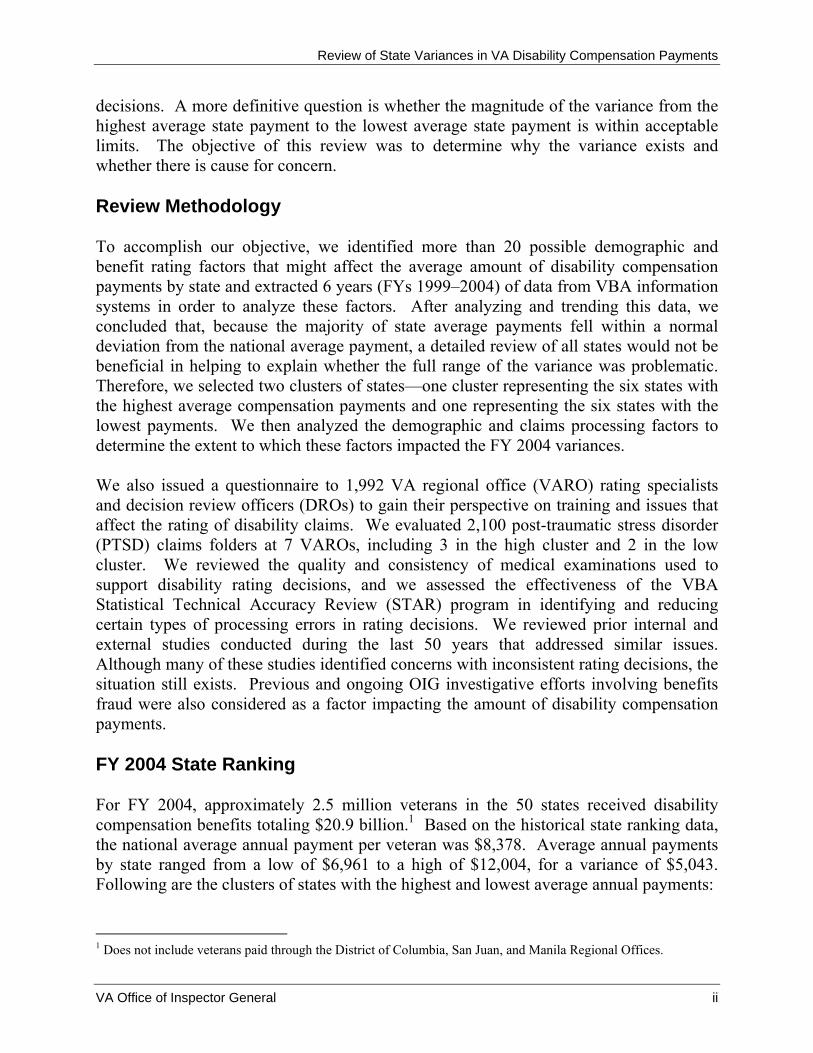
For FY 2004, approximately 2.5 million veterans in the 50 states received disability compensation benefits totaling $20.9 billion.1 Based on the historical state ranking data, the national average annual payment per veteran was $8,378. Average annual payments by state ranged from a low of $6,961 to a high of $12,004, for a variance of $5,043. Following are the clusters of states with the highest and lowest average annual payments:
1 Does not include veterans paid through the District of Columbia, San Juan, and Manila Regional Offices.
VA Office of Inspector General ii
Review of State Variances in VA Disability Compensation Payments
High Cluster Low Cluster New Mexico $12,004 Indiana $7,287 Maine 11,626 Michigan 7,241 Arkansas 10,968 Connecticut 7,204 West Virginia 10,866 Ohio 7,039 Oklahoma 10,697 New Jersey 7,028 Oregon 10,277 Illinois 6,961
Average $11,073 Average $7,127
Comparing the high cluster average of $11,073 to the national average of $8,378 shows a variance of $2,695. The low cluster average is $1,251 below the national average. Preliminarily, this suggests that the high cluster may be more problematic than the lower ranked states.
Demographic and Benefit Rating Factors
The following demographic and benefit rating factors help explain the variances in state average annual disability compensation payments. Demographic factors are variables that VA has virtually no control over. Our review shows that many of these variables have a correlation to the ranking of compensation payments by state. These factors support the presumption that some part of the variance is predictable and valid.
• Power of Attorney Representation. Data indicates that veterans whose claims are represented by veterans service organizations receive, on average, $6,225 more per year than those without representation. There is also a correlation between state ranking of compensation payments and the percentage of representation in that state. For example, the high cluster of states shows an average representation of 69.5 percent, while the low cluster averages 54.7 percent representation.
• Enlisted versus Officer. On a national level, data indicates that enlisted veterans average $1,775 more per year than veterans who served as officers. There is also a correlation between the state ranking and the percentage of enlisted personnel. For example, the high cluster shows an average of 63.4 percent enlisted personnel receiving compensation benefits compared to the low cluster, which shows 44.4 percent enlisted personnel receiving benefits.
• Military Retirees versus Non-Military Retirees. Data indicates that military retirees receive $1,438 more per year than non-military retired claimants. Our analysis shows that states with a higher percentage of retired military veterans are ranked higher in terms of average annual disability compensation payments. For example, the high cluster averages 27.6 percent retired military veterans receiving compensation benefits compared to the low cluster, which averages 16.6 percent military retirees.
VA Office of Inspector General iii

Review of State Variances in VA Disability Compensation Payments
• Participation of Veterans Receiving Benefits. Data indicates a correlation between the state ranking and the percentage of veterans who reside in a state and who receive disability compensation. For example, the high cluster shows an average of 12.3 percent of the veterans in those states receiving benefits compared to 7.7 percent in the low cluster. One explanation for this is the rate at which veterans submit new disability claims. For example, the rate of new claims for the high cluster was 103.2 claims per 1,000 veterans in the state, compared to only 43.5 claims per 1,000 veterans for states in the low cluster.
• Period of Service. Data indicates that Vietnam veterans receive, on average, $2,328 more in annual compensation payments than veterans in the next highest period of service. The national average compensation payment by period of service is: Vietnam–$10,930, Korean Conflict–$8,602, World War II–$7,798, Peacetime– $6,979, and Gulf War–$6,058. Our analysis shows a correlation between the percentage of compensation recipients who are Vietnam veterans and the state rankings. For example, the high cluster shows an average 39.4 percent of veterans receiving compensation are Vietnam veterans compared to 33.8 percent in the low cluster. The number and extent of service-connected disabilities for presumptive conditions are greater for Vietnam veterans, which partially explains why their average compensation payments are higher than those of veterans of other periods of service. The impact of period of service is more definitive when analyzing the mix of percentages of different periods of service. For example, states with a high percentage of Vietnam veterans and a low percentage of World War II veterans have higher average compensation payments. Our analysis shows that the high cluster averages 13 percent World War II veterans, while the low cluster averages 23 percent.
• Branch of Service. Analysis of branch of military service indicates that Marine Corps veterans received the highest average amount of compensation when compared to the other branches and that there was a correlation with the average amount of disability payments by each branch of service and the state ranking. However, the percentage of veterans in each branch of service did not correlate to the state rankings. Data indicates that states with higher average payments make higher payments to all branches of service, and those with lower average payments make lower payments to all branches of service.
• Dependents. Data indicates that, nationally, veterans with dependents receive more per year than veterans without dependents. States with higher percentages of veterans with dependents will average higher disability payments. Data shows that the percentage of veterans with dependents in the high cluster averaged 43.8 percent compared to 30.3 percent in the low cluster.
VA Office of Inspector General iv

Review of State Variances in VA Disability Compensation Payments
• Special Monthly Compensation. Data shows that the percentage of veterans receiving Special Monthly Compensation (SMC) and the average amounts of SMC per veteran impact the ranking for average annual compensation payments by state. For example, in the high cluster 9 percent of the veterans received SMC, while the percent of veterans receiving SMC in the low cluster averaged 7.2 percent.
• Age. Data shows that veteran age minimally influences disability compensation amounts. For example, average veteran age in the high cluster was 58 compared to the average age of 61 in the low cluster. While this suggests that younger veteran populations may result in higher payment rates, the relationship is more closely associated with period of service, which our analysis shows includes more Vietnam era recipients.
• Average Number of Disabilities. The more service-connected disabilities a veteran has will typically result in a higher overall combined rating and a higher benefit payment. There appears to be a correlation between the number of disabilities and the high and low clusters, with average numbers of disabilities of 3.0 and 2.4, respectively, a 25 percent difference.
The following claims processing characteristics include those factors that VA has some control over.
• Pending Claims. There did not seem to be a correlation between pending claims and the variance, as most states in the high and low clusters exceeded the 50-state average for pending claims. There was a small correlation between the percent of pending claims and the timeliness of claims processing, with the low cluster having a slightly higher rate of claims processed in more than 120 days. Of note was the fact that the percent of ratings completed in more than 120 days by state ranged from a low of 29.8 percent to a high of 80.6 percent in FY 2004.
• Brokered Claims. Claims transferred to other states for adjudication due to workload demands (brokered claims) may influence the average annual payment made by the referring state; however, since VBA does not track the payment history of brokered cases by claim folders, we could not determine if brokering affects the variance. It is noteworthy that for FY 2004, 13.3 percent, or more than 91,000 cases, were brokered to other states, with the high cluster averaging 10.7 percent and the low cluster 13.9 percent brokered claims. Brokered claims ranged from a low of no cases to a high of 88.2 percent of all cases. Illinois brokered 21.1 percent of all its cases in FY 2004.
• Appeal Rates. Appeal rates did not appear to influence the variance. While data shows appeal rates averaged 47.7 appeals per 1,000 veterans in the high cluster as
VA Office of Inspector General v
Review of State Variances in VA Disability Compensation Payments
compared to 32.7 appeals in the low cluster, 10 out of the 12 states in both clusters were not significantly different. Appeal rates also varied significantly by state, from a low of 11 to a high of 80 per 1,000 veterans.
• Transferred Cases. Another factor that potentially impacts the variance is cases originally adjudicated in one state and later transferred to another state because the veteran relocated. Since VBA does not track transferred cases, we were unable to determine the impact transferred cases had on the variance.
• Grant Rates. Another factor that might impact the variance would be grant and denial rates for compensation claims. While VBA published grant rates for a number of years through FY 2002, it discontinued the practice because the data was determined to be incomplete and misleading. Since VBA stopped tracking grant and denial rates by VARO, we were unable to determine the impact these rates had on the variance.
• Rater Experience. An analysis of raters with more than 2 years experience did not appear to demonstrate a correlation to the state rankings. We found 86 percent of the raters in the high cluster averaged more than 2 years experience compared to 82 percent in the low cluster. It should be noted that Illinois raters having more than 2 years experience increased from 69.4 percent in FY 2002 to 100 percent in FY 2004. This may account for some of Illinois’ rise in the state ranking from 37th in FY 2002 to 5th in FY 2005.
Our analysis of rating decisions shows that some disabilities are inherently more susceptible to variations in rating determinations. This is attributed to a combination of factors, including a disability rating schedule that is based on a 60-year-old model and some diagnostic conditions that lend themselves to more subjective decision making.
• VA Schedule for Rating Disabilities. The VA disability compensation program is based on a 1945 model that does not reflect modern concepts of disability. Over the past 5 decades, various commissions and studies have repeatedly reported concerns about whether the rating schedule and its governing concept of average impairment adequately reflects medical and technological advancements and changes in workplace opportunities and earning capacity for disabled veterans. Although some updates have occurred, proponents for improving the accuracy and consistency of ratings advocate that a major restructuring of the rating schedule is long overdue.
• Ratings for the 15 Body Systems. Some body systems result in a much wider range of ratings, demonstrating that there are some disabling conditions that are affected more by subjective decision making. For example, variability in ratings by body system ranged from a low of 5 percent in the Skin/Scars body system to a high of 26 percent in the Systemic (Infectious Diseases, Immune Disorders, and Nutritional
VA Office of Inspector General vi
Review of State Variances in VA Disability Compensation Payments
Deficiencies) body system. Data shows that for ratings that can be independently validated based on physical measurements (for example, amputations), the assigned degrees of disability were consistent. For example, our review of data for 276,024 veteran claims with Musculoskeletal and Auditory body systems-related disabilities, such as above-the-knee or below-the-knee amputations, tinnitus, and total deafness, found that veterans received consistent ratings nationwide. The rating schedule criteria for other body systems, such as mental disorders, were more susceptible to interpretation and judgment because much of the evidence to support a disability is self-reported by the claimant. We selected the mental disorder system for further analysis because it had the fourth highest variability rate of the 15 body systems, the highest overall nationwide rating average of 58 percent, and it included PTSD, which is one of the fastest growing disability conditions.
• Ratings for PTSD. During FYs 1999–2004, the number and percentage of PTSD cases increased significantly. While the total number of all veterans receiving disability compensation grew by only 12.2 percent, the number of PTSD cases grew by 79.5 percent, from 120,265 cases in FY 1999 to 215,871 cases in FY 2004. During the same period, PTSD benefits payments increased 148.8 percent from $1.7 billion to $4.3 billion. Compensation for all other disability categories only increased by 41.7 percent. While veterans being compensated for PTSD represented only 8.7 percent of all compensation recipients, they received 20.5 percent of all compensation payments.
• Veterans with 100 Percent Disability Related to PTSD. Data shows that the variance in 100 percent PTSD cases is a primary factor contributing to the variance in average annual compensation payments by state. For example, the total $5,043 variance that exists from the low state to the high state is reduced to $3,323 when PTSD Individual Unemployability (IU) and schedular 100 percent PTSD payments are removed from the state averages. This suggests that 34.1 percent, or $1,720, of the $5,043 variance is explained by these cases. The driver is not the amount of the awards but the difference in the number of veterans with 100 percent PTSD ratings in each state. States with higher average payments have higher percentages of veterans rated 100 percent or IU for PTSD. For example, New Mexico has the highest payment average of $12,004, and 12.6 percent of its veterans are in this group. Illinois has the lowest average payment of $6,961 and only 2.8 percent of its compensation recipients are rated 100 percent for PTSD.
• All Veterans Rated with Individual Unemployability. From FY 1999 to FY 2004, the number of veterans receiving increased benefits for IU increased 107 percent from 95,052 to 196,916 (includes 53,390 PTSD cases). Data also shows a direct correlation to the variance, in that the high state cluster averaged 14.3 percent veterans with IU compared to only 5.4 percent in the low cluster.
VA Office of Inspector General vii

Review of State Variances in VA Disability Compensation Payments
• Percentage of 10 Percent Versus 100 Percent Ratings by State. Our analysis shows that states vary in terms of the percentages of 10 percent versus 100 percent ratings and that there is a correlation to the variance. For example, the high cluster averages fewer 10 percent ratings and more 100 percent than the low cluster. The high cluster averages 23.5 percent for veterans with 10 percent ratings and 11.6 percent for veterans with 100 percent ratings. The low cluster averages 35.7 percent for veterans with 10 percent ratings and 7.1 percent for veterans with 100 percent ratings.
• Lump-Sum Payments. In 1997, as part of an overall strategy to improve claims processing timeliness, we suggested that VBA could offer lump-sum payments to veterans to reduce the number of reopened claims. Taking into consideration that 30.6 percent of all claims are rated 10 percent, combined with results from our survey where rating specialists expressed concern with insufficient staff to adequately process claims, consideration should be given to offering lump-sum payments to veterans as settlement of all future compensation cases. Lump-sum payments for all veterans with disabilities rated 20 percent or less would result in reducing 46.9 percent, or 1.17 million active claims. It would also result in reducing recurring compensation payments of $1.96 billion a year and would free up staff to improve the quality and timeliness of future workload. Acceptance of a lump-sum payment would not change a veteran’s eligibility for VA health care.
Survey of Raters
We issued a questionnaire to 1,992 rating specialists and DROs to gain their perspective on training and on the issues that affect the rating of disability claims; 1,349 (67.7 percent) responded. Results included:
• Eighty-one percent agreed that when rating a claim they start with the assumption that the veteran is applying for the highest possible rating.
• Sixty-five percent of respondents reported insufficient staff to ensure timely and quality service.
• Fifty-seven percent responded that it was difficult to meet production standards if they adequately develop claims and thoroughly review the evidence before issuing rating decisions.
• Forty-one percent of the respondents estimated that 30 percent or more of the claims were not ready to rate when presented for rating.
VA Office of Inspector General viii

Review of State Variances in VA Disability Compensation Payments
• Twenty percent estimated that, of the claims that were not ready to rate, more than 10 percent were actually rated without all the needed information.
• Fifty-two percent of the raters responded they could support two or more different ratings for the same medical condition.
• Survey respondents expressed generally positive opinions of the quality of their training, but indicated training has not received high priority.
Disability Examinations
Our review determined there was no apparent difference in the quality of medical examination reports completed by VA and QTC Medical Group, Inc. (QTC) physicians. However, raters surveyed believe many VA and QTC examinations are incomplete. Thirty-two percent of the survey respondents estimated that 20 percent or more of the medical examinations should have been returned because they were not sufficient for rating purposes. Only 7 percent of the survey respondents estimated that more than 20 percent of the medical examinations were actually returned to the examiners because they were insufficient for rating. Very few raters interviewed have seen or were familiar with the reports generated through use of the medical examination report templates being developed by the VA Compensation and Pension Examination Program.
PTSD Case Reviews
We reviewed 2,100 compensation cases at 7 VAROs and found VBA procedures were not always followed, and that VAROs approached stressor verification requirements differently from state to state. In 527 (25 percent) of the 2,100 cases reviewed, we found inconsistencies in the methods raters used to develop and verify veteran-reported evidence about the claimed service-related stressor event before granting compensation benefits. The error rate ranged from a low of 11 percent in Oregon to a high of 40.7 percent in Maine. The error rate for Illinois was 21.7 percent. To demonstrate the potential consequence of not obtaining or developing adequate evidence to support a PTSD claim, the 25 percent error rate equates to questionable compensation payments totaling $860.2 million in FY 2004. Over the lifetimes of these veterans, the questionable payments would be an estimated $19.8 billion.
Our review at three VAROs revealed that the STAR program was ineffective in detecting the evidence development weaknesses identified in our review of PTSD cases. We determined that veterans sought less treatment for PTSD when their ratings were increased to 100 percent. Of 92 PTSD cases reviewed, we found that 39 percent had a decline in mental health visits after achieving 100 percent status. The average decline in visits was 82 percent, with some veterans receiving no mental health treatment at all.
VA Office of Inspector General ix
Review of State Variances in VA Disability Compensation Payments
Part of the problem is that the compensation program has a built-in disincentive to get well when veterans are reapplying to get their disability ratings increased.
Legislated Pay Increases
The disproportionate pay increases by Congress for higher rating levels impact the variance of compensation payments by state. An increase in the number of IU and 100 percent schedular ratings combined with disproportionate pay increases by Congress for higher rating levels has resulted in IU ratings and 100 percent schedular ratings comprising 16.3 percent of all ratings, which make up 57.4 percent of all disability compensation payments ($12 billion out of $20.9 billion). This is a primary reason why states with higher percentages of IU and 100 percent ratings have higher average annual compensation payments. For example, data shows that the high cluster averaged 25.9 percent IU and schedular 100 percent ratings compared to 12.5 percent for the low cluster.
Benefits Fraud
Fraudulent and improper claims are additional factors that will unnecessarily increase the amount of disability compensation payments if left unchecked. In addition to several major individual domestic fraud cases investigated over the years, such as the $11.2 million compensation fraud case in Atlanta, recent international benefits reviews by the OIG in the Philippines and Puerto Rico saved $66 million in fraudulent and improper payments over a 5-year period. It should be noted that international benefits were not included in our variance analysis. VBA’s FY 2004 income verification match with data from the Internal Revenue Service identified 8,486 veterans rated IU who reported earned income. If all 8,486 matches were fraudulent and invalid IU cases, the estimated cost savings for the next 5 years is over $600 million.
Conclusion
Variances in average annual disability compensation payments by state have existed for decades. The factors that influence these payments are complex and intertwined. As outlined in this report, compensation payments by state are affected by legislated pay increases, an antiquated rating schedule, veteran demographics, and inconsistent rating decisions. Payments may be affected by claims processing practices, disability examinations, timeliness pressures, staffing levels, rater experience and training, and fraud. We concluded that some disabilities are inherently prone to subjective rating decisions, especially for conditions such as PTSD where much of the information needed to make a rating decision is not physically apparent and is more susceptible to interpretation and judgment. This subjectivity leads to inconsistency in rating decisions.
VA Office of Inspector General x
Review of State Variances in VA Disability Compensation Payments
VBA acknowledges and is concerned that there are variances in claims decisions across the system. In fact, the October 2001 VA Claims Processing Task Force Report noted that the need for greater accountability and consistency in benefits delivery operations was the most significant issue facing VBA at the time. Since then, VBA has implemented several initiatives to improve consistency of decision making. While much has been accomplished, more needs to done. The following recommendations are intended to assist VBA in their efforts to further improve consistency in rating decisions.
Recommendations
To address issues pertaining to compensation payment variances, we recommend that the Under Secretary for Benefits take the following improvement actions:
1. Conduct a scientifically sound study using statistical models, such as a multi-variant regression analysis, of the major influences on compensation payments to develop baseline data and metrics for monitoring and managing variances, and use this information to develop and implement procedures for detecting, correcting, and preventing unacceptable payment patterns.
2. Coordinate with the Veterans’ Disability Benefits Commission to ensure all potential issues concerning the need to clarify and revise the Schedule for Rating Disabilities are reviewed, analyzed, and addressed.
3. Conduct reviews of rating practices for certain disabilities, such as PTSD, IU, and other 100 percent ratings, to ensure consistency and accuracy nationwide. At a minimum, these reviews should consist of data analysis, claims file reviews, and onsite evaluation of rating and management practices.
4. Expand the national quality assurance program by including evaluations of PTSD rating decisions for consistency by regional office, and to ensure sufficient evidence to support the rating is fully developed and documented, such as verifying the stressor event.
5. Coordinate with the Veterans Health Administration to improve the quality of medical examinations provided by VA and contract clinicians, and to ensure medical and rating staff are familiar with approved medical examination report templates and that the templates are consistently used.
6. In view of growing demand, the need for quality and timely claims decisions, and the ongoing training requirements, reevaluate human resources and ensure the VBA field organization is adequately staffed and equipped to meet mission requirements.
VA Office of Inspector General xi

Review of State Variances in VA Disability Compensation Payments
7. Consider establishing a lump-sum payment option in lieu of recurring monthly payments for veterans with disability ratings of 20 percent or less.
8. Undertake a more detailed analysis to identity differences in claims submission patterns to determine if certain veteran sub-populations, such as World War II, Korean Conflict, or veterans living in specific locales, have been underserved, and perform outreach based on the results of the analysis to ensure all veterans have equal access to VA benefits.
Comments
The Under Secretary for Benefits agreed with the review findings and recommendations and provided acceptable improvement plans. (See Appendix I for the full text of the Under Secretary for Benefits’ comments.) We will follow up on the implementation of recommended improvement actions until they are completed.
(original signed by:)
MICHAEL L. STALEY Assistant Inspector General for Auditing
VA Office of Inspector General xii

Review of State Variances in VA Disability Compensation Payments
Introduction Purpose
At the request of the Secretary of Veterans Affairs, the OIG conducted a review to evaluate factors contributing to variances in average annual VA disability compensation payments by state. The Secretary initiated the request in response to concerns expressed by Members of Congress about the reasonableness of the payment variances.
Background
Congressional Concerns about Variances in VA Disability Compensation Payments. In December 2004, the Secretary asked for the OIG review after receiving inquiries from the Senate and House Committees on Veterans’ Affairs and an Illinois delegation that included the Speaker of the House, the Ranking Member of the House Committee on Veterans’ Affairs, and 16 other Members of Congress. The congressional delegation expressed concerns that possible inconsistencies in VA disability rating practices may have caused Illinois veterans to receive lower disability ratings and smaller payments compared to veterans in other states. The members of the Illinois delegation requested that the Secretary assess the disability rating methods used at VARO Chicago, which processes claims for Illinois veterans, and identify other factors that might be contributing to payment differences nationwide.
VA Disability Compensation Program. Part of VA’s Compensation and Pension (C&P) program, disability compensation is a tax-free monetary benefit paid to veterans who are disabled by injury or disease incurred or aggravated during military service. The purpose of this benefit is to compensate veterans for the average loss in earnings capacity in civilian occupations associated with the severity of the service-connected conditions. Service-disabled veterans are entitled to compensation benefits regardless of their income or employment status, with the exception of IU benefits.
In FY 2004, VAROs administered compensation benefits totaling $20.9 billion to about 2.5 million veterans residing in the 50 states. The recurring compensation payments to these veterans averaged $8,378 annually. For individual states, the average annual payments ranged from a high of $12,004 for veterans residing in New Mexico to a low of $6,961 for veterans in Illinois. The New Mexico average annual payment was 43.3 percent higher than the average payments for all 50 states and the Illinois average payment was 16.9 percent lower than the 50-state average. The difference between the high and low average annual payments was $5,043.
Disability Compensation Claims Processing. After a veteran submits a benefits application to the VARO of jurisdiction, a VARO veterans service representative (VSR) develops claim evidence by obtaining the veteran’s military service medical records and other relevant medical information. The veteran undergoes a medical examination by a
VA Office of Inspector General 1
Review of State Variances in VA Disability Compensation Payments
VA or a contract clinician. A VARO rating specialist evaluates the evidence and determines if the claimed impairments are service-connected, assigns a degree of disability for each impairment by applying the medical criteria of VA’s rating schedule, and determines the veteran’s overall degree of service-connected disability.
The rating schedule classifies diagnostic codes by 15 body systems, such as musculoskeletal, mental, and cardiovascular; by specific conditions, such as impairment of the knee, PTSD, and hypertensive disease; and by the severity of the conditions. The degree of disability for both individual conditions and the overall disability rating is expressed as a percentage in 10 percent increments from 0 percent, for conditions that are disabling but not to a compensable degree, to 100 percent, for conditions that are totally disabling.
After the disability rating and determination of service-connection have been completed, the VSR processing the claim enters the pertinent rating and claim information into VA’s automated Benefits Delivery Network (BDN) to begin the veteran’s monthly compensation payments. These payments are usually retroactive to the date the VARO received the claim. If a service-connected condition worsens, a veteran can file a claim for an increase in disability rating and higher compensation payments. If VA denies a disability claim or assigns a rating lower than the veteran feels is appropriate, the veteran may appeal the decision first to the VARO of jurisdiction, then to the VA Board of Veterans Appeals (BVA), and finally to the U.S. Court of Appeals for Veterans Claims (CAVC). Under certain circumstances, a veteran who disagrees with a decision of CAVC may appeal to the U.S. Court of Appeals for the Federal Circuit and then to the U.S. Supreme Court.
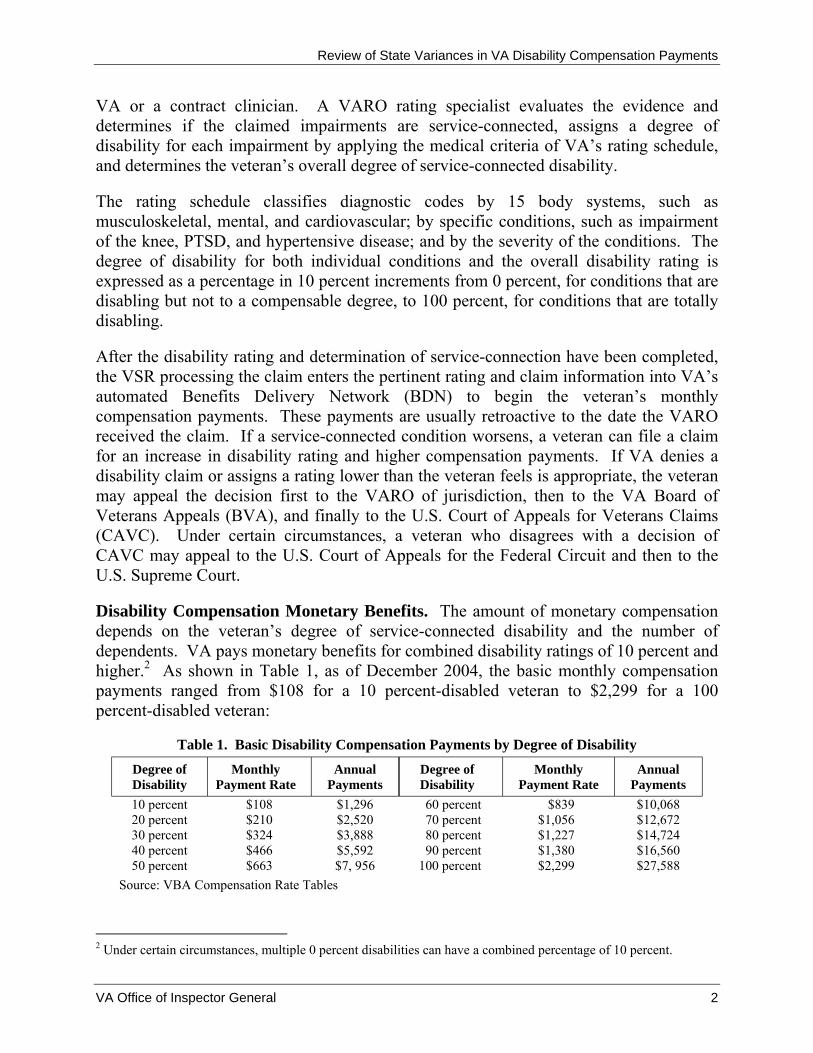
Disability Compensation Monetary Benefits. The amount of monetary compensation depends on the veteran’s degree of service-connected disability and the number of dependents. VA pays monetary benefits for combined disability ratings of 10 percent and higher.2 As shown in Table 1, as of December 2004, the basic monthly compensation payments ranged from $108 for a 10 percent-disabled veteran to $2,299 for a 100 percent-disabled veteran:
Table 1. Basic Disability Compensation Payments by Degree of Disability
Payments Payments Degree of Disability
Monthly Payment Rate
Annual Degree of Disability
Monthly Payment Rate
Annual
10 percent $108 $1,296 60 percent $839 $10,068 20 percent $210 $2,520 70 percent $1,056 $12,672 30 percent $324 $3,888 80 percent $1,227 $14,724 40 percent $466 $5,592 90 percent $1,380 $16,560 50 percent $663 $7, 956 100 percent $2,299 $27,588
Source: VBA Compensation Rate Tables
2 Under certain circumstances, multiple 0 percent disabilities can have a combined percentage of 10 percent.
VA Office of Inspector General 2
Review of State Variances in VA Disability Compensation Payments
For disability ratings of 30 percent or higher, VA pays additional benefits for veterans’ dependents. For example, if a 100 percent-disabled veteran has a spouse and two children under age 18, the monthly payment increases by $290 to $2,589. As of September 2004, 905,187 (36.3 percent) of the 2.5 million veterans were receiving additional benefits for dependents.
For very serious disabilities, such as the loss of a limb, VA pays additional SMC that exceeds the basic compensation rates. For example, VA would pay SMC benefits of $3,155 a month to a veteran disabled by the anatomical loss or loss of use of both hands with no dependents. For a veteran with the same disability who has a spouse and two children under age 18, VA would pay SMC benefits of $3,445 a month. VA also pays additional benefits if the veteran requires the regular aid and attendance of another person. As of September 2004, 203,149 veterans (8.1 percent) were receiving SMC benefits.
In FY 2004, the average degree of disability for all 2.5 million veterans receiving compensation benefits was 37.0 percent, which represents an 11.8 percent increase from the 33.1 percent average degree of disability in FY 2000. In FY 2004, the largest group of recipients by degree of disability was the 763,100 veterans who were rated 10 percent disabled (30.6 percent), but who accounted for only $977 million (4.7 percent) of compensation payments. In contrast, the 208,779 veterans rated 100 percent disabled equated to 8.4 percent of compensation recipients, but accounted for $6.5 billion (30.9 percent) of total compensation payments.
Disproportionate Relationship between Degrees of Disability and Compensation Payment Rates. As shown in Table 1, the compensation payment rates are not proportional to the corresponding degrees of disability, with the higher disability ratings having disproportionally larger monetary benefits than the lower ratings. Starting in the late 1950s, occasional non-linear disability rating-to-payment-rate relationships evolved as a result of periodic legislative rate increases that were weighted towards the higher ratings. By increasing the payment rates in this way, Congress surmised that higher disability ratings of over 50 percent adversely affect the ability to earn a living more than at lower rated disabilities, and that a disability rating of over 90 percent is the threshold for greatest need. The following examples and Figure 1 illustrate the relationships between disability ratings and compensation payment rates:
• A 100 percent disability rating is 10 times greater than a 10 percent rating, but the basic monthly 100 percent compensation payment rate of $2,299 is 21.3 times greater than the 10 percent payment rate of $108.
• A 100 percent rating is 2 times greater than a 50 percent rating, but the 100 percent payment rate is 3.5 times greater than the 50 percent payment rate of $663.
VA Office of Inspector General 3

Review of State Variances in VA Disability Compensation Payments
• A 100 percent rating is only 10 percent higher than a 90 percent rating, but the 100 percent payment rate is 70 percent higher than the 90 percent rate of $1,380.
Figure 1. Relationship between Degrees of Disability and Compensation Payment Rates
Monthly Rate
$2,500
$2,000
$1,500
$1,000
$500
$0 10% 20% 30% 40% 50% 60% 70% 80% 90% 100%
Degree of Disability
States with higher average disability ratings will have disproportionally higher average annual payments. As such, part of the variance is attributed to congressional pay setting. Additional payment amounts for SMC and dependents, which are also weighted towards the higher ratings, further increase compensation payment variances.
Basis of the VA Schedule for Rating Disabilities. Federal law has required VA to develop and apply a schedule to evaluate reductions in earning capacity resulting from specific disabilities or combination of disabilities. The rating schedule was to be based, as far as practicable, upon the average impairments of earning capacity resulting from such disabilities in civilian occupations. The law also requires VA to readjust the rating schedule from time to time in accordance with its experience. However, under no circumstances shall such readjustment cause a veteran’s disability rating to be reduced (38 U.S.C. 1155).
The concept of average impairment of earning capacity dates back to the 1919 rating schedule that had been developed in accordance with the provisions of the War Risk Insurance Act of 1917. The law required the development and application of a schedule for rating reductions in earning capacity resulting from permanent injuries based on average impairments of earning capacity resulting from such injuries in civilian occupations and not on the specific earning impairments for individual cases.
VA Office of Inspector General 4
Review of State Variances in VA Disability Compensation Payments
The last major modification to the rating schedule occurred in 1945, when it was revised to reflect advances in medicine, science, and technology and to add new diagnostic codes and a numerical indexing system for disabilities. Since then, VA has revised and expanded the schedule’s medical criteria several times to clarify terminology, add new conditions, and increase the number of levels of disability for some conditions. However, these more recent revisions have not changed the basic relationship between disabilities and average earnings impairment established in the 1945 rating schedule. Since 1994, VBA has revised rating schedule criteria for 13 of the 15 body systems.
Recurring Concerns about the Rating Schedule. Over the past 50 years, various commissions and studies, including the 1956 Bradley Commission, the 1971 Economic Validation of the Rating Schedule (ECVARS), and more recent VA-sponsored reviews, have repeatedly raised questions about whether the rating schedule and the concept of average impairment adequately reflected the effects of economic, medical, and social changes on the earning capacity of disabled veterans. Some of the concerns that one or more of the studies cited include:
• The rating schedule is based on the principle of average impairment of earning capacity, not on the effect of the individual veteran’s specific impairment.
• The schedule may not adequately reflect advances in medicine, technology, and rehabilitation, or changes in types of work, workplace requirements, or societal attitudes towards disability.
• The disabilities in the schedule may better reflect functional impairments instead of impairment to earnings capacity.
• The schedule does not take into consideration the veteran’s actual earnings or income.
• Unlike other disability programs, VA disability compensation payments are usually a lifetime benefit, and disability ratings are rarely reduced and usually increase over time.
• Different raters or VAROs may not consistently apply rating criteria when making disability determinations.
Significant findings of the studies and reviews are presented in more detail in Appendixes A and B. One recent study made no recommendations, but did raise some challenging questions.
Literature Review and Analysis of the Legislative History of the VA Disability Compensation Program. Under a VA contract, a research firm conducted a review and analysis of the legislative history of the disability compensation program for the use of the new congressionally-mandated Veterans’ Disability Benefits Commission. The 2004
VA Office of Inspector General 5

Review of State Variances in VA Disability Compensation Payments
research report reviewed the methods, conclusions, and recommendations of previous studies of VA’s disability compensation program. The report also discussed trends in national disability and the approaches used in different disability programs, such as Federal and state workers compensation. Although it made no policy recommendations, the report suggested nine prioritized questions that VA might consider for further research:
1. How well does the VA disability compensation program meet the intent of Congress of replacing average impairment to lost earning capacity of disabled veterans?
2. Do benefits compensate for loss of quality of life due to service-connected disabilities?
3. Should measures of impairment, disability criteria, and the rating schedule be reexamined?
4. Are VA disability compensation and other programs adequate for the risks of military service to health and life?
5. Does the disability benefit affect the incentive to work?
6. How well or to what extent do disability benefits contribute to beneficiaries’ total income?
7. Should Congress reconsider the requirement that disability compensation be based on average impairment and not on the loss of individual earning capacity?
8. How does rehabilitation affect earning capacity and how should disability compensation and rehabilitation programs be coordinated?
9. Should mentally disabled veterans be identified separately from those who are physically disabled?
Continuing Changes to Disability Compensation Requirements. In recent years, legislated changes to rating criteria and compensation program requirements have had the effect of expanding veterans’ potential eligibility and entitlement to disability compensation benefits as illustrated by the increase in disabilities presumed to be service-connected, elimination of the bar against concurrent receipt of compensation and military retirement benefits, and current proposals, which if enacted would relax evidence requirements pertaining to certain periods of service.
Expansion of Presumptive Conditions. VA awards disability compensation for certain illnesses or other conditions presumed to be service-connected, even when the conditions do not manifest themselves until many years after military service, if the condition can be reasonably associated with the veteran’s military service. In recent years, various
VA Office of Inspector General 6
Review of State Variances in VA Disability Compensation Payments
statutory changes have expanded the number of presumptive conditions and the periods in which they may be claimed in response to the experiences of modern warfare and advances in scientific and epidemiological knowledge. (See Appendix C for a listing of diseases subject to presumptive service connection.) For example:
• For veterans exposed to radiation from nuclear weapons testing during the 1940s and 1950s or other radiation-risk events, VA presumes service connection for leukemia and a number of other types of cancer.
• For Vietnam veterans exposed to Agent Orange or other herbicides, 11 diseases, such as non-Hodgkin’s lymphoma, diabetes, and prostate cancer, are presumed to be service-connected even when the conditions manifested themselves many years after military service.
• For Gulf War veterans, VA presumes service connection for a number of medically unexplained or multi-symptom illnesses, such as chronic fatigue syndrome, chronic muscle or joint pain, sleep disturbances, and abnormal weight loss that might occur within an as-yet-undetermined period.
Concurrent Receipt of VA Disability Compensation and Military Retirement Benefits. Until recently, veterans entitled to both disability compensation and military retirement benefits had their payments offset so that the total benefits would not exceed the maximum amount payable from either program. Because compensation benefits are income tax-free, veterans generally chose to receive the maximum compensation payable and offset their military retirement benefits, which are taxable. In November 2003, the National Defense Authorization Act for 2004 eliminated some of the restrictions on the concurrent receipt of these benefits. Beginning in 2004, veterans with disabilities of at least 50 percent and 20 years of military service began retaining an increasingly larger part of their concurrent benefits and would receive full concurrent benefits after 10 years. The law was subsequently amended to eliminate the 10-year phase-in period for 100 percent-disabled veterans, which allowed them to receive full concurrent benefits effective January 2005.
New Disability Benefits Commission Established. The National Defense Authorization Act for 2004 established a new commission, the Veterans’ Disability Benefits Commission, to conduct a study of benefits payable to veterans and survivors for service-connected disabilities and deaths. The study is to include an evaluation of the laws and regulations covering eligibility for benefits; compensation rates, including the appropriateness of the rating schedule, based on average impairment of earning capacity; and comparable benefits provided by other Federal programs, states, and the private sector. The commission is to consult with the Institute of Medicine of the National Academy of Sciences on the medical aspects of contemporary disability policies. The commission is to complete its report and recommendations within 15 months of its first meeting, which is scheduled for May 2005.
VA Office of Inspector General 7

Review of State Variances in VA Disability Compensation Payments
Scope and Methodology
In conducting this review, we performed a series of data analyses of disability compensation payments, claims processing information, and demographic factors using information from the BDN master record files, VBA annual reports, and other VA and non-VA sources. To complete these analyses in a timely manner, we used a methodology to summarize compensation data consistent with that used by VBA in their annual reports. Because of the complexity of continually tracking payments to millions of veterans, VBA uses a somewhat simplified approach in presenting some payment data. For example, to compute average annual compensation payments, VBA uses payment data for the veterans receiving compensation as of September 30, the last day of each fiscal year, and multiplies the monthly payment rate for each veteran by 12 months to calculate estimated annual average payment amounts. This method has some limitations in that it does not account for such factors as payments for retroactive periods, changes in payment rates, and gains and losses in veterans receiving compensation that occur throughout the year. While our methodologies were similar, the data sort criteria were not the same and resulted in minor differences in average annual payment by state. The VBA Annual Report uses RCS Report 0237 and aggregates data by veterans’ mail code. For our analysis, we sorted payment data from the C&P Master Record “Office of Jurisdiction” field and aggregated the data to the state level. However, based on our review of VBA’s historical payment data for the past 20 years, we believe the data is representative of the relative average payments made to veterans residing in different states.
Since the basis for this requested review was related to average annual payments by state, we based our analysis and data presentation by state where appropriate. Accordingly, we excluded data related to Puerto Rico, the Philippines, and the District of Columbia. To better understand the factors influencing the state payment variances, we selected the six states with the highest average annual payments (high payment states) and the six states with the lowest average annual payments (low payment states) for detailed analyses.
We also reviewed VBA claims processing and disability rating policies and procedures, as well as various studies and evaluations of disability compensation program and rating schedule issues. We discussed compensation program policies, procedures, issues, and initiatives with VBA headquarters and VARO managers and employees.
We conducted a web-based questionnaire survey of all 1,992 rating veterans service representatives (RVSRs) and DROs. The purpose of the survey was to obtain their views on issues affecting the rating of disabilities and the processing of compensation claims. The survey consisted of 38 questions about the respondents’ work experience, training, claims development practices, application of the rating schedule, production requirements, and staffing issues. We received responses from 1,349 (67.7 percent) of the potential participants.
VA Office of Inspector General 8
Review of State Variances in VA Disability Compensation Payments
We also conducted onsite visits at seven VAROs—Albuquerque, New Mexico; Chicago, Illinois; Cleveland, Ohio; Portland, Oregon; Roanoke, Virginia; San Diego, California; and Togus, Maine—where we reviewed a sample of 2,100 compensation cases that included a PTSD disability with a rating of 50 percent or greater. Five of the states included in our case review are also included in our high or low payment states. The purpose of this review was to determine whether PTSD claims were properly processed and adequately developed for evidence of service connection. We selected PTSD claims for detailed review because of the high variation in the proportions of PTSD disability ratings awarded by different VAROs, the greater degree of subjectivity required to evaluate PTSD claims, the significant increase in claims and compensation payments associated with PTSD disabilities in recent years, and the vulnerability to fraudulent claims.
To evaluate the consistency and adequacy of medical evaluations used in disability rating determinations, we reviewed a random sample of 349 medical evaluations for initial PTSD and joint conditions that had been completed by VA and contract physicians and other clinicians during the 9-month period January–September 2004. We performed our review work during the period December 2004–April 2005.
VA Office of Inspector General 9

Review of State Variances in VA Disability Compensation Payments
Results and Conclusions
Issue 1: Comparison of Average Annual VA Disability Compensation Payments and Percentages of Veterans Receiving Compensation by State
Findings
A variance in average annual disability compensation payments by state is not necessarily a problem. A more definitive question is whether the magnitude of the variance, from the lowest average state payment to the highest average state payment, is within acceptable limits.
Variances in VA Disability Compensation Payments by State. We found that variances from the annual VA disability compensation payment national average are greater in those states where veterans were receiving the highest annual payments as opposed to those states receiving lower annual payments. As of September 30, 2004, VAROs serving the 50 states administered benefits to 2,493,576 veterans receiving average annual recurring payments of $8,378.
From FY 1999 to 2004, the number of veterans receiving compensation increased from 2.2 million to 2.5 million, an increase of 12.3 percent (see Appendix D Table 1). The average annual VA disability compensation payments (average annual payments) discussed in this section consist of the historical averages of all veterans receiving compensation payments.
During the past 6 years, average annual payments increased from $6,053 to $8,378, a 38.4 percent increase. Also during this period, the gap between the high payment and the low payment states widened. The high payment state average annual payment increased $3,681 (44.2 percent) while the low payment state increased $2,021 (40.9 percent). There was less of an increase when comparing the lowest state average to the national average in that the variance only increased $304 from $1,113 to $1,417 (27.3 percent).
VA Office of Inspector General 10

Review of State Variances in VA Disability Compensation Payments
Figure 2. Comparison of High, Low, and Average Annual Payments for FYs 1999–2004
))
1999 2000 2002 2004 04
$4,000
$6,000
$8,000
$10,000
$12,000
Ave
rage
Ann
ual P
aym
ents
High State $8,323 $8,969 $9,687 $10,481 $11,086 $12,004 $3,681
50-State Average $6,053 $6,394 $6,804 $7,333 $7,868 $8,378 $2,325
Low State $4,940 $5,208 $5,532 $6,004 $6,493 $6,961 $2,021
Variance (H-L $3,383 $3,761 $4,155 $4,477 $4,593 $5,043 $1,660
Variance (US-L $1,113 $1,186 $1,272 $1,329 $1,375 $1,417 $304
2001 2003 Variance 99
Ranking of High and Low Payment States for FYs 1999 and 2004. We analyzed the data for high payment and low payment states and confirmed that the variance was greater for high payment states. As shown on the next page, the high payment states average annual payments increased more than low payment states. High payment states increased $3,275, an average of 42.6 percent, ranging from 31.8 percent to 64.9 percent. At the same time, the national average increased only $2,325, an average of 38.4 percent. In 2004, high payment states exceeded the national average by $1,899 to $3,626. For FYs 1999 to 2004, five of the six high payment states exceeded the national percentage increase, including New Mexico, which exceeded the national percentage increase by 69 percent.
VA Office of Inspector General 11

Review of State Variances in VA Disability Compensation Payments
Table 2. Variance in High Payment States–FYs 1999 and 2004 State 1999 2004 1999–2004
Average Average Annual Annual Percent
Veterans Payment Veterans Payment Increase Increase 50-State Totals 2,220,262 $6,053 High Payment States 157,645 $7,682 New Mexico 20,744 $7,281 Maine 15,951 $8,281 Arkansas 29,134 $8,323 West Virginia 18,084 $7,456 Oklahoma 43,609 $7,707 Oregon 30,123 $7,122
2,493,576 $8,378 $2,325 38.4 182,825 $10,957 $3,275 42.6
25,258 $12,004 $4,723 64.9 18,751 $11,626 $3,345 40.4 31,473 $10,968 $2,645 31.8 20,681 $10,866 $3,410 45.7 51,213 $10,697 $2,990 38.8 35,449 $10,277 $3,155 44.3
Table 3. Variance in Low Payment States–FYs 1999 and 2004 State 1999 2004 1999–2004
Average Average Annual Annual Percent
Veterans Payment Veterans Payment Increase Increase 50-State Totals 2,220,262 $6,053 2,493,576 $8,378 $2,325 38.4 Low Payment States 324,432 $5,227 322,663 $7,106 $1,879 36.0 Indiana 38,051 $5,603 42,855 $7,287 $1,684 30.1 Michigan 64,599 $5,218 64,204 $7,241 $2,023 38.8 Connecticut 22,038 $5,249 21,005 $7,204 $1,955 37.2 Ohio 86.141 $5,329 85,527 $7,039 $1,710 32.1 New Jersey 53,306 $5,119 46,903 $7,028 $1,909 37.3 Illinois 60,297 $4,940 62,169 $6,961 $2,021 40.9
During FYs 1999–2004, five of six low payment states were ranked in the bottom six each year. Indiana replaced New York in the bottom six in 2004. The low payment states average annual payments increased $1,879, an average of 36 percent, ranging from 30.1 percent to 40.9 percent. At the same time, the national average increased only $2,325, an average of 38.4 percent. In 2004, the national average exceeded low payment states’ average by $1,091 to $1,417. For FYs 1999 to 2004, two of the six states, Illinois (40.9 percent) and Michigan (38.8 percent) exceeded the national percentage increase.
The following figure illustrates the variance between high payment and low payment states for FY 2004.
VA Office of Inspector General 12
Review of State Variances in VA Disability Compensation Payments
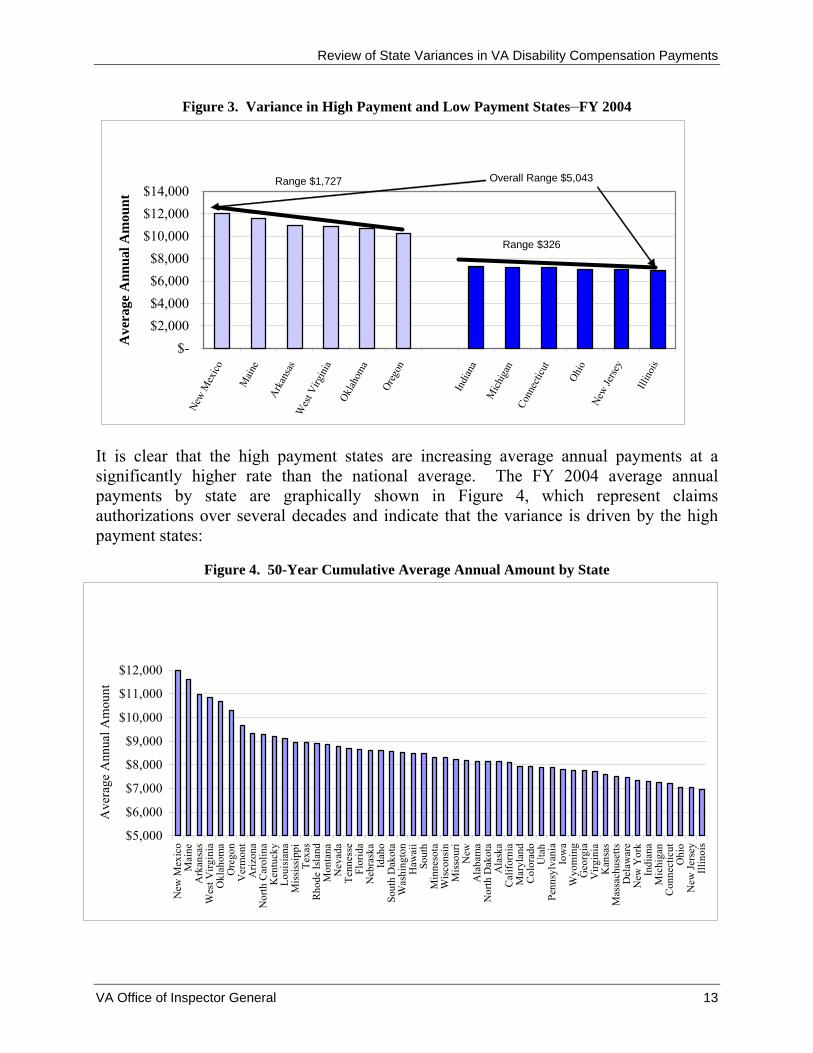
Figure 3. Variance in High Payment and Low Payment States–FY 2004
$-$2,000 $4,000 $6,000 $8,000
$10,000 $12,000 $14,000
New
Mex
ico
Main
e Ar
kans
as
Wes
t Virg
inia
Oklah
oma
Oreg
on
Indi
ana
Mich
igan
Co
nnec
ticut
Ohio
Ne
wJe
rsey
Illin
ois
Ave
rage
Ann
ual A
mou
nt
Range $1,727
Range $326
Overall Range $5,043
It is clear that the high payment states are increasing average annual payments at a significantly higher rate than the national average. The FY 2004 average annual payments by state are graphically shown in Figure 4, which represent claims authorizations over several decades and indicate that the variance is driven by the high payment states:
Figure 4. 50-Year Cumulative Average Annual Amount by State
$5,000
$6,000
$7,000
$8,000
$9,000
$10,000
$11,000
$12,000
New
Mex
ico
Mai
ne
Ark
ansa
s W
est V
irgin
ia
Okl
ahom
a O
rego
n V
erm
ont
Ariz
ona
Nor
th C
arol
ina
Ken
tuck
y Lo
uisi
ana
Mis
siss
ippi
Te
xas
Rho
de Is
land
Mon
tana
Nev
ada
Tenn
esse
Fl
orid
a N
ebra
ska
Idah
o So
uth
Dak
ota
Was
hing
ton
Haw
aii
Sout
hM
inne
sota
W
isco
nsin
M
isso
uri
New
A
laba
ma
Nor
th D
akot
a A
lask
a C
alifo
rnia
M
aryl
and
Col
orad
o U
tah
Penn
sylv
ania
Iow
a W
yom
ing
Geo
rgia
V
irgin
ia
Kan
sas
Mas
sach
uset
ts
Del
awar
e N
ew Y
ork
Indi
ana
Mic
higa
n C
onne
ctic
utO
hio
New
Jers
ey
Illin
ois
Ave
rage
Ann
ual A
mou
nt
VA Office of Inspector General 13

Review of State Variances in VA Disability Compensation Payments
Shift in State Rankings for Claims Authorized During FYs 1999–2005. To determine whether historical payment averages were consistent with more recently authorized claims, we extracted only new disability compensation claims authorized during FYs 1999–2005. In doing so, we were able to isolate claims rated over the last 6 years as opposed to reviewing average annual payments derived from decades of claims authorizations.
During FYs 1999–2005, 778,457 (31 percent of total) veterans began receiving compensation based on new claims. The average annual payment for these claims was $4,971 in FY 1999 and $6,988 in FY 2004 (see Appendix D Table 2). The table below shows the average annual payments for new claims in each FY.
Table 4. Average Annual Payments to Veterans with New Claims
PaymentFiscal Year Veterans Average Annual
1999 89,623 $4,971 2000 84,576 $5,404 2001 83,018 $5,930 2002 149,610 $6,430 2003 159,441 $6,853 2004 146,547 $6,988 2005 65,642 $6,431
Note: 2005 data through February 2005.
A comparison of Illinois to the 50-state average and the high and low states in FYs 1999– 2005 for the new claims showed that Illinois went from $616 below the national average in FY 1999 to $973 above the national average in FY 2005, as shown in Figure 5.
Figure 5. Comparison of 50-State and Illinois Average Annual Compensation Payments for New Claims FYs 1999–2005
t
is
$2,000
$3,000
$4,000
$5,000
$6,000
$7,000
$8,000
$9,000
$10,000
$11,000
$12,000
Ave
rage
Pay
men
50 - State Average $4,971 $5,404 $5,930 $6,430 $6,853 $6,988 $6,431
Illinois $4,355 $4,645 $5,088 $5,950 $6,799 $6,970 $7,404
Low State $3,820 $4,455 $4,563 $4,980 $5,315 $5,152 $4,711
High State $6,735 $7,806 $10,015 $9,877 $11,236 $11,206 $8,812
FY 1999 FY 2000 FY 2001 FY 2002 FY 2003 FY 2004 FY 2005
High State
Illino50 - State Average
Low State
Note: 2005 data through February 2005.
VA Office of Inspector General 14

Review of State Variances in VA Disability Compensation Payments
We compared the average payments to all veterans for FY 2004 for the high and low payment states to the average payments made to new claims in FYs 1999–2005, to identify trends and changes. Notable trends in both the top and bottom six states were identified.
Among the high payment states, three (New Mexico, Arkansas, and Oregon) were ranked 1st, 2nd, and 3rd, for average payments made for new claims, maintaining their highly ranked status for the last 20 years. However, the other three states (Maine, West Virginia, and Oklahoma) significantly dropped in the ranking, with most of the change occurring after FY 2003. Maine moved from 3rd in FY 2003 to 37th in 2005. Oklahoma moved from 5th in FY 2004 to 24th in 2005 (see Appendix D Table 3).
Among the low payment states, four (Illinois, New Jersey, Ohio, and Michigan) moved up significantly in their rankings for new claims. Illinois moved from 44th in FY 1999 to 5th in 2005, a jump of 39 states. Michigan moved from 32nd in FY 1999 to 11th in 2005, a jump of 21 states. However, the other two states (Connecticut and Indiana) dropped in the ranking by nine and one state, respectively. Three of the low payment states (Illinois, Michigan, and Connecticut) also exceeded the average annual compensation amount for new claims ($6,431) by $973, $622, and $439, respectively.
The higher ranking of Illinois is consistent with actions expressed by the Director of the VARO in Chicago to a representative of Congressman Lane Evans, Ranking Member, House Veterans’ Affairs Committee during a visit on December 10–11, 2004. At the exit briefing, the Director informed the representative that he was committed to awarding all benefits consistent with law and regulation. He informed the Committee representative that training in the past year doubled, that emphasis was on across the board quality decisions, and that trainees were being paired with mentors that embody a philosophy of granting every benefit possible. The VARO utilizes STAR review results for individual and division training. The VARO also has in place two authorization and two rating quality reviewers to conduct individual performance quality reviews. We confirmed these controls were in place.
Comparison of Historical Average Payments and Veterans Who Began Receiving Compensation in FYs 1999–2004. We found that the rankings for the high payment states generally remained constant when comparing the historical average and the new claim average, except for Maine and West Virginia. These states were ranked 14 and 6 states lower for new claims in 2004 than their historical average, respectively.
VA Office of Inspector General 15

Review of State Variances in VA Disability Compensation Payments
Table 5. Comparison of Historical (All Veterans) State Average Annual Payment Rankings and Ranking for New Claims for High Payment States
State
Historical Average (All Veterans) New Claims
1999
2000
2001
2002
2003
2004
1999
2000
2001
2002
2003
2004
New Mexico 5 5 3 2 2 1 2 2 1 1 1 1 Maine 2 1 1 1 1 2 4 1 2 2 3 16 Arkansas 1 2 2 3 3 3 5 6 8 3 5 2 West Virginia 4 3 4 4 4 4 1 3 12 9 8 10 Oklahoma 3 4 5 5 5 5 13 8 13 5 4 5 Oregon 6 6 6 6 6 6 6 11 4 4 2 3
For low payment states, we found more significant changes in the average rankings between the two groups. Indiana was the only state we evaluated in detail with average payments for new claims less than the historical average. This occurred in each year reviewed and is contrary to the trend for the other five low payment states. The other states significantly improved their ranking when comparing the 2004 historical and new veteran averages. Each of the states made double digit jumps, with Michigan and Illinois making 31 and 27 position moves, respectively.
Table 6. Comparison of Historical (All Veterans) State Average Annual Payment Rankings and Ranking for New Claims for Low Payment States
State
Historical Average (All Veterans) New Claims
1999
2000
2001
2002
2003
2004
1999
2000
2001
2002
2003
2004
Indiana 42 43 43 44 44 45 49 46 44 50 50 50 Michigan 48 48 48 47 47 46 32 23 29 20 19 15 Connecticut 47 47 46 46 46 47 7 20 7 38 22 30 Ohio 46 46 47 49 48 48 42 38 47 47 45 33 New Jersey 49 49 49 48 49 49 35 19 34 21 41 37 Illinois 50 50 50 50 50 50 44 47 45 37 24 23
As shown above, dramatic changes have occurred in average annual payments and state rankings for both the high and low states. Absent a national case review, we cannot determine the specific causes for these significant shifts, but we did note that Illinois veterans currently applying for and receiving benefits are near or above the 50-state average.
Percentages of State Veterans Receiving Compensation. As of September 2004, VA was paying compensation benefits to 2.5 million (10.2 percent) of the 24.5 million veterans living in the 50 states included in our analyses. By state, the percentage of the veteran populations receiving compensation ranged from a high of 19.2 percent for North Dakota to a low of 6.9 percent for Illinois. For North Dakota, the state with the second-smallest veteran population, the 19.2 percent rate was 88.2 percent higher than the 50
VA Office of Inspector General 16
Review of State Variances in VA Disability Compensation Payments
state average of 10.2 percent. For Illinois, the 6.9 percent rate was 32.4 percent below the 50-state average (see Appendix D Table 4).
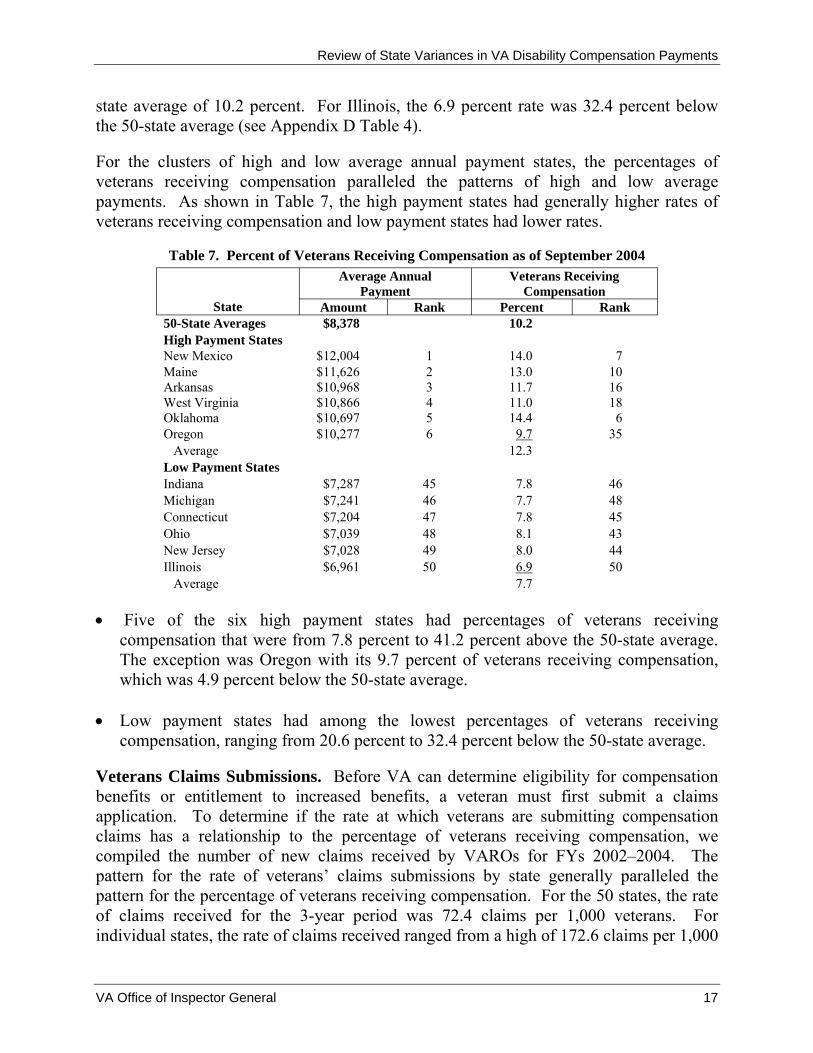
For the clusters of high and low average annual payment states, the percentages of veterans receiving compensation paralleled the patterns of high and low average payments. As shown in Table 7, the high payment states had generally higher rates of veterans receiving compensation and low payment states had lower rates.
Table 7. Percent of Veterans Receiving Compensation as of September 2004
State
Average Annual Payment
Veterans Receiving Compensation
Amount Rank Percent Rank 50-State Averages $8,378 10.2 High Payment States New Mexico $12,004 Maine $11,626 Arkansas $10,968 West Virginia $10,866 Oklahoma $10,697 Oregon $10,277
Average
1 14.0 7 2 13.0 10 3 11.7 16 4 11.0 18 5 14.4 6 6 9.7 35
12.3 Low Payment States Indiana $7,287Michigan $7,241Connecticut $7,204Ohio $7,039New Jersey $7,028Illinois $6,961
Average
45 7.8 46 46 7.7 48 47 7.8 45 48 8.1 43 49 8.0 44 50 6.9 50
7.7
• Five of the six high payment states had percentages of veterans receiving compensation that were from 7.8 percent to 41.2 percent above the 50-state average. The exception was Oregon with its 9.7 percent of veterans receiving compensation, which was 4.9 percent below the 50-state average.
• Low payment states had among the lowest percentages of veterans receiving compensation, ranging from 20.6 percent to 32.4 percent below the 50-state average.
Veterans Claims Submissions. Before VA can determine eligibility for compensation benefits or entitlement to increased benefits, a veteran must first submit a claims application. To determine if the rate at which veterans are submitting compensation claims has a relationship to the percentage of veterans receiving compensation, we compiled the number of new claims received by VAROs for FYs 2002–2004. The pattern for the rate of veterans’ claims submissions by state generally paralleled the pattern for the percentage of veterans receiving compensation. For the 50 states, the rate of claims received for the 3-year period was 72.4 claims per 1,000 veterans. For individual states, the rate of claims received ranged from a high of 172.6 claims per 1,000
VA Office of Inspector General 17
Review of State Variances in VA Disability Compensation Payments
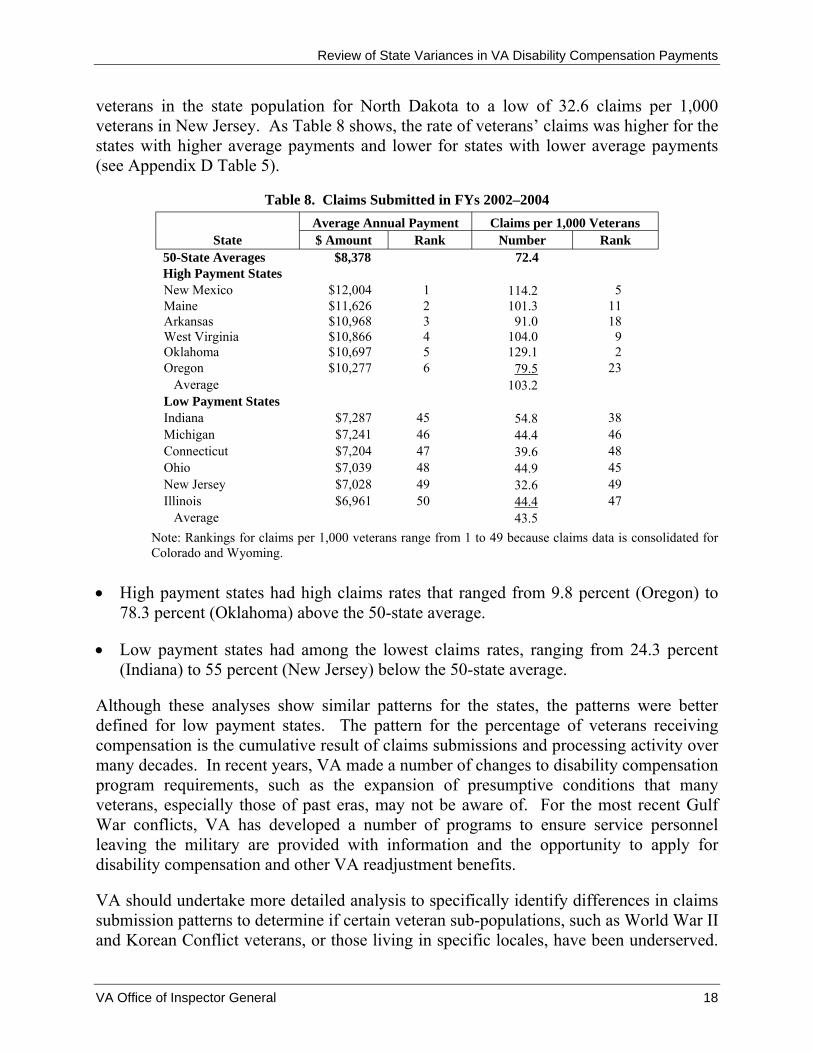
veterans in the state population for North Dakota to a low of 32.6 claims per 1,000 veterans in New Jersey. As Table 8 shows, the rate of veterans’ claims was higher for the states with higher average payments and lower for states with lower average payments (see Appendix D Table 5).
Table 8. Claims Submitted in FYs 2002–2004
State Average Annual Payment Claims per 1,000 Veterans
$ Amount Rank Number Rank 50-State Averages $8,378 72.4 High Payment States New Mexico $12,004 Maine $11,626 Arkansas $10,968 West Virginia $10,866 Oklahoma $10,697 Oregon $10,277
Average
1 114.2 5 2 101.3 11 3 91.0 18 4 104.0 9 5 129.1 2 6 79.5 23
103.2 Low Payment States Indiana $7,287Michigan $7,241Connecticut $7,204Ohio $7,039New Jersey $7,028Illinois $6,961
Average
45 54.8 38 46 44.4 46 47 39.6 48 48 44.9 45 49 32.6 49 50 44.4 47
43.5 Note: Rankings for claims per 1,000 veterans range from 1 to 49 because claims data is consolidated for Colorado and Wyoming.
• High payment states had high claims rates that ranged from 9.8 percent (Oregon) to 78.3 percent (Oklahoma) above the 50-state average.
• Low payment states had among the lowest claims rates, ranging from 24.3 percent (Indiana) to 55 percent (New Jersey) below the 50-state average.
Although these analyses show similar patterns for the states, the patterns were better defined for low payment states. The pattern for the percentage of veterans receiving compensation is the cumulative result of claims submissions and processing activity over many decades. In recent years, VA made a number of changes to disability compensation program requirements, such as the expansion of presumptive conditions that many veterans, especially those of past eras, may not be aware of. For the most recent Gulf War conflicts, VA has developed a number of programs to ensure service personnel leaving the military are provided with information and the opportunity to apply for disability compensation and other VA readjustment benefits.
VA should undertake more detailed analysis to specifically identify differences in claims submission patterns to determine if certain veteran sub-populations, such as World War II and Korean Conflict veterans, or those living in specific locales, have been underserved.
VA Office of Inspector General 18

Review of State Variances in VA Disability Compensation Payments
As indicated by such analysis, focused outreach efforts to specific sub-populations could be initiated to ensure VBA staffs provide veterans adequate information and effective assistance in obtaining compensation and other benefits when entitled.
Conclusion
During FYs 1999 to 2004, the number of veterans receiving compensation increased from 2.2 million to 2.5 million, a net increase of 12.3 percent. Average annual payments increased from $6,053 to $8,378, a 38.4 percent increase during the past 6 years. The variances between the states receiving the highest and lowest average annual payments increased from $3,383 to $5,043, a 49.1 percent increase. We noted that the average payments in states receiving the highest average annual payments increased by over three times more than the states receiving the lowest average annual payments.
A review of new claims during FYs 1999 to 2004 showed that average annual payments by state are shifting. The variance has decreased and some low payment states, including Illinois, are reporting average annual payments above the national average. Regardless of the repositioning of states, ensuring that the variance is caused by factors relevant only to demographic, disability, and pay scale variables, and rating inconsistencies among VAROs must be addressed.
Veteran participation in VA’s compensation program also needs management attention. In recent years, VA and the Congress made a number of changes to the program, including expanding the numbers of presumptive conditions that many veterans in past periods of service may not be aware exist. For Gulf War conflicts, VA has developed a number of programs to ensure all service personnel being discharged are aware of their opportunity to apply for VA compensation benefits. VBA needs to undertake a more detailed analysis to identify differences in claims submission patterns and determine whether certain veteran sub-populations, such as World War II and Korean Conflict veterans, or those living in specific locales, have been underserved. VBA should assess the need for additional outreach initiatives and should work closely with veterans service organizations, state organizations, and the Department of Defense.
VA Office of Inspector General 19

Review of State Variances in VA Disability Compensation Payments
Issue 2: Influences of Demographic and Processing Factors on Average Annual Compensation Payments
Findings
Demographic Factors and Limitations of Analysis. To further evaluate the variances in the average payments to veterans residing in different states, we performed comparative analyses for the following veteran demographic factors:
Military-Retired Status Enlisted or Officer StatusAverage Age Number of Disabilities by Period of
Service
Power of Attorney Representation Branch of Service Period of Service Dependency and Special Monthly
Compensation
These demographic analyses were limited to data elements that could be extracted from the automated BDN payment system. We recognize that other analytical approaches, such as applying statistical models or including other demographic information from sources external to the BDN system, could be useful in finding all explanations for payment variances. For example, information on a veteran’s education and occupation, locality-specific economic conditions, population and migration patterns, and the number and timing of disability claims applications following military service would all provide useful information.
Military-Retired Status. Average annual compensation payments to veterans who retired from military service were generally higher than payments to other veterans who did not retire from the military. Most military-retired veterans served on active duty for 20 or more years while non-military retirees may have had active duty of only 2 years or less. As of September 2004, 751,791 (30.1 percent) of the 2.5 million veterans receiving compensation were military retirees. By state, the percentage of military-retired veterans ranged from a low of 11.3 percent for New York to a high of 50.8 percent in Virginia. The average annual payment for all military-retired veterans was $9,383, compared to the average payment for non-military retired veterans of $7,945, for a difference of $1,438.
By state, the average annual payments for military-retired veterans ranged from a low of $7,903 for Delaware to a high of $12,318 for West Virginia. Non-retired veterans’ average payments ranged from a low of $6,420 for Illinois to a high of $12,820 for New Mexico (see Appendix D Table 6). Table 9 below shows the pattern of average payments for retired-military and non-military retired veterans in the high and low payment states.
VA Office of Inspector General 20
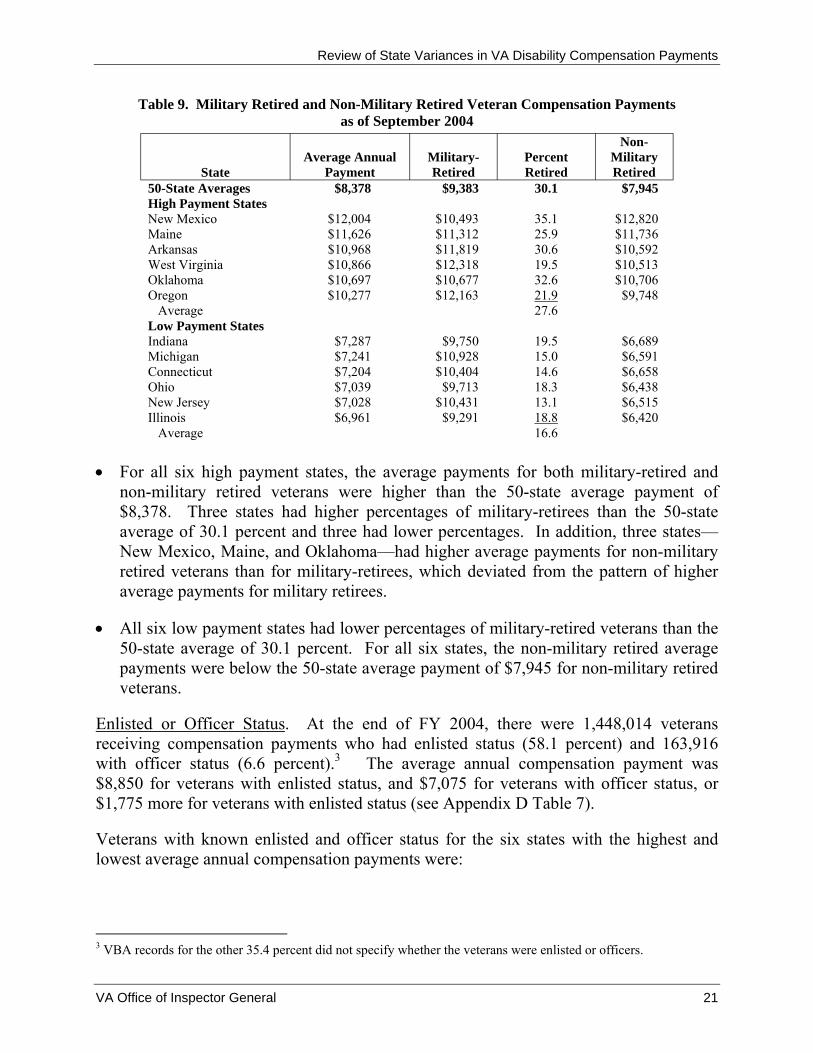
Review of State Variances in VA Disability Compensation Payments
Table 9. Military Retired and Non-Military Retired Veteran Compensation Payments as of September 2004
State Average Annual
Payment Military-Retired
Percent Retired
Non-Military Retired
50-State Averages $8,378 $9,383 30.1 $7,945 High Payment States New Mexico $12,004 $10,493 35.1 $12,820 Maine $11,626 $11,312 25.9 $11,736 Arkansas $10,968 $11,819 30.6 $10,592 West Virginia $10,866 $12,318 19.5 $10,513 Oklahoma $10,697 $10,677 32.6 $10,706 Oregon $10,277 $12,163 21.9 $9,748
Average 27.6 Low Payment States Indiana $7,287 $9,750 19.5 $6,689 Michigan $7,241 $10,928 15.0 $6,591 Connecticut $7,204 $10,404 14.6 $6,658 Ohio $7,039 $9,713 18.3 $6,438 New Jersey $7,028 $10,431 13.1 $6,515 Illinois $6,961 $9,291 18.8 $6,420
Average 16.6
• For all six high payment states, the average payments for both military-retired and non-military retired veterans were higher than the 50-state average payment of $8,378. Three states had higher percentages of military-retirees than the 50-state average of 30.1 percent and three had lower percentages. In addition, three states–– New Mexico, Maine, and Oklahoma—had higher average payments for non-military retired veterans than for military-retirees, which deviated from the pattern of higher average payments for military retirees.
• All six low payment states had lower percentages of military-retired veterans than the 50-state average of 30.1 percent. For all six states, the non-military retired average payments were below the 50-state average payment of $7,945 for non-military retired veterans.
Enlisted or Officer Status. At the end of FY 2004, there were 1,448,014 veterans receiving compensation payments who had enlisted status (58.1 percent) and 163,916 with officer status (6.6 percent).3 The average annual compensation payment was $8,850 for veterans with enlisted status, and $7,075 for veterans with officer status, or $1,775 more for veterans with enlisted status (see Appendix D Table 7).
Veterans with known enlisted and officer status for the six states with the highest and lowest average annual compensation payments were:
3 VBA records for the other 35.4 percent did not specify whether the veterans were enlisted or officers.
VA Office of Inspector General 21

Review of State Variances in VA Disability Compensation Payments
Table 10. Enlisted and Officer Status as of September 2004
State
Percent
State
Percent
Enlisted Officer Enlisted Officer 50-State Averages 58.1 6.6 High Payment States Low Payment States New Mexico 66.3 9.1 Indiana 52.5 3.7 Maine 67.2 4.4 Michigan 46.8 2.4 Arkansas 63.7 4.9 Connecticut 38.4 3.9 West Virginia 56.7 2.9 Ohio 48.2 4.5 Oklahoma 62.8 5.4 New Jersey 31.1 3.1 Oregon 63.6 4.9 Illinois 49.6 4.0
Averages 63.4 5.3 Averages 44.4 3.6
Average Age. As of September 2004, the average age of the 2.5 million veterans receiving compensation payments was 58. By state, the average age ranged from a low of 52 for Alaska to a high of 66 for Massachusetts (see Appendix D Table 8). Table 11 below shows the average veteran ages for the high and low payment states.
Table 11. Veteran Average Age as of September 2004
State Payment Age State Payment Age Average Annual Average Annual
50-State Averages $8,378 58 High Payment States Low Payment States New Mexico $12,004 Maine $11,626 Arkansas $10,968 West Virginia $10,866 Oklahoma $10,697 Oregon $10,277
Average
59 Indiana $7,287 58 58 Michigan $7,241 61 58 Connecticut $7,204 63 59 Ohio $7,039 60 57 New Jersey $7,028 65 57 Illinois $6,961 59 58 Average 61
• For the six high payment states, the average ages were equal to or slightly above the 50-state average age of 58, ranging from 57 to 59.
• Similarly, two of the low payment states had average veteran ages equal to or slightly above the 50-state average age, ranging from 58 to 59. The four other states had higher average ages, ranging from 60 for Ohio to 65 for New Jersey.
Number of Disability Conditions by Period of Service. Veterans with more service-connected disabilities will typically result in a higher overall disability rating and higher compensation payments. BDN can record a maximum of six individual disability codes in each veteran’s payment record. As of September 2004, the average number of service-connected disabilities for all veterans in the 50 states was 2.6 per veteran. By period of service, the 50-state averages ranged from a low of 2.1 disabilities per World War II veteran to a high of 4.0 disabilities per Gulf War veteran. As shown in Table 12, veterans in the high average payment states generally had more disabilities and the veterans in the low average payment states had fewer disabilities (see Appendix D Table 9). For all
VA Office of Inspector General 22

Review of State Variances in VA Disability Compensation Payments
periods, high payment states had 25 percent more disabilities than the low payment states—3 disabilities states versus 2.4 disabilities.
Table 12. Average Number of Veteran Disabilities by Period of Service as of September 2004
Average Number of Service-Connected Disabilities
All Gulf Vietnam Korean World State Periods War Era Peacetime Conflict War II
50-State Averages 2.6 4.0 3.2 2.8 2.3 2.1 High Payment States New Mexico 2.9 4.0 3.3 3.1 2.7 2.6 Maine 2.9 4.1 3.1 2.8 2.3 2.2 Arkansas 2.9 3.9 3.3 2.8 2.4 2.2 West Virginia 2.8 3.6 3.1 2.6 2.5 2.2 Oklahoma 3.2 4.1 3.5 3.1 2.6 2.5 Oregon 3.0 3.9 3.2 2.8 2.6 2.5
Averages 3.0 3.9 3.3 2.9 2.5 2.4 Low Payment States Indiana 2.6 3.3 2.9 2.3 2.3 2.2 Michigan 2.3 3.1 2.6 2.2 1.9 1.9 Connecticut 2.3 3.4 2.6 2.3 1.9 1.8 Ohio 2.5 3.5 2.7 2.4 2.0 2.0 New Jersey 2.4 3.2 2.5 2.1 2.0 1.9 Illinois 2.5 3.4 2.9 2.4 2.0 1.9
Averages 2.4 3.3 2.7 2.3 2.0 2.0
• For the six high payment states, the average number of disabilities was greater than or equal to the 50-state averages overall and for most individual periods of service. Arkansas, West Virginia, and Oregon had average numbers of disabilities lower than the 50-state average for the Gulf War; Maine and West Virginia had lower than average numbers of disabilities for the Vietnam era; and West Virginia had lower than average numbers of disabilities for Peacetime.
• For five of the six low payment states, the average number of disabilities was less than the 50-state averages overall and for all periods of service.
Power of Attorney Representation. Veterans and dependents may appoint a power of attorney (POA) representative, such as a VA-recognized national veterans service organization or a state veterans office, to assist them in applying for VA benefits. Qualified POA representatives provide a valuable service to applicants by explaining VA benefits, assisting in completion of forms and collection of evidence, monitoring the progress of the claim, and representing them in hearings and appeals. The majority of veterans receiving compensation have appointed POA representatives. The BDN payment record identifies the veteran’s designated representative, but does not contain information about the extent of assistance provided by the representative for any particular benefits claim action.
VA Office of Inspector General 23

Review of State Variances in VA Disability Compensation Payments
As of September 2004, about 1.6 million (63.8 percent) of the 2.5 million veterans receiving compensation in the 50 states had designated a POA representative. By state, the percentage of veterans with POA representatives ranged from a low of 42.3 percent for Hawaii to a high of 80.7 percent for North Dakota. For all 50 states, the average annual disability payments for veterans with POA representation were $6,225 higher than the payments for those without representation. The 50-state average payment was $10,631 for veterans with representation and $4,406 for veterans without representation (see Appendix D Table 10). Table 13 below shows the average annual payments for veterans with and without POA representation in the high average payment and low average payment states:
Table 13. Power of Attorney Representation as of September 2004
State Payment Percent withAverage Annual Veterans with
Representation Representation Veterans without Representation
50-State Totals $8,378 $10,631 63.8 $4,406High Payment States New Mexico $12,004 Maine $11,626 Arkansas $10,968 West Virginia $10,866 Oklahoma $10,697 Oregon $10,277
Average
$15,275 65.9 $5,677 $14,419 69.9 $5,148 $13,052 67.7 $6,597 $12,791 73.4 $5,561 $13,501 64.3 $5,650 $11,890 75.9 $5,187
69.5 Low Payment States Indiana $7,287Michigan $7,241Connecticut $7,204Ohio $7,039New Jersey $7,028Illinois $6,961
Average
$9,312 57.9 $4,503 $9,391 63.8 $3,450
$10,922 47.0 $3,900 $9,381 57.3 $3,902
$10,775 48.3 $3,528 $9,564 54.1 $3,890
54.7
• All six high payment states had higher percentages of veterans with POA designations, ranging from 64.3 percent to 75.9 percent, and average payments, ranging from $11,890 to $15,275, that were above the 50-state averages of 63.8 percent and $10,631, respectively. Within each state, the average payments for veterans with POA representation were substantially higher than for veterans without representation, ranging from 97.8 percent higher for Arkansas to 180.1 percent higher for Maine.
• The six low payment states had percentages of veterans with POA representation ranging from 47.0 percent to 63.8 percent, which were equal to or below the 50-state average. For veterans with representation, the average annual payments, ranging from $9,312 to $10,922 were clustered around the 50-state average of $10,631. As with the high payment states, within each state, the average payments for veterans with POA representation were much higher than for veterans without representation, ranging from 140.4 percent higher for Ohio to 205.4 percent higher for New Jersey.
VA Office of Inspector General 24

Review of State Variances in VA Disability Compensation Payments
Branch of Service. Of the 2.5 million veterans receiving compensation benefits as of September 2004, about 98.9 percent served in one of the four major military service branches—Army, Air Force, Marine Corps, and Navy. As shown in Table 14, 52.8 percent of veterans receiving compensation had served in the Army, 17.8 percent in the Air Force, 17.6 percent in the Navy, and 10.7 percent in the Marine Corps. Average annual payments ranged from a low of $7,361 for Air Force veterans to a high of $9,315 for Marine Corps veterans. By state, the percent of veterans of any particular branch of service did not appear to have a significant influence on average payments (see Appendix D Table 11).
Table 14. Average Annual Payments by Branch of Service as of September 2004
State
Army Air Force Marine Corps Navy Percent
of Veterans
Average Annual
Payment
Percent of
Veterans
Average Annual
Payment
Percent of
Veterans
Average Annual
Payment
Percent of
Veterans
Average Annual
Payment 50-State Averages 52.8 $8,787 17.8 $7,361 10.7 $9,315 17.6 $7,665 High Payment States New Mexico 46.5 $13,764 28.8 $8,521 9.6 $14,846 13.9 $11,510 Maine 45.7 $12,778 16.6 $9,804 10.7 $14,001 23.5 $9,898 Arkansas 52.6 $11,597 23.2 $9,369 9.0 $12,028 14.7 $10,672 West Virginia 59.9 $11,271 13.7 $9,168 12.3 $11,973 13.4 $9,955 Oklahoma 56.3 $11,489 22.0 $8,184 8.6 $12,228 12.4 $10,497 Oregon 47.0 $10,696 14.5 $9,322 13.1 $11,757 23.0 $9,389 Low Payment States Indiana 58.5 $7,531 13.6 $6,401 12.5 $7,857 14.8 $6,697 Michigan 60.9 $7,358 11.6 $6,639 11.6 $7,832 14.6 $6,829 Connecticut 53.2 $7,145 11.0 $7,186 12.1 $8,869 21.8 $6,489 Ohio 55.6 $7,241 17.3 $6,249 11.6 $7,744 14.5 $6,706 New Jersey 61.8 $7,036 10.2 $6,411 10.9 $8,621 15.9 $6,400 Illinois 56.4 $7,216 13.6 $6,244 12.3 $7,711 17.1 $6,185
• For the high payment states, the average payments were significantly higher than the 50-state average annual payments for the four service branches. For example, average payments for Marine Corps veterans ranged from $11,757 in Oregon to $14,846 in New Mexico, compared to the 50-state average payment of $9,315.
• For the low payment states, the average payments were consistently lower than the 50-state average payments for each service branch. For example, average payments for Army veterans ranged from $7,036 in New Jersey to $7,531 in Indiana compared to the 50-state average payment of $8,787.
Period of Service. By period of service, or era, 34.6 percent of the 2.5 million veterans receiving compensation benefits as of September 2004 served in the Vietnam era, 15.0 percent served in World War II, 6.4 percent in the Korean Conflict, 21.1 percent in the Gulf War, and 22.9 percent during Peacetime. As shown in Table 15, the average annual payments for the 50 states ranged from a high of $10,930 for Vietnam veterans to a low of $6,058 for Gulf War veterans. This analysis shows that Vietnam veterans received an
VA Office of Inspector General 25

Review of State Variances in VA Disability Compensation Payments
average annual payment of $10,930, $2,328 more than the next highest group—the Korean Conflict payment of $8,602 (see Appendix D Table 12).
Table 15. Average Annual Payments by Period of Service as of September 2004 Average Annual Payment Percent of Veterans
World Korean Gulf Peace- World Korean Gulf Peace-State War II Conflict Vietnam War time War II Conflict Vietnam War time
50-State Averages $7,798 $8,602 $10,930 $6,058 $6,979 15.0 6.4 34.6 21.1 22.9 High Payment States New Mexico $13,558 $13,155 $15,033 $7,637 $8,901 12.0 6.1 41.0 18.3 22.6 Maine $11,275 $11,176 $14,983 $8,058 $9,546 13.4 7.1 37.1 19.1 23.3 Arkansas $10,782 $11,853 $13,533 $7,756 $9,414 12.8 5.8 38.1 20.1 23.1 West Virginia $9,570 $11,008 $13,874 $7,160 $8,421 14.6 7.3 42.3 17.0 18.9 Oklahoma $12,349 $12,501 $13,789 $6,784 $8,419 11.4 5.7 37.0 23.9 22.0 Oregon $9,646 $10,282 $12,861 $7,126 $8,469 13.6 5.9 40.6 18.0 21.9
Averages 13.0 6.3 39.4 19.4 22.0 Low Payment States Indiana $6,938 $7,083 $8,982 $5,333 $6,358 16.7 7.1 36.7 17.8 21.6 Michigan $6,070 $7,017 $9,231 $5,279 $6,383 22.4 7.6 36.3 14.0 19.6 Connecticut $5,342 $6,146 $9,896 $6,060 $6,749 27.8 8.6 30.9 11.1 21.6 Ohio $6,162 $7,063 $8,890 $5,193 $6,229 20.4 7.4 34.7 15.6 22.0 New Jersey $5,859 $6,632 $9,311 $5,489 $6,096 30.3 10.7 31.0 8.1 20.0 Illinois $5,722 $6,419 $9,459 $5,147 $6,061 21.0 7.4 33.0 19.2 19.4
Averages 23.1 8.1 33.8 14.3 20.7
• The six high payment states had higher average annual payments for all of the periods of service. Of significance, for the Vietnam period these states had average payments, ranging from $12,861 for Oregon to $15,033 for New Mexico, and percentages of veterans, ranging from 37.0 percent for Oklahoma to 42.3 percent for West Virginia, that were significantly higher than the 50-state averages of $10,930 or 34.6 percent, respectively.
• Five of the six low payment states had lower average payments than the 50-state averages for all of the periods of service. The states also had higher proportions of lower payment World War II veterans.
• The number and extent of service-connected disabilities for presumptive conditions are greater for Vietnam veterans, which partially explains why their average compensation payments are higher than those of veterans of other periods of service.
Dependency and SMC. We analyzed data for the dependency and SMC variables to determine if these factors helped explain some of the differences found in average annual compensation payments among states. Through a comparative analysis we determined that differences in veteran population characteristics provide a partial explanation of variances. For dependency, we found that the mix of veterans receiving compensation
VA Office of Inspector General 26
Review of State Variances in VA Disability Compensation Payments
for themselves and dependents, versus those not being paid for dependents, varied significantly when comparing the average annual payments for states at the high and low ends of the scale. When we coupled this observation with the fact that veterans with dependents receive higher compensation payments compared to veterans disabled to the same degree without dependents, then it logically follows that the dependency variable contributes to the payment differences. We found a similar pattern for SMC benefit recipients, who also receive higher payments compared to veterans at the same degree of disability without SMC ratings. Because of the limitations of data available to study these variables and compounded by the complexity of rating factors and the large number of possible dependency combinations, we could not precisely measure the contribution to the variance. However, to illustrate this relationship we calculated an estimate of the value that dependency and SMC variables, when combined at the 100 percent degree of disability level, contributed to the average annual payment amount for all veterans.
Table 16 shows the percent of veterans with SMC ratings, the percent of veterans with dependents, the percent of veterans with 100 percent service-connected disabilities, the additional disability compensation from these payment variables, and the estimated additional payment amount that dependency and SMC adds to the state averages for all veterans, not just those receiving dependency or SMC (see Appendix D Table 13). The estimated additional compensation from dependency and SMC to the average payment was $210 for the cluster of six states with the lowest average annual compensation and $344 for the cluster of six states with the highest average annual compensation, a difference of $134, or about 63.8 percent higher, which explains some of the variance in average annual compensation payments.
VA Office of Inspector General 27

Review of State Variances in VA Disability Compensation Payments
Table 16. Illustration of Effect of Additional Compensation Payments for SMC and Dependents
State
Average Annual
Payment
Veterans Receiving
Compensation
Percent of Veterans Receiving
SMC
Percent of Veterans
with Dependents
Percent of 100 Percent
Disabled Veterans
Additional Compensation for SMC and
Dependency for 100 Percent
Disabled Veterans*
Value Added to
State Average Annual
Payment 50-State Averages $8,378 2,493,576 8.1 36.3 8.4 $668,793,252 $268 New Mexico $12,004 25,258 8.9 43.3 10.2 $8,331,456 $330 Maine $11,626 18,751 8.1 43.6 12.0 $5,649,144 $301 Arkansas $10,968 31,473 9.1 46.1 12.3 $11,908,056 $378 West Virginia $10,866 20,681 9.4 44.5 11.9 $6,274,344 $303 Oklahoma $10,697 51,213 9.4 44.8 11.1 $19,611,372 $383 Oregon $10,277 35,449 9.0 40.5 11.9 $13,157,604 $371
Averages 9.0 43.8 11.6 $344
Indiana $7,287 42,855 7.1 33.6 6.6 $8,999,388 $210 Michigan $7,241 64,204 8.2 30.7 7.0 $12,921,600 $201 Connecticut $7,204 21,005 7.0 28.6 8.1 $4,639,584 $221 Ohio $7,039 85,527 7.2 30.9 6.9 $17,879,640 $209 New Jersey $7,028 46,903 6.0 28.2 7.5 $9,383,148 $200 Illinois $6,961 62,169 7.9 29.5 6.7 $13,463,400 $217
Averages 7.2 30.3 7.1 $210
*Note: We determined this value by calculating the total dollars paid to 100 percent service-connected veterans and deducted the basic rate payable for the veterans in this group without dependents, which enabled us to isolate the compensation attributable solely to dependency and SMC.
Claims Processing Factors. Whereas we concluded VA has little or no influence over demographic factors, VA has influence over claims processing factors. Our comparative analysis of claims processing factors included the following:
Pending Claims Appeal Rates Brokered Claims Transferred Claims Rating Timeliness Grant Rates Rater Experience
We found these claims processing factors have no significant influence on the average annual payments.
Pending Claims. The percent of claims pending does not appear to influence the average annual payment made by the individual states. A claim for disability benefits is considered pending until an award or disallowance is processed. During the period FYs 1999−2004, the number of pending claims increased from 236,032 to 316,145, an increase of 80,113 or 33.9 percent (see Appendix D Table 14).
Four of the six high payment states (Arkansas, West Virginia, Oklahoma, and Oregon) equaled or exceeded the 50-state average, while New Mexico (30 percent) was just below
VA Office of Inspector General 28
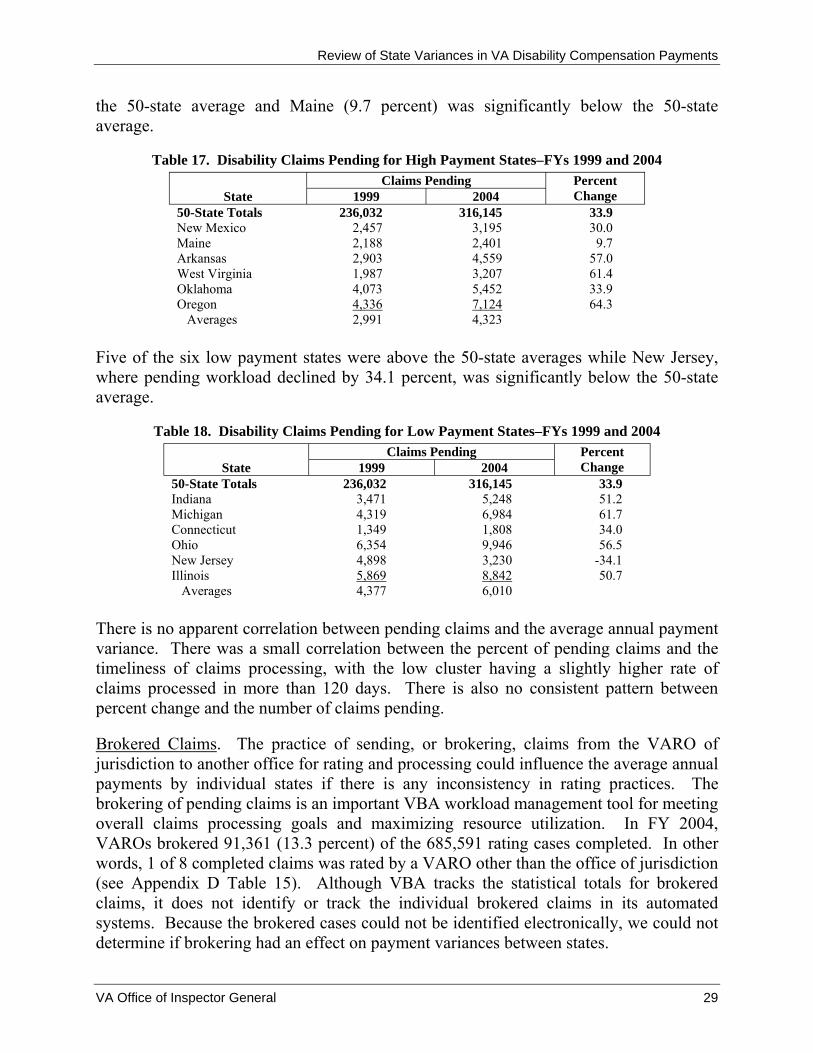
Review of State Variances in VA Disability Compensation Payments
the 50-state average and Maine (9.7 percent) was significantly below the 50-state average.
Table 17. Disability Claims Pending for High Payment States–FYs 1999 and 2004 Claims Pending Percent
Change State 1999 2004 50-State Totals 236,032 316,145 33.9 New Mexico 2,457 3,195 30.0 Maine 2,188 2,401 9.7 Arkansas 2,903 4,559 57.0 West Virginia 1,987 3,207 61.4 Oklahoma 4,073 5,452 33.9 Oregon 4,336 7,124 64.3
Averages 2,991 4,323
Five of the six low payment states were above the 50-state averages while New Jersey, where pending workload declined by 34.1 percent, was significantly below the 50-state average.
Table 18. Disability Claims Pending for Low Payment States–FYs 1999 and 2004 Claims Pending Percent
Change State 1999 2004 50-State Totals 236,032 316,145 33.9 Indiana 3,471 5,248 51.2 Michigan 4,319 6,984 61.7 Connecticut 1,349 1,808 34.0 Ohio 6,354 9,946 56.5 New Jersey 4,898 3,230 -34.1 Illinois 5,869 8,842 50.7
Averages 4,377 6,010
There is no apparent correlation between pending claims and the average annual payment variance. There was a small correlation between the percent of pending claims and the timeliness of claims processing, with the low cluster having a slightly higher rate of claims processed in more than 120 days. There is also no consistent pattern between percent change and the number of claims pending.
Brokered Claims. The practice of sending, or brokering, claims from the VARO of jurisdiction to another office for rating and processing could influence the average annual payments by individual states if there is any inconsistency in rating practices. The brokering of pending claims is an important VBA workload management tool for meeting overall claims processing goals and maximizing resource utilization. In FY 2004, VAROs brokered 91,361 (13.3 percent) of the 685,591 rating cases completed. In other words, 1 of 8 completed claims was rated by a VARO other than the office of jurisdiction (see Appendix D Table 15). Although VBA tracks the statistical totals for brokered claims, it does not identify or track the individual brokered claims in its automated systems. Because the brokered cases could not be identified electronically, we could not determine if brokering had an effect on payment variances between states.
VA Office of Inspector General 29

Review of State Variances in VA Disability Compensation Payments
Our analysis of the available statistical data for FY 2004 showed that overall the six high payment states brokered a lower percentage of cases and the six low payment states brokered a higher percentage of cases than the national average of 13.3 percent.
Four of the high payment states, New Mexico (4.0 percent), Maine (10.6 percent), West Virginia (7.2 percent), and Oklahoma (1.4 percent), brokered less than the 50-state average percentage of cases; and Arkansas (14.8 percent) and Oregon (26.3 percent) brokered a higher percentage of cases than the 50-state average.
Table 19. High Payment States Brokered Claims–FY 2004
State Rating Cases Completed Brokered Cases Percent Brokered Cases
50-State Totals 685,591 91,361 13.3 New Mexico 7,457 300 4.0 Maine 5,540 585 10.6 Arkansas 9,966 1,470 14.8 West Virginia 7,546 541 7.2 Oklahoma 18,297 249 1.4 Oregon 12,369 3,259 26.3
Averages 10,196 1,067 10.7
Three low payment states, Ohio (19.3), New Jersey (28.9), and Illinois (21.1) brokered a higher percentage of their workload than the 50-state average; while Indiana (1 percent), Michigan (13.1 percent), and Connecticut (nil) were below the 50-state average.
Table 20. Low Payment States Brokered Claims–FY 2004
State Rating Cases Completed Brokered Cases Percent Brokered Cases
50-State Totals 685,591 91,361 13.3 Indiana 11,439 117 1.0 Michigan 15,933 2,087 13.1 Connecticut 3,706 1 0.0 Ohio 19,855 3,825 19.3 New Jersey 6,616 1,911 28.9 Illinois 13,687 2,887 21.1
Averages 11,873 1,805 13.9
Of note, New Mexico, the highest average payment state, brokered only 4 percent of their FY 2004 cases, while Illinois and New Jersey, the two lowest payment states, had more than 20 percent of their claims decisions made at other offices. However, as stated above, there are states in both the high payment and low payment groups with brokering percentages above and below the national average. If VBA tracked brokered cases electronically, it would be possible to determine and measure the effects that brokering has on the individual state average payments.
Rating Timeliness. The percent of ratings completed in 120 days does not influence the average annual payment made by the individual states. The timeliness of a rating decision is determined by the average days to complete a claim. This is an indicator
VA Office of Inspector General 30

Review of State Variances in VA Disability Compensation Payments
VBA uses to monitor the general effectiveness of claims processing and to identify situations necessitating management attention. The intent is to provide efficient, quality service to VA claimants. The 50-state percent of rating cases completed in more than 120 days for the last 3 FYs varied as follows: 2002 (66.7 percent), 2003 (55.7 percent), and 2004 (60.2 percent) (see Appendix D Table 16).
The following table shows the percent of rating actions taking longer than 120 days to complete for FYs 2002 to 2004.
Table 21. Rating Action Timeliness–FYs 2002–2004 Percent Completed in More than 120 Days
Percent Completed in More than 120 Days
State 2002 2003 2004 State 2002 2003 2004 50-State Totals 66.7 55.7 60.2 High Payment States Low Payment States New Mexico 73.1 79.6 70.0 Indiana 65.8 52.9 54.7 Maine 66.2 61.9 66.9 Michigan 67.7 55.6 69.0 Arkansas 60.7 67.1 64.8 Connecticut 63.2 67.5 68.2 West Virginia 71.7 79.6 73.0 Ohio 73.5 69.3 67.8 Oklahoma 57.0 76.3 69.2 New Jersey 80.8 64.7 64.5 Oregon 77.4 69.8 66.9 Illinois 65.5 66.6 68.3
As the above data indicated, most high and low payment states took longer to complete a rating than the 50-state average. In both FYs 2003 and 2004, high payment states completed a higher average percent of claims within 120 days than low payment states. As stated earlier, the number of rating actions completed affects the timeliness of claims processing, rather than the average annual payment.
Rater Experience. The percent of RVSRs with more than 2 years rating experience does not help to explain the variance in average annual payments by state, but it appears to influence the average annual payments. RVSRs should make consistent, conscientious, sound, and equitable judgment in applying policies to ensure accurate and timely decisions on disability benefit claims. VBA considers an RVSR to be journeyman after 2 years of rating experience. We reviewed RVSR experience to determine if the average experience of RVSRs contributed to the difference in average annual payments. The 50state percentage of RVSRs with more than 2 years rating experience was 50.1 percent in FY 2002, 57 percent in FY 2003, and 78.9 percent in FY 2004 (see Appendix D Table 17). For FYs 2002, 2003, and 2004, high payment states exceeded or came within 2 percentage points of the 50-state average of RVSRs with 2 years experience in 4, 6, and 5 states, respectively. Likewise, four low payment states exceeded or came within 2 percentage points of the 50-state average of RVSRs with 2 years experience in all 3 years.
Table 22 shows the percent of RVSRs with more than 2 years experience for FYs 2002 to 2004.
VA Office of Inspector General 31

Review of State Variances in VA Disability Compensation Payments
Table 22. Percent of RVSRs With More Than 2 Years Experience for FYs 2002–2004
State 2002 2003 2004 Difference 2002–2004
50-State Totals 50.1% 57.0% 78.9% 28.8 High Payment States New Mexico 58.8% 63.9% 88.2% 29.4 Maine 66.7% 62.8% 69.2% 2.5 Arkansas 48.0% 59.3% 100% 52.0 West Virginia 35.3% 63.4% 100% 64.7 Oklahoma 41.5% 72.4% 80.0% 38.5 Oregon 66.7% 71.3% 81.0% 14.3
Averages 52.8% 65.5% 86.4% Low Payment States Indiana 64.6% 55.1% 58.0% -6.6 Michigan 57.4% 54.1% 81.5% 24.1 Connecticut 50.0% 62.2% 77.8% 27.8 Ohio 13.1% 29.4% 81.7% 68.6 New Jersey 60.0% 61.3% 93.3% 33.3 Illinois 69.4% 77.8% 100% 30.6
Averages 52.4% 56.7% 82.1%
In FY 2004, RVSRs in 10 of the 12 high and low payment states had over 2 years of experience or were within 2 percentage points of the national average. The average percent of RVSRs with over 2 years of experience was 86.4 for high payment states and 82.1 for low payment states. Although there was not a significant difference in experience between high payment and low payment states, low payment states showing increases in rater experience also moved up in the state rankings based on new claims. Therefore, rater experience does not explain the variance in average annual payments between the states, but it does have some influence on the payment.
Appeal Rates. The appeal rates do not appear to influence the average annual payments made by the individual states. When a veteran is not satisfied with the rating decision made on a disability claim, the veteran or his representative may appeal the decision in an attempt to receive a more favorable rating. For FYs 2002–2004, there were 85,340 appeals filed, or 34 appeals per 1,000 veterans (see Appendix D Table 18). Four of the six high payment states, Arkansas (80), West Virginia (69), Oklahoma (38), and Oregon (39) had a greater number of appeals per 1,000 veterans than the 50-state average.
VA Office of Inspector General 32

Review of State Variances in VA Disability Compensation Payments
Table 23. High Payment States Veterans Appeals Filed for FYs 2002–2004
State Payment ReceivingAverage Annual Veterans
Compensation Appeals Filed
2002–2004 Appeals per
1,000 Veterans 50-State Totals $8,378 2,493,576 85,340 34 High Payment New Mexico $12,004 25,258 846 33 Maine $11,626 18,751 508 27 Arkansas $10,968 31,473 2,506 80 West Virginia $10,866 20,681 1,425 69 Oklahoma $10,697 51,213 1,930 38 Oregon $10,277 35,449 1,391 39
Averages $11,073 47.7
For low payment states with the lowest average payments, only Michigan (39) had a greater number of appeals than the 50-state average.
Table 24. Low Payment States Veterans Appeals Filed for FYs 2002–2004
State Payment ReceivingAverage Annual Veterans
Compensation Appeals Filed
2002–2004 Appeals per
1,000 Veterans 50-State Totals $8,378 2,493,576 85,340 34 Low Payment Indiana $7,287 42,855 1,424 33 Michigan $7,241 64,204 2,474 39 Connecticut $7,204 21,005 663 32 Ohio $7,039 85,527 2,751 32 New Jersey $7,028 46,903 1,376 29 Illinois $6,961 62,169 1,943 31
Averages $7,127 32.7
The data does not suggest that a higher rate of appeals results in higher average annual payments. Our review of high and low payment states found that 10 of 12 were not significantly different in the rate of appeals filed. Only Arkansas and West Virginia experienced significantly higher appeal rates than the 50-state average.
Transferred Cases. Another factor that would potentially impact the variance would be cases originally adjudicated in one state and later transferred to another state because the veteran relocated. Since VBA does not track transferred cases, we were unable to determine the impact transferred cases had on the variance.
Grant Rates. Another factor that might impact the variance would be grant and denial rates for compensation claims. While VBA published grant rates for a number of years through FY 2002, it discontinued publishing this data because the data was determined to be incomplete and misleading. Since VBA does not track grant and denial rates by VARO, we were unable to determine the impact these rates had on the variance.
VA Office of Inspector General 33

Review of State Variances in VA Disability Compensation Payments
Conclusion
We identified demographic and claims processing factors which have some influence or help to explain part of the average payment variance. VBA should develop a comprehensive and systematic method for collecting data on factors impacting variance in payments that will enable VA to model the compensation claims process and predict outcomes. Such information would help program managers evaluate issues such as variances in disability ratings or payment patterns. For example, VBA information systems should capture and compile metrics such as grant or denial rates for claims, accurate counts of unique veterans paid, payments by veteran and by disability, additional benefits payable due to dependency or SMC, and other descriptive demographic elements, such as educational level, that would assist in evaluating and explaining disability compensation program outcomes.
VA Office of Inspector General 34

Review of State Variances in VA Disability Compensation Payments
Issue 3: Rating Decisions for Certain Disabilities Influence Average Disability Compensation Payments
Findings
Extensive data analysis of ratings assigned veterans in each state disclosed that certain disability ratings appear to influence average annual payment rankings more than others. The review showed that states with higher average annual payments have higher average combined degrees of disability, higher average ratings for each of the 15 body systems, and higher percentages of veterans with ratings of 100 percent or with IU.
Certain disabilities have independently verifiable rating criteria and therefore are uniformly rated in all states (for example, physical measurements of below-the-knee amputations, above-the-knee amputations, and total deafness). Other disabilities with less obvious physical attributes rely more on veterans’ self-reported and third party data which may need to be developed and is more subject to interpretation and judgment.
We concluded that 100 percent and IU ratings account for much of the state-by-state variances. We also found that the number of veterans with 100 percent and IU ratings has increased significantly since FY 1999.
Overall Average Combined Degrees of Disability. Multiple disabilities generally result in a combined degree of disability for purposes of compensation payment. The combined degree of disability is expressed as a percentage and represents the total disabling effect of the veteran’s service-connected disabilities.
In FY 2004, the 50-state average combined disability rating was 37.0 percent (see Appendix D Table 19). In FY 2004, the six high payment states had higher average combined degrees of disability than the six low payment states. Table 25 shows high payment states had average combined degrees of disability of 44.2 percent, while low payment states averaged 33.4 percent.
VA Office of Inspector General 35

Review of State Variances in VA Disability Compensation Payments
Table 25. Combined Average Degree of Disability–FY 2004
State Payment Receiving
Rank byAverage Annual
Veterans
Compensation
Average Degree of Disability
Degree of Disability
50-State Totals $8,378 2,493,576 37.0% High Payment States New Mexico $12,004 25,258 45.0% 2 Maine $11,626 18,751 45.1% 1 Arkansas $10,968 31,473 44.2% 3 West Virginia $10,866 20,681 44.0% 4 Oklahoma $10,697 51,213 43.5% 5 Oregon $10,277 35,449 43.3% 6
Average 44.2% Low Payment States Indiana $7,287 42,855 34.2% 43 Michigan $7,241 64,204 33.5% 46 Connecticut $7,204 21,005 33.6% 45 Ohio $7,039 85,527 33.1% 47 New Jersey $7,028 46,903 33.0% 48 Illinois $6,961 62,169 32.9% 49
Average 33.4%
During FYs 1999–2004, the 50-state average annual payment increased by 38.4 percent from $6,053 to $8,378. The number of veterans receiving compensation by combined degree of disability increased from 2.2 million in FY 1999 to 2.5 million in FY 2004, an increase of 12.3 percent, as shown below:
Table 26. Veterans by Combined Degree of Disability–FYs 1999–2004 Combined Degree
of Disability 1999 2000 2001 2002 2003 2004 0% 17,133 16,664 16,135 15,650 15,237 14,671
10% 828,345 814,440 799,051 782,841 769,986 763,100 20% 358,472 359,155 360,669 376,566 385,758 392,452 30% 299,155 298,920 298,497 304,102 309,609 313,915 40% 187,654 190,643 194,547 208,382 221,808 231,452 50% 112,211 114,819 117,543 124,927 133,052 140,245 60% 114,122 118,277 122,328 133,970 147,108 157,145 70% 75,619 83,937 91,230 104,430 121,198 135,995 80% 46,746 50,941 55,371 65,899 78,740 89,787 90% 21,648 23,803 26,168 32,120 39,517 46,035
100% 159,157 162,868 166,880 179,475 195,136 208,779 Totals 2,220,262 2,234,467 2,248,419 2,328,362 2,417,149 2,493,576
During the 6-year period, significant shifts occurred in the distribution of assigned combined degrees of disability. The number of veterans in the 0 to 30 percent categories decreased from 67.7 to 59.5 percent and the number in the 70 to 100 percent categories increased from 13.7 to 19.3 percent.
VA Office of Inspector General 36

Review of State Variances in VA Disability Compensation Payments
In FY 2004, VA paid $20.9 billion in disability compensation to 2.5 million veterans. As shown below, the 70 percent and above veterans (19.3 percent) account for nearly 61.0 percent of all disability payments. The 100 percent veterans (8.4 percent) account for nearly 31.0 percent of all payments. The 30 percent and below veterans (59.5 percent) account for about 15.9 percent of all payments.
Table 27. Percentage of Veterans Receiving Compensation Payments by Degree–FY 2004
Degree Percent of
Payments Payments Combined
Veterans Total Percent of Total
0% 0.6% $12,778,441 0.1% 10% 30.6% $976,768,000 4.7% 20% 15.7% $972,888,508 4.7% 30% 12.6% $1,328,802,195 6.4% 40% 9.3% $1,413,940,268 6.8% 50% 5.6% $1,204,003,325 5.8% 60% 6.3% $2,313,017,255 11.1% 70% 5.5% $2,898,869,420 13.9% 80% 3.6% $2,127,772,326 10.2% 90% 1.8% $1,182,915,360 5.7%
100% 8.4% $6,459,622,260 30.9% 100.0% $20,891,377,358 100.0%
Totals may not add due to rounding.
As shown below, compared with low payment states, high payment states had lower percentages of veterans with combined degrees of disability below 40 percent and higher percentages of veterans rated above 60 percent. Only 46.8 percent of New Mexico’s veteran population was rated below 40 percent, while Illinois had 66 percent. Conversely, New Mexico had 31.6 percent rated above 60 percent, while Illinois had 15.2 percent.
VA Office of Inspector General 37

Review of State Variances in VA Disability Compensation Payments
Figure 6. Percent of Veterans with Combined Degrees of Disability Less than 40 Percent and Greater than 60 Percent
0%
10%
20%
30%
40%
50%
60%
70%
Mi
High Pay
New
Mex
ico
Mai
ne
Ark
ansa
s
Wes
t Vir
gini
a
Okl
ahom
a
Ore
gon
Indi
ana
chig
an
Con
nect
icut
Ohi
o
New
Jer
sey
Illin
ois
Perc
ent o
f Vet
eran
Pop
ulat
ion
Less than 40% Combined Degree
Greater than 60% Combined Degree
ment States Low Payment States
Veterans with 10 Percent and 100 Percent Ratings. The average compensation by state is based on the ratings assigned. In FY 2004, the difference in the average annual compensation payment for a veteran with a 10 percent rating and a veteran with a 100 percent rating was $30,069. Nationally, the average percentage of veterans with 10 percent ratings was 30.6 percent, and the average percentage of veterans with 100 percent ratings was 8.4 percent (see Appendix D Table 20).
Our analysis shows that states vary in terms of the percentages of 10 percent versus 100 percent ratings, and that there is a correlation to the variance. For example, the high payment states average fewer 10 percent ratings and more 100 percent ratings then the low cluster. The high payment states average 23.5 percent 10 percent ratings and 11.6 percent 100 percent ratings. The low payment states average 35.7 percent 10 percent ratings and 7.1 percent 100 percent ratings.
VA Office of Inspector General 38

Review of State Variances in VA Disability Compensation Payments
Table 28. Veterans with 10 Percent and 100 Percent Disabilities–FY 2004 Average Percent of Total Veterans Annual 10 Percent 100 Percent
State Payment Disabled Disabled 50-State Averages $8,378 30.6 8.4 High Payment States New Mexico $12,004 23.7 10.2 Maine $11,626 23.6 12.0 Arkansas $10,968 22.6 12.3 West Virginia $10,866 23.7 11.9 Oklahoma $10,697 22.9 11.1 Oregon $10,277 24.7 11.9
Averages 23.5 11.6 Low Payment States Indiana $7,287 32.9 6.6 Michigan $7,241 34.7 7.0 Connecticut $7,204 37.2 8.1 Ohio $7,039 34.5 6.9 New Jersey $7,028 39.0 7.5 Illinois $6,961 35.7 6.7
Averages 35.7 7.1
Consideration of Lump-Sum Disability Payment Option. As part of compensation program improvement efforts, VBA should consider proposing a one-time lump-sum payment option for less severe disabilities. As of September 2004, about 1.2 million (46.9 percent) of all veterans receiving compensation had less severe disabilities rated from 0 percent to 20 percent, but accounted for only about 9.4 percent of total compensation payments. Further, about 46.8 percent of the veterans who began receiving compensation in FY 2004 had 0 to 20 percent disability ratings.
Past studies, including the 1996 Veterans’ Claims Adjudication Commission, a 1997 OIG audit of claims processing timeliness, and a 2000 Government Accountability Office (GAO) survey of veterans, have suggested that VA and Congress consider paying less severely disabled veterans in a lump sum rather than recurring monthly payments. Although VBA did not implement a lump-sum option, we believe that it continues to be a viable option for veterans with minor disabilities. Several veteran disability programs of other countries, such as Canada, and other Federal disability programs require lump-sum payments or offer lump-sum payment options to some disability beneficiaries.
Consideration of this matter for all veterans with disabilities rated 20 percent or less would result in reducing 46.9 percent or 1.17 million active case files. It would also result in reducing recurring compensation payments of $1.96 billion a year and free up staff to improve the quality and timeliness of future workload. Acceptance of a lump-sum payment would not change a veteran’s eligibility status for health care benefits.
Veterans Receiving Compensation Payments for IU. Veterans whose disabilities are rated at less than 100 percent can receive compensation at the 100 percent rate if their disabilities prevent them from working. Nationally, the average percentage of veterans
VA Office of Inspector General 39
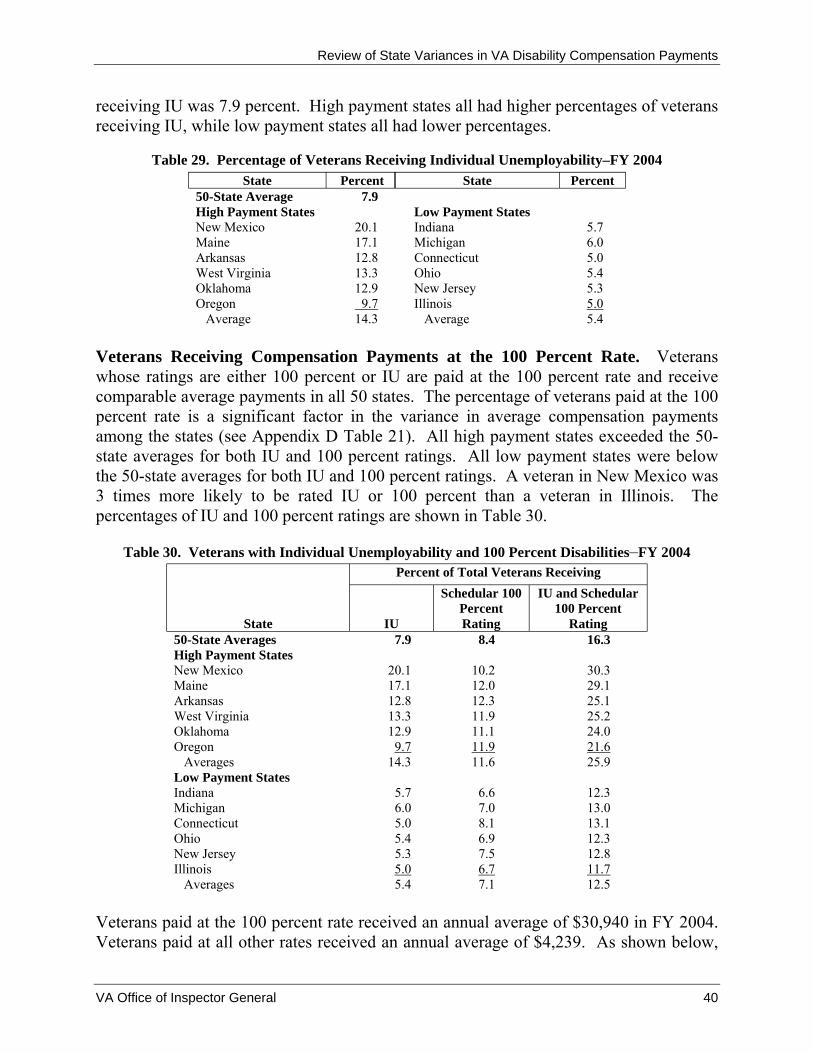
Review of State Variances in VA Disability Compensation Payments
receiving IU was 7.9 percent. High payment states all had higher percentages of veterans receiving IU, while low payment states all had lower percentages.
Table 29. Percentage of Veterans Receiving Individual Unemployability–FY 2004 State Percent State Percent
50-State Average 7.9 High Payment States Low Payment States New Mexico 20.1 Indiana 5.7 Maine 17.1 Michigan 6.0 Arkansas 12.8 Connecticut 5.0 West Virginia 13.3 Ohio 5.4 Oklahoma 12.9 New Jersey 5.3 Oregon 9.7 Illinois 5.0
Average 14.3 Average 5.4
Veterans Receiving Compensation Payments at the 100 Percent Rate. Veterans whose ratings are either 100 percent or IU are paid at the 100 percent rate and receive comparable average payments in all 50 states. The percentage of veterans paid at the 100 percent rate is a significant factor in the variance in average compensation payments among the states (see Appendix D Table 21). All high payment states exceeded the 50state averages for both IU and 100 percent ratings. All low payment states were below the 50-state averages for both IU and 100 percent ratings. A veteran in New Mexico was 3 times more likely to be rated IU or 100 percent than a veteran in Illinois. The percentages of IU and 100 percent ratings are shown in Table 30.
Table 30. Veterans with Individual Unemployability and 100 Percent Disabilities–FY 2004 Percent of Total Veterans Receiving
Schedular 100 IU and Schedular Percent 100 Percent
State IU Rating Rating 50-State Averages 7.9 8.4 16.3 High Payment States New Mexico 20.1 10.2 30.3 Maine 17.1 12.0 29.1 Arkansas 12.8 12.3 25.1 West Virginia 13.3 11.9 25.2 Oklahoma 12.9 11.1 24.0 Oregon 9.7 11.9 21.6
Averages 14.3 11.6 25.9 Low Payment States Indiana 5.7 6.6 12.3 Michigan 6.0 7.0 13.0 Connecticut 5.0 8.1 13.1 Ohio 5.4 6.9 12.3 New Jersey 5.3 7.5 12.8 Illinois 5.0 6.7 11.7
Averages 5.4 7.1 12.5
Veterans paid at the 100 percent rate received an annual average of $30,940 in FY 2004. Veterans paid at all other rates received an annual average of $4,239. As shown below,
VA Office of Inspector General 40

Review of State Variances in VA Disability Compensation Payments
the 16.3 percent of veterans paid at the 100 percent rate received 57.6 percent of the total compensation paid ($12 billion out of $20.9 billion).
Figure 7. Percent of Veterans Paid at 100 Percent Rate and Total Compensation Paid–FY 2004
57.6%
16.3%
42.4%
83.7%
0% 10% 20% 30% 40% 50% 60% 70% 80% 90%
Percent of Total Compensation
Percent of Veterans
Veterans Paid at 100 Percent Rate
All Other Veterans
Average Disability Ratings by Body System. The rating schedule categorizes physical and mental conditions by 15 body systems. We reviewed the average ratings for veterans in each state for each of the 15 body systems to determine the number of systems rated above and below the 50-state average (see Appendix D Table 22).
We analyzed the average rating assigned to each of the 15 body systems for high and low payment states. High payment states had ratings above the 50-state average for 82 of the 90 (6 x 15) body systems (91.1 percent), while low payment states had ratings above the 50-state average for 27 of 90 body systems (30 percent).
Table 31. Body Systems Ratings Above the 50-State Average Degree of Disability–FY 2004
State State Number Above
Average Number Above
Average High Payment States Low Payment States New Mexico 14 Indiana 7 Maine 13 Michigan 7 Arkansas 15 Connecticut 3 West Virginia 13 Ohio 6 Oklahoma 13 New Jersey 1 Oregon 14 Illinois 3
Body Systems Rating Data. Some diagnostic groups result in a much wider range of ratings, demonstrating that the ratings for some disabling conditions are impacted more by subjective decision making. For example, variability in ratings by body system ranged from a low of 5 percent in the Skin/Scars body system to a high of 26 percent in the Systemic body system. Data shows that for ratings that can be independently
VA Office of Inspector General 41
Review of State Variances in VA Disability Compensation Payments
validated based on physical measurements the degree of disability was consistent (see Appendix D Table 22).
Nationwide, some disabilities were evaluated consistently. For example, veterans receiving compensation for disabilities such as below-the-knee amputation, above-the-knee amputation, and total deafness, with few exceptions, received consistent ratings in each state:
• All 268,434 veterans with tinnitus were rated at 10 percent as designated by the rating schedule.
• Of 5,546 veterans with below-the-knee amputations, 5,373 (96.9 percent) were rated at 40 percent as designated by the rating schedule.
• Of 561 veterans with above-the-knee amputations, 543 (96.8 percent) were rated at 60 percent as designated by the rating schedule.
• Of 1,483 veterans with total deafness, 1,463 (98.7 percent) were rated at 100 percent as designated by the rating schedule.
VBA staff were taking appropriate corrective actions on cases that were not properly rated.
Rating Criteria for Some Disabilities Are More Difficult for RVSRs to Apply. The rating schedule criteria for some disabilities are based on physical measurements and are more definitive and therefore easier for RVSRs to consistently apply to all veterans. An example of these disabilities is below-the-knee amputation cases, which are easy to identify and evaluate because they require little judgment by the RVSRs. The criteria for other disabilities are less definitive and rely more on veterans’ self-reported data. Evaluating these disabilities requires RVSRs to use more judgment in applying the rating schedule. Examples are mental conditions and other disabilities such as paralysis of the foot, where the rating schedule provides that the rating percentage assigned is based on whether the condition is completely disabling (80 percent), severe with marked muscular atrophy (60 percent), moderately severe (40 percent), moderate (20 percent), or mild (10 percent). The rating schedule does not provide any additional guidance to the RVSRs for their evaluation of the disability.
One indication of conditions which are more difficult to evaluate is the variance in ratings among the states. Analysis of the average ratings by state for all 15 body systems showed a range of 5 percent for skin conditions (12–17 percent) to 26 percent for systemic (27–53 percent) conditions. The average range in ratings for all 15 body systems was 13 percent. Five other body systems with ranges of average ratings above 13 percent were Cardiovascular with 20 percent (23–43), Genitourinary with 20 percent
VA Office of Inspector General 42
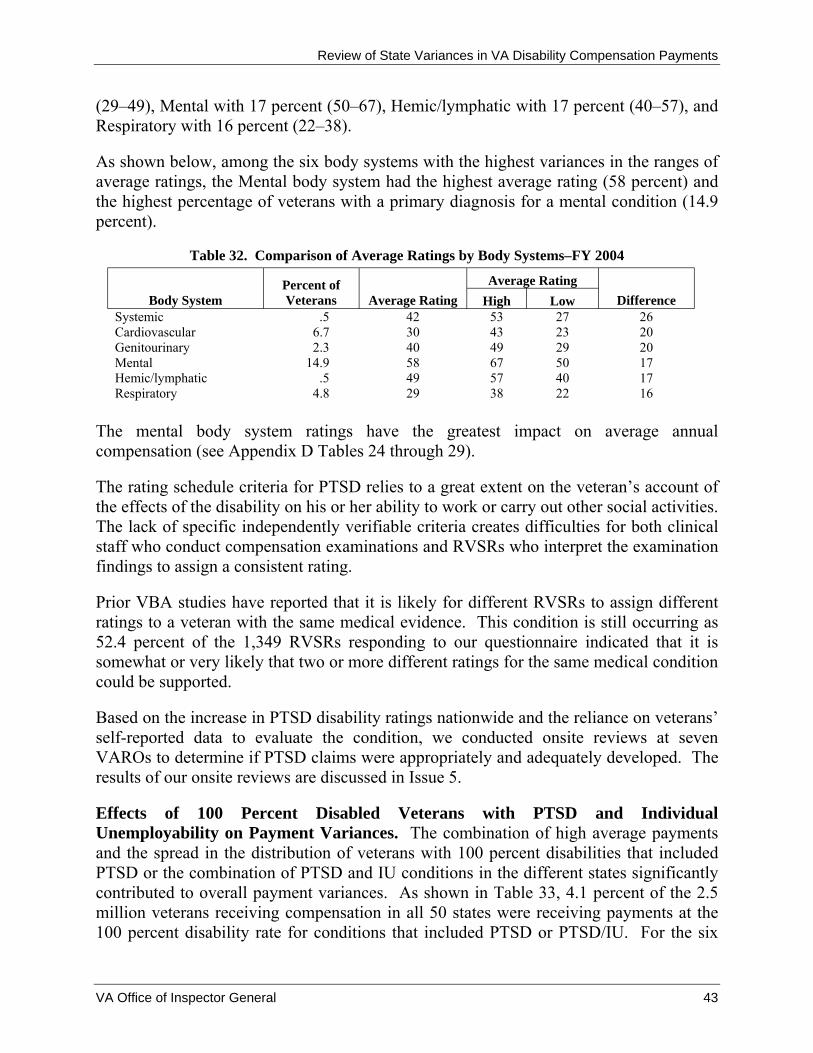
Review of State Variances in VA Disability Compensation Payments
(29–49), Mental with 17 percent (50–67), Hemic/lymphatic with 17 percent (40–57), and Respiratory with 16 percent (22–38).
As shown below, among the six body systems with the highest variances in the ranges of average ratings, the Mental body system had the highest average rating (58 percent) and the highest percentage of veterans with a primary diagnosis for a mental condition (14.9 percent).
Table 32. Comparison of Average Ratings by Body Systems–FY 2004
Body System Percent of Veterans Average Rating
Average Rating Difference High Low
Systemic .5 42 53 27 26 Cardiovascular 6.7 30 43 23 20 Genitourinary 2.3 40 49 29 20 Mental 14.9 58 67 50 17 Hemic/lymphatic .5 49 57 40 17 Respiratory 4.8 29 38 22 16
The mental body system ratings have the greatest impact on average annual compensation (see Appendix D Tables 24 through 29).
The rating schedule criteria for PTSD relies to a great extent on the veteran’s account of the effects of the disability on his or her ability to work or carry out other social activities. The lack of specific independently verifiable criteria creates difficulties for both clinical staff who conduct compensation examinations and RVSRs who interpret the examination findings to assign a consistent rating.
Prior VBA studies have reported that it is likely for different RVSRs to assign different ratings to a veteran with the same medical evidence. This condition is still occurring as 52.4 percent of the 1,349 RVSRs responding to our questionnaire indicated that it is somewhat or very likely that two or more different ratings for the same medical condition could be supported.
Based on the increase in PTSD disability ratings nationwide and the reliance on veterans’ self-reported data to evaluate the condition, we conducted onsite reviews at seven VAROs to determine if PTSD claims were appropriately and adequately developed. The results of our onsite reviews are discussed in Issue 5.
Effects of 100 Percent Disabled Veterans with PTSD and Individual Unemployability on Payment Variances. The combination of high average payments and the spread in the distribution of veterans with 100 percent disabilities that included PTSD or the combination of PTSD and IU conditions in the different states significantly contributed to overall payment variances. As shown in Table 33, 4.1 percent of the 2.5 million veterans receiving compensation in all 50 states were receiving payments at the 100 percent disability rate for conditions that included PTSD or PTSD/IU. For the six
VA Office of Inspector General 43

Review of State Variances in VA Disability Compensation Payments
high average payment states, the percentages of veterans with these disabilities were higher than the 4.1 percent 50-state average, ranging from 12.6 percent (New Mexico) to 5.4 percent (Arkansas). For the six low average payment states, the percent of veterans with these conditions were lower, ranging from 3.6 percent (Connecticut) to 2.2 percent (Ohio). By state, the average payments for these veterans were all very high, ranging from $28,059 to $28,711. For all other veterans, the average annual payment was only $7,523. For all states, the average payments for the all other veterans ranged from $6,251 to $9,966. See Appendix D Table 23 for details on all states.
Table 33. Veterans with 100 Percent Disability and PTSD or PTSD and IU Rating–FY 2004
State
Total Veterans
Average Annual Payment
Veterans with 100 Percent Disability and PTSD or PTSD and
IU Rating All Other Veterans Average Annual
Payment Percent PTSD and
PTSD/IU Average Annual
Payment 50-State Totals $8,378 4.1% $28,387 $7,523 High Payment States New Mexico $12,004 12.6% $28,310 $9,663 Maine $11,626 11.0% $28,191 $9,571 Arkansas $10,968 5.4% $28,535 $9,966 West Virginia $10,866 9.6% $28,517 $8,996 Oklahoma $10,697 7.1% $28,537 $9,338 Oregon $10,277 7.4% $28,363 $8,825
Average 8.9% Low Payment States Indiana $7,287 2.3% $28,202 $6,795 Michigan $7,241 2.3% $28,225 $6,744 Connecticut $7,204 3.6% $28,174 $6,430 Ohio $7,039 2.2% $28,315 $6,568 New Jersey $7,028 3.5% $28,300 $6,251 Illinois $6,961 2.8% $28,240 $6,340
Average 2.8%
To illustrate the contribution that the veterans with these conditions had on overall payment variances, we estimated the differences between the average payments for veterans with 100 percent disability ratings that included PTSD or PTSD and IU conditions and the veterans without these conditions.
As previously discussed, the difference between the highest (New Mexico) and the lowest (Illinois) state annual average payments for all veterans in the 50 states was $5,043. The difference between the high and low state payments for veterans in these states without the PTSD or PTSD/IU conditions was $3,323 or 65.9 percent of the $5,043 high-low payment difference for all veterans. Therefore, the remaining difference of $1,720 ($5,043–$3,323), or 34.1 percent of the 50-state veteran average payment
VA Office of Inspector General 44

Review of State Variances in VA Disability Compensation Payments
difference can be attributed to the distribution of veterans paid at the 100 percent rate with PTSD or PTSD/IU disabilities.
Effects of Veterans with 10 Percent, Individual Unemployability, and 100 Percent Disabilities on Payment Variances. To further illustrate the effects of some categories of veterans on payment variances, when veterans with 10 percent, IU, or schedular 100 percent disability ratings are excluded from the state average annual payment comparisons, the variance that can be attributed to the other veterans receiving compensation is dramatically reduced. For example, for FY 2004 the other veterans, those who have disability ratings ranging from 20 to 90 percent, account for 53.1 percent of all veterans receiving compensation and have an annual payment of $5,943. The annual average payment was $6,190 for all other veterans in New Mexico and $5,682 for all other veterans in Illinois, a variance of $508.
The $508 variance was significantly smaller that the overall variance of $5,043 for all veterans in these two states. When the $508 variance for all other veterans is subtracted from the $5,043 variance for all veterans, the remaining $4,535, accounts for 89.9 percent of the $5,043 total payment variance between the two states and represents the variance attributable to veterans with 10 percent, IU, and schedular 100 percent disability ratings (see Appendix D Table 21).
Conclusion
The increasing variance in state average annual payments is caused in part by the disproportionate increase in the number of veterans receiving ratings at 100 percent disability compensation and/or 100 percent disability compensation because of IU. Reviewing these claims folders to determine the appropriateness of the awards in the 12 states with the highest and lowest average annual payments should provide more information to VBA leadership on whether this condition is problematic or whether the awards are appropriate. As many reports have suggested in the past, VBA leadership needs to revamp the rating schedule to provide better criteria for ensuring rating consistency, and determine whether alternative compensation strategies are needed to replace a 60-year-old disability program model, which may not adequately reflect modern concepts of disability, and may not adequately provide for consistent disability determinations.
VA Office of Inspector General 45

Review of State Variances in VA Disability Compensation Payments
Issue 4: Claims Development Consistency Is Needed
Findings
We reviewed 2,100 PTSD claims awards at 7 VAROs to determine whether the claims had been properly developed and to identify cases involving potential claims fraud. We randomly selected the sample from the population of male veterans born on or after January 1, 1939, who were rated at least 50 percent for PTSD as of September 2003. These parameters covered 51.8 percent of all PTSD cases at the seven VAROs.
PTSD Regulations and Policies. Veterans are entitled to service connection for PTSD when: (1) there is medical evidence the veteran was diagnosed with the condition, (2) current symptoms can be linked with established medical evidence to an in-service stressor, and (3) there is credible supporting evidence that the claimed stressor occurred (38 C.F.R. 3.304(f)). The detailed PTSD claim development procedures are found in VBA manual instructions (VA Manual M21-1, Part III, Chapter 5).
To be diagnosed with PTSD, the veteran must have been exposed to a traumatic event of an extreme nature. While PTSD stressors are usually combat-related, they can also be noncombat-related (for example, duty on a burn ward or in a graves registration unit).
Primary sources of credible supporting evidence for a combat-related stressor causing PTSD include information obtained from the veteran’s service medical records (SMRs) and military personnel records (201 file). If a review of the SMRs and 201 file does not provide adequate evidence and the veteran has provided specific verifiable information about the claimed stressor, the rater should contact the appropriate military service research agencies to attempt to obtain evidence supporting the claimed stressor. Raters may also accept certain combat awards, such as the Purple Heart or the Combat Infantryman Badge, as evidence that a veteran engaged in combat.
If a veteran did not receive a combat award, VBA policy allows raters to accept a combat veteran’s testimony as credible supporting evidence of a combat-related stressor causing PTSD. However, the rater must confirm combat participation before accepting the veteran’s testimony about the combat stressor. If the evidence shows that the veteran engaged in combat, the rater may accept the veteran’s testimony as a basis for establishing the claimed stressor.
If the evidence does not establish that the veteran engaged in combat, the rater may not use the veteran’s testimony alone to establish the combat-related stressor. Instead, the rate must develop credible evidence that the claimed stressor occurred. In addition, the rater may accept other credible evidence, such as VA medical records or "buddy statements."
VA Office of Inspector General 46
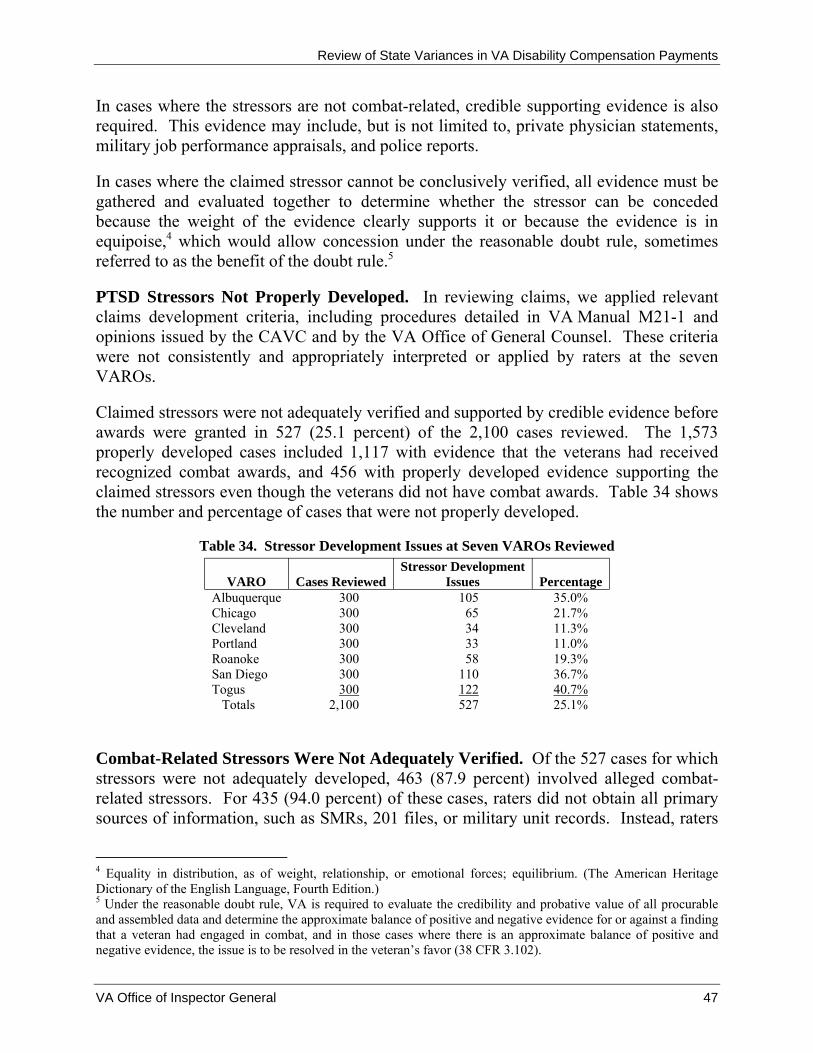
Review of State Variances in VA Disability Compensation Payments
In cases where the stressors are not combat-related, credible supporting evidence is also required. This evidence may include, but is not limited to, private physician statements, military job performance appraisals, and police reports.
In cases where the claimed stressor cannot be conclusively verified, all evidence must be gathered and evaluated together to determine whether the stressor can be conceded because the weight of the evidence clearly supports it or because the evidence is in equipoise,4 which would allow concession under the reasonable doubt rule, sometimes referred to as the benefit of the doubt rule.5
PTSD Stressors Not Properly Developed. In reviewing claims, we applied relevant claims development criteria, including procedures detailed in VA Manual M21-1 and opinions issued by the CAVC and by the VA Office of General Counsel. These criteria were not consistently and appropriately interpreted or applied by raters at the seven VAROs.
Claimed stressors were not adequately verified and supported by credible evidence before awards were granted in 527 (25.1 percent) of the 2,100 cases reviewed. The 1,573 properly developed cases included 1,117 with evidence that the veterans had received recognized combat awards, and 456 with properly developed evidence supporting the claimed stressors even though the veterans did not have combat awards. Table 34 shows the number and percentage of cases that were not properly developed.
Table 34. Stressor Development Issues at Seven VAROs Reviewed
Issues PercentageVARO Cases Reviewed Stressor Development
Albuquerque 300 105 35.0% Chicago 300 65 21.7% Cleveland 300 34 11.3% Portland 300 33 11.0% Roanoke 300 58 19.3% San Diego 300 110 36.7% Togus 300 122 40.7% Totals 2,100 527 25.1%
Combat-Related Stressors Were Not Adequately Verified. Of the 527 cases for which stressors were not adequately developed, 463 (87.9 percent) involved alleged combat-related stressors. For 435 (94.0 percent) of these cases, raters did not obtain all primary sources of information, such as SMRs, 201 files, or military unit records. Instead, raters
Equality in distribution, as of weight, relationship, or emotional forces; equilibrium. (The American Heritage Dictionary of the English Language, Fourth Edition.) 5 Under the reasonable doubt rule, VA is required to evaluate the credibility and probative value of all procurable and assembled data and determine the approximate balance of positive and negative evidence for or against a finding that a veteran had engaged in combat, and in those cases where there is an approximate balance of positive and negative evidence, the issue is to be resolved in the veteran’s favor (38 CFR 3.102).
VA Office of Inspector General 47
4

Review of State Variances in VA Disability Compensation Payments
relied on incomplete information, the veteran’s unsubstantiated testimony, or secondary source information such as buddy statements or information taken from Internet web sites to determine the veteran’s combat status and/or the occurrence of claimed stressors. In the remaining 28 cases (6.0 percent), raters obtained primary source information, but it was not sufficient to substantiate the claimed stressors. For these 28 cases, the raters should have either denied the claims or asked the veterans to provide additional information in support of their claims. The following examples illustrate inadequate development of claimed combat-related stressors.
• The Army veteran served in Vietnam with the military occupational specialty (MOS) of draftsman. There was no evidence of any combat awards. The veteran first applied for PTSD benefits in 1998, 31 years after his discharge from the military. He claimed that during the Tet Offensive he witnessed an elderly man being shot by a Vietcong soldier and that he then shot the soldier. He also described rocket and mortar attacks which occurred during the Tet Offensive. The rater obtained the veteran’s SMRs and 201 file, but these did not confirm the claimed stressors. Nevertheless, the rater decided that because the veteran’s unit was in Vietnam during the Tet Offensive, the claimed stressor could be conceded because the Tet hostilities were countrywide. In this case, the rater should have attempted to obtain evidence from the U.S. Armed Services Center for Unit Records Research (CURR) showing that the veteran’s unit was in combat. Although VARO officials did not agree with our conclusion about this case, VBA policy clearly requires that the rater establish the fact that the veteran’s unit was involved in combat and not merely that his unit was in Vietnam.
• The veteran served in Vietnam as a clerk. His PTSD claim cited several stressors including driving on sweep patrols, walking on patrols, and participating in firefights. The VARO obtained his SMRs and 201 file, but these records showed no combat awards or other evidence of combat exposure. The rater did not request any additional information to support the claimed stressors from the veteran or from CURR, but granted the rating because the veteran’s 201 file indicated that he had participated in counteroffensive operations. Mere participation in a military campaign is not necessarily indicative of participation in combat. The rating instructions state that if the evidence does not establish that the veteran was engaged in combat then credible supporting evidence is required to establish that a stressor occurred (VA Manual M21-1, Part III, 5.14). The instructions provide specific and detailed guidance on how raters should attempt to verify claimed stressors. When we discussed this case with VARO officials, they agreed that the rating was granted without sufficient evidence.
Claims such as these were granted because raters were not consistent when applying VBA evidentiary standards for determining veterans’ combat status and for confirming their claimed stressors. A major cause of the inconsistency was differing interpretations
VA Office of Inspector General 48
Review of State Variances in VA Disability Compensation Payments
of VBA policy for determining combat status and when stressors should be verified. For example, raters at one VARO told us that they often granted PTSD without verifying the combat stressors. Instead they based PTSD ratings on various types of evidence that might be indicative of combat, such as the veteran’s MOS or receipt of noncombat awards such as the Vietnam Campaign Medal. Raters at another VARO told us that they did not always verify combat stressors but instead conceded the stressors if evidence showed that the veteran had an MOS indicative of combat and served in an active combat zone for any extended period of time.
At another VARO, raters sometimes based their determinations of combat status partly on a “V” code in the 201 file.6 The raters believed that the “V” code meant that the veteran served in a combat unit, and they used this as evidence even if the veteran had no combat awards. However, we contacted the Department of Defense and learned that the “V” code did not represent service in a combat unit but merely that the veteran had served an unaccompanied tour of duty. In any case, mere service in a combat unit is not necessarily indicative of combat status or of a combat stressor. When we discussed this issue with VARO officials, they agreed to stop using the “V” code as an indicator of combat status. Because VAROs were inconsistently interpreting VA policy on determining combat status, PTSD claims were not treated consistently from VARO to VARO. The following example illustrates a case where combat status was inappropriately conceded. In this case, two VAROs denied the veteran’s PTSD claim, but a third VARO eventually granted the claim based on a local interpretation of the evidence needed to support combat status.
• The Army veteran served in Vietnam with an MOS of petroleum storage specialist. In a 1982 rating decision, the first VARO denied the veteran’s PTSD claim because there was no evidence to support his claimed stressors, which included conducting village sweeps and seeing dead bodies. In 1995, the veteran filed his claim at a second VARO. This VARO requested his 201 file, a stressor statement, and evidence of treatment for PTSD. The VARO received the 201 file, which did not show evidence of combat awards or other exposure to combat, and the veteran did not respond to the request for a stressor statement. In 1996, the VARO denied the veteran’s claim because his stressors could not be verified. In November 2002, the veteran filed his claim at a third VARO. This VARO requested a stressor statement, evidence to support the stressor, and records of PTSD treatment. The veteran did not respond to the request for stressor information, but the VARO did obtain medical records indicating the veteran attended intermittent group therapy sessions at a VA medical center during the period October 2001 to March 2003. In April 2003, the VARO granted the veteran a 50 percent rating for PTSD. According to the rating decision, service connection was granted because the “personnel service records”
6 This “V” code is shown in the type of “foreign service” section of the 201 file. This code is not the same as the “V” for valor device that is associated with some medals and that is shown in the “awards and decorations” section of the 201 file.
VA Office of Inspector General 49

Review of State Variances in VA Disability Compensation Payments
supported the claim of “stressful combat experiences.” This was not correct. The file does not contain any evidence of combat experiences. When we discussed this case with VARO officials, they acknowledged that the PTSD rating was granted because they believed the veteran’s combat status had been confirmed based on the “V” code in the personnel records and documented his receipt of a Vietnam Campaign Medal.
Noncombat-Related Stressors Were Not Adequately Verified. Sixty-four (12.1 percent) of the 527 cases that were not properly developed involved noncombat-related stressors. The evidentiary standards for noncombat-related stressors are higher than for combat-related stressors. Noncombat-related stressors must be confirmed with evidence. The following example illustrates the problem of granting a PTSD award based on a noncombat-related stressor that was not verified.
• The Navy veteran served from August 1998 to December 1999, when he was discharged under honorable conditions for fraudulent entry into military service. He spent all his active duty time in San Diego. In November 2000, he applied for PTSD compensation claiming an automobile accident as a noncombat stressor. He claimed he was a passenger in an automobile that was moving 3 miles per hour and was rear-ended by another automobile moving 80 miles per hour. The rater did not attempt to confirm that the accident occurred. Instead, the rater relied on a physician’s note made when the veteran visited a Navy infirmary 3 days after the alleged accident. The note states that the veteran claimed that he had stayed in a hospital overnight after the accident and was released the following day with no medications. The Navy physician who examined the veteran found no significant injuries. VARO officials maintained that the rating decision was correct and that the physician’s note adequately documented the occurrence of the accident. However, the note only documents the veteran’s testimony about the accident, not the actual occurrence of the accident. Since this is a noncombat-related stressor, the veteran’s testimony is not sufficient to verify it. The VARO should have attempted to obtain a police report of the accident and/or evidence that the veteran was seen overnight in a hospital. In addition, a police report and a hospital report could have removed any doubt about the circumstances surrounding the alleged accident. VA compensation is not payable if the accident occurred because of misconduct, such as driving while intoxicated. (We have referred this case to the OIG Office of Investigations).
VARO Agreement on Problem Cases Varied Greatly. At each of the seven VAROs, we reviewed PTSD cases using a consistent methodology based on VBA claims processing criteria. We also discussed selected problem cases with VARO officials to determine whether they agreed or disagreed with our assessment of these cases. There was a wide range of agreement and disagreement. At one VARO, officials agreed with our conclusions on 94 percent of the cases. At another VARO, officials agreed with our conclusions on only 5 percent of the cases. In our opinion, this range of agreement and disagreement is evidence of inconsistency in VARO processing of PTSD claims.
VA Office of Inspector General 50

Review of State Variances in VA Disability Compensation Payments
Inconsistent PTSD Claim Development Increases the Risk of Improper Payments. If VAROs do not process PTSD claims properly and consistently, there is little assurance that all benefit payments are appropriate. Some veterans may receive benefits they are not entitled to and others may not receive benefit payments they are entitled to. We concluded that there was inadequate assurance that benefits were paid properly in 25.1 percent of cases we reviewed. VARO officials agreed with our conclusions on 54.3 percent of cases discussed. However, we believe that development actions are still needed and therefore did not adjust the error rate. The fact that some regional offices agreed with development requirements and others did not agree with the same requirements lends support to our conclusion that PTSD cases are not developed consistently. If the 25.1 percent rate were applied to all PTSD cases and the associated benefit payments, annual payments made without adequate assurance would total about $860.2 million. Since the average age of veterans whose cases we reviewed was 56 and the average life expectancy of a 56-year-old male is 79 years, the potential PTSD benefits paid without adequate assurance would be an estimated $19.78 billion (23 years x $860.2 million).
Ratings for PTSD. During FYs 1999–2004, the number and percentage of PTSD cases grew significantly. While the total number of all veterans receiving disability compensation grew by only 12.3 percent, the number of PTSD cases grew by 79.5 percent, increasing from 120,265 cases in FY 1999 to 215,871 cases in FY 2004. During the same period, PTSD benefits payments increased 148.8 percent from $1.72 billion to $4.28 billion. Compensation for all other disability categories only increased by 41.7 percent. While veterans being compensated for PTSD represented only 8.7 percent of all claims, they received 20.5 percent of all compensation benefits.
Some Reasons for Development Inconsistencies. The accuracy and amount of compensation benefits paid for service-connected disabilities is dependent on two primary factors: rating specialists’ adherence to VBA policies and procedures to ensure proper development of veterans’ claims and medical examiners’ evaluations of the severity of claimed injuries or disabilities. Medical examiners must make a medical diagnosis that the claimed injury or disability exists, and the diagnosis must link symptoms or medical conditions to the veteran’s time of service. For some medical conditions, such as PTSD, the criteria are more ambiguous and rating specialists and medical examiners must use professional judgment to determine the presence and severity of conditions that may not necessarily be measured with conclusive diagnostic tests. Instead of x-rays or blood tests, these conditions require the veteran to self-report in-service stressors that have affected his normal functioning. Conditions such as PTSD leave room for interpretation by the medical examiner and the rating specialist, thus influences outside of the rating schedule may affect a veteran’s disability rating. Independent validation and reconstruction of the claimed stressors that prompted the claimed PTSD becomes more difficult when considering that the average age of veterans
VA Office of Inspector General 51
Review of State Variances in VA Disability Compensation Payments
in our sample was 56 years old, and the average elapsed time between their discharge and the effective dates of their initial PTSD ratings was 24 years.
As a further indicator of the ambiguous nature of rating subjective medical conditions, a 2003 study of 320 adult male combat veterans who were evaluated at VA PTSD outpatient clinics from 1995 to 1999 concluded that compensation-seeking veterans were much more likely to over-report or exaggerate their symptoms than were non-compensation-seeking veterans.7 This study suggested that VA disability compensation incentives influence the way some veterans report their symptoms when being evaluated for PTSD. The study further concluded that current VA disability policies have problematic implications for the delivery of clinical care, evaluation of treatment outcome, and rehabilitation efforts within VA.
This study highlights the highly subjective nature of PTSD claims and provides a possible explanation for part of the significant differences between percentages of PTSD claims in different states. To illustrate this difference, PTSD claims in New Mexico account for 18.2 percent of all claims and 36.6 percent of all compensation payments. In Illinois, PTSD claims account for 7.0 percent of all claims and 18.4 percent of all compensation payments.
PTSD Initial Ratings Increase Over Time. Based on our review of PTSD claim files, we observed that the rating evaluation level typically increased over time, indicating that the veteran’s PTSD condition had worsened. Generally, once a PTSD rating was assigned, it was increased over time until the veteran was paid at the 100 percent rate, either due to a 100 percent schedular rating or to being rated IU.
As of September 30, 2004, 4.1 percent of all veterans were receiving disability compensation payments for PTSD and were receiving compensation at the 100 percent rate. In the six states with the highest average payment for all veterans, 5.4 to 12.6 percent of all veterans had PTSD and were receiving compensation benefits at the 100 percent rate. By comparison, in the six states with the lowest average annual payments, 2.2 to 3.6 percent of all veterans had PTSD and were receiving benefits at the 100 percent rate (see Issue 3 Table 33).
Veterans Receiving Increases to 100 Percent Appear to Seek Less Treatment. When PTSD ratings were increased to 100 percent, veterans sought less treatment for the condition. In a judgment sample of 92 PTSD cases, we found that 39 percent of the veterans had a 50 percent or greater decline in mental health visits over the 2 years after the rating decision. The average decline in visits was 82 percent, and some veterans received no mental health treatment at all. While their mental health visits declined, non-mental health visits did not.
“Disability Compensation Seeking Among Veterans Evaluated for Posttraumatic Stress Disorder,” B. Christopher Frueh, Ph.D, Jon D. Elhai, Ph.D, Paul B. Gold, Ph.D, Jennine Monnier, Ph.D, Kathryn M. Magruder, Ph.D, Terence M. Keane, Ph.D, George W. Arana, M.D., Psychiatric Services, January 2003, Vol. 54, No.1.
VA Office of Inspector General 52
7

Review of State Variances in VA Disability Compensation Payments
Although 39 percent had a 50 percent or greater decline in mental health visits, they had a slightly higher rate of non-mental health care visits for the 2 years after they received their 100 percent rating. VA needs to review care provided at Vet Centers and through other sources to determine if there is a significant population of veterans who no longer pursue or receive mental health care after their 100 percent rating.
Some Web Sites Provide Questionable Claims Assistance Services. While conducting Internet research as part of our review, we noted an abundance of web sites providing advice to veterans filing PTSD claims or offering ways to compile less than truthful evidence to obtain approval. Information available on the Internet could be used by a veteran to create or embellish a stressor letter or exaggerate symptoms. For example, a veteran could utilize the U.S. National Park Service’s web site, which links to a private web site, the Virtual Wall, to locate the name of a “buddy” who was killed in combat during the Vietnam War and use this information as their stressor. The web site includes details, such as the MOS, branch of service, assigned unit, dates of birth and death, and residence of each veteran listed on the Vietnam Veterans Memorial. Because the site includes such detailed information, it could be used to make a false claim seem credible.
Other web sites offer free assistance, including tips on what to say during a VA C&P exam, sample stressor letters to submit with a PTSD claim, and sample letters that friends or family could send in support of a claim. While the motives of the operators of these web sites are not clear, the information provided is readily available to those filing PTSD claims, including those who may not actually have PTSD.
There are also web sites that offer evidence assistance for a fee. One site offers U.S. Army Training and Award Certificates. For $17.95, an individual could purchase a personalized Combat Infantryman Badge Certificate, and for $19.95 a Purple Heart Certificate. The web site clearly notes that no DD 214 is required to purchase these certificates. An individual, with no legitimate combat experience, could purchase one of these certificates and submit it as evidence of their combat stressors when filing a claim for PTSD. While a certificate submitted by a veteran should not be adequate credible evidence supporting a veteran’s combat status, it could be used by RVSRs when weighing evidence for or against a claim.
Increased Risk of Not Identifying Fraudulent Claims. The 527 cases that we identified as incompletely developed included 13 (2.5 percent) that we considered potentially fraudulent and that we referred to the OIG Office of Investigations. If RVSRs had properly developed these cases, they might have confirmed the veteran’s claimed stressors or determined that the claim was potentially fraudulent. The following examples illustrate how more careful development might have detected potential fraud cases.
• The Navy veteran served from January 1966 to August 1969 as a cook. He received no combat awards during his tour in Vietnam. He first filed a PTSD claim in 1983
VA Office of Inspector General 53

Review of State Variances in VA Disability Compensation Payments
and filed again in 1989 and 1991. For these three claims he alleged various stressors including combat as a Navy SEAL, being held as a prisoner-of-war, murdering a Vietnamese civilian, and being involved in a combat action during which now Senator John Kerry rescued him from a river. The veteran’s military records did not support any of these alleged stressors, so the VARO denied all three claims. In 1991, the veteran filed a fourth claim, this time supporting his claim with copies of letters he allegedly wrote his mother while he was in Vietnam. These letters mentioned combat experiences that were not consistent with the duties of a cook. Nevertheless, based on these letters the RVSR granted the veteran a 50 percent rating in September 1991. In our opinion, these letters were of questionable validity because of the veteran’s history of benefits seeking, his fabrication of stressors for his earlier claims, and the fact that the letters contained statements that a soldier would not normally make to his mother. We have referred this case to the OIG Office of Investigations.
• In December 1999, more than 31 years after his release from active duty, the veteran filed a PTSD claim. He served in the Marine Corps from September 1965 until September 1968 and spent 12 months in Vietnam as an aircraft maintenance crewman and crew chief. His claimed stressors included experiencing mortar and rocket fire and seeing wounded and dead soldiers. To support his claim, he submitted an 11page statement describing several alleged stressful experiences and including dates, locations, and names of fellow soldiers. The RVSR granted a 70 percent rating based on the veteran’s statement. However, if the RVSR had carefully compared evidence in the claim folder with the veteran’s statement, he would have discovered that it contained inconsistencies and probable exaggerations. For example, the veteran reported experiencing a rocket attack in April 1966 but his 201 file showed that he did not arrive in Vietnam until September 1966. Because of the date discrepancy and the improbability of the experiences recounted, we searched the Internet and found that the web site for the veteran’s Vietnam unit contained a number of “war stories” submitted by other veterans. Most of the events described in the veteran’s statement appear to have been taken from the web site. We discussed this case with VARO officials, and they agreed that it was a potentially fraudulent case. We have referred it to the OIG Office of Investigations for further review.
Conclusion
VBA needs to ensure that all rating personnel are consistently developing and documenting PTSD claims. Action is needed to develop and implement management oversight reviews designed to identify and evaluate PTSD rating inconsistencies, and provide training as needed. Action is also needed to develop and utilize monitors that will identify out-of-line rating situations and unusual increases in rates of growth so that managers can respond as needed.
VA Office of Inspector General 54

Review of State Variances in VA Disability Compensation Payments
Issue 5: VBA Needs to Reduce Error Rates and Strengthen Quality Improvement
Findings
A component of VBA’s national quality assurance program, STAR measures the accuracy of compensation claims processing at all regional offices. Under the STAR program, samples of compensation claims involving a disability rating are reviewed by independent reviewers of the C&P Program Review Staff.
According to the C&P Program Review Staff managers, the STAR program reviews a statistical sample of cases worked by each regional office. The STAR reviewers determine the processing accuracy of each case using the following criteria:
• Were all claimed issues addressed?
• Were all inferred/ancillary issues addressed?
• Was Veterans Claims Assistance Act (VCAA) pre-decision “notice” provided and adequate?
• Does the record show VCAA development requirements?
• Was grant/denial of all issues correct?
• Was percent evaluation correct?
• Were all effective dates affecting payment correct?
• Were all payment rates correct?
VBA has established quality goals for disability ratings. The FY 2003 goal was 88 percent accuracy and the FY 2004 goal was 90 percent. VBA did not meet its accuracy goals in either FY. STAR program results for FYs 2003–2004 show that the national error rates were 14.6 percent in FY 2003 and 13.0 percent in 2004. As shown in Table 35, the error rates among the high payment and low payment states do not show a consistent pattern (see Appendix D Table 31).
VA Office of Inspector General 55
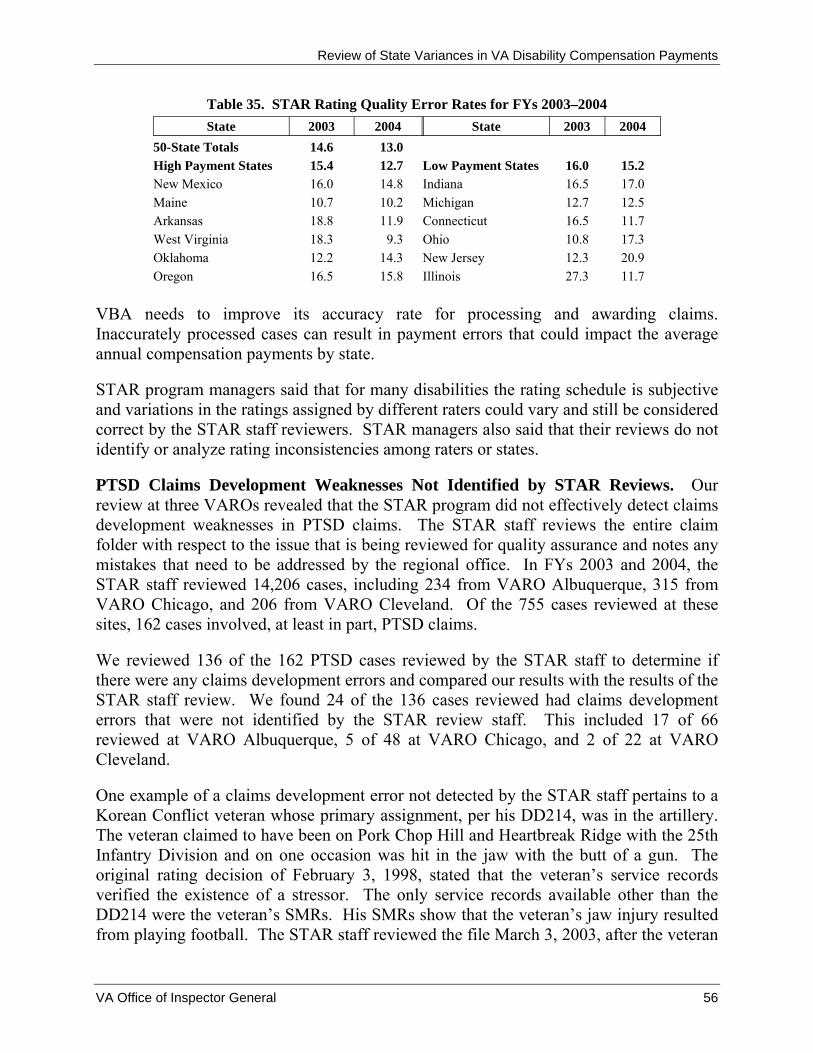
Review of State Variances in VA Disability Compensation Payments
Table 35. STAR Rating Quality Error Rates for FYs 2003–2004 State 2003 2004 State 2003 2004
50-State Totals 14.6 13.0 High Payment States 15.4 12.7 Low Payment States 16.0 15.2 New Mexico 16.0 14.8 Indiana 16.5 17.0 Maine 10.7 10.2 Michigan 12.7 12.5 Arkansas 18.8 11.9 Connecticut 16.5 11.7 West Virginia 18.3 9.3 Ohio 10.8 17.3 Oklahoma 12.2 14.3 New Jersey 12.3 20.9 Oregon 16.5 15.8 Illinois 27.3 11.7
VBA needs to improve its accuracy rate for processing and awarding claims. Inaccurately processed cases can result in payment errors that could impact the average annual compensation payments by state.
STAR program managers said that for many disabilities the rating schedule is subjective and variations in the ratings assigned by different raters could vary and still be considered correct by the STAR staff reviewers. STAR managers also said that their reviews do not identify or analyze rating inconsistencies among raters or states.
PTSD Claims Development Weaknesses Not Identified by STAR Reviews. Our review at three VAROs revealed that the STAR program did not effectively detect claims development weaknesses in PTSD claims. The STAR staff reviews the entire claim folder with respect to the issue that is being reviewed for quality assurance and notes any mistakes that need to be addressed by the regional office. In FYs 2003 and 2004, the STAR staff reviewed 14,206 cases, including 234 from VARO Albuquerque, 315 from VARO Chicago, and 206 from VARO Cleveland. Of the 755 cases reviewed at these sites, 162 cases involved, at least in part, PTSD claims.
We reviewed 136 of the 162 PTSD cases reviewed by the STAR staff to determine if there were any claims development errors and compared our results with the results of the STAR staff review. We found 24 of the 136 cases reviewed had claims development errors that were not identified by the STAR review staff. This included 17 of 66 reviewed at VARO Albuquerque, 5 of 48 at VARO Chicago, and 2 of 22 at VARO Cleveland.
One example of a claims development error not detected by the STAR staff pertains to a Korean Conflict veteran whose primary assignment, per his DD214, was in the artillery. The veteran claimed to have been on Pork Chop Hill and Heartbreak Ridge with the 25th Infantry Division and on one occasion was hit in the jaw with the butt of a gun. The original rating decision of February 3, 1998, stated that the veteran’s service records verified the existence of a stressor. The only service records available other than the DD214 were the veteran’s SMRs. His SMRs show that the veteran’s jaw injury resulted from playing football. The STAR staff reviewed the file March 3, 2003, after the veteran
VA Office of Inspector General 56

Review of State Variances in VA Disability Compensation Payments
had applied for an increase in compensation. They noted one error regarding the VCAA and one comment indicating that the SMRs were not secured in the files. The STAR staff did not note that the SMRs contradicted the veteran’s claims. Subsequent to our review, VARO staff concurred that there was no evidence sufficient to verify the veteran’s claimed stressors.
In another case, the STAR staff found that the VARO had used an incorrect effective date when establishing the claim, but they did not note any case development or stressor verification errors. The veteran, who served in the field artillery in Vietnam, claimed that enemy forces overran his position and killed 16 U.S. soldiers. He also claimed seeing a comrade die after an accidental weapon discharge. On February 20, 2002, the VARO denied the veteran’s PTSD claim citing the lack of a verified stressor. On October 8, 2002, the VARO granted a PTSD rating because of new evidence provided by the veteran from a private web site. The only information provided by the web site was that the veteran’s unit had been stationed in Vietnam, information that was clearly noted in the veteran’s military records. No other stressor verification was performed. The VARO concurred with our determination that the PTSD rating was granted prematurely and that further stressor verification should have been performed.
Although STAR reviewers evaluated most claims processing issues, they did not always examine the adequacy of the evidence used to reach rating decisions. In our opinion, an effective STAR reviews would have detected the types of development deficiencies we identified.
In 2004, VBA officials stated that the new RBA 2000 system might provide the data necessary to track regional office-specific average disability ratings for specific impairments, although VBA may need to collect system data for several years in order to analyze consistency. Furthermore, we were told by VBA managers that RBA 2000 data collected prior to October 2004 was unreliable.
Conclusion
Actions need to be taken to develop and implement a system for monitoring and analyzing the consistency of ratings so that out-of-line conditions can be timely identified and corrected.
VA Office of Inspector General 57

Review of State Variances in VA Disability Compensation Payments
Issue 6: Survey of Raters to Assess Factors That Affect the Consistency of Ratings from State to State
Findings
In March and April 2005, we surveyed RVSRs and DROs to obtain their input on issues that affect the rating of disability compensation claims. The survey had 38 questions about the backgrounds and training of the RVSRs and DROs, claims development, application of the rating schedule, production standards, and staffing. We also offered respondents the opportunity to provide comments on these or other issues. We received responses from 1,349 (67.7 percent) of the 1,992 potential respondents.
Demographics of Respondents. Survey respondents reported working an average of 6 years as RVSRs or DROs and an average of 14 years as VBA employees. The average age of the respondents is 47. Forty-five percent are veterans, and 59.2 percent of the veterans have service-connected disabilities.
Training. RVSRs and DROs expressed generally positive opinions of the quality of their training, but their responses indicate training has not received high priority.
• Fifty-seven percent evaluated the overall quality of training as good or very good; 16 percent evaluated it as poor or very poor.
• Forty-five percent reported that in the last 12 months they had received 10 hours or less of formal classroom instruction on rating policies and procedures. An additional 24.1 percent reported that they had received 11–20 hours of formal classroom instruction in the last 12 months.
• When asked how often their offices provide formal classroom instruction on rating policies and procedures, 18.0 percent replied once a week, 45.6 percent said once a month, and 36.4 percent said once a quarter or less often.
Claims Development. RVSRs and DROs expressed dissatisfaction with the adequacy of claims development. Forty-one percent of respondents estimated that 30 percent or more of the claims sent to the rating teams in the past 12 months as ready to rate were not actually ready. An additional 45.0 percent of respondents estimated that 10–29 percent of the claims were not ready.
Respondents believe that some claims are rated without all the needed information. Twenty percent estimated that, of the claims that were not ready to rate, more than 10 percent were actually rated without all the needed information. An additional 19.3 percent of respondents estimated that 5–10 percent of the claims that were not ready were actually rated without all the needed information.
VA Office of Inspector General 58

Review of State Variances in VA Disability Compensation Payments
Survey responses indicate that the quality of C&P medical exams performed by VA examiners and contract examiners is comparable. Forty-eight percent evaluated the quality of exams by VA examiners as good or very good; 18.5 percent evaluated them as poor or very poor. Forty-nine percent evaluated the quality of exams by contract examiners as good or very good; 16.3 percent evaluated them as poor or very poor.
Respondents believe that more C&P exams should be returned to the examiners as insufficient for rating purposes. Responses to two survey questions showed a significant disparity between estimates of the percentage of C&P exams that should have been returned and the percentage that were actually returned.
• Thirty-two percent of respondents estimated that 20 percent or more of exams should have been returned as insufficient. An additional 14.7 percent estimated that 11–19 percent of exams should have been returned as insufficient.
• Only 6.5 percent of respondents estimated that 20 percent or more of C&P exams were returned to the examiners as insufficient. An additional 8.5 percent estimated that 11–19 percent of exams were returned.
Application of Rating Schedule. Questions pertaining to the rating schedule resulted in mixed responses. Respondents indicated that they generally do not have difficulty using the schedule to assign diagnostic codes and degrees of disability, but that they could often support two or more different ratings for the same medical condition.
• Fifty-two percent of respondents stated it is generally easy or very easy to translate complete medical evidence to a diagnostic code with degrees of disability; 16.5 percent stated it is generally difficult or very difficult.
• In response to another question, 52.4 percent of respondents replied it is somewhat likely or very likely that two or more different ratings for the same medical condition could be supported; 25.0 percent replied it is somewhat unlikely or very unlikely.
When questioned about the ease of rating disabilities in each body system, RVSRs and DROs indicated that they have the least difficulty rating claims involving cardiovascular, respiratory, auditory, and eye conditions. They consider claims involving neurological and convulsive disorders, dental and oral conditions, and mental disorders the most difficult to rate. Survey responses indicated it is most likely that two or more different ratings could be supported for claims involving musculoskeletal conditions, mental disorders, and neurological and convulsive disorders. It is least likely that two or more different ratings could be supported for claims involving auditory and eye conditions, dental and oral conditions, and respiratory disorders.
VA Office of Inspector General 59
Review of State Variances in VA Disability Compensation Payments
Most respondents stated that when rating a claim they assume the veteran is applying for the highest possible rating and apply a broad and liberal interpretation of the rating schedule.
• Eighty-one percent strongly agreed or agreed somewhat with the statement that when rating a claim they start with the assumption that the veteran is applying for the highest possible rating for the claimed disability. Only 5.2 percent disagreed somewhat or strongly disagreed with that statement.
• Eighty percent strongly agreed or agreed somewhat with the statement that when rating a claim they apply a broad and liberal interpretation of the rating schedule. Only 7.3 percent disagreed somewhat or strongly disagreed with that statement.
RVSRs and DROs believe their objectives are different from those of their managers. We asked them to rank the importance of 16 potential objectives. Their responses indicated that when rating claims their most important objectives are complying with applicable criteria, granting the highest ratings allowed, and ensuring they have sufficient information before making decisions. We also asked them to rank the importance to their managers of 15 comparable objectives. Their responses indicated that they believe the most important objectives for their managers are maximizing the number of ratings done each day, reducing the backlog of pending work, and improving the timeliness of ratings.
Production Standards. Each VARO establishes production standards for its RVSRs and DROs, and those standards must equal or exceed national standards established by VBA. For journeyman RVSRs, the production standards range from 3 to 5 weighted8 cases per day for those working in the VAROs and from 3 to 7 weighted cases per day for those working at home. DROs have production standards ranging from 3 to 4 weighted cases per day.
Survey responses showed that RVSRs and DROs are concerned about their production standards, and many respondents indicated that the need to meet production standards adversely affects the quality of their work.
• Forty-seven percent said it is generally difficult or very difficult to meet their daily production standards; 22.5 percent said it is generally easy or very easy.
• Forty-nine percent strongly disagreed or disagreed somewhat with the statement that they have no difficulty meeting their production standards without sacrificing quality; 30.5 percent strongly agreed or agreed somewhat with that statement.
• Fifty-seven percent strongly agreed or agreed somewhat with the statement that they have difficulty meeting their production standards if they make sure they have
8 Cases are assigned different weights based on the type of claim and the number of claimed disabilities or issues rated.
VA Office of Inspector General 60

Review of State Variances in VA Disability Compensation Payments
sufficient evidence for rating each case and thoroughly review the evidence; 24.1 percent strongly disagreed or disagreed somewhat with that statement.
Staffing. Most RVSRs and DROs do not believe VAROs have sufficient rating staff. Sixty-five percent indicated that the rating activities in their offices have somewhat smaller or much smaller staffs than needed to provide timely and high quality service. Thirty-one percent indicated that the rating activities have about the right number of staff, and 4 percent indicated that the rating activities have somewhat larger or much larger staffs than needed.
Respondent Comments. At the end of the survey, we invited respondents to provide comments, and 593 provided additional input on a wide range of issues. Twenty-one respondents provided comments that were entirely positive, 424 identified problems or suggested improvements, and 148 provided statements with no apparent positive or negative connotations. The most frequently discussed issue, mentioned by 193 respondents, was management’s perceived emphasis on production at the expense of quality. The second most frequently discussed issue, mentioned by 44 respondents, was the need for more and better training. Other issues mentioned by multiple respondents included managers’ reluctance to return insufficient C&P exams, inadequacy of claims development, inconsistency of the production standards at different VAROs, inconsistent handling of PTSD claims, and the need to update the rating schedule. A selection of comments is provided below:
“Although management wants to meet quality goals, they are much more concerned with quantity. An RVSR is much more likely to be disciplined for failure to meet production standards than for failing to meet quality standards.”
“I have been encouraged to grant the highest benefit allowed by law since the date I began working for the VA. Management in our office stresses the importance of giving the veteran the highest benefit to which he or she is entitled by law. However, there is a lot of pressure to make your production standard. In fact, your performance standard centers around production and a lot of awards are based on it. Those who don't produce could miss out on individual bonuses, etc.”
“I believe our office should participate more in the broadcasts, many times they are taped and we are told we can see them at a later date, but never do. I beli[e]ve there should be more centralized training for RVSRs and DROs in order to provide more consistent ratings. I have worked brokered cases from several stations and have seen great differences in the way benefits are granted. One example is the grant of PTSD. Some offices grant service connection using only the Vietnam Service Medal as a stressor. This is not correct. Another observation is that there is never
VA Office of Inspector General 61

Review of State Variances in VA Disability Compensation Payments
any recognition or awards for quality work, awards only go to those who produce the most ratings. Management has indicated on several occasions that quality is as important as quantity, but this is not supported when it comes to handing out awards.”
“I find that there are too many changes in how cases are expected to be rated without enough training and instruction….”
“Exams often lack basic information needed for rating a disability, and generally speaking, we do not send back VA exams as insufficient.”
“The Rating Schedule allows for too much subjectivity in rating many conditions. For example when rating a digestive condition we rate on pronounced, severe, moderate or mild symptoms however we have no specific definition on what is considered pronounced, severe, moderate or mild.”
“Our local management does not make any requirements to rate cases that are not ready, or to inaccurately rate cases. Cases are rated based on the evidence of record….”
“If consistency nationwide is the goal, then the current rating schedule and other regulations are inadequate. Generally, there is too much room for subjective interpretation of evidence as applied to rating schedule criteria, even if the medical evidence is 'complete' (which it often is not; the generally poor or inconsistent quality of VA examinations plays a role in this issue, as well). That is why there is even a question of whether or not an individual or a station encourages a 'liberal' or a 'narrow' interpretation. Purely, or at least more, objective criteria for all body systems and diagnostic codes might help.”
“For the past 10 years no examination has been allowed to be returned as inadequate because the regional office concocted a deal with the hospital to cook the books on examination quality….Rating specialists and DRO's have been pressured to make rating decisions unwarranted by the evidence to make 'problem cases' go away….”
“The real truth will show that we are doing a fair job with each case we handle. Each veteran counts and the disabilities are rated as they should be, fairly.”
“The rules and regulations have changed so fast and ballooned in scope and complexity until I feel very strongly that: 1) no two RVSRs in our office would look at the same claim with the same evidence and come to
VA Office of Inspector General 62
Review of State Variances in VA Disability Compensation Payments
the same conclusion unless it was a very simple issue and 2) any reviewer could find something wrong with any rating that they picked up….One comment on the VA exam situation: some VA medical centers are very good and some are awful. We get everything we need from some and next to nothing from others. I have learned to live with what I have and rate accordingly….”
For a summary of responses to each question in the survey, see Appendix E.
Differences in Responses from States with Highest Compensation Payments and States with Lowest Payments. We compared the responses of RVSRs and DROs from the six states with the highest average compensation payments and the six states with the lowest average compensation payments to determine whether there were differences that might help explain the disparity in average payments to residents of those states. The comparison showed that the two groups have more similarities than differences. For example:
• The two groups of respondents are similar in length of experience, age, and percentage with veteran status.
• They expressed similar levels of dissatisfaction with claims development and indicated that more C&P exams should be returned to the examiners as insufficient for rating purposes.
• Similar percentages of respondents from both groups said that when rating a claim they assume the veteran is applying for the highest possible rating and they apply a broad and liberal interpretation of the rating schedule.
• The two groups have similar objectives when rating disability claims.
• They share concerns about production standards and staffing.
The following paragraphs summarize differences between the responses of RVSRs and DROs from the states with the highest average compensation payments and the responses of those from states with the lowest average compensation payments.
Demographics of Respondents. Responses of RVSRs and DROs with veteran status revealed differences in the percentages with service-connected disabilities and the periods of active duty. In states with the highest average payments, 75.4 percent of the RVSRs or DROs who are veterans have service-connected disabilities, while in states with the lowest payments this figure is 46.3 percent. In states with the highest average payments, RVSRs and DROs are more likely to have served on active duty during Peacetime or Gulf War than RVSRs and DROs in states with the lowest average payments, who are more likely to have served during the Vietnam Era.
VA Office of Inspector General 63

Review of State Variances in VA Disability Compensation Payments
Training. Survey responses indicated that training has received higher priority in the six states with the highest average compensation payments than in the six states with the lowest payments. The following graph compares estimates of the amount of formal classroom instruction on rating policies and procedures received by RVSRs and DROs in the past 12 months.
Figure 8. Hours of Formal Classroom Instruction
0 5
10 15 20 25 30 35 40 45
Perc
enta
ge States with highest average
compensation payments
States with lowest average compensation payments
one 0 20
30
40
50 0
–1 5
1– 1– 1– 1– nN 1 ha1 2 3 4 tor
eM
Hours
Responses to other survey questions also indicated that training of RVSRs and DROs has received higher priority in states with the highest average compensation payments. For example, when asked how often their offices provide formal classroom instruction on rating policies and procedures, 35.1 percent of respondents from states with the highest payments said once a week, 41.7 percent said once a month, and 23.2 percent said once a quarter or less often. In contrast, only 15.4 percent of respondents from states with the lowest payments said their offices provide formal classroom instruction on rating policies and procedures once a week, 45.6 percent said once a month, and 39 percent said once a quarter or less often.
Claims Development. Respondents from states with the highest average compensation payments have a more favorable opinion of C&P exams, whether performed by VA examiners or contract examiners, than respondents from states with the lowest average compensation payments.
• Fifty-two percent of respondents from states with the highest average compensation payments evaluated the quality of exams performed by VA examiners as good or very
VA Office of Inspector General 64
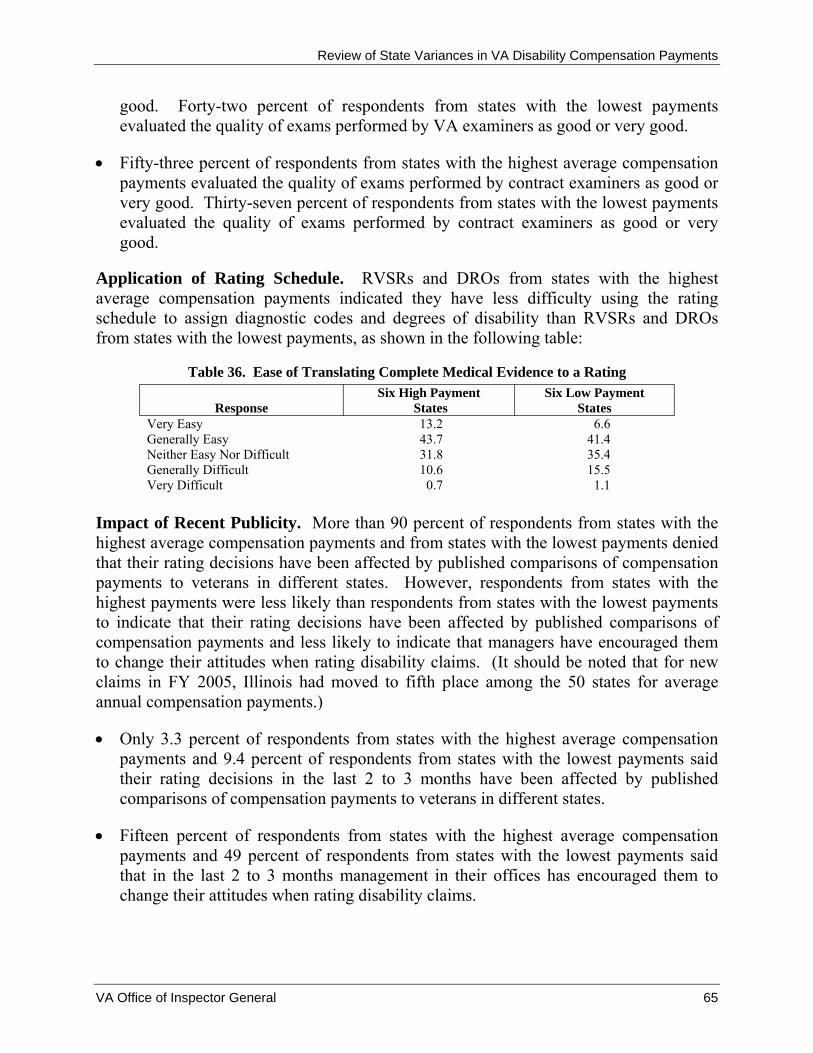
Review of State Variances in VA Disability Compensation Payments
good. Forty-two percent of respondents from states with the lowest payments evaluated the quality of exams performed by VA examiners as good or very good.
• Fifty-three percent of respondents from states with the highest average compensation payments evaluated the quality of exams performed by contract examiners as good or very good. Thirty-seven percent of respondents from states with the lowest payments evaluated the quality of exams performed by contract examiners as good or very good.
Application of Rating Schedule. RVSRs and DROs from states with the highest average compensation payments indicated they have less difficulty using the rating schedule to assign diagnostic codes and degrees of disability than RVSRs and DROs from states with the lowest payments, as shown in the following table:
Table 36. Ease of Translating Complete Medical Evidence to a Rating
States StatesResponse Six High Payment Six Low Payment
Very Easy 13.2 6.6 Generally Easy 43.7 41.4 Neither Easy Nor Difficult 31.8 35.4 Generally Difficult 10.6 15.5Very Difficult 0.7 1.1
Impact of Recent Publicity. More than 90 percent of respondents from states with the highest average compensation payments and from states with the lowest payments denied that their rating decisions have been affected by published comparisons of compensation payments to veterans in different states. However, respondents from states with the highest payments were less likely than respondents from states with the lowest payments to indicate that their rating decisions have been affected by published comparisons of compensation payments and less likely to indicate that managers have encouraged them to change their attitudes when rating disability claims. (It should be noted that for new claims in FY 2005, Illinois had moved to fifth place among the 50 states for average annual compensation payments.)
• Only 3.3 percent of respondents from states with the highest average compensation payments and 9.4 percent of respondents from states with the lowest payments said their rating decisions in the last 2 to 3 months have been affected by published comparisons of compensation payments to veterans in different states.
• Fifteen percent of respondents from states with the highest average compensation payments and 49 percent of respondents from states with the lowest payments said that in the last 2 to 3 months management in their offices has encouraged them to change their attitudes when rating disability claims.
VA Office of Inspector General 65
Review of State Variances in VA Disability Compensation Payments
For more detailed results of the comparison of responses from states with the highest average compensation payments and responses from states with the lowest average compensation payments, see Appendix F.
Conclusion
Survey respondents expressed generally positive opinions of the quality of their training, but their responses indicate training has not received high priority. Managers need to ensure that there is a balance of formal classroom instruction provided to all raters and routine updates on claims development and application of the rating schedule to ensure consistency in the adjudication process. Managers also need to determine whether raters at their regional offices are being required to rate claims without all the needed information, and take steps to resolve this issue if needed. While survey responses indicated that the quality of the C&P examinations performed by VA and contract examiners is comparable, respondents believed that more C&P examinations should be returned to examiners as insufficient for rating purposes. Managers need to work with their Veterans Health Administration (VHA) colleagues to ensure that C&P examinations are comprehensive and complete for rating purposes, and need to ensure that their raters are familiar with examination templates developed by the Compensation and Pension Examination Program (CPEP) office.
VBA leadership also needs to respond to the raters’ perception that their objectives are different from those of their managers. Their responses indicated that when rating claims their most important objectives are complying with applicable criteria, granting the highest ratings allowed, and ensuring they have sufficient information before making decisions. They believed the most important objectives for their managers are maximizing the number of ratings done each day, reducing the backlog of pending work, and improving the timeliness of ratings. About 57 percent of the raters said it is generally difficult to meet their production standards if they make sure they have sufficient evidence for rating each case and thoroughly review the evidence. Most raters did not believe regional offices have sufficient rating staff. VBA leadership needs to address this issue with their rating staffs in conjunction with strengthening development and rating consistency concerns expressed in the survey.
VA Office of Inspector General 66
Review of State Variances in VA Disability Compensation Payments
Issue 7: Source and Consistency of Disability Examinations
Findings
Our case review found that regardless of whether a contractor or VA physician completed the C&P disability medical examination, the rating outcome was essentially the same. Also, raters we surveyed reported that contractor and VA physician medical examinations were generally of the same quality. However, we noted that consistency in the way medical examinations are completed still needs management attention, and the C&P exam templates recently developed by the CPEP are not being used by many VHA medical facilities. Additionally, the CPEP management needs to improve communication with rating staff at the VAROs regarding the new template and seek their comments on any improvements needed.
The assignment of a disability rating to a veteran requires the collection and assessment of data from various sources. The veteran’s current medical status is determined through the performance of a physical examination. When a veteran is ill and presents to a hospital, the goal of the physical examination is to determine the cause and extent of the illness. If a veteran is examined for the purpose of determining the extent of his medical disability for compensation purposes, a focused physical examination is performed. Although similar, these two examinations have different goals and require different data to reach their conclusions.
VA physicians perform most disability medical examinations. VBA has a contract with QTC Medical Group, Inc.9 as an additional source for these examinations. After a veteran requests a disability determination, a VARO rater arranges for the veteran to have the required examination. The veteran may be scheduled for an examination with a provider at a VA hospital or a QTC physician.
Physicians contracted to QTC are not uniformly distributed throughout the county.10 The documentation and quality assurance procedures for QTC examinations are different than the procedures used by VA. The RVSR is therefore presented medical examination data in a similar format. VA pays QTC about $61 million for these services. The QTC average cost per examination is approximately $590.
Little Difference Between QTC and VA Physician Medical Examinations. To determine whether disability examination reports prepared by VA and QTC physicians affected the variance in ratings, we reviewed examination reports for initial PTSD examinations and joint examinations involving at least one knee.
9 As a result of Public Law 104-275, VBA initiated a contract with QTC Medical Group, Inc. to conduct a pilot toexamine the impact of disability examinations performed by non-VA physicians. 10 Under the QTC pilot, regional offices in Atlanta, Boston, Los Angeles, Roanoke, Salt Lake City, San Diego,Wichita, and Winston Salem utilized QTC resources. In addition to the test sites, the regional offices in Seattle,Muskogee, and Houston have access to QTC resources.
VA Office of Inspector General 67

Review of State Variances in VA Disability Compensation Payments
For those veterans whose initial PTSD examination was performed by a VA physician, the average rating was 31.3 with a confidence interval of 5.52. The average rating for those veterans whose initial PTSD examination was performed by a QTC physician was 37.7 with a confidence interval of plus or minus 4.93. At the .05 level of statistical significance, these results are similar. The joint examination review yielded a similar result. The VA physician examinations resulted in an average rating of 22.2 with a confidence interval of 4.63, which was not significantly different from the QTC physician group average rating of 23.4 with a confidence interval of 5.02. The physical examination samples we selected suggest that the rating result does not depend upon the source of the physical examination when comparing VA physicians and QTC physicians. This result is consistent with the finding in the Evaluation of Contract Examination Pilot Test of December 1999 where data suggested that the quality of QTC and VHA examinations is relatively constant across the examination categories.11
Our survey of raters yielded similar findings. Forty-eight percent of the 1,349 survey respondents evaluated the quality of examinations by VA physicians as good or very good; 19 percent evaluated them as poor or very poor. Forty-nine percent evaluated the quality of examinations by QTC physicians as good or very good; 16 percent evaluated them as poor or very poor.
The C&P Service maintains 57 types of disability examination request worksheets that guide clinicians to collect and report information needed to decide veterans’ disability claims. Each type of worksheet addresses a particular body system or category of disability. In the past, the worksheets have been provided to clinicians for reference during the conduct of examinations and dictation of findings.
Examination Report Templates Need To Be Mandated and Communicated to Medical Facilities and Regional Offices. CPEP, a joint VBA/VHA entity, is collaborating with the VHA Health Systems Design and Development office to develop an automated examination report template for each of the 57 disability examination request worksheets. The primary objective of automating the report templates is to eliminate errors of omission by means of “structured data entry.” This means that the automated template prompts the examiner to address each information element that is relevant for rating the specific condition being examined, and bypasses elements that does not pertain to that specific condition.
According to CPEP management, as of March 2005, 55 of the 57 automated examination report templates had been installed at all VHA examination facilities, but their use has not been mandated. These 55 templates are currently available for production purposes system-wide (that is they can be used in preparing any C&P examination report involving one or more of those 55 worksheets). CPEP management informed us that two templates
11 SRA International submission to Congress as required in Section 504 of Public Law 104-275, “Evaluation of Contract Examination Pilot Test” pg 61.
VA Office of Inspector General 68

Review of State Variances in VA Disability Compensation Payments
not yet in production system-wide are currently in beta testing and scheduled for system-wide release in April 2005.12 A software update, also scheduled for release in April, will allow a clinician to add templates during an examination when findings indicate a need for information from another worksheet.
While VA, through the development and implementation of CPEP report templates, is making an effort to standardize C&P medical examinations, use of the templates is not yet required of VHA facilities. VBA rating personnel have seen only a limited number of examination reports submitted in the template format. We spoke with personnel at seven VAROs and were informed that use of the templates at VHA facilities is not yet common. VSC personnel at five of the seven VAROs indicated that they either have not seen any examination reports completed in the template format or they have only seen a limited number completed by one medical center in their area. Use of the templates was more frequent at medical centers serving the other two VAROs. Rating personnel at two VAROs who have seen the results of C&P examinations presented in the template format stated that they believed the examination reports need to be improved and that it was difficult to locate the information needed for rating purposes. According to VBA management, they are engaged in an effort to review and approve the report templates.
Conclusion
We concluded that there is little difference between the quality of contractor produced C&P examinations and VA examinations and their impact on the degrees of disability that are eventually awarded to the veterans. Actions need to be taken to ensure examination report templates provide complete and accurate evidence needed to evaluate disability claims.
“Beta testing” means that the software for those worksheets has been installed and is being used for C&P examinations at a limited number of exam facilities. These beta test facilities volunteered to use the software and provide feedback about their experience with it so that any necessary adjustments can be made before deploying it system-wide for production purposes.
VA Office of Inspector General 69
12
Review of State Variances in VA Disability Compensation Payments
Issue 8: Fraudulent and Invalid VA Disability Compensation Claims
Findings
Fraudulent and invalid claims are two factors that could unnecessarily increase the amount of average VA disability compensation payments from state to state if left unchecked.
During FYs 1999–2004, the OIG successfully prosecuted 455 individuals who committed VA compensation and pension fraud. Prosecution-related recoveries for these cases totaled about $13.0 million, and administrative-related recoveries totaled about $12.6 million. Fines, penalties, and restitution totaled $36.2 million.
OIG reports issued during the same period have identified fraud and invalid payments such as payments made to deceased veterans and incorrect rating percentages that, if not abated, will cost the Government millions in unnecessary expenditures. To illustrate, recent audit and investigative work conducted at VARO San Juan and VARO Manila identified instances of potential fraudulent cases and invalid claims.
At VARO San Juan, we identified 1,353 erroneous claims that needed to be terminated. Overpayments totaled approximately $29 million and represented projected cost avoidances of more than $45 million over the next 5 years. Nine criminal cases were initiated and one search warrant was obtained and executed. At VARO Manila, 594 invalid cases were identified for suspension or termination because the claimants were deceased or not entitled to the payments. Overpayments totaled approximately $2.5 million, with projected cost avoidances totaling more than $21 million over the next 5 years. Criminal investigations initiated during the review were turned over to the Philippines National Police.
As of March 31, 2005, OIGs Death Match project has identified in excess of 9,650 possible investigative leads. Over 8,149 leads have been reviewed, resulting in the development of 860 criminal and administrative cases. Investigations have resulted in the actual recovery of $14.6 million, with an additional $7.3 million in anticipated recoveries. In addition to recoveries, the 5-year projected cost avoidance to VA is estimated at $32.6 million. To date, there have been 131 arrests in these cases with several additional cases awaiting judicial actions.
In another case, we identified 12 individuals that defrauded the VA of approximately $11.2 million. The review disclosed that a VA employee accessed and falsified numerous compensation cases to generate hundreds of benefit payments under the accounts of veterans who had died and had no beneficiaries. The individuals were prosecuted accordingly.
VA Office of Inspector General 70

Review of State Variances in VA Disability Compensation Payments
As the following examples illustrate, individual cases also have shown the need for VBA employees to adequately develop each claim and scrutinize evidence before authorizing compensation benefits. To illustrate,
• A Korean Conflict veteran seeking compensation falsified documents claiming that he had been a prisoner of war, received shrapnel injuries, and was awarded the Purple Heart Medal. In 1986, the veteran was granted a service-connected disability rating and through the VA appeal process was able to receive IU and payment at the 100 percent rate. The veteran’s story was aired by the media and it was reported that he was a surviving member of an Army group that allegedly was ordered to fire on Korean civilians at No Gun Ri. As a result of the media coverage, the OIG and VARO followed up on the veteran’s claim. A closer review of the evidence submitted by the veteran found it to be altered and fabricated. The veteran was indicted, convicted, and sentenced to 21 months’ incarceration and 3 years’ supervised release and was ordered to repay $412,839 to the Government.
• A veteran who received 70 percent disability compensation for PTSD was found to have fabricated his stressors in order to receive benefits. The VARO terminated the veteran’s benefits and created an overpayment of $122,041. The veteran pleaded guilty to fraud and was prosecuted and sentenced in December 2003.
• A veteran claimed to have been wounded in combat in Vietnam and to have witnessed several shocking incidents which caused him to suffer from PTSD, and to have been awarded three Purple Heart Medals. The veteran eventually persuaded the VA that his PTSD rendered him 100 percent disabled, and he received more than $250,000 in compensation payments. The veteran pleaded guilty to one count of theft of public money and five counts of wire fraud as the review found that he was not wounded in combat nor was he awarded any Purple Heart Medals. The veteran is serving a 13year sentence for making threats against the former President, using an explosive to commit a federal felony, making false bomb threats, and making false statements.
Some Veterans Receiving 100 Percent VA Disability Compensation for Unemployability May Not Be Entitled. In recent years, the number of veterans receiving IU has increased significantly. During the 6-year period FY 1999–2004, the number of veterans receiving increased benefits for IU increased from 95,052 to 196,916, a 107 percent increase. The increase in the number of veterans receiving 100 percent compensation has a correlation to the widening of the payment variance (see Issue 3). We found, however, that some veterans may not be entitled to these IU benefits.
VBA should be more aggressive in utilizing Internal Revenue Service (IRS) and Social Security Administration (SSA) records to ensure veterans claiming to be unemployable are not earning income. The Omnibus Budget Reconciliation Act of 1990 (Public Law 101-508) permitted VA to utilize IRS and SSA records for the Income Verification
VA Office of Inspector General 71

Review of State Variances in VA Disability Compensation Payments
Match (IVM) program. Under the program, VBA matches VA benefit records with IRS/SSA records to determine if veterans have earned income.
In FY 2004, the IVM program identified 8,486 veterans in receipt of VA disability compensation benefits whose reported income from employment exceeded $6,000.13 The 8,486 veterans included 289 whose income exceeded $50,000 (see Appendix G). VBA management analyzed these cases and referred them to the appropriate VARO for proper action, including termination of IU benefits if warranted. VBA referred the remaining cases to the pension maintenance centers, and controls were lax in tracking the results of these cases.
The following table shows 4.3 percent of all veterans receiving IU benefits had reported income exceeding $6,000. States with the highest average VA disability compensation payments ranged from 3.7 percent to 6.4 percent. States with the lowest average annual compensation payments ranged from 3.5 percent to 4.8 percent. If VBA does not establish better controls, the impact of inappropriate benefit payments cannot be adequately measured and evaluated and invalid claims will never be adjusted and resolved.
Table 37. Income Verification Match Results–FY2004 Veterans with IU Rating
State Number IVM Comp Referrals Percent Referrals 50-State Totals 196,916 8,486 4.3% High Payment States 25,111 1,152 New Mexico 5,076 325 6.4% Maine 3,199 131 4.1% Arkansas 4,024 147 3.7% West Virginia 2,741 108 3.9% Oklahoma 6,632 282 4.3% Oregon 3,439 159 4.6%
Averages 4,185 192 4.6%
Low Payment States 17,538 744 Indiana 2,448 106 4.3% Michigan 3,882 186 4.8% Connecticut 1,046 47 4.5% Ohio 4,585 160 3.5% New Jersey 2,471 111 4.5% Illinois 3,106 134 4.3%
Averages 2,923 124 4.2%
Not only had VBA not established centralized controls for monitoring the outcomes of all IU veterans reporting income to IRS, but VBA had also discontinued the requirement several years ago to require IU recipients to annually certify whether or not they were gainfully employed and earned income. VBA has recently reversed its earlier decision to discontinue annual certifications, and will again require veterans receiving IU to certify
13 IRS data used was from tax year 2002.
VA Office of Inspector General 72

Review of State Variances in VA Disability Compensation Payments
their employment and earned income. The certification requirements will remind veterans of their obligation to report changes in their employment status to VA, permit timely adjustments to payments, and caution veterans that signing a false statement could have serious consequences.
We were not able to obtain the IVM/IU data from VBA because the current Memorandum of Understanding (MOU) with IRS limited use to VBA, even though the law gave legal authority to VA as a whole. The current computer matching agreement between the IRS and VBA pertains to tax years 2002–2003.
In view of the increasing number of IU claims in recent years and the fact that VBA is identifying cases from the matches that need to be adjusted, actions need to be taken to strengthen monitoring controls over the development and authorization of IU ratings. Actions also need to be taken to share the IVM matching results with the OIG so that further work can be done to determine the extent of fraud in this area. Nationwide, the average annual payment for each veteran rated IU is $27,588; in FY 2004 there were 200,318 veterans who received IU. The average annual payment for IU over and above the average payment for other scheduler disabilities is $14,416 per veteran. If all 8,486 matched veterans represent fraudulent and improper payment cases, the potential estimated cost savings over 5 years is $611.7 million.
Conclusion
The identification of instances of fraud and invalid payments underscores the need for VBA employees to demonstrate due diligence in developing and reviewing evidence supporting applicants’ claims for benefits. Actions need to be taken to renegotiate an MOU to include making the matches available to all VA components having a need to know. In cases where fraud has occurred, VBA needs to refer the cases to OIG.
VA Office of Inspector General 73
Review of State Variances in VA Disability Compensation Payments
Recommendations To address issues pertaining to compensation payment variances, we recommend that the Under Secretary for Benefits take the following improvement actions:
1. Conduct a scientifically sound study using statistical models, such as a multi-variant regression analysis, of the major influences on compensation payments to develop baseline data and metrics for monitoring and managing variances, and use this information to develop and implement procedures for detecting, correcting, and preventing unacceptable payment patterns.
2. Coordinate with the Veterans’ Disability Benefits Commission to ensure all potential issues concerning the need to clarify and revise the Schedule for Rating Disabilities are reviewed, analyzed, and addressed.
3. Conduct reviews of rating practices for certain disabilities, such as PTSD, IU, and other 100 percent ratings, to ensure consistency and accuracy nationwide. At a minimum, these reviews should consist of data analysis, claims file reviews, and onsite evaluation of rating and management practices.
4. Expand the national quality assurance program by including evaluations of PTSD rating decisions for consistency by regional office, and to ensure sufficient evidence to support the rating is fully developed and documented, such as verifying the stressor event.
5. Coordinate with the Veterans Health Administration to improve the quality of medical examinations provided by VA and contract clinicians, and to ensure medical and rating staff are familiar with approved medical examination report templates and that the templates are consistently used.
6. In view of growing demand, the need for quality and timely claims decisions, and the ongoing training requirements, reevaluate human resources and ensure the VBA field organization is adequately staffed and equipped to meet mission requirements.
7. Consider establishing a lump-sum payment option in lieu of recurring monthly payments for veterans with disability ratings of 20 percent or less.
8. Undertake a more detailed analysis to identity differences in claims submission patterns to determine if certain veteran sub-populations, such as World War II, Korean Conflict, or veterans living in specific locales, have been underserved, and perform outreach based on the results of the analysis to ensure all veterans have equal access to VA benefits.
VA Office of Inspector General 74

Review of State Variances in VA Disability Compensation Payments
Appendix A
Selected Studies of the VA Disability Compensation Program and Rating Schedule
Since the implementation of the 1945 rating schedule, various studies, including the major 1956 Bradley Commission and the 1971 Economic Validation of the Rating Schedule (ECVARS) studies, and more recent VA-sponsored and GAO reviews have evaluated the adequacy and appropriateness of the rating schedule as the basis for compensating veterans with service-connected disabilities. Although done at different times over the past 50 years, these studies have repeatedly raised questions about whether or not the rating schedule reflected the economic, medical, and social changes have had on the earning capacity of disabled veterans since 1945.
The studies raised various concerns about the basis for the disability compensation program and use of the rating schedule, such as: the use of the average impairment rather than the individual veteran’s specific impairment and earning capacity as the basis for rating disabilities; advances in medicine, technology, and rehabilitation, and changes in types of work, workplace requirements, or societal attitudes towards disability have not been taken into account in the rating schedule; and, the subjective nature of medical evaluations and ratings for some disabilities and potentially inconsistent application of disability criteria by different raters or offices.
Bradley Commission (1956). As part of a 1950s study of VA compensation, pension, and other benefits, the President’s Commission on Veterans’ Pensions, known as the Bradley Commission, evaluated the rating schedule to determine if it was an adequate and equitable basis for compensating disabled veterans. Based on a nationwide survey of medical specialists, the Commission concluded in its 1956 report that the schedule’s medical rating criteria did not reflect the medical advances made since 1945. A comparison of the earnings and income of disabled veterans with those of nondisabled veterans and others found that, with the exception of totally disabled and elderly disabled veterans, there was little difference in income among the groups. Noting that the job market had shifted from the predominantly manual labor jobs of the 1945 era to more service-oriented and clerical jobs, the Commission concluded that the rating schedule was less representative of the average impairment of veterans performing non-manual labor jobs. In addition, the study found wide disparities between VA disability ratings and military disability retirement ratings for the same cases, with VA ratings being more conservative. The Commission indicated that more study was needed to determine true rating accuracy.
The Commission recommended that the rating schedule be revised based on factual data to ensure it reflected the average reduction in earning capacity. Stating that the purpose of the disability compensation program is economic maintenance, the Commission concluded that it was appropriate to periodically compare the earnings of disabled veterans with the earnings of the working population and to update the rating schedule to
VA Office of Inspector General 75

Review of State Variances in VA Disability Compensation Payments
Appendix A
ensure that disabled veterans are adequately compensated for the reduction in earnings resulting from their service-connected disabilities.
Economic Validation of the Rating Schedule (1971). In response to the Bradley Commission recommendations and other criticisms about inaccuracies in the rating schedule, VA conducted the ECVARS in the late 1960s and issued a report to Congress in 1971. ECVARS is considered the most comprehensive assessment of the rating schedule ever done. The study surveyed two groups—485,000 veterans receiving service-connected disability compensation and 14,000 veterans not receiving compensation. Controlling for age, education, and geographic region, ECVARS measured economic loss as the differences in median income between the two groups. According to a 1997 GAO analysis of ECVARS, disability compensation exceeded economic loss for 330 (47 percent) of 700 disability diagnostic codes represented in the study, and economic loss exceeded disability compensation for 75 (11 percent) of 700 diagnostic codes.
Based on the ECVARS results, VA proposed a revised schedule with adjustments to disability ratings that it believed would more accurately represent reductions in veterans’ earning capacity resulting from service-connected disabilities. However, the proposed schedule was not adopted, because VA believed Congress did not support the change. According to 1973 Congressional records, if the change had been made, 200,000 disabled Vietnam veterans would have lost significant benefits. Since ECVARS, VA has not conducted another comprehensive study to evaluate the effects of service-connected disabilities on veterans’ earnings.
VA Program Evaluation of Uniformity of Ratings (1983). As part of a 1983 evaluation of C&P programs, the VA Office of Program Planning and Evaluation assessed the uniformity of rating decisions. Based on a sample test of 26 disabilities in 16 claims administered to staff at 56 VAROs, the evaluators concluded that for some disabilities different raters would assign different ratings based on the same evidence. About 3 percent of the 1,315 ratings done for the sample claims were either higher or lower than the acceptable ranges of ratings established for the uniformity tests. However, the allowable acceptable ranges provided for wide variation in what could be considered to be a correct rating. For example, the acceptable range for a test case with a diabetes condition was 20–100 percent disabling, and the acceptable range for a case with PTSD was 0–70 percent.
The evaluators concluded that the lack of uniformity in ratings was random with no pattern of stricter or less strict VAROs. Contributing to the lack of uniformity were the vagueness and generality of some rating schedule medical criteria, imprecise and incomplete medical examination reports requiring subjective interpretation by raters, and the reluctance of raters to request additional information because of the additional time required and concerns about meeting work timeliness standards. The evaluators made no recommendations concerning uniformity of ratings.
VA Office of Inspector General 76
Review of State Variances in VA Disability Compensation Payments
Appendix A
GAO–Need to Update Medical Criteria Used in VA’s Disability Rating Schedule (1988). GAO concluded that VA could not ensure that veterans were assigned accurate and uniform disability ratings because the rating schedule had not been adjusted to incorporate the results of many recent medical advances. As a result, veterans may have been assigned inconsistent ratings and may have been undercompensated or overcompensated, depending on the rating specialist who processed a disability claim. Although some sections of the schedule had been recently revised, the schedule had not been comprehensively updated since 1945.
At GAO’s request, physicians from VA, the military services, and a medical school evaluated the medical criteria in the rating schedule and identified outdated terminology, ambiguous classifications, and medical conditions missing from the schedule. In responses to a GAO-administered questionnaire, VA rating specialists cited concerns about many diagnostic codes with inadequate criteria for distinguishing among degrees of severity and medical examinations identifying medical conditions not listed in the rating schedule. GAO recommended that VA update the schedule’s medical criteria and keep them current. In 1989, VA began a process of systematically updating the schedule to ensure the medical criteria for each diagnosis.
GAO–Law Allows Compensation for Disabilities Unrelated to Military Service (1989). According to GAO, the laws governing disability compensation do not require VA to determine if military service was a contributing factor in the cause of a disease but only require that the disease became manifest at the time of service. Based on a review of 400 sample cases for veterans receiving disability compensation as of August 1986, GAO estimated that about 19 percent of veterans receiving compensation had disabilities resulting from diseases that were probably neither caused nor aggravated by military service, and 13 percent had disabilities resulting from diseases for which the relationship to service could not be determined.
GAO suggested that Congress might want to reconsider whether diseases that arose during military service, but that were neither caused nor aggravated by the service, should be compensable conditions. Such a change would require revising the definition of “service-connected” and would likely require legislative action. GAO further suggested that such changes be prospective in order not to affect veterans already receiving compensation. VA did not comment on the matter. In 2003 Congressional testimony, GAO estimated that in 2002 about 290,000 veterans received $970 million for diseases identified as not caused by or related to military service.
Veterans’ Claims Adjudication Commission (1996). Authorized by Public Law 103446, the Veterans’ Claims Adjudication Commission, also known as the Melidosian Commission, conducted a major evaluation of C&P programs, including the claims and appellate processes. Although most of its work focused on other C&P program and management issues, the Commission’s 1996 report did comment on the rating schedule. The Commission concluded that the laws and regulations governing compensation were
VA Office of Inspector General 77
Review of State Variances in VA Disability Compensation Payments
Appendix A
silent on the purpose of the program and only vaguely defined the concept of disability for purposes of monetary benefits. Further, a clear statement of purpose codified in Title 38 United States Code would help program managers ensure the intent of Congress was met. The Commission also concluded that VA would benefit from better communication with others involved in similar disability determinations and recommended that VBA develop and implement a business plan to increase its involvement with other Federal and state disability programs, private insurers, and medical associations. This involvement could benefit VA by providing useful information about current administrative and medical evaluation theories and practices that could be applied to VA’s own programs.
In a March 1997 review of the Commission report, VA’s Strategic Management Group disagreed with the Commission’s conclusions on the need to clarify program intent, finding that the intent of the program—to compensate for disabled veterans’ average loss of earnings capacity—was clear. The Group did agree that it would be useful to be an active participant in associations involved in disability determinations. However, the Group indicated that the Commission’s intent in calling for a business plan to accomplish this recommendation was not clear and seemed unnecessarily prescriptive.
GAO–Disability Ratings May Not Reflect Veterans’ Economic Loss (1997). In 1997, GAO concluded that the rating schedule had not changed substantially since 1945. VA disability ratings were still primarily based on the judgments that the physicians and lawyers who developed the 1945 schedule made about disabilities and the average effect on the ability to perform jobs requiring manual and physical labor. Because the composition of industry and the workforce had changed over the years, the schedule did not correspond to disabled veterans’ actual average loss of earnings capacity. GAO further stated VA had made few substantive changes in the schedule in response to the 1956 Bradley Commission and the 1971 ECVARS studies. GAO suggested that there are generally accepted and widely-used research designs and statistical methods that VA could apply to develop actual earnings-based estimates of economic impairment associated with specific service-connected disabilities.
GAO suggested that Congress consider directing VA to develop such information and adjust disability ratings accordingly. GAO did not provide an estimate of the effects on beneficiary payments or program costs that might result from such a change in the basis for rating disabilities. In response, VA commented that the current rating schedule represented a consensus among Congress, VA, and the veteran community and that changing the basis for the rating schedule would serve no useful purpose.
VA OIG–Consideration of Lifetime Impairment in Disability Ratings (1997). In 1997, as part of an overall strategy to improve C&P claims processing timeliness, the OIG suggested that VBA revise rating criteria to reflect expected lifetime impairment so that VA could offer lump sum payments to veterans and reduce the number of reopened claims. VBA responded that changing to a lump sum payment option in lieu of small
VA Office of Inspector General 78

Review of State Variances in VA Disability Compensation Payments
Appendix A
monthly payments seemed to be counter to the purpose of the compensation program because it did not address the effects of worsening disabilities associated with aging.
National Academy of Public Administration Study (1997). A 1997 National Academy of Public Administration study of VBA’s overall management of the C&P program concluded that VBA had not developed the management capabilities needed to achieve permanent service performance improvements. One of the areas VBA needed to improve was the consistency of adjudication decisions. The Academy recognized the increasing complexity of claims processing requirements resulting from the advent of judicial review in the late 1980s and the increased number of disability claims and the number of disabilities being claimed by veterans.
The Academy identified several factors that could lead to inconsistency in claims decisions: (1) achieving consistency across 58 decentralized offices (Wyoming was a stand alone VARO in 1997) and 800 rating specialists was inherently difficult; (2) certain medical conditions, such as psychiatric cases, required subjective judgment in disability determinations; (3) regulations were sometimes unclear and subject to different interpretations; (4) the quality assurance system did not assess consistency of decisions; and (5) VBA lacked a comprehensive training strategy that identified training needs and used standardized training to meet those needs.
VA Claims Processing Task Force (2001). The Task Force was established by the Secretary of Veterans Affairs to assess VBA organization, management, and processes and to make recommendations to improve VA’s ability to process veterans’ C&P claims. While acknowledging the work of previous studies and commissions and VA initiatives to improve its capability to adjudicate claims, the task force noted the need for major improvement in areas such as accountability, leadership, organization, communication, change management, claims development, medical examinations, and training. One of the Task Force’s concerns was the lack of reliable assurances that claims decisions would be made as uniformly and fairly as possible to the benefit of the veteran. The Task Force made a number of short-term and middle-term recommendations to address the immediate claims backlog crisis and other quality issues.
In an April 2005 briefing paper, VBA indicated that actions in the last 3 years to implement the Task Force recommendations have improved the quality of its claims decisions and laid the groundwork for ensuring more consistency of decisions in the future. The implementation actions included changes to make all VARO organizations consistent in organization, work processes, and information technology applications; specialization and consolidation for certain types of claims; centralized training for claims processing staff, including computerized training modules, satellite broadcasts, and training letters on specific disability issues; revisions to the rating schedule to eliminate ambiguous criteria; site reviews to monitor policy compliance; and improvements in the STAR quality reviews to monitor and measure claims accuracy.
VA Office of Inspector General 79

Review of State Variances in VA Disability Compensation Payments
Appendix A
GAO–Reexamination of Disability Criteria (2002). In 2002, GAO evaluated the extent to which SSA and VA have updated disability criteria based on scientific advances and labor market changes. GAO found that SSA and VA had not fully updated their disability criteria and progress in updating medical criteria used to make eligibility decisions had been slow. The agencies had made some changes that recognized medical advances that have reduced the severity and occurrence of some conditions. However, the statutory design of the disability programs has limited the role of medical treatment and assistive technologies in determinations of disability. In addition, VA had made slow progress in updating the rating schedule, completing criteria revisions for 11 of the 16 body systems (now consolidated into 15 systems) since the process began in 1989. VA took on average about 5 years to complete updates of individual body systems. The amount of time was attributed to the extensive external and internal review processes used and the limited number of staff assigned to coordinate the updates.
GAO recommended that VA use its annual performance plan to define and carry out strategies for making progress in updating the rating schedule and that VA study and report to Congress the effects that a comprehensive consideration of medical treatment and assistive technologies would have on the VA disability compensation program. VA did not agree with the recommendations. VA responded that it was inappropriate to develop a timetable for future rating schedule updates while its initial review was still ongoing. VA did not agree to study the effects of medical treatment and assistive technologies on the compensation program, stating that moving in this direction would be a radical departure from the current program that might not be supported by Congress and the veteran community.
GAO–VA Disability Compensation Program Designated as High Risk (2003). In 2003, GAO designated modernization of Federal disabilities programs, including VA and SSA programs, as high risk areas because the programs were not aligned with 21st century realities or positioned to provide meaningful and timely support for persons with disabilities. As in its previous reviews, GAO again asserted that the VA disability compensation program had not been updated to reflect the current state of science, medicine, technology, and labor market conditions. In addition, while VA had made progress in improving the timeliness of its disability claims decisions, it was still far from meeting its goals. Modernizing the programs would likely require fundamental changes, including regulatory and legislative action.
GAO–Plan Needed for Assessing Consistency of Ratings (2004). In a 2004 review, GAO concluded that VBA did not systematically assess decision-making consistency among regional offices and that automated BDN payment system data did not provide a reliable basis for identifying indications of possible inconsistencies. Although GAO presented no empirical evidence showing that inconsistency in rating decisions was a significant problem, it repeated its concerns of earlier reviews. In 2002, GAO had reported that VA did not systematically assess decision-making consistency for specific
VA Office of Inspector General 80
Review of State Variances in VA Disability Compensation Payments
Appendix A
impairments, despite concerns about possible inconsistencies and that VBA’s STAR program assessed overall accuracy of disability decisions but not consistency of decisions. GAO cited concerns from the 1997 National Academy of Public Administration report and the 2001 VA Claims Processing Task Force about the inherent difficulty of achieving consistency across 57 regional offices because of differing interpretations of VA guidelines. VA had previously agreed in principle with GAO’s 2002 recommendation to conduct consistency assessments but did not describe how it would measure consistency.
In 2004, VA officials stated that the new RBA (Rating Board Automation) 2000 system might provide the data necessary to track regional office-specific average disability ratings for specific impairments although VA might need to collect system data for several years in order to analyze consistency. GAO recommended that VA develop a plan to use the data gathered from RBA 2000 to identify indications of possible inconsistencies in the award or denial of disability compensation among regional offices and to systematically study consistency for specific impairments based on the RBA 2000 data. VA agreed with GAO’s conclusions and recommendations.
Thesis on State Demographics and Veteran Disability (2004). A 2004 thesis prepared by the director of a state department of veterans’ affairs office evaluated state-by-state variances in the percentage of veterans receiving disability benefits and the percentage of veterans rated at different degrees of service-connected disability. For example, in 2001 the nationwide percentage of total veterans receiving disability compensation was 10.2 percent, with a low of 6.3 percent for Illinois and a high of 15.9 percent for Alaska. To evaluate the variances, the author performed statistical analyses of the relationships between various state demographic factors and disability receipt rates for VA’s C&P programs.
The author concluded that the distribution of disabled veterans across the nation was not random and that states with more rural, poor, and less educated populations had more disabled veterans. States with higher percentages of younger veterans and military retirees had higher percentages of disabled veterans. The influences of individual VAROs, state and local governments, and veterans’ service organizations had little effect on disability receipt rates. Veterans with higher disability ratings, including military retirees, migrated or returned to areas with lower socioeconomic conditions that are attractive for those living on fixed government-provided incomes. Older veterans with mild or moderate disabilities were less likely to apply for disability benefits. The author noted that his statistical tests were relatively simple and recommended that more complex analysis be done to provide more detail and to examine veteran population variations within states.
VA Office of Inspector General 81

Review of State Variances in VA Disability Compensation Payments
Appendix B
Selected Reviews of VA’s Disability Programs and Schedule for Rating Disabilities
Economic Systems Inc., Literature Review and Analysis of the Legislative History of the VA Disability Compensation Program, December 2004.
Clayton A. Clarke, State Demographics and Veteran Disability, (MLA thesis, Harvard University, 2004).
B. Christopher Frueh, et al., “Disability Compensation Seeking among Veterans Evaluated for Posttraumatic Stress Disorder,” Psychiatric Services, 54 (January 2003): 84–91, http://psychservices.psychiatryonline.org.
National Academy of Public Administration, Management of Compensation and Pension Benefits Claim Processing for Veterans, August 1997.
Department of Veterans Affairs VA Vocational Rehabilitation and Employment Task Force, Report to the Secretary of
Veterans Affairs: The Vocational Rehabilitation and Employment Program for the 21st Century Veteran, March 2004.
VA Claims Processing Task Force, Report to the Secretary of Veterans Affairs, October 2001.
VA OIG, Summary Report on VA Claims Processing Issues, December 1997.
VA Strategic Management Group, Review of Report to Congress of the Veterans’ Claims Adjudication Commission, March 1997.
Veterans’ Claims Adjudication Commission, Report to Congress, December 1996.
VA OIG, Report of Audit: Timeliness of Benefits Claims Processing Can Be Improved, March 1994.
VA Blue Ribbon Panel on Claims Processing, Proposals to Improve Disability Claims Processing in the Veterans Benefits Administration, November 1993.
VA Office of Program Planning and Evaluation, Program Evaluation of Veterans Compensation for Service-Connected Disability Program, 1983.
Administrator of Veterans Affairs Report to Committee on Veterans’ Affairs, House Representatives, Economic Validation of the Rating Schedule, July 1971.
VA Office of Inspector General 82

Review of State Variances in VA Disability Compensation Payments
Appendix B
Government Accountability Office GAO, High-Risk Series: Modernizing Federal Disability Programs, January 2005.
GAO, Veterans’ Benefits: VA Needs Plan for Assessing Consistency of Decisions, November 2004.
GAO, VA Benefits: Fundamental Changes to VA’s Disability Criteria Need Careful Consideration, September 2003.
GAO, SSA and VA Disability Programs: Re-Examination of Disability Criteria Needed to Help Ensure Program Integrity, August 2002.
GAO, Veterans’ Benefits: Quality Assurance for Disability Claims and Appeals Processing Can Be Further Improved, August 2002.
GAO, Veterans’ Benefits: Quality Assurance for Disability Claims Processing, August 2001.
GAO, Veterans’ Benefits: Training for Claims Processors Needs Evaluation, May 2001.
GAO, Veterans’ Benefits: Veterans Have Mixed Views on a Lump Sum Disability Payment Option, December 2000.
GAO, Veterans Benefits Administration: Problems and Challenges Facing Disability Claims Processing, May 2000
GAO, Veterans’ Benefits: Promising Claims-Processing Practices Need to Be Evaluated, April 2000.
GAO, Veterans’ Benefits Claims: Further Improvements Needed in Claims-Processing Accuracy, March 1999.
GAO, VA Disability Compensation: Disability Ratings May Not Reflect Veterans’ Economic Losses, January 1997.
GAO, VA Benefits: Law Allows Compensation for Disabilities Unrelated to Military Service, July 1989.
GAO, Veterans’ Benefits: Need to Update Medical Criteria Used in VA’s Disability Rating Schedule, December 1988.
VA Office of Inspector General 83

Review of State Variances in VA Disability Compensation Payments
Appendix C
Diseases Subject to Presumptive Service Connection
This appendix lists the VA-recognized presumptive service-connected conditions as prescribed in Title 38, Code of Federal Regulations, Volume 1, Section 3.309, revised as of July 1, 2004.
Chronic Diseases Anemia, primary Arteriosclerosis Arthritis Atrophy, Progressive muscular Brain hemorrhage Brain thrombosis Bronchiectasis Calculi of the kidney, bladder, or gallbladder Cardiovascular-renal disease, including
hypertension Cirrhosis of the liver Coccidioidomycosis Diabetes mellitus Encephalitis lethargica residuals Endocarditis Endocrinopathies Epilepsies Hansen’s disease Hodgkin’s disease Leukemia Lupus erthematosus, systemic Myasthenia gravis Myelitis
Tropical Diseases Amebiasis Cholera Dysentery Leishmaniasis, including kala-azar Malaria Oroya fever Plague Yaws
Myocarditis Nephritis Other organic diseases of the nervous
system Osteitis deformans (Paget’s disease) Osteomalacia Palsy, bulbar Paralysis agitans Psychoses Purpura idiopathic, hemorrhagic Raynaud’s disease Sarcoidosis Scleroderma Sclerosis, amyotrophic lateral Sclerosis, multiple Syringomyelia Thromboangilitis obliterans (Buerger’s
disease) Tuberculosis, active Tumors, malignant, or of the brain or
spinal cord or peripheral nerves Ulcers, peptic (gastric or duodenal)
Blackwater fever Dracontiasis Filariasis Loiasis Onchocerciasis Pinta Schistosomiasis Yellow fever
VA Office of Inspector General 84

Review of State Variances in VA Disability Compensation Payments
Psychosis Any of the anxiety states Avitaminosis Beriberi (including beriberi heart disease) Chronic dysentery Helminthiasis Dysthymic disorder (or depressive
neurosis) Cirrhosis of the liver Stroke and its complications Organic residuals of frostbite, if determined
that the veteran’s internment was in climatic conditions consistent with the occurrence of frostbite
Appendix C
Diseases Specific to Former Prisoners of War Atherosclerotic heart disease or
hypertensive vascular disease (including hypertensive heart disease) and their complications (including myocardial infarction, congestive heart failure, arrhythmia)
Malnutrition (including optic atrophy associated with malnutrition)
Pellagra Post-traumatic osteoarthritis Any other nutritional deficiency Irritable bowel syndrome Peptic ulcer disease Peripheral neuropathy, except where
directly related to infectious causes
Diseases Specific to Radiation-Exposed Veterans Cancer of the bile ducts Cancer of the thyroid Cancer of the breast Cancer of the pharynx Cancer of the esophagus Cancer of the stomach Cancer of the small intestine Cancer of the pancreas Multiple myeloma Lymphomas (except Hodgkin’s disease) Cancer of the ovary Cancer of the lung
Leukemia (other than chronic lymphocytic leukemia)
Primary liver cancer (except if cirrhosis or hepatitis B is indicated)
Cancer of the gall bladder Cancer of the salivary gland Cancer of the urinary tract Bronchiolo-alveolar carcinoma Cancer of the bone Cancer of the brain Cancer of the colon
VA Office of Inspector General 85

Review of State Variances in VA Disability Compensation Payments
Appendix C
Diseases Associated with Exposure to Certain Herbicide Agents Non-Hodgkin’s lymphoma Multiple myeloma Hodgkin’s disease Respiratory cancers (cancer of the lung,
bronchus, larynx, or trachea) *Soft-tissue sarcoma (other than
osteosarcoma, chondrosarcoma, Kaposi’s sarcoma, or mesothelioma)
Chloracne or other acneform disease consistent with chloracne
*Soft-tissue sarcoma includes the following: Adult fibrosarcoma Dermatofibrosarcoma protuberans Malignant fibrous histiocytoma Liposarcoma LeiomyosarcomaMalignant ganglioneuroma Rhabdomyosarcoma Ectomesenchymoma Congenital and infantile fibrosarcoma Proliferating (systemic)
angioendotheliomatosis Malignant hemangiopericytoma Epithelioid leimyosarcoma (malignant
leiomyoblastoma)
Type 2 diabetes (also known as Type II diabetes mellitus or adult-onset diabetes)
Acute and subacute peripheral neuropathy
Porphyria cutanea tarda Prostate cancer Chronic lymphocytic leukemia
Synovial sarcoma (malignant synovioma) Malignant giant cell tumor of tendon
sheath Malignant schwannoma
Malignant mesenchymoma Malignant granular cell tumor Alveolar soft part sarcoma Epithelioid sarcoma Clear cell sarcoma of tendons and
aponeuroses Extraskeletal Ewing’s sarcoma Malignant glomus tumor Angiosarcoma (hemangiosarcoma and
lymphangiosarcoma)
VA Office of Inspector General 86
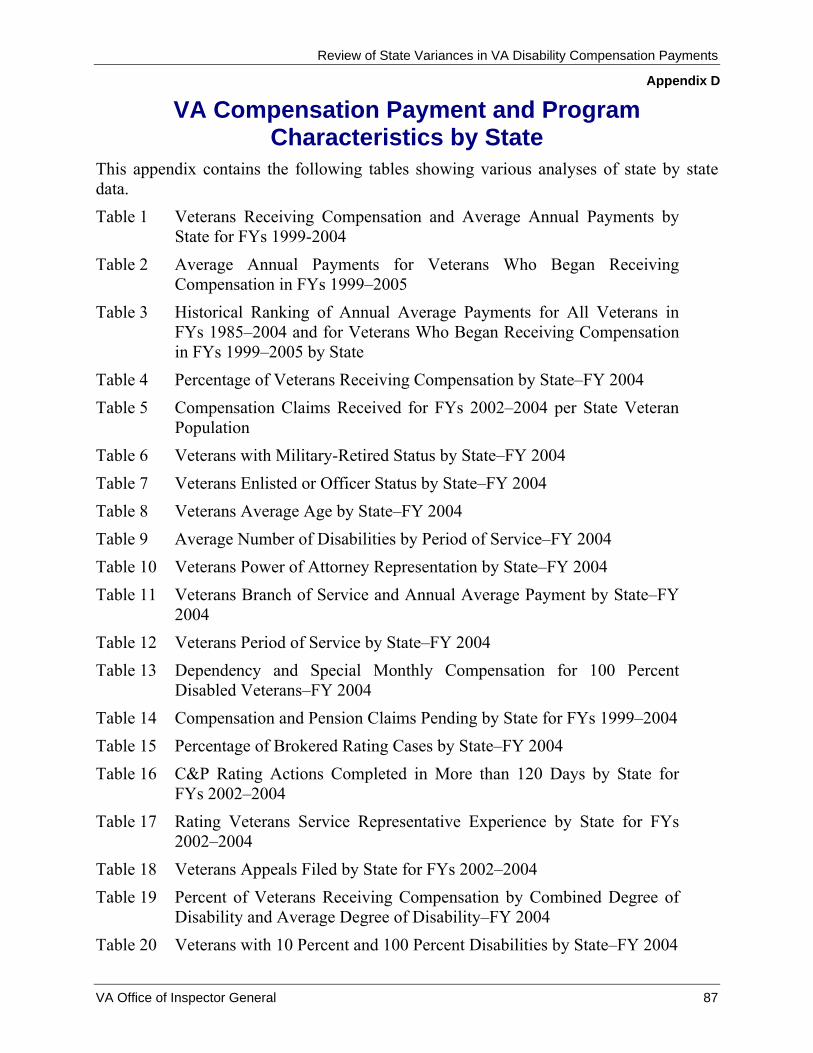
Review of State Variances in VA Disability Compensation Payments
Appendix D
VA Compensation Payment and Program Characteristics by State
This appendix contains the following tables showing various analyses of state by state data. Table 1 Veterans Receiving Compensation and Average Annual Payments by
State for FYs 1999-2004 Table 2 Average Annual Payments for Veterans Who Began Receiving
Compensation in FYs 1999–2005 Table 3 Historical Ranking of Annual Average Payments for All Veterans in
FYs 1985–2004 and for Veterans Who Began Receiving Compensation in FYs 1999–2005 by State
Table 4 Percentage of Veterans Receiving Compensation by State–FY 2004 Table 5 Compensation Claims Received for FYs 2002–2004 per State Veteran
Population Table 6 Veterans with Military-Retired Status by State–FY 2004 Table 7 Veterans Enlisted or Officer Status by State–FY 2004 Table 8 Veterans Average Age by State–FY 2004 Table 9 Average Number of Disabilities by Period of Service–FY 2004 Table 10 Veterans Power of Attorney Representation by State–FY 2004 Table 11 Veterans Branch of Service and Annual Average Payment by State–FY
2004 Table 12 Veterans Period of Service by State–FY 2004 Table 13 Dependency and Special Monthly Compensation for 100 Percent
Disabled Veterans–FY 2004 Table 14 Compensation and Pension Claims Pending by State for FYs 1999–2004 Table 15 Percentage of Brokered Rating Cases by State–FY 2004 Table 16 C&P Rating Actions Completed in More than 120 Days by State for
FYs 2002–2004 Table 17 Rating Veterans Service Representative Experience by State for FYs
2002–2004 Table 18 Veterans Appeals Filed by State for FYs 2002–2004 Table 19 Percent of Veterans Receiving Compensation by Combined Degree of
Disability and Average Degree of Disability–FY 2004 Table 20 Veterans with 10 Percent and 100 Percent Disabilities by State–FY 2004
VA Office of Inspector General 87

Review of State Variances in VA Disability Compensation Payments
Appendix D
Table 21 Veterans with 10 Percent, Individual Unemployability, and Schedular 100 Percent Disabilities by State–FY 2004
Table 22 Veterans Average Ratings for Primary Disability by Body Systems and State–FY 2004
Table 23 Veterans with 100 Percent Disability with PTSD or PTSD and Individual Unemployability Ratings–FY 2004
Table 24 Veterans with Systemic Disabilities by Degree of Disability and State–FY 2004
Table 25 Veterans with Cardiovascular Disabilities by Degree of Disability and State–FY 2004
Table 26 Veterans with Genitourinary Disabilities by Degree of Disability and State–FY 2004
Table 27 Veterans with Mental Disabilities by Degree of Disability and State–FY 2004
Table 28 Veterans with Hemic/Lymphatic Disabilities by Degree of Disability and State–FY 2004
Table 29 Veterans with Respiratory Disabilities by Degree of Disability and State–FY 2004
Table 30 Veterans Receiving Compensation for PTSD–FY 2004 Table 31 STAR Error Rates for FYs 2003–2004
VA Office of Inspector General 88
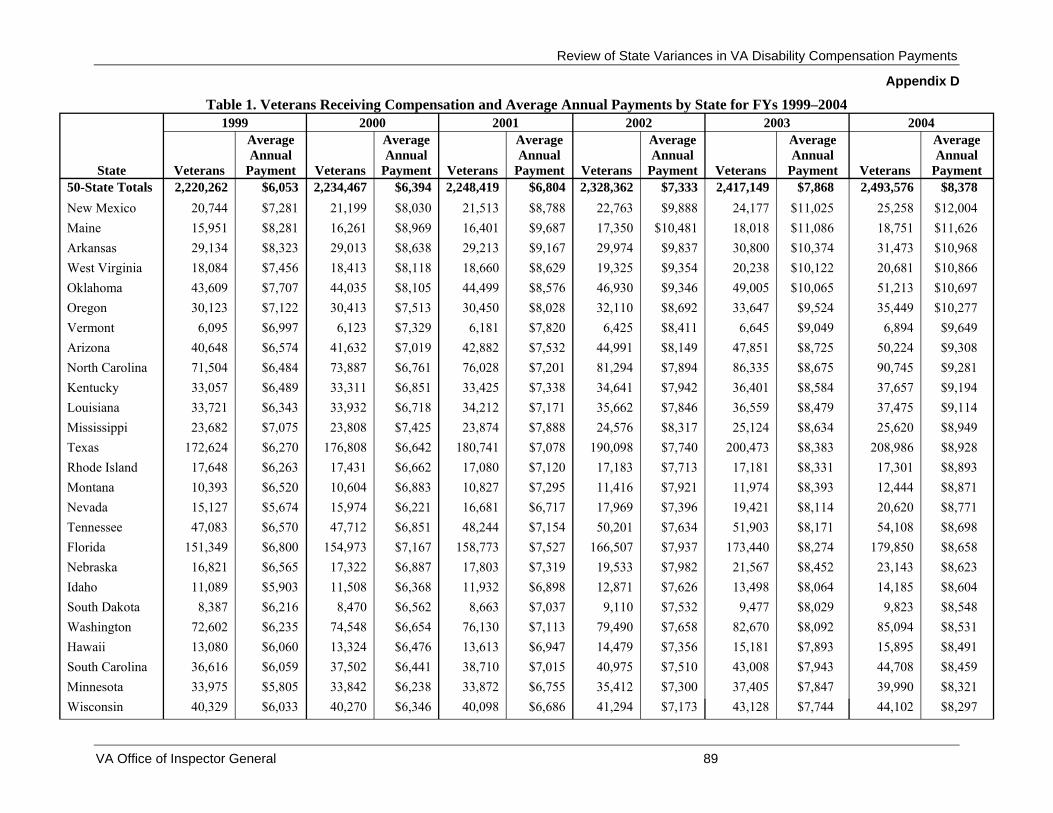
Review of State Variances in VA Disability Compensation Payments
Appendix D
Table 1. Veterans Receiving Compensation and Average Annual Payments by State for FYs 1999–2004 1999 2000 2001 2002 2003 2004
Average Average Average Average Average Average Annual Annual Annual Annual Annual Annual
State Veterans Payment Veterans Payment Veterans Payment Veterans Payment Veterans Payment Veterans Payment 50-State Totals 2,220,262 $6,053 2,234,467 $6,394 2,248,419 $6,804 2,328,362 $7,333 2,417,149 $7,868 2,493,576 $8,378 New Mexico 20,744 $7,281 21,199 $8,030 21,513 $8,788 22,763 $9,888 24,177 $11,025 25,258 $12,004 Maine 15,951 $8,281 16,261 $8,969 16,401 $9,687 17,350 $10,481 18,018 $11,086 18,751 $11,626 Arkansas 29,134 $8,323 29,013 $8,638 29,213 $9,167 29,974 $9,837 30,800 $10,374 31,473 $10,968 West Virginia 18,084 $7,456 18,413 $8,118 18,660 $8,629 19,325 $9,354 20,238 $10,122 20,681 $10,866 Oklahoma 43,609 $7,707 44,035 $8,105 44,499 $8,576 46,930 $9,346 49,005 $10,065 51,213 $10,697 Oregon 30,123 $7,122 30,413 $7,513 30,450 $8,028 32,110 $8,692 33,647 $9,524 35,449 $10,277 Vermont 6,095 $6,997 6,123 $7,329 6,181 $7,820 6,425 $8,411 6,645 $9,049 6,894 $9,649 Arizona 40,648 $6,574 41,632 $7,019 42,882 $7,532 44,991 $8,149 47,851 $8,725 50,224 $9,308 North Carolina 71,504 $6,484 73,887 $6,761 76,028 $7,201 81,294 $7,894 86,335 $8,675 90,745 $9,281 Kentucky 33,057 $6,489 33,311 $6,851 33,425 $7,338 34,641 $7,942 36,401 $8,584 37,657 $9,194 Louisiana 33,721 $6,343 33,932 $6,718 34,212 $7,171 35,662 $7,846 36,559 $8,479 37,475 $9,114 Mississippi 23,682 $7,075 23,808 $7,425 23,874 $7,888 24,576 $8,317 25,124 $8,634 25,620 $8,949 Texas 172,624 $6,270 176,808 $6,642 180,741 $7,078 190,098 $7,740 200,473 $8,383 208,986 $8,928 Rhode Island 17,648 $6,263 17,431 $6,662 17,080 $7,120 17,183 $7,713 17,181 $8,331 17,301 $8,893 Montana 10,393 $6,520 10,604 $6,883 10,827 $7,295 11,416 $7,921 11,974 $8,393 12,444 $8,871 Nevada 15,127 $5,674 15,974 $6,221 16,681 $6,717 17,969 $7,396 19,421 $8,114 20,620 $8,771 Tennessee 47,083 $6,570 47,712 $6,851 48,244 $7,154 50,201 $7,634 51,903 $8,171 54,108 $8,698 Florida 151,349 $6,800 154,973 $7,167 158,773 $7,527 166,507 $7,937 173,440 $8,274 179,850 $8,658 Nebraska 16,821 $6,565 17,322 $6,887 17,803 $7,319 19,533 $7,982 21,567 $8,452 23,143 $8,623 Idaho 11,089 $5,903 11,508 $6,368 11,932 $6,898 12,871 $7,626 13,498 $8,064 14,185 $8,604 South Dakota 8,387 $6,216 8,470 $6,562 8,663 $7,037 9,110 $7,532 9,477 $8,029 9,823 $8,548 Washington 72,602 $6,235 74,548 $6,654 76,130 $7,113 79,490 $7,658 82,670 $8,092 85,094 $8,531 Hawaii 13,080 $6,060 13,324 $6,476 13,613 $6,947 14,479 $7,356 15,181 $7,893 15,895 $8,491 South Carolina 36,616 $6,059 37,502 $6,441 38,710 $7,015 40,975 $7,510 43,008 $7,943 44,708 $8,459 Minnesota 33,975 $5,805 33,842 $6,238 33,872 $6,755 35,412 $7,300 37,405 $7,847 39,990 $8,321 Wisconsin 40,329 $6,033 40,270 $6,346 40,098 $6,686 41,294 $7,173 43,128 $7,744 44,102 $8,297
VA Office of Inspector General 89
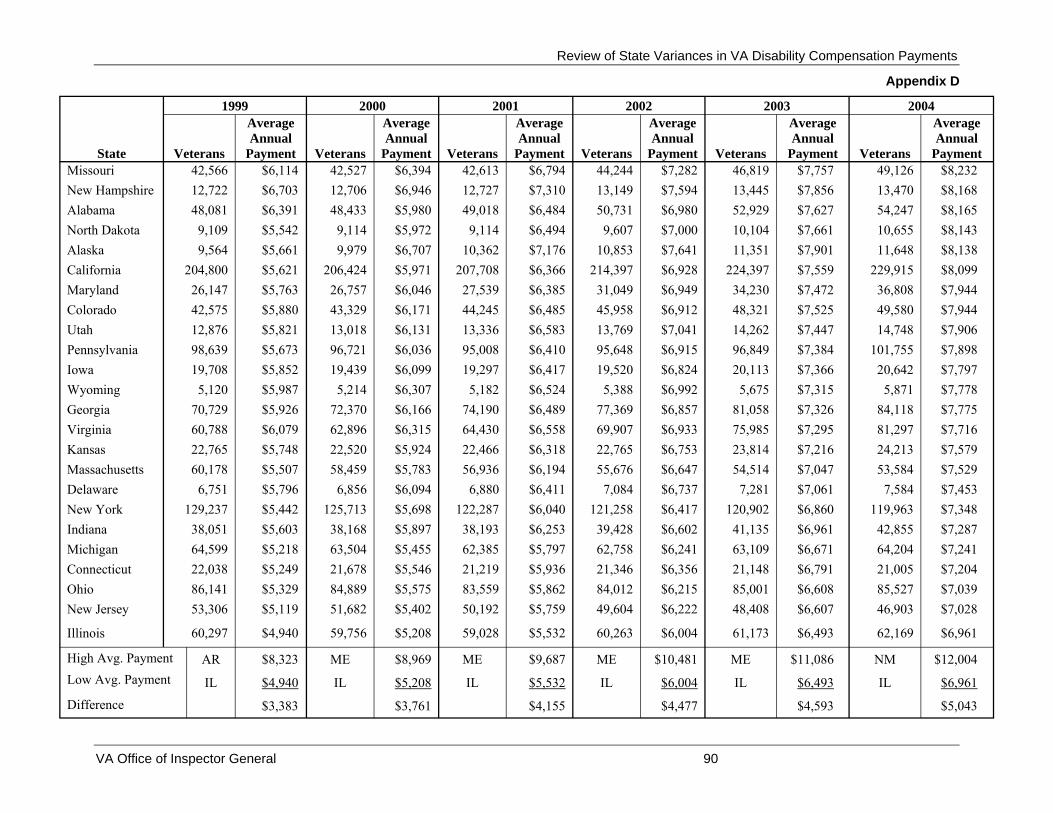
Review of State Variances in VA Disability Compensation Payments
Appendix D
1999 2000 2001 2002 2003 2004 Average Average Average Average Average Average Annual Annual Annual Annual Annual Annual
State Veterans Payment Veterans Payment Veterans Payment Veterans Payment Veterans Payment Veterans Payment Missouri 42,566 $6,114 42,527 $6,394 42,613 $6,794 44,244 $7,282 46,819 $7,757 49,126 $8,232 New Hampshire 12,722 $6,703 12,706 $6,946 12,727 $7,310 13,149 $7,594 13,445 $7,856 13,470 $8,168 Alabama 48,081 $6,391 48,433 $5,980 49,018 $6,484 50,731 $6,980 52,929 $7,627 54,247 $8,165 North Dakota 9,109 $5,542 9,114 $5,972 9,114 $6,494 9,607 $7,000 10,104 $7,661 10,655 $8,143 Alaska 9,564 $5,661 9,979 $6,707 10,362 $7,176 10,853 $7,641 11,351 $7,901 11,648 $8,138 California 204,800 $5,621 206,424 $5,971 207,708 $6,366 214,397 $6,928 224,397 $7,559 229,915 $8,099 Maryland 26,147 $5,763 26,757 $6,046 27,539 $6,385 31,049 $6,949 34,230 $7,472 36,808 $7,944 Colorado 42,575 $5,880 43,329 $6,171 44,245 $6,485 45,958 $6,912 48,321 $7,525 49,580 $7,944 Utah 12,876 $5,821 13,018 $6,131 13,336 $6,583 13,769 $7,041 14,262 $7,447 14,748 $7,906 Pennsylvania 98,639 $5,673 96,721 $6,036 95,008 $6,410 95,648 $6,915 96,849 $7,384 101,755 $7,898 Iowa 19,708 $5,852 19,439 $6,099 19,297 $6,417 19,520 $6,824 20,113 $7,366 20,642 $7,797 Wyoming 5,120 $5,987 5,214 $6,307 5,182 $6,524 5,388 $6,992 5,675 $7,315 5,871 $7,778 Georgia 70,729 $5,926 72,370 $6,166 74,190 $6,489 77,369 $6,857 81,058 $7,326 84,118 $7,775 Virginia 60,788 $6,079 62,896 $6,315 64,430 $6,558 69,907 $6,933 75,985 $7,295 81,297 $7,716 Kansas 22,765 $5,748 22,520 $5,924 22,466 $6,318 22,765 $6,753 23,814 $7,216 24,213 $7,579 Massachusetts 60,178 $5,507 58,459 $5,783 56,936 $6,194 55,676 $6,647 54,514 $7,047 53,584 $7,529 Delaware 6,751 $5,796 6,856 $6,094 6,880 $6,411 7,084 $6,737 7,281 $7,061 7,584 $7,453 New York 129,237 $5,442 125,713 $5,698 122,287 $6,040 121,258 $6,417 120,902 $6,860 119,963 $7,348 Indiana 38,051 $5,603 38,168 $5,897 38,193 $6,253 39,428 $6,602 41,135 $6,961 42,855 $7,287 Michigan 64,599 $5,218 63,504 $5,455 62,385 $5,797 62,758 $6,241 63,109 $6,671 64,204 $7,241 Connecticut 22,038 $5,249 21,678 $5,546 21,219 $5,936 21,346 $6,356 21,148 $6,791 21,005 $7,204 Ohio 86,141 $5,329 84,889 $5,575 83,559 $5,862 84,012 $6,215 85,001 $6,608 85,527 $7,039 New Jersey 53,306 $5,119 51,682 $5,402 50,192 $5,759 49,604 $6,222 48,408 $6,607 46,903 $7,028
Illinois 60,297 $4,940 59,756 $5,208 59,028 $5,532 60,263 $6,004 61,173 $6,493 62,169 $6,961
High Avg. Payment Low Avg. Payment
Difference
AR
IL
$8,323
$4,940
$3,383
ME
IL
$8,969
$5,208
$3,761
ME
IL
$9,687
$5,532
$4,155
ME
IL
$10,481
$6,004
$4,477
ME
IL
$11,086
$6,493
$4,593
NM
IL
$12,004
$6,961
$5,043
VA Office of Inspector General 90

Review of State Variances in VA Disability Compensation Payments
Appendix D
Table 2. Average Annual Payments for Veterans Who Began Receiving Compensation in FYs 1999–2005 1999 2000 2001 2002 2003 2004 2005
Average Average Average Average Average Average Average Annual Annual Annual Annual Annual Annual Annual
States Veterans Payment Veterans Payment Veterans Payment Veterans Payment Veterans Payment Veterans Payment Veterans Payment 50-State Totals 89,623 $4,971 84,576 $5,404 83,018 $5,930 149,610 $6,430 159,441 $6,853 146,547 $6,988 65,642 $6,431 New Mexico 1,012 $6,575 929 $7,450 822 $10,015 1,751 $9,877 1,979 $11,236 1,533 $11,206 591 $8,812 Maine 556 $6,407 715 $7,806 586 $8,830 1,443 $8,433 1,141 $8,455 1,240 $7,320 504 $5,721 Arkansas 1,127 $6,153 861 $6,217 1,086 $6,861 1,639 $7,877 1,699 $8,131 1,571 $8,436 718 $8,284 West Virginia 913 $6,735 919 $6,862 838 $6,710 1,511 $6,848 1,578 $7,602 1,175 $7,615 534 $6,597 Oklahoma 1,616 $5,373 1,752 $6,159 1,820 $6,633 3,728 $7,581 3,724 $8,327 3,980 $7,835 1,846 $6,428 Oregon 1,252 $5,768 1,022 $6,020 719 $7,784 2,292 $7,665 2,317 $8,512 2,547 $8,121 814 $8,141 Vermont 213 $4,704 181 $6,249 184 $7,856 355 $7,136 354 $7,518 412 $7,732 154 $6,967 Arizona 1,684 $4,818 1,915 $5,518 2,096 $6,420 2,994 $7,133 3,543 $7,500 3,217 $7,530 1,302 $7,059 North Carolina 3,783 $5,462 4,291 $5,384 4,091 $5,809 7,324 $6,848 7,401 $7,653 6,487 $7,240 3,802 $5,980 Kentucky 1,369 $4,760 1,314 $4,955 1,165 $6,294 2,351 $6,720 2,891 $6,975 2,512 $7,416 1,835 $5,780 Louisiana 1,527 $4,893 1,426 $5,619 1,429 $5,859 2,623 $6,725 2,243 $7,300 2,010 $7,937 919 $7,397 Mississippi 813 $4,885 822 $5,457 763 $5,689 1,455 $5,607 1,286 $5,687 1,263 $6,196 598 $5,915 Texas 9,813 $5,027 8,824 $5,272 8,858 $5,950 14,544 $6,818 15,162 $7,232 13,737 $7,302 6,374 $6,707 Rhode Island 339 $5,148 418 $5,684 294 $7,681 768 $7,389 664 $8,090 780 $7,577 262 $6,458 Montana 480 $4,646 452 $4,921 464 $6,228 804 $6,186 873 $6,309 753 $6,483 418 $5,617 Nevada 725 $4,573 934 $5,315 594 $6,553 1,237 $6,374 1,680 $7,510 1,357 $7,625 518 $7,466 Tennessee 2,041 $4,980 1,911 $4,789 1,839 $5,083 3,354 $5,795 3,271 $6,754 3,523 $6,810 1,680 $6,084 Florida 6,366 $4,767 7,458 $5,145 7,048 $5,144 10,965 $5,958 10,097 $5,897 9,760 $6,292 3,834 $5,903 Nebraska 1,017 $5,478 1,055 $5,155 1,146 $5,677 2,315 $6,121 2,675 $6,181 2,371 $5,302 850 $5,287 Idaho 607 $4,629 591 $5,169 587 $6,442 1,159 $6,629 854 $6,705 831 $6,343 417 $5,341 South Dakota 435 $6,512 300 $6,284 417 $6,826 594 $6,321 563 $6,434 541 $7,678 281 $7,357 Washington 4,194 $5,534 3,874 $6,152 3,497 $6,726 5,388 $6,822 5,466 $7,067 4,722 $7,472 1,922 $7,104 Hawaii 665 $4,856 569 $5,756 635 $5,323 1,231 $5,457 1,136 $6,493 1,209 $6,979 500 $6,506 South Carolina 1,952 $4,423 1,790 $5,422 1,941 $6,346 3,007 $5,968 2,976 $5,928 2,790 $6,918 1,287 $6,936 Minnesota 1,060 $5,425 1,050 $6,174 1,170 $7,195 2,695 $6,557 3,094 $6,399 3,721 $5,921 1,833 $5,064 Wisconsin 1,093 $5,402 1,028 $6,007 927 $6,560 2,300 $6,638 2,797 $7,367 2,523 $7,780 1,060 $6,743 Missouri 1,740 $4,705 1,203 $4,808 1,468 $4,855 2,939 $5,781 3,947 $5,679 3,729 $6,085 1,573 $5,260
VA Office of Inspector General 91

Review of State Variances in VA Disability Compensation Payments
Appendix D
1999 2000 2001 2002 2003 2004 2005
Average Average Average Average Average Average Average Annual Annual Annual Annual Annual Annual Annual
States Veterans Payment Veterans Payment Veterans Payment Veterans Payment Veterans Payment Veterans Payment Veterans Payment New Hampshire 497 $4,649 361 $5,317 335 $5,520 692 $5,181 607 $6,055 438 $5,931 220 $4,816 Alabama 1,883 $4,340 1,649 $4,738 1,928 $5,690 3,102 $5,990 3,661 $6,510 2,762 $6,920 1,485 $6,035 North Dakota 290 $4,617 335 $6,051 337 $5,816 821 $6,562 861 $7,158 946 $6,181 441 $5,142 Alaska 692 $5,099 657 $5,687 570 $6,815 739 $6,475 825 $5,988 609 $5,803 269 $5,575 California 9,745 $5,134 8,741 $5,495 8,165 $6,272 14,882 $6,723 17,528 $7,248 14,005 $7,313 6,357 $6,949 Maryland 1,413 $5,217 1,333 $5,853 1,394 $5,956 2,750 $6,324 2,871 $6,395 2,662 $6,698 968 $6,663 Colorado 1,797 $4,778 1,845 $5,462 1,978 $5,777 3,081 $6,282 3,703 $7,440 2,608 $7,011 1,517 $5,866 Utah 562 $4,892 452 $5,379 656 $5,957 715 $6,019 826 $6,374 860 $6,779 517 $5,557 Pennsylvania 2,533 $5,203 2,183 $5,914 2,226 $5,842 4,318 $6,380 4,330 $6,800 4,708 $6,865 2,152 $7,180 Iowa 507 $5,238 410 $5,115 478 $5,371 888 $5,835 1,252 $6,509 1,170 $6,677 458 $6,485 Wyoming 230 $4,313 270 $5,245 191 $4,563 376 $6,240 444 $5,584 381 $6,493 167 $5,638 Georgia 3,610 $4,237 3,261 $4,601 3,455 $4,896 4,859 $5,407 5,201 $6,079 4,851 $6,302 2,168 $6,185 Virginia 3,823 $4,628 3,686 $5,065 2,930 $5,453 6,046 $5,995 7,095 $6,188 6,457 $7,054 2,653 $6,871 Kansas 802 $3,820 536 $4,455 703 $6,003 1,187 $5,838 1,682 $6,256 1,166 $6,424 518 $5,705 Massachusetts 962 $5,195 908 $5,282 1,082 $5,954 1,558 $6,284 1,480 $6,975 1,861 $6,487 576 $5,943 Delaware 304 $5,035 304 $4,543 202 $6,311 372 $5,805 374 $5,487 440 $6,091 193 $5,666 New York 2,966 $4,321 2,366 $4,915 2,289 $5,411 4,843 $5,674 5,265 $6,099 4,649 $6,775 2,168 $6,236 Indiana 1,418 $4,069 1,203 $4,665 1,159 $5,131 2,467 $4,980 2,938 $5,315 2,998 $5,152 1,141 $4,711 Michigan 1,460 $4,755 1,249 $5,479 1,302 $5,852 2,640 $6,482 2,695 $7,013 3,288 $7,326 1,311 $7,053 Connecticut 516 $5,732 457 $5,543 406 $6,954 1,008 $5,860 746 $6,926 698 $6,707 373 $6,870 Ohio 1,934 $4,531 1,794 $5,077 1,843 $4,983 3,563 $5,445 4,221 $5,857 3,599 $6,616 1,351 $6,156 New Jersey 962 $4,662 865 $5,594 874 $5,729 1,791 $6,479 1,879 $6,052 1,604 $6,479 684 $6,252 Illinois 2,325 $4,355 2,107 $4,645 2,031 $5,088 4,146 $5,950 3,546 $6,799 3,493 $6,970 1,529 $7,404
VA Office of Inspector General 92

Review of State Variances in VA Disability Compensation Payments
Appendix D
Table 3. Historical Ranking of Annual Average Payments for All Veterans in FYs 1985–2004 and for Veterans Who Began Receiving Compensation in FYs 1999–2005 by State
Ranking for New Compensation
State
Ranking for All Veterans Recipients
1985
1986
1987
1988
1989
1990
1991
1992
1993
1994
1995
1996
1997
1998
1999
2000
2001
2002
2003
2004
1999
2000
2001
2002
2003
2004
2005
New Mexico 6 6 6 6 7 7 7 7 8 8 8 9 9 7 5 5 3 2 2 1 2 2 1 1 1 1 1 Maine 9 9 7 7 6 4 4 2 2 2 2 2 2 2 2 1 1 1 1 2 4 1 2 2 3 16 37 Arkansas 1 1 1 1 1 1 1 1 1 1 1 1 1 1 1 2 2 3 3 3 5 6 8 3 5 2 2 West Virginia 13 12 12 12 10 10 10 10 7 7 7 8 8 5 4 3 4 4 4 4 1 3 12 9 8 10 20 Oklahoma 4 4 4 4 3 3 2 3 3 3 3 3 3 3 3 4 5 5 5 5 13 8 13 5 4 5 24 Oregon 15 16 16 16 13 14 15 14 12 12 9 6 6 6 6 6 6 6 6 6 6 11 4 4 2 3 3 Vermont 3 3 2 2 2 2 3 4 5 5 5 5 5 8 8 8 8 7 7 7 34 5 3 7 9 7 12 Arizona 7 7 9 9 9 8 8 8 10 11 10 11 11 11 11 10 9 9 8 8 28 21 17 8 11 12 10 North Carolina 11 10 10 10 11 11 11 11 9 9 11 12 12 16 16 16 15 14 9 9 10 27 32 10 7 19 31 Kentucky 17 15 15 15 15 13 13 12 13 16 15 14 15 17 15 15 11 11 11 10 31 40 20 15 20 14 36 Louisiana 26 26 25 24 24 22 25 21 23 24 25 26 24 21 18 17 17 15 12 11 24 18 28 13 14 4 6 Mississippi 5 5 5 5 5 5 5 5 4 4 4 4 4 4 7 7 7 8 10 12 26 25 36 45 46 42 33 Texas 12 13 13 13 14 15 14 15 17 17 18 20 20 19 19 21 21 16 15 13 22 32 27 12 16 18 18 Rhode Island 23 22 22 23 21 20 22 23 24 23 20 19 19 18 20 19 19 17 16 14 18 17 5 6 6 11 23 Montana 21 19 20 19 19 19 18 19 19 19 19 18 17 13 14 13 14 13 14 15 37 41 22 30 34 36 41 Nevada 40 37 40 41 43 42 39 42 46 46 47 47 45 42 38 31 28 25 19 16 41 30 15 24 10 9 4 Tennessee 16 17 17 17 17 17 17 17 15 15 17 16 14 12 12 14 18 20 18 17 23 44 46 42 25 27 29 Florida 2 2 3 3 4 6 6 6 6 6 6 7 7 9 9 9 10 12 17 18 30 36 43 36 44 41 34 Nebraska 20 20 19 20 20 21 24 22 21 18 16 17 16 14 13 12 12 10 13 19 9 35 37 31 37 49 45 Idaho 24 21 21 21 22 23 21 26 30 28 32 35 34 34 30 26 25 21 21 20 38 34 16 17 26 39 44 South Dakota 18 18 18 18 18 18 19 20 20 21 23 22 26 23 22 22 22 23 22 21 3 4 9 26 30 8 7 Washington 22 24 24 25 26 28 32 33 34 34 34 31 23 22 21 20 20 18 20 22 8 9 11 11 18 13 9 Hawaii 34 28 26 26 25 25 28 24 22 25 24 24 21 27 25 23 24 26 25 23 27 15 42 46 29 22 21 South Carolina 31 32 31 29 30 29 30 27 27 27 27 27 27 24 26 24 23 24 23 24 43 26 18 35 43 25 14 Minnesota 46 46 46 46 47 47 47 47 47 47 46 41 38 37 34 30 27 27 27 25 11 7 6 19 31 47 48 Wisconsin 30 30 29 28 29 30 31 31 32 31 31 30 31 28 27 27 29 29 29 26 12 12 14 16 13 6 17 Missouri 27 27 28 27 27 26 29 30 25 22 22 21 22 25 23 25 26 28 28 27 33 43 49 43 47 45 46 New Hampshire 14 14 14 14 16 16 16 16 14 13 12 10 10 10 10 11 13 22 26 28 36 29 38 49 40 46 49
VA Office of Inspector General 93

Review of State Variances in VA Disability Compensation Payments
Appendix D
Ranking for New Compensation
State
Ranking for All Veterans Recipients
1985
1986
1987
1988
1989
1990
1991
1992
1993
1994
1995
1996
1997
1998
1999
2000
2001
2002
2003
2004
1999
2000
2001
2002
2003
2004
2005
Alabama 28 29 30 31 32 31 33 35 36 37 39 39 40 38 40 39 36 33 31 29 45 45 35 34 27 24 30 North Dakota 44 44 44 43 40 38 40 38 35 36 36 37 37 39 43 40 33 31 30 30 40 10 31 18 17 43 47 Alaska 49 49 49 47 37 35 20 18 16 10 13 13 13 15 17 18 16 19 24 31 20 16 10 22 42 48 42 California 36 38 37 37 39 41 41 43 44 44 44 43 42 43 41 41 41 36 32 32 19 22 21 14 15 17 13 Maryland 33 34 33 33 34 34 34 32 31 33 33 33 33 36 36 37 40 34 34 33 15 14 25 25 32 31 19 Colorado 25 23 23 22 23 24 23 25 29 29 30 29 30 30 31 32 35 38 33 34 29 24 33 28 12 21 35 Utah 38 36 35 32 28 27 27 29 26 26 28 32 32 31 33 34 30 30 35 35 25 28 24 32 33 28 43 Pennsylvania 42 42 42 44 46 45 43 41 40 40 40 40 41 41 39 38 39 37 36 36 16 13 30 23 23 26 8 Iowa 29 31 32 34 35 36 36 36 37 35 35 36 36 35 32 35 37 40 37 37 14 37 41 40 28 32 22 Wyoming 19 25 27 30 31 33 26 28 28 30 29 25 29 29 28 29 32 32 39 38 47 33 50 29 48 34 40 Georgia 10 11 11 11 12 12 12 13 18 20 21 23 25 26 29 33 34 39 38 39 48 48 48 48 39 40 27 Virginia 8 8 8 8 8 9 9 9 11 14 14 15 18 20 24 28 31 35 40 40 39 39 39 33 36 20 15 Kansas 35 33 34 35 33 32 35 34 33 32 26 28 28 32 37 42 42 41 41 41 50 50 23 39 35 38 38 Massachusetts 37 39 38 38 38 39 38 40 41 41 41 44 44 44 44 44 44 43 43 42 17 31 26 27 21 35 32 Delaware 45 45 45 45 41 40 42 39 39 39 37 34 35 33 35 36 38 42 42 43 21 49 19 41 49 44 39 New York 41 41 41 40 45 46 45 45 43 43 42 42 43 45 45 45 45 45 45 44 46 42 40 44 38 29 26 Indiana 32 35 36 36 36 37 37 37 38 38 38 38 39 40 42 43 43 44 44 45 49 46 44 50 50 50 50 Michigan 39 40 39 39 42 43 44 44 42 42 43 46 47 47 48 48 48 47 47 46 32 23 29 20 19 15 11 Connecticut 47 47 47 48 48 48 48 48 48 48 48 48 48 48 47 47 46 46 46 47 7 20 7 38 22 30 16 Ohio 43 43 43 42 44 44 46 46 45 45 45 45 46 46 46 46 47 49 48 48 42 38 47 47 45 33 28 New Jersey 48 48 48 49 49 49 49 49 49 49 49 49 49 49 49 49 49 48 49 49 35 19 34 21 41 37 25 Illinois 50 50 50 50 50 50 50 50 50 50 50 50 50 50 50 50 50 50 50 50 44 47 45 37 24 23 5
VA Office of Inspector General 94

Review of State Variances in VA Disability Compensation Payments
Appendix D
Table 4. Percentage of Veterans Receiving Compensation by State–FY 2004
State
Average Annual
Payment Total State Veterans
Veterans Receiving
Compensation
Percent of Total State Veterans
50-State Totals New Mexico Maine Arkansas West Virginia Oklahoma Oregon VermontArizona North Carolina KentuckyLouisiana MississippiTexas Rhode Island Montana Nevada Tennessee Florida Nebraska Idaho South Dakota WashingtonHawaiiSouth Carolina MinnesotaWisconsin MissouriNew Hampshire Alabama North Dakota Alaska California Maryland ColoradoUtah PennsylvaniaIowa Wyoming Georgia VirginiaKansas MassachusettsDelaware New York Indiana
$8,378 $12,004 $11,626 $10,968 $10,866 $10,697 $10,277
$9,649 $9,308 $9,281
$9,194 $9,114
$8,949 $8,928 $8,893 $8,871 $8,771 $8,698 $8,658 $8,623 $8,604 $8,548
$8,531 $8,491
$8,459 $8,321
$8,297 $8,232
$8,168 $8,165 $8,143 $8,138 $8,099 $7,944
$7,944 $7,906
$7,898 $7,797 $7,778 $7,775
$7,716 $7,579
$7,529 $7,453 $7,348 $7,287
24,485,952 180,172 143,726 268,353 188,101 355,312 366,780
57,802 555,223 767,051 359,845 366,957 240,109
1,681,748 91,161
102,605 243,716 540,778
1,788,496 159,487 133,183
73,400 632,929 107,310 413,551 426,591 474,594 554,531 131,074 426,322 55,374 67,299
2,310,968 486,298 427,956 151,129
1,145,919 265,960 54,941
760,323 750,950 246,359 490,882 80,751
1,171,900 550,871
2,493,576 25,258 18,751 31,473 20,681 51,213 35,449 6,894
50,224 90,745 37,657 37,475 25,620
208,986 17,301 12,444 20,620 54,108
179,850 23,143 14,185
9,823 85,094 15,895 44,708 39,990 44,102 49,126 13,470 54,247 10,655 11,648
229,915 36,808 49,580 14,748
101,755 20,642 5,871
84,118 81,297 24,213 53,584 7,584
119,963 42,855
10.2% 14.0% 13.0% 11.7% 11.0% 14.4%
9.7% 11.9%
9.0% 11.8% 10.5% 10.2% 10.7% 12.4% 19.0% 12.1%
8.5% 10.0% 10.1% 14.5% 10.7% 13.4% 13.4% 14.8% 10.8%
9.4% 9.3% 8.9%
10.3% 12.7% 19.2% 17.3% 9.9% 7.6%
11.6% 9.8% 8.9% 7.8%
10.7% 11.1% 10.8%
9.8% 10.9% 9.4%
10.2% 7.8%
VA Office of Inspector General 95

Review of State Variances in VA Disability Compensation Payments
Appendix D
Average Veterans Percent of Annual Total State Receiving Total State
State Payment Veterans Compensation Veterans
Michigan $7,241 836,950 64,204 7.7% Connecticut $7,204 268,975 21,005 7.8% Ohio $7,039 1,051,683 85,527 8.1% New Jersey $7,028 582,917 46,903 8.0% Illinois $6,961 896,640 62,169 6.9%
VA Office of Inspector General 96

Review of State Variances in VA Disability Compensation Payments
Appendix D
Table 5. Compensation Claims Received for FYs 2002–2004 per State Veteran Population
State State
Veterans
Veterans Receiving
Compensation as of 2004
Percent State Veterans Receiving
Compensation
Total Claims
Received
Total Claims per 1,000 State Veterans
Original Claims
per 1,000 State
Veterans
Reopened Claims
per 1,000 State
Veterans 50-State Totals New Mexico Maine Arkansas West Virginia Oklahoma Oregon VermontArizona North Carolina KentuckyLouisiana MississippiTexas Rhode Island Montana Nevada Tennessee Florida Nebraska Idaho South Dakota WashingtonHawaiiSouth Carolina MinnesotaWisconsin MissouriNew Hampshire Alabama North Dakota Alaska California Maryland ColoradoUtah PennsylvaniaIowa Wyoming* Georgia VirginiaKansas MassachusettsDelaware
24,485,952 180,172 143,726 268,353 188,101 355,312 366,780
57,802 555,223 767,051
359,845 366,957
240,109 1,681,748
91,161 102,605 243,716 540,778
1,788,496 159,487 133,183
73,400 632,929
107,310 413,551
426,591 474,594
554,531 131,074 426,322 55,374 67,299
2,310,968 486,298
427,956 151,129
1,145,919 265,960 54,941
760,323 750,950
246,359 490,882
80,751
2,493,576 25,258 18,751 31,473 20,681 51,213 35,449
6,894 50,224 90,745 37,657 37,475 25,620
208,986 17,301 12,444 20,620 54,108
179,850 23,143 14,185
9,823 85,094 15,895 44,708 39,990 44,102 49,126 13,470 54,247 10,655 11,648
229,915 36,808 49,580 14,748
101,755 20,642 5,871
84,118 81,297 24,213 53,584 7,584
10.2% 14.0% 13.0% 11.7% 11.0% 14.4% 9.7%
11.9% 9.0%
11.8% 10.5% 10.2% 10.7% 12.4% 19.0% 12.1% 8.5%
10.0% 10.1% 14.5% 10.7% 13.4% 13.4% 14.8% 10.8% 9.4% 9.3% 8.9%
10.3% 12.7% 19.2% 17.3% 9.9% 7.6%
11.6% 9.8% 8.9% 7.8%
10.7% 11.1% 10.8%
9.8% 10.9% 9.4%
1,771,738 20,583 14,564 24,433 19,566 45,873 29,153 4,420
40,093 79,374 32,281 35,902 24,254
178,573 8,848 9,795
16,215 46,304
134,299 18,868 12,115
8,200 52,393 12,826 39,871 31,212 28,902 40,536
6,943 41,061 9,558 7,376
154,746 25,736 35,245 10,466 57,908 13,714
57,686 52,291 15,257 22,768 4,711
72.4 114.2 101.3 91.0
104.0 129.1 79.5 76.5 72.2
103.5 89.7 97.8
101.0 106.2 97.1 95.5 66.5 85.6 75.1
118.3 91.0
111.7 82.8
119.5 96.4 73.2 60.9 73.1 53.0 96.3
172.6 109.6 67.0 52.9 73.0 69.3 50.5 51.6
75.9 69.6 61.9 46.4 58.3
21.0 25.8 24.1 20.8 21.0 33.9 21.3 18.0 18.5 34.4 34.1 23.2 23.4 30.7 21.8 25.3 19.0 25.5 20.0 43.7 22.4 26.6 29.4 37.9 25.5 20.4 14.8 23.0 13.2 25.6 51.6 34.5 22.6 17.1 23.4 19.4 13.0 15.4
22.7 26.9 19.4
9.4 16.6
51.4 88.4 77.2 70.2 83.0 95.2 58.2 58.4 53.7 69.1 55.7 74.6 77.6 75.5 75.3 70.2 47.5 60.1 55.1 74.6 68.6 85.1 53.3 81.6 70.9 52.8 46.1 50.1 39.8 70.7
121.0 75.1 44.4 35.8 49.5 49.9 37.5 36.1
53.2 42.8 42.5 37.0 41.7
VA Office of Inspector General 97

Review of State Variances in VA Disability Compensation Payments
Appendix D
Veterans Percent State Total Original Claims
Reopened Claims
State State
Veterans
Receiving Compensation
as of 2004
Veterans Receiving
Compensation
Total Claims
Received
Claims per 1,000 State Veterans
per 1,000 State
Veterans
per 1,000 State
Veterans New York 1,171,900 119,963 10.2% 62,921 53.7 13.9 39.8 Indiana 550,871 42,855 7.8% 30,178 54.8 16.1 38.7 Michigan 836,950 64,204 7.7% 37,126 44.4 12.0 32.4 Connecticut 268,975 21,005 7.8% 10,664 39.6 10.1 29.6 Ohio 1,051,683 85,527 8.1% 47,175 44.9 12.2 32.6 New Jersey 582,917 46,903 8.0% 18,980 32.6 7.6 24.9 Illinois 896,640 62,169 6.9% 39,775 44.4 14.2 30.2
*Note: Claims data is consolidated for Colorado and Wyoming.
VA Office of Inspector General 98
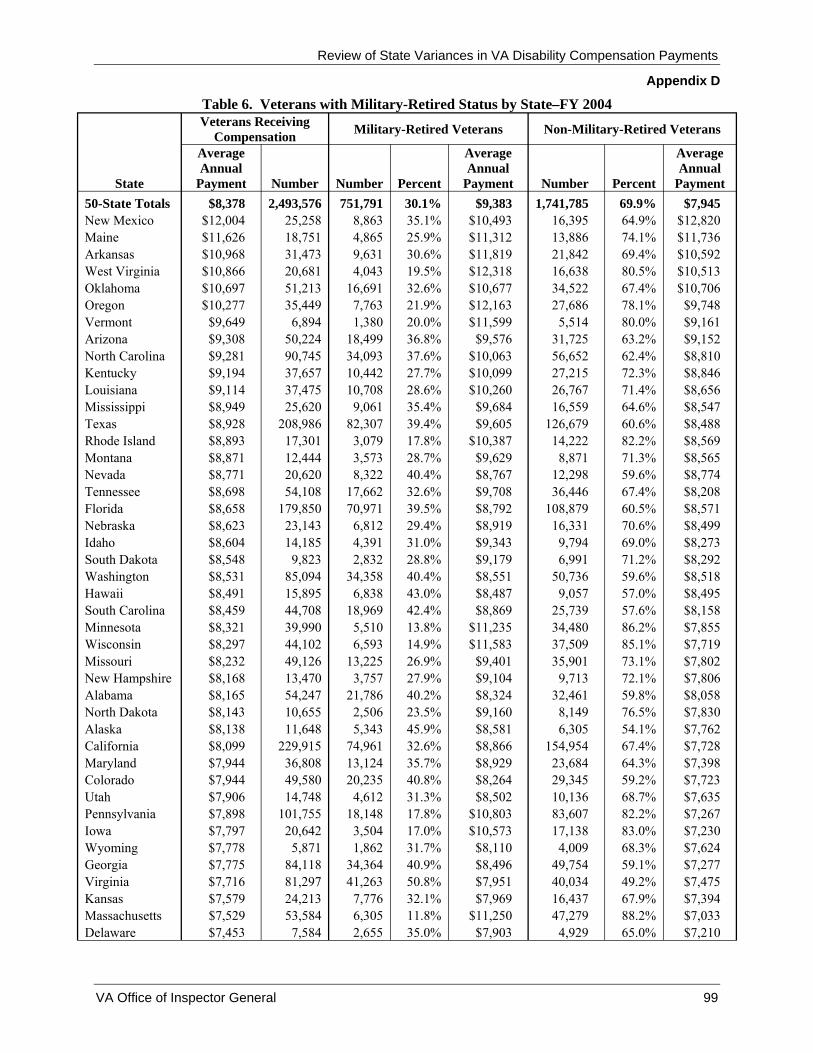
Review of State Variances in VA Disability Compensation Payments
Appendix D
Table 6. Veterans with Military-Retired Status by State–FY 2004 Veterans Receiving
Compensation Military-Retired Veterans Non-Military-Retired Veterans
Average Annual
Average Annual
Average Annual
State Payment Number Number Percent Payment Number Percent Payment 50-State Totals $8,378 2,493,576 751,791 30.1% $9,383 1,741,785 69.9% $7,945 New Mexico $12,004 25,258 8,863 35.1% $10,493 16,395 64.9% $12,820 Maine $11,626 18,751 4,865 25.9% $11,312 13,886 74.1% $11,736 Arkansas $10,968 31,473 9,631 30.6% $11,819 21,842 69.4% $10,592 West Virginia $10,866 20,681 4,043 19.5% $12,318 16,638 80.5% $10,513 Oklahoma $10,697 51,213 16,691 32.6% $10,677 34,522 67.4% $10,706 Oregon $10,277 35,449 7,763 21.9% $12,163 27,686 78.1% $9,748 Vermont $9,649 6,894 1,380 20.0% $11,599 5,514 80.0% $9,161 Arizona $9,308 50,224 18,499 36.8% $9,576 31,725 63.2% $9,152 North Carolina $9,281 90,745 34,093 37.6% $10,063 56,652 62.4% $8,810 Kentucky $9,194 37,657 10,442 27.7% $10,099 27,215 72.3% $8,846 Louisiana $9,114 37,475 10,708 28.6% $10,260 26,767 71.4% $8,656 Mississippi $8,949 25,620 9,061 35.4% $9,684 16,559 64.6% $8,547 Texas $8,928 208,986 82,307 39.4% $9,605 126,679 60.6% $8,488 Rhode Island $8,893 17,301 3,079 17.8% $10,387 14,222 82.2% $8,569 Montana $8,871 12,444 3,573 28.7% $9,629 8,871 71.3% $8,565 Nevada $8,771 20,620 8,322 40.4% $8,767 12,298 59.6% $8,774 Tennessee $8,698 54,108 17,662 32.6% $9,708 36,446 67.4% $8,208 Florida $8,658 179,850 70,971 39.5% $8,792 108,879 60.5% $8,571 Nebraska $8,623 23,143 6,812 29.4% $8,919 16,331 70.6% $8,499 Idaho $8,604 14,185 4,391 31.0% $9,343 9,794 69.0% $8,273 South Dakota $8,548 9,823 2,832 28.8% $9,179 6,991 71.2% $8,292 Washington $8,531 85,094 34,358 40.4% $8,551 50,736 59.6% $8,518 Hawaii $8,491 15,895 6,838 43.0% $8,487 9,057 57.0% $8,495 South Carolina $8,459 44,708 18,969 42.4% $8,869 25,739 57.6% $8,158 Minnesota $8,321 39,990 5,510 13.8% $11,235 34,480 86.2% $7,855 Wisconsin $8,297 44,102 6,593 14.9% $11,583 37,509 85.1% $7,719 Missouri $8,232 49,126 13,225 26.9% $9,401 35,901 73.1% $7,802 New Hampshire $8,168 13,470 3,757 27.9% $9,104 9,713 72.1% $7,806 Alabama $8,165 54,247 21,786 40.2% $8,324 32,461 59.8% $8,058 North Dakota $8,143 10,655 2,506 23.5% $9,160 8,149 76.5% $7,830 Alaska $8,138 11,648 5,343 45.9% $8,581 6,305 54.1% $7,762 California $8,099 229,915 74,961 32.6% $8,866 154,954 67.4% $7,728 Maryland $7,944 36,808 13,124 35.7% $8,929 23,684 64.3% $7,398 Colorado $7,944 49,580 20,235 40.8% $8,264 29,345 59.2% $7,723 Utah $7,906 14,748 4,612 31.3% $8,502 10,136 68.7% $7,635 Pennsylvania $7,898 101,755 18,148 17.8% $10,803 83,607 82.2% $7,267 Iowa $7,797 20,642 3,504 17.0% $10,573 17,138 83.0% $7,230 Wyoming $7,778 5,871 1,862 31.7% $8,110 4,009 68.3% $7,624 Georgia $7,775 84,118 34,364 40.9% $8,496 49,754 59.1% $7,277 Virginia $7,716 81,297 41,263 50.8% $7,951 40,034 49.2% $7,475 Kansas $7,579 24,213 7,776 32.1% $7,969 16,437 67.9% $7,394 Massachusetts $7,529 53,584 6,305 11.8% $11,250 47,279 88.2% $7,033 Delaware $7,453 7,584 2,655 35.0% $7,903 4,929 65.0% $7,210
VA Office of Inspector General 99
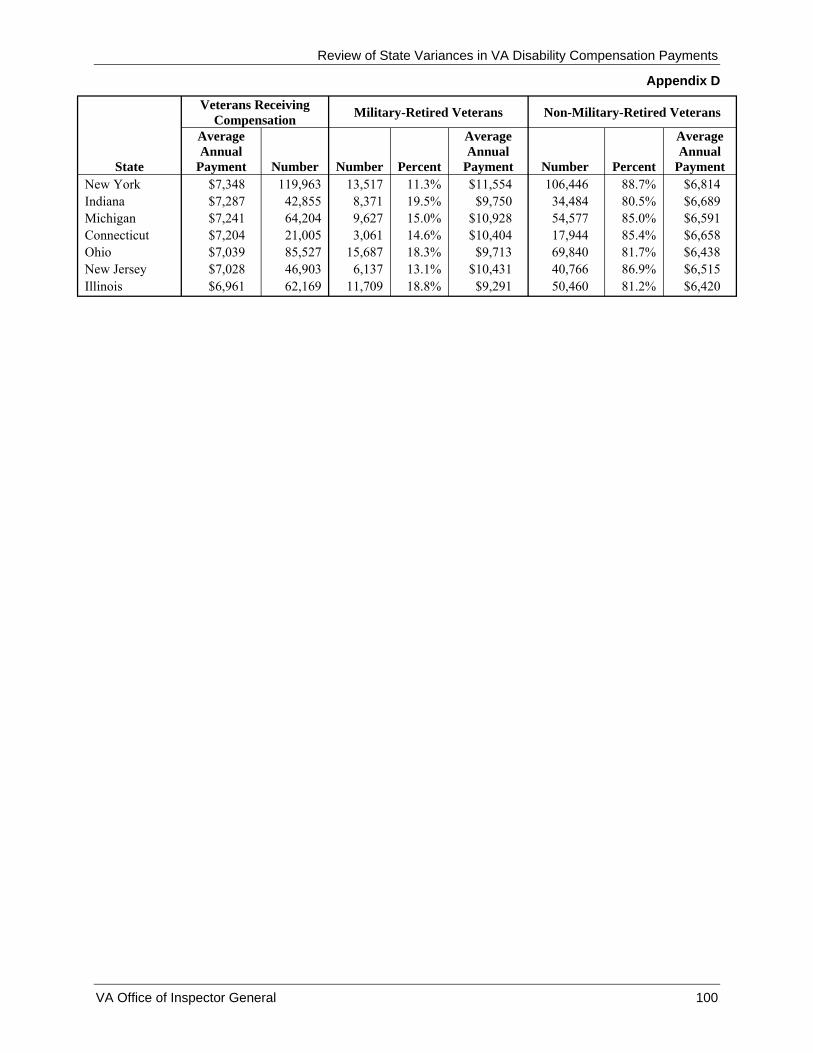
Review of State Variances in VA Disability Compensation Payments
Appendix D
Veterans Receiving Compensation Military-Retired Veterans Non-Military-Retired Veterans
Average Annual
Average Annual
Average Annual
State Payment Number Number Percent Payment Number Percent Payment New York $7,348 119,963 13,517 11.3% $11,554 106,446 88.7% $6,814 Indiana $7,287 42,855 8,371 19.5% $9,750 34,484 80.5% $6,689 Michigan $7,241 64,204 9,627 15.0% $10,928 54,577 85.0% $6,591 Connecticut $7,204 21,005 3,061 14.6% $10,404 17,944 85.4% $6,658 Ohio $7,039 85,527 15,687 18.3% $9,713 69,840 81.7% $6,438 New Jersey $7,028 46,903 6,137 13.1% $10,431 40,766 86.9% $6,515 Illinois $6,961 62,169 11,709 18.8% $9,291 50,460 81.2% $6,420
VA Office of Inspector General 100

Review of State Variances in VA Disability Compensation Payments
Appendix D
Table 7. Veterans Enlisted or Officer Status by State–FY 2004
Average Enlisted Officer Percent Average Percent Average
Annual of Total Annual of Total Annual State Payment Number Veterans Payment Number Veterans Payment
50-State Totals $8,378 1,448,014 58.1% $8,850 163,916 6.6% $7,075 New Mexico $12,004 16,745 66.3% $12,671 2,293 9.1% $7,969 Maine $11,626 12,609 67.2% $11,893 819 4.4% $8,445 Arkansas $10,968 20,049 63.7% $10,929 1,529 4.9% $8,442 West Virginia $10,866 11,727 56.7% $11,018 593 2.9% $8,646 Oklahoma $10,697 32,140 62.8% $10,457 2,740 5.4% $7,686 Oregon $10,277 22,538 63.6% $10,845 1,747 4.9% $8,698 Vermont $9,649 3,330 48.3% $10,219 408 5.9% $8,018 Arizona $9,308 32,578 64.9% $9,304 4,005 8.0% $7,715 North Carolina $9,281 63,947 70.5% $9,383 5,222 5.8% $8,007 Kentucky $9,194 23,235 61.7% $9,421 1,507 4.0% $6,913 Louisiana $9,114 22,986 61.3% $9,355 1,825 4.9% $7,497 Mississippi $8,949 15,798 61.7% $8,831 1,377 5.4% $7,371 Texas $8,928 138,246 66.2% $9,059 19,043 9.1% $7,423 Rhode Island $8,893 7,936 45.9% $10,468 901 5.2% $7,763 Montana $8,871 7,632 61.3% $8,613 831 6.7% $7,689 Nevada $8,771 14,793 71.7% $8,787 1,543 7.5% $7,400 Tennessee $8,698 34,639 64.0% $8,570 2,644 4.9% $6,944 Florida $8,658 113,882 63.3% $8,527 15,979 8.9% $7,468 Nebraska $8,623 12,195 52.7% $8,725 1,748 7.6% $6,095 Idaho $8,604 9,716 68.5% $8,491 914 6.4% $6,998 South Dakota $8,548 5,968 60.8% $8,491 565 5.8% $7,320 Washington $8,531 58,536 68.8% $8,695 7,415 8.7% $7,230 Hawaii $8,491 10,463 65.8% $8,865 1,664 10.5% $6,617 South Carolina $8,459 32,362 72.4% $8,447 3,260 7.3% $7,243 Minnesota $8,321 16,158 40.4% $9,037 1,250 3.1% $7,192 Wisconsin $8,297 20,094 45.6% $8,738 1,312 3.0% $7,657 Missouri $8,232 29,687 60.4% $8,531 2,375 4.8% $6,686 New Hampshire $8,168 7,327 54.4% $8,309 1,091 8.1% $6,804 Alabama $8,165 35,383 65.2% $8,565 4,324 8.0% $5,875 North Dakota $8,143 6,202 58.2% $8,598 334 3.1% $7,357 Alaska $8,138 8,921 76.6% $8,168 1,047 9.0% $7,246 California $8,099 139,066 60.5% $8,642 17,518 7.6% $7,031 Maryland $7,944 22,064 59.9% $8,207 3,890 10.6% $7,381 Colorado $7,944 33,858 68.3% $8,639 6,143 12.4% $6,372 Utah $7,906 8,549 58.0% $8,306 1,249 8.5% $6,944 Pennsylvania $7,898 43,128 42.4% $9,027 3,875 3.8% $7,283 Iowa $7,797 9,813 47.5% $8,350 650 3.1% $6,548 Wyoming $7,778 4,118 70.1% $7,931 406 6.9% $6,734 Georgia $7,775 57,726 68.6% $7,816 6,422 7.6% $6,377 Virginia $7,716 52,256 64.3% $7,871 12,447 15.3% $6,572 Kansas $7,579 13,495 55.7% $7,664 2,016 8.3% $5,934 Massachusetts $7,529 20,651 38.5% $9,833 2,015 3.8% $7,373 Delaware $7,453 4,546 59.9% $7,759 406 5.4% $6,859 New York $7,348 43,680 36.4% $8,910 2,849 2.4% $7,028
VA Office of Inspector General 101
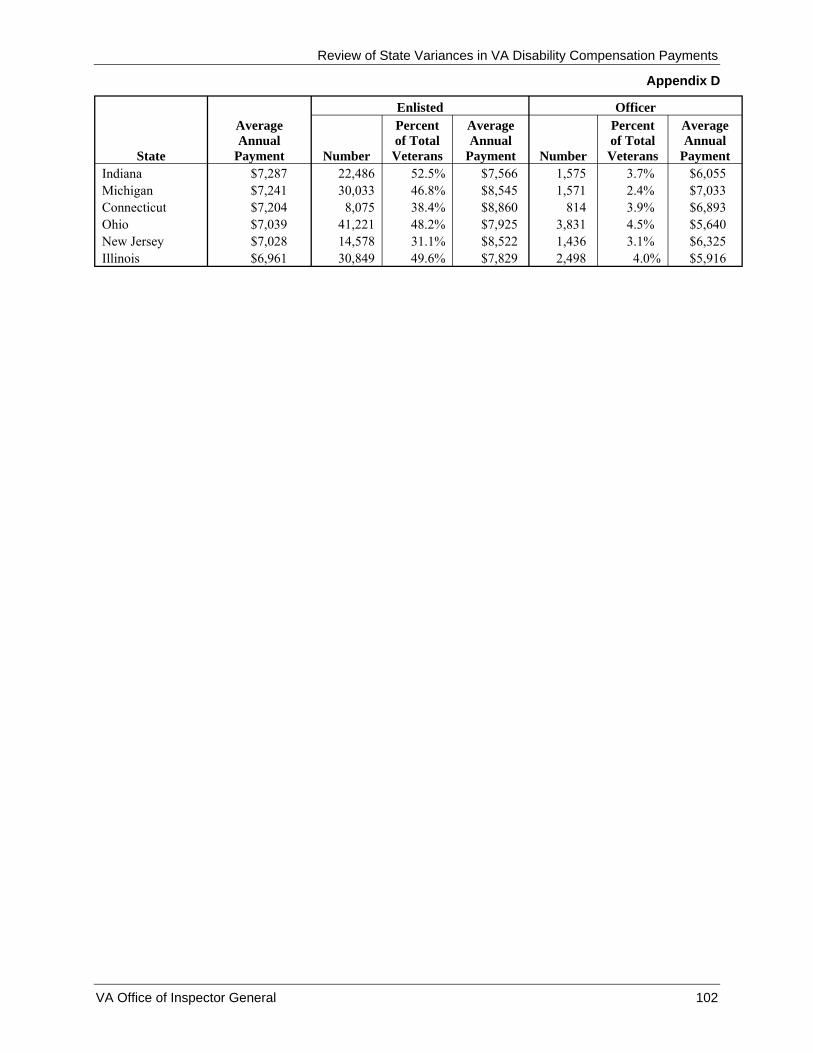
Review of State Variances in VA Disability Compensation Payments
Appendix D
Average Enlisted Officer Percent Average Percent Average
Annual of Total Annual of Total Annual State Payment Number Veterans Payment Number Veterans Payment
Indiana $7,287 22,486 52.5% $7,566 1,575 3.7% $6,055 Michigan $7,241 30,033 46.8% $8,545 1,571 2.4% $7,033 Connecticut $7,204 8,075 38.4% $8,860 814 3.9% $6,893 Ohio $7,039 41,221 48.2% $7,925 3,831 4.5% $5,640 New Jersey $7,028 14,578 31.1% $8,522 1,436 3.1% $6,325 Illinois $6,961 30,849 49.6% $7,829 2,498 4.0% $5,916
VA Office of Inspector General 102

Review of State Variances in VA Disability Compensation Payments
Appendix D
Table 8. Veterans Average Age by State–FY 2004 Average Annual Average
State Payment Age 50-State Totals $8,378 58 New Mexico $12,004 59 Maine $11,626 58 Arkansas $10,968 58 West Virginia $10,866 59 Oklahoma $10,697 57 Oregon $10,277 57 Vermont $9,649 60 Arizona $9,308 57 North Carolina $9,281 55 Kentucky $9,194 58 Louisiana $9,114 58 Mississippi $8,949 59 Texas $8,928 57 Rhode Island $8,893 63 Montana $8,871 57 Nevada $8,771 57 Tennessee $8,698 56 Florida $8,658 59 Nebraska $8,623 59 Idaho $8,604 57 South Dakota $8,548 57 Washington $8,531 55 Hawaii $8,491 58 South Carolina $8,459 56 Minnesota $8,321 61 Wisconsin $8,297 59 Missouri $8,232 59 New Hampshire $8,168 59 Alabama $8,165 58 North Dakota $8,143 59 Alaska $8,138 52 California $8,099 59 Maryland $7,944 55 Colorado $7,944 56 Utah $7,906 58 Pennsylvania $7,898 62 Iowa $7,797 60 Wyoming $7,778 56 Georgia $7,775 55 Virginia $7,716 54 Kansas $7,579 59 Massachusetts $7,529 66 Delaware $7,453 57 New York $7,348 64 Indiana $7,287 58
VA Office of Inspector General 103

Review of State Variances in VA Disability Compensation Payments
Appendix D
Average Annual Average
State Payment Age Michigan $7,241 61 Connecticut $7,204 63 Ohio $7,039 60 New Jersey $7,028 65 Illinois $6,961 59
VA Office of Inspector General 104
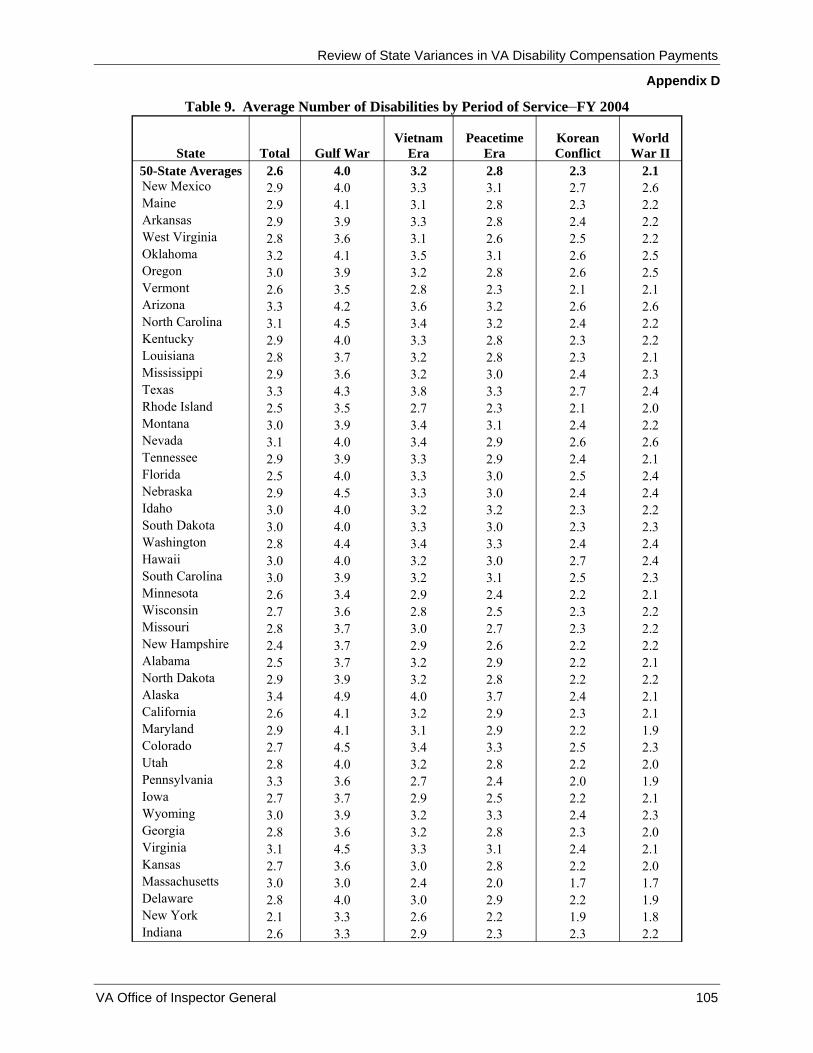
Review of State Variances in VA Disability Compensation Payments
Appendix D
Table 9. Average Number of Disabilities by Period of Service–FY 2004
Vietnam Peacetime Korean World State Total Gulf War Era Era Conflict War II
50-State Averages 2.6 4.0 3.2 2.8 2.3 2.1 New Mexico 2.9 4.0 3.3 3.1 2.7 2.6 Maine 2.9 4.1 3.1 2.8 2.3 2.2 Arkansas 2.9 3.9 3.3 2.8 2.4 2.2 West Virginia 2.8 3.6 3.1 2.6 2.5 2.2 Oklahoma 3.2 4.1 3.5 3.1 2.6 2.5 Oregon 3.0 3.9 3.2 2.8 2.6 2.5 Vermont 2.6 3.5 2.8 2.3 2.1 2.1 Arizona 3.3 4.2 3.6 3.2 2.6 2.6 North Carolina 3.1 4.5 3.4 3.2 2.4 2.2 Kentucky 2.9 4.0 3.3 2.8 2.3 2.2 Louisiana 2.8 3.7 3.2 2.8 2.3 2.1 Mississippi 2.9 3.6 3.2 3.0 2.4 2.3 Texas 3.3 4.3 3.8 3.3 2.7 2.4 Rhode Island 2.5 3.5 2.7 2.3 2.1 2.0 Montana 3.0 3.9 3.4 3.1 2.4 2.2 Nevada 3.1 4.0 3.4 2.9 2.6 2.6 Tennessee 2.9 3.9 3.3 2.9 2.4 2.1 Florida 2.5 4.0 3.3 3.0 2.5 2.4 Nebraska 2.9 4.5 3.3 3.0 2.4 2.4 Idaho 3.0 4.0 3.2 3.2 2.3 2.2 South Dakota 3.0 4.0 3.3 3.0 2.3 2.3 Washington 2.8 4.4 3.4 3.3 2.4 2.4 Hawaii 3.0 4.0 3.2 3.0 2.7 2.4 South Carolina 3.0 3.9 3.2 3.1 2.5 2.3 Minnesota 2.6 3.4 2.9 2.4 2.2 2.1 Wisconsin 2.7 3.6 2.8 2.5 2.3 2.2 Missouri 2.8 3.7 3.0 2.7 2.3 2.2 New Hampshire 2.4 3.7 2.9 2.6 2.2 2.2 Alabama 2.5 3.7 3.2 2.9 2.2 2.1 North Dakota 2.9 3.9 3.2 2.8 2.2 2.2 Alaska 3.4 4.9 4.0 3.7 2.4 2.1 California 2.6 4.1 3.2 2.9 2.3 2.1 Maryland 2.9 4.1 3.1 2.9 2.2 1.9 Colorado 2.7 4.5 3.4 3.3 2.5 2.3 Utah 2.8 4.0 3.2 2.8 2.2 2.0 Pennsylvania 3.3 3.6 2.7 2.4 2.0 1.9 Iowa 2.7 3.7 2.9 2.5 2.2 2.1 Wyoming 3.0 3.9 3.2 3.3 2.4 2.3 Georgia 2.8 3.6 3.2 2.8 2.3 2.0 Virginia 3.1 4.5 3.3 3.1 2.4 2.1 Kansas 2.7 3.6 3.0 2.8 2.2 2.0 Massachusetts 3.0 3.0 2.4 2.0 1.7 1.7 Delaware 2.8 4.0 3.0 2.9 2.2 1.9 New York 2.1 3.3 2.6 2.2 1.9 1.8 Indiana 2.6 3.3 2.9 2.3 2.3 2.2
VA Office of Inspector General 105
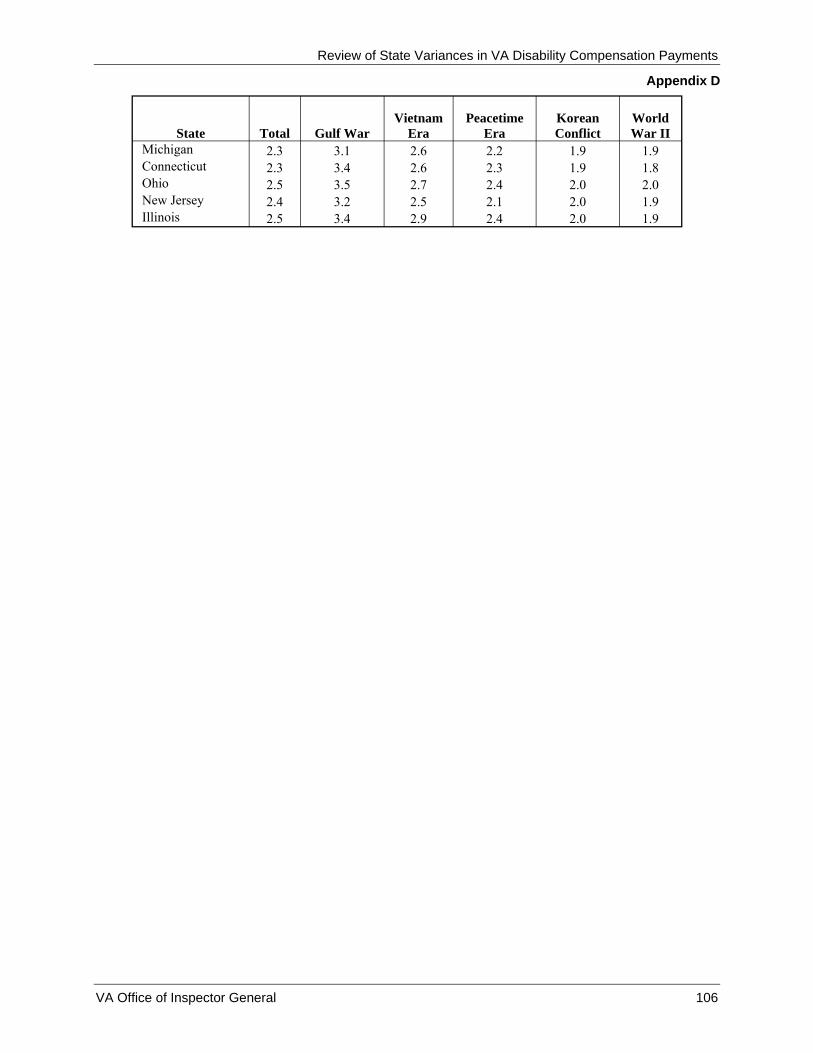
Review of State Variances in VA Disability Compensation Payments
Appendix D
Vietnam Peacetime Korean World State Total Gulf War Era Era Conflict War II
Michigan 2.3 3.1 2.6 2.2 1.9 1.9 Connecticut 2.3 3.4 2.6 2.3 1.9 1.8 Ohio 2.5 3.5 2.7 2.4 2.0 2.0 New Jersey 2.4 3.2 2.5 2.1 2.0 1.9 Illinois 2.5 3.4 2.9 2.4 2.0 1.9
VA Office of Inspector General 106

Review of State Variances in VA Disability Compensation Payments
Appendix D
Table 10. Veterans Power of Attorney Representation by State–FY 2004 Veterans Receiving
Compensation Veterans with Representation Veterans without Representation Average Annual
Percent of Total
Average Annual
Percent of Total
Average Annual
State Payment Number Number Veterans Payment Number Veterans Payment 50-State Totals $8,378 2,493,576 1,591,334 63.8% $10,631 902,242 36.2% $4,406 New Mexico $12,004 25,258 16,649 65.9% $15,275 8,609 34.1% $5,677 Maine $11,626 18,751 13,101 69.9% $14,419 5,650 30.1% $5,148 Arkansas $10,968 31,473 21,309 67.7% $13,052 10,164 32.3% $6,597 West Virginia $10,866 20,681 15,176 73.4% $12,791 5,505 26.6% $5,561 Oklahoma $10,697 51,213 32,918 64.3% $13,501 18,295 35.7% $5,650 Oregon $10,277 35,449 26,919 75.9% $11,890 8,530 24.1% $5,187 Vermont $9,649 6,894 4,248 61.6% $12,449 2,646 38.4% $5,153 Arizona $9,308 50,224 31,341 62.4% $11,894 18,883 37.6% $5,016 North Carolina $9,281 90,745 65,559 72.2% $11,086 25,186 27.8% $4,583 Kentucky $9,194 37,657 23,767 63.1% $11,700 13,890 36.9% $4,905 Louisiana $9,114 37,475 27,009 72.1% $10,984 10,466 27.9% $4,290 Mississippi $8,949 25,620 15,156 59.2% $11,315 10,464 40.8% $5,523 Texas $8,928 208,986 140,951 67.4% $11,043 68,035 32.6% $4,545 Rhode Island $8,893 17,301 9,821 56.8% $12,398 7,480 43.2% $4,291 Montana $8,871 12,444 9,497 76.3% $10,267 2,947 23.7% $4,372 Nevada $8,771 20,620 11,669 56.6% $11,591 8,951 43.4% $5,095 Tennessee $8,698 54,108 35,407 65.4% $10,888 18,701 34.6% $4,550 Florida $8,658 179,850 129,221 71.8% $10,355 50,629 28.2% $4,327 Nebraska $8,623 23,143 16,633 71.9% $10,269 6,510 28.1% $4,415 Idaho $8,604 14,185 10,760 75.9% $9,959 3,425 24.1% $4,346 South Dakota $8,548 9,823 7,229 73.6% $10,070 2,594 26.4% $4,307 Washington $8,531 85,094 64,654 76.0% $9,661 20,440 24.0% $4,956 Hawaii $8,491 15,895 6,717 42.3% $12,471 9,178 57.7% $5,579 South Carolina $8,459 44,708 29,279 65.5% $10,587 15,429 34.5% $4,423 Minnesota $8,321 39,990 30,033 75.1% $9,935 9,957 24.9% $3,454 Wisconsin $8,297 44,102 32,923 74.7% $9,754 11,179 25.3% $4,005 Missouri $8,232 49,126 32,086 65.3% $10,366 17,040 34.7% $4,214 New Hampshire $8,168 13,470 7,934 58.9% $10,669 5,536 41.1% $4,584 Alabama $8,165 54,247 36,483 67.3% $10,138 17,764 32.7% $4,113 North Dakota $8,143 10,655 8,594 80.7% $9,221 2,061 19.3% $3,647 Alaska $8,138 11,648 8,397 72.1% $9,362 3,251 27.9% $4,977 California $8,099 229,915 151,261 65.8% $10,089 78,654 34.2% $4,271 Maryland $7,944 36,808 17,405 47.3% $11,062 19,403 52.7% $5,147 Colorado $7,944 49,580 31,382 63.3% $10,093 18,198 36.7% $4,238 Utah $7,906 14,748 8,374 56.8% $10,416 6,374 43.2% $4,610 Pennsylvania $7,898 101,755 51,354 50.5% $11,122 50,401 49.5% $4,613 Iowa $7,797 20,642 13,297 64.4% $9,832 7,345 35.6% $4,114 Wyoming $7,778 5,871 3,450 58.8% $9,867 2,421 41.2% $4,801 Georgia $7,775 84,118 47,953 57.0% $10,416 36,165 43.0% $4,274 Virginia $7,716 81,297 54,087 66.5% $9,118 27,210 33.5% $4,930 Kansas $7,579 24,213 16,450 67.9% $9,390 7,763 32.1% $3,740 Massachusetts $7,529 53,584 26,505 49.5% $11,478 27,079 50.5% $3,665 Delaware $7,453 7,584 4,416 58.2% $9,765 3,168 41.8% $4,230
VA Office of Inspector General 107
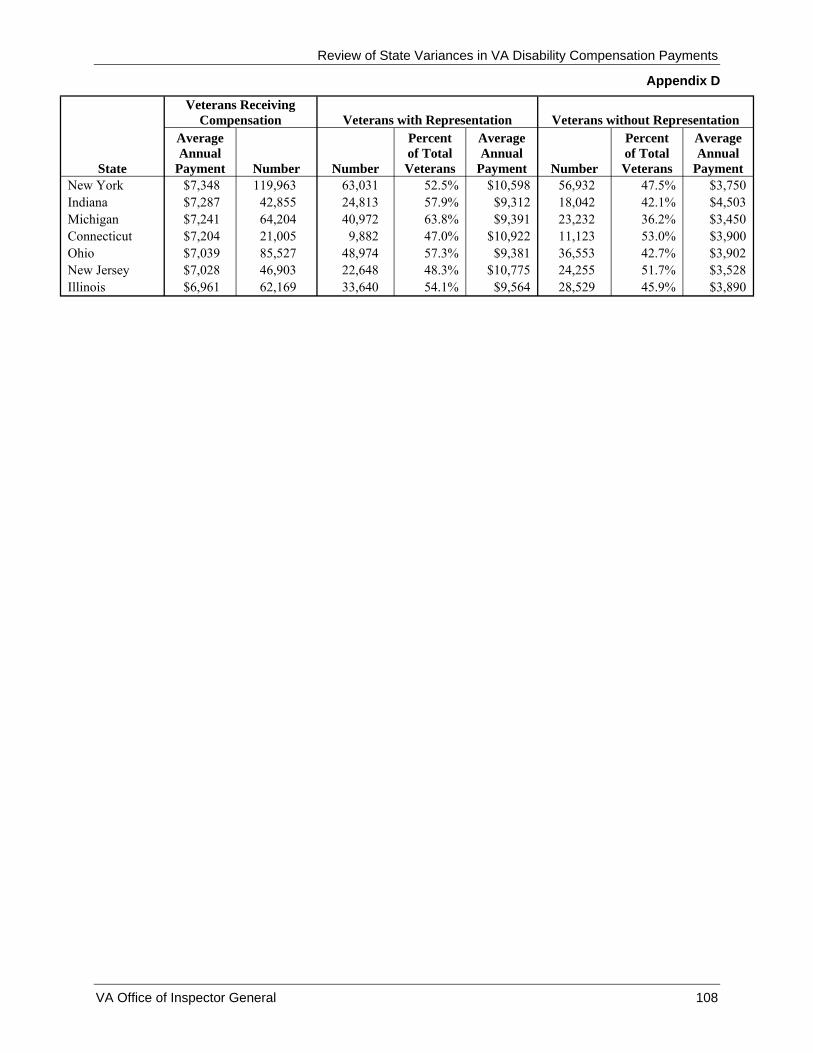
Review of State Variances in VA Disability Compensation Payments
Appendix D
Veterans Receiving Compensation Veterans with Representation Veterans without Representation
Average Annual
Percent of Total
Average Annual
Percent of Total
Average Annual
State Payment Number Number Veterans Payment Number Veterans Payment New York $7,348 119,963 63,031 52.5% $10,598 56,932 47.5% $3,750 Indiana $7,287 42,855 24,813 57.9% $9,312 18,042 42.1% $4,503 Michigan $7,241 64,204 40,972 63.8% $9,391 23,232 36.2% $3,450 Connecticut $7,204 21,005 9,882 47.0% $10,922 11,123 53.0% $3,900 Ohio $7,039 85,527 48,974 57.3% $9,381 36,553 42.7% $3,902 New Jersey $7,028 46,903 22,648 48.3% $10,775 24,255 51.7% $3,528 Illinois $6,961 62,169 33,640 54.1% $9,564 28,529 45.9% $3,890
VA Office of Inspector General 108

Review of State Variances in VA Disability Compensation Payments
Appendix D
Table 11. Veterans Branch of Service and Annual Average Payment by State–FY 2004 Veterans Receiving
Compensation Army Air Force Marine Corps Navy Average Annual
Percent of Total
Average Annual
Percent of Total
Average Annual
Percent of Total
Average Annual
Percent of Total
Average Annual
State Payment Number Veterans Payment Veterans Payment Veterans Payment Veterans Payment 50-State Totals $8,378 2,493,576 52.8% $8,787 17.8% $7,361 10.7% $9,315 17.6% $7,665 New Mexico $12,004 25,258 46.5% $13,764 28.8% $8,521 9.6% $14,846 13.9% $11,510 Maine $11,626 18,751 45.7% $12,778 16.6% $9,804 10.7% $14,001 23.5% $9,898 Arkansas $10,968 31,473 52.6% $11,597 23.2% $9,369 9.0% $12,028 14.7% $10,672 West Virginia $10,866 20,681 59.9% $11,271 13.7% $9,168 12.3% $11,973 13.4% $9,955 Oklahoma $10,697 51,213 56.3% $11,489 22.0% $8,184 8.6% $12,228 12.4% $10,497 Oregon $10,277 35,449 47.0% $10,696 14.5% $9,322 13.1% $11,757 23.0% $9,389 Vermont $9,649 6,894 53.2% $9,994 15.1% $8,192 12.8% $11,009 17.2% $8,868 Arizona $9,308 50,224 45.5% $10,006 27.0% $7,661 11.8% $10,468 14.5% $9,229 North Carolina $9,281 90,745 57.3% $9,731 13.7% $8,069 16.4% $8,979 11.4% $8,942 Kentucky $9,194 37,657 69.5% $9,361 10.4% $8,344 8.4% $9,660 11.0% $8,704 Louisiana $9,114 37,475 53.4% $9,647 20.0% $8,019 10.8% $9,953 14.6% $8,205 Mississippi $8,949 25,620 51.9% $9,578 22.7% $7,669 8.0% $10,225 16.5% $8,123 Texas $8,928 208,986 55.2% $9,375 23.6% $7,759 8.5% $9,959 12.0% $8,462 Rhode Island $8,893 17,301 50.3% $9,192 12.7% $7,534 10.8% $11,359 22.8% $7,968 Montana $8,871 12,444 44.2% $9,704 25.1% $7,138 11.1% $10,111 18.1% $8,545 Nevada $8,771 20,620 37.0% $9,997 31.2% $6,822 11.6% $9,937 19.1% $8,849 Tennessee $8,698 54,108 61.9% $8,829 14.1% $8,050 9.1% $9,531 14.3% $8,217 Florida $8,658 179,850 43.5% $9,751 22.7% $7,374 9.2% $9,895 22.8% $7,413 Nebraska $8,623 23,143 43.3% $9,576 32.3% $7,116 7.8% $9,824 15.9% $8,498 Idaho $8,604 14,185 43.4% $9,253 25.2% $7,448 10.5% $9,367 19.7% $8,387 South Dakota $8,548 9,823 47.9% $9,527 26.9% $6,913 8.4% $9,355 15.8% $7,930 Washington $8,531 85,094 48.3% $9,085 17.3% $7,478 7.1% $10,622 25.3% $7,688 Hawaii $8,491 15,895 54.3% $9,226 15.3% $6,467 9.9% $10,084 19.1% $7,331 South Carolina $8,459 44,708 52.2% $9,205 20.9% $7,211 9.4% $8,957 16.8% $7,490
VA Office of Inspector General 109
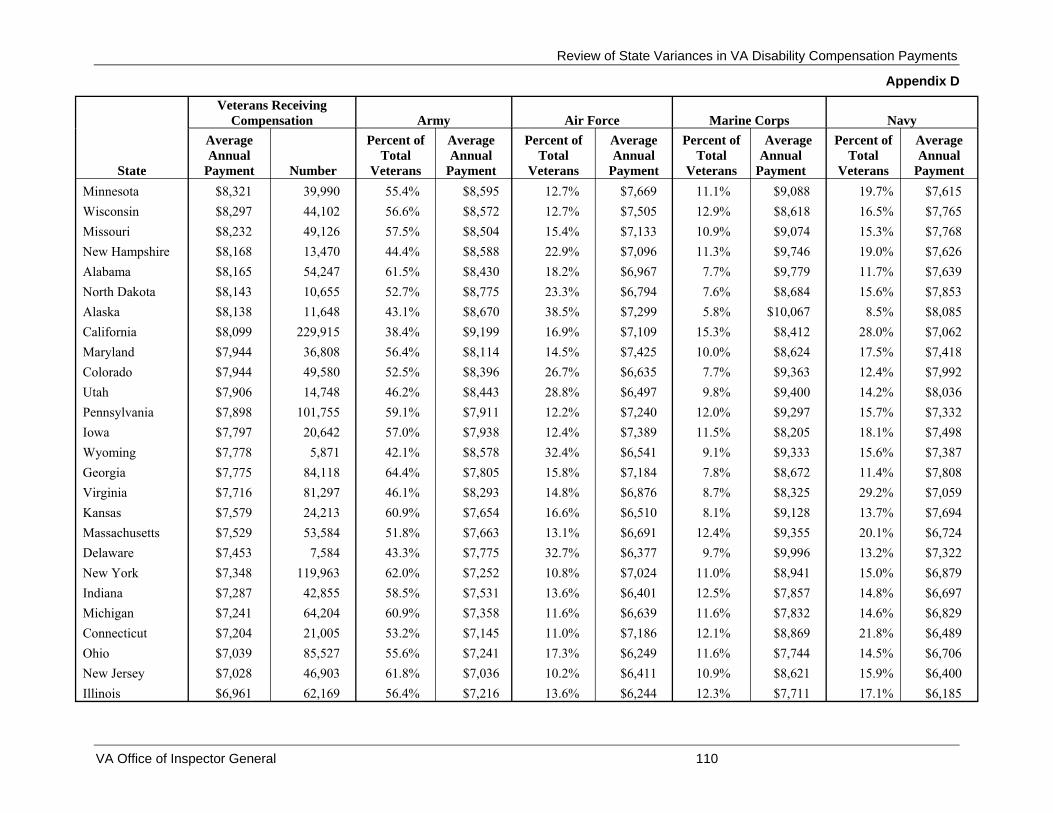
Review of State Variances in VA Disability Compensation Payments
Appendix D
Veterans Receiving Compensation Army Air Force Marine Corps Navy
Average Annual
Percent of Total
Average Annual
Percent of Total
Average Annual
Percent of Total
Average Annual
Percent of Total
Average Annual
State Payment Number Veterans Payment Veterans Payment Veterans Payment Veterans Payment Minnesota $8,321 39,990 55.4% $8,595 12.7% $7,669 11.1% $9,088 19.7% $7,615 Wisconsin $8,297 44,102 56.6% $8,572 12.7% $7,505 12.9% $8,618 16.5% $7,765 Missouri $8,232 49,126 57.5% $8,504 15.4% $7,133 10.9% $9,074 15.3% $7,768 New Hampshire $8,168 13,470 44.4% $8,588 22.9% $7,096 11.3% $9,746 19.0% $7,626 Alabama $8,165 54,247 61.5% $8,430 18.2% $6,967 7.7% $9,779 11.7% $7,639 North Dakota $8,143 10,655 52.7% $8,775 23.3% $6,794 7.6% $8,684 15.6% $7,853 Alaska $8,138 11,648 43.1% $8,670 38.5% $7,299 5.8% $10,067 8.5% $8,085 California $8,099 229,915 38.4% $9,199 16.9% $7,109 15.3% $8,412 28.0% $7,062 Maryland $7,944 36,808 56.4% $8,114 14.5% $7,425 10.0% $8,624 17.5% $7,418 Colorado $7,944 49,580 52.5% $8,396 26.7% $6,635 7.7% $9,363 12.4% $7,992 Utah $7,906 14,748 46.2% $8,443 28.8% $6,497 9.8% $9,400 14.2% $8,036 Pennsylvania $7,898 101,755 59.1% $7,911 12.2% $7,240 12.0% $9,297 15.7% $7,332 Iowa $7,797 20,642 57.0% $7,938 12.4% $7,389 11.5% $8,205 18.1% $7,498 Wyoming $7,778 5,871 42.1% $8,578 32.4% $6,541 9.1% $9,333 15.6% $7,387 Georgia $7,775 84,118 64.4% $7,805 15.8% $7,184 7.8% $8,672 11.4% $7,808 Virginia $7,716 81,297 46.1% $8,293 14.8% $6,876 8.7% $8,325 29.2% $7,059 Kansas $7,579 24,213 60.9% $7,654 16.6% $6,510 8.1% $9,128 13.7% $7,694 Massachusetts $7,529 53,584 51.8% $7,663 13.1% $6,691 12.4% $9,355 20.1% $6,724 Delaware $7,453 7,584 43.3% $7,775 32.7% $6,377 9.7% $9,996 13.2% $7,322 New York $7,348 119,963 62.0% $7,252 10.8% $7,024 11.0% $8,941 15.0% $6,879 Indiana $7,287 42,855 58.5% $7,531 13.6% $6,401 12.5% $7,857 14.8% $6,697 Michigan $7,241 64,204 60.9% $7,358 11.6% $6,639 11.6% $7,832 14.6% $6,829 Connecticut $7,204 21,005 53.2% $7,145 11.0% $7,186 12.1% $8,869 21.8% $6,489 Ohio $7,039 85,527 55.6% $7,241 17.3% $6,249 11.6% $7,744 14.5% $6,706 New Jersey $7,028 46,903 61.8% $7,036 10.2% $6,411 10.9% $8,621 15.9% $6,400 Illinois $6,961 62,169 56.4% $7,216 13.6% $6,244 12.3% $7,711 17.1% $6,185
VA Office of Inspector General 110
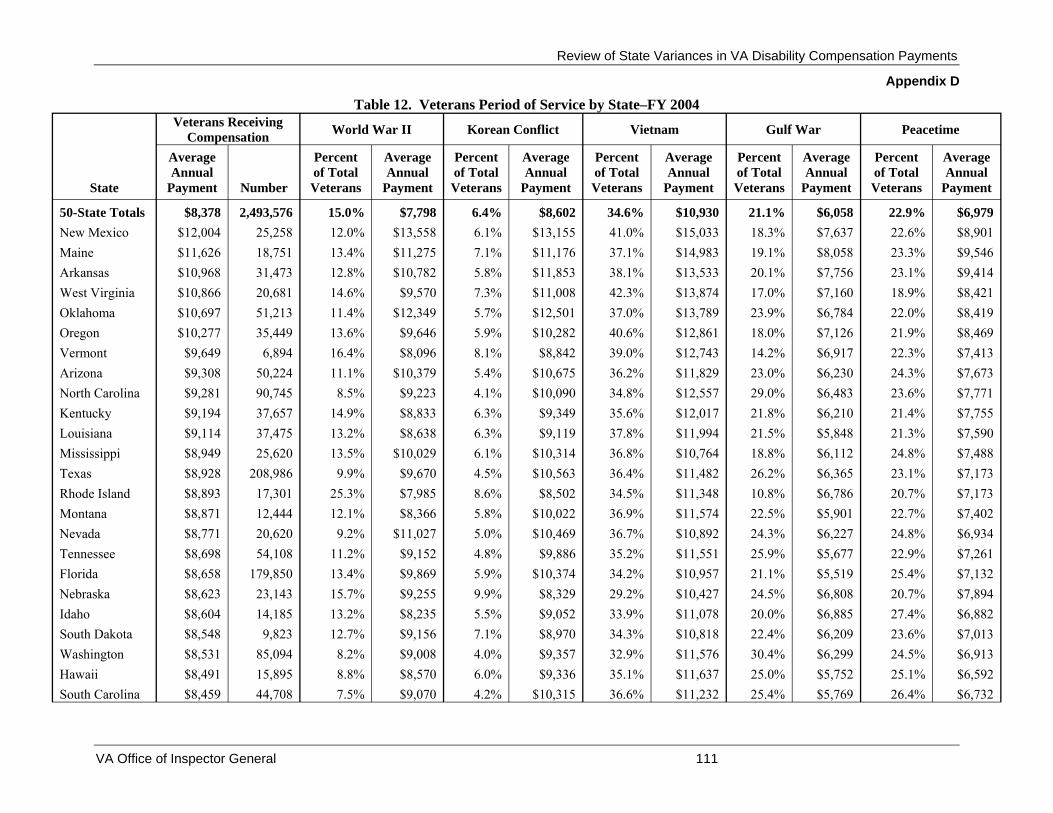
Review of State Variances in VA Disability Compensation Payments
Appendix D
Table 12. Veterans Period of Service by State–FY 2004 Veterans Receiving
Compensation World War II Korean Conflict Vietnam Gulf War Peacetime
Average Annual
Percent of Total
Average Annual
Percent of Total
Average Annual
Percent of Total
Average Annual
Percent of Total
Average Annual
Percent of Total
Average Annual
State Payment Number Veterans Payment Veterans Payment Veterans Payment Veterans Payment Veterans Payment
50-State Totals $8,378 2,493,576 15.0% $7,798 6.4% $8,602 34.6% $10,930 21.1% $6,058 22.9% $6,979 New Mexico $12,004 25,258 12.0% $13,558 6.1% $13,155 41.0% $15,033 18.3% $7,637 22.6% $8,901 Maine $11,626 18,751 13.4% $11,275 7.1% $11,176 37.1% $14,983 19.1% $8,058 23.3% $9,546 Arkansas $10,968 31,473 12.8% $10,782 5.8% $11,853 38.1% $13,533 20.1% $7,756 23.1% $9,414 West Virginia $10,866 20,681 14.6% $9,570 7.3% $11,008 42.3% $13,874 17.0% $7,160 18.9% $8,421 Oklahoma $10,697 51,213 11.4% $12,349 5.7% $12,501 37.0% $13,789 23.9% $6,784 22.0% $8,419 Oregon $10,277 35,449 13.6% $9,646 5.9% $10,282 40.6% $12,861 18.0% $7,126 21.9% $8,469 Vermont $9,649 6,894 16.4% $8,096 8.1% $8,842 39.0% $12,743 14.2% $6,917 22.3% $7,413 Arizona $9,308 50,224 11.1% $10,379 5.4% $10,675 36.2% $11,829 23.0% $6,230 24.3% $7,673 North Carolina $9,281 90,745 8.5% $9,223 4.1% $10,090 34.8% $12,557 29.0% $6,483 23.6% $7,771 Kentucky $9,194 37,657 14.9% $8,833 6.3% $9,349 35.6% $12,017 21.8% $6,210 21.4% $7,755 Louisiana $9,114 37,475 13.2% $8,638 6.3% $9,119 37.8% $11,994 21.5% $5,848 21.3% $7,590 Mississippi $8,949 25,620 13.5% $10,029 6.1% $10,314 36.8% $10,764 18.8% $6,112 24.8% $7,488 Texas $8,928 208,986 9.9% $9,670 4.5% $10,563 36.4% $11,482 26.2% $6,365 23.1% $7,173 Rhode Island $8,893 17,301 25.3% $7,985 8.6% $8,502 34.5% $11,348 10.8% $6,786 20.7% $7,173 Montana $8,871 12,444 12.1% $8,366 5.8% $10,022 36.9% $11,574 22.5% $5,901 22.7% $7,402 Nevada $8,771 20,620 9.2% $11,027 5.0% $10,469 36.7% $10,892 24.3% $6,227 24.8% $6,934 Tennessee $8,698 54,108 11.2% $9,152 4.8% $9,886 35.2% $11,551 25.9% $5,677 22.9% $7,261 Florida $8,658 179,850 13.4% $9,869 5.9% $10,374 34.2% $10,957 21.1% $5,519 25.4% $7,132 Nebraska $8,623 23,143 15.7% $9,255 9.9% $8,329 29.2% $10,427 24.5% $6,808 20.7% $7,894 Idaho $8,604 14,185 13.2% $8,235 5.5% $9,052 33.9% $11,078 20.0% $6,885 27.4% $6,882 South Dakota $8,548 9,823 12.7% $9,156 7.1% $8,970 34.3% $10,818 22.4% $6,209 23.6% $7,013 Washington $8,531 85,094 8.2% $9,008 4.0% $9,357 32.9% $11,576 30.4% $6,299 24.5% $6,913 Hawaii $8,491 15,895 8.8% $8,570 6.0% $9,336 35.1% $11,637 25.0% $5,752 25.1% $6,592 South Carolina $8,459 44,708 7.5% $9,070 4.2% $10,315 36.6% $11,232 25.4% $5,769 26.4% $6,732
VA Office of Inspector General 111
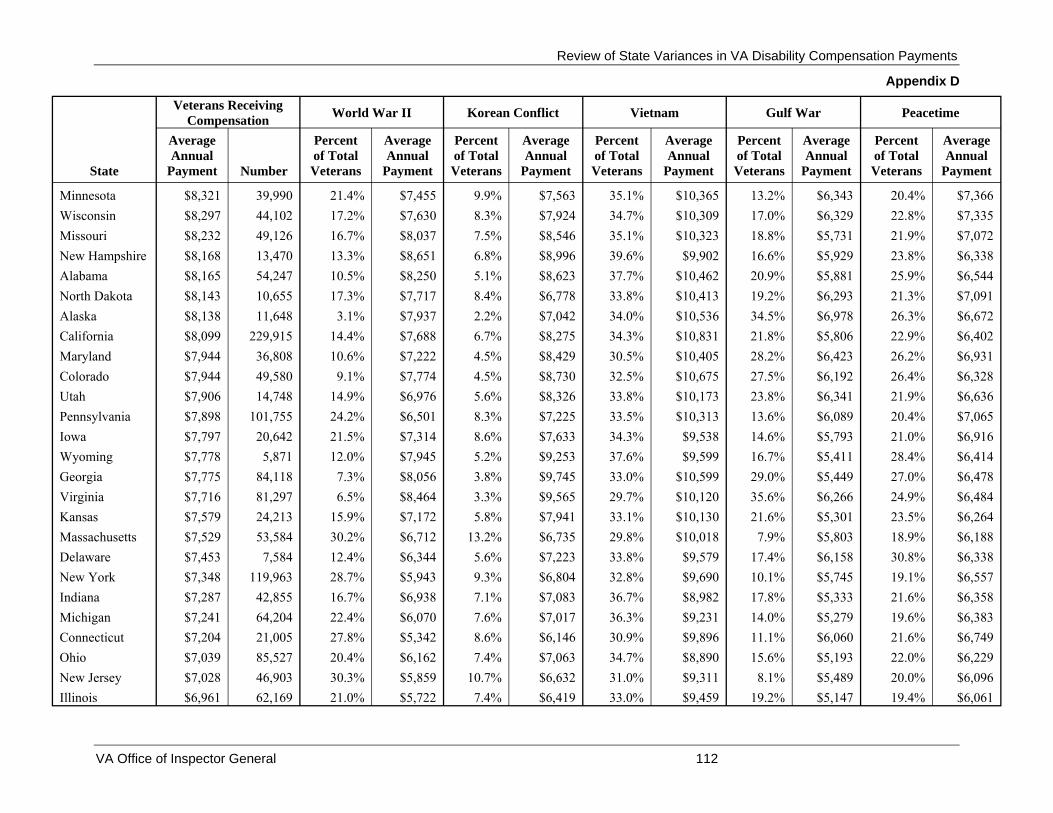
Review of State Variances in VA Disability Compensation Payments
Appendix D
Veterans Receiving Compensation World War II Korean Conflict Vietnam Gulf War Peacetime
Average Annual
Percent of Total
Average Annual
Percent of Total
Average Annual
Percent of Total
Average Annual
Percent of Total
Average Annual
Percent of Total
Average Annual
State Payment Number Veterans Payment Veterans Payment Veterans Payment Veterans Payment Veterans Payment
Minnesota $8,321 39,990 21.4% $7,455 9.9% $7,563 35.1% $10,365 13.2% $6,343 20.4% $7,366 Wisconsin $8,297 44,102 17.2% $7,630 8.3% $7,924 34.7% $10,309 17.0% $6,329 22.8% $7,335 Missouri $8,232 49,126 16.7% $8,037 7.5% $8,546 35.1% $10,323 18.8% $5,731 21.9% $7,072 New Hampshire $8,168 13,470 13.3% $8,651 6.8% $8,996 39.6% $9,902 16.6% $5,929 23.8% $6,338 Alabama $8,165 54,247 10.5% $8,250 5.1% $8,623 37.7% $10,462 20.9% $5,881 25.9% $6,544 North Dakota $8,143 10,655 17.3% $7,717 8.4% $6,778 33.8% $10,413 19.2% $6,293 21.3% $7,091 Alaska $8,138 11,648 3.1% $7,937 2.2% $7,042 34.0% $10,536 34.5% $6,978 26.3% $6,672 California $8,099 229,915 14.4% $7,688 6.7% $8,275 34.3% $10,831 21.8% $5,806 22.9% $6,402 Maryland $7,944 36,808 10.6% $7,222 4.5% $8,429 30.5% $10,405 28.2% $6,423 26.2% $6,931 Colorado $7,944 49,580 9.1% $7,774 4.5% $8,730 32.5% $10,675 27.5% $6,192 26.4% $6,328 Utah $7,906 14,748 14.9% $6,976 5.6% $8,326 33.8% $10,173 23.8% $6,341 21.9% $6,636 Pennsylvania $7,898 101,755 24.2% $6,501 8.3% $7,225 33.5% $10,313 13.6% $6,089 20.4% $7,065 Iowa $7,797 20,642 21.5% $7,314 8.6% $7,633 34.3% $9,538 14.6% $5,793 21.0% $6,916 Wyoming $7,778 5,871 12.0% $7,945 5.2% $9,253 37.6% $9,599 16.7% $5,411 28.4% $6,414 Georgia $7,775 84,118 7.3% $8,056 3.8% $9,745 33.0% $10,599 29.0% $5,449 27.0% $6,478 Virginia $7,716 81,297 6.5% $8,464 3.3% $9,565 29.7% $10,120 35.6% $6,266 24.9% $6,484 Kansas $7,579 24,213 15.9% $7,172 5.8% $7,941 33.1% $10,130 21.6% $5,301 23.5% $6,264 Massachusetts $7,529 53,584 30.2% $6,712 13.2% $6,735 29.8% $10,018 7.9% $5,803 18.9% $6,188 Delaware $7,453 7,584 12.4% $6,344 5.6% $7,223 33.8% $9,579 17.4% $6,158 30.8% $6,338 New York $7,348 119,963 28.7% $5,943 9.3% $6,804 32.8% $9,690 10.1% $5,745 19.1% $6,557 Indiana $7,287 42,855 16.7% $6,938 7.1% $7,083 36.7% $8,982 17.8% $5,333 21.6% $6,358 Michigan $7,241 64,204 22.4% $6,070 7.6% $7,017 36.3% $9,231 14.0% $5,279 19.6% $6,383 Connecticut $7,204 21,005 27.8% $5,342 8.6% $6,146 30.9% $9,896 11.1% $6,060 21.6% $6,749 Ohio $7,039 85,527 20.4% $6,162 7.4% $7,063 34.7% $8,890 15.6% $5,193 22.0% $6,229 New Jersey $7,028 46,903 30.3% $5,859 10.7% $6,632 31.0% $9,311 8.1% $5,489 20.0% $6,096 Illinois $6,961 62,169 21.0% $5,722 7.4% $6,419 33.0% $9,459 19.2% $5,147 19.4% $6,061
VA Office of Inspector General 112

Review of State Variances in VA Disability Compensation Payments
Appendix D
Table 13. Dependency and Special Monthly Compensation for 100 Percent Disabled Veterans–FY 2004
Veterans Receiving Compensation
Relative Percent Additional Value
State
Average Annual
Payment Number
Percent Veterans Receiving
SMC
Percent Veterans
with Dependents
Veterans Rated 100
Percent Disabled
Compensation for SMC and Dependency
(Note 1)
Added to State
Average (Note 2)
50-State Totals $8,378 2,493,576 8.1% 36.3% 8.4% $668,793,252 $268 New Mexico $12,004 25,258 8.9% 43.3% 10.2% $8,331,456 $330 Maine $11,626 18,751 8.1% 43.6% 12.0% $5,649,144 $301 Arkansas $10,968 31,473 9.1% 46.1% 12.3% $11,908,056 $378 West Virginia $10,866 20,681 9.4% 44.5% 11.9% $6,274,344 $303 Oklahoma $10,697 51,213 9.4% 44.8% 11.1% $19,611,372 $383 Oregon $10,277 35,449 9.0% 40.5% 11.9% $13,157,604 $371 Vermont $9,649 6,894 8.2% 38.7% 10.8% $1,944,504 $282 Arizona $9,308 50,224 8.7% 37.3% 9.9% $17,929,656 $357 North Carolina $9,281 90,745 10.9% 43.3% 9.6% $29,224,812 $322 Kentucky $9,194 37,657 8.9% 41.3% 10.3% $12,118,092 $322 Louisiana $9,114 37,475 9.1% 39.0% 9.1% $10,917,960 $291 Mississippi $8,949 25,620 8.7% 39.0% 10.8% $8,849,904 $345 Texas $8,928 208,986 9.8% 40.3% 7.7% $56,214,108 $269 Rhode Island $8,893 17,301 6.2% 34.0% 9.3% $4,272,552 $247 Montana $8,871 12,444 7.8% 37.8% 8.2% $3,509,544 $282 Nevada $8,771 20,620 9.6% 35.3% 8.5% $5,864,316 $284 Tennessee $8,698 54,108 9.5% 38.7% 10.4% $18,742,080 $346 Florida $8,658 179,850 8.0% 36.6% 8.6% $56,035,908 $312 Nebraska $8,623 23,143 7.6% 39.4% 7.4% $5,844,600 $253 Idaho $8,604 14,185 8.2% 39.3% 7.4% $3,703,860 $261 South Dakota $8,548 9,823 8.0% 37.9% 8.7% $2,541,252 $259 Washington $8,531 85,094 7.4% 38.4% 7.5% $19,611,372 $230 Hawaii $8,491 15,895 9.0% 35.8% 9.5% $4,306,392 $271 South Carolina $8,459 44,708 8.5% 39.9% 9.0% $14,238,372 $318 Minnesota $8,321 39,990 7.3% 34.4% 8.6% $9,774,972 $244 Wisconsin $8,297 44,102 7.7% 34.3% 9.0% $11,293,692 $256 Missouri $8,232 49,126 7.6% 35.6% 7.3% $10,506,240 $214 New Hampshire $8,168 13,470 6.2% 37.5% 7.6% $3,154,248 $234 Alabama $8,165 54,247 7.6% 39.2% 8.1% $17,929,656 $331 North Dakota $8,143 10,655 8.0% 36.5% 8.6% $2,639,916 $248 Alaska $8,138 11,648 5.7% 44.8% 5.6% $1,679,856 $144 California $8,099 229,915 8.1% 32.4% 7.9% $61,023,888 $265 Maryland $7,944 36,808 9.5% 39.0% 9.1% $11,848,716 $322 Colorado $7,944 49,580 8.2% 37.4% 9.6% $14,785,248 $298 Utah $7,906 14,748 7.4% 38.5% 7.5% $3,495,480 $237 Pennsylvania $7,898 101,755 7.7% 33.5% 7.6% $22,879,380 $225 Iowa $7,797 20,642 7.7% 33.8% 7.4% $4,296,720 $208 Wyoming $7,778 5,871 6.8% 35.1% 8.7% $1,435,380 $244 Georgia $7,775 84,118 8.6% 36.7% 7.8% $22,601,412 $269 Virginia $7,716 81,297 8.1% 41.1% 6.5% $19,455,240 $239
VA Office of Inspector General 113
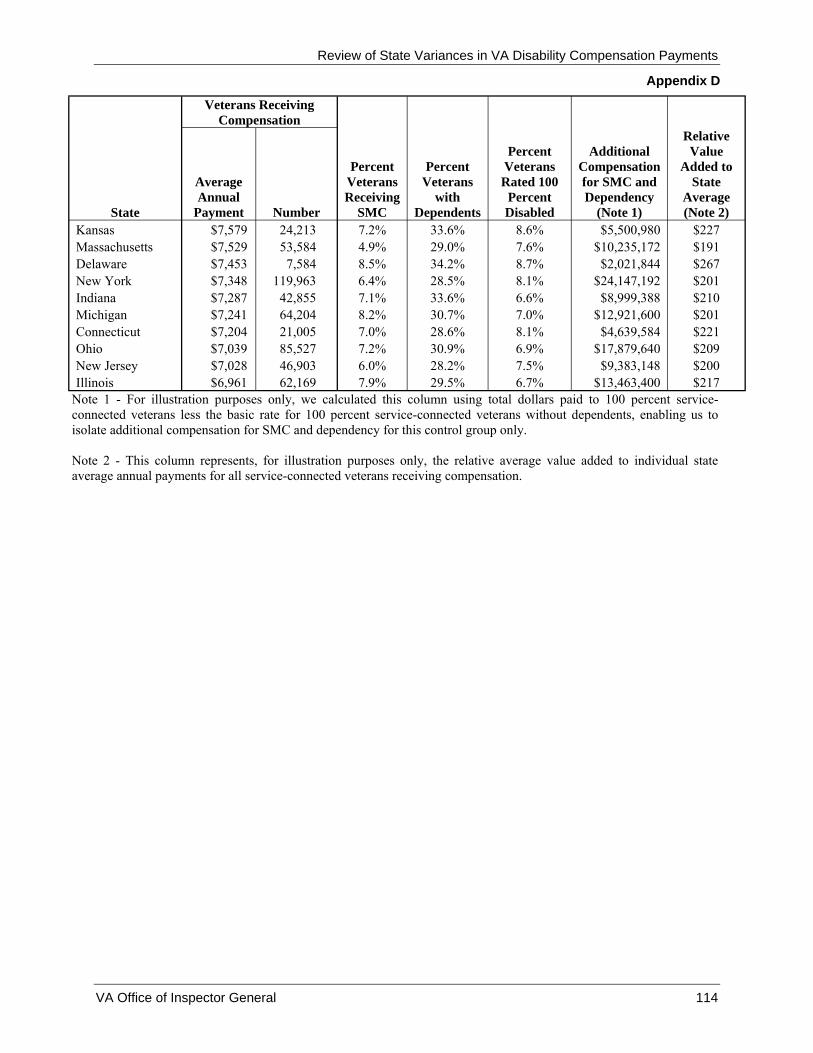
Review of State Variances in VA Disability Compensation Payments
Appendix D
Veterans Receiving Compensation
Relative Percent Additional Value
State
Average Annual
Payment Number
Percent Veterans Receiving
SMC
Percent Veterans
with Dependents
Veterans Rated 100
Percent Disabled
Compensation for SMC and Dependency
(Note 1)
Added to State
Average (Note 2)
Kansas $7,579 24,213 7.2% 33.6% 8.6% $5,500,980 $227 Massachusetts $7,529 53,584 4.9% 29.0% 7.6% $10,235,172 $191 Delaware $7,453 7,584 8.5% 34.2% 8.7% $2,021,844 $267 New York $7,348 119,963 6.4% 28.5% 8.1% $24,147,192 $201 Indiana $7,287 42,855 7.1% 33.6% 6.6% $8,999,388 $210 Michigan $7,241 64,204 8.2% 30.7% 7.0% $12,921,600 $201 Connecticut $7,204 21,005 7.0% 28.6% 8.1% $4,639,584 $221 Ohio $7,039 85,527 7.2% 30.9% 6.9% $17,879,640 $209 New Jersey $7,028 46,903 6.0% 28.2% 7.5% $9,383,148 $200 Illinois $6,961 62,169 7.9% 29.5% 6.7% $13,463,400 $217
Note 1 - For illustration purposes only, we calculated this column using total dollars paid to 100 percent service-connected veterans less the basic rate for 100 percent service-connected veterans without dependents, enabling us to isolate additional compensation for SMC and dependency for this control group only.
Note 2 - This column represents, for illustration purposes only, the relative average value added to individual state average annual payments for all service-connected veterans receiving compensation.
VA Office of Inspector General 114

Review of State Variances in VA Disability Compensation Payments
Appendix D
Table 14. Compensation and Pension Claims Pending by State for FYs 1999–2004 Veterans Receiving
State
Compensation Claims Pending at Fiscal Year-End Percent Change
Average Annual Payment Veterans 1999 2000 2001 2002 2003 2004
50-State Totals $8,378 2,493,576 236,032 216,902 403,970 334,624 247,381 316,145 33.9% New Mexico $12,004 25,258 2,457 2,485 4,693 3,355 2,331 3,195 30.0% Maine $11,626 18,751 2,188 1,241 3,858 2,022 1,772 2,401 9.7% Arkansas $10,968 31,473 2,903 3,688 5,768 4,130 3,849 4,559 57.0% West Virginia $10,866 20,681 1,987 2,252 5,317 3,929 2,600 3,207 61.4% Oklahoma $10,697 51,213 4,073 3,634 8,598 5,160 4,848 5,452 33.9% Oregon $10,277 35,449 4,336 4,280 9,971 8,686 6,039 7,124 64.3% Vermont $9,649 6,894 457 470 1,109 970 600 515 12.7% Arizona $9,308 50,224 6,870 5,058 7,663 7,020 5,945 7,006 2.0% North Carolina $9,281 90,745 9,808 9,993 17,088 11,724 8,628 10,638 8.5% Kentucky $9,194 37,657 4,609 4,168 8,905 9,476 6,907 7,974 73.0% Louisiana $9,114 37,475 3,605 3,668 8,073 5,977 4,852 5,873 62.9% Mississippi $8,949 25,620 2,686 2,568 4,991 3,629 2,710 3,286 22.3% Texas $8,928 208,986 16,236 14,681 33,019 25,422 20,607 34,526 112.7% Rhode Island $8,893 17,301 2,099 1,610 3,054 2,193 1,858 1,349 -35.7% Montana $8,871 12,444 1,375 907 2,041 1,780 1,277 1,679 22.1% Nevada $8,771 20,620 3,093 3,094 6,174 5,269 2,734 3,272 5.8% Tennessee $8,698 54,108 6,522 6,615 10,943 6,743 5,841 6,619 1.5% Florida $8,658 179,850 20,617 14,954 26,622 15,895 12,531 17,121 -17.0% Nebraska $8,623 23,143 2,079 1,876 3,459 1,955 1,680 2,536 22.0% Idaho $8,604 14,185 1,616 1,454 2,395 1,287 1,543 1,808 11.9% South Dakota $8,548 9,823 879 937 1,523 1,253 1,016 1,376 56.5% Washington $8,531 85,094 7,335 6,132 11,573 8,865 6,739 11,332 54.5% Hawaii $8,491 15,895 2,245 2,370 3,770 3,189 2,771 2,905 29.4% South Carolina $8,459 44,708 4,080 3,450 7,596 6,892 4,850 5,319 30.4% Minnesota $8,321 39,990 3,268 2,946 5,598 5,422 4,366 4,723 44.5% Wisconsin $8,297 44,102 2,921 3,203 8,656 6,230 4,274 4,416 51.2% Missouri $8,232 49,126 4,463 5,189 7,839 7,152 5,577 6,577 47.4%
VA Office of Inspector General 115

Review of State Variances in VA Disability Compensation Payments
Appendix D
Veterans Receiving
State
Compensation Claims Pending at Fiscal Year-End Percent Change
Average Annual Payment Veterans 1999 2000 2001 2002 2003 2004
New Hampshire $8,168 13,470 1,064 1,052 1,736 1,351 1,102 1,092 2.6% Alabama $8,165 54,247 5,107 5,141 8,975 9,841 6,714 9,551 87.0% North Dakota $8,143 10,655 1,259 1,063 1,613 1,549 1,075 1,326 5.3% Alaska $8,138 11,648 1,642 1,270 2,266 1,782 1,233 1,147 -30.1% California $8,099 229,915 24,927 23,589 42,702 37,207 21,655 28,351 13.7% Maryland $7,944 36,808 2,671 2,609 4,987 5,892 3,926 4,323 61.8% Colorado $7,944 49,580 4,492 4,008 7,791 6,400 4,343 7,001 55.9% Utah $7,906 14,748 859 962 1,394 1,057 853 1,212 41.1% Pennsylvania $7,898 101,755 7,506 6,583 11,585 9,190 8,286 11,183 49.0% Iowa $7,797 20,642 1,624 2,175 3,428 3,426 2,401 3,689 127.2% Wyoming* $7,778 5,871 Georgia $7,775 84,118 9,748 8,573 14,398 12,766 8,469 10,847 11.3% Virginia $7,716 81,297 7,139 6,872 13,968 13,198 9,038 12,557 75.9% Kansas $7,579 24,213 2,026 2,777 4,565 4,742 2,801 4,401 117.2% Massachusetts $7,529 53,584 3,162 3,611 3,517 4,862 4,368 3,193 1.0% Delaware $7,453 7,584 739 816 1,640 1,493 952 899 21.7% New York $7,348 119,963 11,000 9,566 17,435 16,292 11,055 12,527 13.9% Indiana $7,287 42,855 3,471 2,836 5,701 5,223 3,948 5,248 51.2% Michigan $7,241 64,204 4,319 3,316 7,494 8,098 7,487 6,984 61.7% Connecticut $7,204 21,005 1,349 1,484 2,512 1,607 1,338 1,808 34.0% Ohio $7,039 85,527 6,354 6,234 11,627 11,546 8,041 9,946 56.5% New Jersey $7,028 46,903 4,898 4,284 6,134 6,126 3,441 3,230 -34.1% Illinois $6,961 62,169 5,869 5,158 8,206 5,351 6,110 8,842 50.7%
*Wyoming claims pending included in Colorado data.
VA Office of Inspector General 116

Review of State Variances in VA Disability Compensation Payments
Appendix D
Table 15. Percentage of Brokered Rating Cases by State–FY 2004 Veterans Receiving
Compensation Percent
State Average Annual
Payment Number Rating Cases Completed
Brokered Cases
Brokered Cases
50-State Totals $8,378 2,493,576 685,591 91,361 13.3% New Mexico $12,004 25,258 7,457 300 4.0% Maine $11,626 18,751 5,540 585 10.6% Arkansas $10,968 31,473 9,966 1,470 14.8% West Virginia $10,866 20,681 7,546 541 7.2% Oklahoma $10,697 51,213 18,297 249 1.4% Oregon $10,277 35,449 12,369 3,259 26.3% Vermont $9,649 6,894 1,999 0 0.0% Arizona $9,308 50,224 15,502 234 1.5% North Carolina $9,281 90,745 31,646 1 0.0% Kentucky $9,194 37,657 13,012 6,303 48.4% Louisiana $9,114 37,475 14,832 0 0.0% Mississippi $8,949 25,620 10,823 0 0.0% Texas $8,928 208,986 61,401 4,822 7.9% Rhode Island $8,893 17,301 4,338 2,923 67.4% Montana $8,871 12,444 3,517 407 11.6% Nevada $8,771 20,620 6,696 1,104 16.5% Tennessee $8,698 54,108 20,683 0 0.0% Florida $8,658 179,850 52,100 2,873 5.5% Nebraska $8,623 23,143 6,973 710 10.2% Idaho $8,604 14,185 4,310 253 5.9% South Dakota $8,548 9,823 3,261 48 1.5% Washington $8,531 85,094 16,461 4,536 27.6% Hawaii $8,491 15,895 5,014 2,414 48.1% South Carolina $8,459 44,708 16,833 58 0.3% Minnesota $8,321 39,990 13,979 14 0.1% Wisconsin $8,297 44,102 13,580 5 0.0% Missouri $8,232 49,126 16,649 1,592 9.6% New Hampshire $8,168 13,470 2,818 653 23.2% Alabama $8,165 54,247 17,094 5,401 31.6% North Dakota $8,143 10,655 3,790 79 2.1% Alaska $8,138 11,648 2,705 2,386 88.2% California $8,099 229,915 53,562 10,607 19.8% Maryland $7,944 36,808 9,833 3,273 33.3% Colorado $7,944 49,580 11,398 791 6.9% Utah $7,906 14,748 4,444 0 0.0% Pennsylvania $7,898 101,755 25,094 2,187 8.7% Iowa $7,797 20,642 5,749 2,612 45.4% Wyoming* $7,778 5,871 Georgia $7,775 84,118 23,543 3,991 17.0% Virginia $7,716 81,297 18,560 3,050 16.4% Kansas $7,579 24,213 5,503 1,153 21.0% Massachusetts $7,529 53,584 9,878 3,751 38.0% Delaware $7,453 7,584 1,948 1,067 54.8% New York $7,348 119,963 23,652 4,831 20.4%
VA Office of Inspector General 117
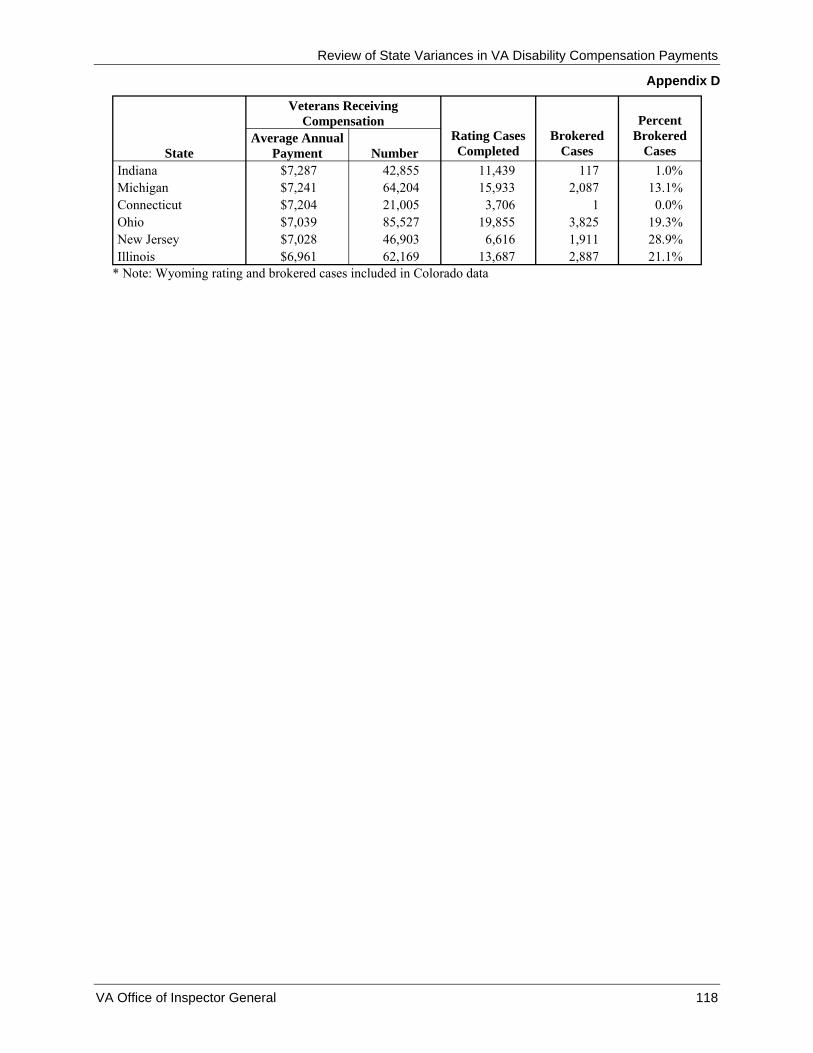
Review of State Variances in VA Disability Compensation Payments
Appendix D
Veterans Receiving Compensation Percent
State Average Annual
Payment Number Rating Cases Completed
Brokered Cases
Brokered Cases
Indiana $7,287 42,855 11,439 117 1.0% Michigan $7,241 64,204 15,933 2,087 13.1% Connecticut $7,204 21,005 3,706 1 0.0% Ohio $7,039 85,527 19,855 3,825 19.3% New Jersey $7,028 46,903 6,616 1,911 28.9% Illinois $6,961 62,169 13,687 2,887 21.1%
* Note: Wyoming rating and brokered cases included in Colorado data
VA Office of Inspector General 118

Review of State Variances in VA Disability Compensation Payments
Appendix D
Table 16. C&P Rating Actions Completed in More than 120 Days by State for FYs 2002–2004
State
Veterans Receiving Compensation Percent Completed in More Than 120 Days Average Annual
Payment Number 2002 2003 2004 50-State Totals $8,378 2,493,576 66.7% 55.7% 60.2% New Mexico $12,004 25,258 73.1% 79.6% 70.0% Maine $11,626 18,751 66.2% 61.9% 66.9% Arkansas $10,968 31,473 60.7% 67.1% 64.8% West Virginia $10,866 20,681 71.7% 79.6% 73.0% Oklahoma $10,697 51,213 57.0% 76.3% 69.2% Oregon $10,277 35,449 77.4% 69.8% 66.9% Vermont $9,649 6,894 74.0% 43.7% 52.7% Arizona $9,308 50,224 68.9% 58.7% 59.8% North Carolina $9,281 90,745 63.3% 53.4% 61.1% Kentucky $9,194 37,657 69.0% 77.9% 80.6% Louisiana $9,114 37,475 54.5% 50.4% 59.0% Mississippi $8,949 25,620 50.8% 55.4% 67.4% Texas $8,928 208,986 64.6% 39.7% 51.9% Rhode Island $8,893 17,301 78.0% 57.2% 65.6% Montana $8,871 12,444 57.2% 62.1% 58.9% Nevada $8,771 20,620 87.1% 42.8% 53.4% Tennessee $8,698 54,108 63.7% 62.1% 56.9% Florida $8,658 179,850 62.9% 67.4% 66.6% Nebraska $8,623 23,143 59.2% 34.2% 48.1% Idaho $8,604 14,185 59.2% 69.9% 67.3% South Dakota $8,548 9,823 59.3% 55.8% 62.3% Washington $8,531 85,094 69.1% 79.4% 69.8% Hawaii $8,491 15,895 79.2% 52.0% 47.4% South Carolina $8,459 44,708 62.6% 49.6% 53.6% Minnesota $8,321 39,990 68.1% 70.0% 64.4% Wisconsin $8,297 44,102 74.4% 45.5% 46.2% Missouri $8,232 49,126 59.4% 59.3% 59.9% New Hampshire $8,168 13,470 72.5% 51.2% 58.9% Alabama $8,165 54,247 62.8% 53.5% 58.6% North Dakota $8,143 10,655 64.1% 78.7% 69.5% Alaska $8,138 11,648 87.2% 74.0% 68.3% California $8,099 229,915 75.4% 41.8% 63.7% Maryland $7,944 36,808 71.7% 34.7% 45.5% Colorado $7,944 49,580 63.8% 72.1% 67.0% Utah $7,906 14,748 33.2% 50.0% 60.3% Pennsylvania $7,898 101,755 59.1% 24.8% 29.8% Iowa $7,797 20,642 70.5% 44.7% 56.9% Wyoming* $7,778 5,871 Georgia $7,775 84,118 67.4% 47.9% 49.8% Virginia $7,716 81,297 79.2% 62.7% 43.7% Kansas $7,579 24,213 83.5% 42.1% 63.0% Massachusetts $7,529 53,584 61.3% 23.1% 55.2% Delaware $7,453 7,584 83.0% 42.4% 73.1% New York $7,348 119,963 71.3% 47.2% 60.1%
VA Office of Inspector General 119

Review of State Variances in VA Disability Compensation Payments
Appendix D
State
Veterans Receiving Compensation Percent Completed in More Than 120 Days Average Annual
Payment Number 2002 2003 2004 Indiana $7,287 42,855 65.8% 52.9% 54.7% Michigan $7,241 64,204 67.7% 55.6% 69.0% Connecticut $7,204 21,005 63.2% 67.5% 68.2% Ohio $7,039 85,527 73.5% 69.3% 67.8% New Jersey $7,028 46,903 80.8% 64.7% 64.5% Illinois $6,961 62,169 65.5% 66.6% 68.3%
*Note: Wyoming rating actions completed included in Colorado data.
VA Office of Inspector General 120
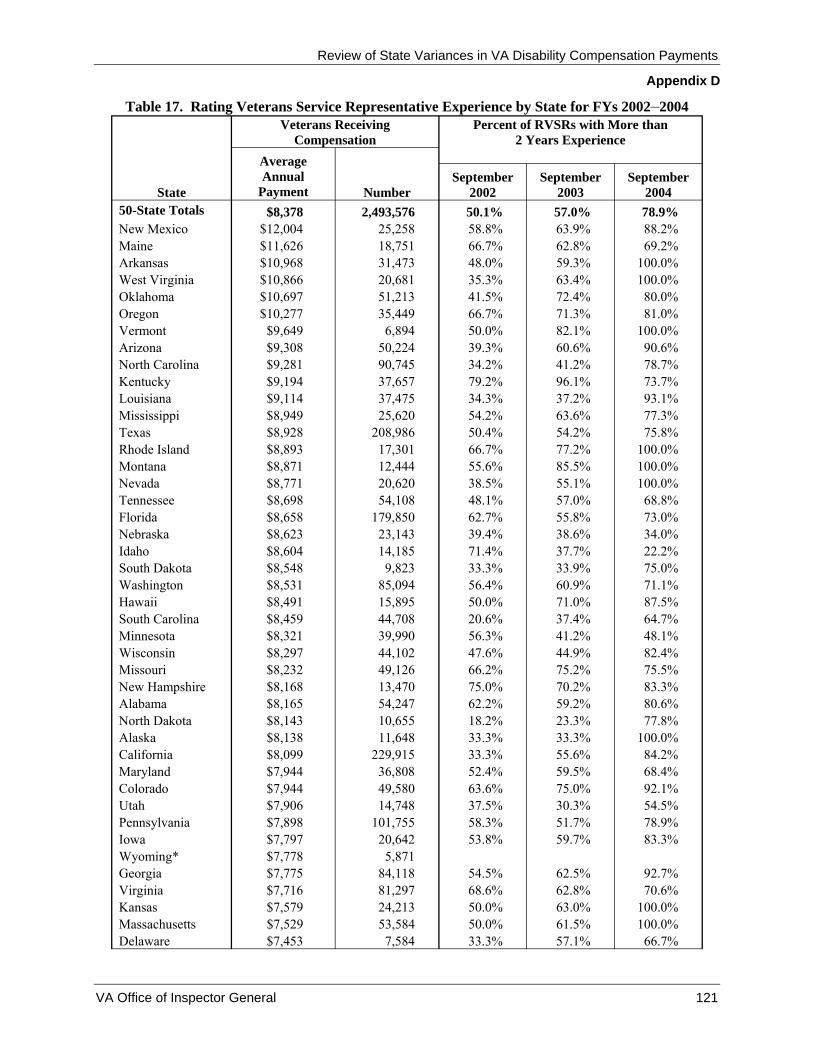
Review of State Variances in VA Disability Compensation Payments
Appendix D
Table 17. Rating Veterans Service Representative Experience by State for FYs 2002–2004
State
Veterans Receiving Compensation
Percent of RVSRs with More than 2 Years Experience
Average Annual
Payment Number September
2002 September
2003 September
2004 50-State Totals New Mexico Maine Arkansas West Virginia Oklahoma Oregon Vermont Arizona North Carolina Kentucky Louisiana Mississippi Texas Rhode Island Montana Nevada Tennessee Florida Nebraska Idaho South Dakota Washington Hawaii South Carolina Minnesota Wisconsin Missouri New Hampshire Alabama North Dakota Alaska California Maryland Colorado Utah Pennsylvania Iowa Wyoming* Georgia Virginia Kansas Massachusetts Delaware
$8,378 $12,004 $11,626 $10,968 $10,866 $10,697 $10,277
$9,649 $9,308 $9,281 $9,194 $9,114 $8,949 $8,928 $8,893 $8,871 $8,771 $8,698 $8,658 $8,623 $8,604 $8,548 $8,531 $8,491 $8,459 $8,321 $8,297 $8,232 $8,168 $8,165 $8,143 $8,138 $8,099 $7,944 $7,944 $7,906 $7,898 $7,797 $7,778 $7,775 $7,716 $7,579 $7,529 $7,453
2,493,576 25,25818,75131,47320,68151,21335,449
6,894 50,22490,74537,65737,47525,620
208,986 17,30112,44420,62054,108
179,850 23,14314,1859,823
85,09415,89544,70839,99044,10249,12613,47054,24710,65511,648
229,915 36,80849,58014,748
101,755 20,6425,871
84,11881,29724,21353,5847,584
50.1% 58.8% 66.7% 48.0% 35.3% 41.5% 66.7%
50.0% 39.3% 34.2% 79.2% 34.3% 54.2%
50.4% 66.7% 55.6% 38.5% 48.1%
62.7% 39.4% 71.4%
33.3% 56.4% 50.0% 20.6% 56.3% 47.6% 66.2% 75.0% 62.2% 18.2% 33.3%
33.3% 52.4% 63.6% 37.5%
58.3% 53.8%
54.5% 68.6% 50.0% 50.0%
33.3%
57.0%63.9% 62.8% 59.3% 63.4% 72.4% 71.3% 82.1% 60.6% 41.2% 96.1% 37.2% 63.6% 54.2% 77.2% 85.5% 55.1% 57.0% 55.8% 38.6% 37.7% 33.9% 60.9% 71.0% 37.4% 41.2% 44.9% 75.2% 70.2% 59.2% 23.3% 33.3% 55.6% 59.5% 75.0% 30.3% 51.7% 59.7%
62.5% 62.8% 63.0% 61.5% 57.1%
78.9% 88.2% 69.2%
100.0% 100.0% 80.0% 81.0%
100.0% 90.6% 78.7% 73.7% 93.1% 77.3% 75.8%
100.0% 100.0% 100.0%
68.8% 73.0% 34.0% 22.2% 75.0% 71.1% 87.5% 64.7% 48.1% 82.4% 75.5% 83.3% 80.6% 77.8%
100.0% 84.2% 68.4% 92.1% 54.5% 78.9% 83.3%
92.7% 70.6%
100.0% 100.0% 66.7%
VA Office of Inspector General 121
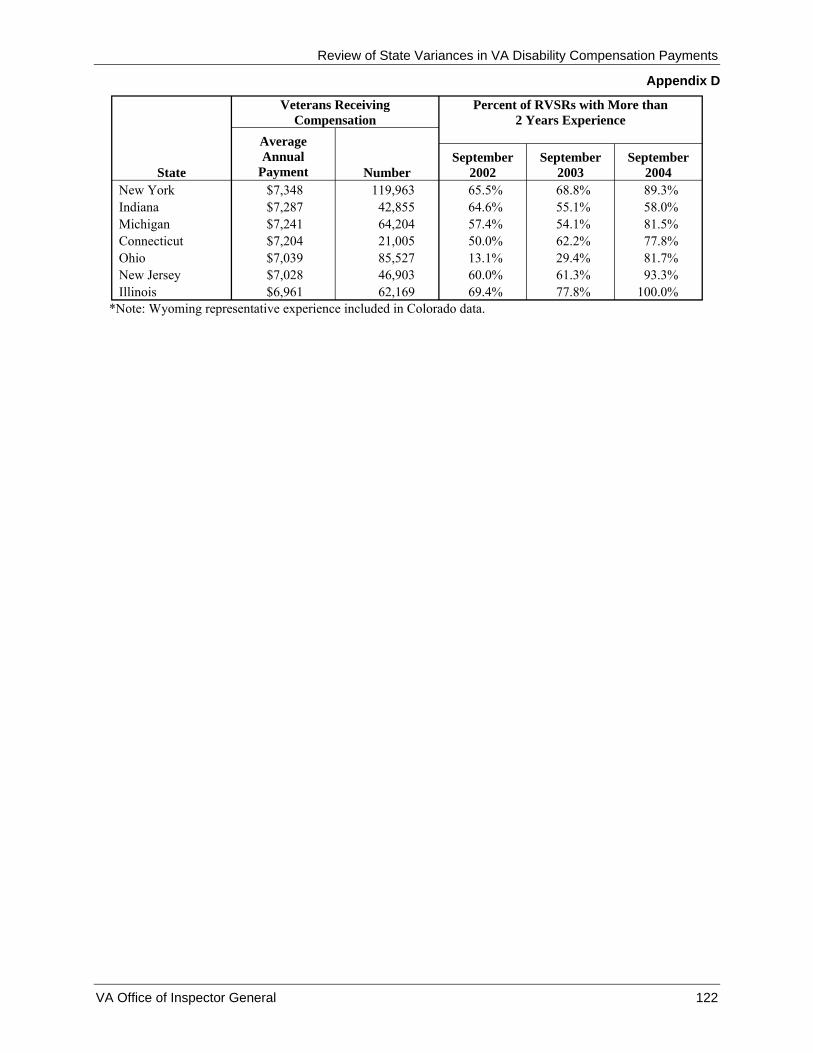
Review of State Variances in VA Disability Compensation Payments
Appendix D
Veterans Receiving Percent of RVSRs with More than Compensation 2 Years Experience
Average Annual September September September
State Payment Number 2002 2003 2004 New York $7,348 119,963 65.5% 68.8% 89.3% Indiana $7,287 42,855 64.6% 55.1% 58.0% Michigan $7,241 64,204 57.4% 54.1% 81.5% Connecticut $7,204 21,005 50.0% 62.2% 77.8% Ohio $7,039 85,527 13.1% 29.4% 81.7% New Jersey $7,028 46,903 60.0% 61.3% 93.3% Illinois $6,961 62,169 69.4% 77.8% 100.0%
*Note: Wyoming representative experience included in Colorado data.
VA Office of Inspector General 122

Review of State Variances in VA Disability Compensation Payments
Appendix D
Table 18. Veterans Appeals Filed by State for FYs 2002–2004
State
Veterans Receiving Compensation Appeals Filed
2002–2004 Appeals per
1,000 Veterans Average Annual
Payment Number 50-State Totals New Mexico Maine Arkansas West Virginia Oklahoma Oregon VermontArizona North Carolina KentuckyLouisiana MississippiTexas Rhode Island Montana Nevada Tennessee Florida Nebraska Idaho South Dakota WashingtonHawaiiSouth Carolina MinnesotaWisconsin MissouriNew Hampshire Alabama North Dakota Alaska California Maryland ColoradoUtah PennsylvaniaIowa Wyoming* Georgia VirginiaKansas MassachusettsDelaware New York Indiana
$8,378 $12,004 $11,626 $10,968 $10,866 $10,697 $10,277
$9,649 $9,308 $9,281
$9,194 $9,114
$8,949 $8,928 $8,893 $8,871 $8,771 $8,698 $8,658 $8,623 $8,604 $8,548
$8,531 $8,491
$8,459 $8,321
$8,297 $8,232
$8,168 $8,165 $8,143 $8,138 $8,099 $7,944
$7,944 $7,906
$7,898 $7,797 $7,778 $7,775
$7,716 $7,579
$7,529 $7,453 $7,348 $7,287
2,493,576 25,258 18,751 31,473 20,681 51,213 35,449
6,894 50,224 90,745 37,657 37,475 25,620
208,986 17,301 12,444 20,620 54,108
179,850 23,143 14,185 9,823
85,094 15,895 44,708 39,990 44,102 49,126 13,470 54,247 10,655 11,648
229,915 36,808 49,580 14,748
101,755 20,642 5,871
84,118 81,297 24,213 53,584 7,584
119,963 42,855
85,340 846 508
2,506 1,425 1,930 1,391
182 1,728 2,859 1,345 2,606 2,011 6,754
277 408 915
2,851 6,158 1,257
506 253 951 219
3,316 828 507
2,237 378
4,637 233 148
4,936 741
1,343 402
4,177 439
2,305 1,986 1,014 1,450
194 3,552 1,424
34 33 27 80 69 38 39 26 34 32 36 70 78 32 16 33 44 53 34 54 36 26 11 14 74 21 11 46 28 85 22 13 21 20 24 27 41 21
27 24 42 27 26 30 33
VA Office of Inspector General 123
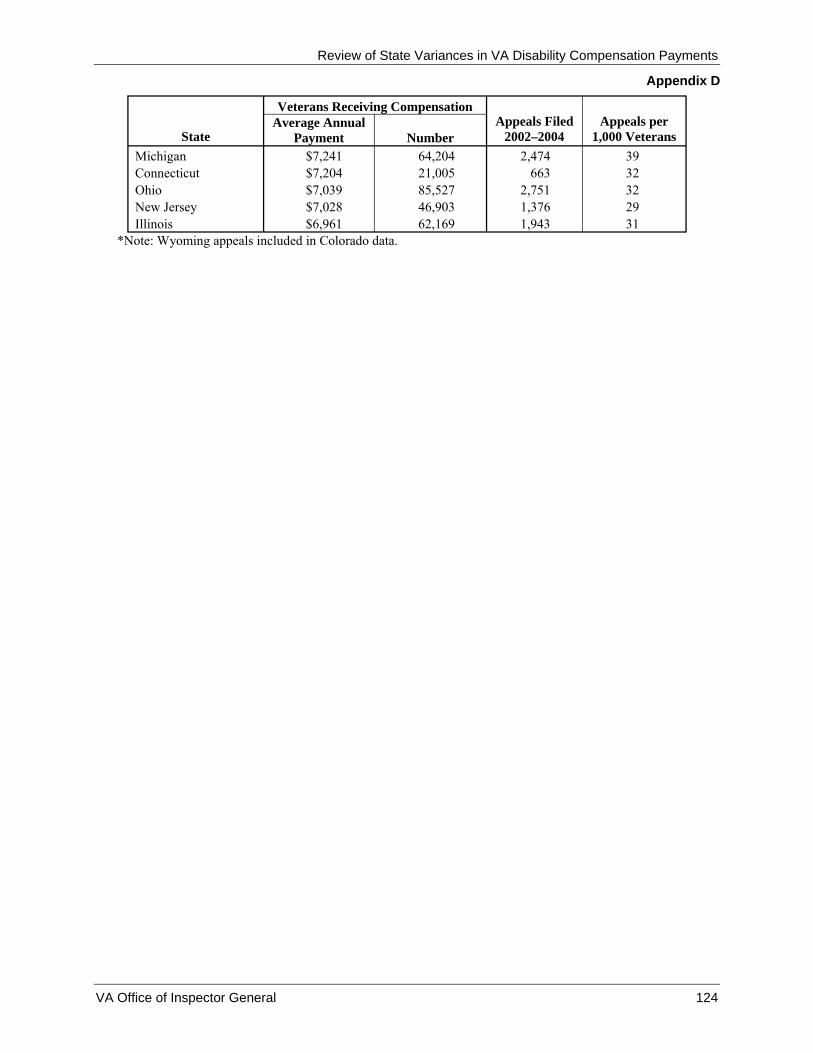
Review of State Variances in VA Disability Compensation Payments
Appendix D
State
Veterans Receiving Compensation Appeals Filed
2002–2004 Appeals per
1,000 Veterans Average Annual
Payment Number Michigan $7,241 64,204 2,474 39 Connecticut $7,204 21,005 663 32 Ohio $7,039 85,527 2,751 32 New Jersey $7,028 46,903 1,376 29 Illinois $6,961 62,169 1,943 31
*Note: Wyoming appeals included in Colorado data.
VA Office of Inspector General 124
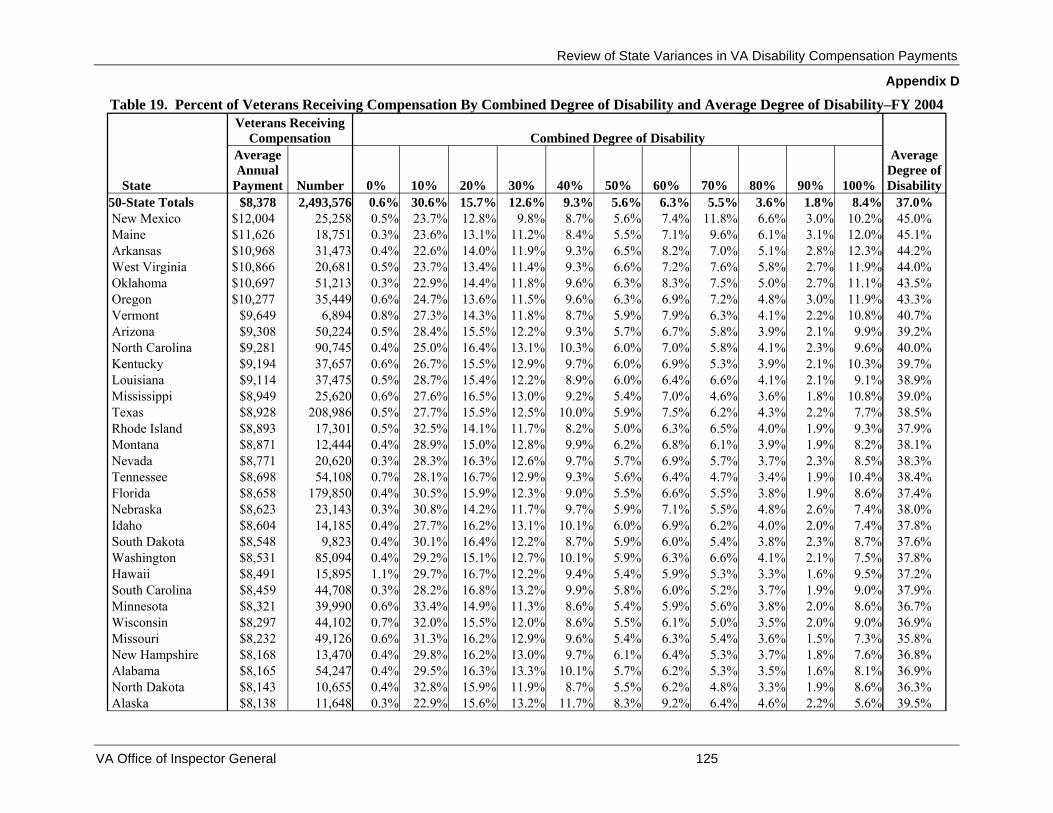
Review of State Variances in VA Disability Compensation Payments
Appendix D
Table 19. Percent of Veterans Receiving Compensation By Combined Degree of Disability and Average Degree of Disability–FY 2004
State
Veterans Receiving Compensation Combined Degree of Disability
Average Degree of Disability
Average Annual
Payment Number 0% 10% 20% 30% 40% 50% 60% 70% 80% 90% 100% 50-State Totals New Mexico Maine Arkansas West Virginia Oklahoma Oregon Vermont Arizona North Carolina Kentucky Louisiana Mississippi Texas
Rhode Island Montana Nevada Tennessee Florida Nebraska Idaho South Dakota Washington Hawaii South Carolina Minnesota Wisconsin Missouri New Hampshire Alabama North Dakota Alaska
$8,378 $12,004 $11,626 $10,968 $10,866
$10,697 $10,277
$9,649 $9,308 $9,281 $9,194 $9,114 $8,949 $8,928 $8,893 $8,871 $8,771 $8,698 $8,658 $8,623 $8,604 $8,548 $8,531 $8,491 $8,459 $8,321 $8,297 $8,232 $8,168 $8,165 $8,143 $8,138
2,493,576 25,258 18,751 31,473 20,681 51,213 35,449 6,894
50,224 90,745 37,657 37,475 25,620
208,986 17,301 12,444 20,620 54,108
179,850 23,143 14,185 9,823
85,094 15,895 44,708 39,990 44,102 49,126 13,470 54,247 10,655 11,648
0.6% 0.5% 0.3% 0.4% 0.5% 0.3% 0.6% 0.8% 0.5% 0.4% 0.6% 0.5% 0.6% 0.5% 0.5% 0.4% 0.3% 0.7% 0.4% 0.3% 0.4% 0.4% 0.4% 1.1% 0.3% 0.6% 0.7% 0.6% 0.4% 0.4% 0.4% 0.3%
30.6% 23.7% 23.6% 22.6% 23.7% 22.9% 24.7% 27.3% 28.4% 25.0% 26.7% 28.7% 27.6% 27.7% 32.5% 28.9% 28.3% 28.1% 30.5% 30.8% 27.7% 30.1% 29.2% 29.7% 28.2% 33.4% 32.0% 31.3% 29.8% 29.5% 32.8% 22.9%
15.7% 12.8% 13.1% 14.0% 13.4% 14.4% 13.6% 14.3% 15.5% 16.4% 15.5% 15.4% 16.5% 15.5% 14.1% 15.0% 16.3% 16.7% 15.9% 14.2% 16.2% 16.4% 15.1% 16.7% 16.8% 14.9% 15.5% 16.2% 16.2% 16.3% 15.9% 15.6%
12.6% 9.8%
11.2% 11.9% 11.4% 11.8% 11.5% 11.8% 12.2% 13.1% 12.9% 12.2% 13.0% 12.5% 11.7% 12.8% 12.6% 12.9% 12.3% 11.7% 13.1% 12.2% 12.7% 12.2% 13.2% 11.3% 12.0% 12.9% 13.0% 13.3% 11.9% 13.2%
9.3% 8.7% 8.4% 9.3% 9.3% 9.6% 9.6% 8.7% 9.3%
10.3% 9.7% 8.9% 9.2%
10.0% 8.2% 9.9% 9.7% 9.3% 9.0% 9.7%
10.1% 8.7%
10.1% 9.4% 9.9% 8.6% 8.6% 9.6% 9.7%
10.1% 8.7%
11.7%
5.6% 5.6% 5.5% 6.5% 6.6% 6.3% 6.3% 5.9% 5.7% 6.0% 6.0% 6.0% 5.4% 5.9% 5.0% 6.2% 5.7% 5.6% 5.5% 5.9% 6.0% 5.9% 5.9% 5.4% 5.8% 5.4% 5.5% 5.4% 6.1% 5.7% 5.5% 8.3%
6.3% 7.4% 7.1% 8.2% 7.2% 8.3% 6.9% 7.9% 6.7% 7.0% 6.9% 6.4% 7.0% 7.5% 6.3% 6.8% 6.9% 6.4% 6.6% 7.1% 6.9% 6.0% 6.3% 5.9% 6.0% 5.9% 6.1% 6.3% 6.4% 6.2% 6.2% 9.2%
5.5% 11.8%
9.6% 7.0% 7.6% 7.5% 7.2% 6.3% 5.8% 5.8% 5.3% 6.6% 4.6% 6.2% 6.5% 6.1% 5.7% 4.7% 5.5% 5.5% 6.2% 5.4% 6.6% 5.3% 5.2% 5.6% 5.0% 5.4% 5.3% 5.3% 4.8% 6.4%
3.6% 6.6% 6.1% 5.1% 5.8% 5.0% 4.8% 4.1% 3.9% 4.1% 3.9% 4.1% 3.6% 4.3% 4.0% 3.9% 3.7% 3.4% 3.8% 4.8% 4.0% 3.8% 4.1% 3.3% 3.7% 3.8% 3.5% 3.6% 3.7% 3.5% 3.3% 4.6%
1.8% 3.0% 3.1% 2.8% 2.7% 2.7% 3.0% 2.2% 2.1% 2.3% 2.1% 2.1% 1.8% 2.2% 1.9% 1.9% 2.3% 1.9% 1.9% 2.6% 2.0% 2.3% 2.1% 1.6% 1.9% 2.0% 2.0% 1.5% 1.8% 1.6% 1.9% 2.2%
8.4% 10.2% 12.0% 12.3% 11.9% 11.1% 11.9% 10.8% 9.9% 9.6%
10.3% 9.1%
10.8% 7.7% 9.3% 8.2% 8.5%
10.4% 8.6% 7.4% 7.4% 8.7% 7.5% 9.5% 9.0% 8.6% 9.0% 7.3% 7.6% 8.1% 8.6% 5.6%
37.0%45.0% 45.1%44.2%44.0%43.5%43.3%40.7%39.2% 40.0% 39.7%38.9% 39.0%38.5% 37.9% 38.1% 38.3% 38.4%37.4% 38.0% 37.8% 37.6% 37.8% 37.2% 37.9% 36.7% 36.9% 35.8% 36.8% 36.9% 36.3% 39.5%
VA Office of Inspector General 125

Review of State Variances in VA Disability Compensation Payments
Appendix D
Veterans Receiving
State
Compensation Combined Degree of Disability Average
Degree of Disability
Average Annual
Payment Number 0% 10% 20% 30% 40% 50% 60% 70% 80% 90% 100% California $8,099 229,915 0.8% 32.8% 15.5% 12.5% 8.9% 5.2% 5.6% 5.4% 3.4% 1.7% 7.9% 35.7% Colorado $7,944 49,580 0.5% 29.9% 16.2% 13.1% 10.1% 5.8% 6.0% 4.4% 2.8% 1.7% 9.6% 37.1% Maryland $7,944 36,808 0.6% 27.7% 16.3% 13.8% 10.9% 6.3% 6.5% 4.3% 3.1% 1.6% 9.1% 37.5% Utah $7,906 14,748 0.5% 29.7% 16.6% 12.4% 9.9% 6.3% 6.4% 5.4% 3.3% 2.0% 7.5% 36.7% Pennsylvania $7,898 101,755 0.8% 32.7% 15.5% 12.9% 8.9% 5.5% 5.9% 5.3% 3.2% 1.6% 7.6% 35.5% Iowa $7,797 20,642 0.6% 32.7% 15.7% 12.6% 9.4% 5.6% 6.0% 5.0% 3.2% 1.8% 7.4% 35.5% Wyoming $7,778 5,871 0.5% 30.5% 17.9% 12.5% 9.7% 5.6% 5.9% 4.2% 2.9% 1.6% 8.7% 36.1% Georgia $7,775 84,118 0.4% 30.6% 17.6% 13.1% 10.0% 5.5% 6.0% 4.5% 3.0% 1.5% 7.8% 35.6% Virginia $7,716 81,297 0.4% 26.8% 17.0% 14.8% 11.4% 6.3% 7.0% 4.9% 3.3% 1.6% 6.5% 36.4% Kansas $7,579 24,213 0.5% 33.4% 17.2% 12.9% 8.9% 4.8% 5.4% 4.2% 2.7% 1.4% 8.6% 34.8% Massachusetts $7,529 53,584 0.7% 37.8% 13.8% 12.8% 7.2% 5.1% 5.4% 5.6% 2.9% 1.0% 7.6% 33.9% Delaware $7,453 7,584 0.6% 31.7% 17.3% 13.3% 9.5% 5.9% 5.9% 3.7% 2.2% 1.3% 8.7% 35.1% New York $7,348 119,963 0.9% 38.4% 14.5% 11.8% 7.5% 5.1% 4.9% 4.6% 2.8% 1.3% 8.1% 33.6% Indiana $7,287 42,855 0.6% 32.9% 17.1% 12.8% 9.5% 5.4% 6.0% 4.5% 2.9% 1.5% 6.6% 34.2% Michigan $7,241 64,204 0.9% 34.7% 16.4% 13.3% 8.6% 5.3% 5.5% 4.4% 2.6% 1.3% 7.0% 33.5% Connecticut $7,204 21,005 0.9% 37.2% 15.5% 12.0% 7.8% 4.9% 5.0% 4.6% 2.6% 1.3% 8.1% 33.6% Ohio $7,039 85,527 0.8% 34.5% 17.7% 12.9% 8.8% 5.3% 5.3% 3.9% 2.6% 1.3% 6.9% 33.1% New Jersey $7,028 46,903 0.8% 39.0% 14.9% 11.6% 7.5% 5.2% 5.1% 4.0% 2.7% 1.7% 7.5% 33.0% Illinois $6,961 62,169 1.0% 35.7% 16.7% 12.6% 8.6% 5.1% 5.0% 4.4% 2.7% 1.4% 6.7% 32.9%
VA Office of Inspector General 126

Review of State Variances in VA Disability Compensation Payments
Appendix D
Table 20. Veterans with 10 Percent and 100 Percent Disabilities by State–FY 2004
State
Veterans Receiving Compensation 10 Percent Disabled 100 Percent Disabled
Annual Average Payment Number Number
Percent of Total
Veterans Number
Percent of Total
Veterans 50-State Totals New Mexico Maine Arkansas West Virginia Oklahoma Oregon VermontArizona North Carolina KentuckyLouisiana MississippiTexas Rhode Island Montana Nevada Tennessee Florida Nebraska Idaho South Dakota WashingtonHawaiiSouth Carolina MinnesotaWisconsin MissouriNew Hampshire Alabama North Dakota Alaska California Maryland ColoradoUtah PennsylvaniaIowa Wyoming Georgia VirginiaKansas MassachusettsDelaware
$8,378 $12,004 $11,626 $10,968 $10,866 $10,697 $10,277
$9,649 $9,308 $9,281
$9,194 $9,114
$8,949 $8,928 $8,893 $8,871 $8,771 $8,698 $8,658 $8,623 $8,604 $8,548
$8,531 $8,491
$8,459 $8,321
$8,297 $8,232
$8,168 $8,165 $8,143 $8,138 $8,099 $7,944
$7,944 $7,906
$7,898 $7,797 $7,778 $7,775
$7,716 $7,579
$7,529 $7,453
2,493,576 25,258 18,751 31,473 20,681 51,213 35,449
6,894 50,224 90,745 37,657 37,475 25,620
208,986 17,301 12,444 20,620 54,108
179,850 23,143 14,185 9,823
85,094 15,895 44,708 39,990 44,102 49,126 13,470 54,247 10,655 11,648
229,915 36,808 49,580 14,748
101,755 20,642 5,871
84,118 81,297 24,213 53,584 7,584
763,100 5,977 4,434 7,125 4,892
11,753 8,744 1,879
14,241 22,643 10,060 10,751 7,066
57,904 5,616 3,594 5,828
15,228 54,880
7,130 3,936 2,958
24,810 4,716
12,619 13,368 14,124 15,377
4,018 15,996 3,498 2,664
75,476 10,187 14,807 4,382
33,268 6,746 1,788
25,745 21,828
8,084 20,269 2,402
30.6% 23.7% 23.6% 22.6% 23.7% 22.9% 24.7% 27.3% 28.4% 25.0% 26.7% 28.7% 27.6% 27.7% 32.5% 28.9% 28.3% 28.1% 30.5% 30.8% 27.7% 30.1% 29.2% 29.7% 28.2% 33.4% 32.0% 31.3% 29.8% 29.5% 32.8% 22.9% 32.8% 27.7% 29.9% 29.7% 32.7% 32.7% 30.5% 30.6% 26.8% 33.4% 37.8% 31.7%
208,779 2,573 2,255 3,868 2,454 5,668 4,223
744 4,994 8,670 3,876 3,394 2,763
16,030 1,608 1,019 1,756 5,631
15,468 1,707 1,045
854 6,403 1,509 4,003 3,428 3,965 3,569 1,026 4,405
919 658
18,218 3,335 4,745 1,105 7,775 1,535
512 6,588 5,250 2,085 4,094
659
8.4% 10.2% 12.0% 12.3% 11.9% 11.1% 11.9% 10.8% 9.9% 9.6%
10.3% 9.1%
10.8% 7.7% 9.3% 8.2% 8.5%
10.4% 8.6% 7.4% 7.4% 8.7% 7.5% 9.5% 9.0% 8.6% 9.0% 7.3% 7.6% 8.1% 8.6% 5.6% 7.9% 9.1% 9.6% 7.5% 7.6% 7.4% 8.7% 7.8% 6.5% 8.6% 7.6% 8.7%
VA Office of Inspector General 127
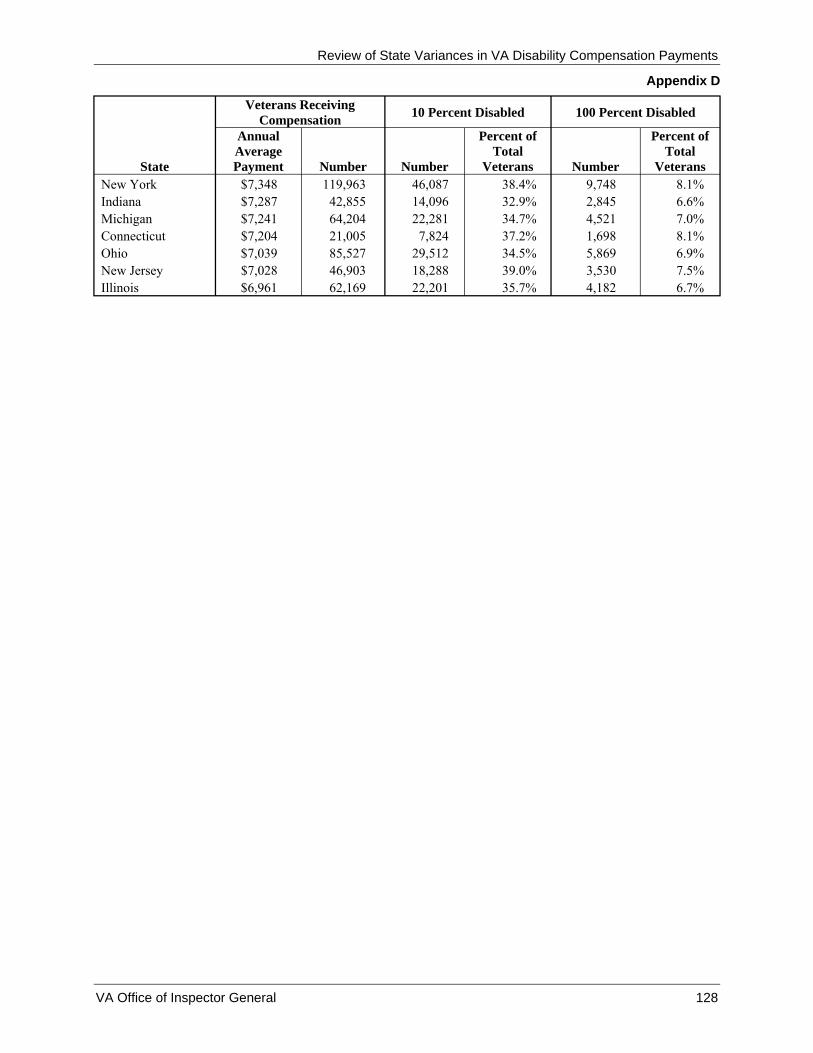
Review of State Variances in VA Disability Compensation Payments
Appendix D
Veterans Receiving Compensation 10 Percent Disabled 100 Percent Disabled
Annual Percent of Percent of
State Average Payment Number Number
Total Veterans Number
Total Veterans
New York $7,348 119,963 46,087 38.4% 9,748 8.1% Indiana $7,287 42,855 14,096 32.9% 2,845 6.6% Michigan $7,241 64,204 22,281 34.7% 4,521 7.0% Connecticut $7,204 21,005 7,824 37.2% 1,698 8.1% Ohio $7,039 85,527 29,512 34.5% 5,869 6.9% New Jersey $7,028 46,903 18,288 39.0% 3,530 7.5% Illinois $6,961 62,169 22,201 35.7% 4,182 6.7%
VA Office of Inspector General 128

Review of State Variances in VA Disability Compensation Payments
Appendix D
Table 21. Veterans with 10 Percent, Individual Unemployability, and Schedular 100 Percent Disabilities by State–FY 2004 Veterans with Veterans with
Veterans Receiving Veterans with 10 Individual Schedular 100 Percent
State
Compensation Percent Disability Unemployability Disability All Other Veterans Average Annual
Payment Number
Percent of Total Veterans
Annual Average Payment
Percent of Total Veterans
Average Annual
Payment
Percent of Total Veterans
Average Annual
Payment
Percent of Total Veterans
Average Annual
Payment 50-State Totals $8,378 2,493,576 30.6% $1,280 7.9% $28,349 8.4% $30,940 53.1% $5,943 New Mexico $12,004 25,258 23.7% $1,281 20.1% $28,258 10.2% $31,133 46.1% $6,190 Maine $11,626 18,751 23.6% $1,282 17.1% $28,289 12.0% $29,998 47.3% $6,112 Arkansas $10,968 31,473 22.6% $1,282 12.8% $28,466 12.3% $30,586 52.3% $6,271 West Virginia $10,866 20,681 23.7% $1,280 13.3% $28,469 11.9% $30,152 51.2% $6,271 Oklahoma $10,697 51,213 22.9% $1,280 12.9% $28,372 11.1% $30,538 53.0% $6,315 Oregon $10,277 35,449 24.7% $1,280 9.7% $28,222 11.9% $31,164 53.7% $6,535 Vermont $9,649 6,894 27.3% $1,278 10.0% $28,402 10.8% $30,201 52.0% $6,182 Arizona $9,308 50,224 28.4% $1,282 9.8% $28,269 9.9% $31,459 51.9% $5,889 North Carolina $9,281 90,745 25.0% $1,282 8.8% $28,551 9.6% $30,912 56.7% $6,168 Kentucky $9,194 37,657 26.7% $1,281 8.5% $28,436 10.3% $30,616 54.5% $6,018 Louisiana $9,114 37,475 28.7% $1,282 9.8% $28,450 9.1% $30,818 52.5% $6,037 Mississippi $8,949 25,620 27.6% $1,282 7.3% $28,441 10.8% $30,751 54.3% $5,876 Texas $8,928 208,986 27.7% $1,282 9.8% $28,458 7.7% $31,237 54.8% $6,169 Rhode Island $8,893 17,301 32.5% $1,277 10.1% $28,127 9.3% $30,077 48.1% $5,901 Montana $8,871 12,444 28.9% $1,283 10.0% $28,369 8.2% $31,041 52.9% $5,899 Nevada $8,771 20,620 28.3% $1,284 9.0% $28,190 8.5% $31,293 54.3% $5,933 Tennessee $8,698 54,108 28.1% $1,282 6.5% $28,424 10.4% $30,906 54.9% $5,945 Florida $8,658 179,850 30.5% $1,281 8.9% $28,321 8.6% $31,517 52.0% $5,849 Nebraska $8,623 23,143 30.8% $1,278 8.8% $28,355 7.4% $31,449 53.0% $6,437 Idaho $8,604 14,185 27.7% $1,281 9.0% $28,341 7.4% $31,366 55.9% $6,060 South Dakota $8,548 9,823 30.1% $1,277 8.2% $28,367 8.7% $30,559 53.0% $5,991 Washington $8,531 85,094 29.2% $1,280 8.6% $28,286 7.5% $30,936 54.7% $6,204 Hawaii $8,491 15,895 29.7% $1,281 7.8% $28,492 9.5% $30,337 53.1% $5,694 South Carolina $8,459 44,708 28.2% $1,282 6.8% $28,458 9.0% $31,193 56.0% $6,002 Minnesota $8,321 39,990 33.4% $1,279 8.0% $28,242 8.6% $30,686 50.0% $6,012 Wisconsin $8,297 44,102 32.0% $1,279 7.2% $28,271 9.0% $30,648 51.7% $5,961 Missouri $8,232 49,126 31.3% $1,280 9.4% $28,335 7.3% $30,953 52.0% $5,613 New Hampshire $8,168 13,470 29.8% $1,282 7.9% $28,322 7.6% $30,513 54.7% $5,906
VA Office of Inspector General 129
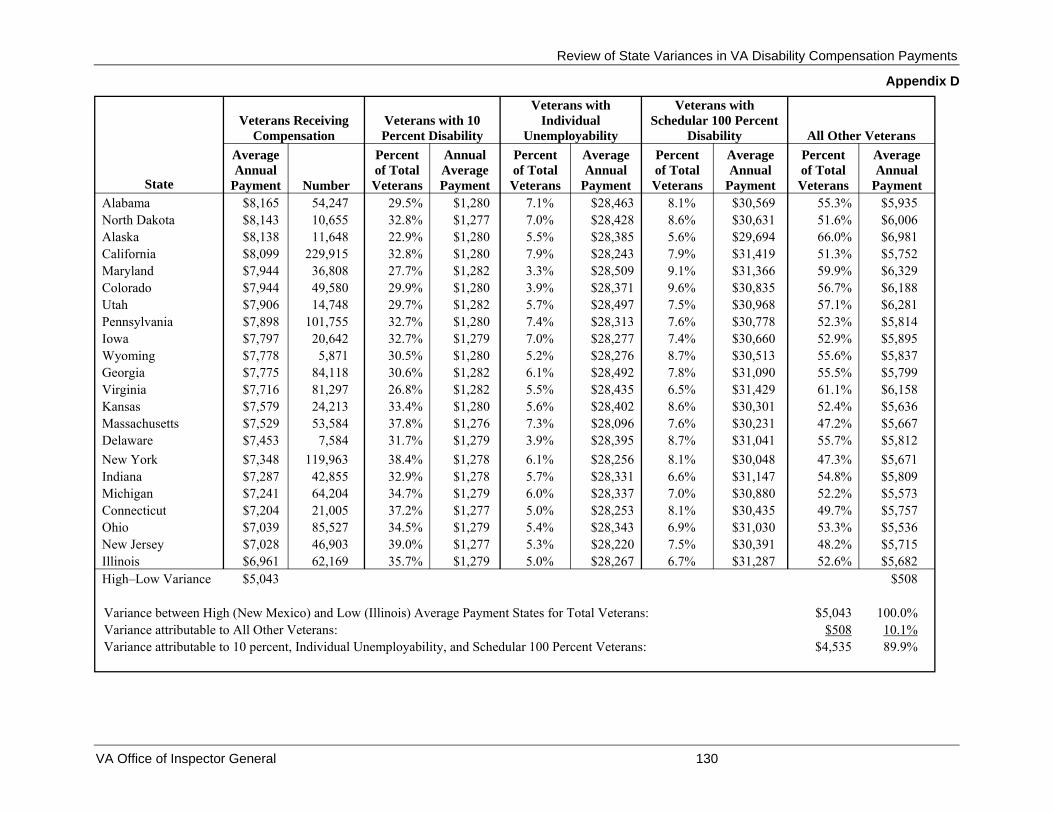
Review of State Variances in VA Disability Compensation Payments
Appendix D
Veterans with Veterans with Veterans Receiving Veterans with 10 Individual Schedular 100 Percent
State
Compensation Percent Disability Unemployability Disability All Other Veterans Average Annual
Payment Number
Percent of Total Veterans
Annual Average Payment
Percent of Total Veterans
Average Annual
Payment
Percent of Total Veterans
Average Annual
Payment
Percent of Total Veterans
Average Annual
Payment Alabama $8,165 54,247 29.5% $1,280 7.1% $28,463 8.1% $30,569 55.3% $5,935 North Dakota $8,143 10,655 32.8% $1,277 7.0% $28,428 8.6% $30,631 51.6% $6,006 Alaska $8,138 11,648 22.9% $1,280 5.5% $28,385 5.6% $29,694 66.0% $6,981 California $8,099 229,915 32.8% $1,280 7.9% $28,243 7.9% $31,419 51.3% $5,752 Maryland $7,944 36,808 27.7% $1,282 3.3% $28,509 9.1% $31,366 59.9% $6,329 Colorado $7,944 49,580 29.9% $1,280 3.9% $28,371 9.6% $30,835 56.7% $6,188 Utah $7,906 14,748 29.7% $1,282 5.7% $28,497 7.5% $30,968 57.1% $6,281 Pennsylvania $7,898 101,755 32.7% $1,280 7.4% $28,313 7.6% $30,778 52.3% $5,814 Iowa $7,797 20,642 32.7% $1,279 7.0% $28,277 7.4% $30,660 52.9% $5,895 Wyoming $7,778 5,871 30.5% $1,280 5.2% $28,276 8.7% $30,513 55.6% $5,837 Georgia $7,775 84,118 30.6% $1,282 6.1% $28,492 7.8% $31,090 55.5% $5,799 Virginia $7,716 81,297 26.8% $1,282 5.5% $28,435 6.5% $31,429 61.1% $6,158 Kansas $7,579 24,213 33.4% $1,280 5.6% $28,402 8.6% $30,301 52.4% $5,636 Massachusetts $7,529 53,584 37.8% $1,276 7.3% $28,096 7.6% $30,231 47.2% $5,667 Delaware $7,453 7,584 31.7% $1,279 3.9% $28,395 8.7% $31,041 55.7% $5,812 New York $7,348 119,963 38.4% $1,278 6.1% $28,256 8.1% $30,048 47.3% $5,671 Indiana $7,287 42,855 32.9% $1,278 5.7% $28,331 6.6% $31,147 54.8% $5,809 Michigan $7,241 64,204 34.7% $1,279 6.0% $28,337 7.0% $30,880 52.2% $5,573 Connecticut $7,204 21,005 37.2% $1,277 5.0% $28,253 8.1% $30,435 49.7% $5,757 Ohio $7,039 85,527 34.5% $1,279 5.4% $28,343 6.9% $31,030 53.3% $5,536 New Jersey $7,028 46,903 39.0% $1,277 5.3% $28,220 7.5% $30,391 48.2% $5,715 Illinois $6,961 62,169 35.7% $1,279 5.0% $28,267 6.7% $31,287 52.6% $5,682 High–Low Variance $5,043 $508
Variance between High (New Mexico) and Low (Illinois) Average Payment States for Total Veterans: $5,043 100.0% Variance attributable to All Other Veterans: $508 10.1% Variance attributable to 10 percent, Individual Unemployability, and Schedular 100 Percent Veterans: $4,535 89.9%
VA Office of Inspector General 130

Review of State Variances in VA Disability Compensation Payments
Appendix D
Table 22. Veterans Average Ratings for Primary Disability by Body Systems and State–FY 2004
State
Veterans Receiving Compensation Average Disability Rating Percent
Average Annual
Payment Number Mus
culo
skel
etal
Vis
ual
Aud
itory
Syst
emic
Res
pira
tory
Car
diov
ascu
lar
Dig
estiv
e
Gen
itour
inar
y
Gyn
ecol
ogic
al
Hem
ic/L
ymph
atic
Skin
/Sca
rs
End
ocri
ne
Neu
rolo
gica
l
Men
tal
Den
tal/O
ral
50-State Totals $8,378 2,493,576 20% 32% 20% 42% 29% 30% 23% 40% 36% 49% 15% 24% 34% 58% 18% New Mexico $12,004 25,258 24% 34% 20% 42% 33% 36% 26% 47% 37% 57% 17% 28% 37% 67% 17% Maine $11,626 18,751 22% 32% 22% 46% 34% 33% 27% 34% 35% 51% 16% 26% 36% 67% 19% Arkansas $10,968 31,473 25% 34% 20% 49% 38% 43% 25% 43% 37% 52% 17% 24% 41% 65% 21% West Virginia $10,866 20,681 23% 35% 22% 41% 35% 39% 26% 43% 37% 55% 16% 25% 36% 61% 15% Oklahoma $10,697 51,213 21% 36% 23% 51% 36% 35% 24% 43% 38% 46% 17% 26% 36% 65% 16% Oregon $10,277 35,449 23% 34% 21% 46% 32% 37% 28% 42% 36% 53% 16% 28% 37% 66% 17% Vermont $9,649 6,894 24% 34% 19% 29% 28% 29% 26% 43% 36% 43% 15% 24% 35% 63% 16% Arizona $9,308 50,224 21% 33% 18% 43% 30% 31% 24% 39% 37% 50% 15% 24% 35% 65% 18% North Carolina $9,281 90,745 20% 34% 20% 48% 34% 34% 24% 49% 36% 51% 17% 23% 32% 63% 18% Kentucky $9,194 37,657 21% 35% 23% 40% 33% 34% 24% 39% 35% 51% 14% 23% 35% 60% 20% Louisiana $9,114 37,475 21% 32% 20% 40% 32% 31% 23% 43% 35% 50% 15% 23% 34% 59% 18% Mississippi $8,949 25,620 21% 37% 23% 49% 32% 31% 23% 43% 38% 46% 16% 22% 37% 60% 20% Texas $8,928 208,986 20% 32% 20% 47% 31% 33% 23% 43% 37% 51% 16% 24% 33% 58% 18% Rhode Island $8,893 17,301 22% 31% 20% 38% 28% 29% 23% 30% 33% 46% 14% 25% 33% 60% 16% Montana $8,871 12,444 21% 33% 19% 39% 31% 30% 22% 44% 35% 55% 15% 24% 36% 57% 14% Nevada $8,771 20,620 21% 32% 20% 45% 33% 34% 22% 40% 36% 49% 15% 26% 35% 60% 17% Tennessee $8,698 54,108 20% 35% 23% 43% 33% 34% 23% 43% 36% 49% 15% 22% 34% 64% 20% Florida $8,658 179,850 20% 33% 22% 43% 31% 31% 23% 41% 36% 52% 15% 24% 34% 60% 17% Nebraska $8,623 23,143 22% 30% 19% 37% 32% 31% 24% 40% 36% 48% 15% 23% 34% 58% 14% Idaho $8,604 14,185 22% 33% 19% 32% 31% 31% 25% 38% 36% 53% 15% 25% 37% 57% 15% South Dakota $8,548 9,823 20% 32% 22% 44% 33% 35% 23% 40% 38% 46% 15% 23% 34% 60% 10% Washington $8,531 85,094 19% 30% 15% 45% 30% 29% 24% 38% 35% 52% 15% 28% 32% 61% 17% Hawaii $8,491 15,895 20% 29% 20% 47% 25% 26% 22% 43% 37% 47% 15% 25% 33% 67% 16% South Carolina $8,459 44,708 19% 33% 20% 43% 35% 29% 22% 48% 36% 50% 15% 22% 34% 60% 20% Minnesota $8,321 39,990 22% 32% 20% 38% 30% 32% 25% 38% 35% 48% 14% 23% 32% 58% 18%
VA Office of Inspector General 131
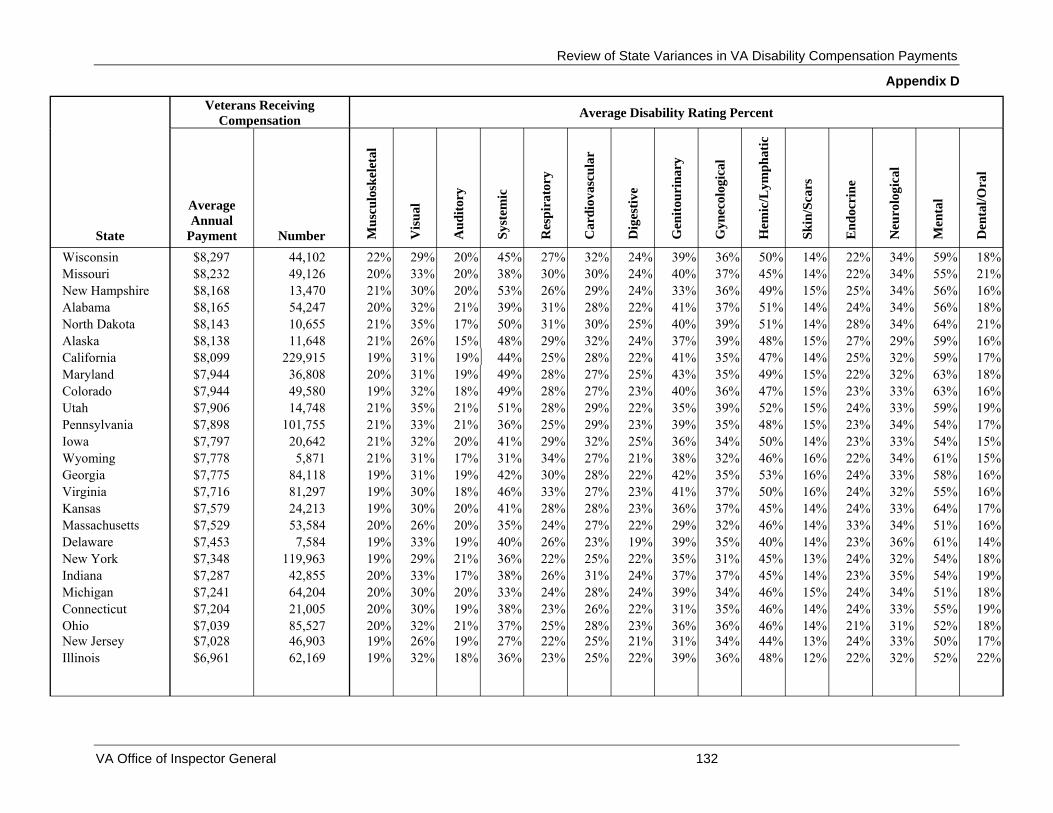
Review of State Variances in VA Disability Compensation Payments
Veterans Receiving Average Disability Rating Percent Compensation
Average Annual
State Payment Number Wisconsin $8,297 44,102 22% 29% 20% 45% 27% 32% 24% 39% 36% 50% 14% 22% 34% 59% 18% Missouri $8,232 49,126 20% 33% 20% 38% 30% 30% 24% 40% 37% 45% 14% 22% 34% 55% 21% New Hampshire $8,168 13,470 21% 30% 20% 53% 26% 29% 24% 33% 36% 49% 15% 25% 34% 56% 16% Alabama $8,165 54,247 20% 32% 21% 39% 31% 28% 22% 41% 37% 51% 14% 24% 34% 56% 18% North Dakota $8,143 10,655 21% 35% 17% 50% 31% 30% 25% 40% 39% 51% 14% 28% 34% 64% 21% Alaska $8,138 11,648 21% 26% 15% 48% 29% 32% 24% 37% 39% 48% 15% 27% 29% 59% 16% California $8,099 229,915 19% 31% 19% 44% 25% 28% 22% 41% 35% 47% 14% 25% 32% 59% 17% Maryland
Mus
culo
skel
etal
$7,944 36,808 20% 31% 19% 49% 28% 27% 25% 43% 35% 49% 15% 22% 32% 63% 18%
Colorado $7,944 49,580 19% 32% 18% 49% 28% 27% 23% 40% 36% 47% 15% 23% 33% 63% 16% Utah $7,906 14,748 21% 35% 21% 51% 28% 29% 22% 35% 39% 52% 15% 24% 33% 59% 19%
Vis
ual
Pennsylvania $7,898 101,755 21% 33% 21% 36% 25% 29% 23% 39% 35% 48% 15% 23% 34% 54% 17% Iowa $7,797 20,642 21% 32% 20% 41% 29% 32% 25% 36% 34% 50% 14% 23% 33% 54% 15% Wyoming $7,778 5,871 21% 31% 17% 31% 34% 27% 21% 38% 32% 46% 16% 22% 34% 61% 15%
Aud
itory
Georgia $7,775 84,118 19% 31% 19% 42% 30% 28% 22% 42% 35% 53% 16% 24% 33% 58% 16% Virginia $7,716 81,297 19% 30% 18% 46% 33% 27% 23% 41% 37% 50% 16% 24% 32% 55% 16%
Syst
emic
Kansas $7,579 24,213 19% 30% 20% 41% 28% 28% 23% 36% 37% 45% 14% 24% 33% 64% 17% Massachusetts $7,529 53,584 20% 26% 20% 35% 24% 27% 22% 29% 32% 46% 14% 33% 34% 51% 16% Delaware $7,453 7,584 19% 33% 19% 40% 26% 23% 19% 39% 35% 40% 14% 23% 36% 61% 14%
Res
pira
tory
New York $7,348 119,963 19% 29% 21% 36% 22% 25% 22% 35% 31% 45% 13% 24% 32% 54% 18% Indiana $7,287 42,855 20% 33% 17% 38% 26% 31% 24% 37% 37% 45% 14% 23% 35% 54% 19% Michigan
Car
diov
ascu
lar
$7,241 64,204 20% 30% 20% 33% 24% 28% 24% 39% 34% 46% 15% 24% 34% 51% 18% Connecticut $7,204 21,005 20% 30% 19% 38% 23% 26% 22% 31% 35% 46% 14% 24% 33% 55% 19% Ohio $7,039 85,527 20% 32% 21% 37% 25% 28% 23% 36% 36% 46% 14% 21% 31% 52% 18%
Dig
estiv
e New Jersey $7,028 46,903 19% 26% 19% 27% 22% 25% 21% 31% 34% 44% 13% 24% 33% 50% 17% Illinois $6,961 62,169 19% 32% 18% 36% 23% 25% 22% 39% 36% 48% 12% 22% 32% 52% 22%
Gen
itour
inar
y
Gyn
ecol
ogic
al
Hem
ic/L
ymph
atic
Skin
/Sca
rs
End
ocri
ne
Neu
rolo
gica
l
Men
tal
Den
tal/O
ral
Appendix D
VA Office of Inspector General 132

Review of State Variances in VA Disability Compensation Payments
Appendix D
State
Veterans Receiving Compensation Average Disability Rating Percent
Average Annual
Payment Number Mus
culo
skel
etal
Vis
ual
Aud
itory
Syst
emic
Res
pira
tory
Car
diov
ascu
lar
Dig
estiv
e
Gen
itour
inar
y
Gyn
ecol
ogic
al
Hem
ic/L
ymph
atic
Skin
/Sca
rs
End
ocri
ne
Neu
rolo
gica
l
Men
tal
Den
tal/O
ral
High Average Degree of Disability 25% 37% 23% 53% 38% 43% 28% 49% 39% 57% 17% 28% 41% 67% 22%
Low Average Degree of Disability 19% 26% 15% 27% 22% 23% 19% 29% 31% 40% 12% 21% 29% 50% 10%
Range 6% 11% 8% 26% 16% 20% 9% 20% 8% 17% 5% 7% 12% 17% 12%
VA Office of Inspector General 133

Review of State Variances in VA Disability Compensation Payments
Appendix D
Table 23. Veterans with 100 Percent Disability with PTSD or PTSD and Individual Unemployability (IU) Ratings–FY 2004
State
Veterans Receiving Compensation
Veterans with 100 Percent Disability and PTSD or PTSD and IU Rating
All Other Veterans
Average Annual
Payment Number
Percent with
PTSD
Percent with PTSD
and IU
Combined Percent
PTSD and PTSD/IU
Combined Average Annual
Payment
Average Annual
Payment 50-State Totals New Mexico Maine Arkansas West Virginia Oklahoma Oregon Vermont Arizona North Carolina Kentucky Louisiana Mississippi Texas
Rhode Island Montana Nevada Tennessee Florida Nebraska Idaho South Dakota Washington Hawaii South Carolina Minnesota Wisconsin Missouri New Hampshire
$8,378 $12,004 $11,626 $10,968 $10,866 $10,697 $10,277 $9,649 $9,308 $9,281 $9,194 $9,114 $8,949 $8,928 $8,893 $8,871 $8,771 $8,698 $8,658 $8,623 $8,604 $8,548 $8,531 $8,491 $8,459 $8,321 $8,297 $8,232 $8,168
2,493,576 25,258 18,751 31,473 20,681 51,213 35,449 6,894
50,224 90,745 37,657 37,475 25,620
208,986 17,301 12,444 20,620 54,108
179,850 23,143 14,185 9,823
85,094 15,895 44,708 39,990 44,102 49,126 13,470
2.0% 3.2% 4.5% 3.1% 4.5% 3.7% 3.9% 4.0% 3.1% 2.4% 3.2% 1.9% 2.5% 1.4% 2.5% 2.0% 1.6% 2.9% 1.5% 1.0% 1.6% 1.8% 2.1% 3.8% 2.2% 2.0% 2.2% 1.3% 1.9%
2.1% 9.4% 6.5% 2.3% 5.1% 3.3% 3.6% 2.2% 2.3% 2.1% 1.7% 2.8% 1.0% 2.1% 3.7% 2.8% 2.1% 1.2% 1.9% 2.0% 2.6% 2.6% 3.4% 2.2% 1.9% 2.4% 1.7% 2.5% 2.1%
4.1% 12.6% 11.0%
5.4% 9.6% 7.1% 7.4% 6.2% 5.4% 4.5% 4.9% 4.7% 3.5% 3.4% 6.2% 4.9% 3.7% 4.1% 3.4% 3.0% 4.2% 4.4% 5.5% 6.0% 4.1% 4.4% 3.9% 3.7% 4.0%
$28,387 $28,310 $28,191 $28,535 $28,517 $28,537 $28,363 $28,294 $28,351 $28,640 $28,653 $28,571 $28,569 $28,535 $28,178 $28,396 $28,348 $28,682 $28,323 $28,444 $28,316 $28,387 $28,239 $28,452 $28,526 $28,344 $28,362 $28,283 $28,261
$7,523$9,663$9,571$9,966$8,996$9,338$8,825$8,427$8,218$8,376$8,195$8,159$8,248$8,230$7,613$7,871$8,019$7,844$7,963$8,012$7,736$7,638 $7,390$7,221$7,598$7,407 $7,484$7,454$7,324
VA Office of Inspector General 134

Review of State Variances in VA Disability Compensation Payments
Appendix D
Veterans Receiving Veterans with 100 Percent Disability All Other Compensation and PTSD or PTSD and IU Rating Veterans
Combined Combined Average Annual
Percent with
Percent with PTSD
Percent PTSD and
Average Annual
Average Annual
State Payment Number PTSD and IU PTSD/IU Payment Payment Alabama $8,165 54,247 2.1% 1.9% 4.0% $28,525 $7,321 North Dakota $8,143 10,655 2.7% 1.0% 3.6% $28,389 $7,384 Alaska $8,138 11,648 1.7% 1.1% 2.8% $28,059 $7,572 California $8,099 229,915 2.1% 2.7% 4.8% $28,280 $7,085 Maryland $7,944 36,808 2.1% 0.7% 2.9% $28,578 $7,336 Colorado $7,944 49,580 3.1% 0.7% 3.8% $28,544 $7,126 Utah $7,906 14,748 1.9% 1.8% 3.7% $28,489 $7,112 Pennsylvania $7,898 101,755 1.4% 2.1% 3.5% $28,355 $7,158 Iowa $7,797 20,642 1.2% 1.8% 3.0% $28,159 $7,164 Wyoming $7,778 5,871 2.5% 1.1% 3.6% $28,320 $7,016 Georgia $7,775 84,118 1.3% 1.2% 2.5% $28,590 $7,236 Virginia $7,716 81,297 0.8% 1.2% 2.0% $28,395 $7,289 Kansas $7,579 24,213 2.7% 1.4% 4.0% $28,247 $6,709 Massachusetts $7,529 53,584 1.6% 2.7% 4.3% $28,191 $6,612 Delaware $7,453 7,584 2.8% 0.8% 3.5% $28,711 $6,671 New York $7,348 119,963 1.9% 2.1% 4.0% $28,254 $6,474 Indiana $7,287 42,855 1.0% 1.3% 2.3% $28,202 $6,795 Michigan $7,241 64,204 1.1% 1.2% 2.3% $28,225 $6,744 Connecticut $7,204 21,005 1.9% 1.6% 3.6% $28,174 $6,430 Ohio $7,039 85,527 1.0% 1.2% 2.2% $28,315 $6,568 New Jersey $7,028 46,903 1.8% 1.7% 3.5% $28,300 $6,251 Illinois $6,961 62,169 1.3% 1.5% 2.8% $28,240 $6,340
Variance between High (New Mexico) and Low (Illinois) State Average Annual Payments for Total Veterans $5,043 (100%)
Variance Attributed to Veterans with 100 Percent Disability with PTSD and PTSD/IU $1,720 (34.1%)
Variance between Average Annual Payments for All Other Veterans $3,323 (65.9%)
VA Office of Inspector General 135

Review of State Variances in VA Disability Compensation Payments
Appendix D
Table 24. Veterans with Systemic Disabilities by Degree of Disability and State–FY 2004
State
Average Annual
Payment
Veterans with Systemic Disability Percent of Total Veterans
Average Degree of Disability
Percent of Veterans at Each Degree of Disability
0 10 20 30 40 50 60 70 80 90 100 50-State Totals $8,378 0.5% 42 9.7% 20.9% 4.0% 20.3% 3.7% 0.9% 22.0% 0.2% 1.1% 0.0% 17.2% New Mexico $12,004 0.2% 42 4.1% 34.7% 0.0% 12.2% 8.2% 2.0% 20.4% 0.0% 0.0% 0.0% 18.4% Maine $11,626 0.2% 46 17.6% 8.8% 5.9% 14.7% 5.9% 0.0% 23.5% 0.0% 0.0% 0.0% 23.5%
Arkansas $10,968 0.2% 49 8.5% 13.6% 3.4% 18.6% 5.1% 0.0% 28.8% 0.0% 0.0% 0.0% 22.0% West Virginia $10,866 0.2% 41 5.9% 20.6% 11.8% 11.8% 11.8% 0.0% 23.5% 0.0% 0.0% 0.0% 14.7% Oklahoma $10,697 0.2% 51 6.3% 12.5% 2.1% 20.8% 8.3% 2.1% 21.9% 0.0% 0.0% 0.0% 26.0% Oregon $10,277 0.2% 46 17.3% 17.3% 5.3% 8.0% 1.3% 0.0% 22.7% 0.0% 5.3% 0.0% 22.7% Vermont $9,649 0.2% 29 17.6% 23.5% 11.8% 11.8% 5.9% 11.8% 11.8% 0.0% 0.0% 0.0% 5.9% Arizona $9,308 0.2% 43 14.4% 15.2% 5.6% 16.8% 5.6% 1.6% 20.8% 0.0% 1.6% 0.0% 18.4%
North Carolina $9,281 0.3% 48 5.2% 19.7% 6.4% 15.9% 3.0% 1.3% 26.2% 0.4% 0.9% 0.0% 21.0% Kentucky $9,194 0.2% 40 7.0% 26.3% 3.5% 21.1% 5.3% 0.0% 21.1% 0.0% 0.0% 0.0% 15.8% Louisiana $9,114 0.2% 40 13.1% 21.4% 3.6% 20.2% 1.2% 0.0% 25.0% 1.2% 0.0% 0.0% 14.3% Mississippi $8,949 0.2% 49 8.3% 18.3% 5.0% 13.3% 0.0% 3.3% 26.7% 0.0% 5.0% 0.0% 20.0% Texas $8,928 0.2% 47 5.0% 18.4% 3.8% 22.1% 3.5% 0.8% 26.7% 0.4% 0.6% 0.0% 18.8%
Rhode Island $8,893 0.2% 38 14.6% 17.1% 4.9% 19.5% 2.4% 4.9% 24.4% 0.0% 4.9% 0.0% 7.3% Montana $8,871 0.3% 39 9.4% 21.9% 9.4% 12.5% 9.4% 0.0% 25.0% 0.0% 0.0% 0.0% 12.5% Nevada $8,771 0.3% 45 5.3% 22.8% 5.3% 22.8% 5.3% 0.0% 14.0% 0.0% 1.8% 0.0% 22.8% Tennessee $8,698 0.2% 43 10.2% 23.4% 4.7% 14.1% 4.7% 2.3% 19.5% 0.0% 1.6% 0.0% 19.5% Florida $8,658 0.3% 43 6.7% 20.9% 4.7% 21.3% 3.5% 1.2% 24.4% 0.0% 0.6% 0.0% 16.7% Nebraska $8,623 0.2% 37 27.5% 12.5% 2.5% 15.0% 5.0% 0.0% 20.0% 2.5% 2.5% 0.0% 12.5% Idaho $8,604 0.3% 32 20.0% 25.0% 7.5% 12.5% 5.0% 0.0% 20.0% 0.0% 0.0% 0.0% 10.0%
South Dakota $8,548 0.3% 44 19.4% 9.7% 6.5% 12.9% 6.5% 0.0% 22.6% 0.0% 3.2% 0.0% 19.4% Washington $8,531 0.2% 45 10.7% 17.6% 2.4% 17.1% 4.4% 1.0% 27.8% 0.5% 0.5% 0.0% 18.0% Hawaii $8,491 0.3% 47 16.3% 18.6% 0.0% 14.0% 4.7% 0.0% 18.6% 0.0% 0.0% 0.0% 27.9%
South Carolina $8,459 0.3% 43 8.5% 20.8% 2.3% 25.4% 3.8% 0.0% 19.2% 0.0% 0.8% 0.0% 19.2% Minnesota $8,321 0.2% 38 22.0% 20.7% 3.7% 9.8% 4.9% 0.0% 20.7% 0.0% 1.2% 0.0% 17.1% Wisconsin $8,297 0.2% 45 12.7% 13.9% 7.6% 15.2% 2.5% 0.0% 29.1% 0.0% 0.0% 0.0% 19.0%
VA Office of Inspector General 136
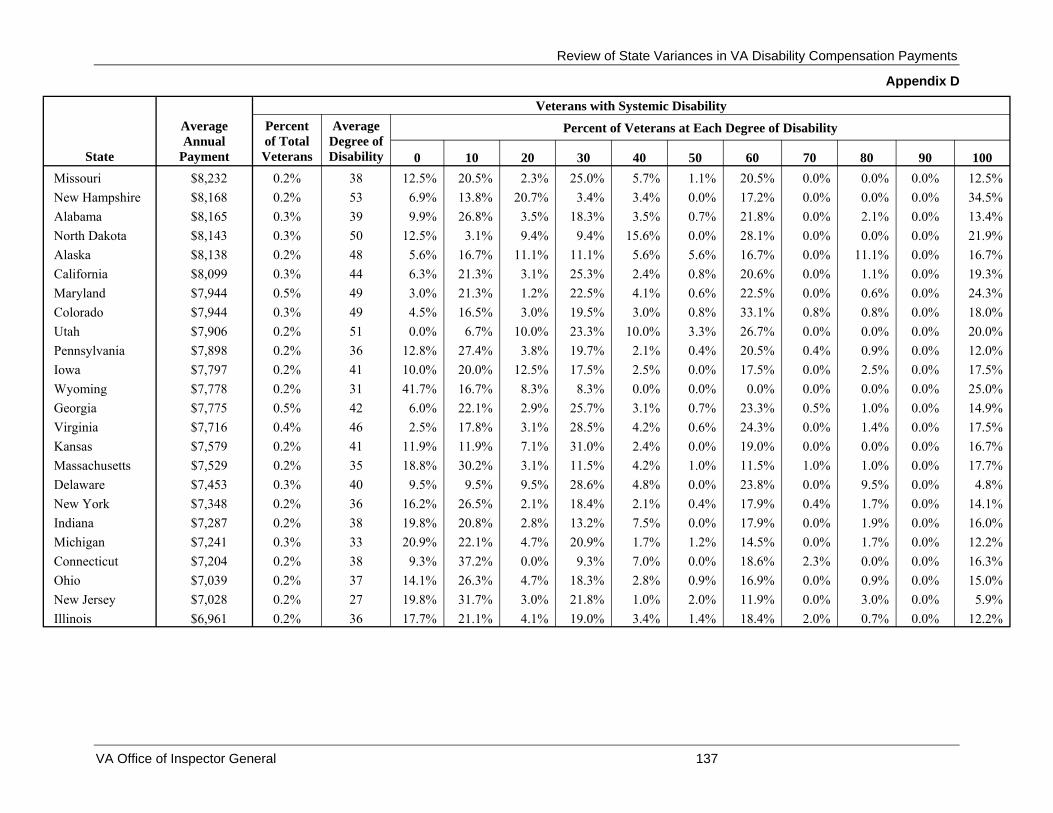
Review of State Variances in VA Disability Compensation Payments
Appendix D
State
Average Annual
Payment
Veterans with Systemic Disability Percent of Total Veterans
Average Degree of Disability
Percent of Veterans at Each Degree of Disability
0 10 20 30 40 50 60 70 80 90 100 Missouri $8,232 0.2% 38 12.5% 20.5% 2.3% 25.0% 5.7% 1.1% 20.5% 0.0% 0.0% 0.0% 12.5%
New Hampshire $8,168 0.2% 53 6.9% 13.8% 20.7% 3.4% 3.4% 0.0% 17.2% 0.0% 0.0% 0.0% 34.5% Alabama $8,165 0.3% 39 9.9% 26.8% 3.5% 18.3% 3.5% 0.7% 21.8% 0.0% 2.1% 0.0% 13.4%
North Dakota $8,143 0.3% 50 12.5% 3.1% 9.4% 9.4% 15.6% 0.0% 28.1% 0.0% 0.0% 0.0% 21.9% Alaska $8,138 0.2% 48 5.6% 16.7% 11.1% 11.1% 5.6% 5.6% 16.7% 0.0% 11.1% 0.0% 16.7%
California $8,099 0.3% 44 6.3% 21.3% 3.1% 25.3% 2.4% 0.8% 20.6% 0.0% 1.1% 0.0% 19.3% Maryland $7,944 0.5% 49 3.0% 21.3% 1.2% 22.5% 4.1% 0.6% 22.5% 0.0% 0.6% 0.0% 24.3% Colorado $7,944 0.3% 49 4.5% 16.5% 3.0% 19.5% 3.0% 0.8% 33.1% 0.8% 0.8% 0.0% 18.0% Utah $7,906 0.2% 51 0.0% 6.7% 10.0% 23.3% 10.0% 3.3% 26.7% 0.0% 0.0% 0.0% 20.0% Pennsylvania $7,898 0.2% 36 12.8% 27.4% 3.8% 19.7% 2.1% 0.4% 20.5% 0.4% 0.9% 0.0% 12.0% Iowa $7,797 0.2% 41 10.0% 20.0% 12.5% 17.5% 2.5% 0.0% 17.5% 0.0% 2.5% 0.0% 17.5% Wyoming $7,778 0.2% 31 41.7% 16.7% 8.3% 8.3% 0.0% 0.0% 0.0% 0.0% 0.0% 0.0% 25.0% Georgia $7,775 0.5% 42 6.0% 22.1% 2.9% 25.7% 3.1% 0.7% 23.3% 0.5% 1.0% 0.0% 14.9% Virginia $7,716 0.4% 46 2.5% 17.8% 3.1% 28.5% 4.2% 0.6% 24.3% 0.0% 1.4% 0.0% 17.5% Kansas $7,579 0.2% 41 11.9% 11.9% 7.1% 31.0% 2.4% 0.0% 19.0% 0.0% 0.0% 0.0% 16.7% Massachusetts $7,529 0.2% 35 18.8% 30.2% 3.1% 11.5% 4.2% 1.0% 11.5% 1.0% 1.0% 0.0% 17.7% Delaware $7,453 0.3% 40 9.5% 9.5% 9.5% 28.6% 4.8% 0.0% 23.8% 0.0% 9.5% 0.0% 4.8% New York $7,348 0.2% 36 16.2% 26.5% 2.1% 18.4% 2.1% 0.4% 17.9% 0.4% 1.7% 0.0% 14.1% Indiana $7,287 0.2% 38 19.8% 20.8% 2.8% 13.2% 7.5% 0.0% 17.9% 0.0% 1.9% 0.0% 16.0% Michigan $7,241 0.3% 33 20.9% 22.1% 4.7% 20.9% 1.7% 1.2% 14.5% 0.0% 1.7% 0.0% 12.2%
Connecticut $7,204 0.2% 38 9.3% 37.2% 0.0% 9.3% 7.0% 0.0% 18.6% 2.3% 0.0% 0.0% 16.3% Ohio $7,039 0.2% 37 14.1% 26.3% 4.7% 18.3% 2.8% 0.9% 16.9% 0.0% 0.9% 0.0% 15.0%
New Jersey $7,028 0.2% 27 19.8% 31.7% 3.0% 21.8% 1.0% 2.0% 11.9% 0.0% 3.0% 0.0% 5.9% Illinois $6,961 0.2% 36 17.7% 21.1% 4.1% 19.0% 3.4% 1.4% 18.4% 2.0% 0.7% 0.0% 12.2%
VA Office of Inspector General 137

Review of State Variances in VA Disability Compensation Payments
Appendix D
Table 25. Veterans with Cardiovascular Disabilities by Degree of Disability and State–FY 2004
State
Average Annual
Payment
Veterans with Cardiovascular Disability Percent of Total Veterans
Average Degree of Disability
Percent of Veterans at Each Degree of Disability
0 10 20 30 40 50 60 70 80 90 100 50-State Totals $8,378 6.7% 30 1.2% 44.8% 7.4% 21.6% 2.7% 0.9% 13.2% 0.1% 0.1% 0.0% 8.0%
New Mexico $12,004 5.7% 36 1.0% 39.1% 5.9% 20.1% 3.3% 0.6% 16.4% 0.2% 0.1% 0.0% 13.1% Maine $11,626 5.0% 33 1.1% 42.2% 8.3% 18.5% 2.5% 0.6% 15.2% 0.4% 0.1% 0.0% 11.0%
Arkansas $10,968 7.3% 43 0.7% 30.6% 6.9% 17.6% 2.6% 0.9% 22.1% 0.3% 0.0% 0.0% 18.4% West Virginia $10,866 6.1% 39 1.0% 30.8% 7.2% 23.4% 3.3% 0.9% 19.4% 0.0% 0.1% 0.0% 13.7% Oklahoma $10,697 7.2% 35 0.6% 36.7% 6.2% 23.3% 3.5% 0.9% 18.8% 0.1% 0.1% 0.0% 9.8% Oregon $10,277 4.5% 37 1.7% 35.6% 6.4% 21.8% 3.7% 1.2% 14.0% 0.4% 0.1% 0.0% 15.2% Vermont $9,649 5.2% 29 1.4% 42.2% 7.0% 24.3% 4.5% 2.0% 12.8% 0.3% 0.0% 0.0% 5.6% Arizona $9,308 6.6% 31 1.2% 45.2% 6.4% 20.8% 2.5% 0.8% 13.6% 0.1% 0.0% 0.0% 9.4% North Carolina $9,281 7.5% 34 1.0% 39.1% 7.8% 22.0% 2.9% 0.5% 16.4% 0.2% 0.0% 0.0% 10.1% Kentucky $9,194 6.6% 34 1.2% 39.1% 7.1% 22.3% 2.7% 0.7% 15.9% 0.1% 0.0% 0.0% 10.9% Louisiana $9,114 7.5% 31 1.1% 43.3% 7.3% 21.1% 2.3% 0.6% 16.2% 0.0% 0.2% 0.0% 7.9% Mississippi $8,949 8.6% 31 0.9% 41.3% 7.5% 25.1% 2.9% 0.8% 13.1% 0.0% 0.2% 0.0% 8.2% Texas $8,928 7.5% 33 1.2% 40.9% 7.0% 22.4% 2.8% 0.6% 15.4% 0.1% 0.1% 0.0% 9.6%
Rhode Island $8,893 5.5% 29 1.2% 45.1% 7.3% 23.9% 1.6% 1.7% 11.5% 0.3% 0.2% 0.0% 7.4% Montana $8,871 4.6% 30 2.1% 43.1% 7.0% 24.3% 3.2% 0.5% 11.4% 0.2% 0.2% 0.0% 8.1% Nevada $8,771 8.0% 34 0.8% 41.0% 7.1% 20.1% 3.5% 1.2% 14.8% 0.1% 0.1% 0.1% 11.2% Tennessee $8,698 7.1% 34 1.4% 41.1% 6.4% 19.4% 2.9% 0.9% 16.7% 0.0% 0.1% 0.0% 11.1% Florida $8,658 7.6% 31 1.8% 43.6% 7.3% 20.1% 2.5% 0.9% 15.6% 0.1% 0.1% 0.0% 8.1% Nebraska $8,623 5.6% 31 1.3% 44.8% 6.7% 21.0% 2.4% 1.6% 12.9% 0.2% 0.1% 0.0% 9.0% Idaho $8,604 5.1% 31 1.4% 43.0% 6.0% 23.3% 3.3% 0.7% 13.0% 0.4% 0.0% 0.0% 8.9% South Dakota $8,548 5.4% 35 1.3% 36.5% 8.8% 22.8% 2.6% 0.9% 14.8% 0.2% 0.2% 0.0% 11.8% Washington $8,531 6.2% 29 2.5% 45.7% 6.7% 21.6% 2.6% 0.7% 11.4% 0.1% 0.1% 0.0% 8.5% Hawaii $8,491 7.7% 26 0.5% 56.6% 5.5% 20.3% 1.1% 0.2% 9.0% 0.1% 0.0% 0.0% 6.6% South Carolina $8,459 8.6% 29 0.9% 47.2% 6.6% 22.8% 1.9% 0.5% 11.9% 0.1% 0.1% 0.0% 8.0% Minnesota $8,321 4.7% 32 0.8% 41.3% 9.5% 21.4% 4.3% 0.9% 11.7% 0.2% 0.1% 0.0% 9.8% Wisconsin $8,297 5.3% 32 0.6% 40.0% 7.7% 22.9% 4.1% 1.2% 15.8% 0.1% 0.0% 0.0% 7.7%
VA Office of Inspector General 138

Review of State Variances in VA Disability Compensation Payments
Appendix D
State
Average Annual
Payment
Veterans with Cardiovascular Disability Percent of Total Veterans
Average Degree of Disability
Percent of Veterans at Each Degree of Disability
0 10 20 30 40 50 60 70 80 90 100 Missouri $8,232 6.1% 30 0.7% 44.5% 8.3% 22.8% 2.6% 0.6% 12.4% 0.1% 0.2% 0.0% 7.7% New Hampshire $8,168 6.0% 29 1.2% 43.9% 8.4% 22.8% 3.0% 1.6% 12.7% 0.1% 0.1% 0.0% 6.1% Alabama $8,165 7.8% 28 1.6% 48.4% 7.4% 19.7% 2.3% 1.0% 12.2% 0.1% 0.0% 0.0% 7.2% North Dakota $8,143 5.4% 30 1.2% 47.0% 6.4% 17.9% 3.1% 0.9% 16.6% 0.0% 0.2% 0.0% 6.8% Alaska $8,138 5.2% 32 1.0% 41.1% 12.0% 18.3% 2.5% 2.3% 10.9% 0.5% 0.3% 0.0% 11.2%
California $8,099 6.8% 28 1.2% 46.9% 7.4% 22.4% 2.5% 0.7% 11.8% 0.2% 0.0% 0.0% 6.9% Maryland $7,944 6.7% 27 0.8% 52.4% 8.4% 18.3% 2.5% 0.7% 9.5% 0.1% 0.1% 0.0% 7.1% Colorado $7,944 6.7% 27 1.0% 51.7% 7.1% 20.8% 2.6% 0.4% 9.3% 0.0% 0.0% 0.0% 7.1% Utah $7,906 5.2% 29 1.2% 46.4% 8.0% 20.9% 2.4% 1.3% 11.2% 0.3% 0.1% 0.0% 8.3% Pennsylvania $7,898 6.1% 29 1.2% 42.2% 8.3% 25.6% 3.2% 1.1% 12.7% 0.1% 0.1% 0.0% 5.5% Iowa $7,797 5.5% 32 1.1% 41.6% 7.4% 22.5% 3.7% 1.2% 12.8% 0.0% 0.0% 0.0% 9.6% Wyoming $7,778 6.5% 27 1.6% 52.6% 5.3% 18.7% 2.9% 1.1% 11.6% 0.0% 0.0% 0.0% 6.3% Georgia $7,775 8.5% 28 1.1% 50.7% 7.1% 18.4% 2.6% 0.5% 11.7% 0.1% 0.1% 0.0% 7.7% Virginia $7,716 9.1% 27 0.7% 52.4% 5.8% 21.3% 2.1% 0.5% 11.3% 0.1% 0.0% 0.0% 5.8% Kansas $7,579 6.6% 28 0.5% 48.9% 7.2% 22.0% 1.6% 0.2% 13.1% 0.0% 0.1% 0.0% 6.5% Massachusetts $7,529 5.0% 27 0.9% 47.6% 8.8% 20.6% 3.6% 2.4% 10.6% 0.1% 0.1% 0.0% 5.3% Delaware $7,453 7.3% 23 1.1% 59.5% 6.4% 17.4% 1.1% 0.7% 9.4% 0.0% 0.0% 0.0% 4.4% New York $7,348 5.1% 25 1.8% 48.7% 10.4% 20.1% 3.3% 1.7% 9.5% 0.1% 0.1% 0.0% 4.5% Indiana $7,287 5.6% 31 1.5% 41.6% 7.1% 25.2% 2.7% 0.8% 12.9% 0.1% 0.0% 0.0% 8.1% Michigan $7,241 5.7% 28 0.7% 45.5% 7.9% 24.0% 2.5% 1.0% 12.9% 0.1% 0.0% 0.0% 5.5% Connecticut $7,204 5.6% 26 1.3% 48.9% 9.5% 22.2% 3.4% 1.4% 7.4% 0.3% 0.2% 0.0% 5.4% Ohio $7,039 6.0% 28 1.0% 47.3% 7.5% 22.2% 2.2% 1.1% 11.5% 0.0% 0.1% 0.0% 7.0% New Jersey $7,028 6.4% 25 1.0% 48.6% 9.1% 24.8% 2.5% 1.1% 8.8% 0.1% 0.0% 0.0% 3.9% Illinois $6,961 5.7% 25 0.8% 53.8% 7.2% 20.3% 2.7% 1.0% 8.5% 0.0% 0.0% 0.0% 5.7%
VA Office of Inspector General 139
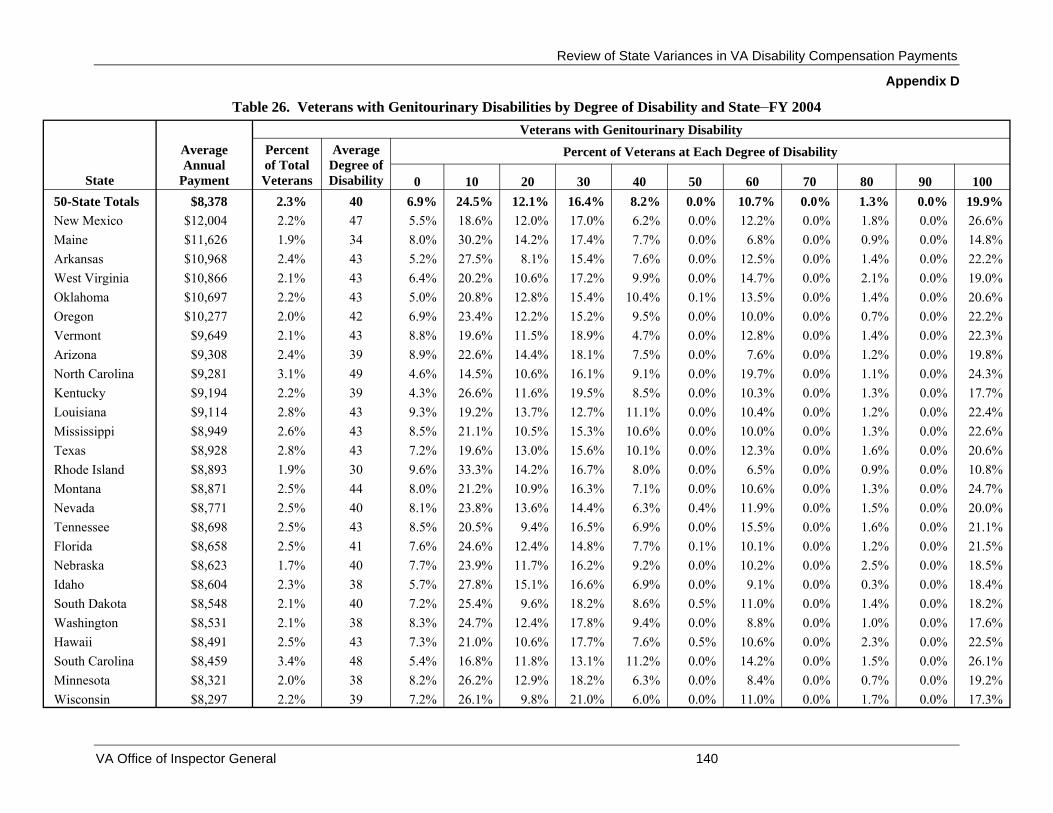
Review of State Variances in VA Disability Compensation Payments
Appendix D
Table 26. Veterans with Genitourinary Disabilities by Degree of Disability and State–FY 2004
State
Average Annual
Payment
Veterans with Genitourinary Disability Percent of Total Veterans
Average Degree of Disability
Percent of Veterans at Each Degree of Disability
0 10 20 30 40 50 60 70 80 90 100 50-State Totals $8,378 2.3% 40 6.9% 24.5% 12.1% 16.4% 8.2% 0.0% 10.7% 0.0% 1.3% 0.0% 19.9% New Mexico $12,004 2.2% 47 5.5% 18.6% 12.0% 17.0% 6.2% 0.0% 12.2% 0.0% 1.8% 0.0% 26.6% Maine $11,626 1.9% 34 8.0% 30.2% 14.2% 17.4% 7.7% 0.0% 6.8% 0.0% 0.9% 0.0% 14.8%
Arkansas $10,968 2.4% 43 5.2% 27.5% 8.1% 15.4% 7.6% 0.0% 12.5% 0.0% 1.4% 0.0% 22.2% West Virginia $10,866 2.1% 43 6.4% 20.2% 10.6% 17.2% 9.9% 0.0% 14.7% 0.0% 2.1% 0.0% 19.0% Oklahoma $10,697 2.2% 43 5.0% 20.8% 12.8% 15.4% 10.4% 0.1% 13.5% 0.0% 1.4% 0.0% 20.6% Oregon $10,277 2.0% 42 6.9% 23.4% 12.2% 15.2% 9.5% 0.0% 10.0% 0.0% 0.7% 0.0% 22.2% Vermont $9,649 2.1% 43 8.8% 19.6% 11.5% 18.9% 4.7% 0.0% 12.8% 0.0% 1.4% 0.0% 22.3% Arizona $9,308 2.4% 39 8.9% 22.6% 14.4% 18.1% 7.5% 0.0% 7.6% 0.0% 1.2% 0.0% 19.8%
North Carolina $9,281 3.1% 49 4.6% 14.5% 10.6% 16.1% 9.1% 0.0% 19.7% 0.0% 1.1% 0.0% 24.3% Kentucky $9,194 2.2% 39 4.3% 26.6% 11.6% 19.5% 8.5% 0.0% 10.3% 0.0% 1.3% 0.0% 17.7% Louisiana $9,114 2.8% 43 9.3% 19.2% 13.7% 12.7% 11.1% 0.0% 10.4% 0.0% 1.2% 0.0% 22.4% Mississippi $8,949 2.6% 43 8.5% 21.1% 10.5% 15.3% 10.6% 0.0% 10.0% 0.0% 1.3% 0.0% 22.6% Texas $8,928 2.8% 43 7.2% 19.6% 13.0% 15.6% 10.1% 0.0% 12.3% 0.0% 1.6% 0.0% 20.6%
Rhode Island $8,893 1.9% 30 9.6% 33.3% 14.2% 16.7% 8.0% 0.0% 6.5% 0.0% 0.9% 0.0% 10.8% Montana $8,871 2.5% 44 8.0% 21.2% 10.9% 16.3% 7.1% 0.0% 10.6% 0.0% 1.3% 0.0% 24.7% Nevada $8,771 2.5% 40 8.1% 23.8% 13.6% 14.4% 6.3% 0.4% 11.9% 0.0% 1.5% 0.0% 20.0%
Tennessee $8,698 2.5% 43 8.5% 20.5% 9.4% 16.5% 6.9% 0.0% 15.5% 0.0% 1.6% 0.0% 21.1% Florida $8,658 2.5% 41 7.6% 24.6% 12.4% 14.8% 7.7% 0.1% 10.1% 0.0% 1.2% 0.0% 21.5% Nebraska $8,623 1.7% 40 7.7% 23.9% 11.7% 16.2% 9.2% 0.0% 10.2% 0.0% 2.5% 0.0% 18.5% Idaho $8,604 2.3% 38 5.7% 27.8% 15.1% 16.6% 6.9% 0.0% 9.1% 0.0% 0.3% 0.0% 18.4%
South Dakota $8,548 2.1% 40 7.2% 25.4% 9.6% 18.2% 8.6% 0.5% 11.0% 0.0% 1.4% 0.0% 18.2% Washington $8,531 2.1% 38 8.3% 24.7% 12.4% 17.8% 9.4% 0.0% 8.8% 0.0% 1.0% 0.0% 17.6% Hawaii $8,491 2.5% 43 7.3% 21.0% 10.6% 17.7% 7.6% 0.5% 10.6% 0.0% 2.3% 0.0% 22.5% South Carolina $8,459 3.4% 48 5.4% 16.8% 11.8% 13.1% 11.2% 0.0% 14.2% 0.0% 1.5% 0.0% 26.1%
Minnesota $8,321 2.0% 38 8.2% 26.2% 12.9% 18.2% 6.3% 0.0% 8.4% 0.0% 0.7% 0.0% 19.2% Wisconsin $8,297 2.2% 39 7.2% 26.1% 9.8% 21.0% 6.0% 0.0% 11.0% 0.0% 1.7% 0.0% 17.3%
VA Office of Inspector General 140

Review of State Variances in VA Disability Compensation Payments
Appendix D
State
Average Annual
Payment
Veterans with Genitourinary Disability Percent of Total Veterans
Average Degree of Disability
Percent of Veterans at Each Degree of Disability
0 10 20 30 40 50 60 70 80 90 100 Missouri $8,232 2.1% 40 7.3% 24.3% 11.6% 18.1% 7.9% 0.0% 8.7% 0.2% 1.6% 0.0% 20.4%
New Hampshire $8,168 2.1% 33 6.8% 29.7% 17.6% 16.1% 7.5% 0.0% 8.2% 0.0% 0.4% 0.0% 13.6% Alabama $8,165 2.5% 41 6.0% 26.2% 13.5% 15.0% 7.1% 0.0% 8.6% 0.0% 1.4% 0.0% 22.0% North Dakota $8,143 2.0% 40 11.1% 25.5% 12.5% 13.4% 5.1% 0.5% 8.8% 0.0% 0.5% 0.0% 22.7% Alaska $8,138 1.9% 37 5.9% 26.7% 14.5% 13.1% 10.4% 0.0% 13.6% 0.0% 1.4% 0.0% 14.5% California $8,099 2.3% 41 6.4% 25.3% 12.1% 16.1% 8.0% 0.0% 10.0% 0.0% 1.1% 0.0% 21.0% Maryland $7,944 2.7% 43 6.2% 21.7% 13.9% 14.3% 10.6% 0.0% 9.9% 0.0% 1.0% 0.0% 22.3% Colorado $7,944 2.4% 40 6.1% 24.6% 11.6% 14.6% 9.2% 0.0% 16.1% 0.0% 1.0% 0.0% 16.8% Utah $7,906 2.3% 35 6.8% 26.8% 12.5% 19.3% 10.7% 0.3% 9.8% 0.0% 1.5% 0.0% 12.2% Pennsylvania $7,898 2.3% 39 6.6% 29.0% 10.4% 16.6% 6.8% 0.1% 8.9% 0.0% 1.2% 0.0% 20.3% Iowa $7,797 2.1% 36 7.6% 30.0% 10.6% 20.3% 5.8% 0.0% 7.4% 0.0% 2.1% 0.0% 16.4% Wyoming $7,778 1.9% 38 7.9% 24.6% 12.3% 17.5% 8.8% 0.0% 10.5% 0.0% 0.9% 0.0% 17.5% Georgia $7,775 2.7% 42 6.5% 23.3% 12.7% 15.6% 9.5% 0.0% 9.7% 0.0% 1.6% 0.0% 21.2% Virginia $7,716 2.9% 41 5.7% 21.0% 16.6% 14.5% 11.5% 0.0% 10.3% 0.0% 0.5% 0.0% 19.9% Kansas $7,579 2.2% 36 8.5% 26.1% 15.3% 15.9% 8.3% 0.2% 7.9% 0.0% 0.6% 0.0% 17.2%
Massachusetts $7,529 2.0% 29 4.9% 45.9% 10.2% 16.0% 4.8% 0.2% 6.6% 0.0% 0.7% 0.0% 10.7% Delaware $7,453 2.5% 39 8.0% 26.2% 10.7% 16.0% 9.1% 0.0% 10.2% 0.0% 1.1% 0.0% 18.7% New York $7,348 1.8% 35 7.6% 34.2% 10.3% 16.7% 5.6% 0.1% 7.7% 0.0% 1.0% 0.0% 16.7% Indiana $7,287 1.7% 37 6.9% 28.2% 11.5% 21.3% 4.3% 0.0% 8.9% 0.0% 1.0% 0.0% 18.0%
Michigan $7,241 2.1% 39 5.8% 23.0% 12.8% 22.7% 7.5% 0.1% 9.1% 0.0% 2.0% 0.0% 17.1% Connecticut $7,204 1.8% 31 5.2% 39.0% 11.0% 19.6% 5.5% 0.0% 5.8% 0.0% 1.0% 0.0% 12.8% Ohio $7,039 2.0% 36 8.5% 30.8% 10.5% 16.6% 5.1% 0.0% 9.8% 0.0% 1.5% 0.0% 17.1%
New Jersey $7,028 1.8% 31 8.7% 38.4% 10.2% 16.4% 5.2% 0.0% 7.9% 0.0% 1.0% 0.0% 12.2% Illinois $6,961 2.2% 39 6.8% 27.3% 10.8% 20.6% 6.3% 0.1% 7.2% 0.0% 1.5% 0.0% 19.6%
VA Office of Inspector General 141

Review of State Variances in VA Disability Compensation Payments
Appendix D
Table 27. Veterans with Mental Disabilities by Degree of Disability and State–FY 2004
State
Average Annual
Payment
Veterans with Mental Disability Percent of Total Veterans
Average Degree of Disability
Percent of Veterans at Each Degree of Disability
0 10 20 30 40 50 60 70 80 90 100 50-State Totals $8,378 14.9% 58 0.2% 14.0% 0.1% 20.0% 0.0% 18.6% 0.0% 18.7% 0.0% 0.0% 28.4%
New Mexico $12,004 23.4% 67 0.1% 4.3% 0.0% 9.7% 0.0% 18.4% 0.0% 44.4% 0.0% 0.0% 23.1% Maine $11,626 25.3% 67 0.1% 5.8% 0.0% 12.9% 0.0% 15.0% 0.2% 36.3% 0.0% 0.0% 29.8%
Arkansas $10,968 16.9% 65 0.1% 7.9% 0.1% 17.9% 0.0% 20.8% 0.0% 17.2% 0.0% 0.0% 36.0% West Virginia $10,866 24.3% 61 0.2% 7.4% 0.0% 19.4% 0.0% 23.2% 0.0% 21.8% 0.0% 0.0% 27.9% Oklahoma $10,697 17.3% 65 0.1% 7.0% 0.0% 17.2% 0.0% 21.3% 0.0% 18.7% 0.0% 0.0% 35.6% Oregon $10,277 20.4% 66 0.1% 6.8% 0.1% 15.1% 0.1% 16.9% 0.0% 28.9% 0.0% 0.0% 32.0% Vermont $9,649 17.9% 63 0.2% 11.8% 0.0% 17.4% 0.0% 17.6% 0.1% 17.2% 0.0% 0.0% 35.8% Arizona $9,308 15.1% 65 0.1% 9.7% 0.1% 16.5% 0.0% 18.2% 0.0% 19.6% 0.0% 0.0% 35.7% North Carolina $9,281 13.3% 63 0.2% 10.3% 0.0% 18.2% 0.0% 18.1% 0.0% 20.3% 0.0% 0.0% 32.9% Kentucky $9,194 15.9% 60 0.2% 12.9% 0.1% 22.5% 0.1% 17.0% 0.0% 12.9% 0.0% 0.0% 34.3% Louisiana $9,114 17.6% 59 0.1% 11.4% 0.0% 19.6% 0.0% 22.4% 0.0% 20.3% 0.0% 0.0% 26.0% Mississippi $8,949 15.6% 60 0.2% 14.0% 0.1% 22.2% 0.0% 16.9% 0.0% 9.4% 0.0% 0.0% 37.4% Texas $8,928 12.0% 58 0.2% 10.7% 0.1% 21.6% 0.0% 21.8% 0.0% 18.6% 0.0% 0.0% 26.9% Rhode Island $8,893 20.8% 60 0.2% 13.6% 0.1% 16.9% 0.0% 16.5% 0.1% 25.0% 0.0% 0.0% 27.4% Montana $8,871 14.5% 57 0.3% 11.7% 0.0% 22.9% 0.0% 20.3% 0.1% 19.7% 0.0% 0.0% 24.9% Nevada $8,771 12.5% 60 0.2% 10.6% 0.0% 19.3% 0.0% 18.8% 0.0% 25.9% 0.0% 0.0% 25.1% Tennessee $8,698 13.6% 64 0.1% 11.5% 0.1% 19.3% 0.1% 16.0% 0.0% 13.0% 0.0% 0.0% 40.0% Florida $8,658 14.1% 60 0.2% 12.0% 0.1% 17.8% 0.0% 21.9% 0.0% 19.2% 0.0% 0.0% 28.7% Nebraska $8,623 12.2% 58 0.5% 8.5% 0.0% 20.9% 0.0% 25.5% 0.0% 20.5% 0.0% 0.0% 24.1% Idaho $8,604 14.2% 57 0.3% 9.9% 0.0% 22.3% 0.1% 22.4% 0.0% 23.6% 0.1% 0.0% 21.2% South Dakota $8,548 14.3% 60 2.6% 10.8% 0.1% 17.2% 0.0% 17.5% 0.1% 23.3% 0.0% 0.0% 28.5% Washington $8,531 14.6% 61 0.2% 9.7% 0.1% 18.3% 0.1% 17.6% 0.0% 29.2% 0.0% 0.0% 24.8% Hawaii $8,491 13.9% 67 0.1% 10.1% 0.0% 14.2% 0.0% 17.2% 0.0% 18.0% 0.0% 0.0% 40.4% South Carolina $8,459 13.4% 60 0.1% 10.4% 0.1% 21.8% 0.0% 18.5% 0.0% 20.0% 0.0% 0.0% 29.0% Minnesota $8,321 15.6% 58 0.1% 14.7% 0.1% 18.0% 0.0% 19.1% 0.0% 20.8% 0.0% 0.0% 27.1% Wisconsin $8,297 14.9% 59 0.1% 15.0% 0.1% 19.0% 0.0% 17.0% 0.0% 16.9% 0.0% 0.0% 31.8%
VA Office of Inspector General 142

Review of State Variances in VA Disability Compensation Payments
Appendix D
State
Average Annual
Payment
Veterans with Mental Disability Percent of Total Veterans
Average Degree of Disability
Percent of Veterans at Each Degree of Disability
0 10 20 30 40 50 60 70 80 90 100 Missouri $8,232 14.6% 55 0.2% 14.3% 0.0% 25.0% 0.1% 20.0% 0.0% 16.2% 0.0% 0.0% 24.3% New Hampshire $8,168 15.4% 56 0.1% 15.5% 0.0% 21.0% 0.1% 19.5% 0.0% 18.7% 0.0% 0.0% 25.0% Alabama $8,165 14.9% 56 0.2% 13.8% 0.0% 24.6% 0.0% 17.9% 0.0% 17.2% 0.0% 0.0% 26.3% North Dakota $8,143 11.8% 64 0.2% 11.5% 0.1% 15.8% 0.0% 18.6% 0.1% 16.2% 0.0% 0.0% 37.5%
Alaska $8,138 9.1% 59 0.2% 9.2% 0.0% 21.2% 0.0% 23.3% 0.0% 19.2% 0.0% 0.0% 27.0% California $8,099 14.6% 59 0.2% 13.3% 0.1% 18.2% 0.0% 18.1% 0.0% 22.0% 0.0% 0.0% 28.1% Maryland $7,944 12.6% 63 0.1% 11.9% 0.0% 18.6% 0.0% 17.7% 0.1% 14.0% 0.0% 0.0% 37.4% Colorado $7,944 13.6% 63 0.1% 13.3% 0.1% 20.0% 0.0% 14.3% 0.0% 12.6% 0.0% 0.0% 39.6% Utah $7,906 14.7% 59 0.1% 11.3% 0.1% 18.8% 0.1% 22.0% 0.1% 22.5% 0.1% 0.0% 24.8% Pennsylvania $7,898 16.5% 54 0.1% 19.1% 0.0% 21.6% 0.0% 17.6% 0.0% 17.1% 0.0% 0.0% 24.5% Iowa $7,797 14.3% 54 0.3% 15.4% 0.3% 23.9% 0.2% 19.6% 0.1% 15.3% 0.0% 0.0% 24.9% Wyoming $7,778 13.3% 61 0.0% 12.0% 0.0% 23.6% 0.0% 17.0% 0.0% 10.9% 0.0% 0.0% 36.5% Georgia $7,775 11.4% 58 0.1% 15.8% 0.1% 21.1% 0.0% 17.5% 0.1% 14.3% 0.0% 0.0% 31.0% Virginia $7,716 10.0% 55 0.1% 14.6% 0.0% 25.9% 0.0% 18.0% 0.0% 16.1% 0.0% 0.0% 25.1% Kansas $7,579 12.6% 64 0.2% 13.4% 0.1% 18.1% 0.0% 13.4% 0.0% 15.8% 0.0% 0.0% 38.9% Massachusetts $7,529 22.5% 51 0.0% 20.8% 0.1% 22.0% 0.0% 17.8% 0.0% 18.4% 0.0% 0.0% 20.8% Delaware $7,453 13.2% 61 0.2% 15.3% 0.0% 22.2% 0.0% 13.7% 0.0% 10.5% 0.0% 0.0% 38.2% New York $7,348 20.3% 54 0.2% 20.5% 0.0% 20.6% 0.0% 17.4% 0.0% 14.6% 0.0% 0.0% 26.6% Indiana $7,287 11.0% 54 0.2% 17.1% 0.1% 24.4% 0.0% 16.9% 0.0% 15.0% 0.0% 0.0% 26.2% Michigan $7,241 14.1% 51 0.2% 23.1% 0.1% 23.4% 0.1% 16.2% 0.0% 12.2% 0.0% 0.0% 24.7% Connecticut $7,204 17.0% 55 0.2% 22.5% 0.1% 17.6% 0.0% 14.8% 0.0% 16.0% 0.0% 0.0% 28.7% Ohio $7,039 13.6% 52 0.2% 19.8% 0.0% 25.6% 0.0% 18.0% 0.0% 11.1% 0.0% 0.0% 25.2% New Jersey $7,028 18.7% 50 0.1% 24.2% 0.0% 22.1% 0.0% 18.6% 0.0% 11.4% 0.0% 0.0% 23.6% Illinois $6,961 13.9% 52 0.4% 21.4% 0.1% 20.1% 0.1% 16.9% 0.0% 17.8% 0.0% 0.0% 23.2%
VA Office of Inspector General 143

Review of State Variances in VA Disability Compensation Payments
Appendix D
Table 28. Veterans with Hemic/Lymphatic Disabilities by Degree of Disability and State–FY 2004
State
Average Annual
Payment
Veterans with Hemic/Lymphatic Disability Percent of Total Veterans
Average Degree of Disability
Percent of Veterans at Each Degree of Disability
0 10 20 30 40 50 60 70 80 90 100 50-State Totals $8,378 0.5% 49 5.7% 6.1% 5.9% 46.2% 1.4% 0.2% 3.6% 1.2% 0.0% 0.0% 29.6%
New Mexico $12,004 0.4% 57 6.7% 7.7% 1.0% 34.6% 0.0% 0.0% 8.7% 1.9% 0.0% 0.0% 39.4% Maine $11,626 0.5% 51 1.1% 5.7% 8.0% 44.8% 3.4% 1.1% 4.6% 1.1% 1.1% 0.0% 28.7% Arkansas $10,968 0.5% 52 4.2% 9.2% 2.1% 42.3% 2.8% 0.7% 4.2% 1.4% 0.0% 0.0% 33.1% West Virginia $10,866 0.5% 55 1.9% 2.8% 4.6% 51.9% 0.9% 0.0% 0.0% 1.9% 0.0% 0.0% 36.1% Oklahoma $10,697 0.4% 46 7.0% 7.5% 6.0% 47.0% 1.0% 0.0% 4.0% 0.5% 0.0% 0.0% 27.0% Oregon $10,277 0.5% 53 5.1% 6.2% 7.3% 39.0% 1.7% 0.0% 3.4% 1.7% 0.0% 0.0% 35.6% Vermont $9,649 0.5% 43 0.0% 12.1% 6.1% 54.5% 3.0% 0.0% 3.0% 0.0% 0.0% 0.0% 21.2% Arizona $9,308 0.5% 50 7.5% 4.8% 4.4% 44.0% 3.2% 0.4% 3.6% 0.8% 0.0% 0.0% 31.3% North Carolina $9,281 0.5% 51 6.2% 4.8% 7.8% 42.5% 1.1% 0.5% 2.3% 1.1% 0.0% 0.0% 33.8% Kentucky $9,194 0.5% 51 5.8% 4.7% 4.1% 44.2% 3.5% 0.6% 4.7% 0.6% 0.0% 0.0% 32.0% Louisiana $9,114 0.5% 50 4.1% 6.4% 5.3% 46.8% 1.2% 0.0% 5.3% 1.8% 0.0% 0.0% 29.2% Mississippi $8,949 0.4% 46 5.6% 4.7% 6.5% 51.4% 1.9% 0.0% 3.7% 0.0% 0.0% 0.0% 26.2% Texas $8,928 0.5% 51 6.2% 5.2% 7.0% 43.1% 1.7% 0.1% 2.7% 1.2% 0.0% 0.0% 32.8%
Rhode Island $8,893 0.5% 46 5.1% 6.3% 2.5% 57.0% 0.0% 0.0% 1.3% 1.3% 0.0% 0.0% 26.6% Montana $8,871 0.5% 55 4.8% 3.2% 11.3% 38.7% 0.0% 0.0% 1.6% 0.0% 0.0% 0.0% 40.3% Nevada $8,771 0.5% 49 4.5% 2.7% 11.6% 46.4% 0.9% 0.0% 3.6% 2.7% 0.0% 0.0% 27.7% Tennessee $8,698 0.5% 49 4.8% 5.9% 9.6% 43.7% 3.0% 0.0% 2.2% 1.1% 0.0% 0.0% 29.6% Florida $8,658 0.5% 52 4.2% 6.6% 5.2% 44.4% 1.3% 0.1% 3.1% 1.9% 0.0% 0.0% 33.1% Nebraska $8,623 0.5% 48 1.9% 6.7% 8.6% 49.5% 1.0% 0.0% 4.8% 0.0% 1.0% 0.0% 26.7% Idaho $8,604 0.5% 53 6.9% 1.4% 5.6% 38.9% 6.9% 0.0% 5.6% 2.8% 0.0% 0.0% 31.9% South Dakota $8,548 0.5% 46 2.1% 12.5% 4.2% 47.9% 4.2% 0.0% 2.1% 0.0% 0.0% 0.0% 27.1% Washington $8,531 0.5% 52 5.0% 5.2% 6.4% 41.9% 2.1% 0.2% 4.8% 1.7% 0.0% 0.0% 32.6% Hawaii $8,491 0.4% 47 10.4% 9.0% 4.5% 38.8% 3.0% 0.0% 4.5% 0.0% 0.0% 0.0% 29.9% South Carolina $8,459 0.5% 50 3.3% 6.2% 10.9% 43.6% 0.9% 0.0% 3.3% 1.4% 0.0% 0.0% 30.3% Minnesota $8,321 0.5% 48 6.8% 4.9% 5.3% 49.0% 1.9% 0.0% 2.4% 1.0% 0.0% 0.0% 28.6% Wisconsin $8,297 0.6% 50 5.3% 2.0% 4.5% 52.4% 2.0% 0.0% 4.1% 0.8% 0.0% 0.0% 28.9%
VA Office of Inspector General 144

Review of State Variances in VA Disability Compensation Payments
Appendix D
State
Average Annual
Payment
Veterans with Hemic/Lymphatic Disability Percent of Total Veterans
Average Degree of Disability
Percent of Veterans at Each Degree of Disability
0 10 20 30 40 50 60 70 80 90 100 Missouri $8,232 0.6% 45 7.3% 6.6% 7.3% 49.5% 0.0% 0.0% 3.7% 0.4% 0.0% 0.0% 25.3% New Hampshire $8,168 0.5% 49 6.2% 10.8% 1.5% 44.6% 1.5% 0.0% 3.1% 3.1% 0.0% 0.0% 29.2% Alabama $8,165 0.5% 51 3.6% 7.2% 4.8% 46.2% 0.8% 0.4% 5.2% 1.6% 0.0% 0.0% 30.3% North Dakota $8,143 0.6% 51 3.2% 1.6% 7.9% 49.2% 3.2% 0.0% 4.8% 0.0% 0.0% 0.0% 30.2% Alaska $8,138 0.4% 48 9.6% 1.9% 13.5% 36.5% 1.9% 1.9% 5.8% 0.0% 0.0% 0.0% 28.8% California $8,099 0.5% 47 6.7% 4.9% 6.1% 47.6% 2.3% 0.3% 3.6% 1.1% 0.2% 0.0% 27.3% Maryland $7,944 0.5% 49 6.0% 4.9% 7.1% 46.4% 1.6% 0.5% 2.2% 1.1% 0.0% 0.0% 30.1% Colorado $7,944 0.5% 47 3.8% 6.8% 8.3% 48.9% 1.9% 0.0% 3.0% 1.1% 0.0% 0.0% 26.1% Utah $7,906 0.5% 52 5.5% 4.1% 4.1% 46.6% 1.4% 0.0% 4.1% 0.0% 0.0% 0.0% 34.2% Pennsylvania $7,898 0.6% 48 5.2% 6.9% 6.0% 47.2% 0.7% 0.2% 4.8% 0.9% 0.0% 0.0% 28.1%
Iowa $7,797 0.6% 50 3.8% 1.5% 5.3% 54.9% 0.8% 0.0% 3.8% 1.5% 0.0% 0.0% 28.6% Wyoming $7,778 0.4% 46 13.0% 4.3% 8.7% 43.5% 0.0% 0.0% 0.0% 0.0% 0.0% 0.0% 30.4% Georgia $7,775 0.5% 53 6.2% 8.5% 6.7% 36.7% 0.5% 0.0% 4.0% 1.5% 0.0% 0.0% 35.9% Virginia $7,716 0.6% 50 3.7% 6.9% 7.3% 44.8% 1.0% 0.4% 3.7% 1.7% 0.0% 0.0% 30.6% Kansas $7,579 0.5% 45 6.1% 7.0% 7.8% 47.0% 1.7% 0.9% 3.5% 2.6% 0.0% 0.0% 23.5% Massachusetts $7,529 0.4% 46 2.5% 11.0% 2.0% 53.5% 1.0% 0.5% 4.5% 1.0% 0.0% 0.0% 24.0% Delaware $7,453 0.7% 40 9.4% 5.7% 5.7% 52.8% 0.0% 0.0% 7.5% 3.8% 0.0% 0.0% 15.1% New York $7,348 0.4% 45 7.8% 9.5% 4.3% 47.5% 0.8% 0.0% 4.3% 0.6% 0.0% 0.0% 25.3% Indiana $7,287 0.5% 45 6.7% 6.2% 3.8% 54.1% 2.4% 0.0% 1.4% 0.0% 0.0% 0.0% 25.4% Michigan $7,241 0.6% 46 9.4% 5.1% 2.4% 49.6% 0.5% 0.3% 5.4% 0.8% 0.3% 0.0% 26.3% Connecticut $7,204 0.6% 46 6.3% 7.0% 3.1% 53.1% 0.0% 0.0% 2.3% 1.6% 0.0% 0.0% 26.6% Ohio $7,039 0.5% 46 5.8% 6.7% 5.3% 51.7% 0.2% 0.2% 2.3% 0.9% 0.0% 0.0% 26.7% New Jersey $7,028 0.4% 44 7.8% 7.3% 2.2% 52.5% 0.6% 0.6% 3.9% 1.7% 0.0% 0.0% 23.5% Illinois $6,961 0.6% 48 8.7% 5.6% 3.6% 46.3% 0.5% 0.3% 4.3% 1.0% 0.0% 0.0% 29.7%
VA Office of Inspector General 145

Review of State Variances in VA Disability Compensation Payments
Appendix D
Table 29. Veterans with Respiratory Disabilities by Degree of Disability and State–FY 2004
State
Average Annual
Payment
Veterans with Respiratory Disability Percent of Total Veterans
Average Degree of Disability
Percent of Veterans at Each Degree of Disability
0 10 20 30 40 50 60 70 80 90 100 50-State Totals $8,378 4.8% 29 10.6% 36.4% 2.8% 25.9% 1.1% 6.7% 8.5% 0.1% 0.2% 0.0% 7.6%
New Mexico $12,004 4.0% 33 10.2% 31.5% 1.6% 25.3% 0.7% 9.3% 9.7% 0.2% 0.4% 0.0% 10.9% Maine $11,626 4.0% 34 7.2% 33.0% 2.8% 25.8% 0.8% 6.0% 14.0% 0.3% 0.3% 0.0% 9.9% Arkansas $10,968 4.7% 38 7.2% 26.6% 1.5% 27.5% 0.8% 7.3% 14.9% 0.2% 0.0% 0.0% 14.0% West Virginia $10,866 4.5% 35 10.4% 28.7% 3.3% 26.0% 2.2% 2.7% 11.7% 0.2% 0.4% 0.0% 14.3% Oklahoma $10,697 4.7% 36 5.1% 31.5% 1.2% 28.2% 1.0% 9.5% 12.5% 0.0% 0.2% 0.0% 10.9% Oregon $10,277 4.1% 32 12.3% 29.6% 3.6% 26.9% 1.2% 4.3% 11.2% 0.1% 0.2% 0.0% 10.4%
Vermont $9,649 3.8% 28 16.3% 32.3% 3.8% 24.0% 2.3% 3.4% 8.7% 0.4% 0.4% 0.0% 8.4% Arizona $9,308 5.1% 30 8.8% 36.9% 1.9% 28.8% 0.7% 4.3% 9.7% 0.1% 0.4% 0.0% 8.5% North Carolina $9,281 4.7% 34 6.6% 33.1% 2.0% 29.3% 0.5% 5.7% 11.1% 0.1% 0.2% 0.0% 11.5% Kentucky $9,194 4.6% 33 11.3% 29.2% 3.3% 26.7% 1.3% 6.8% 9.4% 0.2% 0.2% 0.0% 11.6% Louisiana $9,114 4.6% 32 7.0% 34.2% 2.7% 28.3% 0.8% 6.3% 11.0% 0.2% 0.1% 0.0% 9.5% Mississippi $8,949 4.9% 32 6.6% 37.7% 2.6% 24.1% 1.4% 7.4% 10.2% 0.0% 0.1% 0.0% 10.0% Texas $8,928 5.2% 31 7.3% 35.9% 1.7% 27.1% 0.7% 10.8% 9.0% 0.1% 0.3% 0.0% 7.1%
Rhode Island $8,893 4.2% 28 10.4% 38.0% 4.9% 25.1% 0.7% 4.1% 9.3% 0.1% 0.7% 0.0% 6.8% Montana $8,871 4.3% 31 8.1% 38.8% 2.6% 22.9% 0.4% 7.8% 8.5% 0.0% 0.0% 0.0% 10.9% Nevada $8,771 5.5% 33 4.6% 39.0% 1.1% 26.5% 0.4% 6.2% 10.8% 0.0% 0.3% 0.0% 11.1% Tennessee $8,698 4.7% 33 10.7% 32.0% 2.6% 25.5% 1.2% 5.7% 9.8% 0.2% 0.3% 0.0% 11.9% Florida $8,658 4.7% 31 8.0% 36.6% 1.8% 25.1% 0.9% 7.6% 10.3% 0.2% 0.2% 0.0% 9.3% Nebraska $8,623 4.3% 32 7.2% 35.5% 1.4% 28.1% 0.2% 7.9% 10.4% 0.0% 0.2% 0.0% 9.1% Idaho $8,604 4.4% 31 7.3% 38.0% 2.6% 26.8% 1.1% 6.7% 7.7% 0.3% 0.0% 0.0% 9.6% South Dakota $8,548 4.3% 33 7.4% 36.0% 2.4% 23.4% 1.2% 8.1% 9.5% 0.2% 0.0% 0.0% 11.7% Washington $8,531 5.1% 30 10.5% 33.2% 1.6% 27.3% 0.4% 10.6% 8.7% 0.2% 0.1% 0.0% 7.3% Hawaii $8,491 4.6% 25 21.1% 32.0% 3.3% 24.2% 0.4% 6.5% 6.1% 0.1% 0.0% 0.0% 6.3% South Carolina $8,459 4.6% 35 6.2% 33.1% 1.8% 28.4% 0.5% 7.6% 10.1% 0.0% 0.0% 0.0% 12.2% Minnesota $8,321 3.8% 30 11.7% 39.4% 3.9% 19.5% 2.2% 3.4% 7.9% 0.3% 0.9% 0.0% 10.7% Wisconsin $8,297 4.3% 27 12.5% 37.0% 4.8% 23.4% 2.3% 4.3% 7.2% 0.1% 0.5% 0.0% 8.0%
VA Office of Inspector General 146
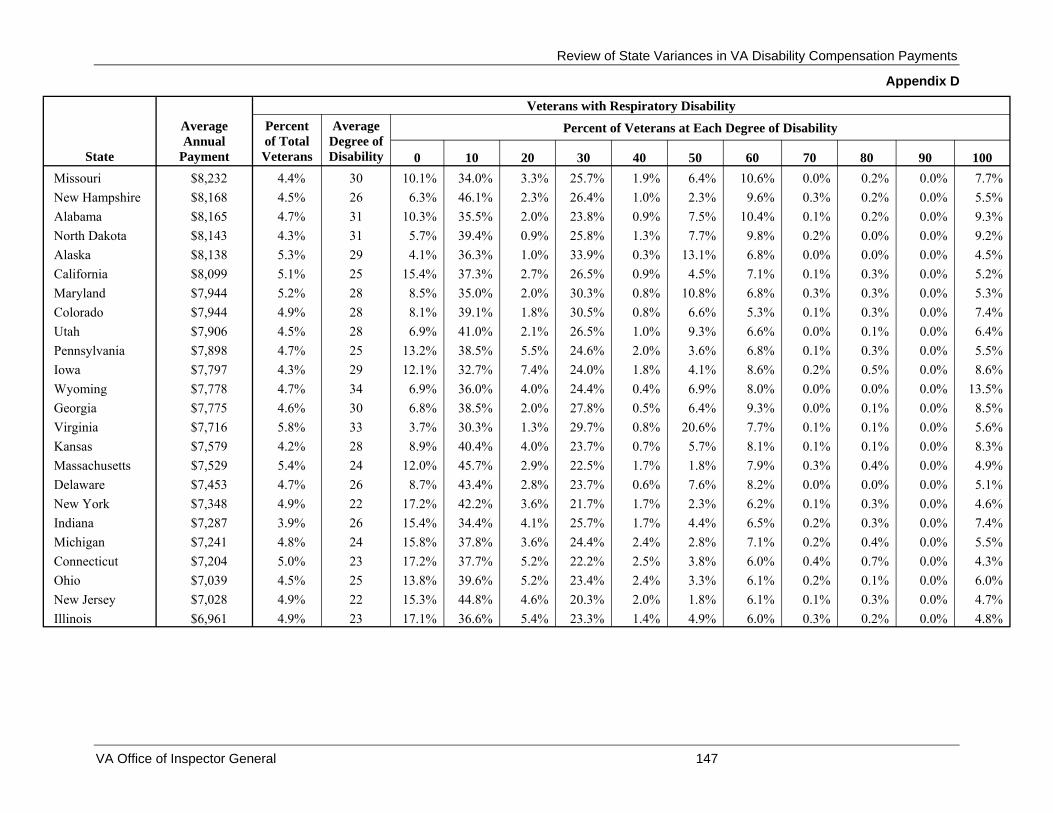
Review of State Variances in VA Disability Compensation Payments
Appendix D
State
Average Annual
Payment
Veterans with Respiratory Disability Percent of Total Veterans
Average Degree of Disability
Percent of Veterans at Each Degree of Disability
0 10 20 30 40 50 60 70 80 90 100 Missouri $8,232 4.4% 30 10.1% 34.0% 3.3% 25.7% 1.9% 6.4% 10.6% 0.0% 0.2% 0.0% 7.7% New Hampshire $8,168 4.5% 26 6.3% 46.1% 2.3% 26.4% 1.0% 2.3% 9.6% 0.3% 0.2% 0.0% 5.5% Alabama $8,165 4.7% 31 10.3% 35.5% 2.0% 23.8% 0.9% 7.5% 10.4% 0.1% 0.2% 0.0% 9.3%
North Dakota $8,143 4.3% 31 5.7% 39.4% 0.9% 25.8% 1.3% 7.7% 9.8% 0.2% 0.0% 0.0% 9.2% Alaska $8,138 5.3% 29 4.1% 36.3% 1.0% 33.9% 0.3% 13.1% 6.8% 0.0% 0.0% 0.0% 4.5% California $8,099 5.1% 25 15.4% 37.3% 2.7% 26.5% 0.9% 4.5% 7.1% 0.1% 0.3% 0.0% 5.2% Maryland $7,944 5.2% 28 8.5% 35.0% 2.0% 30.3% 0.8% 10.8% 6.8% 0.3% 0.3% 0.0% 5.3% Colorado $7,944 4.9% 28 8.1% 39.1% 1.8% 30.5% 0.8% 6.6% 5.3% 0.1% 0.3% 0.0% 7.4% Utah $7,906 4.5% 28 6.9% 41.0% 2.1% 26.5% 1.0% 9.3% 6.6% 0.0% 0.1% 0.0% 6.4% Pennsylvania $7,898 4.7% 25 13.2% 38.5% 5.5% 24.6% 2.0% 3.6% 6.8% 0.1% 0.3% 0.0% 5.5% Iowa $7,797 4.3% 29 12.1% 32.7% 7.4% 24.0% 1.8% 4.1% 8.6% 0.2% 0.5% 0.0% 8.6% Wyoming $7,778 4.7% 34 6.9% 36.0% 4.0% 24.4% 0.4% 6.9% 8.0% 0.0% 0.0% 0.0% 13.5% Georgia $7,775 4.6% 30 6.8% 38.5% 2.0% 27.8% 0.5% 6.4% 9.3% 0.0% 0.1% 0.0% 8.5% Virginia $7,716 5.8% 33 3.7% 30.3% 1.3% 29.7% 0.8% 20.6% 7.7% 0.1% 0.1% 0.0% 5.6% Kansas $7,579 4.2% 28 8.9% 40.4% 4.0% 23.7% 0.7% 5.7% 8.1% 0.1% 0.1% 0.0% 8.3% Massachusetts $7,529 5.4% 24 12.0% 45.7% 2.9% 22.5% 1.7% 1.8% 7.9% 0.3% 0.4% 0.0% 4.9% Delaware $7,453 4.7% 26 8.7% 43.4% 2.8% 23.7% 0.6% 7.6% 8.2% 0.0% 0.0% 0.0% 5.1% New York $7,348 4.9% 22 17.2% 42.2% 3.6% 21.7% 1.7% 2.3% 6.2% 0.1% 0.3% 0.0% 4.6% Indiana $7,287 3.9% 26 15.4% 34.4% 4.1% 25.7% 1.7% 4.4% 6.5% 0.2% 0.3% 0.0% 7.4% Michigan $7,241 4.8% 24 15.8% 37.8% 3.6% 24.4% 2.4% 2.8% 7.1% 0.2% 0.4% 0.0% 5.5% Connecticut $7,204 5.0% 23 17.2% 37.7% 5.2% 22.2% 2.5% 3.8% 6.0% 0.4% 0.7% 0.0% 4.3% Ohio $7,039 4.5% 25 13.8% 39.6% 5.2% 23.4% 2.4% 3.3% 6.1% 0.2% 0.1% 0.0% 6.0% New Jersey $7,028 4.9% 22 15.3% 44.8% 4.6% 20.3% 2.0% 1.8% 6.1% 0.1% 0.3% 0.0% 4.7% Illinois $6,961 4.9% 23 17.1% 36.6% 5.4% 23.3% 1.4% 4.9% 6.0% 0.3% 0.2% 0.0% 4.8%
VA Office of Inspector General 147

Review of State Variances in VA Disability Compensation Payments
Appendix D
Table 30. Veterans Receiving Compensation for PTSD–FY2004 Veterans Receiving Veterans Receiving Compensation for
Compensation Disabilities Other than PTSD Veterans Receiving Compensation for PTSD Percent of
State
Average Annual
Payment Number
Average Annual
Payment Number
Percent of Total Compensation
Recipients
Percent of Total
Payments
Average Annual
Payment Number
Total Compensation
Recipients
Percent of Total
Payments 50-State Totals $8,378 2,493,576 $7,291 2,277,705 91.3% 79.5% $19,845 215,871 8.7% 20.5% New Mexico $12,004 25,258 $9,309 20,665 81.8% 63.4% $24,129 4,593 18.2% 36.6% Maine $11,626 18,751 $9,308 15,671 83.6% 66.9% $23,421 3,080 16.4% 33.1% Arkansas $10,968 31,473 $9,795 28,074 89.2% 79.7% $20,649 3,399 10.8% 20.3% West Virginia $10,866 20,681 $8,601 16,824 81.4% 64.4% $20,747 3,857 18.6% 35.6% Oklahoma $10,697 51,213 $9,063 44,546 87.0% 73.7% $21,611 6,667 13.0% 26.3% Oregon $10,277 35,449 $8,456 30,180 85.1% 70.0% $20,708 5,269 14.9% 30.0% Vermont $9,649 6,894 $8,154 6,037 87.6% 74.0% $20,181 857 12.4% 26.0% Arizona $9,308 50,224 $8,005 45,465 90.5% 77.9% $21,754 4,759 9.5% 22.1% North Carolina $9,281 90,745 $8,164 83,041 91.5% 80.5% $21,322 7,704 8.5% 19.5% Kentucky $9,194 37,657 $7,987 33,941 90.1% 78.3% $20,220 3,716 9.9% 21.7% Louisiana $9,114 37,475 $7,898 33,306 88.9% 77.0% $18,831 4,169 11.1% 23.0% Mississippi $8,949 25,620 $8,065 23,589 92.1% 83.0% $19,219 2,031 7.9% 17.0% Texas $8,928 208,986 $8,011 193,303 92.5% 83.0% $20,230 15,683 7.5% 17.0% Rhode Island $8,893 17,301 $7,296 15,283 88.3% 72.5% $20,982 2,018 11.7% 27.5% Montana $8,871 12,444 $7,628 11,073 89.0% 76.5% $18,905 1,371 11.0% 23.5% Nevada $8,771 20,620 $7,719 18,970 92.0% 81.0% $20,869 1,650 8.0% 19.0% Tennessee $8,698 54,108 $7,685 49,801 92.0% 81.3% $20,408 4,307 8.0% 18.7% Florida $8,658 179,850 $7,775 167,289 93.0% 83.5% $20,420 12,561 7.0% 16.5% Nebraska $8,623 23,143 $7,634 21,258 91.9% 81.3% $19,776 1,885 8.1% 18.7% Idaho $8,604 14,185 $7,518 12,752 89.9% 78.6% $18,265 1,433 10.1% 21.4% South Dakota $8,548 9,823 $7,425 8,993 91.6% 79.5% $20,720 830 8.4% 20.5% Washington $8,531 85,094 $7,061 75,920 89.2% 73.8% $20,699 9,174 10.8% 26.2% Hawaii $8,491 15,895 $6,915 14,217 89.4% 72.8% $21,843 1,678 10.6% 27.2% South Carolina $8,459 44,708 $7,337 40,623 90.9% 78.8% $19,619 4,085 9.1% 21.2%
VA Office of Inspector General 148
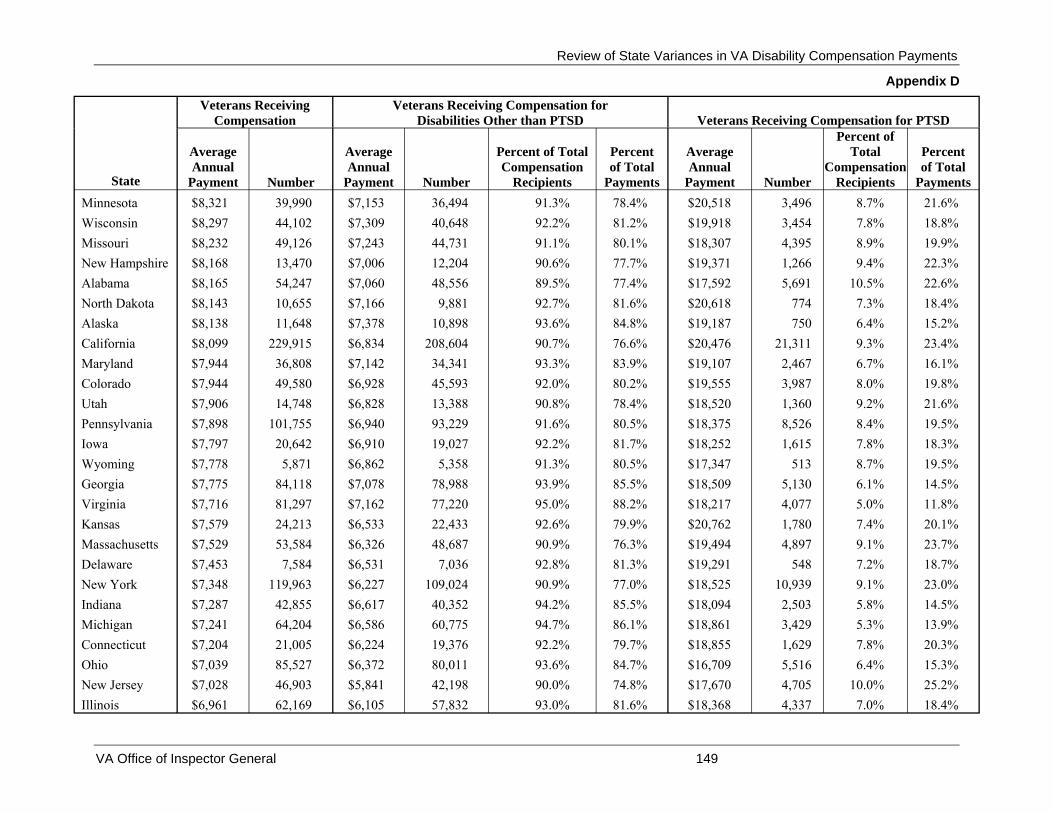
Review of State Variances in VA Disability Compensation Payments
Appendix D
Veterans Receiving Veterans Receiving Compensation for Compensation Disabilities Other than PTSD Veterans Receiving Compensation for PTSD
Percent of
State
Average Annual
Payment Number
Average Annual
Payment Number
Percent of Total Compensation
Recipients
Percent of Total
Payments
Average Annual
Payment Number
Total Compensation
Recipients
Percent of Total
Payments Minnesota $8,321 39,990 $7,153 36,494 91.3% 78.4% $20,518 3,496 8.7% 21.6% Wisconsin $8,297 44,102 $7,309 40,648 92.2% 81.2% $19,918 3,454 7.8% 18.8% Missouri $8,232 49,126 $7,243 44,731 91.1% 80.1% $18,307 4,395 8.9% 19.9% New Hampshire $8,168 13,470 $7,006 12,204 90.6% 77.7% $19,371 1,266 9.4% 22.3% Alabama $8,165 54,247 $7,060 48,556 89.5% 77.4% $17,592 5,691 10.5% 22.6% North Dakota $8,143 10,655 $7,166 9,881 92.7% 81.6% $20,618 774 7.3% 18.4% Alaska $8,138 11,648 $7,378 10,898 93.6% 84.8% $19,187 750 6.4% 15.2% California $8,099 229,915 $6,834 208,604 90.7% 76.6% $20,476 21,311 9.3% 23.4% Maryland $7,944 36,808 $7,142 34,341 93.3% 83.9% $19,107 2,467 6.7% 16.1% Colorado $7,944 49,580 $6,928 45,593 92.0% 80.2% $19,555 3,987 8.0% 19.8% Utah $7,906 14,748 $6,828 13,388 90.8% 78.4% $18,520 1,360 9.2% 21.6% Pennsylvania $7,898 101,755 $6,940 93,229 91.6% 80.5% $18,375 8,526 8.4% 19.5% Iowa $7,797 20,642 $6,910 19,027 92.2% 81.7% $18,252 1,615 7.8% 18.3% Wyoming $7,778 5,871 $6,862 5,358 91.3% 80.5% $17,347 513 8.7% 19.5% Georgia $7,775 84,118 $7,078 78,988 93.9% 85.5% $18,509 5,130 6.1% 14.5% Virginia $7,716 81,297 $7,162 77,220 95.0% 88.2% $18,217 4,077 5.0% 11.8% Kansas $7,579 24,213 $6,533 22,433 92.6% 79.9% $20,762 1,780 7.4% 20.1% Massachusetts $7,529 53,584 $6,326 48,687 90.9% 76.3% $19,494 4,897 9.1% 23.7% Delaware $7,453 7,584 $6,531 7,036 92.8% 81.3% $19,291 548 7.2% 18.7% New York $7,348 119,963 $6,227 109,024 90.9% 77.0% $18,525 10,939 9.1% 23.0% Indiana $7,287 42,855 $6,617 40,352 94.2% 85.5% $18,094 2,503 5.8% 14.5% Michigan $7,241 64,204 $6,586 60,775 94.7% 86.1% $18,861 3,429 5.3% 13.9% Connecticut $7,204 21,005 $6,224 19,376 92.2% 79.7% $18,855 1,629 7.8% 20.3% Ohio $7,039 85,527 $6,372 80,011 93.6% 84.7% $16,709 5,516 6.4% 15.3% New Jersey $7,028 46,903 $5,841 42,198 90.0% 74.8% $17,670 4,705 10.0% 25.2% Illinois $6,961 62,169 $6,105 57,832 93.0% 81.6% $18,368 4,337 7.0% 18.4%
VA Office of Inspector General 149
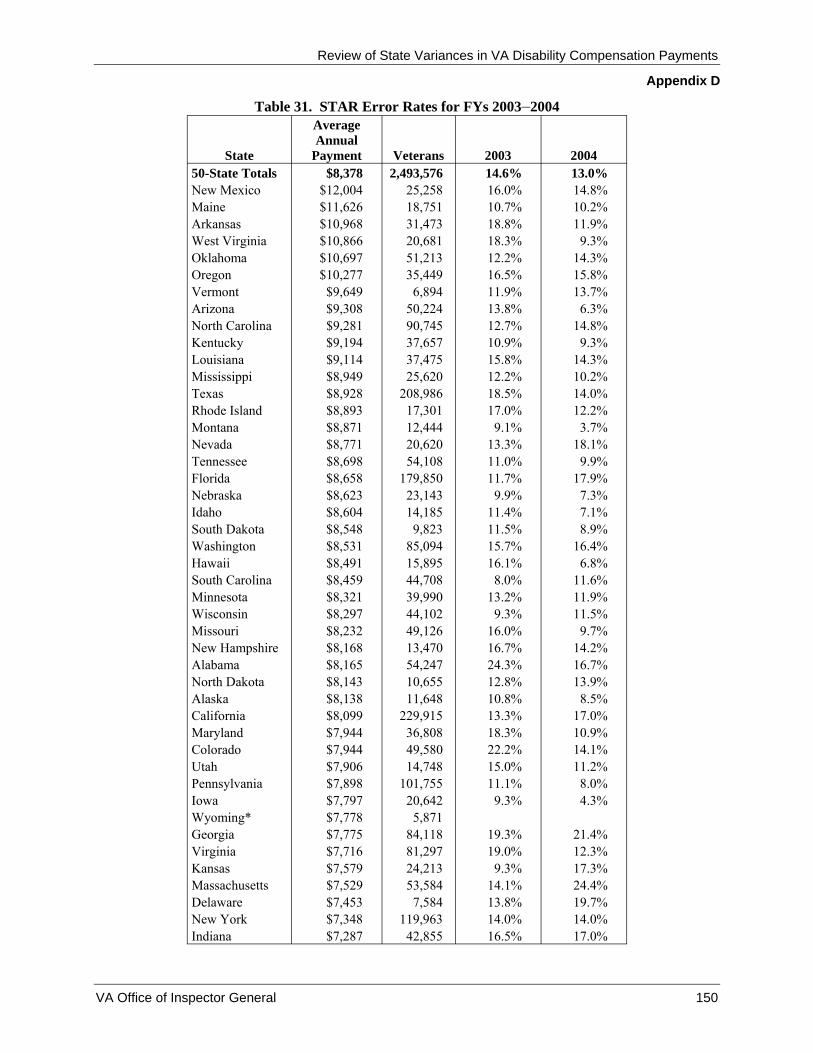
Review of State Variances in VA Disability Compensation Payments
Appendix D
Table 31. STAR Error Rates for FYs 2003–2004 Average Annual
State Payment Veterans 2003 2004 50-State Totals $8,378 2,493,576 14.6% 13.0% New Mexico $12,004 25,258 16.0% 14.8% Maine $11,626 18,751 10.7% 10.2% Arkansas $10,968 31,473 18.8% 11.9% West Virginia $10,866 20,681 18.3% 9.3% Oklahoma $10,697 51,213 12.2% 14.3% Oregon $10,277 35,449 16.5% 15.8% Vermont $9,649 6,894 11.9% 13.7% Arizona $9,308 50,224 13.8% 6.3% North Carolina $9,281 90,745 12.7% 14.8% Kentucky $9,194 37,657 10.9% 9.3% Louisiana $9,114 37,475 15.8% 14.3% Mississippi $8,949 25,620 12.2% 10.2% Texas $8,928 208,986 18.5% 14.0% Rhode Island $8,893 17,301 17.0% 12.2% Montana $8,871 12,444 9.1% 3.7% Nevada $8,771 20,620 13.3% 18.1% Tennessee $8,698 54,108 11.0% 9.9% Florida $8,658 179,850 11.7% 17.9% Nebraska $8,623 23,143 9.9% 7.3% Idaho $8,604 14,185 11.4% 7.1% South Dakota $8,548 9,823 11.5% 8.9% Washington $8,531 85,094 15.7% 16.4% Hawaii $8,491 15,895 16.1% 6.8% South Carolina $8,459 44,708 8.0% 11.6% Minnesota $8,321 39,990 13.2% 11.9% Wisconsin $8,297 44,102 9.3% 11.5% Missouri $8,232 49,126 16.0% 9.7% New Hampshire $8,168 13,470 16.7% 14.2% Alabama $8,165 54,247 24.3% 16.7% North Dakota $8,143 10,655 12.8% 13.9% Alaska $8,138 11,648 10.8% 8.5% California $8,099 229,915 13.3% 17.0% Maryland $7,944 36,808 18.3% 10.9% Colorado $7,944 49,580 22.2% 14.1% Utah $7,906 14,748 15.0% 11.2% Pennsylvania $7,898 101,755 11.1% 8.0% Iowa $7,797 20,642 9.3% 4.3% Wyoming* $7,778 5,871 Georgia $7,775 84,118 19.3% 21.4% Virginia $7,716 81,297 19.0% 12.3% Kansas $7,579 24,213 9.3% 17.3% Massachusetts $7,529 53,584 14.1% 24.4% Delaware $7,453 7,584 13.8% 19.7% New York $7,348 119,963 14.0% 14.0% Indiana $7,287 42,855 16.5% 17.0%
VA Office of Inspector General 150
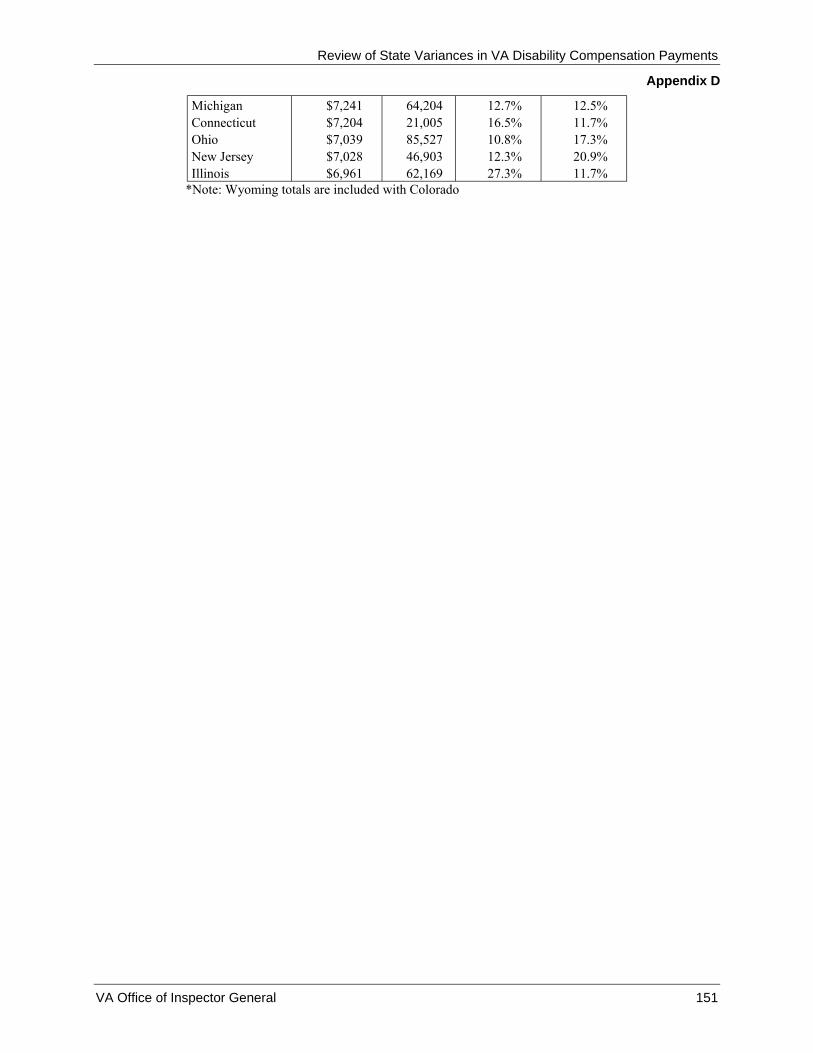
Review of State Variances in VA Disability Compensation Payments
Appendix D
Michigan ConnecticutOhioNew Jersey Illinois
$7,241 $7,204
$7,039 $7,028 $6,961
64,204 21,005 85,527 46,903 62,169
12.7% 16.5% 10.8% 12.3% 27.3%
12.5% 11.7% 17.3% 20.9% 11.7%
*Note: Wyoming totals are included with Colorado
VA Office of Inspector General 151
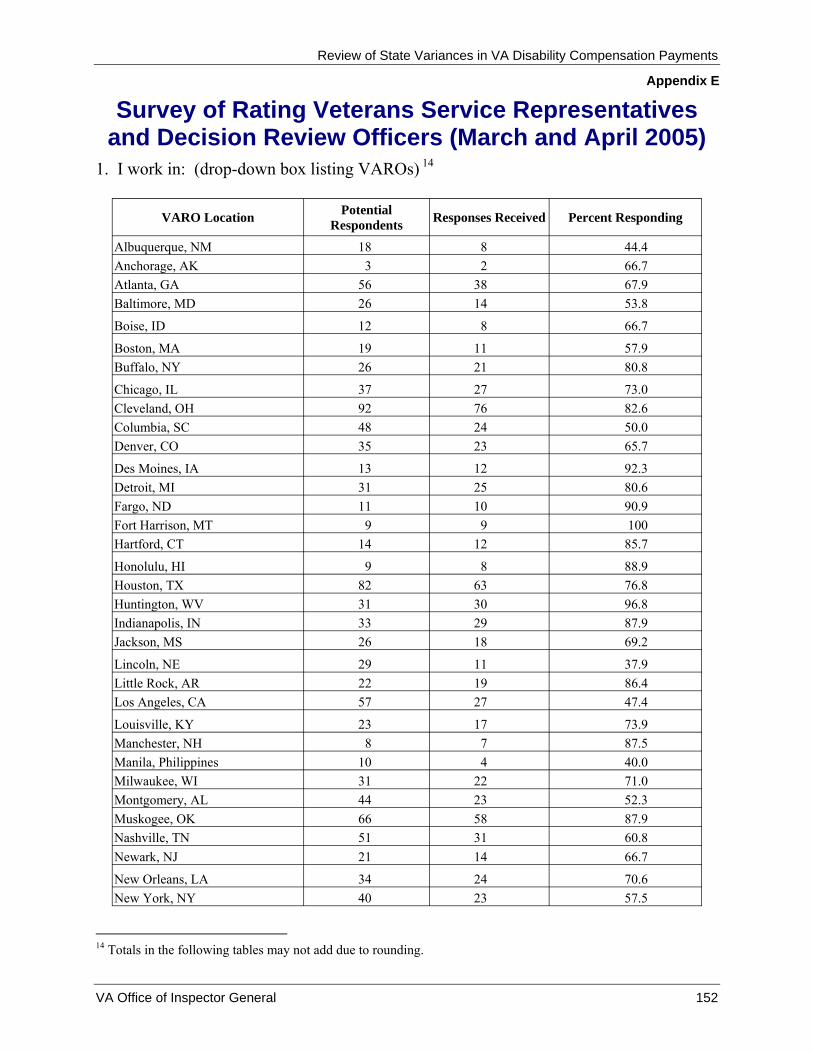
Review of State Variances in VA Disability Compensation Payments
Appendix E
Survey of Rating Veterans Service Representatives and Decision Review Officers (March and April 2005)
1. I work in: (drop-down box listing VAROs) 14
VARO Location Potential Respondents Responses Received Percent Responding
Albuquerque, NM 18 8 44.4 Anchorage, AK 3 2 66.7 Atlanta, GA 56 38 67.9 Baltimore, MD 26 14 53.8
Boise, ID 12 8 66.7
Boston, MA 19 11 57.9 Buffalo, NY 26 21 80.8
Chicago, IL 37 27 73.0 Cleveland, OH 92 76 82.6 Columbia, SC 48 24 50.0 Denver, CO 35 23 65.7
Des Moines, IA 13 12 92.3 Detroit, MI 31 25 80.6 Fargo, ND 11 10 90.9 Fort Harrison, MT 9 9 100 Hartford, CT 14 12 85.7
Honolulu, HI 9 8 88.9 Houston, TX 82 63 76.8 Huntington, WV 31 30 96.8 Indianapolis, IN 33 29 87.9 Jackson, MS 26 18 69.2
Lincoln, NE 29 11 37.9 Little Rock, AR 22 19 86.4 Los Angeles, CA 57 27 47.4
Louisville, KY 23 17 73.9 Manchester, NH 8 7 87.5 Manila, Philippines 10 4 40.0 Milwaukee, WI 31 22 71.0 Montgomery, AL 44 23 52.3 Muskogee, OK 66 58 87.9 Nashville, TN 51 31 60.8 Newark, NJ 21 14 66.7
New Orleans, LA 34 24 70.6 New York, NY 40 23 57.5
14 Totals in the following tables may not add due to rounding.
VA Office of Inspector General 152

Review of State Variances in VA Disability Compensation Payments
Appendix E
VARO Location Potential Respondents Responses Received Percent Responding
Oakland, CA 66 39 59.1 Philadelphia, PA 70 52 74.3
Phoenix, AZ 41 26 63.4 Pittsburgh, PA 21 12 57.1 Portland, OR 25 13 52.0 Providence, RI 10 5 50.0 Reno, NV 13 11 84.6
Roanoke, VA 42 27 64.3 St. Louis, MO 55 47 85.5
St. Paul, MN 30 21 70.0
St. Petersburg, FL 128 74 57.8
Salt Lake City, UT 19 13 68.4 San Diego, CA 53 34 64.2 San Juan, PR 29 10 34.5
Seattle, WA 63 53 84.1 Sioux Falls, SD 9 8 88.9 Togus, ME 27 23 85.2 Waco, TX 96 71 74.0
Washington, DC 15 28 7 25.0 White River Junction, VT 4 4 100 Wichita, KS 12 7 58.3 Wilmington, DE 3 3 100 Winston-Salem, NC 81 41 50.6
Total 1992 1349 67.7
2. My current position is:
Response No. Percent RVSR 1064 80.1 DRO 246 18.5 Other (Please specify) 16 19 1.4
Total 1329 100
Each respondent whose answer to Question 2 was “RVSR” was asked the two following questions:
15 These numbers include employees of both VARO Washington and the Appeals Management Center. 16 Respondents whose answer to Question 2 was “Other” included coaches, RVSR trainees, specialized RVSRs, a Rating Quality Officer, and an RVSR currently assigned to another position.
VA Office of Inspector General 153
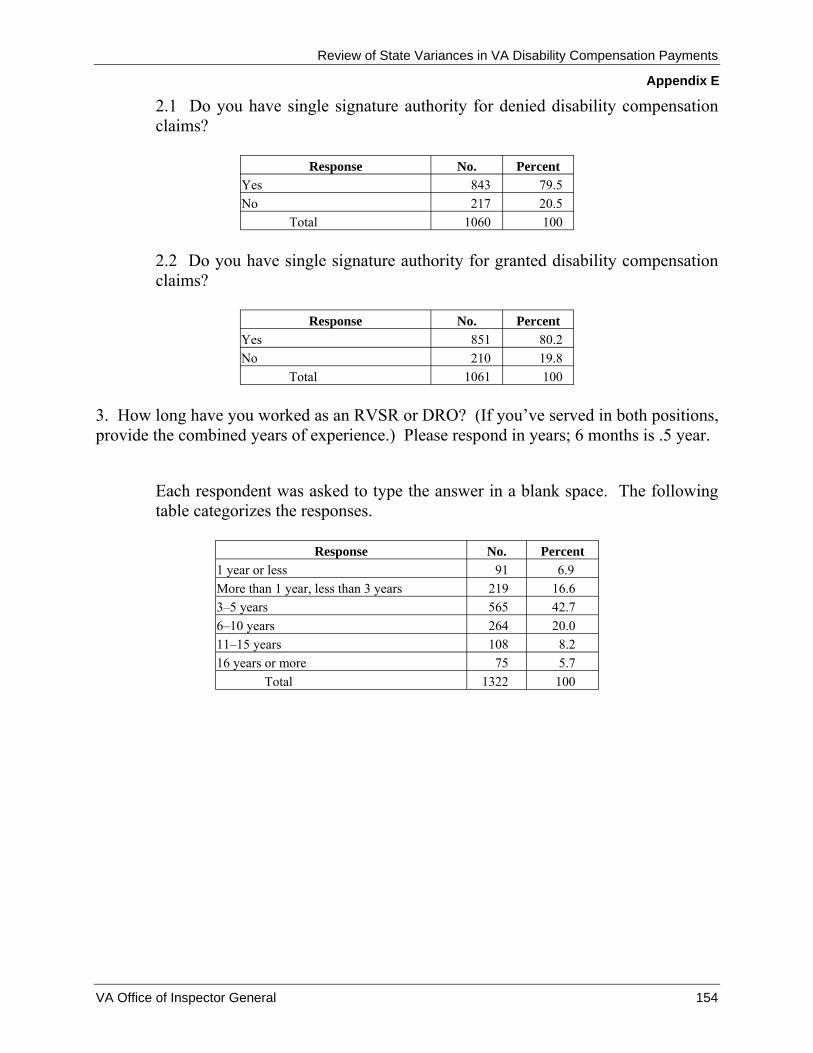
Review of State Variances in VA Disability Compensation Payments
Appendix E
2.1 Do you have single signature authority for denied disability compensation claims?
Response No. Percent Yes 843 79.5 No 217 20.5
Total 1060 100
2.2 Do you have single signature authority for granted disability compensation claims?
Response No. Percent Yes 851 80.2 No 210 19.8
Total 1061 100
3. How long have you worked as an RVSR or DRO? (If you’ve served in both positions, provide the combined years of experience.) Please respond in years; 6 months is .5 year.
Each respondent was asked to type the answer in a blank space. The following table categorizes the responses.
Response No. Percent 1 year or less 91 6.9 More than 1 year, less than 3 years 219 16.6 3–5 years 565 42.7 6–10 years 264 20.0 11–15 years 108 8.2 16 years or more 75 5.7
Total 1322 100
VA Office of Inspector General 154

Review of State Variances in VA Disability Compensation Payments
Appendix E
4. How long have you worked (in any capacity) in the Veterans Benefits Administration? Please respond in years. Three months is .25 year.
Each respondent was asked to type the answer in a blank space. The following table categorizes the responses.
Response No. Percent 1 year or less 4 0.3 More than 1 year, less than 3 years 120 9.0 3–5 years 361 27.1 6–10 years 119 8.9 11–15 years 253 19.0 16 years or more 473 35.6
Total 1330 100
5. Have you completed training for, or worked in, any of the following occupations? Check all that apply.
Response No. Percent Physician 8 0.6 Physician Assistant 4 0.3 Registered Nurse 175 13.4 Licensed Practical Nurse or Licensed Vocational Nurse 20 1.5 Attorney 64 4.9 Paralegal 43 3.3 Veterans Service Organization Representative 66 5.1 Veterans Service Representative (Adjudicator) 811 62.1 Other Clinical Profession (Please specify) 17 116 8.9
Total 1,307 100
6. Are you a veteran?
Response No. Percent Yes 601 44.9 No 738 55.1
Total 1339 100
Each respondent who answered “Yes” to Question 6 was asked the three following questions:
The most frequently mentioned clinical occupations were military medical corpsman, social worker, and emergency medical technician.
VA Office of Inspector General 155
17
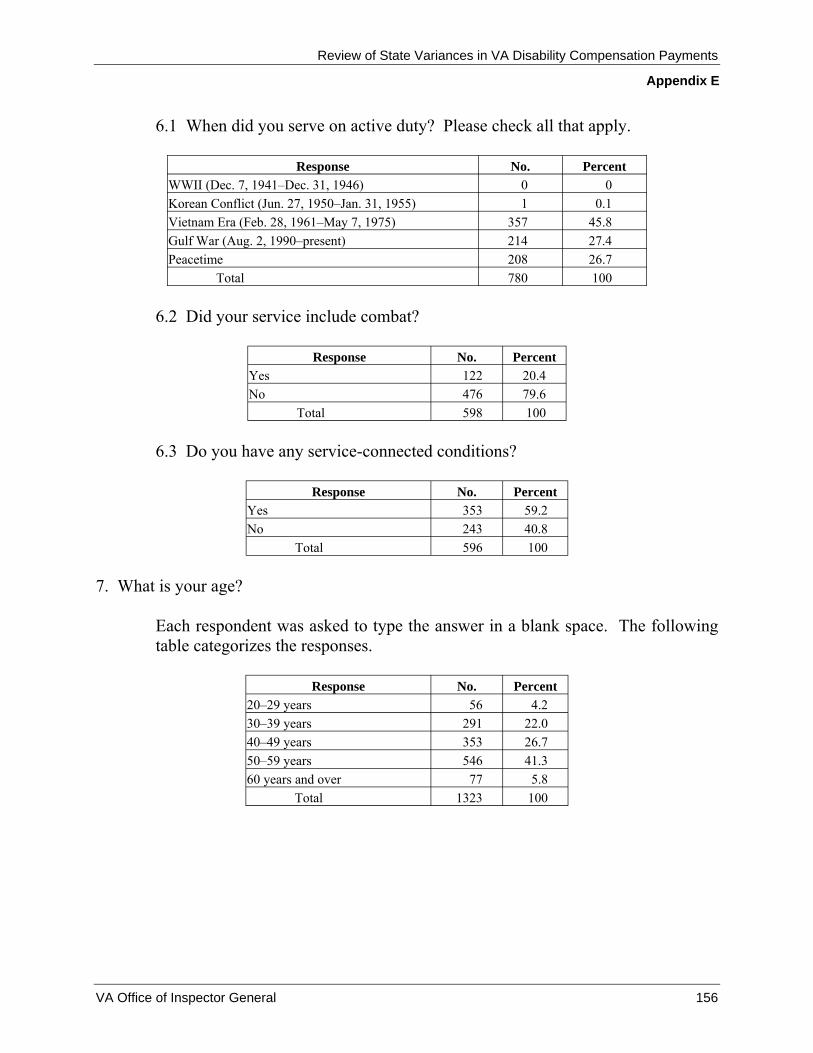
Review of State Variances in VA Disability Compensation Payments
Appendix E
6.1 When did you serve on active duty? Please check all that apply.
Response No. Percent WWII (Dec. 7, 1941–Dec. 31, 1946) 0 0 Korean Conflict (Jun. 27, 1950–Jan. 31, 1955) 1 0.1 Vietnam Era (Feb. 28, 1961–May 7, 1975) 357 45.8 Gulf War (Aug. 2, 1990–present) 214 27.4 Peacetime 208 26.7
Total 780 100
6.2 Did your service include combat?
Response No. Percent Yes 122 20.4 No 476 79.6
Total 598 100
6.3 Do you have any service-connected conditions?
Response No. Percent Yes 353 59.2 No 243 40.8
Total 596 100
7. What is your age?
Each respondent was asked to type the answer in a blank space. The following table categorizes the responses.
Response No. Percent 20–29 years 56 4.2 30–39 years 291 22.0 40–49 years 353 26.7 50–59 years 546 41.3 60 years and over 77 5.8
Total 1323 100
VA Office of Inspector General 156

Review of State Variances in VA Disability Compensation Payments
Appendix E
8. Have you attended centralized Rating Veterans Service Representative training in a formal classroom environment?
Response No. Percent Yes 870 64.9 No 470 35.1
Total 1340 100
9. How often does your office provide formal classroom instruction on rating policies and procedures?
Response No. Percent Once a week 241 18.0 Once a month 610 45.6 Once a quarter 241 18.0 Once biannually (twice a year) 101 7.5 Once annually or less often 112 8.4 Never 33 2.5
Total 1338 100
10. In the past 12 months, approximately how many hours of formal classroom instruction on rating policies and procedures have you received?
Response No. Percent None 57 4.3 1–10 hours 544 40.7 11–20 hours 322 24.1 21–30 hours 116 8.7 31–40 hours 78 5.8 41–50 hours 96 7.2 More than 50 hours 123 9.2
Total 1336 100
VA Office of Inspector General 157

Review of State Variances in VA Disability Compensation Payments
Appendix E
11. Approximately how often does your Rating Team spend time together reviewing and discussing manual changes, court decisions, frequently asked questions, and related issues?
Response No. Percent Once a week 246 18.5 Once a month 442 33.2 Once a quarter (every 3 months) 200 15.0 Once biannually (twice a year) 76 5.7 Once annually or less often 130 9.8 Never 239 17.9
Total 1333 100
12. Did you watch the VBN broadcast “C&P: Requesting Medical Opinions,” which was initially transmitted on March 11, 2004, or a video recording of it?
Response No. Percent Yes 979 73.4 No 355 26.6
Total 1334 100
13. Did you watch the VBN broadcast “C&P: Evaluating Degenerative & Traumatic Arthritis Claims,” which was initially transmitted on September 23, 2004, or a video recording of it?
Response No. Percent Yes 944 70.7 No 392 29.3
Total 1336 100
14. Overall, how would you evaluate the quality of the VBA rating training, including both formal classroom instruction and on-the-job training, you have received?
Response No. Percent Very good 182 13.6 Good 586 43.8 Neither good nor poor 356 26.6 Poor 159 11.9 Very poor 55 4.1
Total 1338 100
VA Office of Inspector General 158
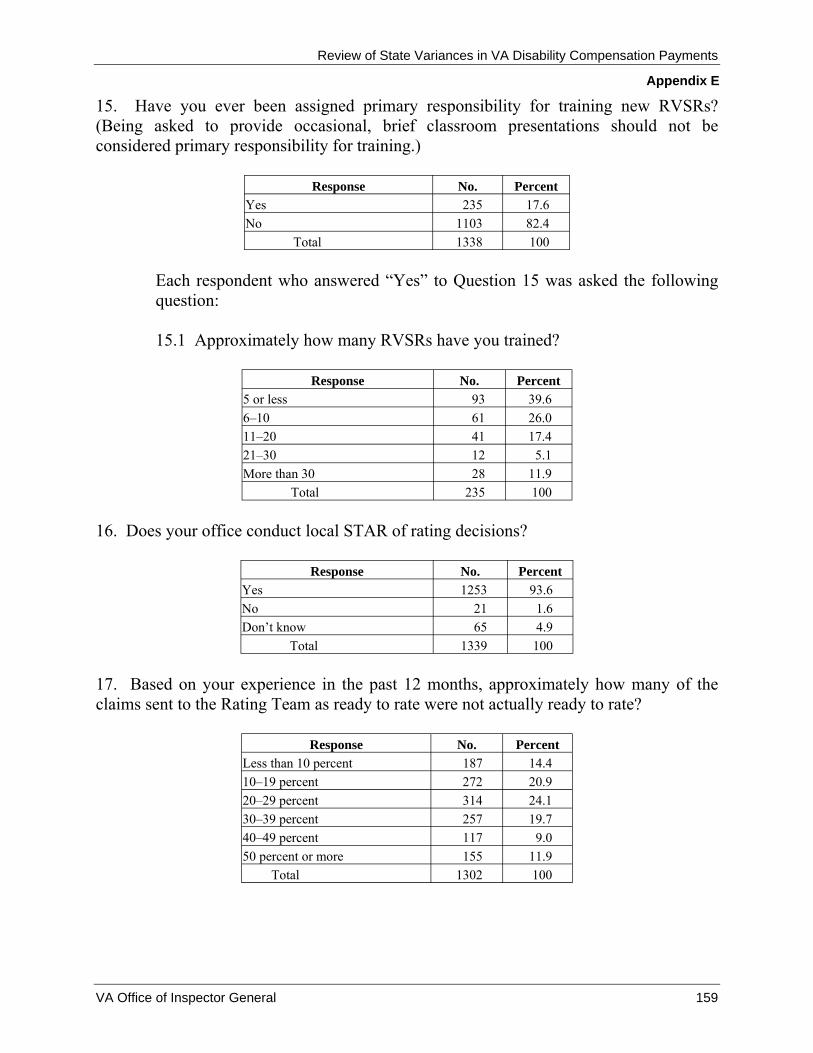
Review of State Variances in VA Disability Compensation Payments
Appendix E
15. Have you ever been assigned primary responsibility for training new RVSRs? (Being asked to provide occasional, brief classroom presentations should not be considered primary responsibility for training.)
Response No. Percent Yes 235 17.6 No 1103 82.4
Total 1338 100
Each respondent who answered “Yes” to Question 15 was asked the following question:
15.1 Approximately how many RVSRs have you trained?
Response No. Percent 5 or less 93 39.6 6–10 61 26.0 11–20 41 17.4 21–30 12 5.1 More than 30 28 11.9
Total 235 100
16. Does your office conduct local STAR of rating decisions?
Response No. Percent Yes 1253 93.6 No 21 1.6 Don’t know 65 4.9
Total 1339 100
17. Based on your experience in the past 12 months, approximately how many of the claims sent to the Rating Team as ready to rate were not actually ready to rate?
Response No. Percent Less than 10 percent 187 14.4 10–19 percent 272 20.9 20–29 percent 314 24.1 30–39 percent 257 19.7 40–49 percent 117 9.0 50 percent or more 155 11.9
Total 1302 100
VA Office of Inspector General 159
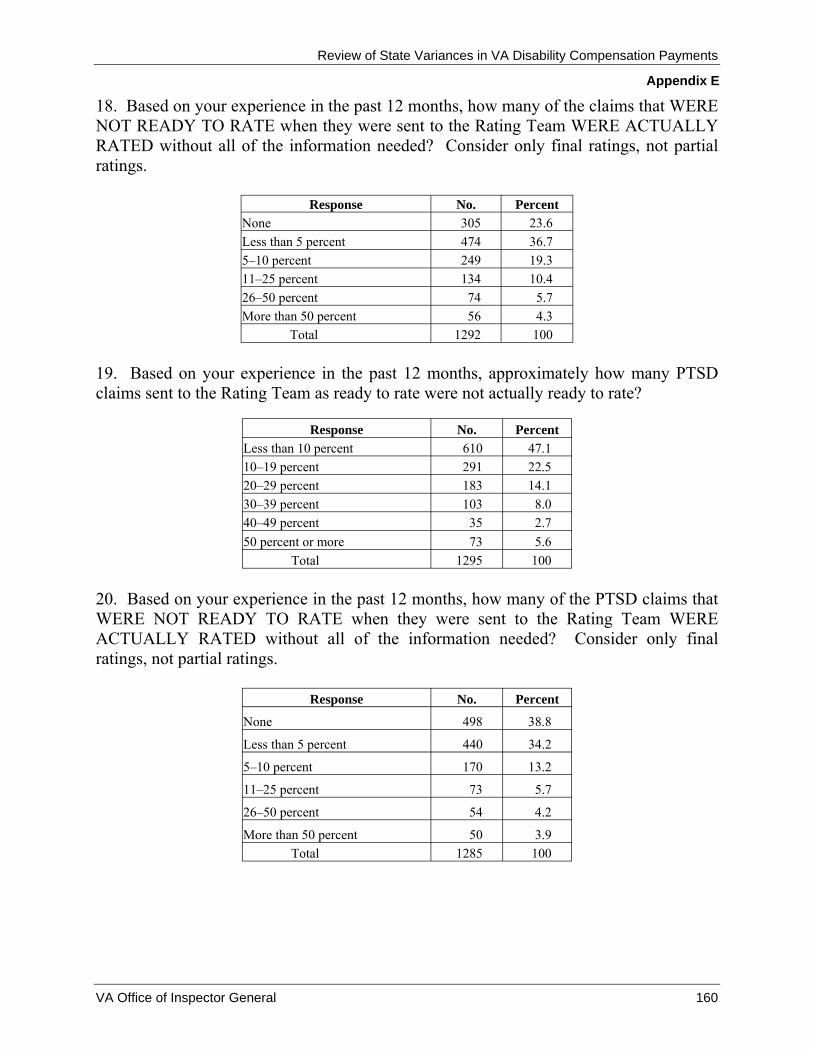
Review of State Variances in VA Disability Compensation Payments
Appendix E
18. Based on your experience in the past 12 months, how many of the claims that WERE NOT READY TO RATE when they were sent to the Rating Team WERE ACTUALLY RATED without all of the information needed? Consider only final ratings, not partial ratings.
Response No. Percent None 305 23.6 Less than 5 percent 474 36.7 5–10 percent 249 19.3 11–25 percent 134 10.4 26–50 percent 74 5.7 More than 50 percent 56 4.3
Total 1292 100
19. Based on your experience in the past 12 months, approximately how many PTSD claims sent to the Rating Team as ready to rate were not actually ready to rate?
Response No. Percent Less than 10 percent 610 47.1 10–19 percent 291 22.5 20–29 percent 183 14.1 30–39 percent 103 8.0 40–49 percent 35 2.7 50 percent or more 73 5.6
Total 1295 100
20. Based on your experience in the past 12 months, how many of the PTSD claims that WERE NOT READY TO RATE when they were sent to the Rating Team WERE ACTUALLY RATED without all of the information needed? Consider only final ratings, not partial ratings.
Response No. Percent
None 498 38.8
Less than 5 percent 440 34.2
5–10 percent 170 13.2
11–25 percent 73 5.7
26–50 percent 54 4.2
More than 50 percent 50 3.9 Total 1285 100
VA Office of Inspector General 160
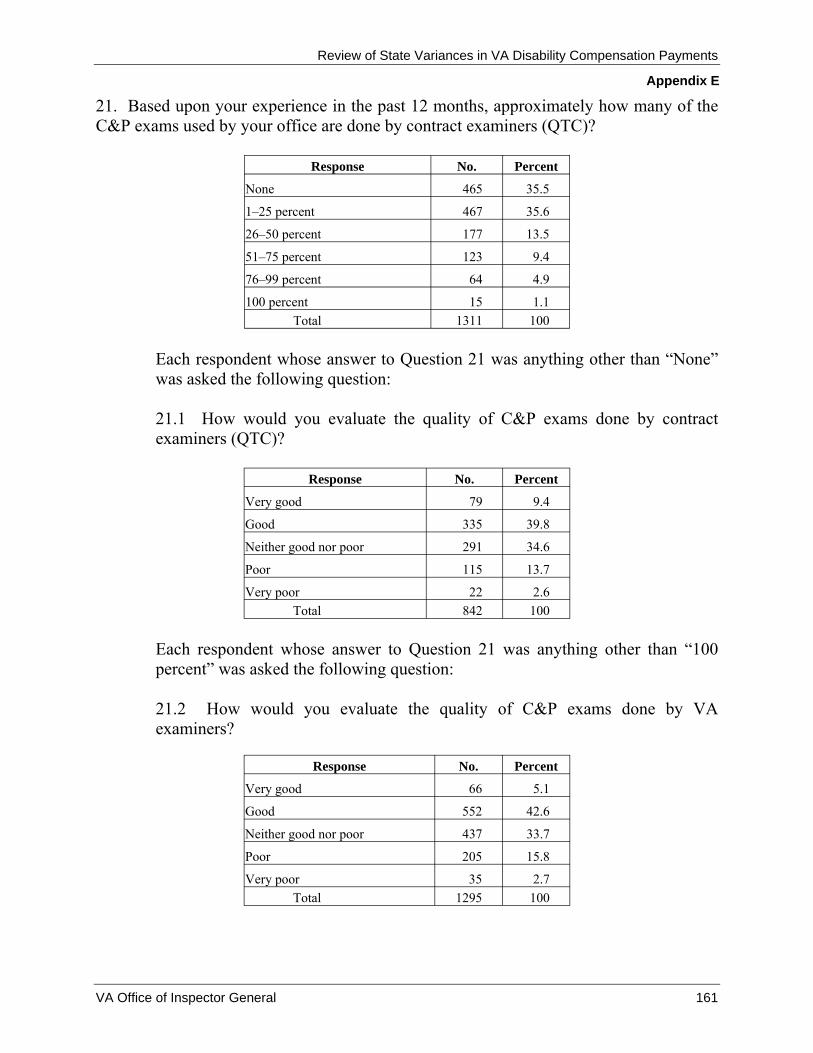
Review of State Variances in VA Disability Compensation Payments
Appendix E
21. Based upon your experience in the past 12 months, approximately how many of the C&P exams used by your office are done by contract examiners (QTC)?
Response No. Percent
None 465 35.5
1–25 percent 467 35.6
26–50 percent 177 13.5
51–75 percent 123 9.4
76–99 percent 64 4.9
100 percent 15 1.1 Total 1311 100
Each respondent whose answer to Question 21 was anything other than “None” was asked the following question:
21.1 How would you evaluate the quality of C&P exams done by contract examiners (QTC)?
Response No. Percent
Very good 79 9.4
Good 335 39.8
Neither good nor poor 291 34.6
Poor 115 13.7
Very poor 22 2.6 Total 842 100
Each respondent whose answer to Question 21 was anything other than “100 percent” was asked the following question:
21.2 How would you evaluate the quality of C&P exams done by VA examiners?
Response No. Percent
Very good 66 5.1
Good 552 42.6
Neither good nor poor 437 33.7
Poor 205 15.8
Very poor 35 2.7 Total 1295 100
VA Office of Inspector General 161

Review of State Variances in VA Disability Compensation Payments
Appendix E
22. Do you obtain the concurrence of another Rating Team member, a supervisor, or a DRO before returning inadequate C&P exams?
Response No. Percent Yes 966 72.3 No 370 27.7
Total 1336 100
23. Based upon your experience in the past 12 months, approximately how many C&P exams WERE returned by your office because they were insufficient for rating purposes?
Response No. Percent
Less than 1 percent 245 18.8
1–5 percent 517 39.6
6–10 percent 348 26.6
11–19 percent 111 8.5
20–29 percent 62 4.7
30 or more percent 23 1.8 Total 1306 100
24. Based upon your experience in the past 12 months, approximately what percentage of C&P exams SHOULD HAVE BEEN returned by your office because they were insufficient for rating purposes?
Response No. Percent
Less than 1 percent 110 8.4
1–5 percent 256 19.6
6–10 percent 331 25.4
11–19 percent 192 14.7
20–29 percent 205 15.7
30 or more percent 210 16.1 Total 1304 100
VA Office of Inspector General 162
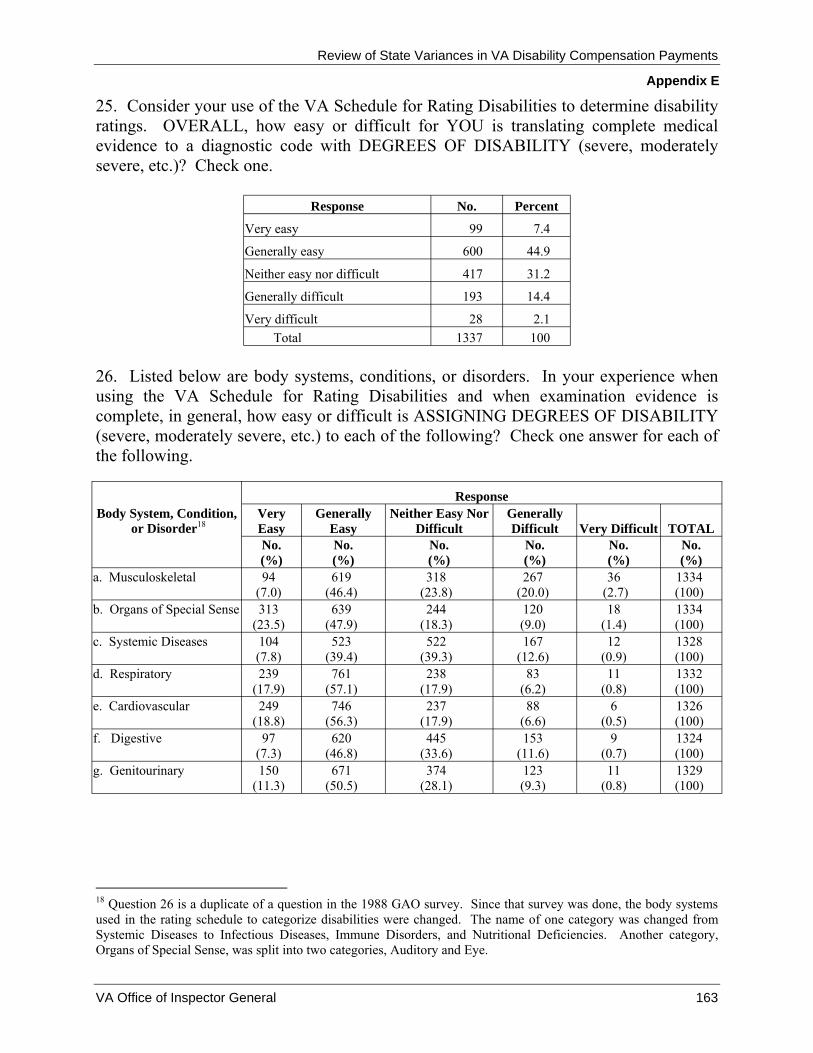
Review of State Variances in VA Disability Compensation Payments
Appendix E
25. Consider your use of the VA Schedule for Rating Disabilities to determine disability ratings. OVERALL, how easy or difficult for YOU is translating complete medical evidence to a diagnostic code with DEGREES OF DISABILITY (severe, moderately severe, etc.)? Check one.
Response No. Percent
Very easy 99 7.4
Generally easy 600 44.9
Neither easy nor difficult 417 31.2
Generally difficult 193 14.4
Very difficult 28 2.1 Total 1337 100
26. Listed below are body systems, conditions, or disorders. In your experience when using the VA Schedule for Rating Disabilities and when examination evidence is complete, in general, how easy or difficult is ASSIGNING DEGREES OF DISABILITY (severe, moderately severe, etc.) to each of the following? Check one answer for each of the following.
Body System, Condition, or Disorder18
Response Very Easy
Generally Easy
Neither Easy Nor Difficult
Generally Difficult Very Difficult TOTAL
No. No. No. No. No. No. (%) (%) (%) (%) (%) (%)
a. Musculoskeletal 94 619 318 267 36 1334 (7.0) (46.4) (23.8) (20.0) (2.7) (100)
b. Organs of Special Sense 313 639 244 120 18 1334 (23.5) (47.9) (18.3) (9.0) (1.4) (100)
c. Systemic Diseases 104 523 522 167 12 1328 (7.8) (39.4) (39.3) (12.6) (0.9) (100)
d. Respiratory 239 761 238 83 11 1332 (17.9) (57.1) (17.9) (6.2) (0.8) (100)
e. Cardiovascular 249 746 237 88 6 1326 (18.8) (56.3) (17.9) (6.6) (0.5) (100)
f. Digestive 97 620 445 153 9 1324 (7.3) (46.8) (33.6) (11.6) (0.7) (100)
g. Genitourinary 150 671 374 123 11 1329 (11.3) (50.5) (28.1) (9.3) (0.8) (100)
18 Question 26 is a duplicate of a question in the 1988 GAO survey. Since that survey was done, the body systems used in the rating schedule to categorize disabilities were changed. The name of one category was changed from Systemic Diseases to Infectious Diseases, Immune Disorders, and Nutritional Deficiencies. Another category, Organs of Special Sense, was split into two categories, Auditory and Eye.
VA Office of Inspector General 163
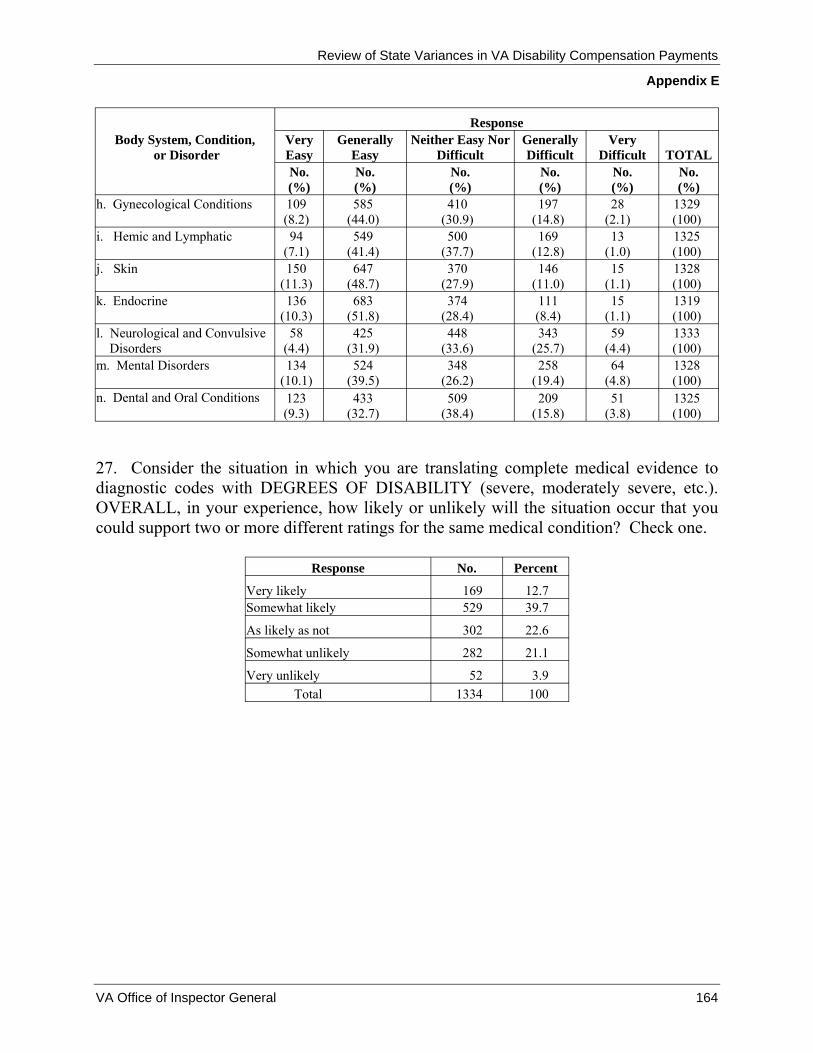
Review of State Variances in VA Disability Compensation Payments
Appendix E
Body System, Condition, or Disorder
Response Very Easy
Generally Easy
Neither Easy Nor Difficult
Generally Difficult
Very Difficult TOTAL
No. (%)
No. (%)
No. (%)
No. (%)
No. (%)
No. (%)
h. Gynecological Conditions 109 (8.2)
585 (44.0)
410 (30.9)
197 (14.8)
28 (2.1)
1329 (100)
i. Hemic and Lymphatic 94 (7.1)
549 (41.4)
500 (37.7)
169 (12.8)
13 (1.0)
1325 (100)
j. Skin 150 (11.3)
647 (48.7)
370 (27.9)
146 (11.0)
15 (1.1)
1328 (100)
k. Endocrine 136 (10.3)
683 (51.8)
374 (28.4)
111 (8.4)
15 (1.1)
1319 (100)
l. Neurological and Convulsive Disorders
58 (4.4)
425 (31.9)
448 (33.6)
343 (25.7)
59 (4.4)
1333 (100)
m. Mental Disorders 134 (10.1)
524 (39.5)
348 (26.2)
258 (19.4)
64 (4.8)
1328 (100)
n. Dental and Oral Conditions 123 (9.3)
433 (32.7)
509 (38.4)
209 (15.8)
51 (3.8)
1325 (100)
27. Consider the situation in which you are translating complete medical evidence to diagnostic codes with DEGREES OF DISABILITY (severe, moderately severe, etc.). OVERALL, in your experience, how likely or unlikely will the situation occur that you could support two or more different ratings for the same medical condition? Check one.
Response No. Percent
Very likely 169 12.7 Somewhat likely 529 39.7
As likely as not 302 22.6
Somewhat unlikely 282 21.1
Very unlikely 52 3.9 Total 1334 100
VA Office of Inspector General 164
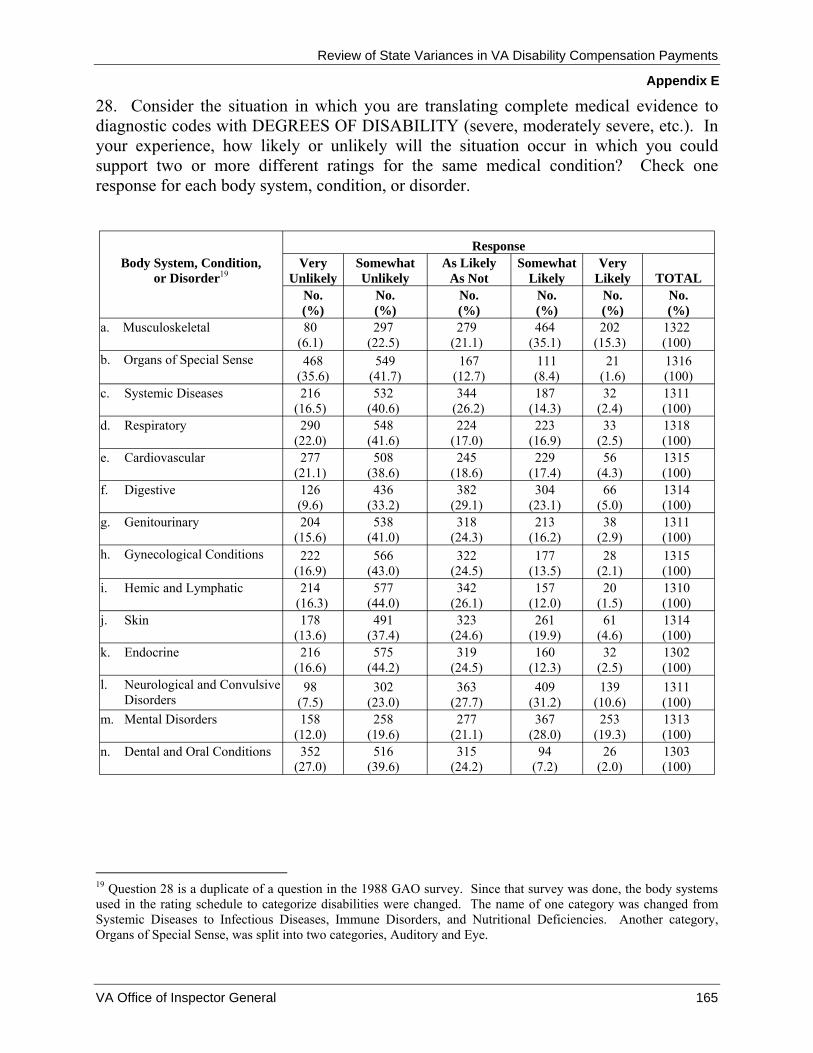
Review of State Variances in VA Disability Compensation Payments
Appendix E
28. Consider the situation in which you are translating complete medical evidence to diagnostic codes with DEGREES OF DISABILITY (severe, moderately severe, etc.). In your experience, how likely or unlikely will the situation occur in which you could support two or more different ratings for the same medical condition? Check one response for each body system, condition, or disorder.
Body System, Condition, or Disorder19
Response Very
Unlikely Somewhat Unlikely
As Likely As Not
Somewhat Likely
Very Likely TOTAL
No. (%)
No. (%)
No. (%)
No. (%)
No. (%)
No. (%)
a. Musculoskeletal 80 (6.1)
297 (22.5)
279 (21.1)
464 (35.1)
202 (15.3)
1322 (100)
b. Organs of Special Sense 468 (35.6)
549 (41.7)
167 (12.7)
111 (8.4)
21 (1.6)
1316 (100)
c. Systemic Diseases 216 (16.5)
532 (40.6)
344 (26.2)
187 (14.3)
32 (2.4)
1311 (100)
d. Respiratory 290 (22.0)
548 (41.6)
224 (17.0)
223 (16.9)
33 (2.5)
1318 (100)
e. Cardiovascular 277 (21.1)
508 (38.6)
245 (18.6)
229 (17.4)
56 (4.3)
1315 (100)
f. Digestive 126 (9.6)
436 (33.2)
382 (29.1)
304 (23.1)
66 (5.0)
1314 (100)
g. Genitourinary 204 (15.6)
538 (41.0)
318 (24.3)
213 (16.2)
38 (2.9)
1311 (100)
h. Gynecological Conditions 222 (16.9)
566 (43.0)
322 (24.5)
177 (13.5)
28 (2.1)
1315 (100)
i. Hemic and Lymphatic 214 (16.3)
577 (44.0)
342 (26.1)
157 (12.0)
20 (1.5)
1310 (100)
j. Skin 178 (13.6)
491 (37.4)
323 (24.6)
261 (19.9)
61 (4.6)
1314 (100)
k. Endocrine 216 (16.6)
575 (44.2)
319 (24.5)
160 (12.3)
32 (2.5)
1302 (100)
l. Neurological and Convulsive Disorders
98 (7.5)
302 (23.0)
363 (27.7)
409 (31.2)
139 (10.6)
1311 (100)
m. Mental Disorders 158 (12.0)
258 (19.6)
277 (21.1)
367 (28.0)
253 (19.3)
1313 (100)
n. Dental and Oral Conditions 352 (27.0)
516 (39.6)
315 (24.2)
94 (7.2)
26 (2.0)
1303 (100)
19 Question 28 is a duplicate of a question in the 1988 GAO survey. Since that survey was done, the body systems used in the rating schedule to categorize disabilities were changed. The name of one category was changed from Systemic Diseases to Infectious Diseases, Immune Disorders, and Nutritional Deficiencies. Another category, Organs of Special Sense, was split into two categories, Auditory and Eye.
VA Office of Inspector General 165
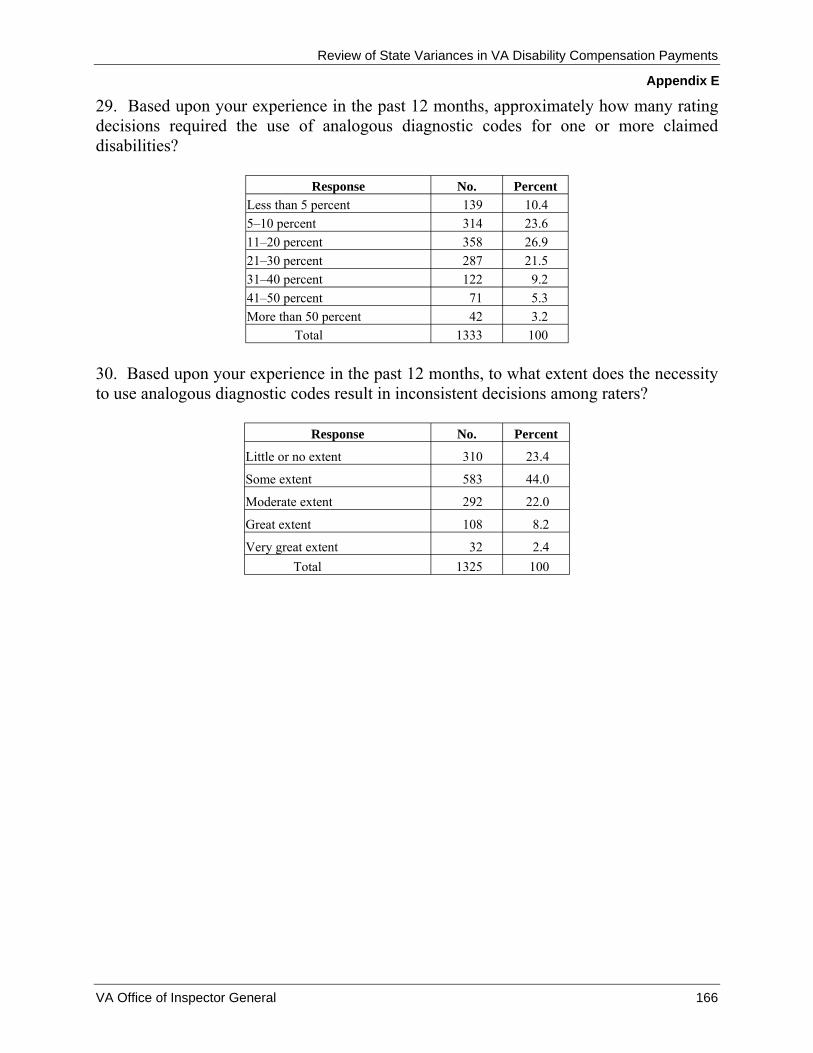
Review of State Variances in VA Disability Compensation Payments
Appendix E
29. Based upon your experience in the past 12 months, approximately how many rating decisions required the use of analogous diagnostic codes for one or more claimed disabilities?
Response No. Percent Less than 5 percent 139 10.4 5–10 percent 314 23.6 11–20 percent 358 26.9 21–30 percent 287 21.5 31–40 percent 122 9.2 41–50 percent 71 5.3 More than 50 percent 42 3.2
Total 1333 100
30. Based upon your experience in the past 12 months, to what extent does the necessity to use analogous diagnostic codes result in inconsistent decisions among raters?
Response No. Percent
Little or no extent 310 23.4
Some extent 583 44.0
Moderate extent 292 22.0
Great extent 108 8.2
Very great extent 32 2.4 Total 1325 100
VA Office of Inspector General 166

Review of State Variances in VA Disability Compensation Payments
Appendix E
31. When you are rating disability claims, how important are the following objectives TO YOU? Rank the importance of each objective on a scale from 1 to 10, with 1 being NOT IMPORTANT and 10 being EXTREMELY IMPORTANT.
Objective Response
1 2 3 4 5 6 7 8 9 10 TOTAL No. No. No. No. No. No. No. No. No. No. No. (%) (%) (%) (%) (%) (%) (%) (%) (%) (%) (%)
a. Avoiding errors that might be identified by STAR reviewers
48 (3.6)
20 (1.5)
22 (1.6)
19 (1.4)
75 (5.6)
23 (1.7)
54 (4.0)
167 (12.5)
144 (10.8)
763 (57.2)
1335 (100)
b. Complying fully with all pertinent laws, regulations, and VA policies and procedures
6 (0.4)
1 (0.1)
0 (0.0)
1 (0.1)
1 (0.1)
8 (0.6)
19 (1.4)
65 (4.9)
166 (12.4)
1071 (80.0)
1338 (100)
c. Ensuring I have sufficient information about the claims before 7 0 0 1 14 22 39 120 244 891 1338 making a decision (0.5) (0.0) (0.0) (0.1) (1.0) (1.6) (2.9) (9.0) (18.2) (66.6) (100)
d. Getting the concurrence of 216 157 136 83 194 125 116 156 70 80 1333 other reviewers (16.2) (11.8) (10.2) (6.2) (14.6) (9.4) (8.7) (11.7) (5.3) (6.0) (100)
e. Granting veterans the highest ratings allowed by the rating schedule (the highest I can defend)
10 (0.7)
0 (0.0)
2 (0.1)
2 (0.1)
18 (1.3)
16 (1.2)
39 (2.9)
92 (6.9)
172 (12.9)
984 (73.7)
1335 (100)
f. Granting veterans the lowest ratings allowed by the rating schedule (the lowest I can defend)
997 (75.0)
117 (8.8)
55 (4.1)
18 (1.4)
42 (3.2)
23 (1.7)
9 (0.7)
11 (0.8)
8 (0.6)
49 (3.7)
1329 (100)
g. Improving the timeliness of 41 25 25 32 118 113 149 238 177 416 1334 ratings (3.1) (1.9) (1.9) (2.4) (8.8) (8.5) (11.2) (17.8) (13.3) (31.2) (100)
VA Office of Inspector General 167

Review of State Variances in VA Disability Compensation Payments
Appendix E
Objective
1 2 3 4 5 6 7 8 9 10 TOTAL No. (%)
No. (%)
No. (%)
No. (%)
No. (%)
No. (%)
No. (%)
No. (%)
No. (%)
No. (%)
No. (%)
h. Meeting my daily 35 16 15 11 70 49 58 161 155 764 1334 production quota (2.6) (1.2) (1.1) (0.8) (5.3) (3.7) (4.4) (12.1) (11.6) (57.3) (100)
i. Minimizing the 124 55 63 44 109 119 114 172 126 403 1329 number of appeals (9.3) (4.1) (4.7) (3.3) (8.2) (9.0) (8.6) (12.9) (9.5) (30.3) (100)
j. Minimizing the number of complaints from veterans and their 111 48 72 49 143 105 112 192 127 376 1335 representatives (8.3) (3.6) (5.4) (3.7) (10.7) (7.9) (8.4) (14.4) (9.5) (28.2) (100)
k. Minimizing the number of decisions overturned on 152 56 64 49 118 112 103 169 138 369 1330 appeal (11.4) (4.2) (4.8) (3.7) (8.9) (8.4) (7.7) (12.7) (10.4) (27.7) (100)
l. Minimizing the number of decisions 144 49 58 44 123 99 103 165 146 397 1328 remanded on appeal (10.8) (3.7) (4.4) (3.3) (9.3) (7.5) (7.8) (12.4) (11.0) (29.9) (100)
m. Minimizing the number of reopened claims
272 (20.6)
83 (6.3)
95 (7.2)
60 (4.5)
163 (12.3)
118 (8.9)
102 (7.7)
139 (10.5)
84 (6.4)
206 (15.6)
1322 (100)
n. Rating as many claims each day as possible
89 (6.7)
38 (2.9)
50 (3.8)
37 (2.8)
115 (8.6)
95 (7.1)
125 (9.4)
215 (16.2)
143 (10.7)
424 (31.9)
1331 (100)
o. Reducing my backlog of pending work
63 (4.7)
21 (1.6)
35 (2.6)
25 (1.9)
94 (7.1)
108 (8.1)
131 (9.8)
227 (17.0)
171 (12.8)
457 (34.3)
1332 (100)
p. Saving the taxpayers money
453 (34.0)
114 (8.6)
87 (6.5)
57 (4.3)
142 (10.7)
85 (6.4)
63 (4.7)
76 (5.7)
62 (4.7)
193 (14.5)
1332 (100)
VA Office of Inspector General 168

Review of State Variances in VA Disability Compensation Payments
Appendix E
32. In your opinion, how important are the following objectives TO MANAGEMENT in your office? Rank the importance of each objective on a scale from 1 to 10, with 1 being NOT IMPORTANT and 10 being EXTREMELY IMPORTANT.
Objective
Response
1 2 3 4 5 6 7 8 9 10 TOTAL
No. No. No. No. No. No. No. No. No. No. No. (%) (%) (%) (%) (%) (%) (%) (%) (%) (%) (%)
a. Avoiding errors that might be identified by STAR 31 20 34 25 62 57 104 169 142 684 1328 reviewers (2.3) (1.5) (2.6) (1.9) (4.7) (4.3) (7.8) (12.7) (10.7) (51.5) (100)
b. Complying fully with all pertinent laws, regulations, and VA policies and procedures
43 (3.2)
44 (3.3)
41 (3.1)
44 (3.3)
89 (6.7)
77 (5.8)
112 (8.4)
190 (14.3)
150 (11.3)
538 (40.5)
1328 (100)
c. Ensuring RVSRs and DROs have sufficient information about the claims before making rating decisions
74 (5.6)
58 (4.4)
64 (4.8)
72 (5.4)
136 (10.3)
139 (10.5)
141 (10.6)
215 (16.2)
133 (10.0)
293 (22.1)
1325 (100)
d. Ensuring RVSRs and DROs meet their daily production quotas
32 (2.4)
12 (0.9)
12 (0.9)
15 (1.1)
48 (3.6)
58 (4.4)
89 (6.7)
153 (11.5)
131 (9.9)
775 (58.5)
1325 (100)
e. Granting veterans the highest ratings allowed by the rating schedule (the highest the RVSRs and DROs 53 15 28 28 103 94 114 204 158 527 1324 can defend) (4.0) (1.1) (2.1) (2.1) (7.8) (7.1) (8.6) (15.4) (11.9) (39.8) (100)
f. Granting veterans the lowest ratings allowed by the rating schedule (the lowest the RVSRs and DROs can 794 102 83 49 105 56 27 31 16 59 1322 defend) (60.1) (7.7) (6.3) (3.7) (7.9) (4.2) (2.0) (2.3) (1.2) (4.5) (100)
g. Improving the timeliness of 11 6 7 9 24 28 76 128 161 875 1325 ratings (0.8) (0.5) (0.5) (0.7) (1.8) (2.1) (5.7) (9.7) (12.2) (66.0) (100)
VA Office of Inspector General 169

Review of State Variances in VA Disability Compensation Payments
Appendix E
Objective
1 2 3 4 5 6 7 8 9 10 TOTAL
No. (%)
No. (%)
No. (%)
No. (%)
No. (%)
No. (%)
No. (%)
No. (%)
No. (%)
No. (%)
No. (%)
h. Maximizing the number of rating decisions done each 15 1 5 6 18 27 73 101 132 939 1317 day (1.1) (0.1) (0.4) (0.5) (1.4) (2.1) (5.5) (7.7) (10.0) (71.3) (100)
i. Minimizing the number 84 45 46 52 102 95 117 164 119 492 1316 of appeals (6.4) (3.4) (3.5) (4.0) (7.8) (7.2) (8.9) (12.5) (9.0) (37.4) (100)
j. Minimizing the number of complaints from veterans and their 63 39 57 45 113 106 134 194 126 445 1322 representatives (4.8) (3.0) (4.3) (3.4) (8.5) (8.0) (10.1) (14.7) (9.5) (33.7) (100)
k. Minimizing the number of decisions overturned 97 56 66 49 127 114 126 157 113 411 1316 on appeal (7.4) (4.3) (5.0) (3.7) (9.7) (8.7) (9.6) (11.9) (8.6) (31.2) (100)
l. Minimizing the number of decisions remanded 65 41 49 43 108 88 113 175 140 495 1317 on appeal (4.9) (3.1) (3.7) (3.3) (8.2) (6.7) (8.6) (13.3) (10.6) (37.6) (100)
m. Minimizing the number of reopened claims
225 (17.0)
105 (7.9)
97 (7.3)
69 (5.2)
159 (12.0)
116 (8.8)
122 (9.2)
106 (8.0)
75 (5.7)
248 (18.8)
1322 (100)
n. Reducing the backlog 12 5 6 9 16 29 67 99 141 932 1316 of pending work (0.9) (0.4) (0.5) (0.7) (1.2) (2.2) (5.1) (7.5) (10.7) (70.8) (100)
o. Saving the taxpayers 553 107 73 66 126 102 63 56 32 141 1319 money (41.9) (8.1) (5.5) (5.0) (9.6) (7.7) (4.8) (4.3) (2.4) (10.7) (100)
33. How easy or difficult is it for YOU to meet your daily production standard?
Response No. Percent
Very easy 67 5.1
Generally easy 230 17.4
Neither easy nor difficult 405 30.6
Generally difficult 443 33.5
Very difficult 178 13.5 Total 1323 100
VA Office of Inspector General 170
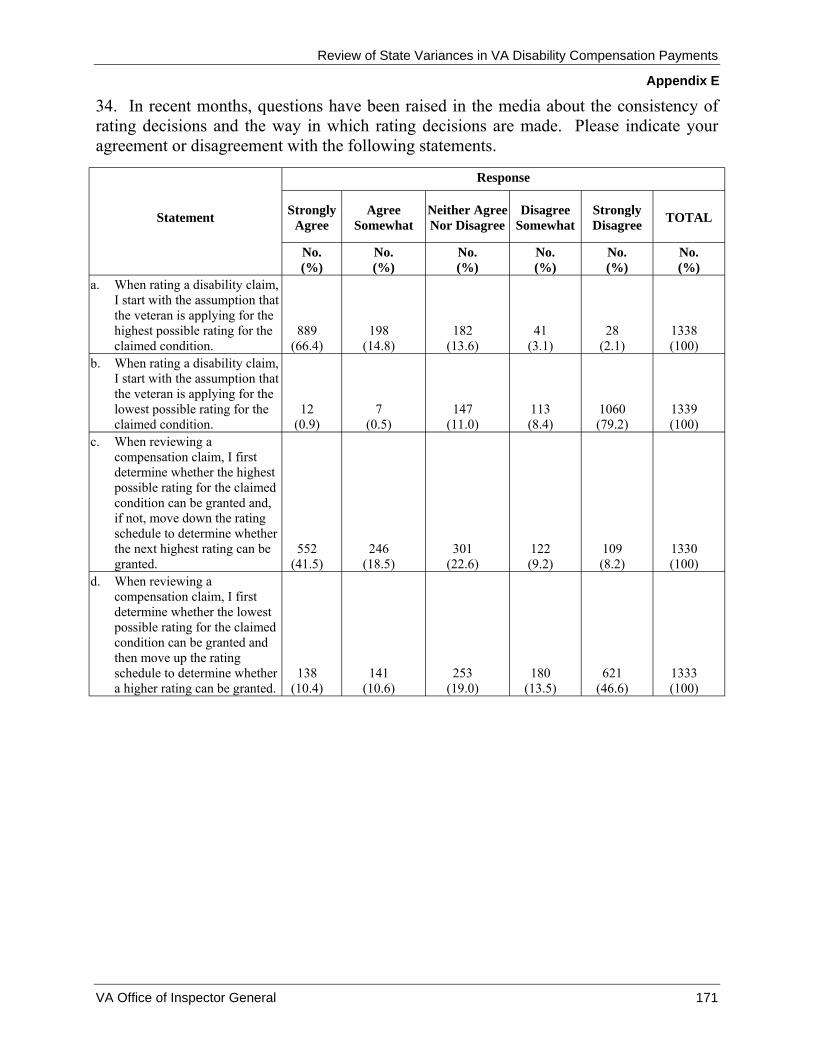
Review of State Variances in VA Disability Compensation Payments
Appendix E
34. In recent months, questions have been raised in the media about the consistency of rating decisions and the way in which rating decisions are made. Please indicate your agreement or disagreement with the following statements.
Statement
Response
Strongly Agree
Agree Somewhat
Neither Agree Nor Disagree
Disagree Somewhat
Strongly Disagree TOTAL
No. No. No. No. No. No. (%) (%) (%) (%) (%) (%)
a. When rating a disability claim, I start with the assumption that the veteran is applying for the highest possible rating for the claimed condition.
889 (66.4)
198 (14.8)
182 (13.6)
41 (3.1)
28 (2.1)
1338 (100)
b. When rating a disability claim, I start with the assumption that the veteran is applying for the lowest possible rating for the claimed condition.
12 (0.9)
7 (0.5)
147 (11.0)
113 (8.4)
1060 (79.2)
1339 (100)
c. When reviewing a compensation claim, I first determine whether the highest possible rating for the claimed condition can be granted and, if not, move down the rating schedule to determine whether the next highest rating can be granted.
552 (41.5)
246 (18.5)
301 (22.6)
122 (9.2)
109 (8.2)
1330 (100)
d. When reviewing a compensation claim, I first determine whether the lowest possible rating for the claimed condition can be granted and then move up the rating schedule to determine whether 138 141 253 180 621 1333 a higher rating can be granted. (10.4) (10.6) (19.0) (13.5) (46.6) (100)
VA Office of Inspector General 171

Review of State Variances in VA Disability Compensation Payments
Appendix E
Statement
Response
Strongly Agree
Agree Somewhat
Neither Agree Nor Disagree
Disagree Somewhat
Strongly Disagree TOTAL
No. No. No. No. No. No. (%) (%) (%) (%) (%) (%)
e. When rating a disability claim, I apply a broad and liberal interpretation of the rating schedule.
672 (50.3)
396 (29.7)
170 (12.7)
64 (4.8)
33 (2.5)
1335 (100)
f. When rating a disability claim, I apply a narrow and conservative interpretation of the rating schedule.
34 (2.5)
52 (3.9)
168 (12.6)
243 (18.2)
840 (62.8)
1337 (100)
g. In my office, management encourages RVSRs to apply a broad and liberal interpretation of the rating schedule.
534 (40.0)
384 (28.8)
271 (20.3)
79 (5.9)
67 (5.0)
1335 (100)
h. In my office, management encourages RVSRs to apply a narrow and conservative interpretation of the rating schedule.
55 (4.1)
60 (4.5)
274 (20.5)
269 (20.1)
678 (50.8)
1336 (100)
i. In my office, RVSRs and DROs who grant lower disability ratings are likely to receive better performance appraisals and more awards than others.
53 (4.0)
30 (2.3)
368 (27.8)
124 (9.4)
750 (56.6)
1325 (100)
VA Office of Inspector General 172

Review of State Variances in VA Disability Compensation Payments
Appendix E
Statement
Response
Strongly Agree
Agree Somewhat
Neither Agree Nor Disagree
Disagree Somewhat
Strongly Disagree TOTAL
No. No. No. No. No. No. (%) (%) (%) (%) (%) (%)
j. In my office, RVSRs and DROs who grant higher disability ratings are likely to receive better performance appraisals and more awards than others.
113 (8.5)
91 (6.9)
483 (36.5)
129 (9.7)
509 (38.4)
1325 (100)
k. I have no difficulty meeting my production standard 163 242 273 308 341 1327 without sacrificing quality. (12.3) (18.2) (20.6) (23.2) (25.7) (100)
l. If I make sure I have sufficient evidence for rating each case and thoroughly review the evidence, I have difficulty meeting my production standard.
400 (30.0)
354 (26.5)
258 (19.3)
168 (12.6)
154 (11.5)
1334 (100)
VA Office of Inspector General 173

Review of State Variances in VA Disability Compensation Payments
Appendix E
35. Based upon your experience, do RVSRs and DROs in your office grant a combined disability rating of 10 percent just to process the veteran’s claim quickly and reduce the backlog of work?
Response No. Percent Yes 154 11.6 No 1170 88.4
Total 1324 100
36. In the last 2 to 3 months, have YOUR rating decisions been affected by published comparisons of compensation payments to veterans in different states?
Response No. Percent Yes 41 3.1 No 1287 96.9
Total 1328 100
Each respondent who answered “Yes” to Question 36 was asked the following question:
36.1 How have your decisions been affected by published comparisons of compensation payments to veterans in different states?
Response No. Percent I’ve been much more inclined to grant higher ratings to the veterans. 6 15.4
I’ve been somewhat more inclined to grant higher ratings to the veterans. 30 76.9 I’ve been somewhat more inclined to grant lower ratings to the veterans. 3 7.7 I’ve been much more inclined to grant lower ratings to the veterans. 0 0.0
Total 39 100
37. In the last 2 to 3 months, has management in your office encouraged the RVSRs and DROs to change their attitudes when rating disability claims?
Response No. Percent Yes 311 23.5 No 1014 76.5
Total 1325 100
VA Office of Inspector General 174

Review of State Variances in VA Disability Compensation Payments
Appendix E
Each respondent who answered “Yes” to Question 37 was asked the following question:
37.1 In the last 2 to 3 months, how has management in your office suggested RVSRs and DROs change their attitudes when rating disability claims?
Response No. Percent Management has encouraged RVSRs and DROs to grant much higher ratings to the veterans. 52 17.0 Management has encouraged RVSRs and DROs to grant somewhat higher ratings to the veterans. 117 38.2 Management has encouraged RVSRs and DROs to grant somewhat lower ratings to the veterans. 2 0.7 Management has encouraged RVSRs and DROs to grant much lower ratings to the veterans. 0 0
Other (Please explain)20 135 44.1
Total 306 100
38. How would you assess staffing of the rating activity (RVSRs and DROs) in your office? Check one.
Response No. Percent The rating activity has a much larger staff than needed to provide timely and high quality service. 9 0.7 The rating activity has a somewhat larger staff than needed to provide timely and high quality service. 44 3.3
The rating activity staff is about the right size. 415 31.0 The rating activity has a somewhat smaller staff than needed to provide timely and high quality service. 517 38.7 The rating activity has a much smaller staff than needed to provide timely and high quality service. 352 26.3
Total 1337 100
Please enter any additional comments here.
Respondents whose answer to Question 37 was “Other” most often indicated that management encouraged RVSRs and DROs to interpret the criteria liberally and grant benefits if possible. Other common statements indicated that management encouraged RVSRs and DROs to avoid deferring issues and process more claims.
VA Office of Inspector General 175
20

Review of State Variances in VA Disability Compensation Payments
Appendix F
Survey Responses for Highest and Lowest Average Compensation Payment States
We compared the 151 responses of RVSRs and DROs from the 6 states with the highest average compensation payments and the 183 responses of RVSRs and DROs from the 6 states with the lowest payments. The results of the comparison are summarized in the following paragraphs. 21
Demographics of Respondents. Respondents from the six states with the highest average compensation payments and respondents from the six states with the lowest payments are similar in length of experience, age, and veteran status, as shown below:
Table 38. Comparison of Experience, Age, and Veteran Status
States StatesDemographic Factor Six High Payment Six Low Payment
Average Years as RVSR or DRO 5.7 6.3 Average Years in VBA 14.5 15.7 Average Age 47.8 47.3Percent with Veteran Status 43.0 45.6
However, there are larger differences in the percentages of respondents with service-connected disabilities and in the periods of active duty.
• In states with the highest payments, 75 percent of the veterans working as RVSRs or DROs have service-connected disabilities, while in states with the lowest payments this figure is 46 percent.
• Veterans working as RVSRs or DROs in states with the highest payments are more likely to have served on active duty during peacetime or the Gulf War than veterans working as RVSRs or DROs in states with the lowest payments, who are more likely to have served during the Vietnam Era.
21 Numbers in the tables and figures may not add up to 100.0 percent because of rounding.
VA Office of Inspector General 176
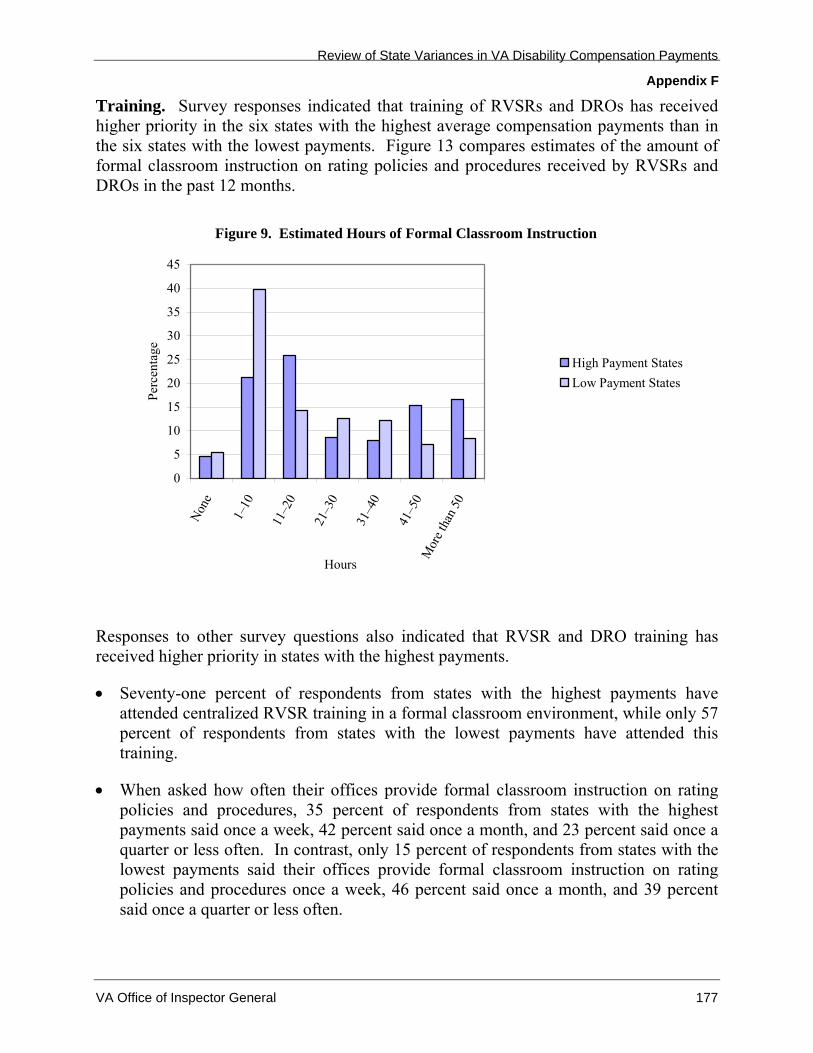
Review of State Variances in VA Disability Compensation Payments
Appendix F
Training. Survey responses indicated that training of RVSRs and DROs has received higher priority in the six states with the highest average compensation payments than in the six states with the lowest payments. Figure 13 compares estimates of the amount of formal classroom instruction on rating policies and procedures received by RVSRs and DROs in the past 12 months.
Figure 9. Estimated Hours of Formal Classroom Instruction
0
5
10
15
20
25
30
35
40
45
Perc
enta
ge
High Payment States Low Payment States
one 0 20
30
40
50 0
–1 5
1– 1– 1– 1– nN 1 ha1 2 3 4 tor
eM
Hours
Responses to other survey questions also indicated that RVSR and DRO training has received higher priority in states with the highest payments.
• Seventy-one percent of respondents from states with the highest payments have attended centralized RVSR training in a formal classroom environment, while only 57 percent of respondents from states with the lowest payments have attended this training.
• When asked how often their offices provide formal classroom instruction on rating policies and procedures, 35 percent of respondents from states with the highest payments said once a week, 42 percent said once a month, and 23 percent said once a quarter or less often. In contrast, only 15 percent of respondents from states with the lowest payments said their offices provide formal classroom instruction on rating policies and procedures once a week, 46 percent said once a month, and 39 percent said once a quarter or less often.
VA Office of Inspector General 177

Review of State Variances in VA Disability Compensation Payments
Appendix F
• When asked how often their rating teams spend time together reviewing and discussing changes in criteria, court decisions, and related issues, 35 percent of respondents from states with the highest payments said once a week, 35 percent said once a month, and 30 percent said once a quarter or less often. In contrast, only 14 percent of respondents from states with the lowest payments said their rating teams spend time together reviewing and discussing these issues once a week, 33 percent said once a month, and 53 percent said once a quarter or less often.
Claims Development. RVSRs and DROs from states with the highest payments and those from states with the lowest payments expressed similar levels of dissatisfaction with claims development.
• Forty-four percent of respondents from states with the highest payments and 39 percent of respondents from states with the lowest payments estimated that 30 percent or more of the claims sent to the rating teams in the past 12 months as ready to rate were not actually ready.
• An additional 45 percent of respondents from states with the highest payments and 48 percent of respondents from states with the lowest payments estimated that 10–29 percent of the claims sent to the rating teams in the past 12 months were not actually ready to rate.
Respondents from states with both the highest and the lowest payments indicated that some claims are rated without all the needed information. Twenty-one percent of respondents from states with the highest payments and 18 percent of respondents from states with the lowest payments estimated that, of the claims that were not ready to rate, more than 10 percent were rated without all the needed information.
Respondents from states with the highest payments have a more favorable opinion of C&P exams, whether performed by VA examiners or contract examiners, than respondents from states with the lowest payments.
• Fifty-two percent of RVSRs and DROs from states with the highest payments evaluated the quality of exams performed by VA examiners as good or very good. Forty-two percent of RVSRs and DROs from states with the lowest payments evaluated the quality of exams performed by VA examiners as good or very good.
• Fifty-three percent of RVSRs and DROs from states with the highest payments evaluated the quality of exams performed by contract examiners as good or very good, while only 37 percent of RVSRs and DROs from states with the lowest payments evaluated the quality of exams performed by contract examiners as good or very good.
VA Office of Inspector General 178

Review of State Variances in VA Disability Compensation Payments
Appendix F
Respondents from states with both the highest payments and the lowest payments believe more C&P exams should be returned to the examiners as insufficient for rating purposes. Responses from both groups showed a significant disparity between estimates of the percentage of exams that should have been returned and estimates of the percentage of exams that were actually returned.
• Thirty percent of respondents from states with the highest payments and 35 percent of respondents from states with the lowest payments estimated that 20 percent or more of C&P exams should have been returned as insufficient.
• Only 9 percent of respondents from states with the highest payments and 7 percent of respondents from the states with the lowest payments estimated that 20 percent or more of C&P exams were returned to the examiners as insufficient.
Application of Rating Schedule. RVSRs and DROs from states with the highest payments indicated they have less difficulty using the rating schedule to assign diagnostic codes and degrees of disability than RVSRs and DROs from states with the lowest payments, as shown below:
Ease of Translating Complete Medical Evidence to a Rating
Question: Consider your use of the VA Schedule for Rating Disabilities to determine disability ratings. Overall, how easy or difficult for you is translating complete medical evidence to a diagnostic code with degrees of disability (severe, moderately severe, etc.)? Check one.
Table 39. Ease of Translating Medical Evidence to a Rating
Response High Payment States
(in percent) Low Payment States
(in percent) Very Easy 13.2 6.6 Generally Easy 43.7 41.4 Neither Easy Nor Difficult 31.8 35.4 Generally Difficult 10.6 15.5 Very Difficult 0.7 1.1
Responses to two questions concerning the likelihood that two or more different ratings could be supported for the same medical condition were inconclusive. Responses to the following question indicated RVSRs and DROs from states with the highest payments were more likely than respondents from states with the lowest payments to think that two or more different ratings for the same medical condition could be supported.
Likelihood of Different Ratings
Question: Consider the situation in which you are translating complete medical evidence to diagnostic codes with degrees of disability (severe, moderately severe, etc.). Overall, in your experience, how likely or
VA Office of Inspector General 179

Review of State Variances in VA Disability Compensation Payments
Appendix F
unlikely will the situation occur that you could support two or more different ratings for the same medical condition? Check one.
Table 40. Likelihood of Different Ratings
Response High Payment States
(in percent) Low Payment States
(in percent) Very Likely 14.6 8.9 Somewhat Likely 39.1 39.4 As Likely As Not 19.9 27.8 Somewhat Unlikely 21.9 20.6 Very Unlikely 4.6 3.3
However, when we asked the same question about the individual body systems used in the rating schedule to categorize disabilities, we could not identify any pattern of differences between the responses of RVSRs and DROs from states with the highest payments and those from states with the lowest payments.
Respondents from states with both the highest and the lowest payments indicated that they have the least difficulty rating claims involving cardiovascular, respiratory, auditory, and eye conditions. Both groups consider claims involving neurological and convulsive disorders, dental and oral conditions, and mental disorders the most difficult to rate. Responses from both groups indicated it is most likely that two or more different ratings could be supported for claims involving musculoskeletal conditions, mental disorders, and neurological and convulsive disorders. Both groups indicated it is least likely that two or more different ratings could be supported for claims involving auditory and eye conditions, dental and oral conditions, and respiratory disorders.
Most respondents from states with the highest payments and from states with the lowest payments said that when rating a disability claim they assume the veteran is applying for the highest possible rating for the claimed disability and apply a broad and liberal interpretation of the rating schedule.
• Eighty-seven percent of respondents from states with the highest payments and 85 percent of respondents from states with the lowest payments strongly agreed or agreed somewhat with the statement that when rating a disability claim they start with the assumption that the veteran is applying for the highest possible rating.
• Eighty-three percent of respondents from states with the highest payments and 84 percent of respondents from states with the lowest payments strongly agreed or agreed somewhat with the statement that when rating a disability claim they apply a broad and liberal interpretation of the rating schedule.
VA Office of Inspector General 180

Review of State Variances in VA Disability Compensation Payments
Appendix F
Respondents from states with the highest payments and respondents from states with the lowest payments have similar objectives when rating claims. When asked to rank the importance of 16 potential objectives, both groups indicated that when rating disability claims their most important objectives are complying with applicable criteria, ensuring they have sufficient information before making decisions, and granting veterans the highest ratings allowed by the rating schedule. We also asked them to rank the importance of 15 comparable objectives to their managers. Both groups indicated they believe the most important objectives to their managers are reducing the backlog of pending work, improving the timeliness of ratings, and maximizing the number of ratings done each day.
Production Standards. Survey responses show that RVSRs and DROs from states with the highest payments and those from states with the lowest payments share concerns about their production standards.
• Forty-four percent of respondents from states with the highest payments and 48 percent of respondents from states with the lowest payments said it is generally difficult or very difficult to meet their daily production standards. Twenty-eight percent of respondents from states with the highest payments and 23 percent of respondents from states with the lowest payments said it is generally easy or very easy.
• Forty-five percent of respondents from states with the highest payments and 46 percent of respondents from states with the lowest payments strongly disagreed or disagreed somewhat with the statement that they have no difficulty meeting their production standards without sacrificing quality. Thirty-two percent of respondents from states with the highest payments and 31 percent of respondents from states with the lowest payments strongly agreed or agreed somewhat with that statement.
• Fifty-four percent of respondents from states with the highest payments and 56 percent of respondents from states with the lowest payments strongly agreed or agreed somewhat with the statement that they have difficulty meeting their production standards if they make sure they have sufficient evidence for rating each case and thoroughly review the evidence. Twenty-five percent of respondents from states with the highest payments and 22 percent of respondents from states with the lowest payments disagreed somewhat or strongly disagreed with that statement.
Staffing. Respondents from states with both the highest and the lowest payments believe VAROs have insufficient rating staff. Fifty-four percent of respondents from states with the highest payments and 60 percent of respondents from states with the lowest payments indicated that the rating activities in their offices have somewhat smaller or much smaller staffs than needed to provide timely and high quality service. Seven percent of respondents from states with the highest payments and 2 percent of respondents from states with the lowest payments indicated that the rating activities in their offices have
VA Office of Inspector General 181

Review of State Variances in VA Disability Compensation Payments
Appendix F
somewhat larger or much larger staffs than needed. The remaining respondents indicated that the rating activities in their offices have staffs of about the right size.
Impact of Recent Publicity. Large majorities of respondents from states with the highest payments and from states with the lowest payments denied that their rating decisions have been affected by published comparisons of compensation payments to veterans in different states. However, respondents from states with the highest payments were less likely than respondents from states with the lowest payments to indicate that their rating decisions have been affected by published comparisons of compensation payments and much less likely to indicate that managers have encouraged them to change their attitudes when rating disability claims.
• Only 3 percent of respondents from states with the highest payments and 9 percent of respondents from states with the lowest payments said their rating decisions in the last 2 to 3 months have been affected by published comparisons of compensation payments to veterans in different states. Of the 22 respondents (5 from states with the highest payments and 17 from states with the lowest payments) who indicated their decisions have been affected, 3 indicated they have been much more inclined to grant veterans higher ratings, and 18 indicated they have been somewhat more inclined to grant higher ratings. One respondent (from one of the states with the highest payments) indicated he or she has been somewhat more inclined to grant lower ratings.
• Fifteen percent of respondents from states with the highest payments and 49 percent of respondents from states with the lowest payments said that, in the last 2 to 3 months, management in their offices has encouraged them to change their attitudes when rating disability claims. Of the 110 respondents who indicated management has encouraged them to change their attitudes when rating claims (23 from states with the highest payments and 87 from states with the lowest payments), 15 said management has encouraged RVSRs and DROs to grant much higher ratings, 46 said management has encouraged them to grant somewhat higher ratings, and the remaining 49 respondents made a wide variety of comments.
VA Office of Inspector General 182

Review of State Variances in VA Disability Compensation Payments
Appendix G
Income Verification Match Results for Veterans with Individual Unemployability by State–FY 2004
Veterans Receiving Compensation Veterans with IU Rating
IVM Average Annual IVM Percent
Referrals with Income
State Payment Number Number Referrals Referrals > $50,000 50-State Totals $8,378 2,493,576 196,916 8,486 4.30% 289 New Mexico $12,004 25,258 5,076 325 6.40% 7 Maine $11,626 18,751 3,199 131 4.10% 1 Arkansas $10,968 31,473 4,024 147 3.70% 4 West Virginia $10,866 20,681 2,741 108 3.90% 5 Oklahoma $10,697 51,213 6,632 282 4.30% 3 Oregon $10,277 35,449 3,439 159 4.60% 7 Vermont $9,649 6,894 686 21 3.10% 0 Arizona $9,308 50,224 4,898 199 4.10% 4 North Carolina $9,281 90,745 7,980 412 5.20% 9 Kentucky $9,194 37,657 3,207 111 3.50% 3 Louisiana $9,114 37,475 3,673 168 4.60% 5 Mississippi $8,949 25,620 1,882 38 2.00% 2 Texas $8,928 208,986 20,534 971 4.70% 27 Rhode Island $8,893 17,301 1,748 69 3.90% 3 Montana $8,871 12,444 1,244 47 3.80% 2 Nevada $8,771 20,620 1,846 82 4.40% 2 Tennessee $8,698 54,108 3,532 137 3.90% 3 Florida $8,658 179,850 15,971 422 2.60% 11 Nebraska $8,623 23,143 2,038 132 6.50% 5 Idaho $8,604 14,185 1,277 44 3.40% 1 South Dakota $8,548 9,823 808 39 4.80% 3 Washington $8,531 85,094 7,327 351 4.80% 13 Hawaii $8,491 15,895 1,232 46 3.70% 0 South Carolina $8,459 44,708 3,054 122 4.00% 0 Minnesota $8,321 39,990 3,195 151 4.70% 5 Wisconsin $8,297 44,102 3,194 166 5.20% 3 Missouri $8,232 49,126 4,616 164 3.60% 7 New Hampshire $8,168 13,470 1,062 41 3.90% 4 Alabama $8,165 54,247 3,859 165 4.30% 2 North Dakota $8,143 10,655 744 44 5.90% 1 Alaska $8,138 11,648 641 44 6.90% 6 California $8,099 229,915 18,211 919 5.00% 46 Maryland $7,944 36,808 1,233 79 6.40% 5 Colorado $7,944 49,580 1,928 70 3.60% 2 Utah $7,906 14,748 837 35 4.20% 1 Pennsylvania $7,898 101,755 7,502 293 3.90% 6 Iowa $7,797 20,642 1,447 74 5.10% 0 Wyoming $7,778 5,871 308 10 3.20% 0 Georgia $7,775 84,118 5,108 182 3.60% 11 Virginia $7,716 81,297 4,508 188 4.20% 10 Kansas $7,579 24,213 1,354 54 4.00% 2
VA Office of Inspector General 183

Review of State Variances in VA Disability Compensation Payments
Appendix G
Veterans Receiving Compensation Veterans with IU Rating
IVM Average Annual IVM Percent
Referrals with Income
State Payment Number Number Referrals Referrals > $50,000 Massachusetts $7,529 53,584 3,934 169 4.30% 10 Delaware $7,453 7,584 297 13 4.40% 0 New York $7,348 119,963 7,352 318 4.30% 17 Indiana $7,287 42,855 2,448 106 4.30% 3 Michigan $7,241 64,204 3,882 186 4.80% 8 Connecticut $7,204 21,005 1,046 47 4.50% 3 Ohio $7,039 85,527 4,585 160 3.50% 4 New Jersey $7,028 46,903 2,471 111 4.50% 7 Illinois $6,961 62,169 3,106 134 4.30% 6
VA Office of Inspector General 184

Review of State Variances in VA Disability Compensation Payments
Appendix H
Summary of Monetary Benefits in Accordance with IG Act Amendments
Recommendation Explanation of Benefit(s) Better Use of Funds
3 Inconsistent PTSD Claim Development Increases the Risk of Improper Payments.
Total $19.78 billion22
22 Since the average age of veterans whose cases we reviewed was 56 and the average life expectancy of a 56-year-old male is 79 years, the potential PTSD benefits paid without adequate assurance would be an estimated $19.78 billion (23 years x $860.2 million annually).
VA Office of Inspector General 185

Review of State Variances in VA Disability Compensation Payments
Appendix I
Under Secretary for Benefits Comments
Department of Veterans Affairs Memorandum
Date: May 13, 2005
From: Under Secretary for Benefits
Subject: Review of State Variances in VA Disability Compensation Payments
To: Inspector General
1. The Veterans Benefits Administration is most appreciative of the efforts of you and your staff in conducting this comprehensive study of the state-to-state variance in the average annual disability compensation payments to veterans.
2. Your findings affirm our belief that there is no single causal factor or simple combination of factors underlying the regional disparity issue and, accordingly, there is no simple remedy. We note that among the factors that were found to influence the payment variability are legislated pay increases, an antiquated pay schedule, veterans service organization representation, period of service, military status (enlisted, officer, retiree, etc.), age, numbers of dependents, and numbers of disabilities. As was indicated in the report, these factors and demographics are outside the control of our decision-makers.
3. Your review also found, not unexpectedly, distinctions in the consistency of disability evaluations on objective vs. subjective categories of claims, and that the rating criteria for some disabilities are more difficult for our decision-makers to consistently apply. Of particular concern to VBA are your findings that our regional office employees are not consistently interpreting and applying criteria for developing and granting PTSD claims and that medical examinations to support our decisions are not consistently conducted. VBA is absolutely committed to improving the quality and consistency of our benefits decisions, and we will take prompt and aggressive action on your recommendations to correct these deficiencies. We have made significant improvements in the quality of our decisions in recent years, and we continue to believe that as we improve quality, consistency is also improving. Your findings in this area underscore the importance of the fundamental principles under which VBA has operated over the past three years:
VA Office of Inspector General 186

Review of State Variances in VA Disability Compensation Payments
Appendix I
• Consistent business structures and practices must be established and implemented throughout our benefits delivery system.
• Centrally managed oversight of our benefits delivery operations is essential to achieving and maintaining improved quality and consistency.
• Centrally developed and directed training must be provided to ensure our employees have the skills and expertise necessary to make fair and consistent decisions.
4. While disparities continue to occur, your analysis that isolated recent years’ rating outcomes shows that additional training and management attention and initiative can change past patterns. Most notably, the Chicago Regional Office moved from 44th in average payments to veterans new to the VA compensation rolls in 1999 to 23rd in 2004. This affirms our belief that our people are working hard and are committed to granting all the benefits they can legally allow.
5. There is an inherent difficulty in achieving the desired level of consistency when operating from 57 separate geographically dispersed offices, as VBA is currently structured. The Government Accountability Office, the National Academy of Public Administration, and others have separately observed this difficulty in earlier studies related to the consistency of our disability evaluations. We believe that this factor, as well as the obvious economic factors, demands that we look at opportunities for operational consolidation of additional aspects of the compensation program.
6. We fully agree that it is critical that we continue to strive to better understand the underlying causes of the variance, and that we identify and correct any processing inconsistencies that may be contributing to the variance. We have attached our response to each of the recommendations provided in your report. More detailed implementation plans will be provided. We note that the recommendation on lump-sum payments, while certainly worthy of consideration, raises much larger issues of public policy that will require extensive analysis, review and consensus building with stakeholders and public policy makers.
7. Thank you for your in-depth review of this most complex issue.
(original signed by:) Daniel L. Cooper
Attachment
VA Office of Inspector General 187

Review of State Variances in VA Disability Compensation Payments
Appendix I
VETERANS BENEFITS ADMINISTRATION RESPONSE TO RECOMMENDATIONS
Recommendation 1: Conduct a scientifically sound study using statistical models, such as a multi-variant regression analysis, of the major influences on compensation payments to develop baseline data and metrics for monitoring and managing variances, and use this information to develop and implement procedures for detecting and preventing unacceptable payment patterns.
Concur. VBA will work closely with the Office of Policy, Planning and Preparedness to develop a statement of work to engage contractual expertise to conduct this study. The initial task order was signed on May 13, 2005.
Recommendation 2: Coordinate with the Veterans Disability Commission to ensure all potential issues concerning the need to clarify and revise the Schedule for Rating Disabilities are reviewed, analyzed, and addressed.
Concur. VBA is prepared to provide the Disability Benefits Commission whatever information or assistance is needed to fulfill its statutory charge. The Disability Benefits Commission held its first public meetings May 9-10, 2005, during which the Director of the Compensation and Pension Service briefed the Commission on disability compensation trends and developments. VBA will work with the Office of Policy, Planning and Preparedness to ensure that the Commission has the required information and support to review, analyze and address all potential issues concerning the need to clarify and revise the Schedule for Rating Disabilities.
Recommendation 3: Conduct reviews of rating practices for certain disabilities, such as PTSD, individual unemployability, and other 100 percent ratings to ensure consistency and accuracy nationwide. At a minimum, these reviews should consist of data analysis, claims file reviews, and on-site evaluation of rating and management practices.
Concur. We fully agree that the ratings of claims in these categories are major drivers of the variance in today's rating activities. The Compensation and Pension Service will initiate a review of all PTSD (IU and 100 percent schedular) claims granted from FY 99 through FY 04 in all 50 states. The need to review PTSD cases adjudicated prior to FY 99 will be assessed upon the completion of this review. In addition, all other 100 percent schedular and IU cases and other selected diagnostic codes will be reviewed through the Compensation and Pension Service's regularly scheduled oversight visits to VBA regional offices. These reviews will pay particular attention to development sufficiency, appropriateness of evaluation assigned, and relevant management practices.
VA Office of Inspector General 188
Review of State Variances in VA Disability Compensation Payments
Appendix I
Recommendation 4: Expand the national quality assurance program by including evaluations of PTSD rating decisions for consistency by regional office, and to ensure sufficient evidence to support the rating is fully developed and documented, such as verifying the stressor event.
Concur. In addition to the ongoing PTSD reviews conducted during the Compensation and Pension Service oversight visits discussed in response to recommendation 3, we will conduct a special quality review of PTSD cases nationwide to identify areas of inconsistency in evidentiary development and disability evaluation. Based on the results of this review, we will develop additional procedural guidance and training for our decision makers and make appropriate systematic and regulatory changes to improve the consistency and accuracy of our decisions.
We will also analyze rating and claims data from VBA claims processing systems on an ongoing basis to identify any unusual patterns or variance by regional office or diagnostic code for further consistency review. To support these consistency reviews, the Compensation and Pension Service is developing new review protocols to monitor and review variation within particular diagnostic codes. Specific protocols will be developed to support variability reviews of PTSD and individual unemployability ratings.
Additionally, we will increase our quality reviews of these sensitive cases at the local level.
Recommendation 5: Coordinate with the Veterans Health Administration to improve the quality of medical examinations provided by VA health care and contract clinicians, and ensure medical and rating staff are familiar with approved medical examination report templates and that the templates are consistently used.
Concur. We will continue to work with the Veterans Health Administration to improve the quality of medical examinations performed to support disability compensation evaluations. We will work with the CPEP Office to ensure that all automated examination report templates thoroughly and accurately solicit the medical evidence needed to consistently evaluate the disability. We will also work with VHA to establish a formal approval process for the templates and to obtain agreement on the mandatory use of approved templates.
Recommendation 6: In view of growing demand, the need for quality and timely decisions, and the ongoing training requirements, reevaluate human resources and ensure the VBA field organization is adequately staffed and equipped to meet mission requirements.
VA Office of Inspector General 189

Review of State Variances in VA Disability Compensation Payments
Appendix I
Concur. We will carefully review VBA’s budget formulation and resource allocation methodologies. We will refine and make appropriate changes to our methodologies to ensure VBA’s resource needs are accurately projected and the field organization is appropriately staffed and funded. While it is critically important that the field organization be staffed and equipped to meet our high expectations for service delivery, we will also work to ensure the adequacy of the resources devoted to investment in information technology, training, and oversight – all essential components for achievement of our quality and consistency goals.
Recommendation 7: Consider establishing a lump-sum payment option in lieu of recurring monthly payments for veterans with disability ratings of 20 percent or less.
Concur. VBA will review prior VA studies and proposals related to lump sum payment options. We will prepare a paper describing the history of consideration of lump-sum payments and provide potential options for further study. It is expected that the Disability Benefits Commission will also consider this public policy issue.
Recommendation 8: Undertake a more detailed analysis to identify differences in claims submission patterns to determine if certain veteran sub-populations, such as World War II, Korean Conflict, or veterans living in specific locales, have been underserved, and perform outreach based on the results of the analysis to ensure all veterans have equal access to VA benefits.
Concur. A study to address this recommendation has been initiated. The Office of Policy, Planning and Preparedness is conducting a one-year research study to determine servicemember and veteran awareness of and access to VA benefits and services. This study was directed by the FY 05 Omnibus Appropriation Bill (S.2468, Section 805) and has four major components. The first component will describe current VA outreach and awareness programs. The second component will develop definitions and output and outcome measures for outreach and awareness. The third component includes the administration of a national survey of up to 13 veteran cohort groups. The final part of the study includes findings and recommendations for improving VA outreach and awareness.
VBA will use the results of this study and other information and data related to claims submission patterns by period of service and specific locales to identify any significant differences. VBA will then initiate outreach and focused campaigns specifically directed at any population of veterans potentially underserved.
VA Office of Inspector General 190

Review of State Variances in VA Disability Compensation Payments
Appendix J
OIG Contact and Staff Acknowledgments
OIG Contact Michael L. Staley (202) 565-4625
Acknowledgments Thomas L. Cargill, Jr.
Mark S. Collins
Nicholas H. Dahl
Marcia E. Drawdy
Michael E. Guier
Timothy Halpin
Freddie Howell, Jr.
Earl Key
James R. Hudson
Jay M. Johnson
Yolonda L. Johnson
Russ Lewis
David Sumrall
Jason Schuenemann
William H. Withrow , Jr.
Kent X. Wrathall
Support from the Office of Management and Administration
VA Office of Inspector General 191
Review of State Variances in VA Disability Compensation Payments
Appendix K
Report Distribution VA Distribution Office of the Secretary Veterans Health Administration Veterans Benefits Administration National Cemetery Administration Assistant Secretaries Office of General Counsel Non-VA Distribution House Committee on Veterans’ Affairs House Appropriations Subcommittee on Military Quality of Life and Veterans Affairs,
and Related Agencies House Committee on Government Reform Senate Committee on Veterans’ Affairs Senate Appropriations Subcommittee on Military Construction and Veterans Affairs Senate Committee on Governmental Affairs National Veterans Service Organizations Government Accountability Office Office of Management and Budget U.S. Senate:
Richard J. Durbin Barack Obama
U.S. House of Representatives: Dennis J. Hastert Lane Evans Luis Guitierrez Rahm Emanuel Judy Biggert Jesse Jackson, Jr. Donald Manzullo Janice Schakowsky Ray Lahood Jerry Weller Mark Kirk Danny Davis John Shimkus Henry Hyde Jerry Costello William Lipinski Timothy Johnson Bobby Rush
This report will be available in the near future on the OIG’s web site at http://www.va.gov/oig/52/reports/mainlist.htm. This report will remain on the OIG web site for at least 2 fiscal years after it is issued.
To Report Suspected Wrongdoing in VA Programs and Operations Call the OIG Hotline – (800) 488-8244
VA Office of Inspector General 192