review of regional water supply...
TRANSCRIPT

FINAL REPORT
THE WATER AND SALT BALANCES OF THE
BURDEKIN RIVER IRRIGATION AREA
Importance for strategic planning and institutional
arrangements for the entire lower Burdekin.
Prepared for Queensland Canegrowers Pty Ltd, Brisbane, QLD
By – John Williams BSc Agr (Hons1) PhD MAIAST Tim Stubbs B Eng (Env) (Hons) Keith L. Bristow BSc MSc PhD
OCTOBER 2009

Contents Lower Burdekin Vision........................................................................................................................4
Acknowledgements..............................................................................................................................5
Glossary .................................................................................................................................................6
Executive Summary – What are the key messages from this work?.............................................7
How might things move forward? ......................................................................................................8
What is the first step in this process? ................................................................................................10
1. Introduction ...................................................................................................................................11
2. What is the current problem in the lower Burdekin?...............................................................12
2.1. ISSUE 1: Understanding and managing the groundwater balance ..............................................12
2.1.1. Leakage beneath irrigation ...................................................................................................12
2.1.2. Leakage from channels and drains......................................................................................17
2.1.3. Combined leakage .................................................................................................................19
2.2. ISSUE 2: Understanding and managing sodic/saline soils and salty groundwater...................20
2.3. ISSUE 3: Understanding the relationships of the water and salt balances in the BRIA, NBWB and the SBWB...............................................................................................................24
3. What has been happening up till now?......................................................................................25
3.1. Research and science ...........................................................................................................................26
3.2. Policy and action ..................................................................................................................................26
4. What is the way forward? ............................................................................................................28
4.1. How could the process begin? ...........................................................................................................29
4.2. What is the first step in the process? .................................................................................................31
4.3. What could be done tomorrow to begin the process?.....................................................................31
5. References.......................................................................................................................................33
6. Appendix 1: Document of Discovery .........................................................................................34
7. Appendix 2: BHWSS groundwater depths in April 2008........................................................35
8. Appendix 3: BHWSS groundwater salinity in April 2008 .......................................................36
Cover photograph:
Cover photograph of lower Burdekin used with permission. Petheram C, Charlesworth PB, Bristow KL (2006) Managing on-farm and regional water and salt balances in Mona Park. CSIRO Land and Water Science Report 23/06. Figure 1 p6.

John Williams Scientific Services Pty Ltd Final Report
List of figures Figure 1: Estimates of infiltration and discharge in the BRIA...................................................... 13
Figure 2: Estimated water balance in the BRIA.............................................................................. 14
Figure 3: A diagrammatic representation of the desired water balance for irrigated sugarcane in the BRIA to ensure watertables are managed in a sustainable manner .............. 17
Figure 4: Distribution of Sodic soils within the Burdekin-Haughton Water Supply Scheme in the lower Burdekin (From Day K, Lio J and Christianos N (1995). In: ‘Australian Sodic Soils. Distribution, Properties and Management’. (CSIRO Australia)... 21
Figure 5: The principles of amelioration and management of Sodic soils (Source: Rengasamy and Olsson, 1995)........................................................................................... 22
Figure 6: Rainfall, groundwater level and salinity of groundwater over 34 years for a bore in the BHWSS (Source: Dr Keith Bristow, CSIRO) ...................................................... 23
Figure 7: Continual improvement cycle.......................................................................................... 28
List of tables Table 1: Preliminary estimates of BRIA groundwater balance .................................................... 15
Table 2: Estimated watertable rise for BRIA for various leakage rates beneath crop root zone ..................................................................................................................................... 16
Table 3: Estimates of base area (m2) for the channels, laterals and sub-laterals for the Haughton/Barratta Distribution Systems.......................................................................... 18
Table 4: Estimates of possible leakage (GL/yr) from base of channels, laterals and sub-laterals for the Haughton/Barratta Distribution Systems at four hydraulic conductivities (K) for the sub-soil material at base of channels ................................ 18
Page 3 |

John Williams Scientific Services Pty Ltd Final Report
Lower Burdekin Vision
The land, water and people resources of the lower Burdekin utilised to deliver social, economic and environmental outcomes for a sustainable future.
The achievement of this vision will rely on openness, the sharing of knowledge and the making of decisions in a fair, systematic and
transparent manner with which all stakeholders feel comfortable.
Page 4 |

John Williams Scientific Services Pty Ltd Final Report
Acknowledgements The project team included John Williams (John Williams Scientific Services Pty Ltd), Tim Stubbs (Yellow and Blue Pty Ltd), Keith Bristow (CSIRO Land and Water and CRC for Irrigation Futures) and Belinda Crozier (John Williams Scientific Services Pty Ltd) as contracted through John Williams Scientific Services Pty Ltd.
The team would like to thank the many people who have taken a strong interest in the project and helped in many different ways. A large number of cane farmers, council staff, scientists from a wide range of agencies and consultant companies were very generous in the provision of time, information and insight to the problems of groundwater management in the lower Burdekin. Queensland Canegrowers Pty Ltd through Tim Wrigley and subsequently Eric Danzi gave patient support to this work. In particular, the team would like to thank:
Dr Scott Crawford
Tom McShane
Gary Jensen
Evan Shannon
Malcolm Kelly
Mauro Garbuio
Kevin Mann
Dean Sgroi
Wayne Smith
Mario Barbagallo
David Cox
Reg Huston
Randall Cox
Tom Vanderbyl
Lyall Hinrichsen
Peter McGahan
Christy Mathers
Di Popham
John Power
Russ McNee
Dr Cuan Petheram
Dick Thompson
Greg Barbagallo
Chris Hesp
Ray Menkens
Terry Williams
Roy Young
Graham Laidlow
Steve Attard
Terri Buono
Gary Ham
Avril Robinson
Toni Anderson
Jason Williams
Les Robertson
Cr Lyn McLaughlin
Page 5 |

John Williams Scientific Services Pty Ltd Final Report
Glossary
BRIA Burdekin River Irrigation Area – is the local name for the irrigation district within the Burdekin-Haughton Water Supply Scheme
BHWSS Burdekin-Haughton Water Supply Scheme - this is the channel system which transports water from the Burdekin Falls Dam
NBWB North Burdekin Water Board – the irrigation district which draws water supply from the delta aquifers on the northern side of the Burdekin River
SBWB South Burdekin Water Board – the irrigation district which draws water supply from the delta aquifers on the southern side of the Burdekin River
NRW Department of Natural Resources and Water
LBWF Lower Burdekin Water Futures group
ML Mega Litre = 1 million litres
GL Giga Litre = 1 billion litres
Page 6 |

John Williams Scientific Services Pty Ltd Final Report
Executive Summary – What are the key messages from this work? It is time for the stakeholders of the lower Burdekin to try a different approach that will deliver sustainable management of surface and groundwater. The continually rising salt and groundwater levels provide damning evidence that the current approach is not working. This is in spite of the large amount of effort that has been made by the lower Burdekin stakeholders and community. The key to the success of this new approach is one where stakeholders collaborate to assemble the required knowledge, craft a consolidated plan of action and establish new institutional and management arrangements that will deliver integrated management of surface and groundwater across the lower Burdekin.
The lower Burdekin comprises three irrigation districts which have been developed in various stages since the 1880’s. The North and South Water Boards manage the groundwater for two irrigation districts which lift groundwater from the relatively shallow Burdekin delta1 aquifers that are recharged from the waters of the Burdekin River. The Burdekin-Haughton Water Supply Scheme (BHWSS)2 was developed around the supply of surface water from the Burdekin Falls Dam via the Clare Weir to the Burdekin River Irrigation Area (BRIA) to create the third irrigation district of the lower Burdekin. The lower Burdekin irrigation districts have evolved pragmatically to have a mix of surface and groundwater irrigation all of which have groundwater systems that are variously connected and which need careful and integrated management. The historical development of three relatively discrete irrigation communities with independent institutional arrangements coupled with an incomplete and fragmented understanding of the groundwater hydrology of the lower Burdekin region, has resulted in an array of institutional and management responsibility that to date has failed to serve the community and yield an integrated management of the surface and groundwater of the lower Burdekin. However, we found evidence that the irrigation communities feel it is now time to change the way business is done.
Current estimates are that the landscape in the BRIA district can naturally discharge 15,000ML/year of groundwater to the ocean. Current recharge from deep drainage beneath the root zone of crops and channel leakage in the BRIA is estimated to be 160,000ML/year. Thus we must expect substantial rise in watertables across the landscape.
Estimates of the groundwater discharge across the entire alluvial floodplain of the lower Burdekin are in the range of 30,000 – 150,000ML/year to surface water and 50,000 – 400,000ML/year to the ocean. These levels are much higher than those estimated for just the BRIA and may indicate that excess groundwater in the BRIA is draining to the groundwater aquifers underlying the Burdekin delta irrigation districts. Consequently, it is possible that this disparity between recharge and discharge to the ocean in the BRIA will have increasing implications for the North and South Burdekin Water Board irrigation districts. Whilst the
1 Hopley D (1970). The geomorphology of the Burdekin delta, North Queensland. James Cook University, North Queensland, Department Geography Monograph Series No. 1 pp 1-66. 2 The BHWSS is the channel system which transports irrigation water throughout the BRIA.
Page 7 |

John Williams Scientific Services Pty Ltd Final Report
groundwater connections are not well-described they do exist and movement of saline waters from the BRIA to the high quality groundwater aquifers needs to be explored and prevented.
Salinity levels are also increasing across the entire lower Burdekin. A report in 2001 by PPK3, estimated that the salinity loading of the BRIA aquifer is increasing by some 26,000 tonnes of salt per year through the input of about 39,000 tonnes of salt per year. This indicates that the aquifer salinity is increasing by about 4 per cent/annum, or will double within 25 years.
This observation of rising groundwater and increasing salinity when combined with a large proportion of subsoils which are strongly sodic and often saline, results in a suite of difficult circumstances which will require very careful management by irrigation communities, regulatory and management authorities. To date, there has been a lack of strategic management by stakeholders to address the issues.
This lack of strategic management is not due to an absence of hard work and commitment by any of the stakeholders. More, it has been caused by stakeholders working on isolated projects with no overall integration coupled with a lack of institutional arrangements and responsibility which drive integrated management of the land and water resources within the lower Burdekin. This has led to variable knowledge between groups, miscommunication and thwarted effort. Unfortunately, this has in turn led to disagreement and distrust between stakeholder groups.
Ultimately, it will be a mixture of policy adjustments and on-ground action by each stakeholder group that will deliver a sustainable future. There are many levers that can be adjusted to achieve a sustainable future. Unfortunately, there is insufficient economic, hydrologic and engineering analysis available to indicate which levers and which course of action are most effective. The challenge for stakeholders is to work together to identify the right mixture of policy adjustment and actions that are needed.
How might things move forward? Firstly, the stakeholders must come together to establish a forum in which the groundwater and salinity management issues can be discussed and knowledge shared. Priority issues the forum must consider are:
1. What mix of strategies will best address the 145,000ML/year of excess water entering the system in the BRIA and what implications does this have for salt and groundwater management in the North and South Burdekin Water Board irrigation districts given:
• the deep drainage and leakage to groundwater under the irrigation area is of an order that it cannot be managed by improved irrigation practice, groundwater pumping and re-use alone;
• the reduction of leakage from channels and drains will reduce the diluting influence on aquifer salinity and to compensate for this, it will be necessary to significantly reduce deep drainage from irrigated lands to levels that approach groundwater aquifer discharge capacity (about 15,000ML/year) to the ocean. This is unlikely to be
3 PPK, (2001). The Proposed Groundwater Management Strategy for the Burdekin Houghton Water Supply Scheme. Department of Natural Resources and Mines, November 2001.
Page 8 |
John Williams Scientific Services Pty Ltd Final Report
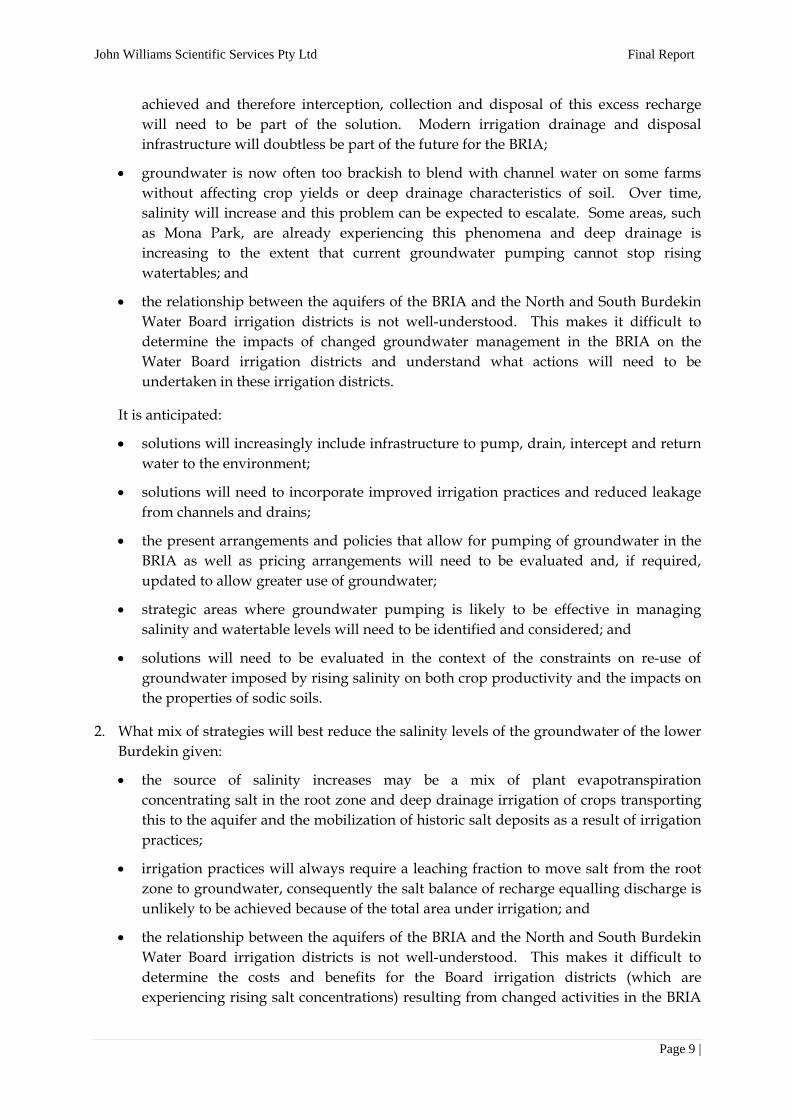
achieved and therefore interception, collection and disposal of this excess recharge will need to be part of the solution. Modern irrigation drainage and disposal infrastructure will doubtless be part of the future for the BRIA;
• groundwater is now often too brackish to blend with channel water on some farms without affecting crop yields or deep drainage characteristics of soil. Over time, salinity will increase and this problem can be expected to escalate. Some areas, such as Mona Park, are already experiencing this phenomena and deep drainage is increasing to the extent that current groundwater pumping cannot stop rising watertables; and
• the relationship between the aquifers of the BRIA and the North and South Burdekin Water Board irrigation districts is not well-understood. This makes it difficult to determine the impacts of changed groundwater management in the BRIA on the Water Board irrigation districts and understand what actions will need to be undertaken in these irrigation districts.
It is anticipated:
• solutions will increasingly include infrastructure to pump, drain, intercept and return water to the environment;
• solutions will need to incorporate improved irrigation practices and reduced leakage from channels and drains;
• the present arrangements and policies that allow for pumping of groundwater in the BRIA as well as pricing arrangements will need to be evaluated and, if required, updated to allow greater use of groundwater;
• strategic areas where groundwater pumping is likely to be effective in managing salinity and watertable levels will need to be identified and considered; and
• solutions will need to be evaluated in the context of the constraints on re-use of groundwater imposed by rising salinity on both crop productivity and the impacts on the properties of sodic soils.
2. What mix of strategies will best reduce the salinity levels of the groundwater of the lower Burdekin given:
• the source of salinity increases may be a mix of plant evapotranspiration concentrating salt in the root zone and deep drainage irrigation of crops transporting this to the aquifer and the mobilization of historic salt deposits as a result of irrigation practices;
• irrigation practices will always require a leaching fraction to move salt from the root zone to groundwater, consequently the salt balance of recharge equalling discharge is unlikely to be achieved because of the total area under irrigation; and
• the relationship between the aquifers of the BRIA and the North and South Burdekin Water Board irrigation districts is not well-understood. This makes it difficult to determine the costs and benefits for the Board irrigation districts (which are experiencing rising salt concentrations) resulting from changed activities in the BRIA
Page 9 |

John Williams Scientific Services Pty Ltd Final Report
and what actions will be required in the Board irrigation districts to manage rising salt concentrations.
It is anticipated the solution will need to identify a sustainable long term mix of:
• infrastructure to pump, drain, intercept and return salt and water to the ocean to complete the salt cycle;
• groundwater pumping and re-use;
• improved irrigation practices;
• reduced channel leakage; and
• adjusted water pricing.
3. How are knowledge needs going to be more effectively identified and met and the outputs collated for use by all stakeholders? How will this be undertaken so that the groundwater of the lower Burdekin is better understood and managed? How will the knowledge be managed so that it becomes part of the human capital of the lower Burdekin community and thus shapes future planning?
The forum must undertake a strategic planning process to develop an effective approach to gathering the knowledge required and implementing the solutions to these questions. It is hard to see how successful implementation and long term sustainable management can be developed without careful attention being given to institutional reform and clarification of responsibilities and accountabilities of all within the community of stakeholders.
What is the first step in this process? The first step in the process is for stakeholders to signal their willingness to engage. Government, irrigators and other stakeholders need to formally acknowledge that they are willing to begin discussions about how a forum could be developed and planning process initiated.
Once stakeholders are on board, the first task of the forum is to identify its objectives, rules of operation and roles and responsibilities. Once this is done, the group must begin to coordinate their current efforts, synthesise knowledge and develop longer term targets with shorter term goals and milestones.
In the period whilst the strategic planning process is being undertaken any new projects proposed must, as a minimum, demonstrate how it is delivering on one of the three priority issues identified above. If it is not delivering on one of these, its immediate value should be questioned (it may still be a valuable project in the longer term).
The Lower Burdekin Water Futures group (LBWF) would provide a useful forum for this discussion to begin. The LBWF is already in place and has good representative membership from across the stakeholder groups of the lower Burdekin.
Page 10 |

John Williams Scientific Services Pty Ltd Final Report
1. Introduction John Williams Scientific Services Pty Ltd was engaged by Canegrowers Pty Ltd to undertake the following project:
A review of institutional arrangements in the Burdekin River Irrigation Area with a view to managing sustainable farming practices in the region.
This project originally focussed on looking at solutions to the rising groundwater problems of the BRIA. As the project progressed, it became apparent that the rising groundwater was a symptom of a much larger underlying issue.
It became clear to the project team that although stakeholder groups were all making concerted effort to resolve the issue, these individual efforts were not resulting in any overall positive impact on groundwater levels.
As the project team’s understanding of the physical attributes of the lower Burdekin increased, it also became apparent that although the lower Burdekin is split into at least three different management areas, the aquifers are not. This further adjusted the scope of the project to include issues relating to the North and South Burdekin Water Board irrigation districts. Subsequently, it became clear that any efforts to sustainably manage the BRIA would be of limited value if they were not undertaken on a whole of lower Burdekin scale which included the Water Boards.
The project has been undertaken in two stages:
• Stage one was focussed on developing an understanding of the issues in the BRIA and broader lower Burdekin. This was done through a review of literature and available data and consultation with all stakeholder groups. This information was brought together into a “Document of Discovery”. Stakeholder consultation was then undertaken to ensure all views were captured accurately. A final “Document of Discovery” was then published. A copy of this is contained in Appendix 1. The consultation was also used to identify a vision for the future which was agreed by all stakeholders. The vision is on page 4 of this document.
• Stage two of the project was focussed on looking forward. Through consultation with each of the stakeholder groups, the team tried to determine the capacity of each group to make change and move forward from the situation captured in the “Document of Discovery”. The team also worked with each group to discuss what the next steps were to move towards the achievement of the vision.
This report brings together the learnings of the project team.
Section 2 of this document investigates the current issues and provides some estimates of key values in the water/salt cycle in the lower Burdekin.
Section 3 looks at what stakeholders have been doing and why these activities have not managed the rising groundwater and salinity levels.
Section 4 provides discussion about a way forward and recommends some “next steps”.
Page 11 |

John Williams Scientific Services Pty Ltd Final Report
2. What is the current problem in the lower Burdekin? The development of irrigation in the lower Burdekin is outlined in detail in the “Document of Discovery” which is attached in Appendix 1. In brief, irrigation in the lower Burdekin has developed incrementally over time.
As infrastructure was developed (Clare Weir 1979 and Burdekin Falls Dam 1987), irrigation districts were opened up. Channel infrastructure was built and infiltration pits were further developed in the Water Board irrigation districts (this is the delta region of the lower Burdekin). This in turn allowed more areas to be developed for irrigation.
This disjointed development meant that the different irrigation districts of the lower Burdekin saw themselves as separate entities. Policy for the region also evolved in an ad hoc or disjointed fashion as the different irrigation districts were developed.
This has resulted in a complex mix of policy settings and grower management techniques across the lower Burdekin. The soil and aquifer properties across the lower Burdekin are also variable.
However, the current mix of management techniques and policy settings is not complementing the properties of the landscape. Subsequently, negative impacts on groundwater quantity and quality are the result.
There are three key issues which must be addressed in order to move towards sustainability in the lower Burdekin. These are:
1. Understanding and managing the groundwater balance;
2. Understanding and managing the sodic/saline soils and salty groundwater; and
3. Understanding how these issues relate across the three major irrigation districts of the lower Burdekin – the BRIA, the NBWB and the SBWB.
2.1. ISSUE 1: Understanding and managing the groundwater balance
2.1.1. Leakage beneath irrigation The BRIA was developed without the inclusion of deep drainage to remove the increased volume of water being applied to the landscape from irrigation, channel and balancing storage losses. If installed from the outset, deep drainage would have increased the cost of the system and may have made farms unaffordable. Also, at the time, groundwater levels were quite deep and the practice of recharging groundwater (undertaken in the delta) resulted in a culture where rising groundwater was not seen as a particularly problematic issue.
This approach was not suitable for the BRIA. The discharge capacity of flat lands with low relief and constrained low permeability aquifers, as in the lower Burdekin, is small relative to the amount of water entering the landscape under irrigation. The leakage to groundwater is dependent on the soil and crop water management.
Page 12 |

John Williams Scientific Services Pty Ltd Final Report
For the Burdekin soils, the leakage (the drainage beneath the root zone to groundwater under irrigation) with best management possible is at least 48mm/year for some soils, but as high as 455mm/year. On other soils under native woodlands, the leakage to groundwater has been estimated to vary from 2mm/year on low permeability soils and to about 30mm/year on the most permeable soils. Under native woodlands the discharge to the ocean is expected to be about the same as the leakage to groundwater, namely between 2 and 10mm/year. This is in agreement with estimates based on the permeability of the groundwater aquifers and the watertable gradients which push water to the ocean. This is represented diagrammatically in Figure 1.
Figure 1: Estimates of infiltration and discharge in the BRIA
As shown in Figure 1, the amount of water draining beneath the root zone of crops and leaking to the groundwater greatly exceeds (by a factor of 10 or 20 times) the capacity of the groundwater to discharge this water to the ocean. This estimate does not include leakage from irrigation channels and balancing storages. It is therefore wise to treat it as a conservative estimate. The consequence is that watertables are rising on average between 500 and 1000mm per year over large areas of the BRIA (see Appendix 2 and Appendix 3). This rising watertable on the left bank of the BRIA was anticipated by Shaw (1989)4 and his estimates of around 750mm/year are consistent with current observations.
The rising watertables being observed are readily calculated from a very simple water balance first set down by Roger Shaw in 19894. Figure 2 on the following page shows a diagrammatic representation of the water balance using estimated water volumes.
4 Shaw R (1989) Predicted deep drainage loss under dryland and irrigation managements for Burdekin soils. In: ‘Soils of the Burdekin River Irrigation Area. Workshop Proceedings, Ayr, August 1988’. (Eds GE Rayment, VJ Eldershaw) p37. Queensland Department of Primary Industries, Conference and Workshop Series QC89003.
Leakage to groundwater 48‐455mm/year
It is much easier to add water to our groundwater systems than it is to drain water from the landscape
Discharge to ocean 2‐10mm/year
Page 13 |

John Williams Scientific Services Pty Ltd Final Report
Water table
Drainage to sea ~2 to 20 mm/yr
Drainage beneath Woodland is~2 to 20 mm/yr
Drainage beneath irrigation is~50 to 500 mm/yr
1.5 to 15Gl/yr
0.4 to 4.0Gl/yr
23 to 225Gl/yr
Figure 2: Estimated water balance in the BRIA
In Figure 2, we have set out the approximate water balance based on the experiments and published work we have examined and particularly, the early work of Queensland Department of Primary Industries. (See: Ahern, Shaw and Eldershaw (1988)5,7 and Shaw (1989)4, much of which is collected together in workshop papers by Rayment and Eldershaw (1989)6).
The key measure in the water balance is the leakage beneath the root zone to groundwater. This allows us to estimate the total amount of water entering the groundwater system. This can then be compared with the amount of water which the landscape can drain to the ocean (Figure 1 sets this out in diagrammatic form). The difference between the two amounts determines the watertable rise and the magnitude of the interception, drainage and disposal options that will be required to control and manage the watertable.
• With the best water management and agronomy on heavy textured soils, the lowest leakage beneath sugarcane would be some 50mm/year and can be expected to range up to 500mm/year and higher under poor management and on more permeable soils. Roger Shaw estimated that on average for the left bank soils with an irrigation of 1,000mm per year (10 Mega litres per hectare) plus 900mm annual rainfall that the leakage to groundwater would be about 195mm per year. Since his work, we found a small number of experiments which have measured the leakage beneath the root zone and that generally confirm this figure to be a conservative initial estimate under good farm management using flood irrigation for many of the left bank soils. We use this estimate for our simple water balance analysis. Given the 45,000ha of irrigated crops
5 Ahern CR, Shaw RJ, Eldershaw VJ (1988). Predicted deep drainage loss for Burdekin soils. Part A. Interpretation by landscape units and agronomic groups. Queensland Department of Primary Industries, Bulletin QB88004. 6 Rayment GE, Eldershaw VJ (1989). Soils of the Burdekin River Irrigation Area. Workshop Proceedings, Ayr, August 1988. Queensland Department of Primary Industries, Conference and Workshop Series QC89003.
Page 14 |

John Williams Scientific Services Pty Ltd Final Report
and 18,000ha of woodland in the BRIA area of 63,000ha, the flow of water beneath the root zone to groundwater is approximately 90 million m3/year (90,000ML/year).
• The capacity of the groundwater system to dispose of water to the ocean for the left bank of the BRIA can be estimated from the approximate transmissivity of the aquifers and the gradient of the watertable. Following the analysis of Shaw (1989)4, the flow is about 8 million m3/year. With the increase in gradient as the watertable rises and maybe some direct discharge to Barratta Creek and the Haughton River, we estimate this maximum discharge capacity of the landscape to be in the order of 15,000ML/year.
• The capacity of the landscape to discharge groundwater can also be estimated from the leakage under woodland for the 63,000ha of the BRIA prior to development. The work of Ahern et al. (1988)5,7 estimated the deep drainage beneath woodland to be about 12mm/year. This yields a flow of 7,600ML/year which is practically the same as the estimate obtained from aquifer characteristics and the gradient to the ocean. This gives us some confidence that for the BRIA, the landscape capacity to discharge groundwater to the ocean is in the order of 8,000 to 15,000ML/year.
• The key issue is that currently the BRIA appears to be adding some 92,000ML/year to a landscape which can only discharge less than 15,000ML/year. Thus the rise in watertable across the irrigation area (see Appendix 2).
• The volume of water excess to discharge capacity is 77,000ML/year or about 170mm/year over the irrigation area. This amount of water must be intercepted, collected by drainage and/or pumping and while some may be re-used the water quality, as discussed later, will mean that much will need to be discharged in a sustainable manner to rivers and waterways. Table 1 is a preliminary estimate of the groundwater balance for the BHWSS for a number of leakage scenarios under irrigated cropping. These estimates of the current leakage beneath the root zone of irrigated sugarcane do not include an estimate of the leakage from irrigation channels and balancing storages. Thus it can be seen as a conservative estimate.
Table 1: Preliminary estimates of BRIA groundwater balance
Leakage beneath irrigation
(mm per year)
Leakage beneath woodland
(mm per year)
Area of irrigation
(ha)
Total area
(ha)
Landscape drainage capacity
(ML)
Water leaking to groundwater
(ML)
Water in excess to landscape capacity
(ML)
100 12 45,000 63,000 15,000 47,000 32,000
200 12 45,000 63,000 15,000 92,000 77,000
400 12 45,000 63,000 15,000 182,000 167,000
7 Ahern CR, Rosenthal KM (1988). Predicted deep drainage loss for Burdekin soils. Part B. Soil types and individual sites. Queensland Department of Primary Industries, Bulletin QB88005.
Page 15 |

John Williams Scientific Services Pty Ltd Final Report
• The estimate of water that exceeds the landscape drainage capacity allows us to compute an anticipated rise in groundwater for the BRIA. This is set out in Table 2 below. Our simple preliminary calculations follow the logic of Shaw (1989)4 and show that for the leakage rates beneath sugarcane of between 100 and 200mm/year which is consistent with observation, we can expect a rise of between 508 and 1,230mm/year. These estimates of watertable rise are practically identical to what was observed in 2007-2008 (see Appendix 2 and Appendix 3) and in most earlier years. These simple calculations are consistent with our observation of watertable movements.
Table 2: Estimated watertable rise for BRIA for various leakage rates beneath crop root zone
Leakage beneath irrigation
(mm per year)
Water excess to landscape capacity
(ML)
Estimated rise in watertable
(mm/year)
100 32,000 508
200 78,000 1,230
400 167,000 2,650
It is likely that at present rates of groundwater rise, salinity impacts will begin to occur more frequently in this area. This has been brought about by the loss of furrow-irrigated waters to groundwater and their rise in the aquifer.
A report in 2001 by PPK3 estimated that the salinity of the BRIA aquifer is increasing by about 26,000 tonnes/year through the input of about 39,000 tonnes/year via irrigation. This indicates that the aquifer salinity is increasing by about 4 per cent/annum or will double within 25 years.
If the salinity and cation balance is suitable some groundwater could be re-used for irrigation, but a large amount of this water will always need to be disposed back to the river system in ways that are acceptable to the environment and river managers. As Christen et al. (2001)8 show in a review of most Australian irrigation systems, it is the disposal of accumulating salt that is a major issue to be resolved for all irrigation areas. The Burdekin being close to the ocean, and the source of most of the salt, has a unique advantage over inland irrigation areas.
This issue is illustrated diagrammatically in Figure 3.
No matter how careful the irrigation practice, the data suggests that between 50 and sometimes more than 400mm/year of water must be drained, intercepted and managed. If salinity allows, some can be re-used but in most circumstances a large part of the water (could be more than 200mm per year) that moves beyond the roots of the crop will need to be disposed back to the environment in an acceptable manner. The disposal of salt in this drainage water is always a fundamental constraining issue that must be resolved in a sustainable manner (see Christen et al. 2001)8 for every irrigation area. The BRIA has some excellent opportunities for solving this problem because it is located near the ocean where
8 Christen EW, Ayars JE, Hornbuckle JW (2001). Subsurface drainage design and management in irrigated areas of Australia. Irrigation Science 21:35-43.
Page 16 |

John Williams Scientific Services Pty Ltd Final Report
much of the salt originated and can be returned in an environmentally sensitive manner. Figure 3 depicts one of the central issues that must be resolved by Government, community and industry.
Drainage from landscape2 to 20 mm/yr
WATERTABLE
Leakage beneathIrrigation
50 to 455 mm/yr
Interceptpump drain
48 - 435 mm/yr
Re-usefor
irrigationif
salinity suitable
Dispose excess water and salt in accord with EPA specifications
Figure 3: A diagrammatic representation of the desired water balance for irrigated sugarcane in the BRIA to ensure watertables are managed in a sustainable manner
2.1.2. Leakage from channels and drains The above sections have dealt with the deep drainage that leaks beyond the root zone of irrigated crops to recharge groundwater systems and is the primary driver for the rise in watertables that are displayed in Appendix 2. However, there are other leakages to groundwater that also need to be reduced and managed carefully in the BRIA.
To maintain watertables, it will be necessary to reduce leakage from channels and drains. This will reduce the diluting influence on aquifer salinity. To compensate for this, it will be necessary to significantly reduce deep drainage from irrigated lands to levels that approach aquifer through-flow and discharge capacities. Thus both leakage under crops and leakage under structures that supply, distribute and collect water must be carefully managed to maintain watertables at acceptable levels.
To provide a preliminary indication of the leakage from the irrigation channel distribution system, a very rudimentary analysis has been attempted to place the magnitude of channel leakage in perspective with that from irrigated crops. It is hoped that this would provide some guidance as to relative magnitude and thus, options for action by respective stakeholders.
Page 17 |

John Williams Scientific Services Pty Ltd Final Report
SunWater, as part of System Leakage Management Plan (SLMP), has conducted comprehensive studies of leakage from all its distribution systems and for the purposes of this work we have given focus to the Haughton and Barratta distribution system.
The Haughton system which is made of several sections including the Haughton, Selkirk and Horseshoe Lagoons has a length of 62.5km and is largely unlined, except for a 1.7km section at 17.7km mark and a 1km pipeline at its end. There are thirteen lateral channels and eight sub-laterals within the Haughton distribution system. All of the laterals are earth channels except for one lateral and two sub-laterals and 700m of pipeline.
The Barratta distribution system is supplied from the Haughton main channel. It is an earth lined channel of approximately 40km in length. There are six lateral and fifteen sub-laterals within the Barratta system. All are earth lined except for two.
The length of the main channel, laterals and sub-laterals along with the average depths and widths of the base have been extracted from infrastructure information supplied by SunWater. The estimated average length of laterals and sub-laterals was 10 and 5km respectively. The width of bed for the channel, lateral and sub-lateral was 4, 2 and 1m respectively. Using these values, the following very simple and rudimentary estimates of expected leakages to the groundwater system were made. These were checked against the measurements and observation made in SLMP prepared by SunWater.
Table 3: Estimates of base area (m2) for the channels, laterals and sub-laterals for the Haughton/Barratta Distribution Systems
System Channel base area
Lateral base area
Sub‐laterals base area
Total base area
Haughton 248000 260000 40000 548000
Barratta 160000 120000 75000 355000
Total 903000
Table 4: Estimates of possible leakage (GL/yr) from base of channels, laterals and sub-laterals for the Haughton/Barratta Distribution Systems at four hydraulic
conductivities (K) for the sub-soil material at base of channels
System K = 1mm/day K = 5mm/day K = 10mm/day K = 100mm/day
Haughton 0.18 0.90 1.81 18.08
Barratta 0.12 0.58 1.17 11.71
Total 0.30 1.48 2.98 29.79
From Table 3 it is estimated that the area of the base of the distribution system through which water must pass and leak to the groundwater is approximately 90 hectares. If the channels are full for 330 days a year, Table 4 shows that the Haughton/Barratta distribution system
Page 18 |

John Williams Scientific Services Pty Ltd Final Report
could leak from 300 to 30,000ML/year for the range of hydraulic conductivities we would encounter with unlined channels built on sub-soil material from the Burdekin soils.
During rainfall shutdowns on the Haughton main channel, the SLMP has an estimate of leakage rates of 5ML/day. If we use the dimensions of the Haughton main channel, it would require a hydraulic conductivity of 20mm/day to produce a leakage rate of 5ML per day. For 330 days a year this generates for the Haughton main channel a leakage of 1,650ML/year. If this leakage rate applied to the whole of the Haughton/Barratta system, the leakage would be approximately 6,000ML/year.
In short, these very simple and rudimentary calculations in Table 4 at least appear to be credible with the observational data available. It suggests that if the hydraulic conductivity of soil material in unlined channels could be kept below 10mm/day, the leakage from the system could be kept at about 3,000ML/year. Clearly much more careful and detailed work is necessary on this matter.
Unfortunately, the leakage across the whole of the Haughton/Barratta system is significantly greater than the levels calculated in Tables 3 and 4 using data from the Haughton main channel. The SLMP reports that for the Haughton/Barratta system over five years from 2003 to 2007, the system supplied on average 302,300ML/year with an inferred leakage of 67,600ML/year or on average 22%. The Haughton/Barratta systems appear high with respect to the other distribution system in the Burdekin where the inferred leakage is 1 - 2% and 10 - 12% for the Clare and Elliott distribution systems respectively.
These inferred leakage values for the Clare distribution system and the Haughton main channel suggest there is good ground for reducing the leakage to 2%. This would yield leakage rates of about 6,000ML/year which accord with the estimated leakage rates set out in Table 4. A goal of getting leakage rates from distribution infrastructure to below, say, 3,000ML/year appears a sensible objective.
2.1.3. Combined leakage Combining both the leakage from deep drainage under irrigated crops and the leakage from channels and drains gives a total input to the aquifer of 160,000ML/year with a calculated landscape drainage capacity of 15,000ML/year. As a result, 145,000ML/year excess water enters the aquifers of the BRIA. This would result in a watertable rise almost double that observed (Appendix 2).
The work of Cook et al.9 estimates discharge of groundwater to surface waters across the entire alluvial floodplain of the lower Burdekin to be in the order of 30,000 – 150,000ML/year (this assumes the majority of the discharge to surface waters occurs to the Burdekin River, Haughton River, Barratta Creek and Plantation Creek) and the discharge to Bowling Green Bay to be in the order of 50,000 – 400,000ML/year. These values are significantly higher than the 15,000ML/year we have estimated. The 15,000ML/year estimate is calculated using a 25km boundary with Bowling Green Bay to the north of the BRIA. Cook et al.9 use the whole
9 Cook PG, Stieglitz T, Clark J (2004). Groundwater Discharge from the Burdekin Floodplain Aquifer, North Queensland. CSIRO Land and Water Technical Report No. 26/04, August 2004.
Page 19 |

John Williams Scientific Services Pty Ltd Final Report
Bay as a boundary and also include discharge from the North and South Water Board irrigation districts which have soils with much greater transmissivity than those of the BRIA.
The combination of the lower than expected rates of groundwater rise in the BRIA and the much higher discharge rates observed by Cook et al.9 compared to the 15,000ML/year calculated, raise the possibility that the delta area may be acting as a drainage system for the groundwater of the BRIA. Further work needs to be undertaken to determine the significance of this relationship. If it is as significant as it initially appears, it will mean that the continued rise of groundwater and salt levels in the BRIA will have major implications for the management of the North and South Water Board irrigation districts.
These findings suggest that a sustainable future for the lower Burdekin requires effective strategic management of the entire lower Burdekin.
2.2. ISSUE 2: Understanding and managing sodic/saline soils and salty groundwater
Soils with sodic and saline sub-soils in which the exchangeable sodium percentage exceeds 6, occupy approximately 43% of the land within the Burdekin-Haughton Water Supply Scheme (BHWSS). This immediately draws attention to a requirement for not only very careful soil management to keep the soils productive but it flags that there are large stores of salt in the landscape which will be mobilized by excess irrigation and that they must be managed in a sustainable manner.
Figure 4 serves to illustrate the extensive distribution of soils with large stores of salts in their sub-soils within the BRIA.
Page 20 |

John Williams Scientific Services Pty Ltd Final Report
Figure 4: Distribution of Sodic soils within the Burdekin-Haughton Water Supply Scheme in the lower Burdekin (From Day K, Lio J and Christianos N (1995). In: ‘Australian Sodic
Soils. Distribution, Properties and Management’. (CSIRO Australia)
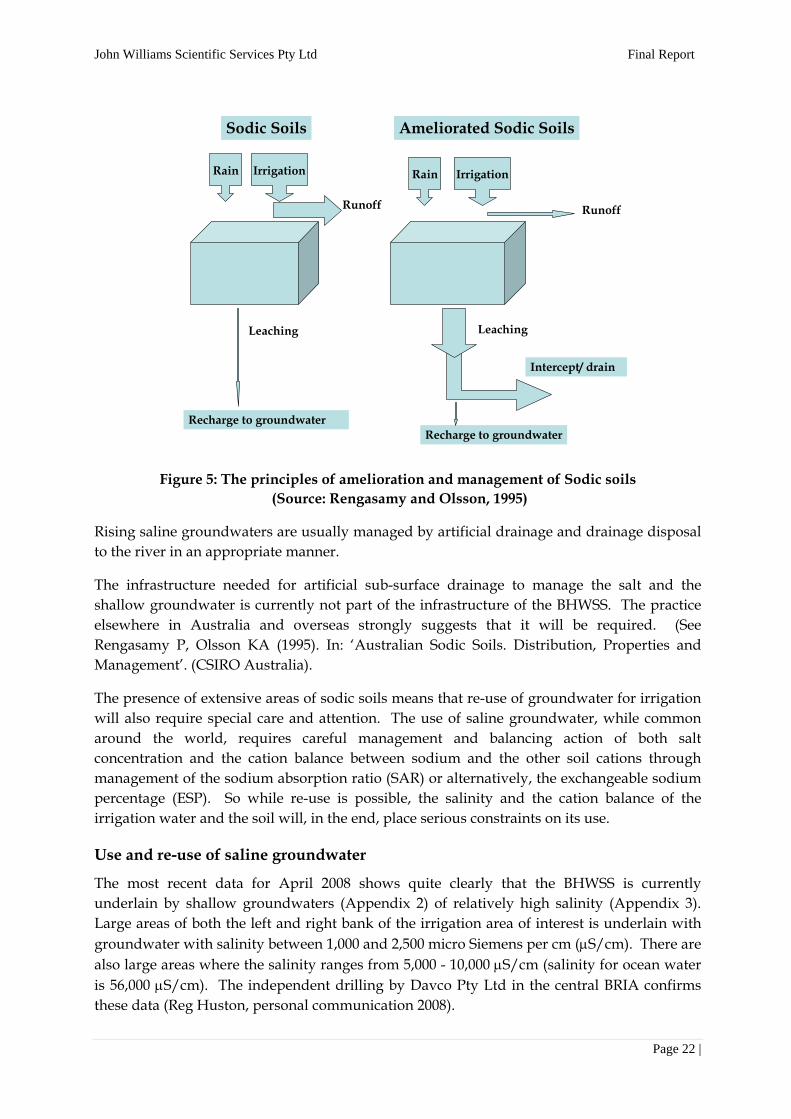
Sodic soils require careful management not only to overcome agronomic limitations but also to manage the large amounts of salt they store and which can be leached to groundwater under irrigation. These sodic soils are known to reduce potential sugarcane yields from between 10 and 50%. The inevitable consequence of continued irrigation of these sodic soils without appropriate management of the drainage is further structural decline and concentration of salt in the root zone. These soils need, and have, over large areas of the lower Burdekin, been ameliorated with large amounts of gypsum and special tillage to improve soil structure through build-up of organic matter and biological activity. Much good progress has been made on this matter in the BHWSS (see Ham GJ, et al. (1995). In: ‘Australian Sodic Soils. Distribution, Properties and Management’. (CSIRO Australia). This improved structural condition means the soil permeability has also changed (increased) and now can conduct water past the root zone and flush out salts from the root zone which limit sugarcane yields. This is good news in the short term for crop production, but the salt that is flushed from the root zone must go somewhere, and it does... it begins to accumulate in the rising shallow groundwater.
The improvement in the sodic soils not only moves salt past the root zone but because of increased soil permeability it means that leakage of water beneath the root zone also increases. Both these processes contribute to the rising and increasingly saline shallow groundwater. The important consequence of sodic soil amelioration is illustrated in Figure 5.
Page 21 |
John Williams Scientific Services Pty Ltd Final Report
Sodic Soils Ameliorated Sodic Soils
IrrigationRain
Recharge to groundwater
Rain Irrigation
Leaching
Runoff Runoff
Leaching
Recharge to groundwater
Intercept/ drain
Figure 5: The principles of amelioration and management of Sodic soils (Source: Rengasamy and Olsson, 1995)
Rising saline groundwaters are usually managed by artificial drainage and drainage disposal to the river in an appropriate manner.
The infrastructure needed for artificial sub-surface drainage to manage the salt and the shallow groundwater is currently not part of the infrastructure of the BHWSS. The practice elsewhere in Australia and overseas strongly suggests that it will be required. (See Rengasamy P, Olsson KA (1995). In: ‘Australian Sodic Soils. Distribution, Properties and Management’. (CSIRO Australia).
The presence of extensive areas of sodic soils means that re-use of groundwater for irrigation will also require special care and attention. The use of saline groundwater, while common around the world, requires careful management and balancing action of both salt concentration and the cation balance between sodium and the other soil cations through management of the sodium absorption ratio (SAR) or alternatively, the exchangeable sodium percentage (ESP). So while re-use is possible, the salinity and the cation balance of the irrigation water and the soil will, in the end, place serious constraints on its use.
Use and re-use of saline groundwater
The most recent data for April 2008 shows quite clearly that the BHWSS is currently underlain by shallow groundwaters (Appendix 2) of relatively high salinity (Appendix 3). Large areas of both the left and right bank of the irrigation area of interest is underlain with groundwater with salinity between 1,000 and 2,500 micro Siemens per cm (μS/cm). There are also large areas where the salinity ranges from 5,000 - 10,000 μS/cm (salinity for ocean water is 56,000 μS/cm). The independent drilling by Davco Pty Ltd in the central BRIA confirms these data (Reg Huston, personal communication 2008).
Page 22 |
John Williams Scientific Services Pty Ltd Final Report
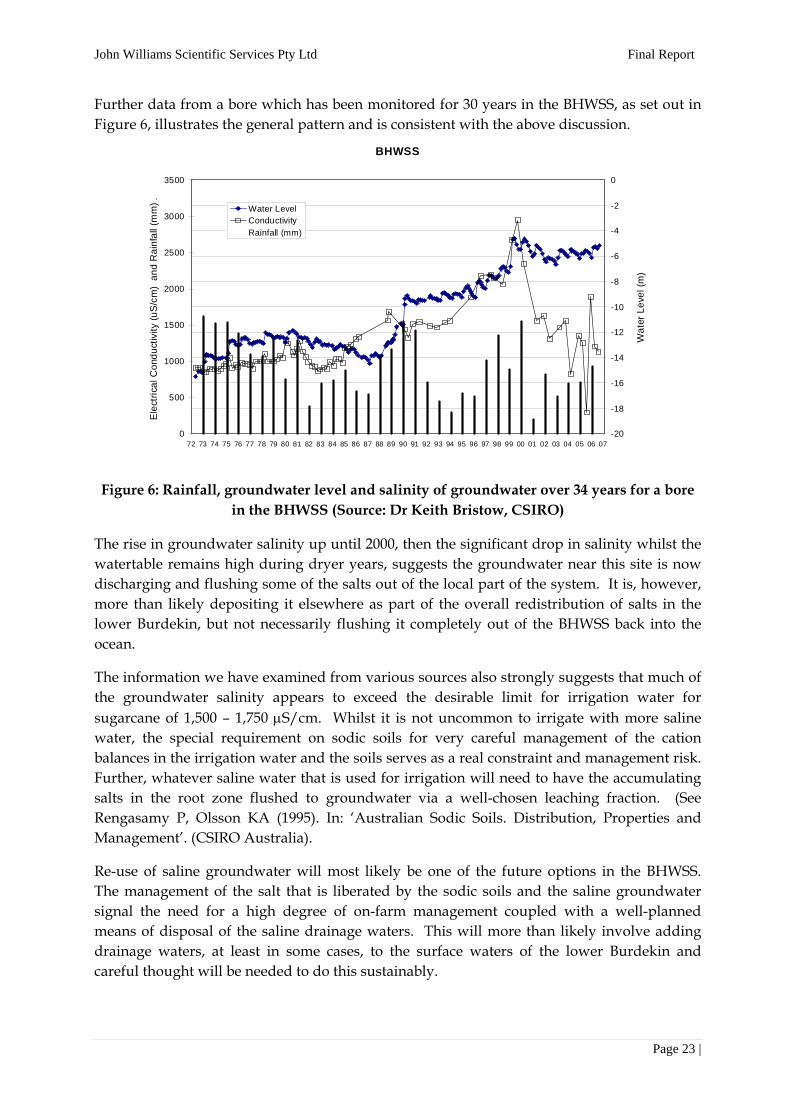
Further data from a bore which has been monitored for 30 years in the BHWSS, as set out in Figure 6, illustrates the general pattern and is consistent with the above discussion.
BHWSS
-20
-18
-16
-14
-12
-10
-8
-6
-4
-2
0
72 73 74 75 76 77 78 79 80 81 82 83 84 85 86 87 88 89 90 91 92 93 94 95 96 97 98 99 00 01 02 03 04 05 06 07
Wat
er L
evel
(m)
0
500
1000
1500
2000
2500
3000
3500
Ele
ctric
al C
ondu
ctiv
ity (u
S/c
m)
and
Rai
nfal
l (m
m) . Water Level
ConductivityRainfall (mm)
Figure 6: Rainfall, groundwater level and salinity of groundwater over 34 years for a bore in the BHWSS (Source: Dr Keith Bristow, CSIRO)
The rise in groundwater salinity up until 2000, then the significant drop in salinity whilst the watertable remains high during dryer years, suggests the groundwater near this site is now discharging and flushing some of the salts out of the local part of the system. It is, however, more than likely depositing it elsewhere as part of the overall redistribution of salts in the lower Burdekin, but not necessarily flushing it completely out of the BHWSS back into the ocean.
The information we have examined from various sources also strongly suggests that much of the groundwater salinity appears to exceed the desirable limit for irrigation water for sugarcane of 1,500 – 1,750 μS/cm. Whilst it is not uncommon to irrigate with more saline water, the special requirement on sodic soils for very careful management of the cation balances in the irrigation water and the soils serves as a real constraint and management risk. Further, whatever saline water that is used for irrigation will need to have the accumulating salts in the root zone flushed to groundwater via a well-chosen leaching fraction. (See Rengasamy P, Olsson KA (1995). In: ‘Australian Sodic Soils. Distribution, Properties and Management’. (CSIRO Australia).
Re-use of saline groundwater will most likely be one of the future options in the BHWSS. The management of the salt that is liberated by the sodic soils and the saline groundwater signal the need for a high degree of on-farm management coupled with a well-planned means of disposal of the saline drainage waters. This will more than likely involve adding drainage waters, at least in some cases, to the surface waters of the lower Burdekin and careful thought will be needed to do this sustainably.
Page 23 |

John Williams Scientific Services Pty Ltd Final Report
This is a critical issue which must be addressed as part of the regional strategy for the whole lower Burdekin. It brings into question the initial prescription and conceptual framework for the groundwater management unit: the Burdekin River Irrigation Area (Left Bank) as specified at: http://www.anra.gov.au/topics/water/overview/qld/gmu‐burdekin‐river‐irrigation‐area‐left‐bank.html
where it is stated that … “The BRIA predominantly uses surface water supplies, with the availability of surface water supplies virtually guaranteed by the presence of the Burdekin Falls Dam located further upstream. Conjunctive water use within the BRIA is required to prevent water table rise and salinity problems, and is promoted by State Water Projects (SWP) by allocating 1 ML of groundwater for each 8 ML of surface water.”
This suggests that for each 10ML per hectare applied during the irrigation season, it was expected that some 125mm will leak past the sugarcane root zone. Our work suggests that this is larger than 125mm and as high as 200mm under current circumstances. Regardless of the actual number, the ultimate design requires pumping of groundwater to prevent the watertable rising in conjunction with irrigation practices and infrastructure which minimize irrigation accessions to groundwater. The problem we have identified, along with many others, is that the lower Burdekin irrigation districts will need a means to manage rising saline groundwater in a sustainable manner. The current provision for groundwater re-use is recognition of the fundamental problem, but we now need to act by addressing the problems with modern infrastructure to intercept, drain, in some cases re-use, and dispose of salt and drainage water as part of the irrigation system. This is fundamental for a modern sustainable irrigation system and essential to ensure a sustainable future for the lower Burdekin. This is the task ahead.
2.3. ISSUE 3: Understanding the relationships of the water and salt balances in the BRIA, NBWB and the SBWB
Although a significant amount of investigation has been undertaken on the delta groundwater aquifers (SBWB and NBWB) and BRIA areas individually, there has been very little work to date which assists community and stakeholders understand the relationships between the groundwater aquifers which connect and which underpin the long term functioning of these irrigation districts.
This lack of knowledge means it is difficult to determine how the raised salt concentrations and groundwater levels in the BRIA interface with the aquifers of the delta.
The delta has management issues of its own including increased salinity and salt water intrusion from the ocean. It is unclear what impact management of salinity and groundwater levels in the BRIA will have on these issues within the delta areas.
Further work is required to better integrate the knowledge of the BRIA and the delta and fill the knowledge gap of the relationships between the areas.
Page 24 |

John Williams Scientific Services Pty Ltd Final Report
3. What has been happening up till now? Although the project team have undertaken some analysis in the previous section, the information we have brought together is not new and has been available in a fragmented form for some time. The three key issues which we have highlighted have been known by individuals in agencies, scientific institutions and in industry leadership. As identified earlier in this report, PPK3 in 2001 undertook an investigation of the rising groundwater and salinity.
The report concluded that the salt balance, in combination with the rising watertable phenomena, raises a number of significant issues that are summarised as follows:
Within 25 years groundwater will be too brackish to blend with channel water on some farms without affecting crop yields or deep drainage characteristics of soil;
Some areas, such as Mona Park, are already experiencing this phenomena and deep drainage is increasing to the extent that current groundwater pumping cannot stop rising watertables;
The source of salinity increases is predominantly from deep drainage after irrigation as the result of plant evapotranspiration concentrating salt in the root zone. In non-irrigated lands, recharging rainfall does not carry the salt loading as experienced under irrigated lands. Further, it tends to dilute the underlying salinity of the aquifer in most areas. Leakage of channel and storm water from drains and channels have a similar dilution effect;
Decreasing recharge to the aquifer will tend to heighten the salt increase to the aquifer unless recharge equals discharge. This balance is unlikely to be achieved because of the total area under irrigation and irrigation practices;
To maintain watertables, it will be necessary to reduce leakage from channels, drains, weirs, lagoons and rivers. This will reduce the diluting influence on aquifer salinity. To compensate for this, it will be necessary to significantly reduce deep drainage from irrigated lands to levels that approach aquifer throughflow/discharge;
In the probable event that deep drainage/recharge cannot be reduced to throughflow/discharge volumes, groundwater will have to be exported from the system to maintain salt balances; and
Areas currently using only channel water have the potential to use more groundwater. This will improve soil condition without the use of gypsum but will require attention to irrigation practices.
Along with these project findings, the report recommended a range of actions. Given that this report was published in 2001, it is surprising that the groundwater continues to rise and salt levels increase.
The project team found that numerous other studies have been undertaken and reports developed which have identified the issues and potential solutions. For one reason or another, these have not been successfully implemented and the issues and problems still exist.
Page 25 |

John Williams Scientific Services Pty Ltd Final Report
The fact that the communities of stakeholders have not drawn together and acted upon the information available to date, suggests that a new approach to social process in the lower Burdekin stakeholders and community is necessary. What is now needed is learning, planning and building together an action plan along with designing and implementing new institutional arrangements is of paramount importance to the lower Burdekin communities.
3.1. Research and science Extensive research and scientific work has been undertaken across the lower Burdekin. The science community has made considerable effort in trying to understand key parts of the system and some excellent work has been done. Unfortunately, this work has generally been focussed on specific issues rather than the macro scale of the entire lower Burdekin. Added to this is the research funding model which is also generally aimed at specific issues rather than long term issues at the macro scale.
Consequently, big picture questions like “what are the properties of the aquifers of the lower Burdekin and how do they interact?” have not been answered. This lack of big picture knowledge makes it very difficult to undertake strategic planning. It also means that in the absence of this knowledge, each stakeholder group uses their specific knowledge to develop beliefs on how the landscape operates.
3.2. Policy and action Considerable effort has been made by both irrigators and Government to improve practices and undertake activities which will result in the management of the rising groundwater and, to a lesser degree, the management of the salt.
Unfortunately, these efforts have generally not been co-ordinated. Additionally, they have not been strategically implemented within a whole of lower Burdekin plan so that actions dovetail into each other and lead to cumulative benefits.
The lack of a robust understanding of the aquifer properties and relationships across the lower Burdekin means that although projects are driven by specific issues, their whole of basin impacts are speculative. The policy settings have also been made without this robust understanding and have been uniform across the BRIA.
This policy uniformity across an area with highly variable aquifer properties and water quality has in part restricted effective management of the rising groundwater. Water pricing in its current form is also identified as a key driver in irrigators not pumping groundwater for re-use. This needs to be explored further to establish its level of contribution.
The Water Boards have worked quite effectively with Government to locally manage some of the groundwater issues in their area. However, it is clear that the aquifers of the lower Burdekin do not follow the boundaries drawn on a map. It is possible therefore, that the issues currently affecting the BRIA will have flow-on implications for the Delta Water Board areas.
This suggests that strategic planning at a whole of lower Burdekin scale might be the most effective way to move forward.
Page 26 |

John Williams Scientific Services Pty Ltd Final Report
Ultimately though, all stakeholders have spent large amounts of money and time trying to address the issues yet each year the water and salt levels continue to rise. Even during the lifetime of this work, the project team have observed multiple projects being undertaken by different stakeholders with costs stretching above the million dollar mark. Yet when the question is asked how these projects interrelate, how their knowledge will be captured and integrated with future projects and how they dovetail to deliver cumulative benefits, it appears they don’t.
It is clear stakeholders are making the effort but like holding the wrong end of a hammer, your efforts may have a limited outcome. If you change your approach and take the handle of the hammer, you will find you can get much better outcomes with the same or even less effort.
It is time for the stakeholders of the lower Burdekin to try a different approach. For those who disagree with this, the continually rising salt and groundwater levels provide pretty damning evidence that the current approach is not working in spite of all the effort that has been made.
Page 27 |

John Williams Scientific Services Pty Ltd Final Report
4. What is the way forward? There is no single solution that will resolve the issues of the lower Burdekin and deliver a sustainable future. A sustainable future will be achieved by making many adjustments in areas ranging from policy to on-farm practices. These adjustments need to be made in a planned and strategic way so that action and reaction can be observed and subsequent changes made. If a strategic approach is used projects can dovetail into each other and cumulative benefits, larger than the impact of any one project, will start to eventuate. This process is classically represented by the continual improvement diagram below (Figure 7).
Figure 7: Continual improvement cycle
An effective solution to deliver a sustainable future to the lower Burdekin will not be developed by one stakeholder group. Each stakeholder group brings its own knowledge, experience and beliefs which must be worked into an agreed way forward, involving agreed plans and actions. If one group tries to develop a solution independently, it is very unlikely it will have adequately captured the knowledge and beliefs of the other stakeholders. Consequently, it is destined to be rejected and fail.
The project team have experienced this first hand through the life of this project. At times, the project team was overrun with enthusiasm and put forward what it felt was a logical and reasonable solution. In hindsight, it does not seem surprising that the project team had failed to adequately understand the knowledge and beliefs of one of the stakeholder groups and consequently, the ideas were not well-received.
This experience has reinforced to the project team that only through a process involving all stakeholder groups working together will an effective solution be reached.
Page 28 |

John Williams Scientific Services Pty Ltd Final Report
4.1. How could the process begin? Firstly, the stakeholders must come together to establish a forum in which the groundwater and salinity management issues can be discussed and knowledge shared. Priority issues the forum must consider are:
1. What mix of strategies will best address the 145,000ML/year of excess water entering the system in the BRIA and what implications does this have for salt and groundwater management in the North and South Burdekin Water Board irrigation districts given:
• the deep drainage and leakage to groundwater under the irrigation area is of an order that it cannot be managed by improved irrigation practice, groundwater pumping and re-use alone;
• the reduction of leakage from channels and drains will reduce the diluting influence on aquifer salinity and to compensate for this, it will be necessary to significantly reduce deep drainage from irrigated lands to levels that approach groundwater aquifer discharge capacity (about 15,000ML/year) to the ocean. This is unlikely to be achieved and therefore interception, collection and disposal of this excess recharge will need to be part of the solution. Modern irrigation drainage and disposal infrastructure will doubtless be part of the future for the BRIA;
• groundwater is now often too brackish to blend with channel water on some farms without affecting crop yields or deep drainage characteristics of soil. Over time, salinity will rise and this problem can be expected to escalate. Some areas, such as Mona Park, are already experiencing this phenomena and deep drainage is increasing to the extent that current groundwater pumping cannot stop rising watertables; and
• the relationship between the aquifers of the BRIA and the North and South Burdekin Water Board irrigation districts is not well-understood. This makes it difficult to determine the impacts of changed groundwater management in the BRIA on the Water Board irrigation districts and understand what actions will need to be undertaken in these irrigation districts.
It is anticipated:
• solutions will increasingly include infrastructure to pump, drain, intercept and return water to the environment;
• solutions will need to incorporate improved irrigation practices and reduced leakage from channels and drains;
• the present arrangements and policies that allow for pumping of groundwater in the BRIA as well as pricing arrangements will need to be evaluated and, if required, updated to allow greater use of groundwater;
• strategic areas where groundwater pumping is likely to be effective in managing salinity and watertable levels will need to be identified and considered; and
• solutions will need to be evaluated in the context of the constraints on re-use of groundwater imposed by rising salinity on both crop productivity and the impacts on the properties of sodic soils.
Page 29 |

John Williams Scientific Services Pty Ltd Final Report
2. What mix of strategies will best reduce the salinity levels of the groundwater of the lower Burdekin given:
• the source of salinity increases may be a mix of plant evapotranspiration concentrating salt in the root zone and deep drainage irrigation of crops transporting this to the aquifer and the mobilization of historic salt deposits as a result of irrigation practices;
• irrigation practices will always require a leaching fraction to move salt from the root zone to groundwater, consequently the salt balance of recharge equalling discharge is unlikely to be achieved because of the total area under irrigation; and
• the relationship between the aquifers of the BRIA and the North and South Burdekin Water Board irrigation districts is not well-understood. This makes it difficult to determine the costs and benefits for the Board irrigation districts (which are experiencing rising salt concentrations) resulting from changed activities in the BRIA and what actions will be required in the Board irrigation districts to manage rising salt concentrations.
It is anticipated the solution will need to identify a sustainable long term mix of:
• infrastructure to pump, drain, intercept and return salt and water to the ocean to complete the salt cycle;
• groundwater pumping and re-use;
• improved irrigation practices;
• reduced channel leakage; and
• adjusted water pricing.
3. How are knowledge needs going to be more effectively identified and met and the outputs collated for use by all stakeholders? How will this be undertaken so that the groundwater of the lower Burdekin is better understood and managed? How will the knowledge be managed so that it becomes part of the human capital of the lower Burdekin community and thus shapes future planning?
The forum must undertake a strategic planning process to develop an effective approach to gathering the knowledge required and implementing the solutions to these questions. It is hard to see how successful implementation and long term sustainable management can be developed without careful attention being given to institutional reform and clarification of responsibilities and accountabilities of all within the community of stakeholders.
If a project cannot demonstrate how it is delivering on one of the priority issues above, its immediate value should be questioned (it may still be a valuable project in the longer term but this needs to be compared with projects that deliver immediate value). Projects that deliver on one of the priority issues above and also result in multiple benefits such as improved biodiversity, water quality, soil health and social benefits should be prioritised.
Page 30 |

John Williams Scientific Services Pty Ltd Final Report
4.2. What is the first step in the process? With these criteria in place, the planning process can begin. The first step of a planning process is the agreement to some rules of operation which spell out how the stakeholders will come together, the objectives of the group, roles and responsibilities, the process for making decisions and what decisions can be made by the group, and processes for moving through disagreements between stakeholders.
It is critical that these things are spelt out at the beginning and documented in a Charter so that all stakeholders know what they are committing themselves to. Stakeholders must formally commit to the Charter and also commit to how they are going to financially (or in kind) support the process.
Once this framework is in place and objectives have been agreed, the group must start the planning process. This will culminate in the development of objectives (targets) for the lower Burdekin. These objectives may be broken down into shorter term milestones. Actions must then be determined to reach the milestones. As outlined above, this will be an iterative process.
It is likely progress will be slow and frustrating at first. This would not be surprising given the history of the issues and people being unfamiliar with the approach. Stakeholders must persist as the group will find what works and begin to work more efficiently over time.
It is also likely that some full time secretariat support will be required so that actions are implemented and administrative work is carried out in a timely fashion. The model will not work if people are expected to undertake this work on top of their normal role within Government or whilst trying to run a farm. The secretariat and funding for it must be agreed at the beginning of the process.
4.3. What could be done tomorrow to begin the process? Many people have asked the project team “what action could we do tomorrow to begin this process, where do we start?”
The project team believes to start the process senior Government staff need to get a clear message to the stakeholders in the lower Burdekin that they are willing to come to Ayr to commence preliminary discussions on how a group could be formed to begin the strategic planning process, and that they are willing to work collaboratively in developing agreed objectives and an operational framework to achieve those objectives.
Senior Government staff from the key agencies travelling to Ayr for this type of discussion sends a very clear message to irrigators and the whole lower Burdekin community that Government is willing to have a serious look at the process and work with these communities to implement long term sustainable solutions.
Irrigators need to show they also are willing to seriously engage in this process. Letters should be sent by the two Water Boards as well as the BRIA Irrigators Committee stating their support for this process and willingness to engage.
Page 31 |

John Williams Scientific Services Pty Ltd Final Report
The Lower Burdekin Water Futures group would provide a useful forum for this discussion to begin. The LBWF is already in place and has good representative membership from across the stakeholder groups of the lower Burdekin.
Page 32 |

John Williams Scientific Services Pty Ltd Final Report
5. References Ahern CR, Shaw RJ, Eldershaw VJ (1988). Predicted deep drainage loss for Burdekin soils. Part A. Interpretation by landscape units and agronomic groups. Queensland Department of Primary Industries, Bulletin QB88004.
Ahern CR, Rosenthal KM (1988). Predicted deep drainage loss for Burdekin soils. Part B. Soil types and individual sites. Queensland Department of Primary Industries, Bulletin QB88005.
Christen EW, Ayars JE, Hornbuckle JW (2001). Subsurface drainage design and management in irrigated areas of Australia. Irrigation Science 21:35-43.
Cook PG, Stieglitz T, Clark J (2004). Groundwater Discharge from the Burdekin Floodplain Aquifer, North Queensland. CSIRO Land and Water Technical Report No. 26/04, August 2004.
Day K, Lio J, Christianos N (1995). In: ‘Australian Sodic Soils. Distribution, Properties and Management’. (CSIRO Australia).
Ham GJ, et al. (1995). In: ‘Australian Sodic Soils. Distribution, Properties and Management’. (CSIRO Australia).
Hopley D (1970). The geomorphology of the Burdekin delta, North Queensland. James Cook University, North Queensland, Department Geography Monograph Series No. 1 pp 1-66.
PPK, (2001). The Proposed Groundwater Management Strategy for the Burdekin Houghton Water Supply Scheme. Department of Natural Resources and Mines, November 2001.
Rayment GE, Eldershaw VJ (1989). Soils of the Burdekin River Irrigation Area. Workshop Proceedings, Ayr, August 1988. Queensland Department of Primary Industries, Conference and Workshop Series QC89003.
Rengasamy P, Olsson KA (1995). In: ‘Australian Sodic Soils. Distribution, Properties and Management’. (CSIRO Australia).
Shaw R (1989) Predicted deep drainage loss under dryland and irrigation managements for Burdekin soils. In: ‘Soils of the Burdekin River Irrigation Area. Workshop Proceedings, Ayr, August 1988’. (Eds GE Rayment, VJ Eldershaw) p37. Queensland Department of Primary Industries, Conference and Workshop Series QC89003.
Page 33 |

John Williams Scientific Services Pty Ltd Final Report
6. Appendix 1: Document of Discovery To be supplied as a separate file.
Page 34 |

John Williams Scientific Services Pty Ltd Final Report
7. Appendix 2: BHWSS groundwater depths in April 2008
Page 35 |

John Williams Scientific Services Pty Ltd Final Report
8. Appendix 3: BHWSS groundwater salinity in April 2008
Page 36 |

John Williams Scientific Services Pty Ltd Final Report
~ End of Report ~
Page 37 |