review of pricing strategies - dwaf.gov.zapricing strategy review 29 june... · 1.1 project...
TRANSCRIPT

Review of Pricing Strategies 2012
Submitted by
www.pegasys.co.za
In Association With
29 June 2012 WP10465 Review of Water Pricing
Project to Revise the Pricing Strategy for Water Use Charges and Develop a Funding Model for Water Infrastructure Development and Use and a Model for the Establishment of an Economic Regulator

Review of Pricing Strategies 2012
i | P a g e
Table of Contents 1 Introduction .................................................................................................................................... 1
1.1 Project Background and Context ............................................................................................ 1
1.2 Document Structure................................................................................................................ 2
2 Public Finance, Pricing and Water .................................................................................................. 3
2.1 Water as a Public/Private Good (Resources) .......................................................................... 3
2.2 Public Finance and Pricing Theory .......................................................................................... 3
2.2.1 Taxation ........................................................................................................................... 3
2.2.2 Tariffs .............................................................................................................................. 4
2.2.3 User Charges ................................................................................................................... 4
2.2.4 Nominal Fees/Charges .................................................................................................... 5
2.2.5 Subsidies ......................................................................................................................... 5
2.2.6 Water Markets as Pricing Mechanisms ........................................................................... 7
2.2.7 Water Banking ................................................................................................................. 8
2.3 Financing water ....................................................................................................................... 8
2.3.1 Water Cost Components ................................................................................................. 8
2.3.2 The Value of Water ....................................................................................................... 10
3 Water Pricing Principles ................................................................................................................ 12
3.1 Constitutional principles ....................................................................................................... 12
3.2 Overarching Principles of the Pricing Strategy ..................................................................... 12
3.2.1 Policy /strategic principles ............................................................................................ 12
3.2.2 Operational principles ................................................................................................... 12
4 South African Approach to Water Pricing ..................................................................................... 14
4.1 Evolution of Water Management in South Africa ................................................................. 14
4.1.1 Integrated Water Resource Management .................................................................... 15
4.1.2 Infrastructure Development ......................................................................................... 16
4.1.3 Water for Growth and Development ............................................................................ 17
4.2 Evolution of Water Pricing in South Africa ........................................................................... 17
4.2.1 Government Water Schemes Before 1970 ................................................................... 17
4.2.2 Commission of Enquiry in Water Matters ..................................................................... 17
4.2.3 Pricing Strategy of Raw Water Use: The early Years ..................................................... 18
4.2.4 Water Pricing Between 1995 and 1999 ........................................................................ 18
4.2.5 Implementing the Pricing Strategy: 1999 – 2007 ......................................................... 19
Review of Pricing Strategies 2012
4.2.6 Implementing the Pricing Strategy: 2007 to Date ........................................................ 20
4.3 Pricing Strategy Prescribed Water Use Charges ................................................................... 21
4.3.1 Raw Water Infrastructure Charge ................................................................................. 22
4.3.2 Water Resources Management (WRM) Charge ............................................................ 25
4.3.3 Waste Discharge Charge ............................................................................................... 27
4.3.4 Water Research Levy ..................................................................................................... 27
4.3.5 Working for Water Charges/Payment for ecological services ...................................... 28
4.3.6 Water Use Licensing Fee ............................................................................................... 28
4.4 Current Revenue and Expenditure Overview ....................................................................... 29
4.5 Current Institutional Arrangements ...................................................................................... 30
4.6 National Treasury Administered Water Prices Report ......................................................... 31
4.6.1 Recommendations of the Report .................................................................................. 32
4.7 Pricing in Other Sectors – Eskom .......................................................................................... 33
4.7.1 Tariff Structure .............................................................................................................. 33
4.7.2 Protection to the Poor .................................................................................................. 34
5 International Experience – Case Studies ....................................................................................... 36
5.1 Australia ................................................................................................................................ 36
5.1.1 Introduction .................................................................................................................. 36
5.1.2 Transforming Water in Australia ................................................................................... 38
5.1.3 Water Management Principles ..................................................................................... 38
5.1.4 Defining and Recovering Water Costs .......................................................................... 39
5.1.5 Summary of Cost Recovery for Water Supply ............................................................... 39
5.2 Mexico ................................................................................................................................... 39
5.2.1 Introduction .................................................................................................................. 40
5.2.2 Cost Determination and Payment ................................................................................. 40
5.2.3 Water Subsidies ............................................................................................................ 41
5.3 Tanzania ................................................................................................................................ 42
5.3.1 Introduction .................................................................................................................. 42
5.3.2 Transforming Water in Tanzania ................................................................................... 42
5.3.3 Recovering Water Development Costs ......................................................................... 43
5.4 Turkey ................................................................................................................................... 44
5.4.1 Water and Irrigation Management in Turkey ............................................................... 44
5.4.2 Water Pricing in Turkey ................................................................................................. 44
5.5 Conclusion ............................................................................................................................. 45

Review of Pricing Strategies 2012 6 Observations and Conclusions ...................................................................................................... 47
6.1 Lessons from the International Review ................................................................................ 47
6.2 Country Specific Observations .............................................................................................. 47
6.2.1 Australian Water Management Principles .................................................................... 48
6.3 Observations on the South African Experience .................................................................... 48

Review of Pricing Strategies 2012
1 | P a g e
1 Introduction
1.1 Project Background and Context The Department of Water Affairs is embarking on a project that will review the pricing strategy, develop an infrastructure funding model and establish or strengthen an economic regulator for the water sector. The Raw Water Pricing Strategy sets out the government’s approach to pricing raw water. It provides, in principle, for full cost pricing for non‐agriculture water users, including depreciation and a return on assets (ROA). In practice, annual price increases have been capped and hence prices are below full cost for most agricultural water schemes and some schemes dedicated to industrial and domestic supply.
The Pricing and Economic Regulation Reforms (PERR) project is a strategic project that will enable DWA to have good policies on the pricing of water, cost reflective tariffs for the entire water value chain in South Africa with potential for the poor and a good funding framework for infrastructure development, operations and maintenance. The project has been listed under Outcome 6 as a priority and some of its elements fall within the Minister’s performance agreement.
The three main project work‐streams and respective outputs are the following:
• Pricing Strategy Review – a revised raw water pricing strategy
• Infrastructure Funding Models – a funding model for water resources infrastructure development and refurbishment.
• Economic Regulator – recommendation on the establishment of an economic regulator for the entire water value chain.
The project will therefore enhance the Department’s ability to manage water related infrastructure optimally, to price raw water appropriately and to ensure afair and reasonable assessment of tariffs and services standards throughout the water value chain.
In terms of the overall context, there are a number of significant developments in the water and related sectors that are of important in how this project is conceptualised. Some of these are highlighted briefly here, while others are raised specifically in relation to each of the three streams of the project.
• DWA is driving an institutional realignment project, which is looking at the optimal institutional arrangements in the water sector. The decisions arising from the institutional realignment project will have implications for the pricing strategy, the nature of the economic regulator, and the funding model. The decisions of particular importance will include the institutional arrangements in the short and medium term for the management of water resources infrastructure currently falling within the responsibility of DWA.
• The decision by the Minister to establish nine CMAs within the next two to three years will also have impacts on the pricing strategy, as the real costs of managing water resources will become more transparent and evident through this business operating model.
• There is a national debate on whether there should be one economic regulator for all infrastructure sectors, or whether each sector should have a separate economic regulator.
Review of Pricing Strategies 2012
• The Department of Co‐operative Government and Traditional Affairs is establishing a Municipal Infrastructure Support Agency which may have implications for funding models for municipal infrastructure in particular.
A further element that is important in contextualising the project is understanding the water value chain and positioning the various pieces of work within that value chain.
This document serves as international review of water pricing and management. The aim of this document is to survey the water resources policies and practises of other countries in order to draw out some relevant experiences and lessons. In addition to the international review, the document also reviews current water resources policies and practise in South Africa. The focus of the document is issues that relate to abstraction charges, while very little attention is given to waste discharge charges because the waste discharge project has already conducted a review of six countries focusing specifically on that aspect of water pricing. Two separate documents provide international reviews on water resources infrastructure funding models and economic regulation in the water sector.
1.2 Document Structure This document is structured in the following manner:
• Section 2 surveys the theory on public finance and water pricing, looking at the various tools available for use.
• Section 3 outlines some key water pricing principles
• Section 4 discusses South Africa’s approach to water pricing from an historic perspective
• Section 5 is a look at various international case studies that reflect the policies and practices of other countries around the world
• Section 6 concludes with observations of the South African water sector and those of other countries
Review of Pricing Strategies 2012
3 | P a g e
2 Public Finance, Pricing and Water
2.1 Water as a Public/Private Good (Resources) Most goods or service can be categorised as one of three types of products. It can be categorised as a public good/service, a quasi‐public good/service or it can be a private good/service. Public goods and services are collective in nature and private goods and services are particular in nature. Quasi‐public goods and services have both collective and particular characteristics.
Collective goods/services usually have externalities or spill‐overs. Externalities are positive or negative impacts on people not involved in either the provision or consumption of the good or service in question. Government spill‐overs are government initiated benefits or costs not limited to the jurisdiction area of the government concerned, and which result in benefits or costs in the jurisdiction of other governments or at other government levels (Gildenhuys, 1997: 194). These are the public goods/services. Particular goods/services have a value that can be allocated to each unit consumed. This value can then be translated into a price per unit which is determined according to the production and supply costs involved. What makes private goods different from public goods is that those who do not pay for private goods can be barred from consuming them and/or benefiting from their supply and consumption.
Water displays characteristics of all three types of goods at some or other level. At the very basic level of water supply and needs, water is a public good with benefits that cannot be limited to any one jurisdiction or individual. The use of water for basic needs like drinking, cleaning and sanitation has benefits that are collective in the main and should therefore be treated as a public good provided by government. Beyond this minimum level of water needs up to some yet undefined level of use, water is of a quasi‐collective nature with obvious externalities and obvious private benefits. At this level water is used for profitable activities that have a collective benefit for the nation. Water use beyond this level is purely particular in nature. Setting water prices should therefore take into consideration the type of use and quantities used by users or consumers. The fact that water can be viewed as all three types of goods makes it possible to fund water from tax, user charges and consumer tariffs. Each of these concepts will be unpacked further in the next section.
2.2 Public Finance and Pricing Theory
2.2.1 Taxation In modern communities it is generally accepted that governments have to collect taxes in order to pay for the collective services to be rendered to the public (Gildenhuys, 1997: 211). Tax can, amongst other functions, be used to redistribute wealth within the economy by charging certain groups within the economy a higher tax rate than others while providing the same level of service to all (Gildenhuys, 1997: 218). The function of tax that we are most interested in is its ability to create stability within the economy (Gildenhuys, 1997: 219). Tax funding can be used to subsidise the development of water infrastructure and the provision of water services because water is of strategic importance to the nation and the availability of good quality water has benefits for both users and non‐users.
Review of Pricing Strategies 2012 Tax within the water sector is most interesting when it is used as an incentive and/or disincentive to water users in order to alter their water use patterns. The two areas in which tax would attempt to influence the water sector are pollution and efficiency. Tax charges (disincentives) for people who pollute water sources can potentially reduce the pollution levels in the water. The widely accepted Polluter Pays Principle is one such example of a tax disincentive for polluters. This makes it possible to use tax to correct the market failures that result from non‐market related pricing. The type of tax used in the water sector used to influence behaviour is levied specifically of water use. It is not a tax on the general public.
2.2.2 Tariffs Consumer tariffs are comparable to prices of goods traded in the private sector. They are established according to the cost of supplying a quantifiable unit of a good or service which has a cost that can be directly determined or quantified (Gildenhuys, 1997: 366). Tariffs should be used in the case of particular goods or services (provided by government) which are exclusive so those who do not pay for them can be excluded from their consumption (Gildenhuys, 1997: 362). Unlike quasi‐collective and collective goods and services, particular goods and services must be financially self‐supporting, therefore tariffs charged per unit consumed and collected directly from the consumers must be enough to pay for the full cost of supplying such particular services.
Consumer tariffs should have no redistribution of wealth function and they should not be used as economic regulation tools. They are paid for public goods which are completely exhaustible and must be continually replenished by new stock as consumption continues. As a matter of necessity (due to the exhaustible nature of the goods and services for which they are set) they must channel the demand for particular public services to those consumers for whom the service offers the greatest value (Gildenhuys, 1997: 367) – of course the definition of value is somewhat contestable if not clearly defined from the onset. Any water use above a pre‐determined bare minimum should be considered as a particular good and therefore have a per unit tariff set for it such that all the costs incurred in delivering the additional amount of water is fully paid for by the consumer. This would be in line with the now widely accepted User Pays Principle which forms the cornerstone of European agricultural water policy.
2.2.3 User Charges Though user charges and consumer tariffs have some key things in common i) their payment is voluntary because the purchase and use of the goods for which they are charged is voluntary, ii) they are both based on the benefits‐received principles – the user charge or the tariff which has to be paid is based on the direct benefit of the service to the user or consumer, and iii) the user charge or consumer tariff is established according to the cost of delivering the service. They have one important difference.
User charges are levied to recover additional operational (direct) costs incurred on behalf of a specific user of a service – to be used in the case of quasi‐collective services to pay for the extra operational costs incurred for the delivery of the service to the user who requests the service. Quasi‐collective services are the only objects of user charges because user charges are not used to cover the full cost of the service including fixed costs and institutions that provide the services. Services that have user charges are generally partially financed from tax because they have positive or negative externalities, but they also have a particular element because people use them voluntarily
Review of Pricing Strategies 2012 on an individual basis and derive some individual benefit from their use, hence the user charge. The collective element of quasi‐collective services justifies the financing of the fixed cost (capital plus maintenance costs) of making such services available from tax – these are costs pertaining to creating the infrastructure for rendering the services.
There has been a move to charging and collecting revenue from water users to at least partially cover the costs of developing and/or managing water resources. Provided the impacts on vulnerable communities are taken into account, this can provide vital resources for water management (Quesne, Pegram and Von Der Heyden, 2007: 21). The main purpose of user charges is to relieve taxpayers of a tax burden confers more benefits on some user than it does others, and to spread the burden more equitably. Without a user charge no government would be able to determine whether a real demand for a specific service existed and where it is concentrated.
2.2.4 Nominal Fees/Charges Nominal charges can be like user charges and be used only to recover additional operational (direct) costs incurred on behalf of a specific user of a service based on the benefit‐received principle. Nominal charges don’t always cover the full unit cost of delivering that unit of service or good to the user, though they can. Nominal charges are set to compensate governments for the costs of special services rendered on request to identifiable individuals: these services can include special paper work, special deliveries of additional water etc. The difference between nominal levies on one hand and tariffs and user charges on the other is the fact that the services for which nominal levies are charged are not continuous services offered for sale on a regular basis, they are delivered sporadically on the request of individuals (Gildenhuys, 1997: 383).
2.2.5 Subsidies
2.2.5.1 Defining Subsidies Multiple definitions of subsidies are in use. This is primarily because the nature, form, context and purposes of giving subsidies—and economic and policy goals aimed to be achieved by giving subsidies—have differed across countries.
Subsidies can take the on various forms:
• budgetary payments,
• support involving tax expenditures (various tax provisions that reduce the tax burden of particular groups, producers or products),
• market price support,
• subsidised input prices,
• preferential interest rates,
• foregone tax revenues,
• foregone resource rents (Malik, 2008: 5), or
• cross‐subsidisation among consumers.
Subsidies comprise all measures that keep consumer prices at a level below that which reflects the true opportunity cost that would prevail in competitive markets if all external costs and benefits were internalised. Subsidies also include all measures that keep producers’ prices above true opportunity costs in competitive markets.

Review of Pricing Strategies 2012 Externalities enter into the market on equal terms with other traded goods and services when they are internalised and assigned a price. The value of these externalities can then be brought into the system by making those who are benefitting compensate the providers of the public good or service or by ensuring that those who have costs imposed on them are compensated. This compensation can take the form of a government subsidy.
All measures that keep producers’ prices above true opportunity costs in competitive markets if all external costs and benefits were internalised, or that reduce costs for consumers and producers by giving direct and indirect support (Malik, 2008: 6) are subsidies.
The World Trade Organisation (WTO) Agreement on Subsidies and Countervailing Measures provides a definition of the term “subsidy” that contains three basic elements:
• a financial contribution;
• made by a government or any public body within the territory of a Member; and
• which confers a benefit;
All three of these elements must be satisfied in order for a subsidy to exist (Malik, 2008: 6).
The WTO prohibits subsidies that require recipients to meet certain export targets, or to use domestic goods instead of imported goods. They are prohibited because they are specifically designed to distort international trade, and are therefore likely to hurt other countries’ trade (www.wto.org, 28/06/2011). By this definition most water subsidies would probably be allowed without any restriction by the WTO. The significance of this is that countries can therefore use agricultural water pricing as a tool to support the development of their agricultural industries without in any way violating any international trade restrictions.
2.2.5.2 Subsidies and Water The nature, form and objectives of providing water subsidies differ across water‐using sectors within a country and across countries. In developing countries, for example, irrigation subsidies are for things such as rural development, encouraging technological adoption by resource‐poor farmers, achieving greater food production, poverty alleviation, employment generation, social equity concerns etc. In developed countries the objective of giving water subsidies is often simply to increase farm incomes, and to give their products a (some might argue unfair) competitive edge on the international market and thereby increase agricultural exports. In cases like these, water subsidies can distort decisions about what to produce, and can artificially increase the volume of output (Calatrava and Garrido, 2010: 9), thereby adversely affecting international trade. There is an underlying market failure that water subsidies attempt to address in almost every case, however, in each of those cases there are also political undertones to the subsidisation which make the market failures difficult to define.
2.2.5.3 Justified Subsidisation Subsidies are not always market distorting. They can be a useful tool for correcting market failure. When the market is unable to provide certain goods and services for which there is demand, this is considered to be market failure. Sometimes market failures occur when the provision of certain goods and services has a negative impact on people not involved in either the provision or consumption of that good or service. In some cases, subsidies correct not so obvious market failures.
Review of Pricing Strategies 2012 For example, where there is poverty and inequality, targeted subsidies can ensure that the market operates more efficiently than it would without them. Though the market might appear to be operating as it should, it is usually operating at a lower than attainable Pareto efficiency level. Using subsidies can lead to the realisation of a higher Pareto efficiency.
When the provision of a good or service exhibits positive externalities, there exists the likelihood that it will not be provided by the market. Positive externalities are indirect benefits (usually accruing to society) that arise from producing or consuming a good or service. The provision of public goods and services can be expensive and because their benefits are indivisible third parties will benefit from them regardless of whether they pay for them or not. Subsidising the provision of essential public goods and services is, to some extent, justifiable because of their indivisibility quality.
Negative externalities are indirect costs (usually accruing to society) that arise from the production or consumption of certain goods and services. In some cases the provision of goods and service with negative externalities is necessary because the overall benefits outweigh the negative impacts. When this is the case, granting subsidies to mitigate the impact of the negative externalities on the section of society that is ‘unjustifiably’ burdened by the costs of these goods and services is justifiable because of the need to ensure fairness and/or equity in society.
Market failure can also occur as a result of an uneven distribution of wealth and income within a society. If a small group within the economy holds a majority of the wealth then they are more likely to drive prices to levels above those that would occur in a competitive market. When this occurs, it is justifiable to subsidise those members of society who cannot afford to pay for publicly desirable goods and services. This generally leads to the achievement of a more desirable equilibrium within the economy.
Some level of subsidisation is therefore justifiable and will tend to lead to more efficient outcomes where there are externalities – positive and negative – and inequality within society which lead to market failure. Water is a resource that displays externalities at a number of different levels. The use of water for various reasons displays externalities, the construction of dams for the storage of water to avert shortages displays externalities, as does the treatment of water to ensure the quality remains of a consumable and environmentally acceptable level. It would therefore not be inconceivable for government to subsidise some water services.
2.2.6 Water Markets as Pricing Mechanisms Water markets are a water allocation mechanism. The shift to water markets is a move away from the top down government led approach to water allocation. It is a shift that has gone hand‐in‐hand with a move to full cost recovery and the devolution of water management to local levels in many parts of the world. There are a number of types of water markets; open water markets, spot markets, administrative water trading and informal water markets.
Full water markets exist where water rights can be traded on a free market, largely with minimal administrative control and interference. Such an approach most closely approximates the sale of other goods and services in a market economy, for example land. Full, open water markets can be most easily introduced where water rights are privately held and traded (Quesne et al, 2008: 16). Spot water markets are temporary exchanges of water, whereby the holder of the water right
Review of Pricing Strategies 2012 retains the right but trades the usage of the water on a temporary basis. Where open water markets fail, or lead to socially or environmentally unacceptable consequences, regulation of water markets can be introduced. Informal water markets exist even where these are not sanctioned by official national policy or law. Semi‐formal water markets also often exist (Quesne et al, 2008: 16).
The challenge with water markets lies in the identification of mitigation strategies for the potentially damaging impacts of trade while unlocking the very considerable economic and environmental benefits that are on offer. In general, the benefits can be categorised as efficiency gains and the disadvantages relate to the unequal distribution of benefits and costs resulting from water markets as the poor tend to get the short end of the deal where active water markets exist. The lesson is that where there are water markets, they need to be regulated to ensure that the benefits are evenly distributed and that the costs accrue to the people that should be paying for them. There is a level of water use, above the basic and constitutionally guaranteed needs of every individual, which can be traded in water markets, but this must be accompanied by some form of water banking.
2.2.7 Water Banking A water bank is an institution that offers to buy and sell water under some set of rules regarding prices and quantities. It provides an institutional intermediary between buyers and sellers in the water market, thereby lowering transaction costs and water losses, and encouraging market activity. It typically acquires a ‘stock’ of available water entitlements, which are available for purchase. In essence, a water bank can be viewed as a virtual reservoir, absorbing the surplus water from users who may withdraw water when the need arises. Equally important, a water bank can regulate undesirable social and environmental impacts. From an environmental perspective, water banking is attractive as it can allow for water to be set aside to ensure ecological flows as part of the trading process. The volume allocated to a water use entitlement can be reduced to compensate for losses, environmental effects, return flow etc. An important feature that makes the successful operation of a water bank possible is clearly defined and secure water rights, and strong water resource management institutions that can monitor water use and enforce the water rights system (Quesne et al, 2008: 20). Water user associations can act as facilitators or water banks at low cost.
2.3 Financing water Water users’ payments for water can take on one of two forms, water charges and/ or water prices. Water charges are generally set by a water authority that has been put in place by legislation to administer water provision and water quality. Water charges are usually set as a function of the costs of supplying and distributing the water. It is not always the case that the water charges will cover the full cost of water provision and distribution, but that is the base off which they are determined. Water prices on the other hand are determined in the market for water. They reflect the economic value that users attach to water. They tend to be higher than the cost of water provision as they include a profit margin.
2.3.1 Water Cost Components Quite often, the cost of making water available has been equated with the supply costs, which are basically the financial costs associated with the provision of water. These financial costs in turn have been equated with either the sum of the capital and O&M costs or just the O&M costs (Malik, 2008: 14). These costs have been estimated so as to form some basis of determining water charges. Once these costs are estimated charges are set that allow authorities to recover the costs of water
Review of Pricing Strategies 2012 provision. Some opt for full cost recovery, others for partial cost recovery of some form or another (essentially extending subsidies to water users).
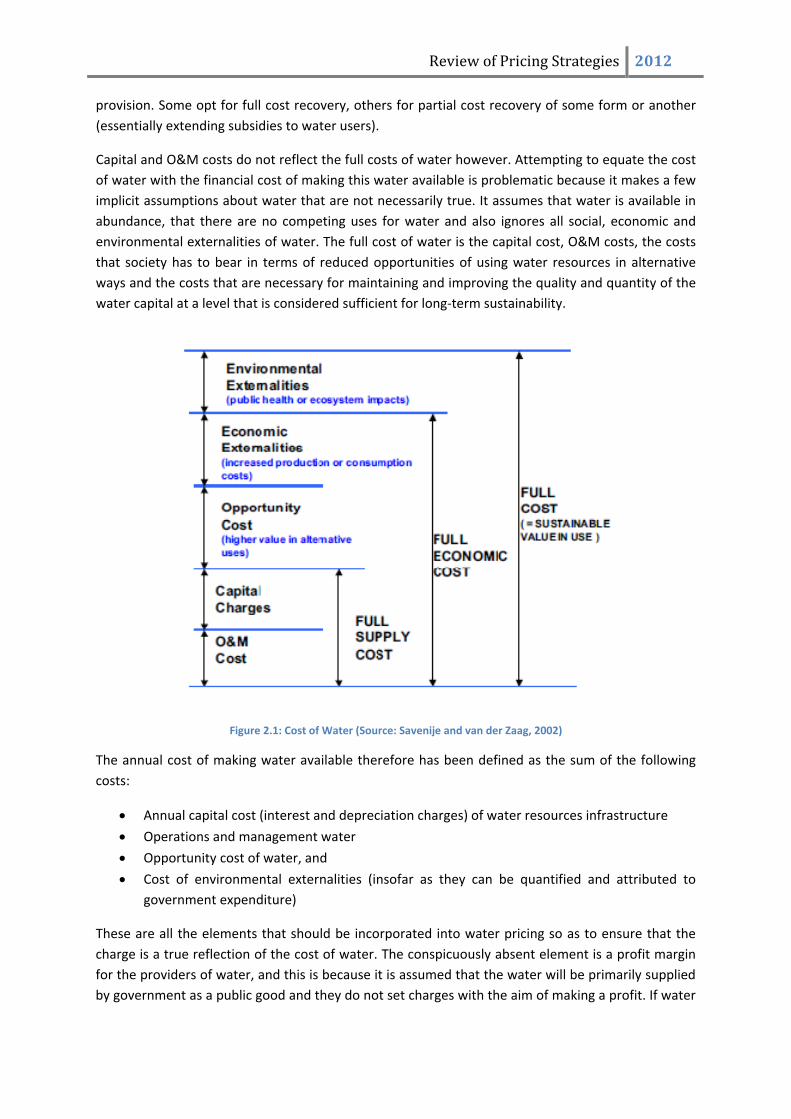
Capital and O&M costs do not reflect the full costs of water however. Attempting to equate the cost of water with the financial cost of making this water available is problematic because it makes a few implicit assumptions about water that are not necessarily true. It assumes that water is available in abundance, that there are no competing uses for water and also ignores all social, economic and environmental externalities of water. The full cost of water is the capital cost, O&M costs, the costs that society has to bear in terms of reduced opportunities of using water resources in alternative ways and the costs that are necessary for maintaining and improving the quality and quantity of the water capital at a level that is considered sufficient for long‐term sustainability.
Figure 2.1: Cost of Water (Source: Savenije and van der Zaag, 2002)
The annual cost of making water available therefore has been defined as the sum of the following costs:
• Annual capital cost (interest and depreciation charges) of water resources infrastructure
• Operations and management water
• Opportunity cost of water, and
• Cost of environmental externalities (insofar as they can be quantified and attributed to government expenditure)
These are all the elements that should be incorporated into water pricing so as to ensure that the charge is a true reflection of the cost of water. The conspicuously absent element is a profit margin for the providers of water, and this is because it is assumed that the water will be primarily supplied by government as a public good and they do not set charges with the aim of making a profit. If water
Review of Pricing Strategies 2012 was sold in the market by private providers there would be a profit margin incorporated into the price of water. Determining the exact magnitude of each of these elements is a rather daunting task. However, knowing the full cost of water services would bring (among other things) greater transparency in terms of impacts on the environment, the sustainability of water resources infrastructure, costs to deliver the service and who should pay (Malik, 2008: 19).
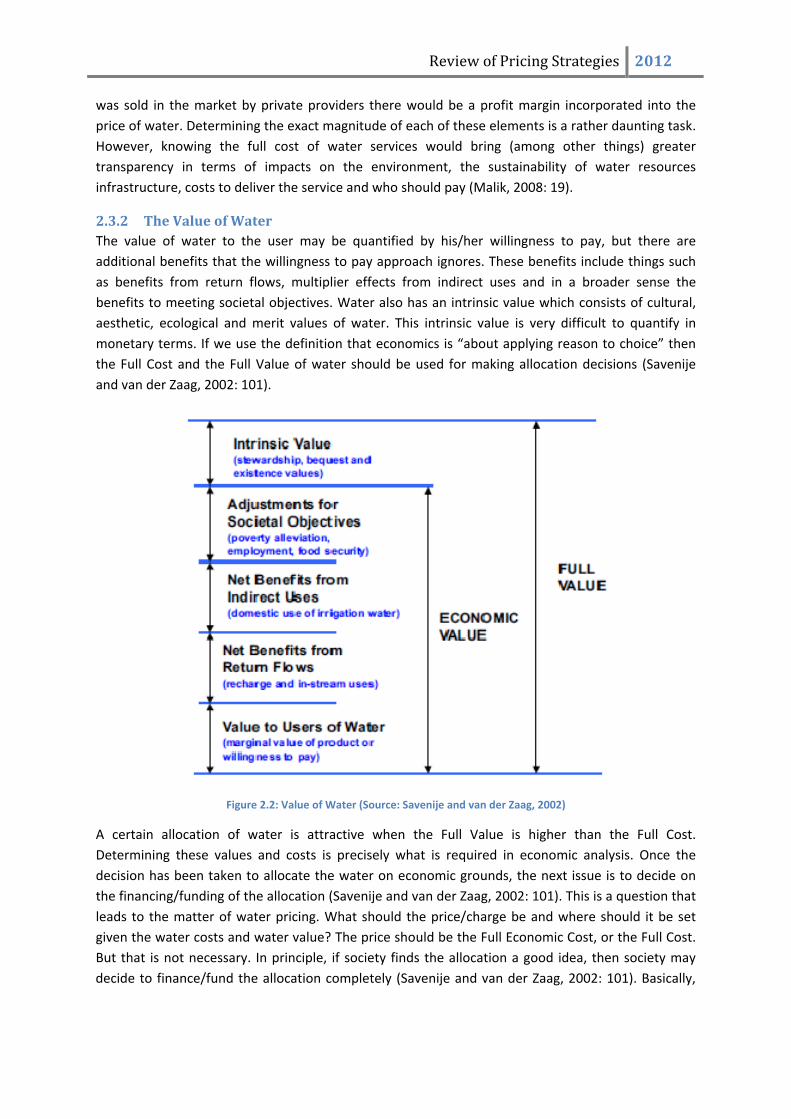
2.3.2 The Value of Water The value of water to the user may be quantified by his/her willingness to pay, but there are additional benefits that the willingness to pay approach ignores. These benefits include things such as benefits from return flows, multiplier effects from indirect uses and in a broader sense the benefits to meeting societal objectives. Water also has an intrinsic value which consists of cultural, aesthetic, ecological and merit values of water. This intrinsic value is very difficult to quantify in monetary terms. If we use the definition that economics is “about applying reason to choice” then the Full Cost and the Full Value of water should be used for making allocation decisions (Savenije and van der Zaag, 2002: 101).
Figure 2.2: Value of Water (Source: Savenije and van der Zaag, 2002)
A certain allocation of water is attractive when the Full Value is higher than the Full Cost. Determining these values and costs is precisely what is required in economic analysis. Once the decision has been taken to allocate the water on economic grounds, the next issue is to decide on the financing/funding of the allocation (Savenije and van der Zaag, 2002: 101). This is a question that leads to the matter of water pricing. What should the price/charge be and where should it be set given the water costs and water value? The price should be the Full Economic Cost, or the Full Cost. But that is not necessary. In principle, if society finds the allocation a good idea, then society may decide to finance/fund the allocation completely (Savenije and van der Zaag, 2002: 101). Basically,

Review of Pricing Strategies 2012 the decision about how to allocate water resources on economic grounds should be conceptually separated from the decision about how this allocation should be financed/ funded.
Review of Pricing Strategies 2012
12 | P a g e
3 Water Pricing Principles This section outlines a number of principles that guide water pricing. These principles are set out here as a first draft, and will be further refined as the project advances. The principles operate at a number of levels, from the high level constitutional principles through to the level of operational principles.
It is worth noting that, in some cases, two or more principles may be in conflict, in which case it must be determined which principle takes precedence. For example, meeting social equity requirements might be in conflict with achieving efficient use of water, possibly for a limited period. This will require a differential application of the principles and a ranking, which has not been attempted in the following list. The ranking will be developed as the project progresses and in consultation with the client.
3.1 Constitutional principles There are two critical constitutional principles that water pricing, the right of access to sufficient water and the right to an environment that is not harmful to health or well‐being.
3.2 Overarching Principles of the Pricing Strategy
3.2.1 Policy /strategic principles At the level of policy and strategy, there are a number of principles that form an overarching framework for the pricing, funding and economic regulation of water:
• The objective of managing the quality, quality and reliability of the nation’s water resources is to achieve optimum, long term, environmentally sustainable social and economic benefit for society from their use
• It is the responsibility of government to ensure that water is treated as a common good and not as a commodity for profit.
• Water has a social and an economic value • A custodian of the nation’s water shall ensure that the development, apportionment,
management and use of those resources is carried out using the criteria of public interest, sustainability, and efficiency of use in a manner which reflects its public trust obligations and the value of water to society while ensuring that equity, basic domestic needs, the requirement of the environment and international obligations are met.
• Equity, like justice and social cohesion, is a value, an end in itself and is therefore its own justification. On the other hand, economic growth, like development and transformation, is a means to constitutionally defined ends. Means and ends shall not be conflated.
3.2.2 Operational principles ‐ Social equity: The Pricing Strategy for water use charges coupled to the granting of financial
assistance will contribute to social equity and redress of the imbalances of the past, both with respect to equitable access to water supply services and direct access to raw water.
‐ Financial sustainability: In order to ensure financial sustainability adequate revenue must be generated to fund the annual cost related to: the management of the country's waterresources; the operations, maintenance and refurbishment of existing Government
Review of Pricing Strategies 2012
water schemes; the development of augmentation schemes.The full financial cost of water resource management and supplying water should be recovered from water users, including the cost of capital. Water must be priced at levels consistent with efficient and effective delivery of services. This approach may be phased in by taking account of constraints of various sectors to adapt quickly to price increases.
‐ Targeted subsidies: the pricing of water may include target subsidies which will be transparent and put in place to serve specific national objectives such as redress, equity and poverty eradication;
‐ Economic efficiency: In the context of water scarcity, ensuring an efficient allocation of scarce water resources requires that the price of water is set to reflect its scarcity value, to ensure firstly that water is conserved and secondly that some water used for low‐value purposes is redirected to alternative high value purposes. This can be done administratively or by using market related mechanisms. It is also critical to ensure that the water resource management systems implemented are cost effective and do not become an unnecessary financial burden on water users.
‐ Ecological sustainability: In terms of Chapter 3 of the NWA, the water needs for the effective functioning of aquatic ecosystems must be protected. The water required for the ecological reserve must be safeguarded and the cost of managing the Reserve must be paid for by all registered and billable users in terms of Section 56(2) (a) (iv) of the NWA.
‐ The polluter pays principle for waste discharge. Water quality management options shall include the use of economic incentives and penalties to reduce pollution;
Review of Pricing Strategies 2012
14 | P a g e
4 South African Approach to Water Pricing
4.1 Evolution of Water Management in South Africa South Africa’s per capita water availability is amongst the lowest in the world, and is considered to be a low rainfall area by international standards, with average rainfall that is only 60% of the world average. Only 9% of rainfall enters the rivers in South Africa. This is one of the lowest ratios of Mean Annual Precipitation (MAP) to Mean Annual Run‐off (MAR) in the world. The global average is 31% (DWAF, 1996). There is generally higher rainfall in the northern and eastern parts of the country than there is in the western parts of the country. Rainfall is highly seasonal, which is exacerbated by high inter‐annual variability and frequent droughts. This is the reason for the water scarcity, with high levels of spatial and temporal variability in river levels, dam storage and groundwater levels.
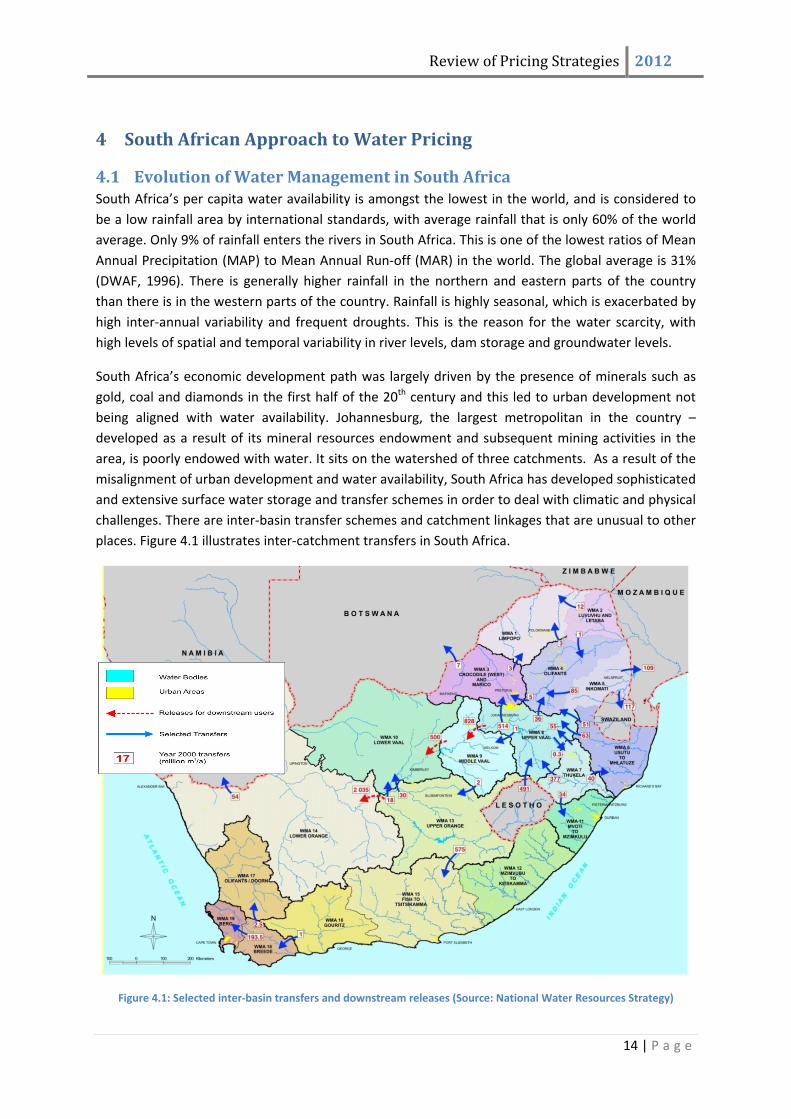
South Africa’s economic development path was largely driven by the presence of minerals such as gold, coal and diamonds in the first half of the 20th century and this led to urban development not being aligned with water availability. Johannesburg, the largest metropolitan in the country – developed as a result of its mineral resources endowment and subsequent mining activities in the area, is poorly endowed with water. It sits on the watershed of three catchments. As a result of the misalignment of urban development and water availability, South Africa has developed sophisticated and extensive surface water storage and transfer schemes in order to deal with climatic and physical challenges. There are inter‐basin transfer schemes and catchment linkages that are unusual to other places. Figure 4.1 illustrates inter‐catchment transfers in South Africa.
Figure 4.1: Selected inter‐basin transfers and downstream releases (Source: National Water Resources Strategy)
Review of Pricing Strategies 2012 The period between 1970 and 1990 was one in which an improved scientific understanding of the increasing water quality challenges resulting from agricultural, industrial and mining discharges facing the country was developed. Although it was already established by the 1970 commission of enquiry that the lack of integrated planning would have potentially negative impacts on water resources, it was only from 1980 that it was comprehended what the environmental impacts of unchecked agricultural and industrial development would be. Once this happened, South Africa began to develop the management regimes needed to mitigate and address these impacts.
In addition to developing a scientific understanding of the water quality challenges, significant strides were made in understanding the aquatic ecosystems and their habits, water quality and flow requirements. The combination of increasing stress on water resources as a result of discharges and better understanding of the science of water helped highlight the need for a more integrated approach to serious and complex water resource problems. It was during this period that the concept of a National Water Management Strategy and comprehensive water pricing was first introduced.
South Africa now has a high degree of water security relative to its water availability as a result of the engineering solutions that have been implemented. There is a well‐developed system of macro level (e.g. major dams), meso level (e.g. municipal and farm dams) and micro level (e.g. boreholes, small‐scale irrigation scheme) infrastructure which are critical in ensuring water security in South Africa. The challenge is that the country is now on the brink of full utilisation of its water yields and there are few cost effective and physically appropriate sites to build additional storage facilities. Continued industrial development and urbanisation have increased the ecological and water quality challenges. In addition to the increasing demand for an already limited supply of water, climate change threatens to further stress the levels of available water in the country as a result of changing rainfall patterns that are leading to more draughts. As a result, basin planning has to be a balance between planning for highly interconnected systems, managing increasing stress and complexity within basin and making water available for transformation purposes.
4.1.1 Integrated Water Resource Management The 1990s saw a fundamental shift in the water resources management paradigm for the region, reflecting the significant political changes around 1994 and the introduction of the first democratic government. Sweeping political change within South Africa created the opportunity to re‐write policy and legislation, based upon the latest thinking and understanding of how resources need to be sustainably managed. The development of the 1997 “white paper” policy statement on the management of the national water resource, and the promulgation of the 1998 National Water Act set a trend for the entire region in terms of policy and legal frameworks for water resources management.
At a planning level, the highly inter‐connected nature of basins within South Africa required the establishment of a National Water Resources Strategy (NWRS) by the Minister of Water Affairs, which indicates the available water for allocation in each of the 19 water management areas, and the levels of environmental protection required.
At the same time, a decentralised approach to water resources management was introduced, with Catchment Management Agencies (CMAs) to be established at a basin or sub‐basin level, with the responsibility, inter alia, to develop and implement a stakeholder consulted catchment management

Review of Pricing Strategies 2012 strategy (CMS) that is consistent with the framework provided by the NWRS. The understanding is that these strategies will have both technical water resources dimensions (such as infrastructure, allocation and/or water quality plans) and institutional enabling dimensions (institutional, stakeholder and information plans). Furthermore the CMS must align with the range of water, development and economic strategies and plans developed at a national, provincial and local government level.
While the first NWRS was promulgated in 2004, only two CMAs were established and neither had developed a complete CMS at the time. In the absence of these CMSs, and in order to plan coherently for future water resources management challenges, the Department of Water Affairs developed relatively technical (but integrated) water resources strategies (named Internal Strategic Perspectives) for all river basins in South Africa. While these were compiled without stakeholder consultation or much engagement with other government departments, they represented a first attempt to bring all available information about water resources together in one document.
The South African water resources planning framework is based on the international recognition of integrated water resource management (IWRM) as the underlying management paradigm. However, the challenges of implementation are significant, particularly in the context of limited human and financial resources. Institutional capacity has been a major limiting factor to the ability to deliver, while ensuring that there were sufficient financial resources to support the planning and implementation was also difficult.
These recent developments were based on the recognition that integrated planning within the sector was needed to ensure that water resources could be protected, utilised, developed, controlled, managed, and conserved. However, the complexity of integrated planning and the capacity needed to implement the results have outstripped the ability of the country to deliver. Hence, with the promise of new policy and legislation came the hard reality of how long it takes to fundamentally shift approaches to water resources management and to succeed in implementing a profoundly new approach.
4.1.2 Infrastructure Development From the early 1900’s until the 1980’s water management was mainly focused on supporting selected rural development, food security and political agendas in South Africa. As a result, water management was in place to support the development of irrigation schemes during the early years. Water policy development during this period was moulded by irrigated agriculture, which also influenced infrastructural, economic and social development. This was a period of unchecked water resource development. The development of large‐scale water resources infrastructure and inter‐basin transfers made the development of large irrigation schemes possible during this period. The trouble was that the planning process reflected the dominant and economic imperatives of the day and public participation was limited. The projects undertaken often had significant design changes because some of the planning stages were done too rapidly and political considerations influenced some decisions.
In the latter years, the industrial and mining sectors of the national economy grew significantly and came to dominate water policy and infrastructure development. This shift has taken place gradually over the past half century. Due to the fact that the mining industry was developing in areas where there were no water sources, there was a need to create a complex system of inter‐basin transfers

Review of Pricing Strategies 2012 and dams to support the development centres of the economy. This was further complicated by the fact that Johannesburg (the fastest developing and biggest economic hub in the country) was outgrowing its water supplies.
4.1.3 Water for Growth and Development Some of the critical challenges facing South Africa include the need for increased economic growth, redistribution of wealth, and the eradication of poverty. As a water scarce country, this begs the question of how best the scarce water resources can be used to support economic growth and social development. As the World Water Development Report 3 notes, the vast majority of development planning takes place outside of the water arena, and water managers and planners are caught trying to provide and support this development in a meaningful and sustainable way. The South African government chose to approach this matter in a proactive manner, directly aligning water planning with economic planning initiatives.
The Department of Water Affairs therefore developed a draft Water for Growth and Development Strategy in order to provoke the discussion as to how South Africa can align its water resources with economic growth and social development needs. This need is underlined by concerns around how best to balance water, energy and food security as the country moves forward.
4.2 Evolution of Water Pricing in South Africa
4.2.1 Government Water Schemes Before 1970 Early Government water schemes in the RSA were built mainly to encourage development under unfavourable conditions and often took the form of large irrigation schemes that served as welfare settlements. These schemes were generally financed by the State and there was no attempt to recover any significant portion of the cost from occupants through water rates. The undetermined direct and indirect benefits the schemes were expected to yield to the nation were regarded as sufficient justification for financing the schemes from State funds. Many schemes were built during these years – this was the well‐known golden era of dam construction.
Due to the fact that water schemes were not always built under efficient economic imperatives, a number of things were not done particularly well. The political motivations behind the dams and schemes that were built during this era were built even though there was some poor planning around their construction. During this period there was limited hydrological information. Due to limited hydrological information on run‐off and yields, a number of dams were built larger than required. Scheduled areas with high quotas were allocated that were not sustained in later years. Many of these schemes can hardly irrigate more than 60% of the allocated water use rights sustainably every year. The Karoo schemes are notable examples.
4.2.2 Commission of Enquiry in Water Matters The recommendations of the Commission of Enquiry into Water Matters were accepted by the Government as policy in 1970. The first significant formal directives on tariffs arose from Recommendation 38 of the commission of enquiry. This recommendation was on agricultural schemes and it read as follows:
Review of Pricing Strategies 2012
• That water rates on new irrigation schemes cover the full running costs as well as a percentage of the interest and redemption costs, bearing in mind the share of capital costs, of the scheme recoverable through raised land prices;
• That in so far as consistent with socio‐economic conditions, the water rates on existing Government irrigation schemes be gradually raised to cover at least the operating costs;
• That water rates for each irrigation scheme be determined by the Department of Water Affairs after investigation by and consultation with the Department of Agricultural Economics and Marketing;
After the commission of enquiry, increasing emphasis was placed on identifying and recovering the actual costs of supplying each user or user group. Although tariff policies concerning water for industrial, domestic and agricultural use have evolved over decades, the first significant formal directives on tariffs arose from this Recommendation 38.
4.2.3 Pricing Strategy of Raw Water Use: The early Years The 1970 recommendations were found to be sound but in need of refinement, especially where they applied to the agricultural sector. As a result a reinvestigation of tariffs, rates and subsidies was conducted, which led to the adoption of the White Paper WP N‐’84 of 1984. The White Paper contained some guidelines for water costing, pricing and payment. Some important recommendations came from the White Paper.
Cost Recovery It was pointed out that the recovery of the full costs of a scheme from its users ignored the advantages which devolved upon other beneficiaries as a result of the development of infrastructure by the State. The result was that the principle of recovering the full cost did not form the only basis for determining tariffs. However, water from government water schemes was supplied at scheme‐related tariffs, the redeemable costs of each independent scheme being borne by its own consumers. Where scheme level tariffs were too low, existing tariffs would be increased annually in increments that would make it possible for them to reach the predetermined tariff within a reasonable period. The recovery of at least the annual operating costs was a prime objective.
Each White Paper on the establishment of a Government water scheme tabled in Parliament in terms of section 58 of the Water Act, 1956, would show how the capital cost of the project is divided between services to the various consumer sectors and what the expected socio‐economic benefits are. It would identify any portion of the capital cost that will not be redeemed. Capital costs assigned to objectives such as flood protection, recreational use and the generation of socio‐economic benefits would be deducted from the total cost to obtain a divisible capital sum on which to base water supply tariffs.
4.2.4 Water Pricing Between 1995 and 1999 Negotiations were concluded in 1995 on a strategy for tariffs to be imposed on state schemes. This strategy was based on the following principles:
• Full recovery of operation and maintenance (O&M) plus catchment management costs, plus
• A surcharge on the above costs to counter under‐recovery during droughts, plus
• An agreed upon amount to cover future replacement, betterment and drainage works costs.

Review of Pricing Strategies 2012 Prior to the construction of any betterment or drainage works, negotiations regarding the repayment would have to be carried out on an ad hoc basis with the respective Advisory Committee or Irrigation Board.
To give impetus to implementation of the strategy, it was further agreed that tariff increases would be gradually and uniformly effected from 1996/97 onwards on the following basis:
• The full recovery of annual operating, maintenance and current drainage/betterment costs, plus a 10% surcharge had to be reached within 5 years at each scheme, i.e. by the end of the 2000/2001 financial year.
• The following catchment management costs would be added to O&M costs: abstraction and storage control, afforestation permit control, the Working for Water Programme (subsidised by 90% as a result of subsequent representations to the Minister) and water weeds control.
• Increases for 1996/97 would be based on one‐fifth (20%) of the difference between the estimated 1996/97 costs plus 10% and the 1995/96 tariffs. For the following four years, the increases would be based on one‐fourth, one‐third, half and full recovery of the corresponding differences between costs and tariffs as recalculated annually.
• On schemes where the current tariffs already exceeded the following year’s costs plus 10%, tariffs would remain at the current level.
• A maximum annual increase of 50% on the current tariffs would apply.
• Tariffs would also not be decreased in any year
The determination of tariffs follows more or less these agreements with the exceptions that the catchment management costs were not added to O&M costs. This was only recovered with the introduction of the catchment management charge in 2002.
4.2.5 Implementing the Pricing Strategy: 1999 – 2007 With regards to the actual implementation of the pricing strategy so as to ensure that the guiding objectives are achieved, some guidelines on how water prices would be determined were developed. It was agreed that tariff increases would be gradually and uniformly effected according to the previous agreement.
Total existing tariffs would be increased gradually to reach full recovery of the SAAU negotiated costs (envisaged by March 2001). The maximum annual increase of existing tariffs will be limited to 50% of the previous tariff during this period. Tariffs would also not be decreased in any year.
It was intended that all management, operating, maintenance and current refurbishment costs, together with certain water resource management costs plus a 10% surcharge, would be recovered in respect of existing Government schemes by March 2001, by gradually phasing out the subsidy over a five year period. This policy has been adhered to, but only a few users have been able to achieve the goal of full cost recovery.
From April 2001, a depreciation component of water resource development costs was added to the charge. The depreciation component was to replace the obligation to pay for the future replacement, betterment and drainage costs in terms of the former agreement.
Review of Pricing Strategies 2012 The water resource management charge was introduced in April 2002. The aim was to reach full recovery of water resource management costs using a phased approach. The catchment management activity costs relating to water conservation (invasive plant and water weed control) and water utilisation (storage, abstraction and afforestation permit control), plus a 10% surcharge (to account for under‐recovery of costs during drought years), would be phased in.
The agreement reached in 1995 made provision for the allocated costs for the Working for Water Programme (water conservation) to be subsidised by 90% due to the fact that this activity would only increase the assurance of supply to this sector and would not make additional allocations possible. Only approximately 15% to 20% of the Working for Water funding was derived from the trading account and allocated to be recovered from charges. The balance was obtained from poverty relief funds and not subjected to recovery from water user charges.The way the charges were set up later were such that only users who benefitted from the project were charged the unsubsidized portion of the project and those costs were determined on a project by project basis in consultation with the users involved. The Working for Water project has been moved to the Department of Environmental Affairs.
4.2.6 Implementing the Pricing Strategy: 2007 to Date
Phasing in Charges A revised Pricing Strategy was established in 2007. This strategy had itself set certain guidelines on how prices were to be set on water. The 2007 strategy was developed because the 1999 strategy did not quite achieve the goal of full cost recovery in five years. According to this strategy the charges for commercial agriculture water users from government schemes were to be phased in as follows:
• Full Operation and Maintenance costs were be recovered annually, with an annual increase limited to 50%
• Depreciation charges for existing schemes will be capped at 1.5 cents per m3 plus Producer Price Index (PPI – rate) with 2007/08 as the base year, with annual increase limited to 20% of the previous year’s charge
• Full financial cost recovery (including ROA) for new schemes
There haven’t really been any new schemes built for agricultural use in South Africa. There are schemes that agriculture benefits from that have been built, but they were not built primarily to benefit agriculture. As a result, the ROA cost has not been applied yet for agriculture.
Domestic and industrial water users pay O&M, depreciation and ROA as set out in the pricing strategy and in most areas, full cost recovery has been reached for these two groups of users. The only exceptions are the users that qualify for government support as a result of the constitutional guarantee of a basic amount of water for every person and household, for which the equitable share grant is set aside.
Current Status Though the principle of full cost recovery was first accepted in 1984, full cost of Operation and Maintenance is still not recovered on some schemes. This is the result of ever increasing allocation of costs from overheads from different offices such as regional and cluster offices, and other indirect costs added to the Operation and Maintenance (O&M) cost. There are costs that were previously

Review of Pricing Strategies 2012 covered by exchequer account which have now been passed on to the users like some of the cost of hydrology.
The required outcome of the revised pricing strategy review is the following:
• The pricing strategy should be revised with the objective of achieving full cost recovery. A calculation of cost reflective tariffs is necessary together with a calculation of total subsidies in the system and recommendations on sources of funding of subsidies and the impact thereof.
• Make recommendations on options – a national, systems or scheme tariff (TCTA do charge a system tariff which is often not related to the infrastructure they finance, this might complicate opportunities to shift from existing practice).
• In the absence of an effective resource quality objective system within DWA, develop a simplified model for a mitigation charge for waste discharge.
• Further develop the work done by DWA on hydropower generation charges.
• An economic charge, either administratively determined or market‐oriented to provide incentives to shift water use from low value to high value water use (This may be difficult to implements if a single national raw water tariff is favoured).
The revision of the pricing strategy for raw water will have extensive socio‐economic impacts, affecting all water users. The extent of the impact needs to be clearly understood, quantified and communicated to our political principals in order for them to make an informed decision on a final pricing strategy. These could include for example:
• Keeping tariffs artificially low to enhance food security, this will be achieved at the cost of infrastructure deterioration or through subsidies from the fiscus – which will lead to some opportunity costs.
• Infrastructure development and maintenance as opposed to affordability by the poor.
• Infrastructure development either as a catalyst or constraint to economic growth and social development.
4.3 Pricing Strategy Prescribed Water Use Charges Figure 4.2 shows seven different charges that can be levied for the various functions performed at the different stages in the water supply and sanitation cycle. Not all of these charges are necessarily charged to all water users, some charges cannot be applied to certain users because they do not make direct use of the services provided.
The following description in the sub‐sections below provides an overview of water use charges that have been applied or considered under the 2007 Pricing Strategy, based on an OECD review by Pegram and Schreiner (2009).

Review of Pricing Strategies 2012
Figure 4.2: Pricing Chain Linking Water Resources and Water Services (DWA Strategic Framework for WS, 2005)
4.3.1 Raw Water Infrastructure Charge Financing of the development and operation of water resources infrastructure is done primarily in terms of the Pricing Strategy, with different institutions involved at different levels. A differentiation between infrastructure to meet social versus commercial demand can be made. Typically the former is funded on‐budget from the fiscus with charges set to recover operational and nominal asset costs. Infrastructure for commercial demand on the other hand is funded using commercial off‐budget finance with charges set to recover the full financial cost of operation and debt repayment. Some infrastructure for commercial demand is developed on‐budget to promote economic development, but the charges to commercial users are then negotiated at the full financial cost (equivalent to off‐budget financing).The treatment of financing costs such as interest and transaction costs is fundamentally different for social and commercial investment. For social investments these costs are incorporated into National Treasury operations as part of the cost of financing government. For commercial infrastructure these costs are explicitly ring‐fenced and recovered at a project level from the users who benefit from the infrastructure.
The classification of the type of water use as social or commercial demand is at the sole discretion of the Minister, but there is no clear definition of what constitutes either type of use.In general, social use is seen to be water for disadvantaged communities that cannot afford to pay the costs of the infrastructure.
National Raw Water Infrastructure Charges for Government Funded Schemes The raw water charge for existing publicly financed infrastructure consists of three elements calculated for each scheme in the country, namely:
Review of Pricing Strategies 2012
• Operation and Maintenance Charge: to cover the direct (personnel and materials) and indirect (overhead) costs associated with administering, operating and maintaining that scheme, estimated through the annual budgeting process.
• Depreciation Charge: to cover the typical refurbishment costs associated with loss of functional performance that is not restored by current maintenance, estimated on a straight line basis on the depreciable portion of the current asset value over its total useful life.
• Return on Assets (ROA) Charge: to cover the social opportunity cost of capital (partially covering the financial costs) to government for publicly funded infrastructure, to be used for funding augmentation planning studies, new schemes or betterments of existing schemes for social purposes or dam safety betterment, estimated as a percentage (currently 4%) of the depreciated replacement value.
The Department calculates these charges annually for each government water scheme on a volumetric basis (Rand per cubic metre) and invoices water users according to their sector, with the following general rules:
• Municipal, bulk industrial, power and mining users are charged O&M, depreciation and ROA charges and are typically billed on a monthly cycle.
• Agricultural users are charged O&M and depreciation charges and are typically billed on a 6 monthly cycle; the argument for not applying ROA to agriculture for existing schemes is that future social infrastructure will be primarily for domestic and livelihoods use.
• Water users associated with off‐budget schemes are charged an O&M charge by the department only until the debt has been repaid whilst the capital repayment is done through the agreement with the financiers.
An individual water user obtaining water from multiple sources would potentially pay different scheme costs for each source, but would only receive one invoice with each scheme as a line‐item. Agricultural irrigation charges may be reduced in times of drought in accordance with the percentage restriction required by DWA.
In 1997 the White Paper assumed the national water resources infrastructure asset were about R20 billion, in 2004 the assets were estimated at about R40 billion and in 2009 this had risen to about R75 billion current value (and ZAR 131 billion replacement value) once the more recent asset inventory was completed. This obviously has dramatic implications for the depreciation and ROA charges, but poses a problem because increases in infrastructure charges are capped (by the 2007 pricing strategy) at PPI plus 10%.
The 4% ROA charge rate was originally based on projected national average increase in domestic and industrial demands, and this has more recently been supported by the medium‐term projected capital requirements for social infrastructure and betterments. However, no rigorous methodological or policy approach has been developed to estimate an appropriate rate for ROA charges. This approach has generated significant debate, particularly by the larger municipalities that believe they will not benefit from the significant ROA payments they have made, due to classification of their demands as meeting “commercial needs”.
Review of Pricing Strategies 2012 Infrastructure and Capital Unit Charges (CUC) for Offbudget Funded Schemes Since 1994, the development of water resources infrastructure (particularly the large schemes) has predominantly been funded off‐budget and costs recouped from water users. This was mainly done through a specialised state‐owned intermediary (TCTA). TCTA’s funding model remains sound with its long term debt sufficiently covered by long term assets, even though it has capitalised interest over the past few years.
The setting of a “capital unit charge” (CUC) for debt repayment is specified in the Pricing Strategy, which reflects the revenue stream required to pay off the debt over a reasonable time (between 18 to 25 years). In practice this must consider:
1. stability in tariffs in real terms, but growing with inflation (CPIX); 2. the debt profile, acceptable growth and level of debt of the project; 3. overlap with and funding requirements of future augmentation projects in the basin; and 4. financial strain to end users or unhealthy financial balance in the water sector.
Before capital can be raised off‐budget, off‐take agreements must be signed with DWA by the commercial recipients of the water guaranteeing to purchase a specified amount of water at the set price for the duration of the project debt repayment. In turn, DWA signs a revenue agreement with TCTA, which provides a guarantee for the agreed charges and reduces TCTA risk. The CUC is then billed and collected from users by DWA as a line item on the infrastructure invoice and transferred to the TCTA. The O&M charge on off‐budget infrastructure is payable to DWA or the appropriate operator of the infrastructure. It is intended that a water resource development charge will be set by the Minister (which in principle will be less than the ROA) once the project debt has been paid off, and that this will be applied with a depreciation charge.
It is also important to note that DWA has adopted an integrated risk and pricing methodology on a systems basis which takes account of future infrastructure development in the Vaal and Western Cape systems, related to the Lesotho Highlands and Berg River projects. This represents a shift from the scheme based infrastructure charges for publicly financed infrastructure. This has the advantage of balancing tariffs between schemes, ensuring stable tariff regimes and optimising the yield of the system as water abstraction is not based on financial considerations of respective tariffs, but has not been expanded to the calculation of infrastructure charges.
Irrigation Board and Water User Association Scheme Levies Though this is not explicitly covered under the raw water pricing strategy, irrigation boards and Water User Associations are entitled to set charges/levies on their members to recover the costs of administration, operation, depreciation and debt repayment of their own schemes, following the requirements of their constitutions. Due to the fact that these charges are levied under the Pricing Strategy, the charges are charges upon the land and successors‐in‐title stay liable for unpaid charges.
Where they are responsible for the operation of government water schemes, they can act as billing and/or implementing agents for DWA. Some irrigation boards/water user associations have outstanding pre‐1994 loans with the Land Bank, while some have taken commercial loans for infrastructure development. There have been difficulties in repayment of some of these debts by farmers over the past decade. Although banks are willing to provide loans, the viability of the
Review of Pricing Strategies 2012 projects and revenue stream is carefully adjudicated. Current government policy is that the state will no longer underwrite either private sector or Land Bank loans.
Water User Associations and Irrigation Boards can apply for billing agent status. This not only provides the opportunity to improve efficiencies of collection of water use charges, which are very low in some water management areas, but it also provides for more localised regulation and oversight. The approach applied incentives to improve efficiencies of collection, based on the level of collection and age of arrears collected. However, difficulties arose when DWA insisted that all money collected be paid to them first, with the Association/Board only being remunerated later. This could result in significant delays in payment which was of concern to the agent. In addition, the Associations/Boards would be “jointly and severally liable” for an outstanding debt although DWA will provide administrative and legal support in difficult cases. Delays were experienced from DWA to finalise agreements, but this has now been sorted out.
Where functions to perform water resource management functions have been delegated to water user associations, part of the water resources management charge can be refunded to the institution.
Water Board Bulk Infrastructure and Local Government Water Supply Tariffs Water Boards and Local Government in South Africa often own and/or operate water resources infrastructure as part of their bulk water supply systems. The recovery of operation, maintenance and refurbishment costs for this infrastructure is usually through the institutions’ water supply tariffs. Some water boards (such as Umgeni Water) and local governments operate water resource infrastructure in their area of jurisdiction and thus may be involved in water supply to irrigation as well.
4.3.2 Water Resources Management (WRM) Charge The water resources management charge was introduced to recover the governance costs in a Water Management Area, including but not limited to:
• Planning and implementing catchment management strategies.
• Monitoring and assessing water resource availability and use.
• Water use allocations.
• Water quantity management, including flood and drought management, water distribution, control over abstraction, storage and stream flow reduction activities.
• Water resource protection, resource quality management and water pollution control.
• Water conservation and demand management.
• Institutional development and enabling the public to participate in water resources management decision‐making.
Under the 1999 Pricing Strategy this applied to consumptive water uses, namely abstraction, and stream flow reduction activities (commercial afforestation), but in 2007 was expanded to include waste discharge related users. The waste discharge charge, however, has not been implemented yet.
A policy decision was made to apply a single charge to all users within each sector (urban‐industrial, agriculture and forestry) in a water management area, considering assurance of supply, while excluding some functions for forestry (such as dam safety and Working for Water). Only

Review of Pricing Strategies 2012 approximately 15 to 20% of the Working for Water funding is derived from the trading account and allocated to be recovered from charges for irrigation water users. The balance is obtained from poverty relief funds and not subjected to recovery from water user charges. Urban‐industrial users are paying the full allocated Working for Water cost whilst Agriculture only pays 10% of the allocated cost.
As with the infrastructure charge, subsidy mechanisms have been developed to waive charges to emerging black farmers for a specified duration. There is a question as to whether the length of the waiver is sufficient for resource poor farmers to develop well established and sustainable businesses, or whether the waiver needs to be extended. There is also a need to clarify how this waiver will be is to be funded – either through cross‐subsidisation from other users or from the fiscus.
The intent was for the WRM charge to recover the Catchment Management Agency (CMA) costs related to management of water resources in the Water Management Area (WMA), but in practice with the delayed establishment of CMAs, the charges have been calculated and collected by the regional offices of DWA in their capacity as “proto‐CMAs”.
The implementation of water resources management charges to all registered users in the country required the registration and billing of in excess of 60 000 customers with about 80 000 water uses. However, as is to be expected less than 20% of these customers represent more than 80% of the revenue and these are typically the same users that are paying infrastructure charges (Pegram and Schreiner, 2009: 28). Most of the water user associations and irrigation boards are paying these charges on behalf of their members and recover that through their charges. Municipalities are paying the charges for all water use within their distribution systems.
The process of registering users, maintaining the data base, billing according to water use and recovering costs has required significant technical, managerial and financial resources by DWA, linked to the establishment of the Water Authorisation and Registration Management System (WARMS) national register and SAP billing systems. In retrospect, it seems that the systems that were adopted were far more complex than were actually required. The implications for delegation to CMAs remains unanswered and recent proposals imply that CMAs will be responsible for authorisation and collection of WRM chargesand the Infrastructure Branch/Agency for the consumptive use charges, but DWA will retain responsibility for the national water register (under WARMS) and invoicing (through SAP). In some ways, this contradicts the original spirit behind the establishment of CMAs. Originally, the policy was that all charges (i.e. infrastructure, WRM, WRC and WfW) were to be included on a single invoice to a given customer, but during the process of establishing the Infrastructure Branch in anticipation of the National Water Resources Infrastructure Agency, a dual invoice system was recommended, implemented and is still in place.
Poor performance in water resources management in some water management areas, invoice inaccuracy and invoice delays have contributed to the seemingly low payment rates for WRM charges. Of the roughly R330 million in WRM charges invoiced in 2008/09, only about 50% was recovered by DWA, although inadequate financial management of the system prevents accurate estimation of this amount (Pegram and Schreiner, 2009: 29). In limited cases farmer groups have deposited the charges into trust funds, stating that these would only be paid once DWA
Review of Pricing Strategies 2012 demonstrates delivery of the functions being billed for, including timeous authorisation of license applications and control/enforcement of illegal water use.
These low payment rates have also been exacerbated by the inadequate mobilisation of new users who have not had to pay for water previously (unlike many of the infrastructure scheme water users), even though WRM charges are considerably lower than the infrastructure charges. Indications are that once CMAs are established, WRM charges would most likely need to double from current levels. There is an on‐going debate about the basis for financial support to CMAs, and particularly the degree to which they should all aspire to complete self‐sufficiency. The key lesson being learned from the WRM charge implementation is the importance of engaging customers in the charge setting process and the demonstration of value added by the associated functions being charged for. This has been lacking due to the delayed implementation of CMAs in South Africa.
4.3.3 Waste Discharge Charge In 2006, DWA proposed a waste discharge charge system (WDCS) to give effect to the polluter pays principle, targeting basins in which the water quality was deteriorating below agreed levels. The system was based on two distinct charges reflecting fundamentally different approaches to managing water quality problems.
• Firstly, the mitigation charge is a user charge to recover the costs of mitigation measures undertaken in the resource.
It is intended for application where mitigation in the water resource provides an economically efficient option to support the achievement of water quality objectives in a catchment, in comparison to the costs of reducing effluent load at source.
Its calculation is simply by apportioning the full financial cost of mitigation to dischargers according to their waste load.
• Secondly, the incentive charge is designed to achieve the economically optimal use of the resource for discharging or disposal of waste
The charge is set at a level that seeks to change dischargers’ behaviour and reduce total waste load to a level that will enable the achievement of economically, socially and ecologically acceptable water quality objectives.
This is calculated against an estimate of the marginal costs of treatment for all dischargers, setting this at the level that will cumulatively achieve adequate waste load reduction to meet the catchment water quality objectives.
This is not particularly relevant for irrigated agriculture, because irrigation return flows are unlikely to be subject to these charges for the foreseeable future, and discharge from livestock facilities, agro‐processing and aquaculture will be treated in the same way as point source “industrial use”.
4.3.4 Water Research Levy Since 1984, water research levies have been charged on urban, industrial and irrigation water from government water schemes to support water related research by the Water Research Commission. The WRC board in consultation with DWA allocates funding to both solicited and unsolicited water research projects addressing both water resources and water services policy and implementation challenges in South Africa. South Africa has benefited considerably over the past few decades from this earmarked research funding. These benefits have occurred as a result of long‐term water research programmes being ring fenced from other changing operational needs. South Africa’s lead
Review of Pricing Strategies 2012 role in water policy and implementation can be ascribed to long term research programmes around environmental flows, institutional development, agricultural water use, water quality management and instruments to give effect to integrated water resources management.
All water users from Government Water Schemes and within Irrigation Boards/Water User Associations and Municipalities have to pay the WRC levy and the task of billing water users for the WRC levy and collecting it lies with DWA. The only exceptions to this are the Rand Water Board and the Umgeni Water Board, both of which are billed by the WRC and payment is collected by the WRC as well.
4.3.5 Working for Water Charges/Payment for ecological services Under the 1999 Pricing Strategy, a portion of the costs associated with clearing alien invasive plants (that evapotranspirate water from catchment areas) could be applied to urban‐industrial and agricultural irrigation water users in a Water Management Area, linked to the water resources management charge. Working for Water (WfW) charges were typically between R0.01/m3 and R0.05/m3 for urban users and only 10% of this for agriculture, due to a 90% subsidy arrangement. The approximately R75 million annual billing was supported by a much larger fiscal subsidy of in excess of R300 million, reflecting the public works and biodiversity value of the programme (Pegram and Schreiner, 2009: 30).
With the 2007 Pricing Strategy, this was shifted to a willing user arrangement, where stakeholders and users in a catchment area with infestation could agree to fund the alien clearing with charges calculated on the relative use by each user, possibly supported by subsidies where available. Additional water made available above that required to address environmental and over‐allocation needs could be allocated to those contributing financially to the clearing. This reflects the closest experience that South Africa has to a payment for environmental services (PES) scheme.
The planning and implementation of WfW has somewhat suffered from its diverse water resource, biodiversity and social development mandates, but its broader success has led to the implementation of a Working for Wetlands initiative funded entirely from the fiscus. The WfW programme was moved to the Department of Environment Affairs as of April 2011.
A key question is how to deal with the costs of the Working for Water programme, and issues of payment for ecological services.
4.3.6 Water Use Licensing Fee While a license application fee of R114 (including VAT) has been in place for many years, this is a relatively insignificant income stream for DWA and does not reflect the full cost of evaluating the 100 to 200 water use licences applications received every year (not including the current 1300 backlog). In reality, the application fee has decreased 6% to 8% over the last decade (Pegram and Schreiner, 2009: 30). The only challenge with water use licences is that the delays in their processing has been used by water users as an example of why they are of the view that they should not be paying the WRM charge. That said, water use licences can be used to leverage off the strength of private water users to extend support to the emerging crop of historically disadvantaged farmers.
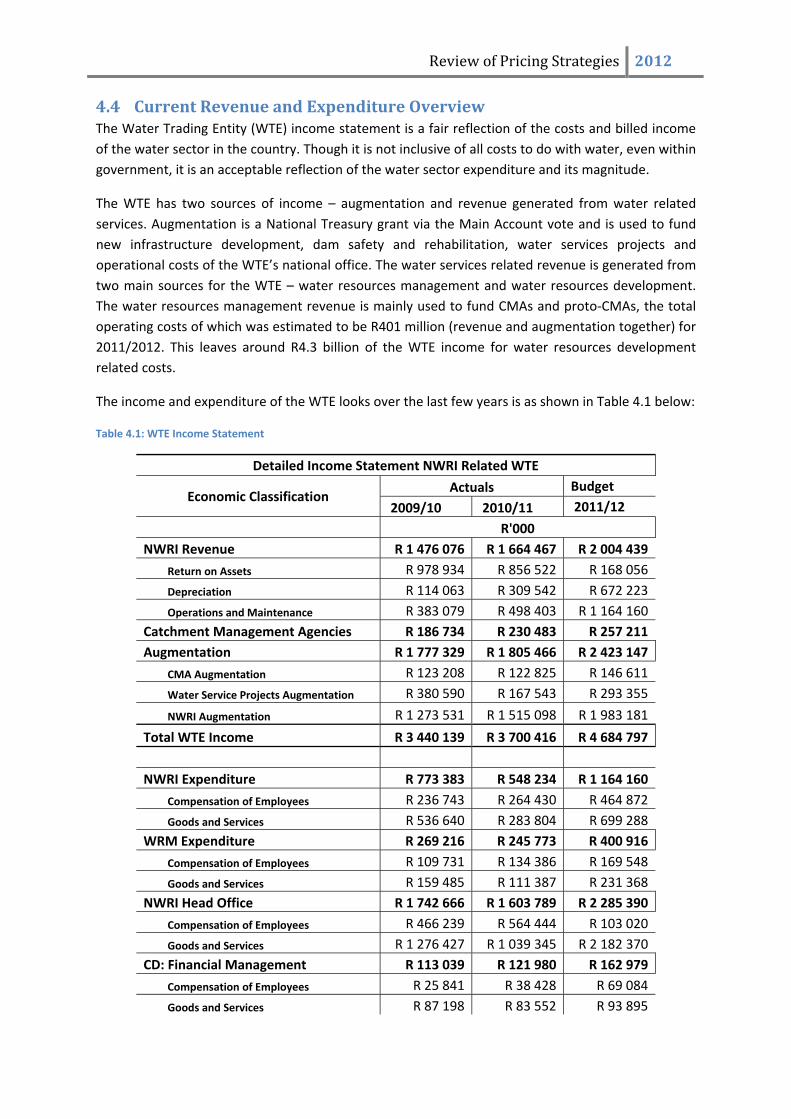
Review of Pricing Strategies 2012 4.4 Current Revenue and Expenditure Overview The Water Trading Entity (WTE) income statement is a fair reflection of the costs and billed income of the water sector in the country. Though it is not inclusive of all costs to do with water, even within government, it is an acceptable reflection of the water sector expenditure and its magnitude.
The WTE has two sources of income – augmentation and revenue generated from water related services. Augmentation is a National Treasury grant via the Main Account vote and is used to fund new infrastructure development, dam safety and rehabilitation, water services projects and operational costs of the WTE’s national office. The water services related revenue is generated from two main sources for the WTE – water resources management and water resources development. The water resources management revenue is mainly used to fund CMAs and proto‐CMAs, the total operating costs of which was estimated to be R401 million (revenue and augmentation together) for 2011/2012. This leaves around R4.3 billion of the WTE income for water resources development related costs.
The income and expenditure of the WTE looks over the last few years is as shown in Table 4.1 below:
Table 4.1: WTE Income Statement
Detailed Income Statement NWRI Related WTE
Economic Classification Actuals Budget
2009/10 2010/11 2011/12
R'000 NWRI Revenue R 1 476 076 R 1 664 467 R 2 004 439
Return on Assets R 978 934 R 856 522 R 168 056
Depreciation R 114 063 R 309 542 R 672 223
Operations and Maintenance R 383 079 R 498 403 R 1 164 160 Catchment Management Agencies R 186 734 R 230 483 R 257 211 Augmentation R 1 777 329 R 1 805 466 R 2 423 147
CMA Augmentation R 123 208 R 122 825 R 146 611
Water Service Projects Augmentation R 380 590 R 167 543 R 293 355
NWRI Augmentation R 1 273 531 R 1 515 098 R 1 983 181
Total WTE Income R 3 440 139 R 3 700 416 R 4 684 797
NWRI Expenditure R 773 383 R 548 234 R 1 164 160
Compensation of Employees R 236 743 R 264 430 R 464 872
Goods and Services R 536 640 R 283 804 R 699 288 WRM Expenditure R 269 216 R 245 773 R 400 916
Compensation of Employees R 109 731 R 134 386 R 169 548
Goods and Services R 159 485 R 111 387 R 231 368 NWRI Head Office R 1 742 666 R 1 603 789 R 2 285 390
Compensation of Employees R 466 239 R 564 444 R 103 020
Goods and Services R 1 276 427 R 1 039 345 R 2 182 370 CD: Financial Management R 113 039 R 121 980 R 162 979
Compensation of Employees R 25 841 R 38 428 R 69 084
Goods and Services R 87 198 R 83 552 R 93 895
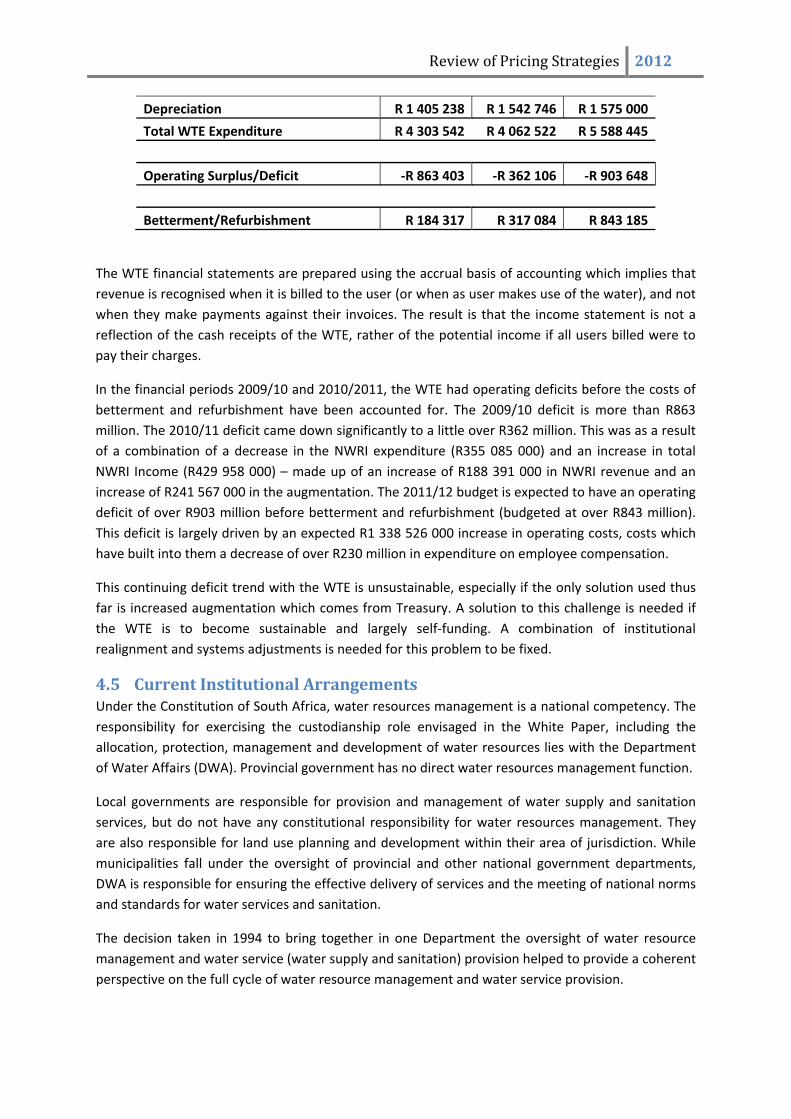
Review of Pricing Strategies 2012
Depreciation R 1 405 238 R 1 542 746 R 1 575 000
Total WTE Expenditure R 4 303 542 R 4 062 522 R 5 588 445
Operating Surplus/Deficit ‐R 863 403 ‐R 362 106 ‐R 903 648
Betterment/Refurbishment R 184 317 R 317 084 R 843 185
The WTE financial statements are prepared using the accrual basis of accounting which implies that revenue is recognised when it is billed to the user (or when as user makes use of the water), and not when they make payments against their invoices. The result is that the income statement is not a reflection of the cash receipts of the WTE, rather of the potential income if all users billed were to pay their charges.
In the financial periods 2009/10 and 2010/2011, the WTE had operating deficits before the costs of betterment and refurbishment have been accounted for. The 2009/10 deficit is more than R863 million. The 2010/11 deficit came down significantly to a little over R362 million. This was as a result of a combination of a decrease in the NWRI expenditure (R355 085 000) and an increase in total NWRI Income (R429 958 000) – made up of an increase of R188 391 000 in NWRI revenue and an increase of R241 567 000 in the augmentation. The 2011/12 budget is expected to have an operating deficit of over R903 million before betterment and refurbishment (budgeted at over R843 million). This deficit is largely driven by an expected R1 338 526 000 increase in operating costs, costs which have built into them a decrease of over R230 million in expenditure on employee compensation.
This continuing deficit trend with the WTE is unsustainable, especially if the only solution used thus far is increased augmentation which comes from Treasury. A solution to this challenge is needed if the WTE is to become sustainable and largely self‐funding. A combination of institutional realignment and systems adjustments is needed for this problem to be fixed.
4.5 Current Institutional Arrangements Under the Constitution of South Africa, water resources management is a national competency. The responsibility for exercising the custodianship role envisaged in the White Paper, including the allocation, protection, management and development of water resources lies with the Department of Water Affairs (DWA). Provincial government has no direct water resources management function.
Local governments are responsible for provision and management of water supply and sanitation services, but do not have any constitutional responsibility for water resources management. They are also responsible for land use planning and development within their area of jurisdiction. While municipalities fall under the oversight of provincial and other national government departments, DWA is responsible for ensuring the effective delivery of services and the meeting of national norms and standards for water services and sanitation.
The decision taken in 1994 to bring together in one Department the oversight of water resource management and water service (water supply and sanitation) provision helped to provide a coherent perspective on the full cycle of water resource management and water service provision.
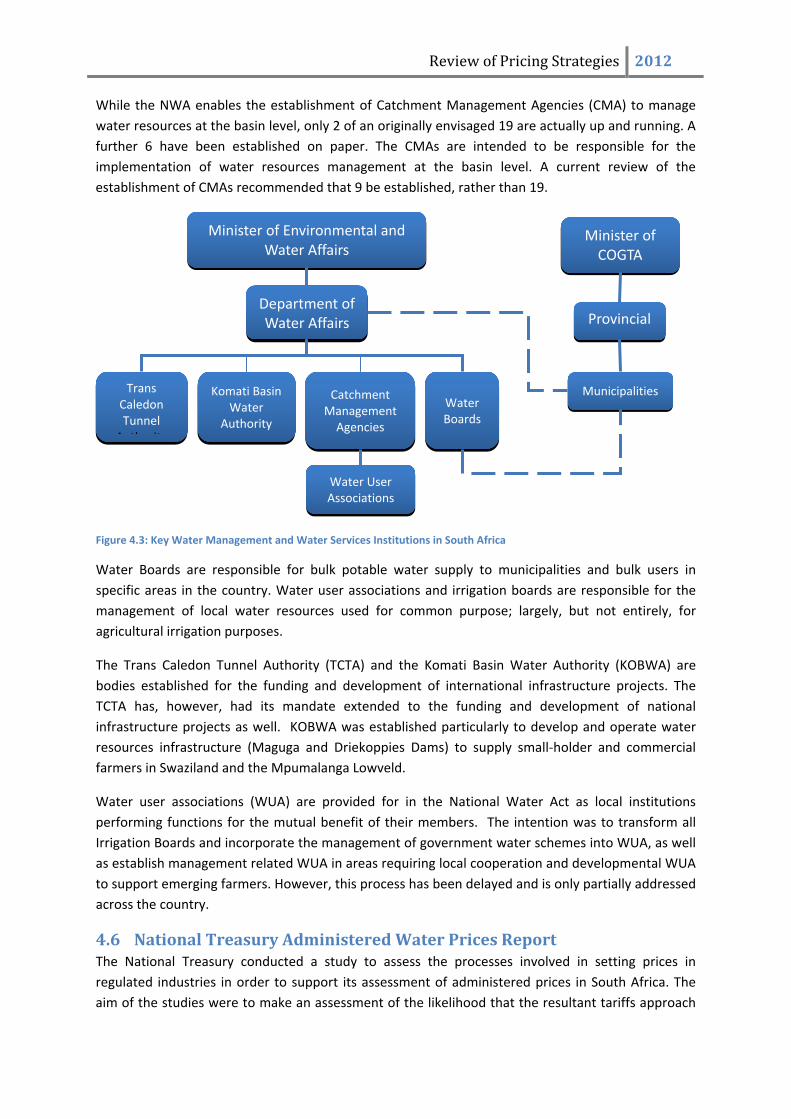
Review of Pricing Strategies 2012 While the NWA enables the establishment of Catchment Management Agencies (CMA) to manage water resources at the basin level, only 2 of an originally envisaged 19 are actually up and running. A further 6 have been established on paper. The CMAs are intended to be responsible for the implementation of water resources management at the basin level. A current review of the establishment of CMAs recommended that 9 be established, rather than 19.
Minister of Environmental and Water Affairs
Figure 4.3: Key Water Management and Water Services Institutions in South Africa
Water Boards are responsible for bulk potable water supply to municipalities and bulk users in specific areas in the country. Water user associations and irrigation boards are responsible for the management of local water resources used for common purpose; largely, but not entirely, for agricultural irrigation purposes.
The Trans Caledon Tunnel Authority (TCTA) and the Komati Basin Water Authority (KOBWA) are bodies established for the funding and development of international infrastructure projects. The TCTA has, however, had its mandate extended to the funding and development of national infrastructure projects as well. KOBWA was established particularly to develop and operate water resources infrastructure (Maguga and Driekoppies Dams) to supply small‐holder and commercial farmers in Swaziland and the Mpumalanga Lowveld.
Water user associations (WUA) are provided for in the National Water Act as local institutions performing functions for the mutual benefit of their members. The intention was to transform all Irrigation Boards and incorporate the management of government water schemes into WUA, as well as establish management related WUA in areas requiring local cooperation and developmental WUA to support emerging farmers. However, this process has been delayed and is only partially addressed across the country.
4.6 National Treasury Administered Water Prices Report The National Treasury conducted a study to assess the processes involved in setting prices in regulated industries in order to support its assessment of administered prices in South Africa. The aim of the studies were to make an assessment of the likelihood that the resultant tariffs approach
Department of Water Affairs
Catchment Management Agencies
Water User Associations
Minister of COGTA
Municipalities Water Boards
Provincial G
Trans Caledon Tunnel
Komati Basin Water
Authority A th it
Review of Pricing Strategies 2012 efficient levels by evaluating the efficiency, effectiveness and analytical rigour of the regulatory processes involved in setting prices for the services involved. The key finding of the report on water prices, which did not offer a detailed quantitative assessment of the performance of the regulatory regime, were as detailed below.
Individual water charges vary widely across South Africa. Due to the large number of links in the water supply chain that are regulated in different ways and by different entities, final charges are unlikely to be cost reflective. Regulatory incentives for cost reductions and for efficient prices are weak at all levels of the activity chain. The absence of an independent regulator is problematic with highly opaque regulatory relationships currently in place.
There is a marked absence of any formal economic regulation of water tariffs throughout the water cost chain and no formal economic regulatory function exists in any part of the water sector. Self‐regulation is evident in a number of instances: that is, the same institution both sets the tariff level and regulates the tariff level. The final charges paid by water service end‐users incorporate a number of different elements that are themselves regulated in different ways and by different entities. As a consequence, it is extremely unlikely that the end charges bear any systematic relationship either to costs or to the achievement of wider social objectives that are of key importance in setting water charges.
Some of the challenges that make it difficult to formulate charges that are in line with the social objectives and a systematic relationship with costs include:
• The absence of explicit policies for bulk water tariffs – though a fairly vague draft guideline has been developed by DWAF for the setting of tariffs by water boards.
Strong municipal and broader political pressure to limit retail water tariffs leading to a cost squeeze, which generally translates into insufficient investment and under maintenance. In this case low prices are not an efficient outcome and above‐inflation increases would be economically efficient and promote better and more reliable service in the long run.
Efficient regulation and any reliable assessment of pricing efficiency is likely to depend, above all, on ring‐fencing of water operations at local authority level from other local authority activities so that better information can be made available. Consideration should be given to the establishment of an independent regulator. Alternatively, regulatory capacity could be development within DWAF and moved to an independent regulator later. The advantages and disadvantages of each approach need to be more fully considered prior to making a decision.
4.6.1 Recommendations of the Report The report has a list of recommendations that relate to the challenges that have to do with the absence of proper regulation in the water sector, the diversity of schemes and the institutional arrangements in the sector that have led to the lack of efficient pricing in the water sector. The recommendations from the report include the following:
• The use of scheme based pricing so as to ensure that water prices reflect the underlying costs of its provision
Review of Pricing Strategies 2012
• The regulation of water resources development charges, the improvement of the economic regulation of bulk water prices (preferably by an independent regulator) and improved regulatory oversight of retail water pricing.
• The strengthening of economic regulation of water generally throughout the water value chain
4.7 Pricing in Other Sectors – Eskom In 2009 Eskom applied to the National Energy Regulator of South Africa (NERSA) for a review of the electricity prices offered by Eskom. The application was for a three year control period starting from 1 April 2010 to 30 March 2013 which is referred to as the Multi‐year Price Determination (MYPD).
The Electricity Pricing Policy (EPP) makes certain provisions with regards to revaluation of assets, and they are as follows:
1. The revenue requirement for a regulated licensee must be set at a level which covers the full cost of production, including a reasonable risk adjusted margin or return on appropriate asset values. The Regulator, after consultation with stakeholders, must adopt an asset valuation methodology that accurately reflects the replacement value of those assets such as to allow the electricity utility to obtain reasonably priced funding for investment; to meet Government defined economic growth.
2. In addition, the regulatory methodology should anticipate investment cycles and other cost trends to prevent unreasonable price volatility and shocks while ensuring financial viability, continuity, fundability and stability over the short, medium and long term assuming an efficient and prudent operator.
Based on these and other provisions, Eskom has reformulated its funding model in a way that makes it possible to ensure proper operations and maintenance, as well as investment in assets that can ensure that the utility keeps up with demand in a sustainable manner.
4.7.1 Tariff Structure Eskom recovers its standard schedule of tariffs’ portion of the revenue requirement by adjusting all components of the regulated tariffs equally by the approved price increase. The average price may – with the approval of the NERSA ‐ be adjusted to take into account subsidies (the Homelight tariffs were capped over the last two years to protect the poor against the impact of the high price increases) or split between the local and non‐local authority tariff.
The difference between local authority prices and other prices is that the local authority price increases can only be implemented on 1 July of each financial year in compliance with the Municipal Management Finance Act (MFMA) and therefore calculated to achieve that portion of the annual revenue requirement over 9 months (July to March) instead of 12 months (April to March).
Once the revenue requirement is determined by NERSA the price increase is applied to the tariff rates that are designed based on the cost to supply customers in a specific tariff category. The Eskom tariffs are based on a cost of supply study, where costs are allocated to different cost drivers such as energy, networks and customer service for each customer category. Different customer categories will have different costs allocated to them depending on:
Review of Pricing Strategies 2012
• The voltage of the supply
• The density of the network to which customers are connected (rural/urban)
• How the energy is used during the day and season
• The capacity used by the customer
From the costs, the tariffs are designed to ensure that they are as cost reflective as possible. Eskom’s average price is based on Eskom’s overall costs, but individual price levels on tariffs per customer or even per customer class might not be cost‐reflective. This is due to averaging, historical cross‐subsidies and social factors such as the customer’s ability to pay a cost reflective price.
4.7.2 Protection to the Poor The Electricity Pricing Policy (EPP) provides guidance for the protection of the poor and states that qualifying customers should be subsidised through a life‐line tariff, which should be limited to 20Amp and have a cost breakeven point at 350kWh per month. Eskom considers various options in order to protect the poor from the impact of increasing prices. The allowable revenue/price increase approved by NERSA is applied to the Eskom retail tariff rates.
In essence, there are three options to provide protection to the poor and facilitate access to affordable electricity. Eskom considers the following options in order to provide protection of the poor from the impact of increasing prices:
Subsidies by Other Customers • Option 1: Cap the increase to the Poor
Increase of the life‐line tariff (20A tariffs as per EPP) limited to CPI over the three years of the MYPD with the difference between the average price and the limited increase being subsided by the other customers
• Option 2: Reduction of the current life‐line tariffs in line with the EPP In order to align with the EPP, the current life‐line tariffs of all licensees would have to be adjusted to breakeven with the cost associated with the life‐line tariff at 350kWh/month.
• Option 3: National Inclining Block Rate Tariff Eskom states that it views the Homelight free basic electricity (FBE) tariffs as a two block inclining block rate tariff, with the first 50kWh free and the second block (usage greater than 50kWh) at the Eskom standard tariffs
Government Subsidy • Option 4: Increasing the FBE allocation
Eskom proposes that the FBE allocation be increased from 50kWh to 70kWh per month for all 20A FBE customers with additional funding for the incremental costs (i.e. the additional 20kWh) from National Treasury
Hybrid Option • Option 5: Increasing the FBE allocation to 70kWh/month with the incremental cost funded
by cross‐subsidies through a designated levy FBE allocation increased from 50kWh to 70kWh per household per month for all qualifying 20A customers. However, instead of National Treasury providing the

Review of Pricing Strategies 2012
additional funding for the incremental costs, an FBE levy is introduced for all other Eskom and municipal customers (excluding customers requiring life line assistance).
Funds accruing from the levy can be paid over to government and thereafter re‐distributed to Eskom and municipalities to recoup the incremental costs for providing the additional 20kWh.
Review of Pricing Strategies 2012
36 | P a g e
5 International Experience – Case Studies Raw water is a scarce commodity of rising value. Though raw water markets exist in some parts of the world, most water is provided by public authorities which set prices for delivered water. It is very important, therefore, that these authorities follow pricing principles that lead to efficient and equitable water use (Guerrero and Howe, date unknown). Efficient allocation suggests setting the price at the long‐run marginal cost or the cost of developing and delivering the last unit, however, given the public nature of water and its benefits, other things must be considered when setting charges.
The purpose of water resources management is not simply to provide water in the quantity and quality desired. Water also has ecological, recreational values and social values that need to be reflected in the pricing system. A charging system should promote a sensible use of the environment, meaning that prices should ideally reflect the true and complete social costs of water supply including resource depletion.
Water costs have multiple elements to them. These elements can be summed to arrive at two categories: financial costs and economic costs. The financial costs are the costs associated with supplying water services to users without considering either the externalities of water consumption (positive or negative) or the opportunity costs. Financial costs are mainly comprised of three elements:
• Operation and Maintenance (O&M) – to do with the daily running of water supply
• Capital costs – covering the costs of new infrastructure and renewal of old infrastructure
• Debt servicing costs
Full economic costs are the sum of the financial costs and the following:
• Opportunity costs – these reflect the scarcity value of resources
• Economic externalities – both positive and negative
Below is a survey of the practises and principles applied in some of the world’s nation, which includes a look at which of these elements of water pricing are applied or considered in water pricing in those countries and their associated difficulties.
5.1 Australia
5.1.1 Introduction The history of water resources development in Australia (and in the iconic Murray Darling Basin in particular) is an important backdrop to the discussion of financing, and can be considered in three phases.
The first was a development phase which took place up until about the 1970s and was characterised by government funding and the construction of large storage infrastructure, water supply systems and inter‐basin transfer schemes. These works were principally undertaken as a way of facilitating regional development, mainly through expansion of irrigation.
Review of Pricing Strategies 2012 In the second phase, during the 1980s and 90s, the focus shifted to water resources management. State governments and the irrigated agriculture sector were confronted with a number of fundamental challenges. Charges being paid by farmers for irrigation water delivery were generally not covering the costs of supply, the government owned irrigation infrastructure was not being managed in a commercial manner, water entitlements were poorly defined, and the health of rivers and aquifers in many parts of the country was deteriorating (Parker and Speed, 2010: 6). A further driver behind this shift was the new national competition policy which required reforms across a range of sectors to promote economic efficiency and sustainability. These reforms required the removal of subsidies within the water sector and for water utility providers to adopt pricing to ensure their long‐term commercial sustainability. Competition policy also drove the shift towards a market‐based approach to water allocation.
The importance of the Murray Darling River basin to Australia’s economic and political landscape meant that broader water policy processes were strongly influenced by conditions within this basin. Other significant drivers at the time included deteriorating water quality and river health. These coincided with a heightened environmental awareness, both amongst politicians and within the broader community, and a realisation that the over allocation of water resources was reducing the reliability of existing supplies. Together these were seen as a threat to the long‐term viability of regional communities. The management response was new price paths for water services, the introduction of caps on abstraction, an increased intensity of management, and the introduction of trading. These changes also precipitated a wholesale reform to the planning, institutional and entitlement systems.
The third of the water sector’s phases (the current one) can be regarded as an adjustment phase. This has been driven by the general view that water resources in the Murray Darling Basin are over allocated, a situation that has been exacerbated by prolonged drought. This has led to national concerns over the ecological health of the basin and widespread calls for action. The combination of over‐allocation and drought has also meant that in many regions irrigators have had little or no water allocated to them for a number of years. In response, water resources policies have increasingly focused on protecting riverine ecosystems and providing secure, reliable water supplies. Amongst other measures, this has required reducing consumptive allocations and increasing the water available to the environment. This has been through a combination of claw‐back under planning mechanisms, the purchase of water entitlements through market mechanisms and improving water use efficiency, especially in the irrigation sector.
At the same time, infrastructure planning in the basin has shifted its focus from new storage to instead meet requirements to deliver environmental outcomes. This includes salt interception schemes constructed to meet water quality objectives and in‐stream “chokes” to reduce the level of flow required before rivers break their banks and inundate adjacent wetlands.
Under Australia’s federal system, the States have (for the most part) had primary responsibility for water resources management and state government agencies have thus managed both water resources and land within the basin. For various political, historical and physical reasons, there are significant regional variations (even within States) in prices. Within a State, there can be dozens of water supply schemes, some with different owners, with different pricing methodologies and tariffs. It can then be difficult to be either categorical or exhaustive in describing how water prices are set
Review of Pricing Strategies 2012 and their level. What follows is an endeavour to provide an overview of the principles underpinning water pricing in Australia.
5.1.2 Transforming Water in Australia Water pricing was one element of the agenda, another being the institutional separation of service delivery from regulation. Water businesses have been institutionally separated from the regulatory bodies. State‐owned irrigation schemes became commercially focussed – either through becoming government owned corporations, or being transferred to users to own and operate. The irrigation assets (dams, pipes, channels) have been moved from government departments to stand alone businesses with a commercial focus. The States committed to “lower bound pricing”, meaning water prices covered the operation, maintenance and refurbishment costs of supply – but not a commercial return on the assets.
Water businesses were established, farmers became customers and water became an economic good. The subsidies of years past became explicit, and price paths were developed to remove them. State governments received incentive payments from the Australian Government if policy outcomes were met, thus allowing the Australian government to, in practise, exerted pressure on the States to change water management practices via financial incentives, principally through various agreements between the State and Australian governments. A new body, the National Competition Council (NCC), was established and it assessed each State’s performance in water and the other areas of micro‐economic reform. States met the new water pricing policy objectives, though the timeframes for implementation varied depending largely on the extent of the price increases necessary. A small number of schemes which simply were not economically viable continued to receive explicit and transparent community service obligation payments.
The Council of Australian Governments (COAG) Agreement on water reform, reached in 1994 as part of the implementation of the National Competition Policy, was the catalyst for water reform in Australia (NCC, 1998). The agreement set out a framework for all States to work towards, with the goal of establishing an efficient and sustainable water industry (Parker and Speed, 2010: 8).
In 2004, the water sector reforms were refreshed with the National Water Initiative (NWI) building on progress since 1994. The National Water Commission (NWC) was established as a statutory body to drive the reforms and provide advice to COAG. The NWC assumed responsibility for assessing States performance on pricing reforms, and its 2005 assessment of progress found States had met the lower bound targets (NWC, 2006). While water pricing is now at lower bound, both irrigation and urban water pricing reforms continue to be a key element of the NWI, with a focus on developing nationally consistent approaches to matters such as capital recovery and the identification of water planning and managements costs.
5.1.3 Water Management Principles Australia has been subject to fundamental reforms to the institutional arrangements for water supply and water pricing since 1994. It has meant that while individual States have (generally) remained responsible for management of their own water resources, the water management principles applied across the country have been the same. These have included:
• The development of water resource plans, underpinned by robust science and hydrology modelling, as the basis for allocation decisions;
Review of Pricing Strategies 2012
• The recognition of the need for water for environmental purposes;
• Separation of regulatory and operational functions in institutional arrangements;
• Granting secure entitlements to water, where possible to the end‐user;
• Allowing for trading of those entitlements between users; and
• Cost reflective pricing of water supply
Australia has opted to go with a more market based approach to water pricing, leaving the payment of cost of water development and supply to the end user.
5.1.4 Defining and Recovering Water Costs The 1994 COAG agreement included general principles for pricing, including consumption‐based pricing, full‐cost recovery and (desirably) the removal of cross‐subsidies. In respect of rural water supply, the agreement provided for a move to full cost‐recovery and to achieve positive real rates of return on the written‐down replacement costs of assets in rural water. The parties agreed to aim to implement this new pricing regime by 2001.
Further advancing these goals, the 2004 NWI required that the parties:
• Promote economically efficient and sustainable use of water resources, water infrastructure assets, and government resources;
• Ensure sufficient revenue streams to allow efficient delivery of the required services;
• Facilitate the efficient functioning of water markets; and
• Give effect to the principles of user‐pays and achieve pricing transparency in respect of water storage and delivery in irrigation systems and cost recovery for water planning and management
5.1.5 Summary of Cost Recovery for Water Supply While the states have been slower than originally anticipated in achieving lower bound pricing (the 1994 COAG originally set a target of 2001), this goal has now been realised in the vast majority of government‐owned water supply schemes.
Where government entities are required to provide water supply services to irrigators at a price that is less than lower bound levels, the balance is paid by government as a transparent community service obligation (‘CSO’) payment. The level of these payments represents the extent to which the different entities are not yet achieving lower bound pricing. Governments have recognised that there are a small number of schemes, representing a small volume of the total water supplied, that are not, and probably will never be, economically viable in their own right. In these instances, the schemes will continue to be supported through a transparent CSO payment.
5.2 Mexico In Mexico, water is nationally owned and the government is the only seller in the "water market". The National Water Law allows the National Water Commission to charge a fee to all water users for the right to use water, as well as to charge a fee for discharging pollutants to natural streams or lakes.
Review of Pricing Strategies 2012 5.2.1 Introduction From 1989 when the National Water Commission was created and given a more strict application of the water law, the law has been adjusted annually to respond to the changing requirements of the water sector.Since the passing of the Water Law in 1992 and the creation of the National Water Commission, Mexico embarked on a massive policy reform to devolve water management of its large water districts to the recently created users associations. This involved setting up new institutions such as basin agencies, giving WUAs managing capacity to administer both capital assets and water resources, and transferring the financial responsibility of running districts and collecting charges to the WUAs.
The size of districts in Mexico has grown from an average of 7,000 ha by the time they were transferred to the WUA to 15,000 ha after several functioning years. Economies of scale are sought from merging districts. New WUAs exhibit better performance and have enabled more farmers to participate. What is also remarkable is that the reliability of water deliveries has also increased, with significant positive impacts in water and land productivity which come from better exports potential. Higher charges were translated into better and timelier water services, which were more than compensated for by more valuable and greater productivity.
5.2.2 Cost Determination and Payment Before 1986the pricing system employed the same fixed price per cubic meter throughout the country. The present water pricing system in Mexico incorporates two kinds of tariffs:
• one of them is a fixed price per cubic meter of water used, differing by water supply zone, of which there are four. These four zones take into account the regional heterogeneity of water availability ‐
Zone 1: water is scarce relative to demand Zone 2: water supply and demand are in balance in the short term Zone 3: water supply is enough to meet demand for the intermediate term Zone 4: water is in abundance for the indefinite future
• The other system is an increasing block rate structure.
In 1997 Zone 1 was broken up into six zones, which were all considered scarcity zones, because of a number of practical difficulties in the application of tariffs derived from the water law which includes somesubsidies, permissions and exceptions for some industrial use or some municipalities. Zones 2 to 4 are now zones 2 to 9 and maintain the conditions as were defined in 1986.
Four principal water uses were also established: irrigation, hydroelectric generation, urban (potable), and industrial. Each use is assigned a pricing weight. The industrial sector is assigned the highest weight; in second place is the water for urban use (potable); in third is thewater for irrigation; and the water for hydroelectricgeneration is assigned the lowest weight. The criteria for assigning these weights have not been made explicit, but they clearly include considerations of return flow and ability to pay.The methods used to fix the prices appear to combine both the water availability weights and the sector weights and the weight by zone and use are as in Table 5.1 below. As a result of these weights, we can describe at least 16 different tariffs for the use of water.

Review of Pricing Strategies 2012 Table 5.1: Water Pricing Weights
Water Availability Water Use Zone Weight Use Weight1 1 Industrial 1 2 0.5 Potable 0.8 3 0.15 irrigation 0.013 4 0.05 Hydroelectricity 0.001
Water is more expensive in areas where there is water scarcity. In the case where industrial water users tap their own water supply, CNA applies tariffs according to the zone weights alone.
The tariffs for discharging wastes were established in the same way as the water use tariffs. Within each zone, the discharge tariffs are determined by the cubic meters discharged and by the composition of pollutants discharged (BOD, TSS, DO and other pollutants). Thus, on the discharge side, we also have at least 16 different tariffs.
With respect to irrigation and urban use, water is currently priced by a block structure with increasing prices that currently recover only operating and maintenance (O&M) costs. Farmers also pay the cost of O&M as a function of the irrigated area and standardized water consumption of the crop being raised. The philosophy of the Federal Law of Water Rights is to achieve, in a reasonable period, tariffs which can more than cover the operation, maintenance and amortization cost, with the goal of re‐investing revenues to extend water services to the sectors that still do not have them.
5.2.3 Water Subsidies Since 1989 water tariffs have risen substantially – rate structures were raised an average 316% in that year alone. These increases generated more efficient water use, as well as capital for the water sector.Between 1990 and 1996 government water subsidies and tariff deficits had gone down to 15% and 13%, respectively, from 35% and 26%. By 1996, 372 water user associations had been formed to control water delivery to 2.92 million hectares. During this time water prices increased by 45–180% and government O&M subsidies had been removed. There are those who claim that O&M charges have been quite low (equivalent to 2‐7% of the gross product), and that maintenance may be suboptimal in many cases (Garrido and Calatrava, 2010: 37). On their own, the water price increases are manageable for Mexican users, largely because water fees were so low (in absolute terms) at the beginning of the reform program. However, water pricing must be done within a broader development context, one that reflects the full spectrum of changes that impact water users within the economy because although water tends to represent a small fraction of total production costs, when combined with dramatic increases in the costs other inputs they can create insurmountable financial problems for many water users.
The Mexican case seems to suggest that devolving responsibility for water management to user associations has great benefits for the water users which translate to benefits for the broader economy. What is worth pointing out is the fact that Mexican WUA’s did not pay any capital costs, which would have gone a long way in freeing up much needed cash reserves for the development of their businesses.
Review of Pricing Strategies 2012 5.3 Tanzania
5.3.1 Introduction Tanzania is an agrarian country where agriculture constitutes the primary economic mainstay. Agriculture contributes 48% to the gross national product (GNP). Physical water resources are relatively abundant in the coastal and highland areas, which receive well over 1000 mm of rainfall/year, but most parts of the drier interior receive less than 600 mm per annum. An estimated 50% of all annual surface runoff flows into the Indian Ocean and the large lakes. However, temporal and spatial variability in rainfall and surface flows is high. Yet, Tanzania’s level of infrastructural development to harness water and to mitigate nature’s variability is still very low, primarily because of the lack of financial, technical and institutional resources to bridge the infrastructural gap.
The Tanzanian government, advised by the World Bank, abandoned its agenda of water development in the early 1990s. Justified by basin‐specific, localised conflicts over water in the dry season, a water regulation agenda was introduced that put water scarcity and conservation nationwide at the centre stage.
5.3.2 Transforming Water in Tanzania The priority in Tanzania’s National Water Policy of 1991 was to further develop water resources for domestic and productive uses nationwide to boost socio‐economic development. However, this changed drastically in the mid‐1990s, when the Tanzanian government amended the national water rights system and, anticipating a redrafting of the entire water law, started implementing pilot experiments of this system in the Rufiji and Pangani basins.
The new water administration that was put in place to give effect to the regulation agenda was grafted upon the formal legal framework that was inherited from the colonial powers since 1923. The system of water rights and fees designed in the 1990s and implemented in the pilot World Bank‐funded RBM project builds on three key aspects of the formal water law and institutions introduced to Tanzania by German and British colonial settlers in the early and mid‐1900s.
1. the government owns the nation’s water resources and has the right to charge its citizens for the use of that resource.
2. water management has ever since been implemented by highly centralised water authorities.
3. the core of the administrative water rights system through which government seeks to manage water has hardly changed either since the early 20th century.
However, up till 1994, the administrative system of water rights remained rather dormant, and reached only few formal, large‐scale users.In this new policy and law, the government also started advocating stronger user participation in the river basin Water Boards, which were fully governmental up to the mid‐1990s. It further strengthened the establishment of Water User Associations (WUAs) at the lowest tiers, which were expected to manage water for multiple uses at village and ward level and were to be represented at higher levels, up to the basin level.
The revival of that system, expansion of its implementation nationwide to also include the informal rural majority, and the drastic increase of the fees to obtain water rights were to generate revenue and self‐finance government and the expanding basin management institutions and activities.
Review of Pricing Strategies 2012 Payment and valuing water as an economic good were put forward as effective ways to stimulate water conservation and saving. The amendment increased fees charged for the mere use of water, in addition to the fees users paid for service delivery through public infrastructure construction, operation and maintenance. The twofold aim of this new fee was cost recovery for basin‐level water management services and fostering the wise use of what was seen as a scarce ‘economic’ resource.
The first results of implementation in the early 2000s appeared disappointing, at least among small‐scale informal users, who constitute the large majority of water users in Tanzania. In the Upper Ruaha catchment, neither of the two goals of cost recovery for water management services by the government nor wiser water use to solve the water‐scarcity problem has been achieved, at least among the majority of small‐scale users. In contrast, fee payment by the few large users did contribute to achieving the goal of cost recovery for basin management.
5.3.3 Recovering Water Development Costs Before the 1990s no‐one had ever thought of using the system for charging volume‐based fees. Insurmountable problems arose as soon as this administrative system became the foundation for volume based blanket tariff setting and fee collection to finance the government’s water management services. First, the lack of objective and transparent procedures incorporates ‘subjectivity by design’ into the new system of water rights and fees in at least four ways:
1. in rate setting; 2. enforcement of fee payment; 3. handling of public funds; and 4. in discouraging genuine organisation of water users.
Second, among small users, the system appeared to drain public funds, instead of generating funds. Third, it met with fierce protest on the ground.
The new fees system concerns anyone who diverts and abstracts even the smallest quantities of surface and groundwater for productive uses and also includes all water users who invest privately in water infrastructure. In state‐supported irrigation schemes, the fee is additional to the partial or full cost recovery of infrastructural construction, operation and maintenance – the latter type of fee is not further addressed in this section. Related to this fee payment is that all water users or groups are obliged to register with the Ministry of Water and Livestock Development to obtain a ‘water right’. This is a certificate indicating the purpose and an annual volume of water resources to which the right holder is entitled. Water users have to pay an application fee at the moment of registration of the water right equivalent to US$40 plus an annual ‘economic water user fee’, proportionate to the volume allocated and depending upon the purpose of the water use. The minimum flat rate for uses up to 3.7 l/s for the annual economic water fee is US$35.
The expectations of the RBM project and the National Water Policy of 2002 that an administrative water rights and fees system would, by itself, serve as a tool to allocate water and mitigate conflicts and ‘be in a position to control withdrawals of surface and groundwater by issuing and revoking water rights’ (World Bank, 1996) were high. While the registration and taxation component of the new water rights system worked at best partly, issuing water rights and making people pay for water failed completely as a water allocation tool, and even aggravated downstream water scarcity.
Review of Pricing Strategies 2012 Lack of water measuring and control devices that prevented Water Officers from effectively controlling access to water and the lack of implementation capacity to enforce state authority undermined the obligatory registration and fee payment. These implementation weaknesses are the Achilles heel for any water rights system that solely depends on the government’s authoritative and practical ability to curtail water use.
5.4 Turkey The analysis of water pricing in Turkey mainly focuses on the agricultural sector. This is because the sector plays such a significant role in water consumption in the country that understanding the mechanisms employed to this end give a widely applied view of water pricing in Turkey. The agricultural sector is the major consumer of water in the country and will continue to be so, for many years to come.
5.4.1 Water and Irrigation Management in Turkey Irrigation development in Turkey is carried out by the public sector, represented by DSI (State Hydraulic Works) and GDRS (General Directorate of Rural Services), and by the private sector (farmers and groups of farmers). DSI under the Ministry of Energy and Natural Resources (MENR), is a governmental organisation which is responsible for almost all aspects of water resources development of Turkey They are responsible for the construction of protective structures against floods and torrents, irrigation and surface drainage systems, big dams and hydroelectric power generation plants. They also have the responsibility to operate and maintain dams, irrigation and drainage systems, to supply water for drinking, domestic and industrial purposes for the cities with population larger than 100 000, to investigate, search and develop surface and ground water resources. The responsibility for on‐farm development and minor irrigation works belongs to the General Directorate of Rural Services, under the Prime Ministry.
Since 1954 Turkey has had a legal framework allowing the transfer of management responsibility for publicly constructed irrigation schemes to local authorities and water unions. The law allows District Councils or municipalities (public corporate bodies) to form higher‐level corporate bodies (unions) for management of jointly‐utilised infrastructure such as roads or water supply.
5.4.2 Water Pricing in Turkey The issue of water pricing has to be approached differently for schemes operated by government and those operated by Irrigation Unions.
Article 26 of DSI law states the following, “All expenditures done to operate the schemes are paid by the beneficiaries themselves (except the flood protection facilities, reclamation facilities and the facilities which make navigation convenient)”. DSI does not sell the water to users with a price determined by full cost calculations, but recovers the costs of water transmission from the source to the field. The two main inputs in the preparation of water tariffs for irrigation management by General Directorate of DSI are O&M expenditures and estimated irrigable areas.
Operation and Maintenance expenditures are those that have to be incurred for operating the schemes and keeping them ready for the service (providing sustainability). Operation Costs include personnel, vehicles and energy‐oil expenditures. Other costs include telephone, electricity, water, heating and rent. The O&M charge is obtained by dividing the total expenditure of the last year by irrigated area. Maintenance Costs are the annual or periodical expenditures made for sustaining
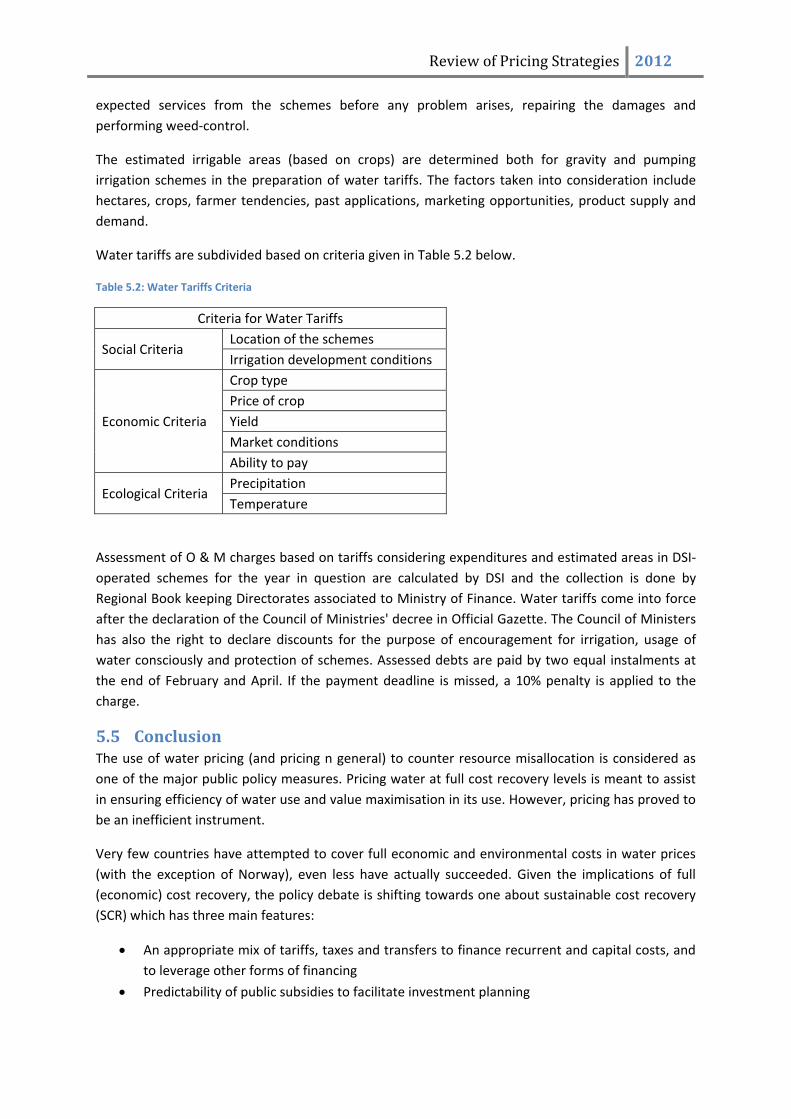
Review of Pricing Strategies 2012 expected services from the schemes before any problem arises, repairing the damages and performing weed‐control.
The estimated irrigable areas (based on crops) are determined both for gravity and pumping irrigation schemes in the preparation of water tariffs. The factors taken into consideration include hectares, crops, farmer tendencies, past applications, marketing opportunities, product supply and demand.
Water tariffs are subdivided based on criteria given in Table 5.2 below.
Table 5.2: Water Tariffs Criteria
Criteria for Water Tariffs
Social Criteria Location of the schemes Irrigation development conditions
Economic Criteria
Crop type Price of crop Yield Market conditions Ability to pay
Ecological Criteria Precipitation Temperature
Assessment of O & M charges based on tariffs considering expenditures and estimated areas in DSI‐operated schemes for the year in question are calculated by DSI and the collection is done by Regional Book keeping Directorates associated to Ministry of Finance. Water tariffs come into force after the declaration of the Council of Ministries' decree in Official Gazette. The Council of Ministers has also the right to declare discounts for the purpose of encouragement for irrigation, usage of water consciously and protection of schemes. Assessed debts are paid by two equal instalments at the end of February and April. If the payment deadline is missed, a 10% penalty is applied to the charge.
5.5 Conclusion The use of water pricing (and pricing n general) to counter resource misallocation is considered as one of the major public policy measures. Pricing water at full cost recovery levels is meant to assist in ensuring efficiency of water use and value maximisation in its use. However, pricing has proved to be an inefficient instrument.
Very few countries have attempted to cover full economic and environmental costs in water prices (with the exception of Norway), even less have actually succeeded. Given the implications of full (economic) cost recovery, the policy debate is shifting towards one about sustainable cost recovery (SCR) which has three main features:
• An appropriate mix of tariffs, taxes and transfers to finance recurrent and capital costs, and to leverage other forms of financing
• Predictability of public subsidies to facilitate investment planning

Review of Pricing Strategies 2012
• Tariff policies that are affordable to all, including the poorest, while ensuring the financial sustainability of service providers
This debate is a more development focused debate that doesn’t burden users who cannot afford high prices while guaranteeing their water supply, and ensuring that a sustainable level of cost recovery occurs.
Review of Pricing Strategies 2012
6 Observations and Conclusions Water resources management is complex. Across the world there are varying approaches that have been adopted, and in some cases adapted in an attempt to resolve water challenges. The types of challenges encountered tend to vary by country depending on the history and socio‐economic realities of the country in question. The raw water pricing strategy in South Africa, must, in its development account for all the various challenges that need to be addressed in the water sector in the country: inequality, poverty, food security, economic growth, unemployment, water scarcity, increasing water pollution and habitat destruction, and an ever changing institutional landscape.
6.1 Lessons from the International Review Across the international water sector, the experiences are varied. There is a lot of good theory, but not a tremendous amount of good practice in implementing it:
• The approaches and mechanisms used to finance and “price” water are closely related to the political economy of a country as well as to its stage of development.
developed economies attempt to drive philosophically towards economic decision making and full cost recovery (although many do not achieve this due to political imperatives); whereas
developing economies attempt to finance infrastructure on budget (or through transfers from donors) with significant implicit subsidies for users, often based on national political imperatives around economic development and livelihoods.
• While the concept of full cost recovery is globally endorsed, there is no clear international practice on what this means for water (even in developed countries), particularly in terms of:
the water resources management costs (administration‐governance), which are viewed as both a strategic (national) function and an operational (local) function; and
the capital portion of the infrastructure, which is viewed as an investment in local economic development with secondary economic benefits beyond the user.
• There is little consistency in the institutional arrangements relevant to water resources or infrastructure management.
6.2 Country Specific Observations In a number of the countries surveyed for the purposes of this review, some interesting experiences worth noting have been compiled. Some of these experiences are listed below.
• In Chile, none‐use fees are levied once a water right is found to be unused, these are escalating fees.
A combination of non‐use fees and the power to revoke unused water rights could enable water authorities to execute water use reform that could lead to a more equitable distribution of water to both current and formerly disadvantaged water users.
• In China safeguards for the poor are built into their water policy which may make price reforms aimed at improving the quality of water services may in fact be a win‐win solution.

Review of Pricing Strategies 2012
The measures employed to protect the poor from rising water prices have been grouped into two categories by a 2003 OECD report: income support measures and tariff‐related measures.
Income support measures comprise those which address the individual consumer’s affordability problem from the income side, such as water bill reductions or waivers, water service vouchers from the governments, capped tariff rebates and discounts, and payment assistance.
Tariff‐related measures, normally developed and implemented by governments in their financing role or by the water utility itself, include increasing block rates, capping metered tariffs, special tariffs for low income consumers, subsidized connections to the network etc.
• Any attempt to create a market for water rights so that water resources can eventually be allocated to their most valued use must take into account all the country specific challenges that can increase transaction costs and distort the envisioned free market from operating as it should.
These challenges include inequality, water infrastructure, geography, users’ willing and ability to pay, as well as the institutional alignment of the water sector in the country among other factors. Competitive markets are difficult to create in sectors requiring larger scale operations as the water sector does.
6.2.1 Australian Water Management Principles Australia has been subject to fundamental reforms to the institutional arrangements for water supply and water pricing since 1994. It has meant that while individual States have (generally) remained responsible for management of their own water resources, the water management principles applied across the country have been the same. These have included:
• The development of water resource plans, underpinned by robust science and hydrology modelling, as the basis for allocation decisions;
• The recognition of the need for water for environmental purposes;
• Separation of regulatory and operational functions in institutional arrangements;
• Granting secure entitlements to water, where possible to the end‐user;
• Allowing for trading of those entitlements between users; and
• Cost reflective pricing of water supply
Australia has opted to go with a more market based approach to water pricing, leaving the payment of cost of water development and supply to the end user.
6.3 Observations on the South African Experience The following discussion attempts to synthesise the important considerations, issues and challenges that should be reflected upon in developing the raw water pricing strategy in South Africa.
• It is critical to recognise that the climate and hydrology in South Africa is quite varied, ranging from winter rainfall in the south west, arid conditions in the centre, highly variable conditions in the south coast, through to summer rainfall in the eastern parts of the country. This significantly influences how water can and should be allocated. Given that South Africa
Review of Pricing Strategies 2012
is a water scarce nation, the resource must be allocated in a manner that best propels its development and benefits the majority of its population.
• Due to the fact that in many parts of the country water supply is provided from infrastructure that supports irrigation, urban, industrial (manufacturing, mining & power) and rural‐domestic demands, these users are in competition with each other over limited water resources.
• Historical political imperatives and inappropriate planning has also bequeathed South Africa with some infrastructure (mainly irrigation) that would not be supported on economic grounds and would not be rebuilt today. This sunk cost needs to be considered in understanding the asset value and its implications on water charges – specifically depreciation and ROA.
• Demands for land and water allocation reform require either a shift in allocation between users or expansion of water. Current (unofficial) policy implies that irrigation requirements for redress need to be obtained through reallocation or efficiency gains from existing irrigation without compensation. However, this also requires that limited allocations will be made from irrigation (about 60% of total water use in South Africa) to other urban or industrial users.
• The institutional arrangements for water resources management continue to be uncertain and uneven, which further complicates the development of coherent and consistent financing mechanisms.
• Finally, the application of key elements of the Pricing Strategy (past and current) is inconsistent across the country, and in many cases it relates more closely to a pragmatic reflection of the historical situation (and evolution) than to an application of the policy to current conditions.
The revision of the raw water pricing strategy must aim to, where possible, correct some of the historical wrongs while ensuring efficiency of water use and transparent cost recovery from users. Water pricing in South Africa must achieve what sometimes appears to be contracting objectives. However, the combination of the correct tools can lead to the achievement of all of the objectives.