review of ondex bernice rogowitz g2p visualization and visual analytics team march 18, 2010
TRANSCRIPT

Review of Ondex
Bernice RogowitzG2P Visualization and Visual Analytics Team
March 18, 2010

Ondex at a Glance
• Open source, Gnu Public Library License on SourceForge
• Large data sets (100,000’s of data objects)• Parsers for multiple inputs• Multiple data output formats• Generalized data structure to link different biological
networks
• Goal: Integrate, analyze and visualize data from heterogeneous sources
• Key focus: data that can be represented in graph form
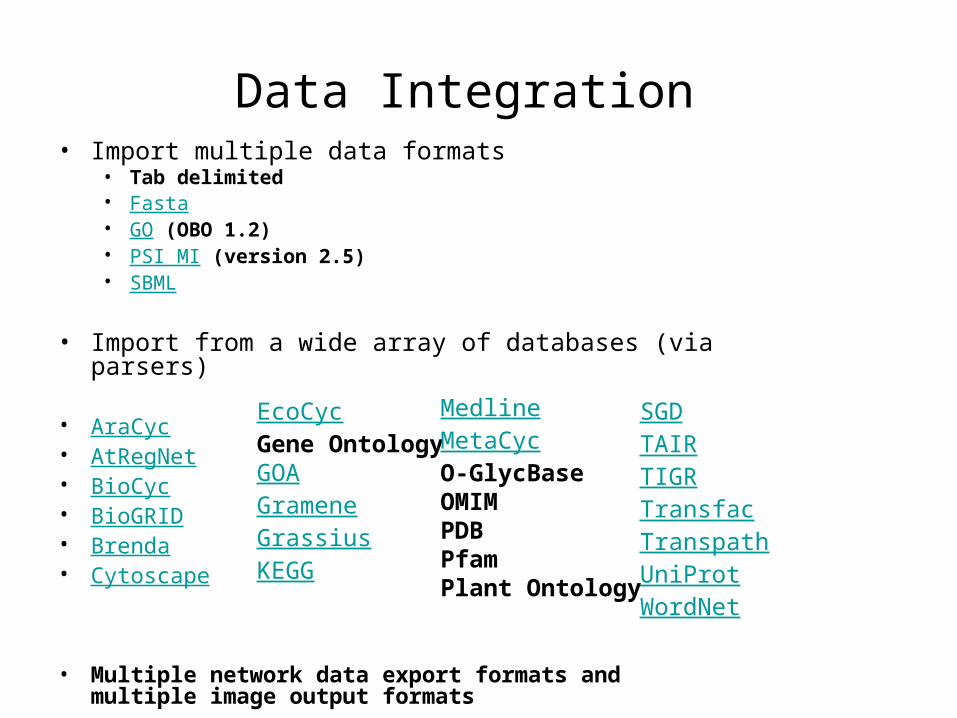
Data Integration • Import multiple data formats
• Tab delimited• Fasta • GO (OBO 1.2) • PSI MI (version 2.5) • SBML
• Import from a wide array of databases (via parsers)
• AraCyc • AtRegNet • BioCyc • BioGRID • Brenda • Cytoscape
• Multiple network data export formats and multiple image output formats
SGD TAIR TIGR Transfac Transpath UniProt WordNet
EcoCyc Gene OntologyGOA Gramene Grassius KEGG
Medline MetaCyc O-GlycBase OMIM PDB Pfam Plant Ontology

Graph Construction
Gene1 Gene 2 value = 1Gene 1 Gene 3 value = 4Gene 1 Gene 4 value= 5Gene 2 Gene 3 value = 1Gene 2 Gene 4 value = 2Gene 3 Gene 4 value = 5
G1 G2 G3 G4
G1 1 4 5
G2 1 2
G3 5
G4
Similarity matrix GraphTable of Tuples
•Nodes are data entities– genes, proteins, etc
•Edges show connectivity and degree of connection
•Metadata can enhance the graph
•Node size, node color
•Edge width, edge color
•Any data that can be expressed in this form can be represented as a graph

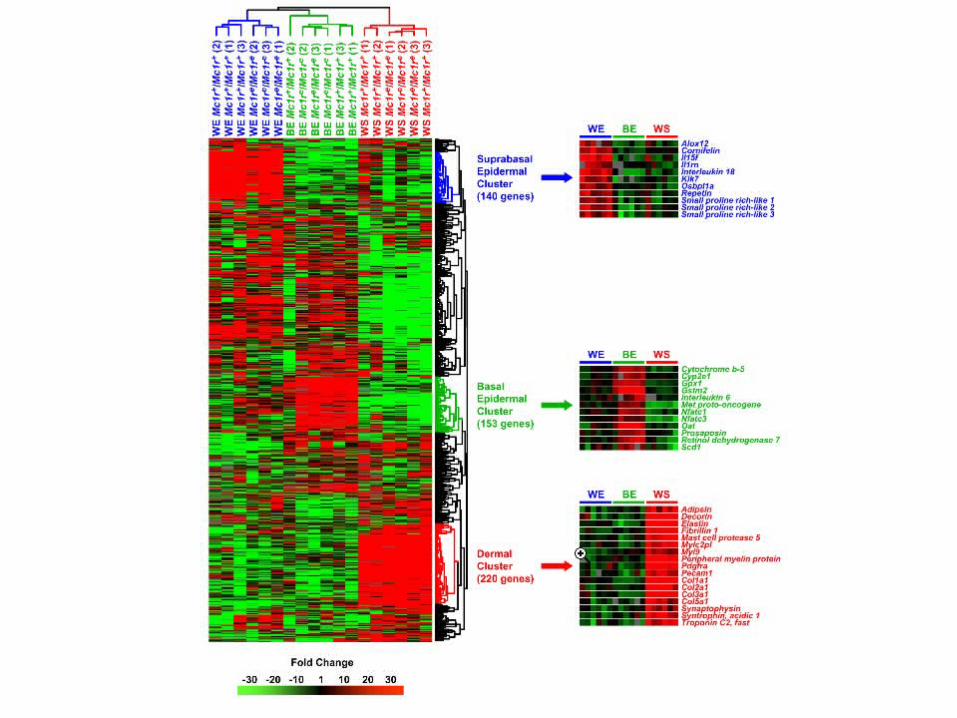
Gene Expression Array Data and its associated Graph (dendogram)
• Various metrics can be used, e.g. different statistical correlation measures, noise-reduced measures
• The graph is re-computed on each set of values in the similarity table

Many Different Biological Networks
• Microarray expression level data – relationships between different genes being expressed
• Protein-protein interactions• Signal transduction networks• Metabolic pathways• Gene regulatory networks

Semantics for Graph Based Representations
• Protein Interaction database– Proteins as nodes, interactions as edges
• Metabolic network– Metabolites, enzymes and reactions as different types of nodes,
connected by directed edges
• Semantics– does a node represent a protein or a metabolite? Does the edge mean “binds to” “produced by” or consumed by?
• ONDEX Approach- define typed nodes as “concepts “ and edges as semantically well-defined relations
• Generic graph-based representation of different types of biological data, resulting in ontologies.
• Data and metadata imported in a way that fits into the graph template through various parsers

Generalized data structure in ONDEX
Ondex “Special Sauce”
• Data schema that combines graph-based methods and generalized data structure(GDS), making use of ontologies and metadata.
• Core idea: store biological networks as graphs; use GDS to store related information (metadata)

Example: Nitrogen uptake in Arabidopsis
• Protein-protein interaction (TAIR) combined with co-expression data (ATTEDII)
• Clusters of nodes show interaction

Example: Drought stress in three cultivars of durum wheat over time
• Metabolic pathways and functional protein annotations
• Identification of functional orthologs to genes on Affymetrix chip
• Enzymes are significantly up or down regulated within Jasmonic acid biosynthesis pathway after 3 days of stress.
Key:•Squares: target sequences, size proportional to expression•Red- up-regulation•Green- down regulation
•Blue squares: ortholog proteins•Blue circles reactions•Pink squares- pathways

References
• www.ondex.org• Jacob Köhler et al., Graph-based analysis and
visualization of experimental results with Ondex, Bioinformatics 22(11), 2006.
• Köhler et al .,Linking experimental results, biological networks and sequence analysis methods using Ontologies and Generalised Data Structures Ontoogy Workshop, Gottingen, 2004