review of new data from the 2008-2010 american community survey on rates of insurance for alaska...
TRANSCRIPT
Health Care Reform: Measuring its impact on American Indians & Alaska Natives in Oregon and Washington
Comparison of Areas with large Indian reservations
to State-wide RatesMarch 14, 2012
Review of New Data from the 2008-2010 American Community Survey on rates of insurance for
Alaska Natives and American Indians

2010 Census is official census:
WA 198,998 AIAN alone and in combination OR 109,223 alone and in combination
2010 ACS estimates: 192,000 estimate by ACS for Washington 2010 Roughly 80,000 live on or near reservations 105,000 estimate by ACS for Oregon 2010
About 40,000 live on or near reservations Little is known about variations in health
insurance status between reservation areas and urban areas.
Comparing Eastern OR Eastern WA to statewide insurance status
Census: Decennial and Annual American Community Survey
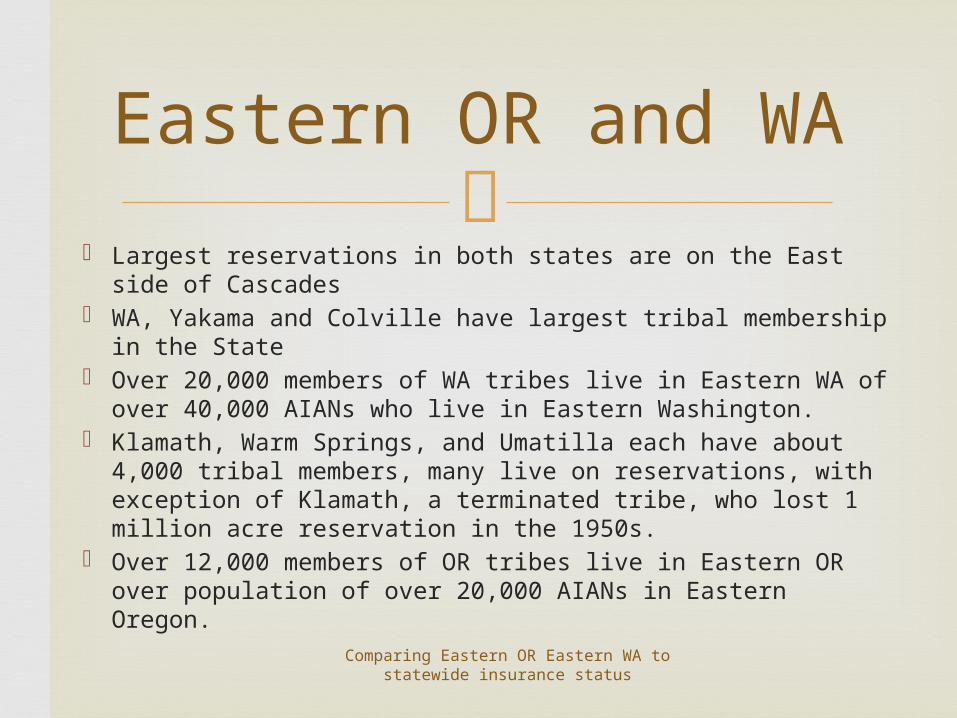
Largest reservations in both states are on the East side of
Cascades WA, Yakama and Colville have largest tribal membership in
the State Over 20,000 members of WA tribes live in Eastern WA of
over 40,000 AIANs who live in Eastern Washington. Klamath, Warm Springs, and Umatilla each have about
4,000 tribal members, many live on reservations, with exception of Klamath, a terminated tribe, who lost 1 million acre reservation in the 1950s.
Over 12,000 members of OR tribes live in Eastern OR over population of over 20,000 AIANs in Eastern Oregon.
Comparing Eastern OR Eastern WA to statewide insurance status
Eastern OR and WA
Comparing Eastern OR Eastern WA to statewide insurance status
PRIVATE
MEDICARE
MEDICAID
IHS
Uninsured
5% 15% 25% 35% 45% 55%PRIVATE MEDICARE MEDICAID IHS Uninsured
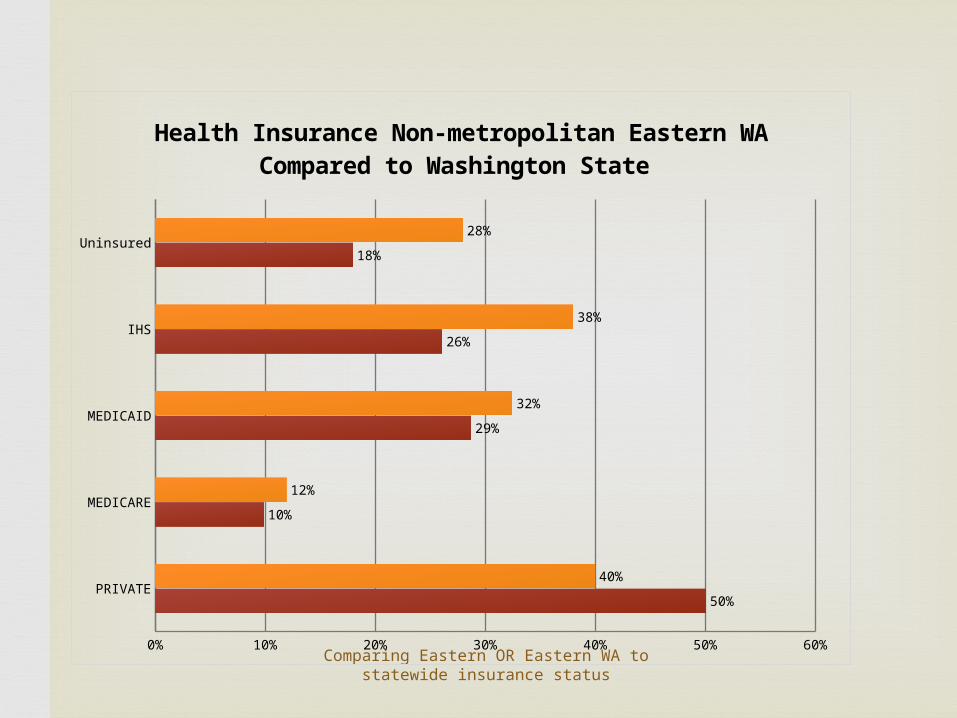
Washington 50% 10% 29% 26% 18%
E Washington 40% 12% 32% 38% 28%
50%
10%
29%
26%
18%
40%
12%
32%
38%
28%
Health Insurance Non-metropolitan Eastern WA Compared to Washington State

Comparing Eastern OR Eastern WA to statewide insurance status
12 % difference in Access to IHS
Washington E Washington
IHS 26% 38%
3%
8%
13%
18%
23%
28%
33%
38%
26%
38%IHS
Axis Title
Comparing Eastern OR Eastern WA to statewide insurance status
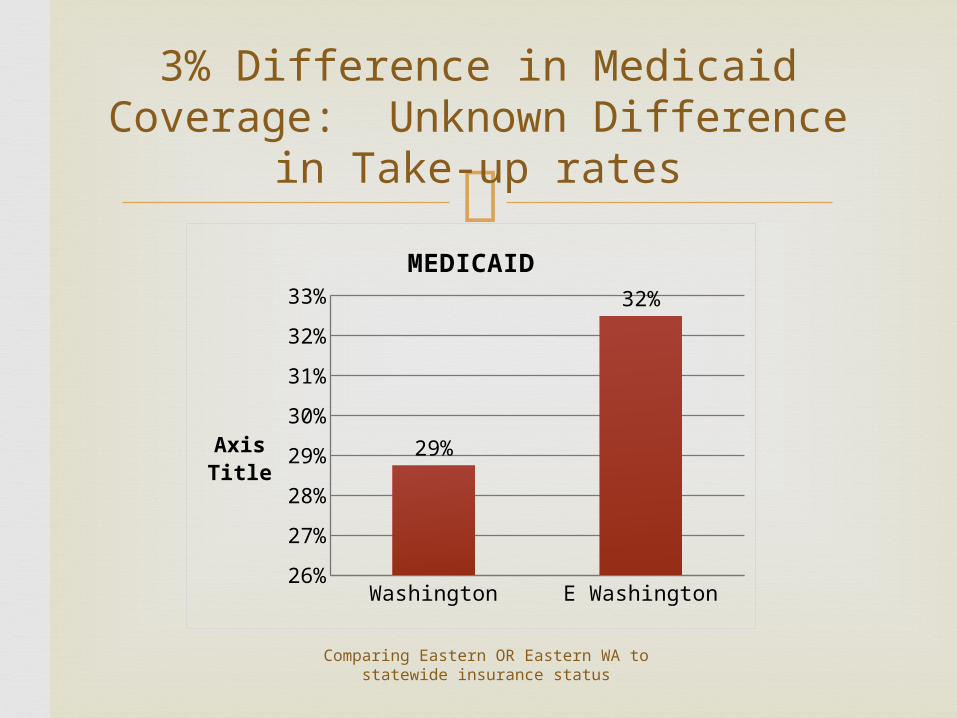
3% Difference in Medicaid Coverage: Unknown Difference in Take-up
rates
Washington E Washington
MEDIC-AID
29% 32%
27%28%29%30%31%32%33%
29%
32%MEDICAID
Axis Title
Comparing Eastern OR Eastern WA to statewide insurance status
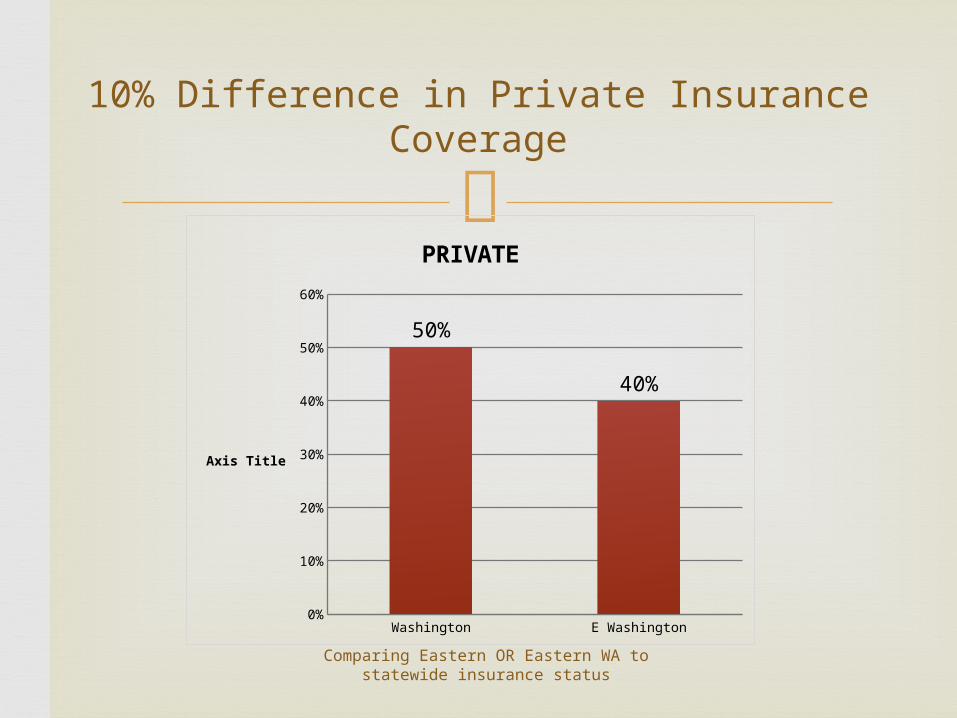
10% Difference in Private Insurance Coverage
Washington E Washington
PRI-VATE
50% 40%
5%
15%
25%
35%
45%
55% 50%
40%
PRIVATE
Axis Title
Comparing Eastern OR Eastern WA to statewide insurance status
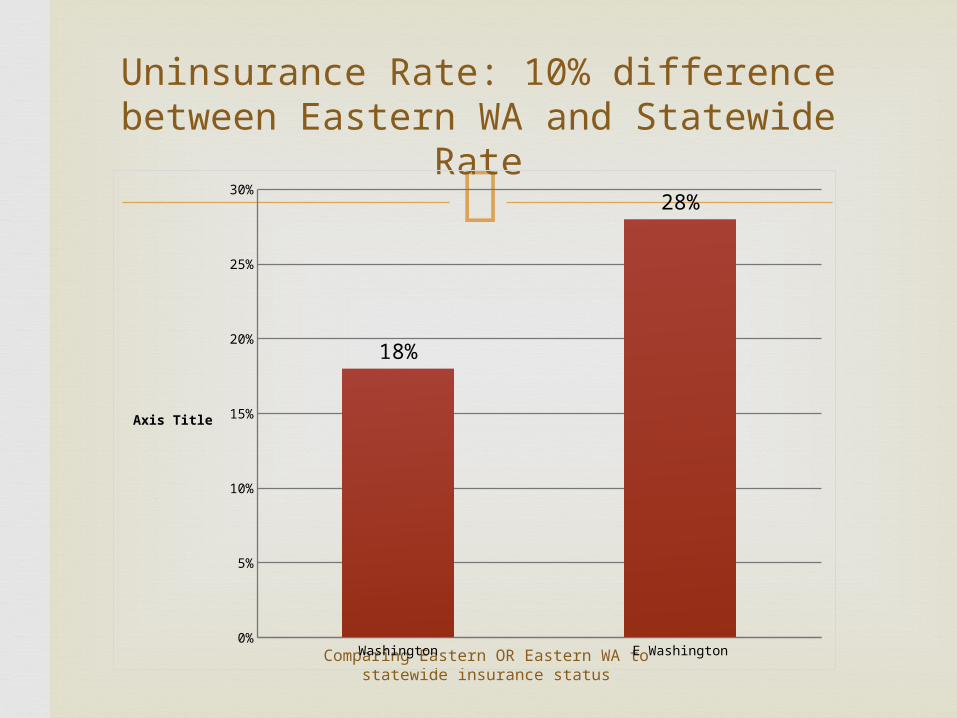
Uninsurance Rate: 10% difference between Eastern WA and Statewide Rate
Washington E Washington
Uninsured 18% 28%
3%
8%
13%
18%
23%
28%
18%
28%
Axis Title

Comparing Eastern OR Eastern WA to statewide insurance status
PRIVATE
MEDICARE
MEDICAID
IHS
Uninsured
5% 15% 25% 35% 45% 55%PRIVATE MEDICARE MEDICAID IHS Uninsured
Oregon 48% 9% 26% 20% 27%
E Oregon 43% 10% 29% 42% 29%
48%
9%
26%
20%
27%
43%
10%
29%
42%
29%
Comparing Health Insurance Status in Eastern OR to Oregon State-wide

Comparing Eastern OR Eastern WA to statewide insurance status
22% difference in access to IHS services: 42% in Eastern Oregon
OREGON E OREGON
IHS 20% 42%
3%
8%
13%
18%
23%
28%
33%
38%
43%
20%
42%
IHS
Axis Title
Comparing Eastern OR Eastern WA to statewide insurance status
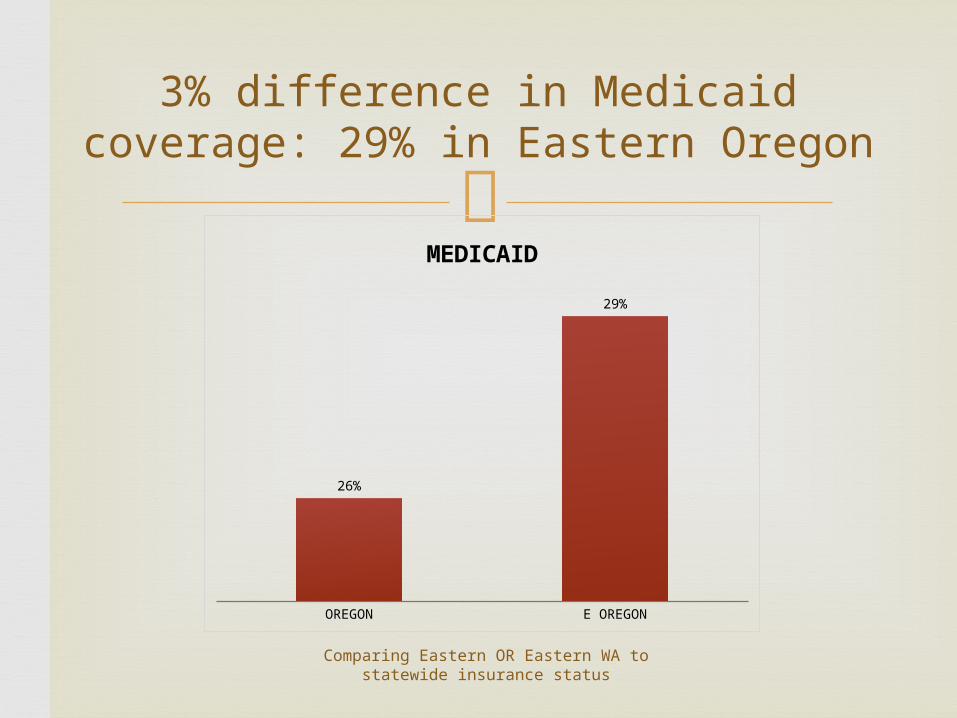
3% difference in Medicaid coverage: 29% in Eastern Oregon
OREGON E OREGON
26%
28%
MEDICAID
Comparing Eastern OR Eastern WA to statewide insurance status
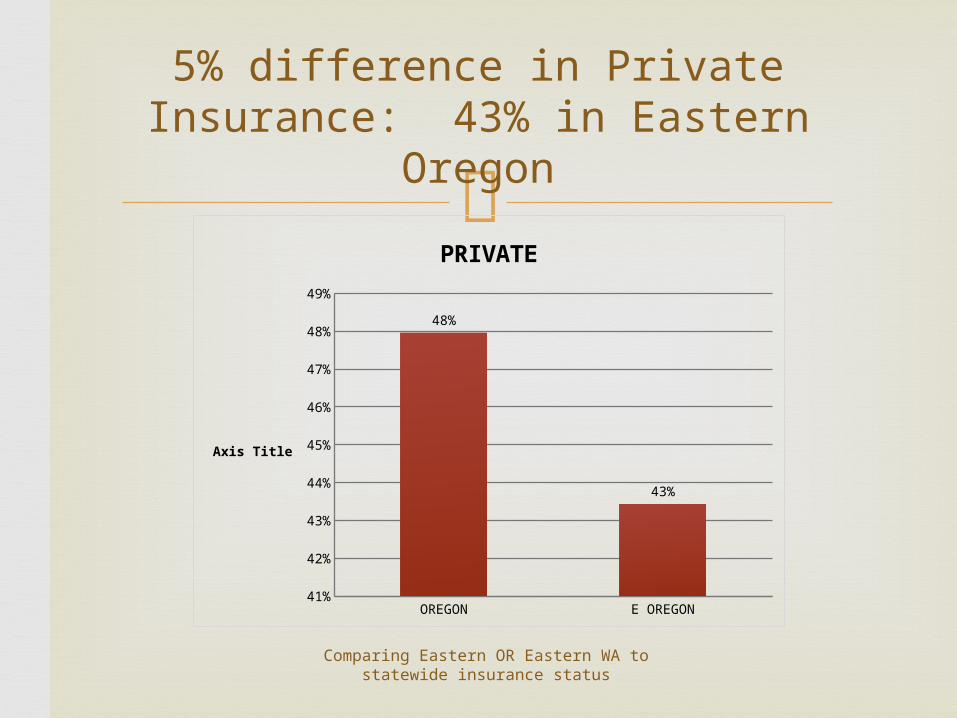
5% difference in Private Insurance: 43% in Eastern Oregon
OREGON E OREGON
PRIVATE 48% 43%
42%
43%
44%
45%
46%
47%
48%
49%48%
43%
PRIVATE
Axis Title
Comparing Eastern OR Eastern WA to statewide insurance status
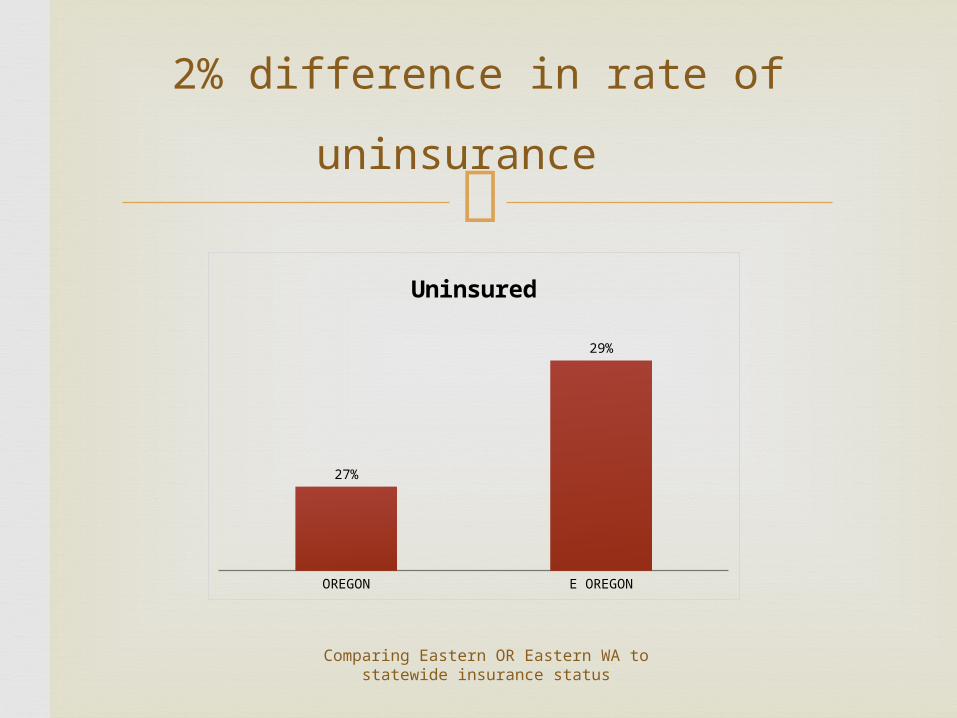
2% difference in rate of uninsurance
OREGON E OREGON
27%
28%
Uninsured
Comparing Eastern OR Eastern WA to statewide insurance status
PRIVATE
MEDICARE
MEDICAID
IHS
Uninsured
5% 15% 25% 35% 45% 55%PRIVATE MEDICARE MEDICAID IHS Uninsured
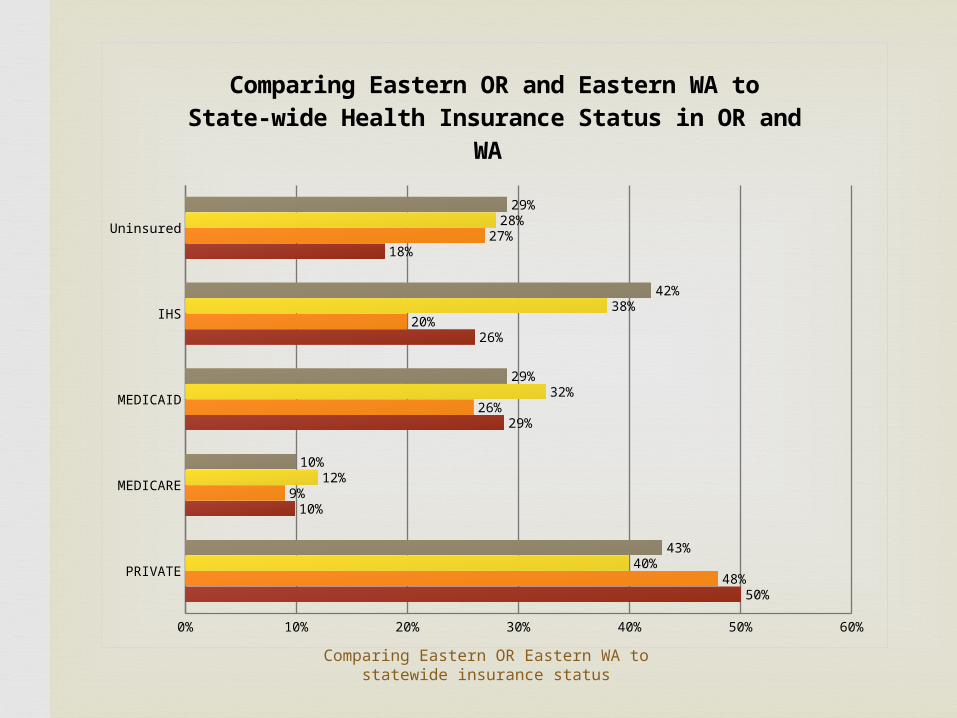
Washington 50% 10% 29% 26% 18%
Oregon 48% 9% 26% 20% 27%
E Washington 40% 12% 32% 38% 28%
E Oregon 43% 10% 29% 42% 29%
50%
10%
29%
26%
18%
48%
9%
26%
20%
27%
40%
12%
32%
38%
28%
43%
10%
29%
42%
29%
Comparing Eastern OR and Eastern WA to State-wide Health Insurance Status in OR and
WA

Comparing Eastern OR Eastern WA to statewide insurance status
The impact of Health Care Reform On or Near Oregon’s and Washington’s Indian Reservations1. Great variation between State-wide and Eastern areas2. Uninsured and IHS access vary widely, but Medicaid
keeps rates lower in areas with lower private insurance 3. Medicaid high (and similar to statewide) in all areas,
but may have lower take up rates given poverty rates4. IHS access higher in rural areas near reservations.5. Private insurance low in eastern parts of both states.6. Outreach and education should consider differences.
Overall Assessment: Variation Across OR and WA
Comparing Eastern OR Eastern WA to statewide insurance status
U.S. Census Bureau. American Community
Survey (ACS) 2008,2009, 2010, 3 year 2008-2010. American Community Survey accessed through Factfinder2 for 3 year reports for years 2008, 2009, 2010
References

Comparing Eastern OR Eastern WA to statewide insurance status
ACS question on insurance coverage
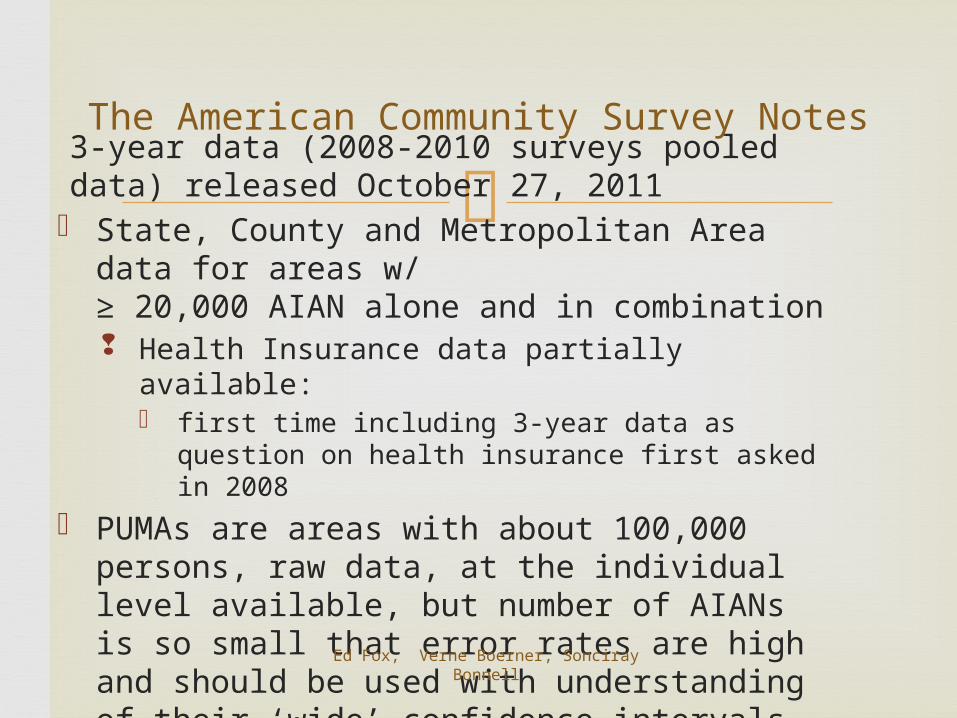
Ed Fox, Verne Boerner, Sonciray Bonnell
3-year data (2008-2010 surveys pooled data) released October 27, 2011
State, County and Metropolitan Area data for areas w/≥ 20,000 AIAN alone and in combination Health Insurance data partially available:
first time including 3-year data as question on health insurance first asked in 2008
PUMAs are areas with about 100,000 persons, raw data, at the individual level available, but number of AIANs is so small that error rates are high and should be used with understanding of their ‘wide’ confidence intervals.
The American Community Survey Notes
Comparing Eastern OR Eastern WA to statewide insurance status
Oregon
Includes all PUMAs east of the Cascades
Washington Includes all PUMAs except those for City of Spokane,
Spokane Valley and rest of Spokane County That is it includes all counties East of the Cascades
except Spokane County.
Spokane county has more AIANs from other states than the counties included in Eastern WA analysis presented here.
PUMAs in this presentation
Comparing Eastern OR Eastern WA to statewide insurance status
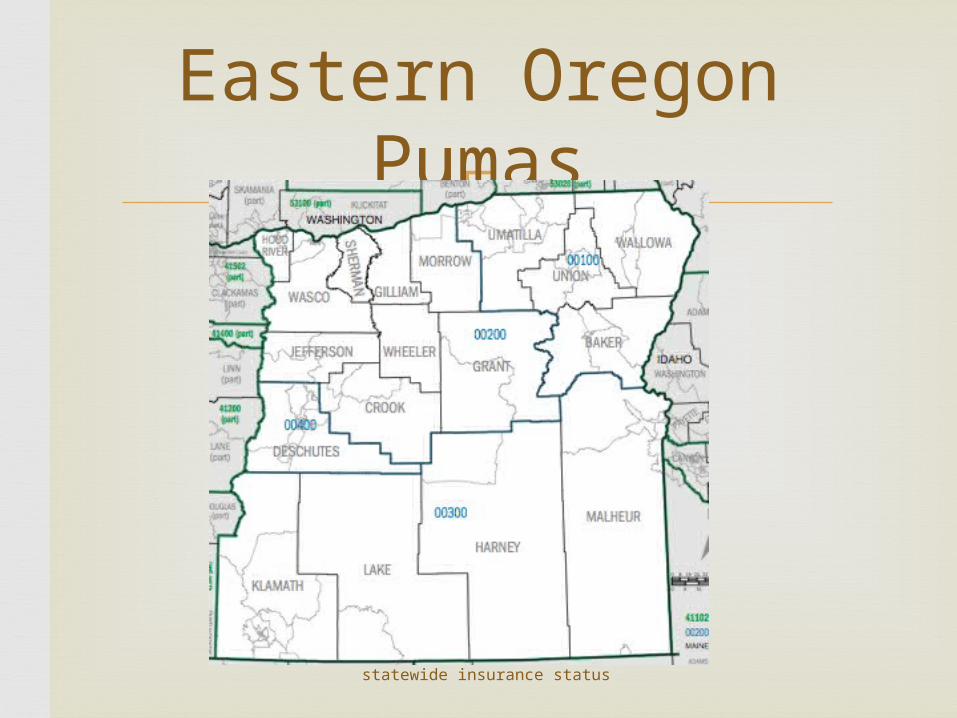
Eastern Oregon Pumas

Comparing Eastern OR Eastern WA to statewide insurance status
INDIAN RESERVATIONS WASHINGTON

Comparing Eastern OR Eastern WA to statewide insurance status

Comparing Eastern OR Eastern WA to statewide insurance status

Comparing Eastern OR Eastern WA to statewide insurance status