review of national and california benchmarking methods
TRANSCRIPT
Review of California and National Methods for Energy-Performance Benchmarking of Commercial
Buildings
Nance E. Matson and Mary Ann Piette Ernest Orlando Lawrence Berkeley National Laboratory
September 5th, 2005
LBNL No. 57364

DISCLAIMER
This document was prepared as an account of work sponsored by the United States Government. While this document is believed to contain correct information, neither the United States Government nor any agency thereof, nor The Regents of the University of California, nor any of their employees, makes any warranty, express or implied, or assumes any legal responsibility for the accuracy, completeness, or usefulness of any information, apparatus, product, or process disclosed, or represents that its use would not infringe privately owned rights. Reference herein to any specific commercial product, process, or service by its trade name, trademark, manufacturer, or otherwise, does not necessarily constitute or imply its endorsement, recommendation, or favoring by the United States Government or any agency thereof, or The Regents of the University of California. The views and opinions of authors expressed herein do not necessarily state or reflect those of the United States Government or any agency thereof or The Regents of the University of California.
This report was prepared as the result of work sponsored by the California Energy Commission. It does not necessarily represent the views of the Energy Commission, its employees or the State of California. The Energy Commission, the State of California, its employees, contracts and subcontractors make no warrant, express or implied, and assume no legal liability for the information in this report; nor does any party represent that the uses of this information will not infringe upon privately owned rights. This report has not been approved or disapproved by the California Energy Commission nor has the California Energy Commission passed upon the accuracy or adequacy of the information in this report.
Table of Contents
Executive Summary .........................................................................................................E-1
Findings.....................................................................................................................E-2 1. Introduction .................................................................................................................. 1 2. Energy Star and Cal-Arch Overview ........................................................................... 2
2.1. Model Data Sources............................................................................................ 3 2.2. Type of Statistical Models .................................................................................. 5 2.3. Model Inputs ....................................................................................................... 7 2.4. Normalization ................................................................................................... 11 2.5. Outputs.............................................................................................................. 12
3. Evaluation of Energy Star and Cal-Arch Models for California Buildings ............... 17 4. Summary .................................................................................................................... 21 5. Future Directions........................................................................................................ 23 6. Acknowledgements .................................................................................................... 23 7. References .................................................................................................................. 24 Appendix A: Analysis of Current EPA Energy Star Models – CEUS Data................... A-1 Appendix B: EPA Energy Star Model ............................................................................ B-1 Regression Equations and Input Requirements .............................................................. C-1
List of Tables 2-1 Summary of Energy Star and Cal-Arch Attributes .....................................................2 2-2 Energy Star and Cal-Arch Data Sources.....................................................................3 2-3 Required Information – Energy Star Models..............................................................9 2-4 Energy Star Model R2 .................................................................................................9 2-5 Building Type Correlation (Kinney and Piette 2003)...............................................11 3-1 Comparison of 2001 Energy Star Office Buildings to CBECS Office Buildings ...17 3-2 Summary Statistics – Energy Star Ratings of California CEUS Buildings ..............19 3-3 California Department of General Services Buildings – Energy Star Ratings .........20 A-1 Summary Statistics................................................................................................. A-1 A-2 Energy Star Model Building-specific Input Assumptions ..................................... A-4 A-3 School Energy Star Ratings (n=32) ....................................................................... A-7 A-4 Offices Energy Star Ratings (n=109)................................................................... A-11 A-5 Hotel Energy Star Ratings (n=19) ....................................................................... A-15 A-6 Medical Offices Energy Star Ratings (n=5)......................................................... A-17 A-7 Supermarket Energy Star Ratings (n=16) ............................................................ A-19 A-8 Warehouse Energy Star Ratings (n=44) .............................................................. A-21 B-1 Energy Star Building Characteristic Filters Applied to the Raw Data for
i
Use in the Regression Analysis...............................................................................B-7 C-1 Distribution of Default and Full Model Energy Star Ratings. Buildings with 75 and above can obtain and Energy Star Label..........................................................C-4 List of Figures 1-1 Steps in Benchmarking ...........................................................................................E-1 2-1 Cal-Arch Histogram....................................................................................................7 2-2 CEC California Climate Zones Mapped to Four Main Climate Zones ....................10 2-3 Energy Star Portfolio Manager – Building Input Screen..........................................12 2-4 Energy Star Portfolio Manager – My Portfolio Results Summary ...........................13 2-5 Cal-Arch Input Page .................................................................................................15 2-6 Cal-Arch Results Page .............................................................................................16 3-1 Heating Degree Days vs. Cooling Degree Days for CBECS Offices (Kinney and
Piette 2002) ..............................................................................................................18 3-2 CEUS Office Buildings – Energy Star Ratings (n=109) ..........................................19 3-3 Comparison between Energy Star Ratings (Full Model) and Whole Building Energy Use Intensity and Relative Cal-Arch Ranking California CEUS Office Buildings (n=109) .............................................................21 A-1 School Energy Star Ratings (n=32) ....................................................................... A-6 A-2 Schools – Comparison between Individual School Energy Star Ratings Using the
2002 and 2004 Models (n=32)............................................................................... A-7 A-3 2002 and 2004 School Energy Star Ratings (n=32) .............................................. A-8 A-4 Offices Energy Star Ratings (n=109)................................................................... A-10 A-5 Office Energy Star ratings – Current and Earlier Model (n=54) ......................... A-12 A-6 Comparison of Current (2004) and Earlier (2002) Office Energy Star Ratings (n=54) ...................................................................... A-12 A-7 Hotel Energy Star Ratings (n=19) ....................................................................... A-14 A-8 Medical Offices Energy Star Ratings (n=5)......................................................... A-16 A-9 Grocery Stores and Supermarket Energy Star Ratings (n=16) ............................ A-18 A-10 Warehouse Energy Star Ratings (n=44) .............................................................. A-20 C-1 Energy Star Ratings - Full Model vs. Model with Operating Characteristics
Defaults - California CEUS Office Buildings (n=109) ..........................................C-2 C-2 Change in Energy Star Rating if Building Occupancy Characteristic Defaults are Used - California CEUS Office Buildings (n=109) ..........................................C-3 C-3 Percent Change in Energy Star Rating if Building Occupancy Characteristic
Defaults are Used - California CEUS Office Buildings (n=109) ...........................C-3 C-4 Energy Star Rating Distributions - Full Model vs. Model Using Building
Occupancy Characteristics Defaults – California CEUS Office Buildings (n=109)....................................................................................................................C-4 C-5 Migration of Energy Star Ratings Between Quartiles When Using Building
Occupancy Characteristics Defaults instead of Full Model – California
ii

CEUS Office Buildings (n=109).............................................................................C-5 C-6 Comparison between Energy Star Ratings (Full Model) and Whole Building Energy Use Intensity and Relative Cal-Arch Ranking – California CEUS Office Buildings (n=109)........................................................................................C-6 C-7 Comparison between Energy Star Ratings Using Building Occupancy
Characteristics Defaults and Whole Building Energy Use Intensity and Relative Cal-Arch Ranking – California CEUS Office Buildings (n=109)............C-6
iii

iv
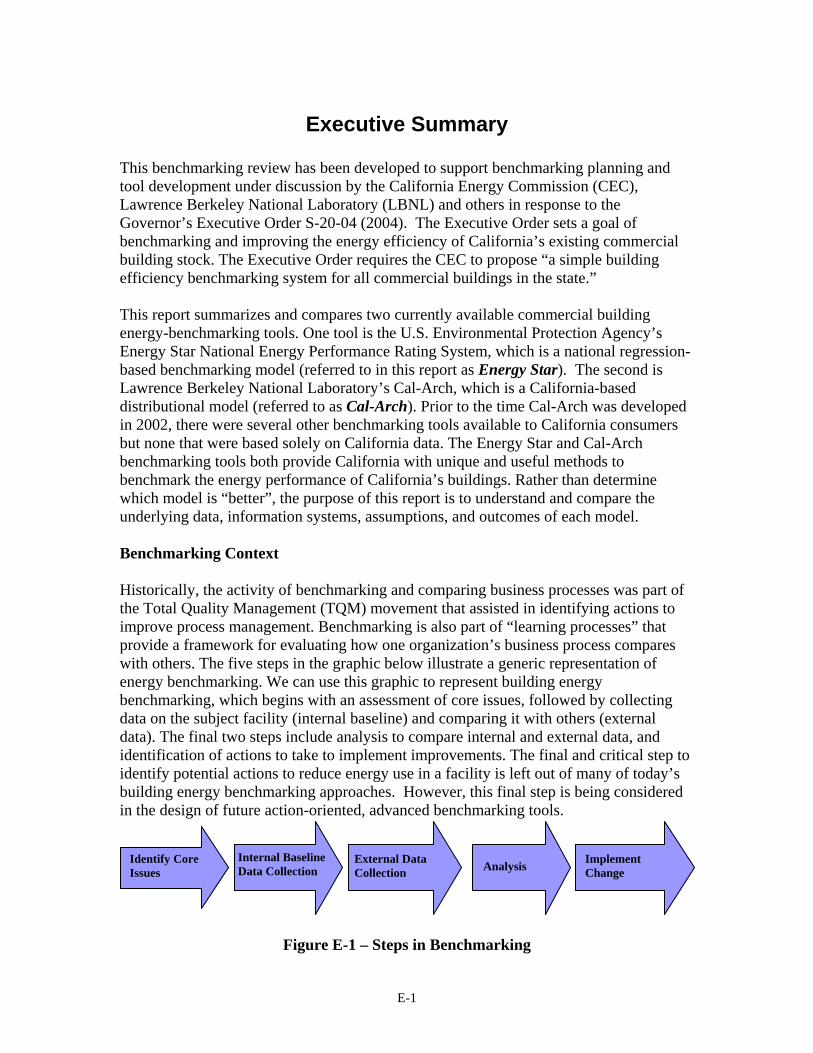
Executive Summary This benchmarking review has been developed to support benchmarking planning and tool development under discussion by the California Energy Commission (CEC), Lawrence Berkeley National Laboratory (LBNL) and others in response to the Governor’s Executive Order S-20-04 (2004). The Executive Order sets a goal of benchmarking and improving the energy efficiency of California’s existing commercial building stock. The Executive Order requires the CEC to propose “a simple building efficiency benchmarking system for all commercial buildings in the state.” This report summarizes and compares two currently available commercial building energy-benchmarking tools. One tool is the U.S. Environmental Protection Agency’s Energy Star National Energy Performance Rating System, which is a national regression-based benchmarking model (referred to in this report as Energy Star). The second is Lawrence Berkeley National Laboratory’s Cal-Arch, which is a California-based distributional model (referred to as Cal-Arch). Prior to the time Cal-Arch was developed in 2002, there were several other benchmarking tools available to California consumers but none that were based solely on California data. The Energy Star and Cal-Arch benchmarking tools both provide California with unique and useful methods to benchmark the energy performance of California’s buildings. Rather than determine which model is “better”, the purpose of this report is to understand and compare the underlying data, information systems, assumptions, and outcomes of each model. Benchmarking Context Historically, the activity of benchmarking and comparing business processes was part of the Total Quality Management (TQM) movement that assisted in identifying actions to improve process management. Benchmarking is also part of “learning processes” that provide a framework for evaluating how one organization’s business process compares with others. The five steps in the graphic below illustrate a generic representation of energy benchmarking. We can use this graphic to represent building energy benchmarking, which begins with an assessment of core issues, followed by collecting data on the subject facility (internal baseline) and comparing it with others (external data). The final two steps include analysis to compare internal and external data, and identification of actions to take to implement improvements. The final and critical step to identify potential actions to reduce energy use in a facility is left out of many of today’s building energy benchmarking approaches. However, this final step is being considered in the design of future action-oriented, advanced benchmarking tools.
Identify Core Issues
Internal Baseline Data Collection
External Data Collection Analysis Implement
Change
Figure E-1 – Steps in Benchmarking
E-1

Building Energy Benchmarking The purpose of whole-building energy benchmarking is to compare a given building’s energy performance to that of similar buildings. Whole-building energy benchmarking can help a building owner or operator determine how well their building is performing, compare their building’s energy consumption to that of similar buildings, track and set targets for improved performance, facilitate assessments of property values, and gain recognition for exemplary achievement. Energy Star and Cal-Arch provide a framework for evaluating building energy consumption and can lead to further exploration and implementation of energy efficiency improvements. Web-based benchmarking tools, such as Energy Star and Cal-Arch, allow for dissemination of building energy comparison data in ways that were not possible before the Internet. Correspondingly, benchmarking methods can also be used to evaluate the performance of building sub-systems and components. Model Summary The Energy Star model is a regression-based model, which includes building type, floor area, energy use and location inputs as well as occupancy-related factors such as number of occupants, operating hours and number of computers. Location is used to obtain weather data for use in the model. Energy Star is a national tool, based on building characteristic and energy use data from the DOE/EIA Commercial Building Energy Consumption (CBECS) survey. The Energy Star score (0-100) is an estimate of how many similar buildings nationwide have higher energy use intensities (EUIs) – an Energy Star score of 75 signifies that the building’s energy use intensity is better than 75% of similar buildings nationwide. The Cal-Arch model is a simplistic distributional model based on building type, floor area, energy use and location. Cal-Arch was designed as an initial simple tool, to provide a public view into the California Commercial End-Use Survey (CEUS) data. The tool is simple in design because the data from the Cal-Arch CEUS are limited – additional tool development was postponed in anticipation of the new more complete survey scheduled for completion in 2005. The current tool is easy to use, providing a relative ranking of a building’s energy use intensity (EUI) within the distribution of energy use intensity for the CEUS buildings in the Cal-Arch database. Cal-Arch graphically shows how a building’s energy use intensity fits within the distribution and reports the percent of buildings in the database that have lower EUIs. Findings Ease of Use. The Energy Star and Cal-Arch benchmarking models are both web-based tools. After specifying the necessary building and operational characteristics, users can get immediate feedback as to how their building compares to other similar buildings within California, using Cal-Arch, and nationwide, using Energy Star.
E-2
Key Differences. Cal-Arch is a California-based tool and has a building reference database consisting of California buildings. Energy Star is a national model, based on the national building stock. Cal-Arch requires minimal building characteristic data, while Energy Star requires additional occupancy-related characteristics. The Energy Star method weather normalizes the building energy consumption data for year-to-year variations and considers weather in comparison of EUIs. Cal-Arch allows the user to compare their building’s energy use intensity against similar buildings in similar climates – but does not use weather normalization for year-to-year variations. Accuracy. The two most important factors affecting the accuracy whole-building energy benchmarking results are building floor area and annual energy consumption values. Accuracy of these values is essential in calculating realistic Energy Star scores and in comparing the user’s building energy use intensities to that of similar buildings in Cal-Arch. Inaccurate building floor areas and/or incomplete energy consumption data can skew the calculated energy use intensity, and can result in an inaccurate comparison to other buildings. Correlation of Energy Star and Cal-Arch and Results to Building Energy Use Intensities. Of interest is how well the Energy Star rating and Cal-Arch rankings relate to each other, using building energy use intensity (EUI) as a common basis. For the 109 office buildings in the 1992 CEUS database, both Energy Star and Cal-Arch correlate well with EUI. The trends between the building EUIs and Relative Cal-Arch rankings (percent of buildings in the Cal-Arch database with higher EUIs) are consistent – as EUIs increase, the Relative Cal-Arch Ranking also increases. Similarly, as Energy Star Ratings decrease, the whole building EUIs increase. Applicability to California’s Commercial Building Stock. Both tools are well suited to serve as benchmarking tools for California’s commercial building stock. The Energy Star rating system is based on the assumption that 25% of the national building stock can achieve an Energy Star rating of 75 or higher – these buildings are eligible for an Energy Star label if the building also meets the indoor environment criteria. Our analysis of 224 California CEUS buildings shows that 42% of these California buildings can achieve an Energy Star rating of 75 or higher. This is much higher than the 25% expected for the national stock. Looking at the sub-set of CEUS office buildings in terms of EUI distributions, we found that an Energy Star rating of 75 translates into 45% of office buildings in Cal-Arch having higher EUIs – this correlates well with the fact that 43% of the 109 CEUS office buildings have Energy Star ratings of 75 or higher. Future Directions. The current tools (Energy Star and Cal-Arch) provide a good foundation for building energy benchmarking in California. The upcoming availability of new CEUS data will allow the updating and expansion of these tools to better model California’s building energy usage. Possible future directions include:
• Updating the simple California-based tool with new CEUS building energy data
E-3

• Developing a California-specific Energy Star-type model – based on the new CEUS data to provide better correlation to and comparison within California’s building stock.
• Action-oriented advanced benchmarking tools – action-oriented tools can provide initial feedback and recommendations as to which building systems or operational strategy improvements may reduce a building’s energy use. Incorporating these types of features into benchmarking tools may improve the value of benchmarking, help motivate building owners and operators to take action to reduce energy use, and expand the use of benchmarking in the marketplace.
• Integration of benchmarking tools into web-based energy information systems – prototypes have already been developed using the Cal-Arch and Energy Star benchmarking engines. Integrating benchmarking with tools that the building industry depends upon for their day-to-day tracking of energy consumption can result in widespread access to benchmarking tools by building owners, staff and decision makers.
E-4

1. Introduction This benchmarking review has been developed in order to support benchmarking planning and tool development currently under discussion by the California Energy Commission (CEC), Lawrence Berkeley National Laboratory (LBNL) and others in response to the Governor’s Executive Order S-20-04 (2004). The Executive Order sets a goal of benchmarking and improving the energy efficiency of California’s existing commercial building stock. The Executive Order requires that the CEC to propose “a simple building efficiency benchmarking system for al1 commercial buildings in the state.” This report summarizes and compares two currently available commercial building energy benchmarking tools – the U.S. Environmental Protection Agency’s Energy Star National Energy Performance Rating System regression-based model (referenced in this report as “Energy Star”) and Lawrence Berkeley National Laboratory’s Cal-Arch California-based distributional model (referenced as “Cal-Arch”). Prior to the time Cal-Arch was developed in 2002, there were several other benchmarking tools available to California consumers but none that were based solely on California data. The Energy Star and Cal-Arch benchmarking tools provide California with two unique and useful methods to benchmark the energy performance of California’s buildings. Rather than determining which model is “better”, the purpose of this report is to understand and compare the underlying systems, assumptions, and outcomes of each model. Report Structure Section Two of this report discusses the following features of the Energy Star and Cal-Arch benchmarking tools: • Purpose of each model • Sources of underlying data – geographic distribution, survey type, scope of questions,
data quality issues • Type of statistical methods used in each model and pros and cons of each method • Data inputs required – data inputs, data accuracy and robustness • Normalization methods and impacts – weather, building area, other factors • Outputs – graphics, results, source vs. site energy Section Three of this report discusses the application of the Energy Star model (nationally and within California) and Cal-Arch (within California). Two subsets of California commercial buildings are presented in this analysis - the California Commercial End-Use Survey (CEUS) data and a subset of California Department of General Services buildings. Three appendices provide further Energy Star model results and model details: • Appendix A – Analysis of Current EPA Energy Star Models – CEUS Data • Appendix B – Energy Star Model – Regression Equations and Input Requirements • Appendix C – Impact of Default Values on Energy Star Ratings
1

2. Energy Star and Cal-Arch Overview
This section discusses the various attributes of Energy Star and Cal-Arch, including data sources, types of models, input date, normalization and outputs. Table 2-1 summarizes the general characteristics of the two models. Energy Star is based on national commercial building data (www.energystar.gov) while Cal-Arch (http://poet.lbl.gov/cal-arch/) is based solely on California commercial building data.
Table 2-1. Summary of Energy Star and Cal-Arch Attributes Energy Star Cal Arch Sources of Underlying Data
Model Data Sources Commercial Building Energy Consumption Survey (CBECS) (1999: K-12 schools, office buildings), Hospitality Research Group’s Trends in the Hotel Industry Database, and EPRI’s Energy Benchmarking Survey (1997)
California Commercial End-Use Survey (CEUS) (1992)
Geographic Coverage National California Type of Survey Computer assisted phone survey On-site survey Scope of questions Building and occupancy characteristics, energy consumption data Data quality issues Floor area and energy consumption data for individual
observations may be estimated, rounded, or gamed. Type of Statistical Model Regression-based Distributional (histogram) Input Data Location, building type,
building and occupancy characteristics (see Table 2-3 for full list), and energy consumption data
Location, building type, floor area and energy consumption data
Weather Normalization of Energy Consumption
Yes No - tool allows comparison to similar buildings in the same climate zone
Outputs Graphics Web-based Portfolio Manager
with input screens and building performance results summaries for multiple buildings
Web-based tool with input screen and distributional histograms, cumulative percentages and statistical results
Results 1 – 100 ranking compared to national dataset (75+ can apply for Energy Star label if the indoor environment criteria is met)
- Energy use intensity (EUI – kBtu/ft2-year)
- Percent of buildings with lower energy use intensities (EUIs)
Source vs. Site Energy – Site energy inputs – Source energy used for rating
calculations
– Site energy inputs – Site or source energy results
available
2
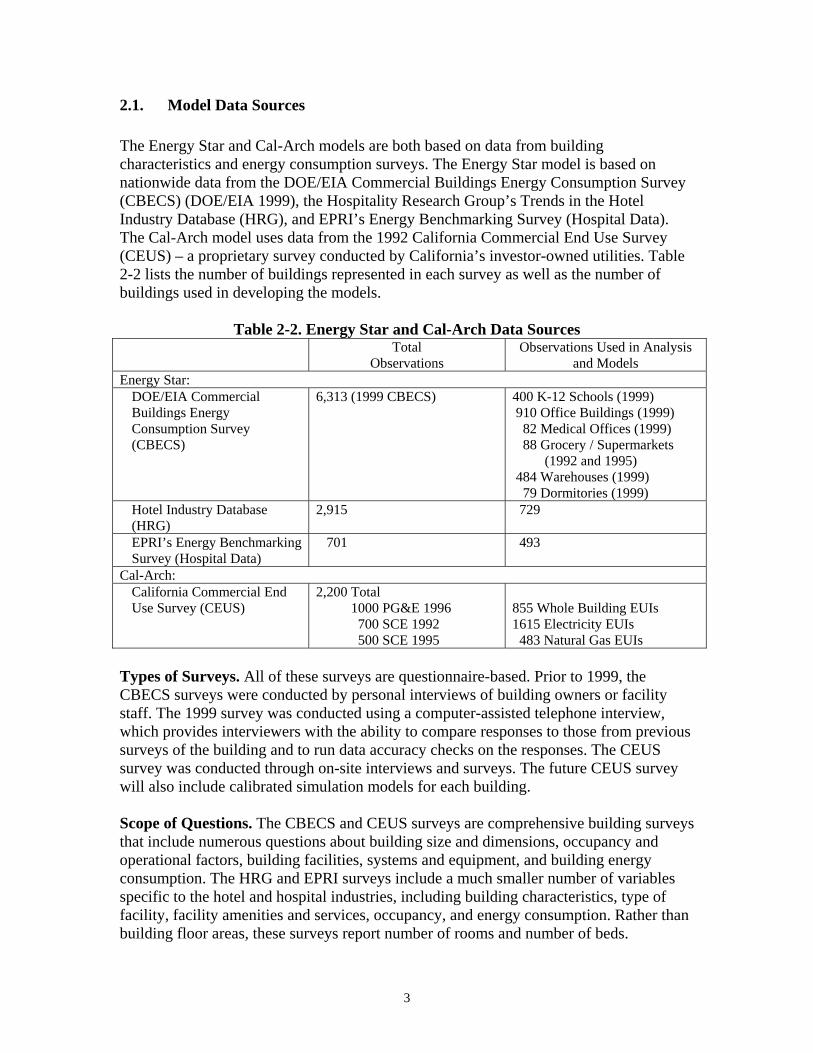
2.1. Model Data Sources The Energy Star and Cal-Arch models are both based on data from building characteristics and energy consumption surveys. The Energy Star model is based on nationwide data from the DOE/EIA Commercial Buildings Energy Consumption Survey (CBECS) (DOE/EIA 1999), the Hospitality Research Group’s Trends in the Hotel Industry Database (HRG), and EPRI’s Energy Benchmarking Survey (Hospital Data). The Cal-Arch model uses data from the 1992 California Commercial End Use Survey (CEUS) – a proprietary survey conducted by California’s investor-owned utilities. Table 2-2 lists the number of buildings represented in each survey as well as the number of buildings used in developing the models.
Table 2-2. Energy Star and Cal-Arch Data Sources Total
Observations Observations Used in Analysis
and Models Energy Star:
DOE/EIA Commercial Buildings Energy Consumption Survey (CBECS)
6,313 (1999 CBECS) 400 K-12 Schools (1999) 910 Office Buildings (1999) 82 Medical Offices (1999) 88 Grocery / Supermarkets
(1992 and 1995) 484 Warehouses (1999) 79 Dormitories (1999)
Hotel Industry Database (HRG)
2,915 729
EPRI’s Energy Benchmarking Survey (Hospital Data)
701 493
Cal-Arch: California Commercial End Use Survey (CEUS)
2,200 Total 1000 PG&E 1996 700 SCE 1992 500 SCE 1995
855 Whole Building EUIs 1615 Electricity EUIs 483 Natural Gas EUIs
Types of Surveys. All of these surveys are questionnaire-based. Prior to 1999, the CBECS surveys were conducted by personal interviews of building owners or facility staff. The 1999 survey was conducted using a computer-assisted telephone interview, which provides interviewers with the ability to compare responses to those from previous surveys of the building and to run data accuracy checks on the responses. The CEUS survey was conducted through on-site interviews and surveys. The future CEUS survey will also include calibrated simulation models for each building. Scope of Questions. The CBECS and CEUS surveys are comprehensive building surveys that include numerous questions about building size and dimensions, occupancy and operational factors, building facilities, systems and equipment, and building energy consumption. The HRG and EPRI surveys include a much smaller number of variables specific to the hotel and hospital industries, including building characteristics, type of facility, facility amenities and services, occupancy, and energy consumption. Rather than building floor areas, these surveys report number of rooms and number of beds.
3

Data Quality Issues. The methodologies for CBECS and CEUS include varying levels of data quality checks. The accuracy of the data included in these surveys is dependent on how well each survey data point agrees with the underlying definition of each variable, the architectural and building science knowledge and capabilities of the surveyors and interviewees, the ability of the surveyor to accurately survey the building characteristics, and the interviewee’s knowledge regarding building floor area, building characteristics and occupancy factors. The two most important factors affecting whole-building energy benchmarking results are building floor area and annual energy consumption values. Accuracy of these values is essential in calculating realistic Energy Star scores and in comparing the user’s building energy use intensities to that of similar buildings in Cal-Arch. Inaccurate building floor areas and/or incomplete energy consumption data can skew the calculated energy use intensity, and can result in an inaccurate comparison to other buildings. Floor Area. Building floor area can be defined in a multitude of ways, including rentable space, conditioned floor area, gross floor area as shown on the plans, and rounded to the nearest hundred, thousand or million. Another important definitional issue is the inclusion/exclusion of indoor parking areas. CBECS defines the building floor area as the gross or total square footage of all spaces in the building, both finished and unfinished, including basements, indoor parking levels, hallways, lobbies, stairways and elevator shafts (CBECS 1999). The CBECS interviewer asks the building owner to specify the actual building floor area or specify which floor area range that the building fits into. If the owner doesn’t know, the interviewer asks a series of relative questions (“is the building smaller than or larger than a book or music superstore, which is about 25,000 square feet?”) to hone in on the building’s floor area range. Some additional data rounding within square footage categories is done during analysis of the raw CBECS data – this can increase the overall error (Sharp 1996). CEUS defines the survey floor area as the enclosed, normally occupied, square footage associated with a premise, rather than an individual building. A premise can be part of a building or include multiple buildings on a single site. Parking garages are not included if it is on a separate meter. The CEUS survey obtains building floor area by measuring, from drawings (blueprints, leasing documents, etc.), or as reported by the facility contact. Additional data (length, width, footprint, height) is collected and is used to double check total building areas and provide inputs for simulation models. Energy Consumption. Annual energy consumption (electricity, natural gas, other fuels) is needed to calculate a building’s Energy Star rating and energy use intensity – this may require adding up energy consumption from multiple meters, making sure that all meters serving the building are counted, and checking that other facilities and purposes (outdoor lighting, etc.) are not being served by meters included in the calculation. Neither tool currently addresses peak power consumption.
4

The majority of the CBECS energy consumption values are as reported by the building owner or interviewee. Utility company energy consumption data is requested only for those buildings where the interviewee was not able to supply this information. As such, there is no verification of the interviewee-supplied energy consumption data against Utility-supplied data. Prior to the CEUS on-site surveys, a list of gas and electric meters and accounts serving the surveyed premise is developed and provided to the on-site surveyor. During the on-site survey, the CEUS surveyor lists the utility meters found – noting whether the meter has been verified, added, deleted, not found, etc. The utility meter list is then used to obtain the energy consumption data from the utility. Errors in total energy consumption can occur if the surveyor is not able to identify all of the meters serving the premise or if meters serve more than the premise surveyed.
2.2. Type of Statistical Models Both models are based on statistical analyses of building characteristic and energy consumption data. The Energy Star model is based on regression analyses whereas the Cal-Arch model is a distributional benchmark with quantitative statistics guiding the building evaluation. Energy Star Model – Synopsis The Energy Star model is based on building type-specific analysis, where annual source energy consumption is predicted with regression models based on building characteristics and occupancy factors. A synopsis of the Energy Star methodology is provided here - additional details as well as the current models’ regression equations are provided in Appendix B of this report. The Energy Star Rating Scale is developed: • The building-specific regression model is developed based on the observations in the
reference data set (CBECs, etc.). • The resulting regression model is used to predict EUIs for each observation in the
reference data set – these EUIs are mapped onto a 1-100 scale, where the 75th percentile EUI is aligned with a rating of 75.
To determine the Energy Star rating for a given building, Building A: • The energy score rating for Building A is determined by using the building-specific
regression model to predict the building’s EUI. • The building-specific 1-100 scale is then adjusted using a correction factor that takes
into account the variance of the Building A predicted EUI from the mean of the reference data set’s actual EUIs. This is the customized rating scale.
• The Building A predicted EUI is weather normalized and then compared to the customized rating scale to determine Building A’s Energy Star rating.
5

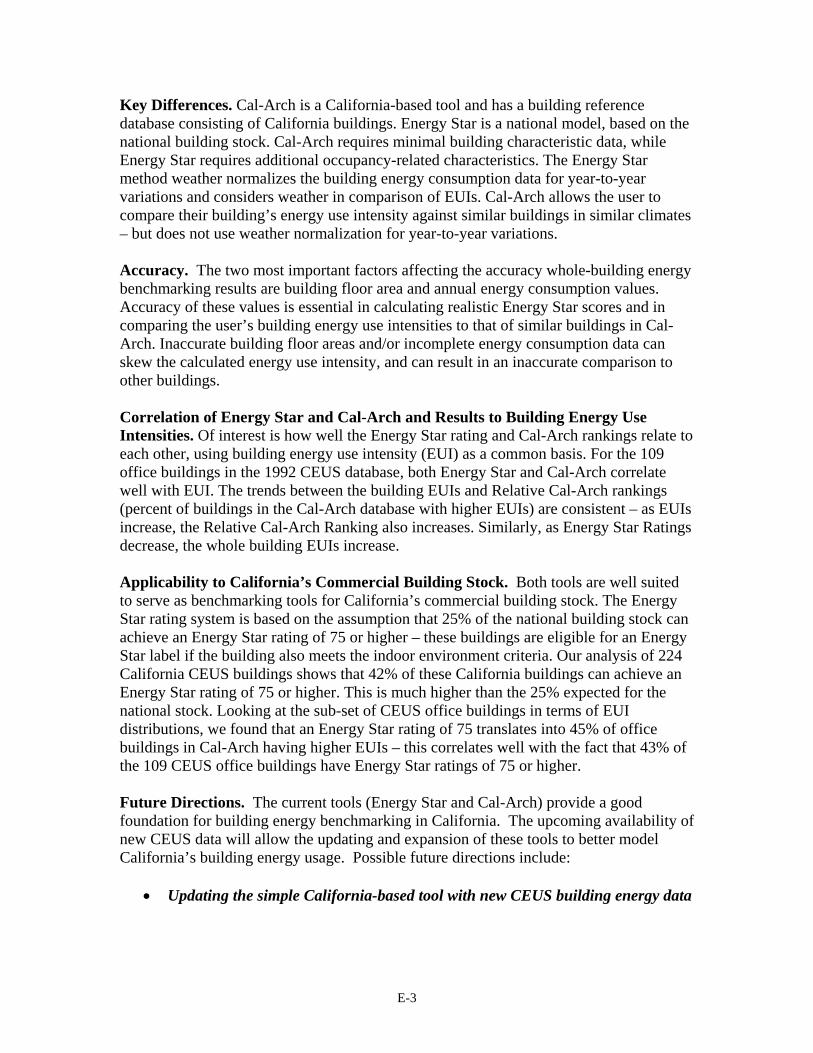
Buildings that score 75 or higher and meet the indoor environment criteria requirements are eligible to receive the Energy Star label. EUI Adjustments for Secondary Uses. The Energy Star model adjusts the building energy consumption to take into account computer data centers, garages and parking lots, and swimming pools. EPA 1999 describes the derivation of these adjustments: for computer data centers, 359.5 kBtu/ft2-year is subtracted from the building energy consumption total (no operating hour adjustment); for parking facilities, a typical lighting and ventilation energy consumption value is multiplied by the number of operating hours per year and subtracted from the building total. The swimming pool model, developed by EPA staff based on a swimming pool model developed by LBNL, calculates swimming pool annual energy based on pool size and number of months operating per year. Cal-Arch Model - Synopsis Cal-Arch, a distributional benchmarking tool developed by LBNL, is based on survey data from California’s 1992 Commercial End Use Survey (CEUS). Distributional benchmarking allows the user to determine the percent of similar buildings that use more or less energy than their building. The energy use intensities (EUIs, kBtu/ft2-year) for a subset of buildings in the Cal-Arch database are plotted as a histogram (Figure 2-1). The EUI for the building being evaluated is compared to the distribution of Cal-Arch EUIs and is noted with an arrow pointing to the corresponding EUI in the histogram. Summary statistics by quartile are also provided. The data displayed are actual EUIs and are not adjusted for weather or any other factors. The user can compare their building’s EUI to that of similar buildings in the same climate zone or statewide.
6
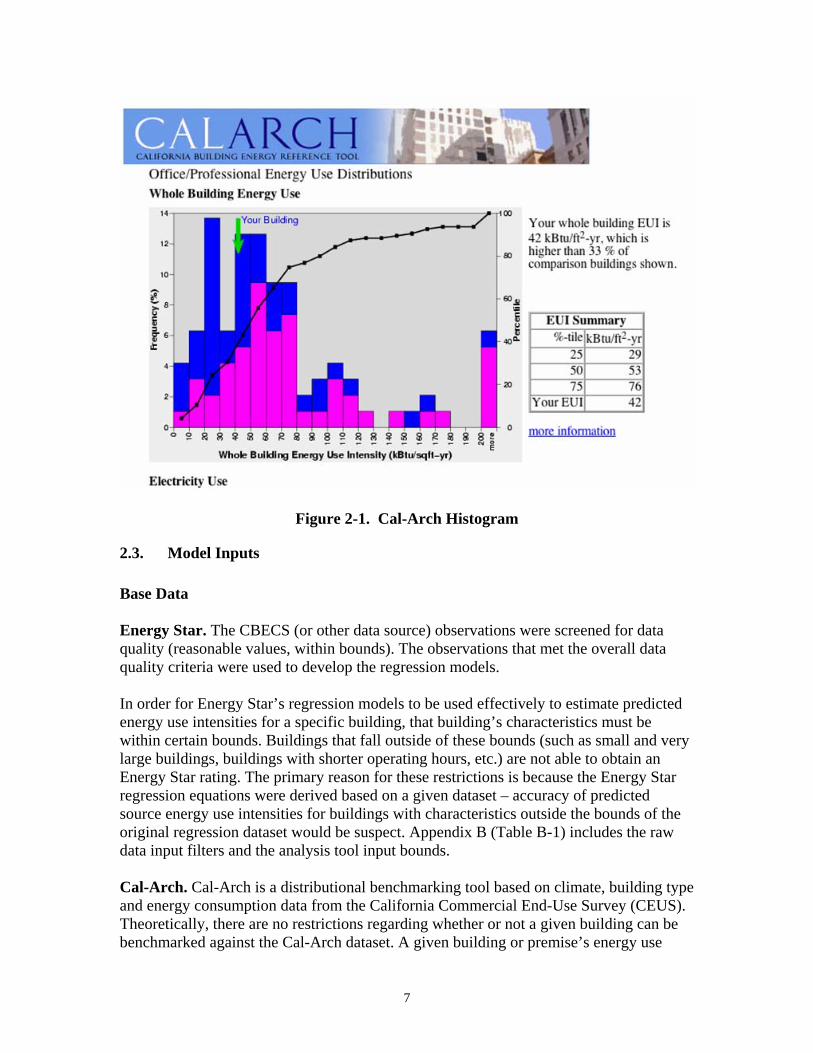
Figure 2-1. Cal-Arch Histogram
2.3. Model Inputs Base Data Energy Star. The CBECS (or other data source) observations were screened for data quality (reasonable values, within bounds). The observations that met the overall data quality criteria were used to develop the regression models. In order for Energy Star’s regression models to be used effectively to estimate predicted energy use intensities for a specific building, that building’s characteristics must be within certain bounds. Buildings that fall outside of these bounds (such as small and very large buildings, buildings with shorter operating hours, etc.) are not able to obtain an Energy Star rating. The primary reason for these restrictions is because the Energy Star regression equations were derived based on a given dataset – accuracy of predicted source energy use intensities for buildings with characteristics outside the bounds of the original regression dataset would be suspect. Appendix B (Table B-1) includes the raw data input filters and the analysis tool input bounds. Cal-Arch. Cal-Arch is a distributional benchmarking tool based on climate, building type and energy consumption data from the California Commercial End-Use Survey (CEUS). Theoretically, there are no restrictions regarding whether or not a given building can be benchmarked against the Cal-Arch dataset. A given building or premise’s energy use
7

intensity – regardless of number of buildings, building size, operating hours and unique characteristics – can be compared to the Cal-Arch database of building energy use intensities. After evaluating the relevance of the position of their building’s EUI within the Cal-Arch distribution, the user can decide to take further steps to independently review their building’s operational and performance issues which may affect their building’s energy use intensity. Accuracy and Robustness Energy Star. The Energy Star model calculates an Energy Star rating based on three main inputs (zip code for location, floor area, and monthly energy consumption data) plus a number of occupancy and use characteristics specific to each building type (number of occupants, operating hours, number of months per year, number of computers, percent of building floor area air conditioned, percent of building floor area heated, use of mechanical ventilation, cooking facilities, refrigeration, lighting, etc.). Table 2-3 summarizes the types of data inputs required for each building type. Model-specific input assumptions and valid data value ranges are shown in Appendix B. Zip code is used to obtain heating and cooling degree data from the nearest weather station – the weather data is used to perform weather normalization on the energy consumption data. Energy Star’s building floor area input is the gross interior area of the building, including hallways, lobbies and ancillary services (stairways, elevators, janitor closets, mechanical rooms, etc.) (EPA 2003). In developing the Energy Star models, EPA looked at the correlation of building energy consumption to a number of building characteristics. They found that building floor area was the most significant input to the Energy Star regression models and provided a good fit as seen in the “Floor Area-Based” R2 values in Table 2-4 (EPA Technical Descriptions 2001, 2003, 2004). Additional variables, such as occupancy, operation hours, computers, etc. added to the full model and increased the model’s R2 and robustness only minimally. These additional variables were individually not as significant a factor as the building floor areas were.
8

Table 2-3. Required Information – Energy Star Models
K-1
2 Sc
hool
s
Off
ice
Hot
els
Med
ical
O
ffic
es
Supe
rmar
kets
War
ehou
ses
Hos
pita
ls
Dor
ms
Zip Code X X X X X X X X Year Built X X X X X X - - Area X X X X X X - X Number of Floors - - - - X - X - Number of Rooms - - X - - - - X Hours of Use X X - X X X - - Number of Occupants X X - X X X - - Tertiary Care - - - - - - X - Above Ground Parking - - - - - - X - Number of Personal Computers X X - - X - X - On-site Cooking X - X - X - - - On-site Laundry - - X - - - - - %Floor area air conditioned X - - X - X - X % Floor area heated X - - X - X - X Mechanical Ventilation X - - - - - - -
Table 2-4. Energy Star Model R2
Model R2
Building Type Floor Area Based
Full Model
K-12 Schools 0.85 0.87 Offices 0.91 0.93 Hotels / Motels not provided 0.60 to 0.88 Medical Offices 0.91 0.93 Supermarkets 0.63 0.79 Warehouses not provided 0.80 Dorms 0.86 0.88 Hospitals not provided 0.83
Cal-Arch. Cal-Arch requires four inputs: building type, floor area, energy consumption (electricity, gas, other), and zip code. For comparison, Cal-Arch provides an un-weighted distribution of EUIs for similar buildings in the same climate zone or statewide. Using an un-weighted distribution reduces the overall impact of high energy use intensity buildings, much as does the choice of “median” rather than “average” for quantifying
9

central tendencies of data sets. Small sample sizes and extreme values are less apt to skew the distribution, but the middle portions of the distribution must be well defined with a good level of accuracy as a small change in EUI can shift the percentile ranking on a cumulative distribution substantially (Sharp 1998). The building type is used to select similar buildings from the Cal-Arch database to be used in the distributional comparison and it is important that the building be defined correctly and that the building type specified is the predominant building activity. Unlike Energy Star, Cal-Arch does not currently have the capability to calculate composite building energy use distributions for buildings with multiple building uses (for example, a building with 50% office space and 50% K-12 classrooms). Cal-Arch’s building type definitions were designed to correspond roughly to the CBECS categories (Table 2-5) (Kinney and Piette 2003). The Energy Star model development also uses the CBECS categories. Using similar building type designations allows one to look at Cal-Arch and Energy Star results for similar building types. As discussed previously, floor area and annual energy consumption values are used to calculate premise energy use intensities (EUIs). The survey units in CEUS are “premises” and can include multiple buildings. As such, Cal-Arch users can enter gross floor areas and annual energy consumption values for a single building or set of buildings as long as all floor areas and energy consumption values are accounted for. Inaccurate building floor areas and/or incomplete energy consumption data can skew the calculated EUI and can result in an inaccurate comparison within the EUI distribution. Zip code is used by Cal-Arch to determine in which of the four California climate zones (North Coast, South Coast, Central Valley and Desert/Mountain) a building is located (Figure 2-2). These four climate zones were creating by mapping the CEC’s sixteen climate zones into four zones – doing so allowed Cal-Arch to provide larger climate-based sample sizes for each building type. By designating their building’s zip code, the user is able to compare their building to similar buildings in a similar climate.
Figure 2-2. CEC California Climate Zones Mapped to Four Main Climate Zones
10
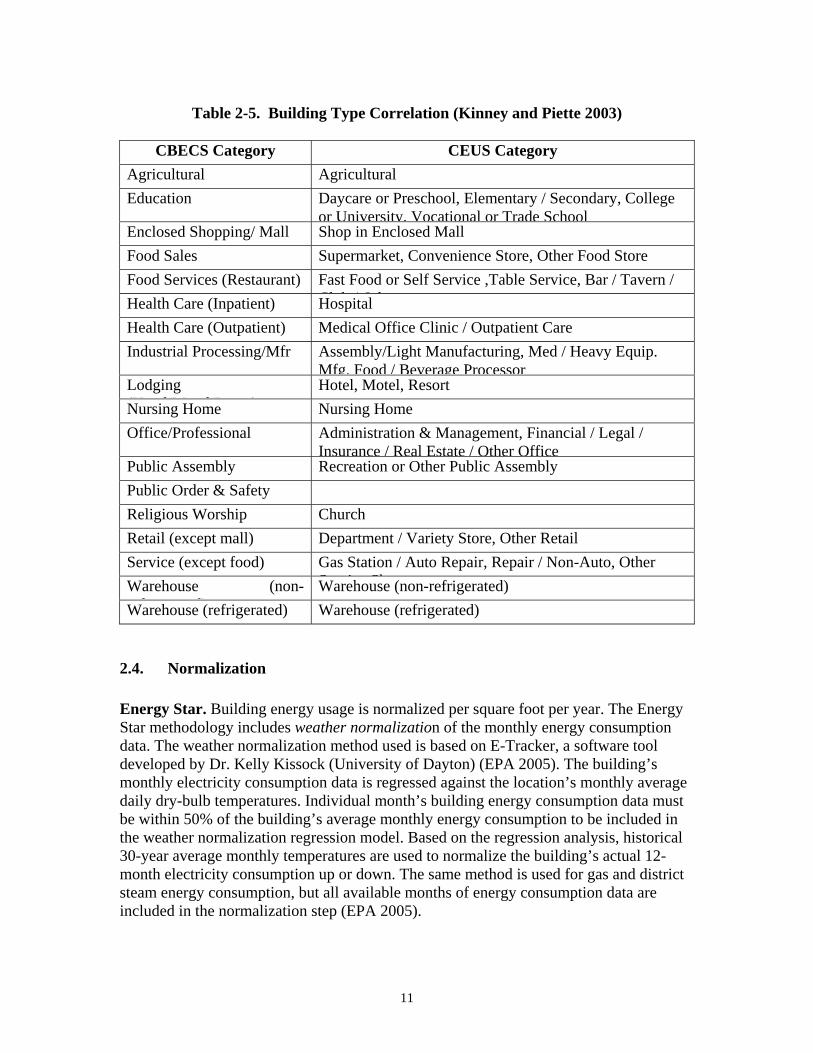
Table 2-5. Building Type Correlation (Kinney and Piette 2003)
CBECS Category CEUS Category Agricultural Agricultural Education Daycare or Preschool, Elementary / Secondary, College
or University, Vocational or Trade SchoolEnclosed Shopping/ Mall Shop in Enclosed Mall Food Sales Supermarket, Convenience Store, Other Food Store Food Services (Restaurant) Fast Food or Self Service ,Table Service, Bar / Tavern /
Cl b / O hHealth Care (Inpatient) Hospital Health Care (Outpatient) Medical Office Clinic / Outpatient Care Industrial Processing/Mfr Assembly/Light Manufacturing, Med / Heavy Equip.
Mfg. Food / Beverage ProcessorLodging (H l/M l/D )
Hotel, Motel, Resort Nursing Home Nursing Home Office/Professional Administration & Management, Financial / Legal /
Insurance / Real Estate / Other OfficePublic Assembly Recreation or Other Public Assembly Public Order & Safety Religious Worship Church Retail (except mall) Department / Variety Store, Other Retail Service (except food) Gas Station / Auto Repair, Repair / Non-Auto, Other
S i ShWarehouse (non-f i d)
Warehouse (non-refrigerated) Warehouse (refrigerated) Warehouse (refrigerated)
2.4. Normalization Energy Star. Building energy usage is normalized per square foot per year. The Energy Star methodology includes weather normalization of the monthly energy consumption data. The weather normalization method used is based on E-Tracker, a software tool developed by Dr. Kelly Kissock (University of Dayton) (EPA 2005). The building’s monthly electricity consumption data is regressed against the location’s monthly average daily dry-bulb temperatures. Individual month’s building energy consumption data must be within 50% of the building’s average monthly energy consumption to be included in the weather normalization regression model. Based on the regression analysis, historical 30-year average monthly temperatures are used to normalize the building’s actual 12-month electricity consumption up or down. The same method is used for gas and district steam energy consumption, but all available months of energy consumption data are included in the normalization step (EPA 2005).
11

Cal-Arch. Building energy usage is normalized per square foot per year. No weather normalization of energy consumption is used. Users can compare their building’s energy use intensity to that of similar buildings in the same climate zone as well as statewide.
2.5. Outputs Energy Star Graphics. Energy Star (www.energystar.gov) uses a web-based portfolio manager to input, calculate and present Energy Star ratings and data for multiple facilities. Users can also submit data for multiple buildings using an Excel-based import template. To input a new building’s data directly into the portfolio manager, users are led through a series of input screens (one of which is shown in Figure 2-3). The portfolio manager performs a basic data check as the user enters data. The My Portfolio page (Figure 2-4) provides summary performance information for all buildings included in the user’s portfolio. The Portfolio Manager provides a choice of standard portfolio views, including building data (floor area, actual annual energy intensity) and performance data (energy star rating, environmental performance, energy costs, and comparisons to baseline energy consumption). The user can also specify custom summaries. The user can organize facilities into smaller groups of facilities and export performance data to Excel.
Figure 2-3. Energy Star Portfolio Manager – Building Input Screen
12
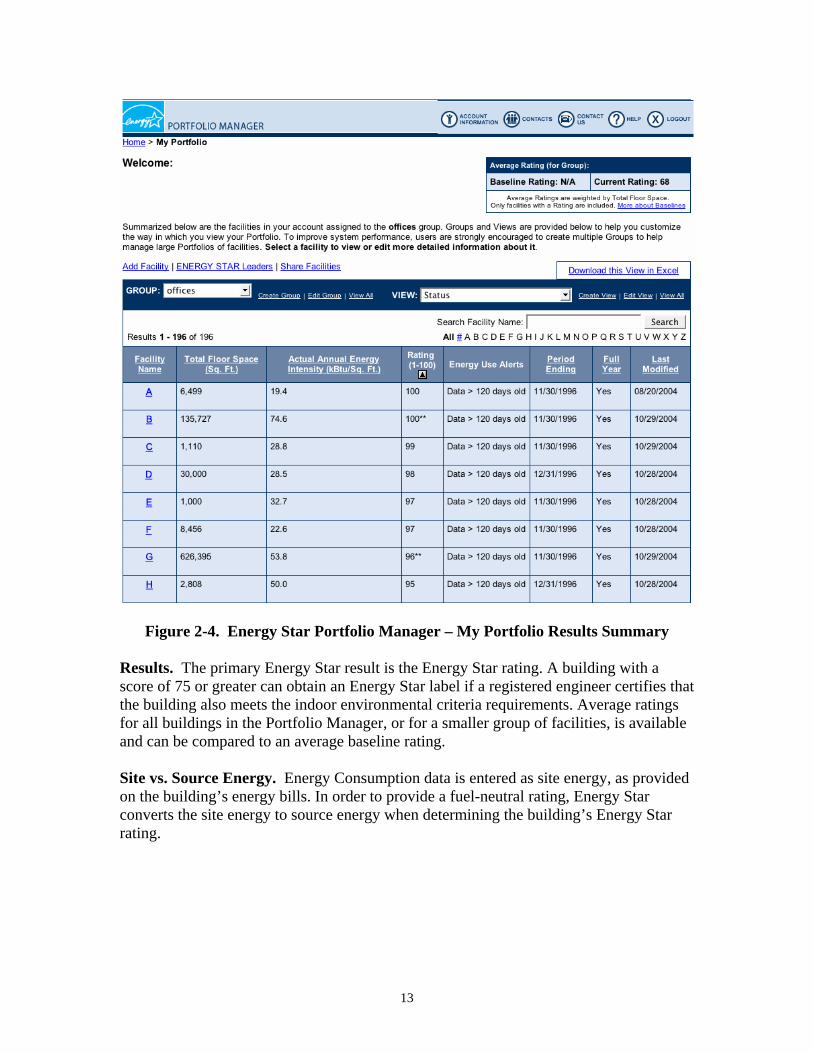
Figure 2-4. Energy Star Portfolio Manager – My Portfolio Results Summary
Results. The primary Energy Star result is the Energy Star rating. A building with a score of 75 or greater can obtain an Energy Star label if a registered engineer certifies that the building also meets the indoor environmental criteria requirements. Average ratings for all buildings in the Portfolio Manager, or for a smaller group of facilities, is available and can be compared to an average baseline rating. Site vs. Source Energy. Energy Consumption data is entered as site energy, as provided on the building’s energy bills. In order to provide a fuel-neutral rating, Energy Star converts the site energy to source energy when determining the building’s Energy Star rating.
13
Cal-Arch Graphics. Cal-Arch is a web-based tool which includes an input page, results page, and supporting documentation. Figure 2-5 and Figure 2-6 show the input and results pages. To input their building’s characteristics, users select their building type and input floor area, energy consumption, and zip code data. Their building can be compared to buildings with similar floor areas by checking a check box. By leaving the zip code input blank, their building can be compared to all similar CEUS buildings statewide. Users can also select output options, including site or source energy and type of distribution (histogram and/or cumulative percentage). Results. The Cal-Arch results page (Figure 2-6) provides histograms showing how the evaluated building’s energy use intensity compares to that of similar buildings. The EUI of the building being evaluated is identified with an arrow on the graph. Text is given summarizing the evaluated whole building, electric and fuel EUIs – for example: “Your whole building EUI is 42 kWhr/ft2-yr which is higher than 9% of comparison buildings shown.” Summary quartile statistics are provided for the buildings included in the comparison building data set. The results page includes: • Statewide or climate-zone specific whole building, electricity and gas EUI
distributions by building type • Position of building EUIs on EUI distributions • Statistics (building EUI, % of buildings with lower EUIs, quartile EUI statistics) • Description of comparison and evaluated buildings:
o Building Type o Zip Code or climate zone o Floor area
Evaluated building floor area Whether comparison building data is filtered by size
o Site or source energy units o Number of comparison buildings on graphs (whole building, electric, gas)
• Links to more information Site versus Source Energy. The Cal-Arch database includes site energy consumption values for each of the CEUS buildings. Similarly, the user inputs their building’s annual energy consumption totals in site energy units, as provided on their energy bills. The user can view the results and graphics in either site or source units (kBtu/sf-year), where the site electricity data is converted to source energy using a factor of 2.7.
14

Figure 2-5. Cal-Arch Input Page
15

16
Figure 2-6. Cal-Arch Results Page
16
3. Evaluation of Energy Star and Cal-Arch Models for California Buildings
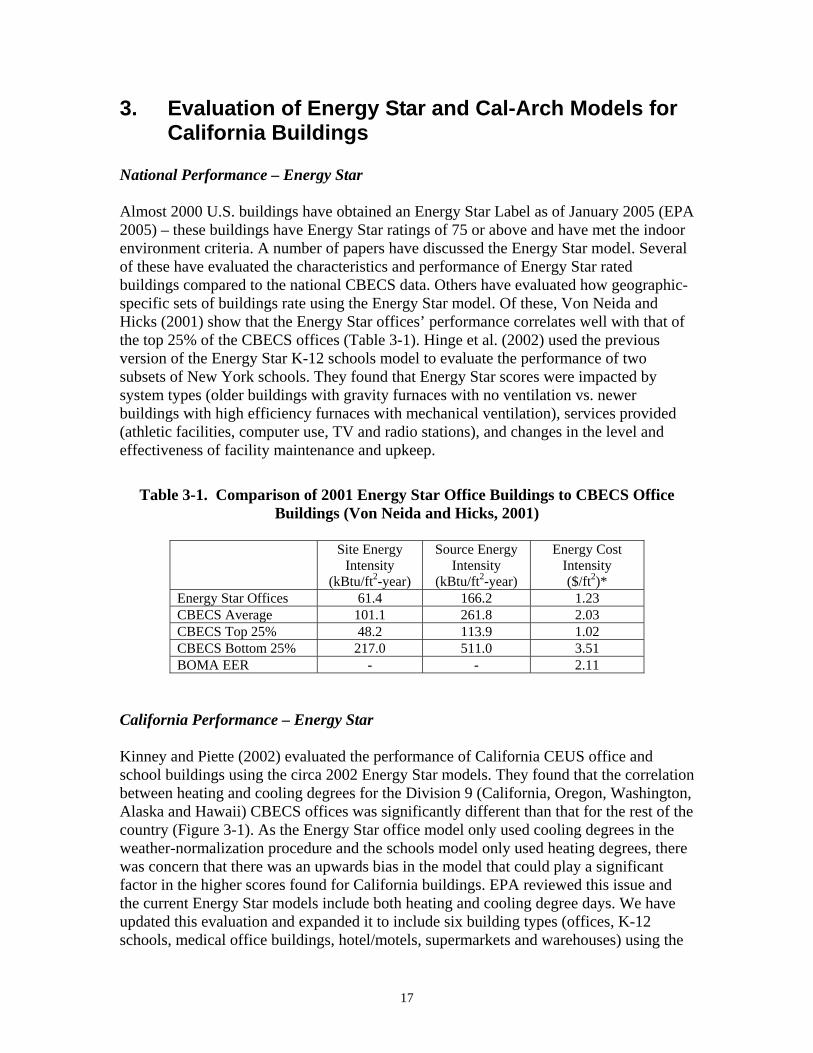
National Performance – Energy Star Almost 2000 U.S. buildings have obtained an Energy Star Label as of January 2005 (EPA 2005) – these buildings have Energy Star ratings of 75 or above and have met the indoor environment criteria. A number of papers have discussed the Energy Star model. Several of these have evaluated the characteristics and performance of Energy Star rated buildings compared to the national CBECS data. Others have evaluated how geographic-specific sets of buildings rate using the Energy Star model. Of these, Von Neida and Hicks (2001) show that the Energy Star offices’ performance correlates well with that of the top 25% of the CBECS offices (Table 3-1). Hinge et al. (2002) used the previous version of the Energy Star K-12 schools model to evaluate the performance of two subsets of New York schools. They found that Energy Star scores were impacted by system types (older buildings with gravity furnaces with no ventilation vs. newer buildings with high efficiency furnaces with mechanical ventilation), services provided (athletic facilities, computer use, TV and radio stations), and changes in the level and effectiveness of facility maintenance and upkeep.
Table 3-1. Comparison of 2001 Energy Star Office Buildings to CBECS Office Buildings (Von Neida and Hicks, 2001)
Site Energy
Intensity (kBtu/ft2-year)
Source Energy Intensity
(kBtu/ft2-year)
Energy Cost Intensity ($/ft2)*
Energy Star Offices 61.4 166.2 1.23 CBECS Average 101.1 261.8 2.03 CBECS Top 25% 48.2 113.9 1.02 CBECS Bottom 25% 217.0 511.0 3.51 BOMA EER - - 2.11
California Performance – Energy Star Kinney and Piette (2002) evaluated the performance of California CEUS office and school buildings using the circa 2002 Energy Star models. They found that the correlation between heating and cooling degrees for the Division 9 (California, Oregon, Washington, Alaska and Hawaii) CBECS offices was significantly different than that for the rest of the country (Figure 3-1). As the Energy Star office model only used cooling degrees in the weather-normalization procedure and the schools model only used heating degrees, there was concern that there was an upwards bias in the model that could play a significant factor in the higher scores found for California buildings. EPA reviewed this issue and the current Energy Star models include both heating and cooling degree days. We have updated this evaluation and expanded it to include six building types (offices, K-12 schools, medical office buildings, hotel/motels, supermarkets and warehouses) using the
17
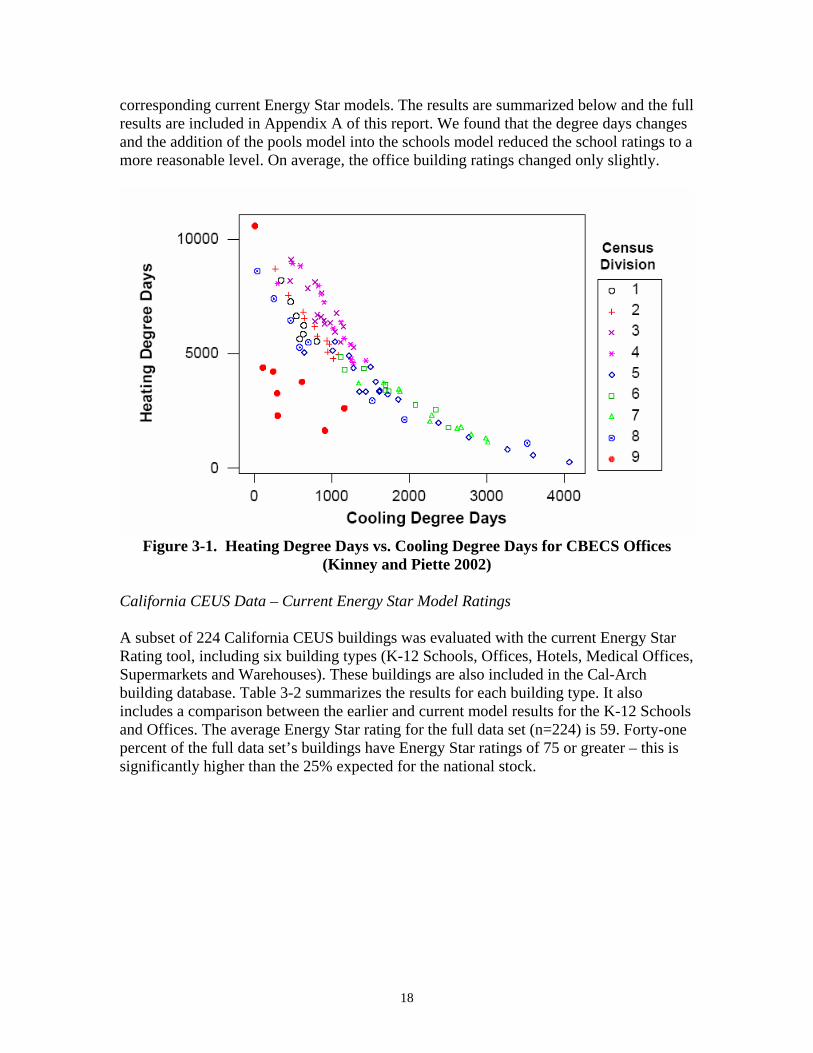
corresponding current Energy Star models. The results are summarized below and the full results are included in Appendix A of this report. We found that the degree days changes and the addition of the pools model into the schools model reduced the school ratings to a more reasonable level. On average, the office building ratings changed only slightly.
Figure 3-1. Heating Degree Days vs. Cooling Degree Days for CBECS Offices
(Kinney and Piette 2002) California CEUS Data – Current Energy Star Model Ratings A subset of 224 California CEUS buildings was evaluated with the current Energy Star Rating tool, including six building types (K-12 Schools, Offices, Hotels, Medical Offices, Supermarkets and Warehouses). These buildings are also included in the Cal-Arch building database. Table 3-2 summarizes the results for each building type. It also includes a comparison between the earlier and current model results for the K-12 Schools and Offices. The average Energy Star rating for the full data set (n=224) is 59. Forty-one percent of the full data set’s buildings have Energy Star ratings of 75 or greater – this is significantly higher than the 25% expected for the national stock.
18
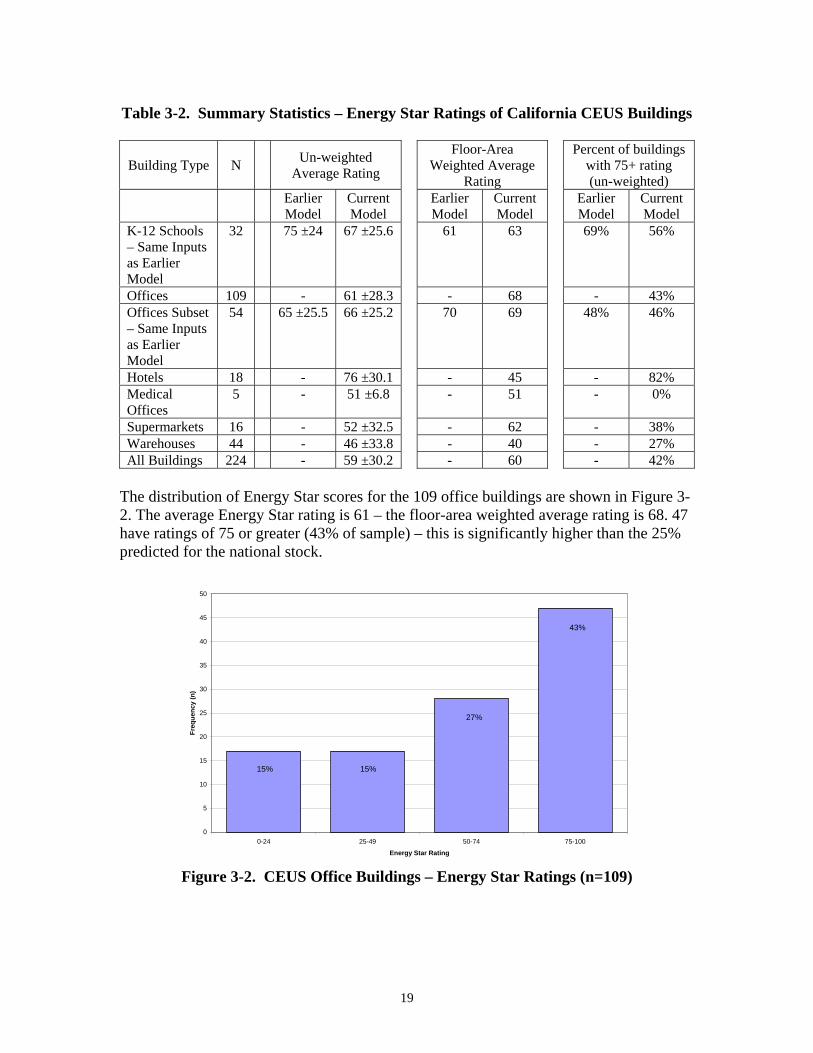
Table 3-2. Summary Statistics – Energy Star Ratings of California CEUS Buildings
Building Type N Un-weighted Average Rating
Floor-Area Weighted Average
Rating
Percent of buildings with 75+ rating (un-weighted)
Earlier Model
Current Model
Earlier Model
Current Model
Earlier Model
Current Model
K-12 Schools – Same Inputs as Earlier Model
32 75 ±24 67 ±25.6 61 63 69% 56%
Offices 109 - 61 ±28.3 - 68 - 43% Offices Subset – Same Inputs as Earlier Model
54 65 ±25.5 66 ±25.2 70 69 48% 46%
Hotels 18 - 76 ±30.1 - 45 - 82% Medical Offices
5 - 51 ±6.8 - 51 - 0%
Supermarkets 16 - 52 ±32.5 - 62 - 38% Warehouses 44 - 46 ±33.8 - 40 - 27% All Buildings 224 - 59 ±30.2 - 60 - 42%
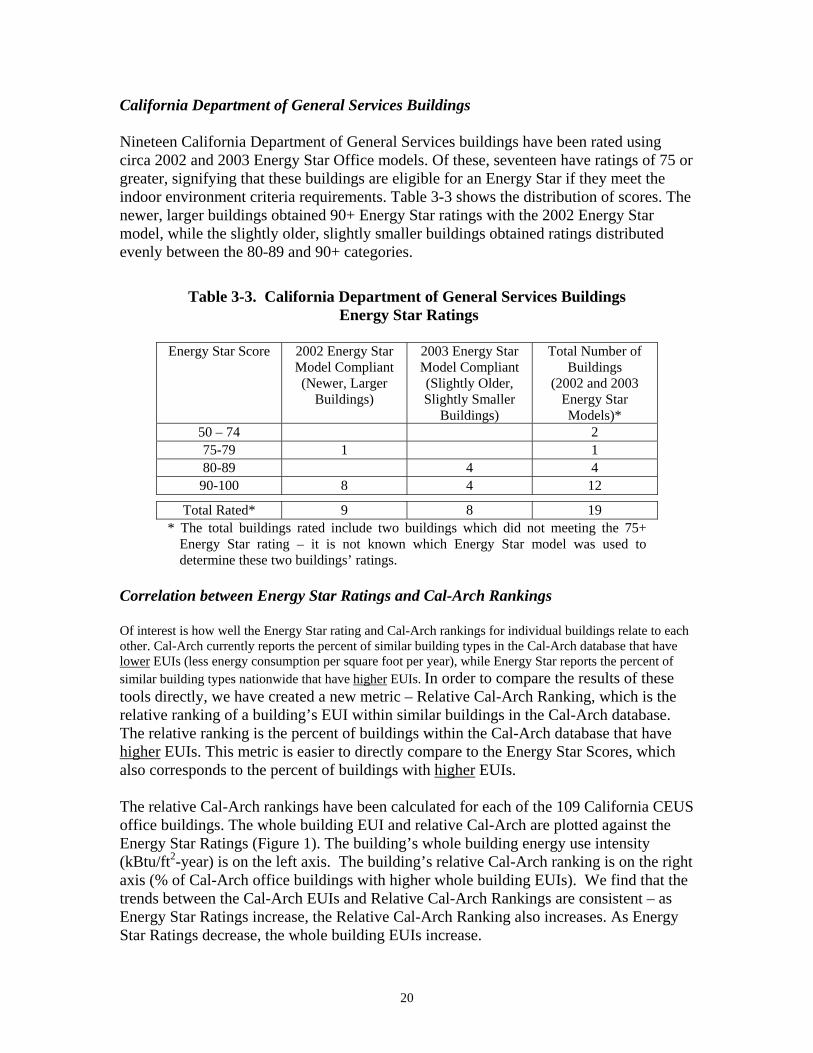
The distribution of Energy Star scores for the 109 office buildings are shown in Figure 3-2. The average Energy Star rating is 61 – the floor-area weighted average rating is 68. 47 have ratings of 75 or greater (43% of sample) – this is significantly higher than the 25% predicted for the national stock.
0
5
10
15
20
25
30
35
40
45
50
0-24 25-49 50-74 75-100
Energy Star Rating
Freq
uenc
y (n
)
15% 15%
27%
43%
Figure 3-2. CEUS Office Buildings – Energy Star Ratings (n=109)
19
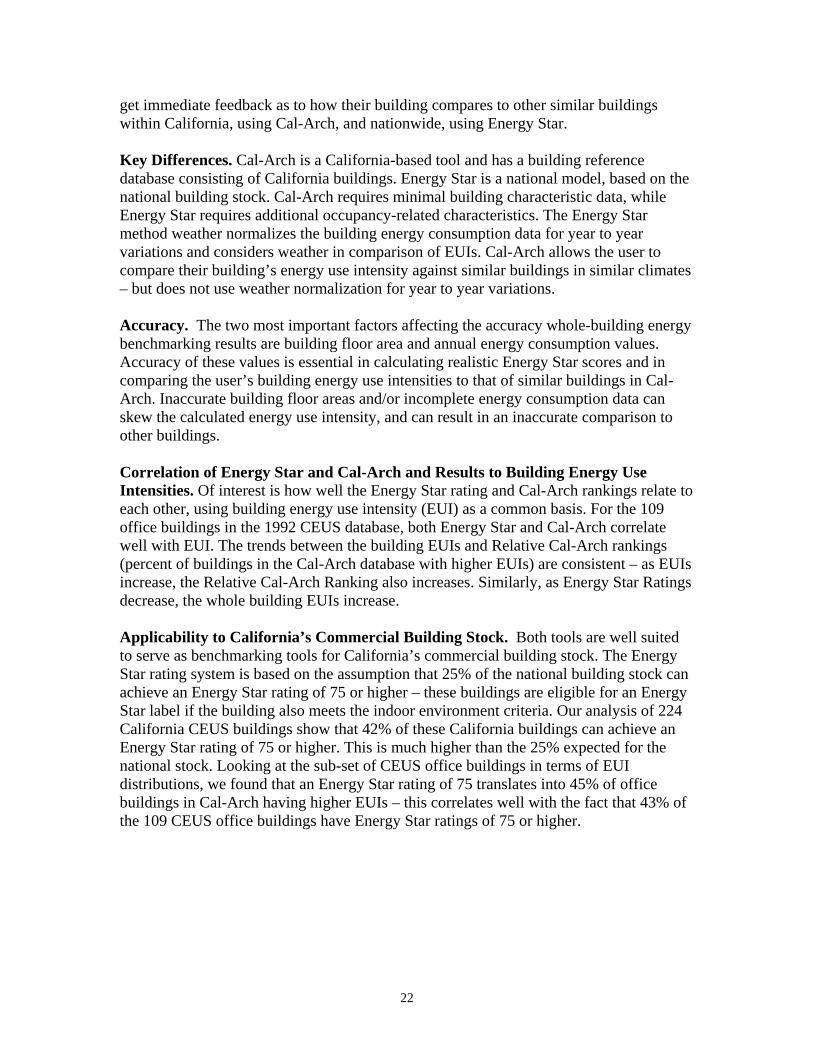
California Department of General Services Buildings Nineteen California Department of General Services buildings have been rated using circa 2002 and 2003 Energy Star Office models. Of these, seventeen have ratings of 75 or greater, signifying that these buildings are eligible for an Energy Star if they meet the indoor environment criteria requirements. Table 3-3 shows the distribution of scores. The newer, larger buildings obtained 90+ Energy Star ratings with the 2002 Energy Star model, while the slightly older, slightly smaller buildings obtained ratings distributed evenly between the 80-89 and 90+ categories.
Table 3-3. California Department of General Services Buildings Energy Star Ratings
Energy Star Score 2002 Energy Star
Model Compliant (Newer, Larger
Buildings)
2003 Energy Star Model Compliant (Slightly Older, Slightly Smaller
Buildings)
Total Number of Buildings
(2002 and 2003 Energy Star Models)*
50 – 74 2 75-79 1 1 80-89 4 4
90-100 8 4 12
Total Rated* 9 8 19 * The total buildings rated include two buildings which did not meeting the 75+
Energy Star rating – it is not known which Energy Star model was used to determine these two buildings’ ratings.
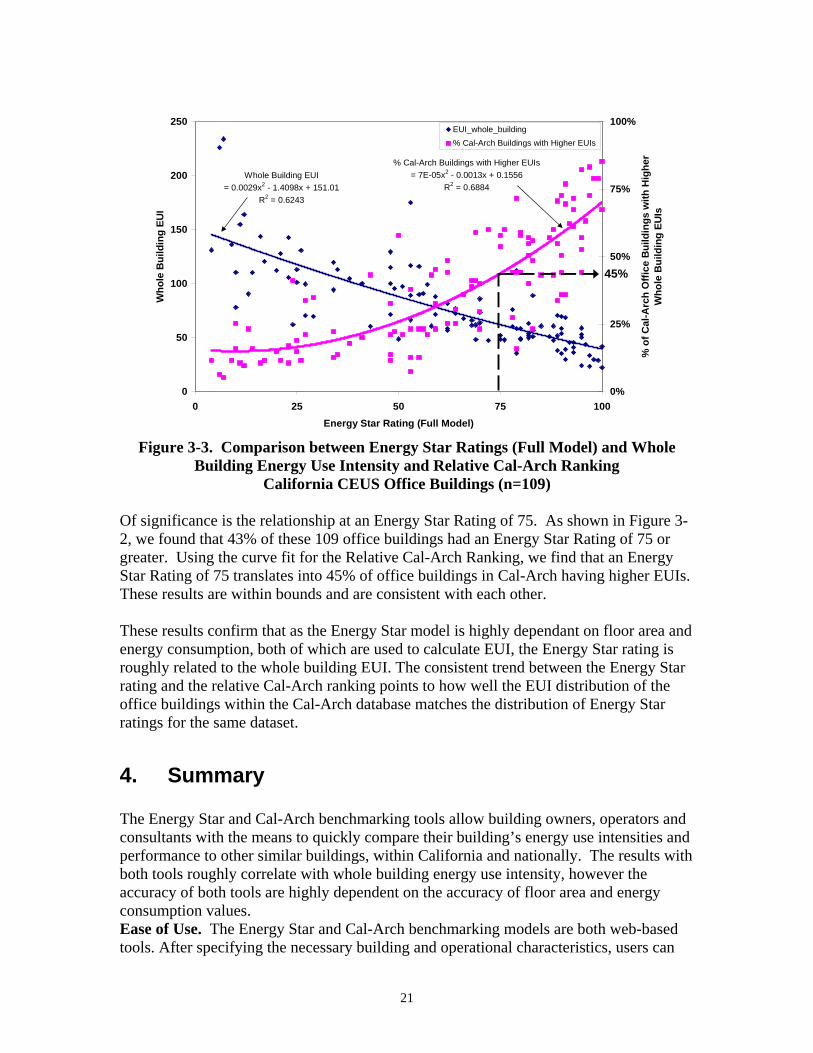
Correlation between Energy Star Ratings and Cal-Arch Rankings Of interest is how well the Energy Star rating and Cal-Arch rankings for individual buildings relate to each other. Cal-Arch currently reports the percent of similar building types in the Cal-Arch database that have lower EUIs (less energy consumption per square foot per year), while Energy Star reports the percent of similar building types nationwide that have higher EUIs. In order to compare the results of these tools directly, we have created a new metric – Relative Cal-Arch Ranking, which is the relative ranking of a building’s EUI within similar buildings in the Cal-Arch database. The relative ranking is the percent of buildings within the Cal-Arch database that have higher EUIs. This metric is easier to directly compare to the Energy Star Scores, which also corresponds to the percent of buildings with higher EUIs. The relative Cal-Arch rankings have been calculated for each of the 109 California CEUS office buildings. The whole building EUI and relative Cal-Arch are plotted against the Energy Star Ratings (Figure 1). The building’s whole building energy use intensity (kBtu/ft2-year) is on the left axis. The building’s relative Cal-Arch ranking is on the right axis (% of Cal-Arch office buildings with higher whole building EUIs). We find that the trends between the Cal-Arch EUIs and Relative Cal-Arch Rankings are consistent – as Energy Star Ratings increase, the Relative Cal-Arch Ranking also increases. As Energy Star Ratings decrease, the whole building EUIs increase.
20
Whole Building EUI = 0.0029x2 - 1.4098x + 151.01
R2 = 0.6243
% Cal-Arch Buildings with Higher EUIs= 7E-05x2 - 0.0013x + 0.1556
R2 = 0.6884
0
50
100
150
200
250
0 25 50 75 100Energy Star Rating (Full Model)
Who
le B
uild
ing
EUI
0%
25%
50%
75%
100%
% o
f Cal
-Arc
h O
ffice
Bui
ldin
gs w
ith H
ighe
r W
hole
Bui
ldin
g EU
Is
EUI_whole_building% Cal-Arch Buildings with Higher EUIs
45%
Figure 3-3. Comparison between Energy Star Ratings (Full Model) and Whole
Building Energy Use Intensity and Relative Cal-Arch Ranking California CEUS Office Buildings (n=109)
Of significance is the relationship at an Energy Star Rating of 75. As shown in Figure 3-2, we found that 43% of these 109 office buildings had an Energy Star Rating of 75 or greater. Using the curve fit for the Relative Cal-Arch Ranking, we find that an Energy Star Rating of 75 translates into 45% of office buildings in Cal-Arch having higher EUIs. These results are within bounds and are consistent with each other. These results confirm that as the Energy Star model is highly dependant on floor area and energy consumption, both of which are used to calculate EUI, the Energy Star rating is roughly related to the whole building EUI. The consistent trend between the Energy Star rating and the relative Cal-Arch ranking points to how well the EUI distribution of the office buildings within the Cal-Arch database matches the distribution of Energy Star ratings for the same dataset.
4. Summary The Energy Star and Cal-Arch benchmarking tools allow building owners, operators and consultants with the means to quickly compare their building’s energy use intensities and performance to other similar buildings, within California and nationally. The results with both tools roughly correlate with whole building energy use intensity, however the accuracy of both tools are highly dependent on the accuracy of floor area and energy consumption values. Ease of Use. The Energy Star and Cal-Arch benchmarking models are both web-based tools. After specifying the necessary building and operational characteristics, users can
21
get immediate feedback as to how their building compares to other similar buildings within California, using Cal-Arch, and nationwide, using Energy Star. Key Differences. Cal-Arch is a California-based tool and has a building reference database consisting of California buildings. Energy Star is a national model, based on the national building stock. Cal-Arch requires minimal building characteristic data, while Energy Star requires additional occupancy-related characteristics. The Energy Star method weather normalizes the building energy consumption data for year to year variations and considers weather in comparison of EUIs. Cal-Arch allows the user to compare their building’s energy use intensity against similar buildings in similar climates – but does not use weather normalization for year to year variations. Accuracy. The two most important factors affecting the accuracy whole-building energy benchmarking results are building floor area and annual energy consumption values. Accuracy of these values is essential in calculating realistic Energy Star scores and in comparing the user’s building energy use intensities to that of similar buildings in Cal-Arch. Inaccurate building floor areas and/or incomplete energy consumption data can skew the calculated energy use intensity, and can result in an inaccurate comparison to other buildings. Correlation of Energy Star and Cal-Arch and Results to Building Energy Use Intensities. Of interest is how well the Energy Star rating and Cal-Arch rankings relate to each other, using building energy use intensity (EUI) as a common basis. For the 109 office buildings in the 1992 CEUS database, both Energy Star and Cal-Arch correlate well with EUI. The trends between the building EUIs and Relative Cal-Arch rankings (percent of buildings in the Cal-Arch database with higher EUIs) are consistent – as EUIs increase, the Relative Cal-Arch Ranking also increases. Similarly, as Energy Star Ratings decrease, the whole building EUIs increase. Applicability to California’s Commercial Building Stock. Both tools are well suited to serve as benchmarking tools for California’s commercial building stock. The Energy Star rating system is based on the assumption that 25% of the national building stock can achieve an Energy Star rating of 75 or higher – these buildings are eligible for an Energy Star label if the building also meets the indoor environment criteria. Our analysis of 224 California CEUS buildings show that 42% of these California buildings can achieve an Energy Star rating of 75 or higher. This is much higher than the 25% expected for the national stock. Looking at the sub-set of CEUS office buildings in terms of EUI distributions, we found that an Energy Star rating of 75 translates into 45% of office buildings in Cal-Arch having higher EUIs – this correlates well with the fact that 43% of the 109 CEUS office buildings have Energy Star ratings of 75 or higher.
22
5. Future Directions The Energy Star and Cal-Arch tools are currently used by in the buildings community to provide information on a building’s relative energy performance. To improve the accessibility of the Energy Star and Cal-Arch tools, prototypes have been developed that allow web-based energy information services and energy information systems to access and report on Energy Star ratings and Cal-Arch rankings. Implementation of these tools into existing web-based systems can result in widespread access to benchmarking tools by building owners, staff and decision makers. Future tools under consideration, such as action-oriented advanced benchmarking, could provide initial feedback and recommendations on which building systems or operational strategies may reduce a building’s energy use. Incorporating these types of features into benchmarking tools may improve the value of benchmarking, help motivate actions to reduce energy use, and broaden the use of benchmarking in the buildings marketplace. The current tools (Energy Star and Cal-Arch) provide a good foundation for building energy benchmarking in California. The upcoming availability of new CEUS data will allow the updating and expansion of these tools to better model California’s building energy usage. Possible future directions include:
• Updating the simple California-based tool with new CEUS building energy data • Developing a California-specific Energy Star-type model – based on the new
CEUS data to provide better correlation to and comparison within California’s building stock.
• Action-oriented advanced benchmarking tools – action-oriented tools can provide initial feedback and recommendations as to which building systems or operational strategy improvements may reduce a building’s energy use. Incorporating these types of features into benchmarking tools may improve the value of benchmarking, help motivate building owners and operators to take action to reduce energy use, and expand the use of benchmarking in the marketplace.
• Integration of benchmarking tools into web-based energy information systems – prototypes have already been developed using the Cal-Arch and Energy Star benchmarking engines. Integrating benchmarking with tools that the building industry depends upon for their day-to-day tracking of energy consumption can result in widespread access to benchmarking tools by building owners, staff and decision makers.
•
6. Acknowledgements We would like to thank Martha Brook and Nancy Jenkins (California Energy Commission), Bob Rose and Tracy Narel (U.S. Environmental Protection Agency), and David Casentini (D&R International) for their support in this effort. We would also like to thank Satkartak Kinney (Lawrence Berkeley National Laboratory) for her assistance
23

on this project and Evan Mills, John Busch and Rich Brown (Lawrence Berkeley National Laboratory) for their review of this report. This work was supported by the California Energy Commission, Public Interest Energy Research Program, under Contract No. 500-03-022 and by the Assistant Secretary for Energy Efficiency and Renewable Energy, Building Technologies Program of the U.S. Department of Energy under Contract No. DE-AC02-05CH11231.
7. References DOE/EIA. 1999. “Commercial Building Energy Consumption Survey – Survey Form”. www.eia.doe.gov/emeu/cbecs/cb99ques.pdf Environmental Protection Agency. 1999. “ENERGY STAR Label for Buildings Technical Description”. May 27, 1999. Environmental Protection Agency. 2001. “Technical Description for the Hotel/Motel Model”, www.energystar.gov/ia/business/evaluate_performance/tech_desc_hotel.pdf, December 11, 2001 Environmental Protection Agency. 2001. “Technical Description for the Grocery Store/Supermarket Model”, www.energystar.gov/ia/business/evaluate_performance/tech_desc_supermarkets.pdf, December 11, 2001 Environmental Protection Agency. 2003. “Professional Engineer’s Guide to the ENERGY STAR Label for Buildings.” EPA 430-F-01. June. Environmental Protection Agency. 2005. “Weather Normalization Description.” www.energystar.gov/index.cfm?c=business.bus_weather_normalization. Environmental Protection Agency. 2003. “Technical Description for the K-12 Model”, www.energystar.gov/ia/business/evaluate_performance/tech_desc_k12.pdf, July 31, 2003. Environmental Protection Agency. 2003. “Technical Description for the Office, Bank, Financial Center, and Courthouse Model”, www.energystar.gov/ia/business/evaluate_performance/tech_desc_office.pdf, July 31, 2003 Environmental Protection Agency. 2003. “Technical Description for the Warehouse Model”, www.energystar.gov/ia/business/evaluate_performance/tech_desc_warehouse.pdf, July 4, 2003.
24

Environmental Protection Agency. 2004. “Technical Description for the Medical Office Building Model”, www.energystar.gov/ia/business/evaluate_performance/tech_desc_medical.pdf, January 14, 2004 Environmental Protection Agency. 2004. “Technical Description for the Residence Halls/Dormitories Model”, www.energystar.gov/ia/business/evaluate_performance/tech_desc_dorms.pdf, January 14, 2004. Energy Protection Agency. 2005. “EPA’s List of Most Energy Efficient Buildings Nears 2000”. Press Release. January 25, 2005. Washington, D.C. Hinge, A., J. Rutherford, D. Abrey, J. daSilva, Elizabeth Titus, and E. Smyth. 2002. “Back to School on Energy Benchmarking”. ACEEE Summer Study, 2002. Kinney, S. and M.A. Piette. 2002. “Development of a California Commercial Building Energy Benchmarking Database”. Lawrence Berkeley National Laboratory Report LBNL-50676. Berkeley, California. Presented at the 2002 ACEEE Summer Study. Kinney, S. and M.A. Piette. 2003. “California Commercial Building Energy Benchmarking: Final Project Report”. Lawrence Berkeley National Laboratory Report LBNL-53479. Berkeley, California. Schwarzenegger, A., Governor of California. 2004. “Executive Order S-20-04”. Executive Department, State of California. Sharp, T.R. 1996. “Energy Benchmarking in Commercial Office Buildings”, Proceedings of the 1996 ACEEE Summer Study, pp 4.321-4.329, Washington, DC: ACEEE. Sharp, T.R. 1998. “Benchmarking Energy Use in Schools”, Proceedings of the 1998 ACEEE Summer Study, pp 3.305-3.316, Washington, DC: ACEEE. Von Neida, B. and Hicks, T. 2001. “Building Performance Defined: the Energy Star National Energy Performance Rating System”. U.S. Environmental Protection Agency. http://www.energystar.gov/ia/business/tools_resources/aesp.pdf
25

26
Appendix A: Analysis of Current EPA Energy Star Models CEUS Data
High Performance Commercial Buildings II
Task 2.3 Develop Dr. CEUS Collaborative Plan Analysis of Current EPA Energy Star Models – CEUS Data
January 28, 2005 Nance Matson and Mary Ann Piette
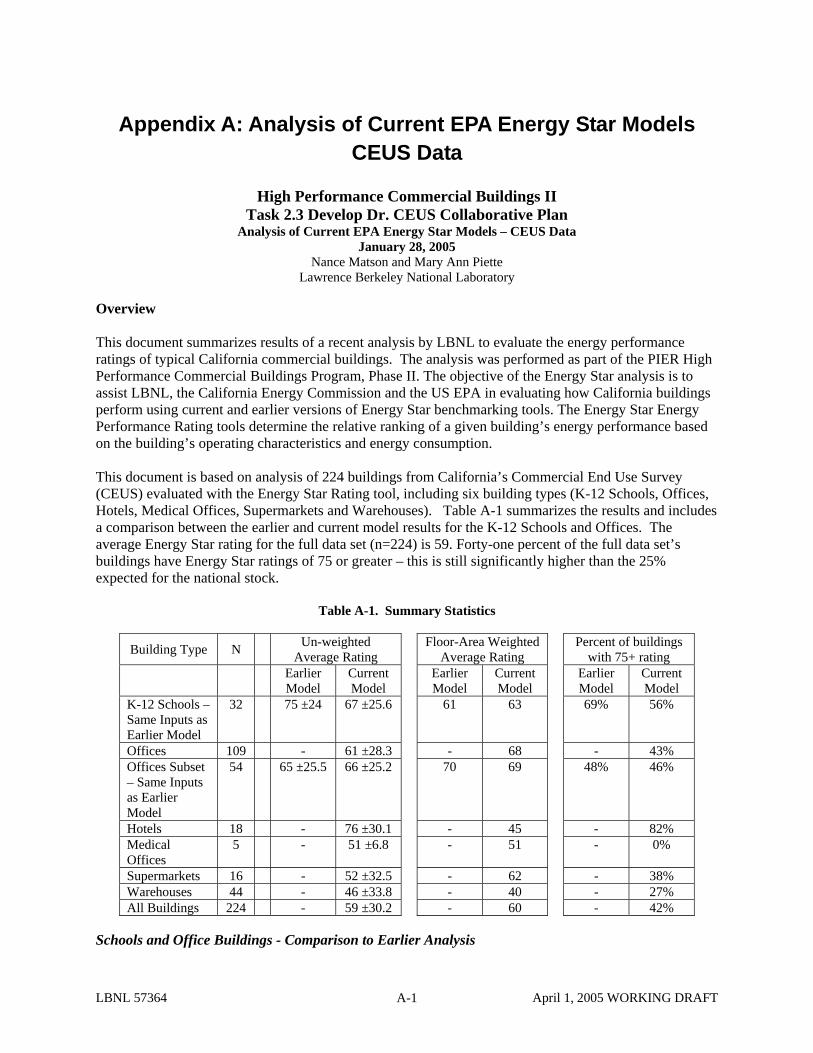
Lawrence Berkeley National Laboratory Overview This document summarizes results of a recent analysis by LBNL to evaluate the energy performance ratings of typical California commercial buildings. The analysis was performed as part of the PIER High Performance Commercial Buildings Program, Phase II. The objective of the Energy Star analysis is to assist LBNL, the California Energy Commission and the US EPA in evaluating how California buildings perform using current and earlier versions of Energy Star benchmarking tools. The Energy Star Energy Performance Rating tools determine the relative ranking of a given building’s energy performance based on the building’s operating characteristics and energy consumption. This document is based on analysis of 224 buildings from California’s Commercial End Use Survey (CEUS) evaluated with the Energy Star Rating tool, including six building types (K-12 Schools, Offices, Hotels, Medical Offices, Supermarkets and Warehouses). Table A-1 summarizes the results and includes a comparison between the earlier and current model results for the K-12 Schools and Offices. The average Energy Star rating for the full data set (n=224) is 59. Forty-one percent of the full data set’s buildings have Energy Star ratings of 75 or greater – this is still significantly higher than the 25% expected for the national stock.
Table A-1. Summary Statistics
Building Type N Un-weighted Average Rating Floor-Area Weighted
Average Rating Percent of buildings with 75+ rating
Earlier Model
Current Model
Earlier Model
Current Model
Earlier Model
Current Model
K-12 Schools – Same Inputs as Earlier Model
32 75 ±24 67 ±25.6 61 63 69% 56%
Offices 109 - 61 ±28.3 - 68 - 43% Offices Subset – Same Inputs as Earlier Model
54 65 ±25.5 66 ±25.2 70 69 48% 46%
Hotels 18 - 76 ±30.1 - 45 - 82% Medical Offices
5 - 51 ±6.8 - 51 - 0%
Supermarkets 16 - 52 ±32.5 - 62 - 38% Warehouses 44 - 46 ±33.8 - 40 - 27% All Buildings 224 - 59 ±30.2 - 60 - 42%
Schools and Office Buildings - Comparison to Earlier Analysis
LBNL 57364 April 1, 2005 WORKING DRAFT A-1

Analyses of the Energy Star ratings of CEUS buildings using the earlier K-12 school and office building Energy Star models was conducted by LBNL in 2002. These analyses found that California buildings tended to have higher scores than the national averages. This difference was most prominent with the school buildings, although there was concern from EPA that the CEUS occupant densities were erroneous and problematic. As discussed below as well as in the detailed results sections of this memo, EPA has since revised the K-12 schools and office building models and we have compared the new and old ratings for these buildings. Detailed results of this analysis are provided in the results section of this memo. Schools Model The earlier Energy Star schools model included location, floor area, hours of operation, number of students, number of computers, heating degree days, presence of on-site cooking facilities, and the percent of school floor area that is air conditioned. The current model includes these inputs, though the number of students variable has been redefined - it is now the number of students at classroom capacity (design conditions), rather than the average number of students over the school year. This difference can impact the rating score if average capacity is significantly different than design capacity. The current model also includes both heating and cooling degree-days, percent of school heated, and presence of mechanical ventilation. Based on LBNL’s previous analysis that schools with swimming pools had higher energy use intensities (EUIs) and corresponding lower ratings, the current model takes into account energy use from swimming pools as well as energy use from garages and data centers. Compared to the earlier model, the average schools ratings have decreased significantly (from 75 to 67) and there is a broader distribution of ratings. The percentage of schools with a 75 or greater rating has dropped from 69% to 53%. This reflects the influence of including heating and cooling degree-days and the pools model in the school Energy Star model. Office Building Model The earlier Energy Star office model included location, floor area, hours of operation, number of occupants, number of computers and cooling degree days. During our previous analysis, we noticed that the distribution of California climate zone heating and cooling degree days is significantly different from that for the National Data, possibly resulting in higher than expected Energy Star ratings for California office buildings. EPA’s current office model now takes heating and cooling degree days and office type (banking and finance, courthouse, and general office) into account. It takes into account the impact of parking garages and data centers on the Energy Star rating. With the current office model, the average office building rating is 70, about the same as with the earlier model. Using the current model, the percent of office buildings with a 75 or greater rating has decreased slightly (48% to 43%). The average office building rating is still significantly higher than the ratings calculated in the EPA’s analysis of the 1995 and 1999 California Commercial Building End-use Consumption (CBECS) office data – using the current model, the California CBECS office buildings’ average ratings were 53 and 55, respectively. Hotels, Medical Offices, Supermarkets and Warehouses There are a high percentage of hotels with 75 or greater ratings (82%) – reflecting that the California hotels may not be well modeled using the national model, although this is a small sample (n=18). The ratings of the five medical offices rated are tightly grouped in the 40-60 range. This small sample size is not sufficient to determine whether the model serves California medical offices well. 38% of the
LBNL 57364 April 1, 2005 WORKING DRAFT A-2

LBNL 57364 April 1, 2005 WORKING DRAFT A-3
supermarkets and 25% of the warehouses have 75 or better ratings, which may be more reasonable in terms of the national model. Energy Star Model – Synopsis The Energy Star model is based on building-type specific regression analysis, where annual source energy consumption is predicted based on building characteristics and occupancy factors. The regression analyses for the K-12 schools, office buildings, medical office buildings and warehouses are based on the 1999 CBECS data. The grocery and supermarket regression analysis is based on the 1992 and 1995 CBECS data. The hotel/motel regression analysis is based on data from The Hospitality Research Group’s (HRG) Trends in the Hotel Industry database. Table A-2 summarizes the building-specific input assumptions. The detailed results sections further discuss these inputs. The Energy Star rating of a given building is determined as follows:
• The building-type specific regression model, based on the applicable CBECS or Hotel data, is used to predict the Actual LnSource energy consumption (EUI) for each observation. Independent variables are described in the building-specific results section.
• After generating EUI histograms, the Actual LnSource EUI (kBtu/yr) data is mapped on a 1-100 point scale, with the 75% percentile Actual LnSource EUI at the 75 point level. This data is then smoothed out by fitting the data to a gamma distribution (Fitted LnSource EUI, kBtu/yr).
• The regression model is used to predict a specific building’s source EUI. • The Customized Source EUIs are calculated by multiplying the Fitted LnSource EUI data by an
adjustment factor ([predicted building Source EUI]/[mean model Source EUI]). • For the hotel and supermarket models, the Customized Source EUI values are calculated by
applying the adjustment factor to the Fitted LnSource EUI data and then dividing the exponent of the adjusted Fitted LnSource EUI data by the building floor area.
• The building source energy consumption (Source EUI) is weather normalized based a 30-year average weather year.
• The weather-normalized building source energy consumption is compared to the Customized Source EUI values to determine the building’s Energy Star rating.

Table A-2. Energy Star Model Building-specific Input Assumptions
K-12 Schools Office Hotels Medical Offices Supermarkets Warehouses Zip Code required required required required required required Year Built required required required required required required
Area School building floor area, less garage and data
center area
Office building floor area, less garage and data
center area
Floor area, number of rooms,
% occupancy
Floor area Floor area, number of floors
or levels
Floor area
Hours of Use Operating hours per week
Operating hours per week
- Operating hours per week
Hours at full staffing level
Hours at full staffing level
Number of Occupants
Number of students at classroom capacity
Number of Employees
- Number of employees
Main shift staffing - number
of employees
Main shift staffing – number
of employees
Number of Personal Computers
Total number of personal
computers and servers
Total number of personal
computers and servers
- - Number of registers and
personal computers
normally in use
-
On-site Cooking Dedicated facilities for food preparation and
serving
- Dedicated facilities for food preparation and
serving
- Dedicated facilities for food
preparation (bakery,
restaurant, etc.)
-
On-site Laundry - - Laundry facilities to wash hotel
linens
- - -
%Floor area air conditioned
required - - required - required
% Floor area heated
required - - required - required
Mechanical Ventilation
Yes/No based on economizer or system type
- - - - -
Table A-2(cont.) Energy Star Model Building-specific Input Assumptions
LBNL 57364 April 1, 2005 WORKING DRAFT
A-4
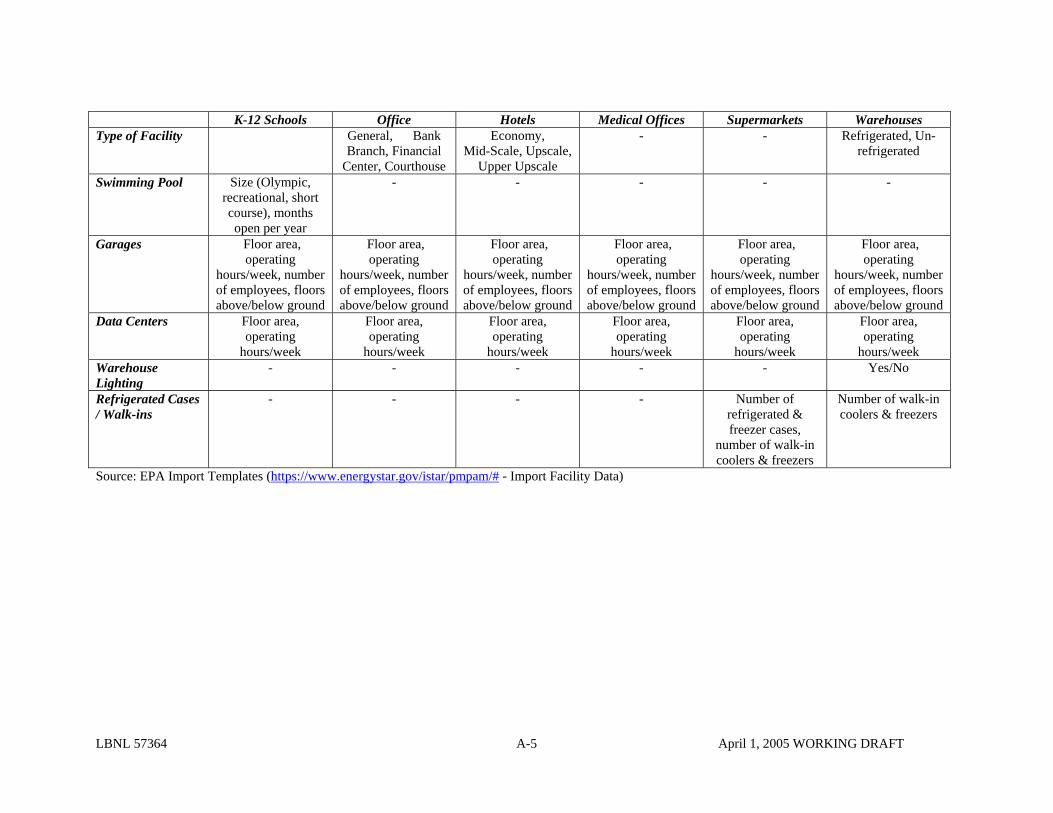
LBNL 57364 April 1, 2005 WORKING DRAFT
A-5
K-12 Schools Office Hotels Medical Offices Supermarkets Warehouses Type of Facility General, Bank
Branch, Financial Center, Courthouse
Economy, Mid-Scale, Upscale,
Upper Upscale
- - Refrigerated, Un-refrigerated
Swimming Pool Size (Olympic, recreational, short course), months open per year
- - - - -
Garages Floor area, operating
hours/week, number of employees, floors above/below ground
Floor area, operating
hours/week, number of employees, floors above/below ground
Floor area, operating
hours/week, number of employees, floors above/below ground
Floor area, operating
hours/week, number of employees, floors above/below ground
Floor area, operating
hours/week, number of employees, floors above/below ground
Floor area, operating
hours/week, number of employees, floors above/below ground
Data Centers Floor area, operating
hours/week
Floor area, operating
hours/week
Floor area, operating
hours/week
Floor area, operating
hours/week
Floor area, operating
hours/week
Floor area, operating
hours/week Warehouse Lighting
- - - - - Yes/No
Refrigerated Cases / Walk-ins
- - - - Number of refrigerated & freezer cases,
number of walk-in coolers & freezers
Number of walk-in coolers & freezers
Source: EPA Import Templates (https://www.energystar.gov/istar/pmpam/# - Import Facility Data)

Energy Star Results K-12 Schools There are 45 K-12 Schools in the CEUS database. Of these, 32 had the complete set of building characteristics and energy consumption data required to be rated using the current model. The schools were modeled using the same inputs as used for the earlier model, allowing a comparison between the two models. For the new model, the average Energy Star rating is 66 (floor-area weighted is 63) (n=32). Seventeen schools have ratings of 75 or greater (53% of sample). Figure A-1 and Table A-3 show the distribution of scores for the new model, while Figures A-2 and A-3 compare the results of the two models. The distribution of scores is broader than found with the earlier model. The current model’s scores are on average 9.75% lower than those from the earlier model. This reflects the impact of including both heating and cooling degree days, as well as the pool model, into the school Energy Star model.
0
2
4
6
8
10
12
14
16
0 20 40 60 80 100 More
Energy Star Rating
Freq
uenc
y
0%
25%
50%
75%
100%
Figure A-1. School Energy Star Ratings (n=32)
A-6
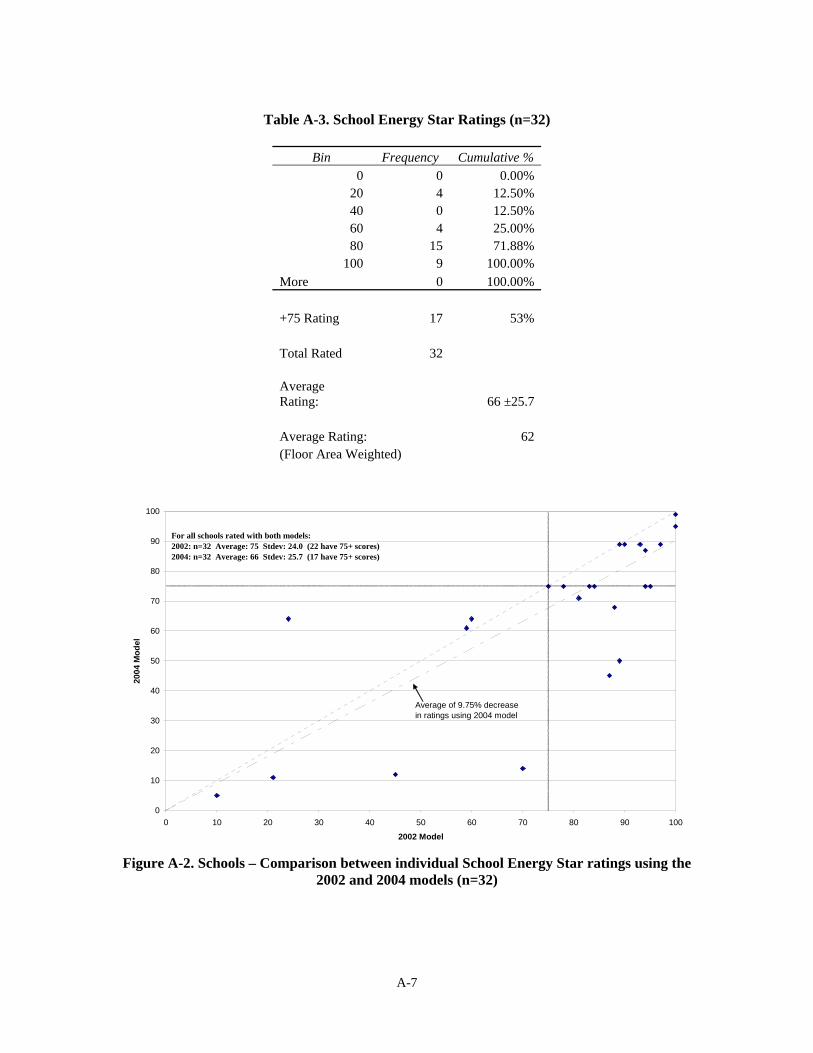
Table A-3. School Energy Star Ratings (n=32)
Bin Frequency Cumulative %
0 0 0.00% 20 4 12.50% 40 0 12.50% 60 4 25.00% 80 15 71.88%
100 9 100.00% More 0 100.00% +75 Rating 17 53% Total Rated 32 Average Rating: 66 ±25.7 Average Rating: 62 (Floor Area Weighted)
0
10
20
30
40
50
60
70
80
90
100
0 10 20 30 40 50 60 70 80 90 10
2002 Model
2004
Mod
el
0
Average of 9.75% decrease in ratings using 2004 model
For all schools rated with both models:2002: n=32 Average: 75 Stdev: 24.0 (22 have 75+ scores)2004: n=32 Average: 66 Stdev: 25.7 (17 have 75+ scores)
Figure A-2. Schools – Comparison between individual School Energy Star ratings using the
2002 and 2004 models (n=32)
A-7
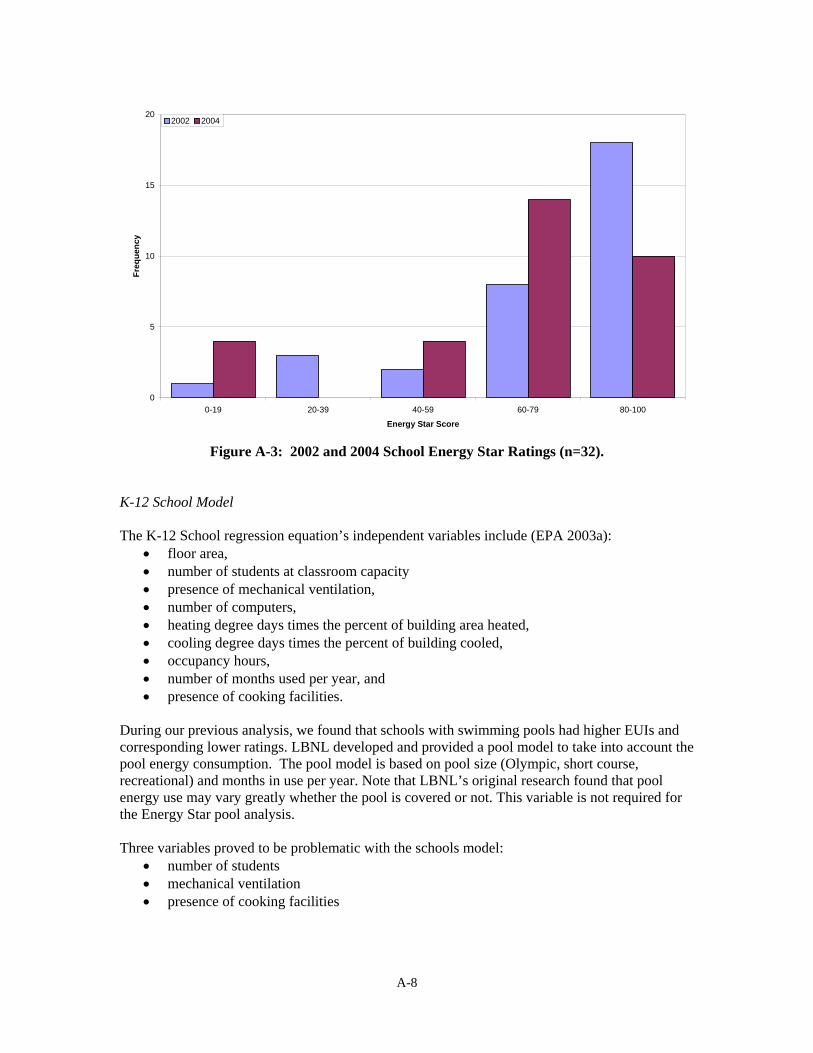
0
5
10
15
20
0-19 20-39 40-59 60-79 80-100
Energy Star Score
Freq
uenc
y
2002 2004
Figure A-3: 2002 and 2004 School Energy Star Ratings (n=32).
K-12 School Model The K-12 School regression equation’s independent variables include (EPA 2003a):
• floor area, • number of students at classroom capacity • presence of mechanical ventilation, • number of computers, • heating degree days times the percent of building area heated, • cooling degree days times the percent of building cooled, • occupancy hours, • number of months used per year, and • presence of cooking facilities.
During our previous analysis, we found that schools with swimming pools had higher EUIs and corresponding lower ratings. LBNL developed and provided a pool model to take into account the pool energy consumption. The pool model is based on pool size (Olympic, short course, recreational) and months in use per year. Note that LBNL’s original research found that pool energy use may vary greatly whether the pool is covered or not. This variable is not required for the Energy Star pool analysis. Three variables proved to be problematic with the schools model:
• number of students • mechanical ventilation • presence of cooking facilities
A-8

Number of Students. The number of students is defined as the school’s classroom capacity – the number of students who can be seated in all classrooms at one time. The CEUS database does not report this number – the closest possible is the maximum number of occupants, which was used in this analysis. Mechanical Ventilation. The mechanical ventilation flag (yes/no) definition is difficult to interpret: “Mechanical ventilation was defined to not exist (VENT=0) when heating-air furnaces, space heaters, district heating systems, or internal boilers were used for space heating in combination with no space cooling or the use of window or residential-type air conditioners. One variance from this definition was that mechanical ventilation was defined to exist (VENT=1) when variable-air volume (VAV) systems or economizers were present regardless of the type of space heating or cooling system or the presence of space cooling. Buildings with other space heating and cooling systems were defined as ventilated (VENT=1)” (Technical Description for the K-12 Model; July 31, 2003). The CEUS HVAC system descriptors, while providing a significant amount of information, did not provide enough information to use the first part of the definition (VENT=0) to discern whether mechanical ventilation was present. To determine whether a given school had mechanical ventilation, we calculated the percentage of cooling capacity with economizers. Heating capacity was used if the school didn’t have space cooling, and floor area was used if no space conditioning capacities given. The school was thus defined to have mechanical ventilation if greater than 50% of the school cooling capacity, heating capacity, or floor area had economizers. Any school with less than 50% economizer capacity was assumed to not have mechanical ventilation. Presence of Cooking Facilities. The model defines the presence of cooking facilities as “dedicated facilities in which food is prepared and served to students. If the school has facilities in which food for students is only kept warm and/or served, or has only a galley that is used by teachers and staff,” the school does not have cooking facilities. The CEUS data includes three sets of variables which can be used to discern whether the school has cooking facilities – number of meals (breakfast, lunch, dinner) served per day, percent of space used for cooking, and an inventory of cooking appliances and the number of hours used per week. The number of meals served per day was used to determine the cooking flag, double-checked using the percent of space used for cooking and the number of hours cooking appliances are used.
A-9
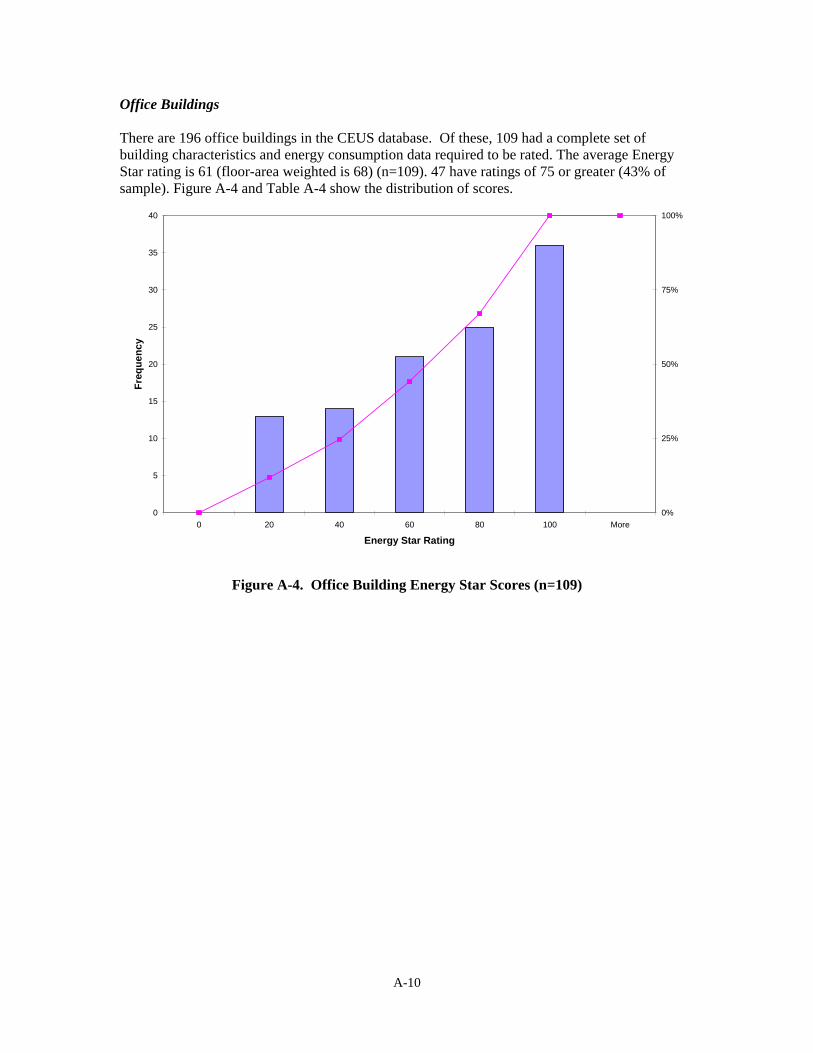
Office Buildings There are 196 office buildings in the CEUS database. Of these, 109 had a complete set of building characteristics and energy consumption data required to be rated. The average Energy Star rating is 61 (floor-area weighted is 68) (n=109). 47 have ratings of 75 or greater (43% of sample). Figure A-4 and Table A-4 show the distribution of scores.
0
5
10
15
20
25
30
35
40
0 20 40 60 80 100 More
Energy Star Rating
Freq
uenc
y
0%
25%
50%
75%
100%
Figure A-4. Office Building Energy Star Scores (n=109)
A-10
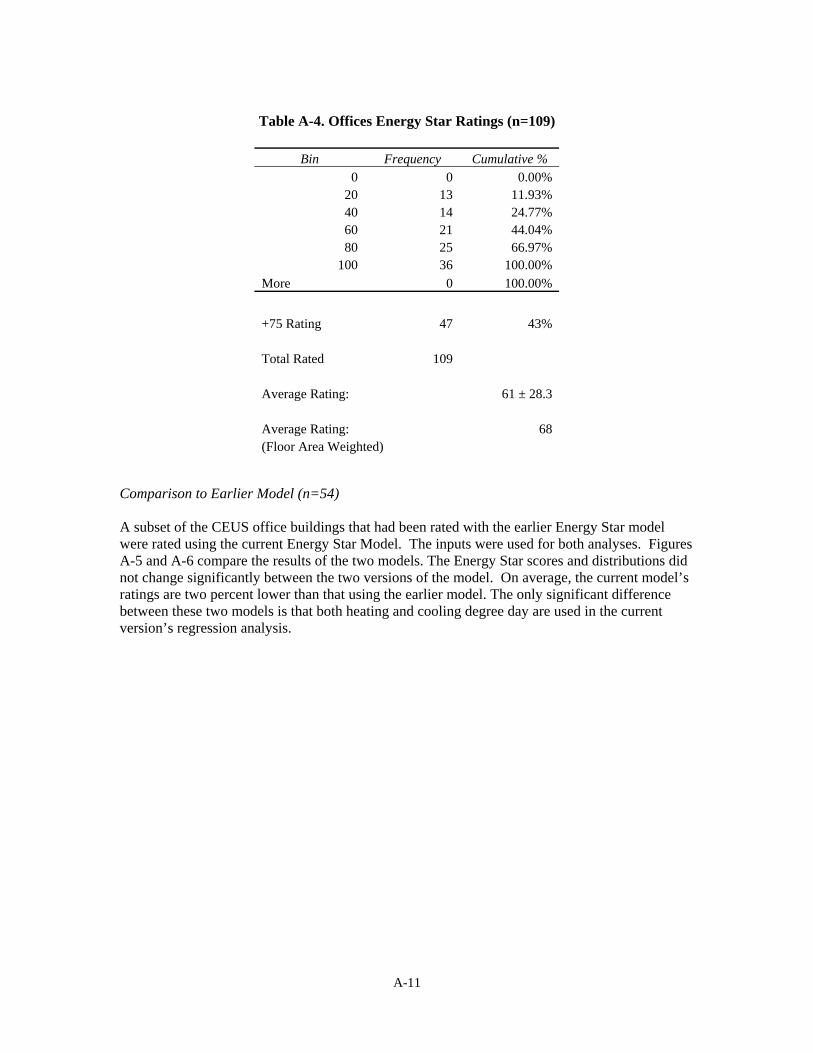
Table A-4. Offices Energy Star Ratings (n=109)
Bin Frequency Cumulative % 0 0 0.00%
20 13 11.93% 40 14 24.77% 60 21 44.04% 80 25 66.97%
100 36 100.00% More 0 100.00% +75 Rating 47 43% Total Rated 109 Average Rating: 61 ± 28.3 Average Rating: 68 (Floor Area Weighted)
Comparison to Earlier Model (n=54) A subset of the CEUS office buildings that had been rated with the earlier Energy Star model were rated using the current Energy Star Model. The inputs were used for both analyses. Figures A-5 and A-6 compare the results of the two models. The Energy Star scores and distributions did not change significantly between the two versions of the model. On average, the current model’s ratings are two percent lower than that using the earlier model. The only significant difference between these two models is that both heating and cooling degree day are used in the current version’s regression analysis.
A-11
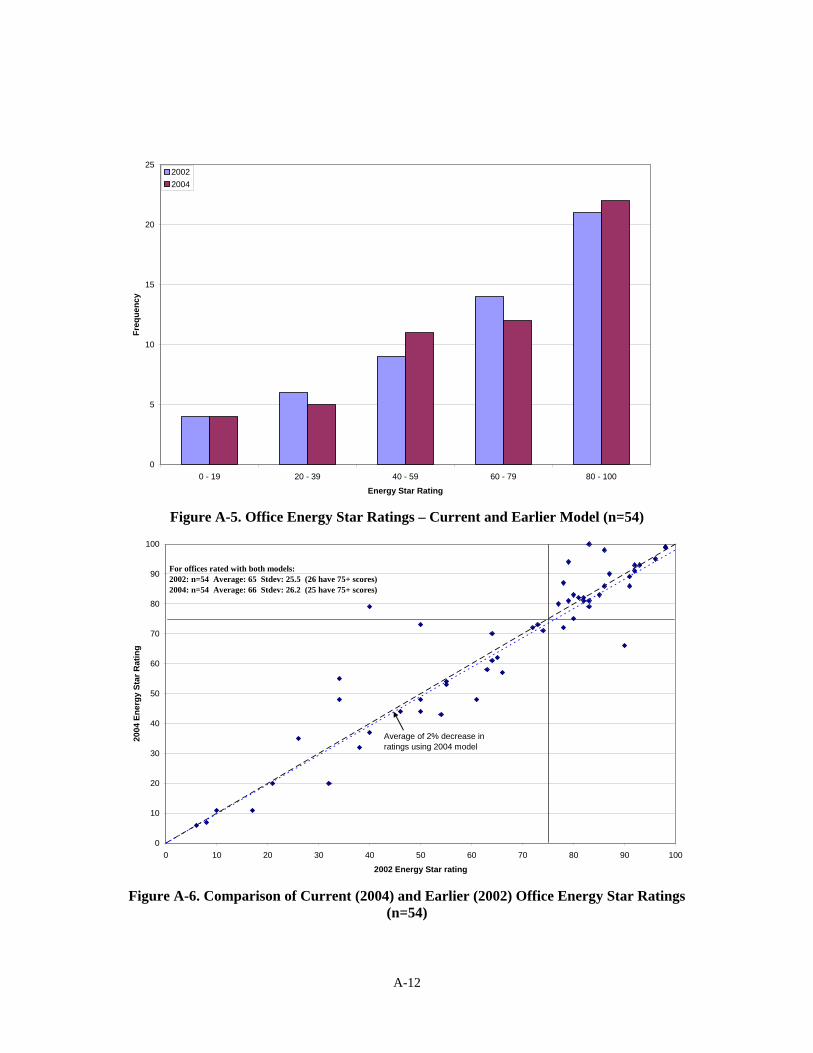
0
5
10
15
20
25
0 - 19 20 - 39 40 - 59 60 - 79 80 - 100
Energy Star Rating
Freq
uenc
y
20022004
Figure A-5. Office Energy Star Ratings – Current and Earlier Model (n=54)
0
10
20
30
40
50
60
70
80
90
100
0 10 20 30 40 50 60 70 80 90 10
2002 Energy Star rating
2004
Ene
rgy
Star
Rat
ing
0
For offices rated with both models:2002: n=54 Average: 65 Stdev: 25.5 (26 have 75+ scores)2004: n=54 Average: 66 Stdev: 26.2 (25 have 75+ scores)
Average of 2% decrease in ratings using 2004 model
Figure A-6. Comparison of Current (2004) and Earlier (2002) Office Energy Star Ratings
(n=54)
A-12

Office Model The office building regression equation’s independent variables include (EPA 2003b):
• floor area, • number of computers, • occupancy hours, • number of employees, • heating degree days, • cooling degree days, and • type of building (general, bank, financial center, and courthouse).
Other variables requested, but not used directly in the office regression model include the presence of garages and data centers – these inputs were used to take into account their impact on the Energy Star rating. The CEUS maximum building occupancy data was used for the number of employees. This may overestimate the number of employees, resulting in a slightly higher rating.
A-13

Hotels and Motels There are 22 hotels and motels in the CEUS database. Of these, eighteen were able to be rated (5 economy, 6 mid-scale, 5 upscale and 2 upper upscale). Eleven have ratings of 75 or greater (61% of sample). The average Energy Star rating is 76 (floor-area weighted is 45) (n=18). Figure A-7 and Table A-5 show the distribution of scores. Hotel and Motel Model There are five regression equations, based on type of hotel (economy, midscale with food preparation, midscale without food preparation, upscale and upper upscale). The independent variables for the economy, midscale and upscale hotels include (EPA 2001a):
• total degree-days (heating plus cooling degree-days, base 65), • number of rooms, and • presence of food preparation facilities.
The upper upscale hotel model is based on the number of rooms and presence of food preparation facilities only. Other variables requested, but not used directly by the model include the floor area, occupancy rate, presence of laundry facilities, and garage and data center inputs. The garage and data center inputs were used to take into account their impact on the Energy Star rating.
0
2
4
6
8
10
12
0 20 40 60 80 100 More
Energy Star Rating
Freq
uenc
y
0%
25%
50%
75%
100%
Figure A-7. Hotel Energy Star Ratings (n=18)
A-14

Table A-5. Hotel Energy Star Ratings (n=18)
Bin Frequency Cumulative %
0 0 0.00% 20 1 5.56% 40 2 16.67% 60 1 22.22% 80 3 38.89%
100 11 100.00% More 0 100.00% +75 Rating 11 61% Total Rated 18 Average Rating: 76 ±30.1 Average Rating: 45 (Floor Area Weighted)
A-15

Medical Offices There are 18 medical office buildings in the CEUS database. Of these, five were able to be rated. Their scores were similar, ranging from 42 to 60. The average Energy Star rating is 51 (floor-area weighted is 52) (n=5). None have ratings of 75 or greater. Figure A-8 and Table A-6 show the distribution of scores. Medical Office Model The medical office regression equation’s independent variables include (2004):
• floor area, • number of workers, • occupancy hours, • heating degree days times the percent of building area heated, and • cooling degree days times the percent of building cooled.
0
1
2
3
4
5
6
0 20 40 60 80 100 More
Energy Star Rating
Freq
uenc
y
0%
25%
50%
75%
100%
Figure A-8. Medical Offices Energy Star Ratings (n=5)
A-16
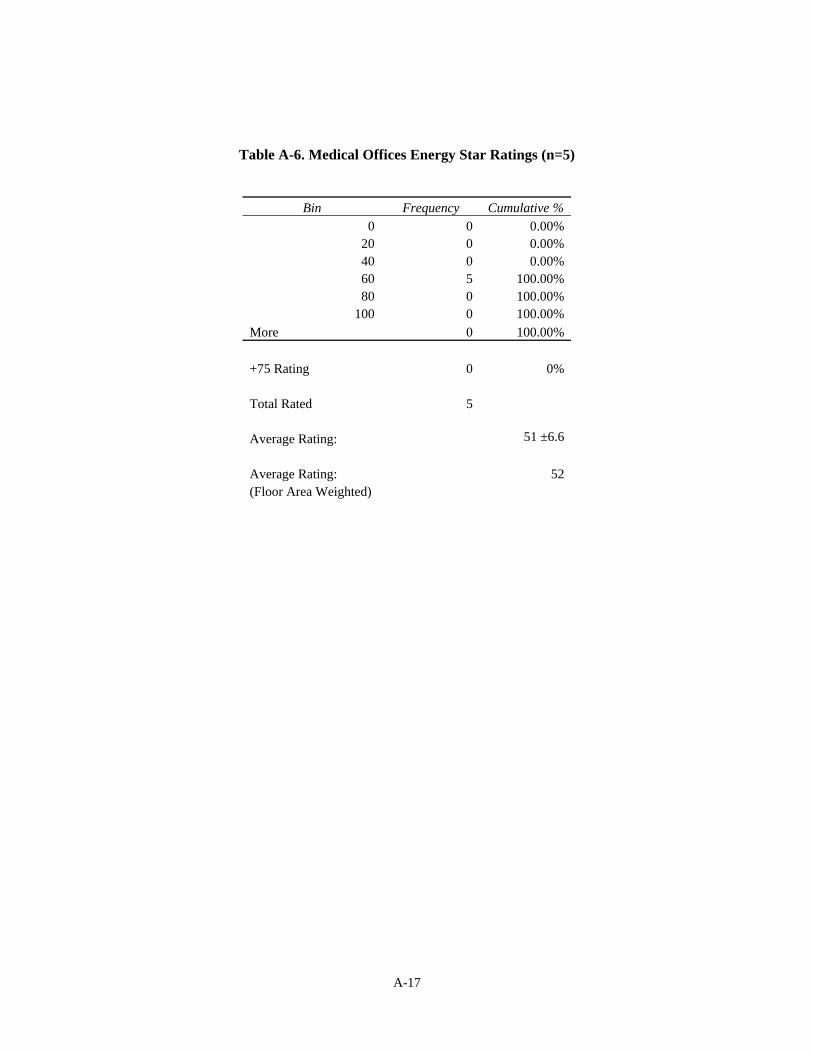
Table A-6. Medical Offices Energy Star Ratings (n=5)
Bin Frequency Cumulative %
0 0 0.00% 20 0 0.00% 40 0 0.00% 60 5 100.00% 80 0 100.00%
100 0 100.00% More 0 100.00% +75 Rating 0 0% Total Rated 5 Average Rating: 51 ±6.6 Average Rating: 52 (Floor Area Weighted)
A-17
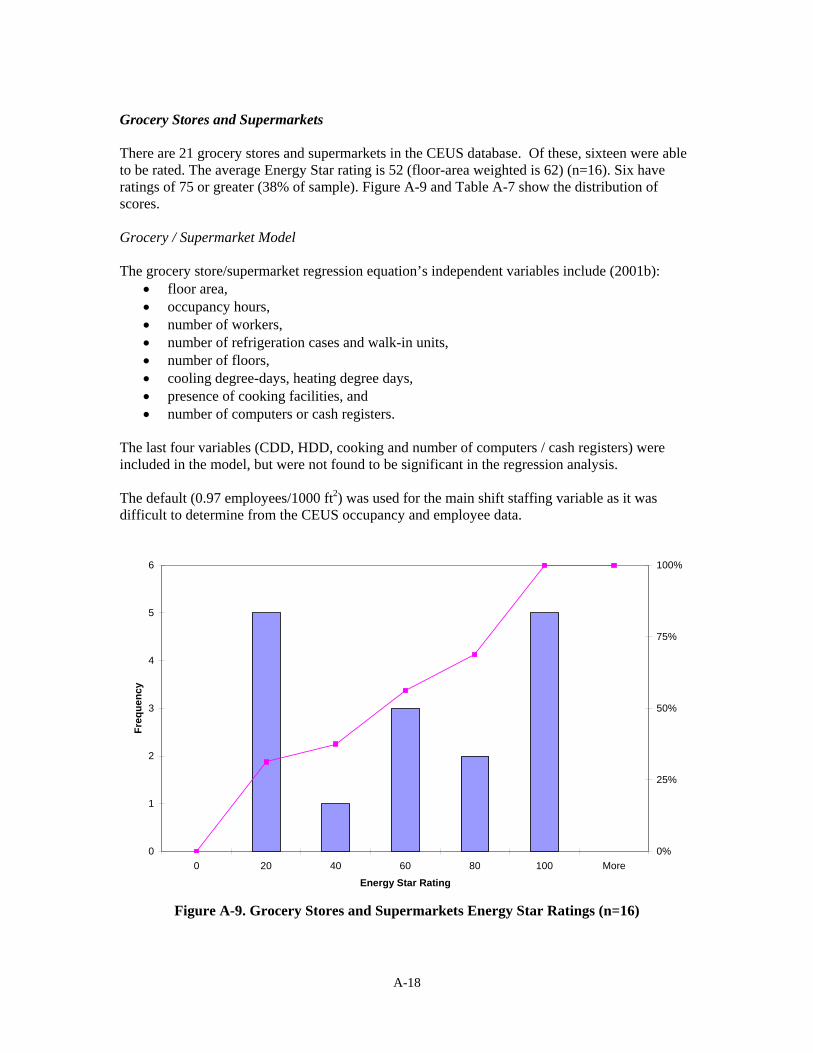
Grocery Stores and Supermarkets There are 21 grocery stores and supermarkets in the CEUS database. Of these, sixteen were able to be rated. The average Energy Star rating is 52 (floor-area weighted is 62) (n=16). Six have ratings of 75 or greater (38% of sample). Figure A-9 and Table A-7 show the distribution of scores. Grocery / Supermarket Model The grocery store/supermarket regression equation’s independent variables include (2001b):
• floor area, • occupancy hours, • number of workers, • number of refrigeration cases and walk-in units, • number of floors, • cooling degree-days, heating degree days, • presence of cooking facilities, and • number of computers or cash registers.
The last four variables (CDD, HDD, cooking and number of computers / cash registers) were included in the model, but were not found to be significant in the regression analysis. The default (0.97 employees/1000 ft2) was used for the main shift staffing variable as it was difficult to determine from the CEUS occupancy and employee data.
0
1
2
3
4
5
6
0 20 40 60 80 100 More
Energy Star Rating
Freq
uenc
y
0%
25%
50%
75%
100%
Figure A-9. Grocery Stores and Supermarkets Energy Star Ratings (n=16)
A-18
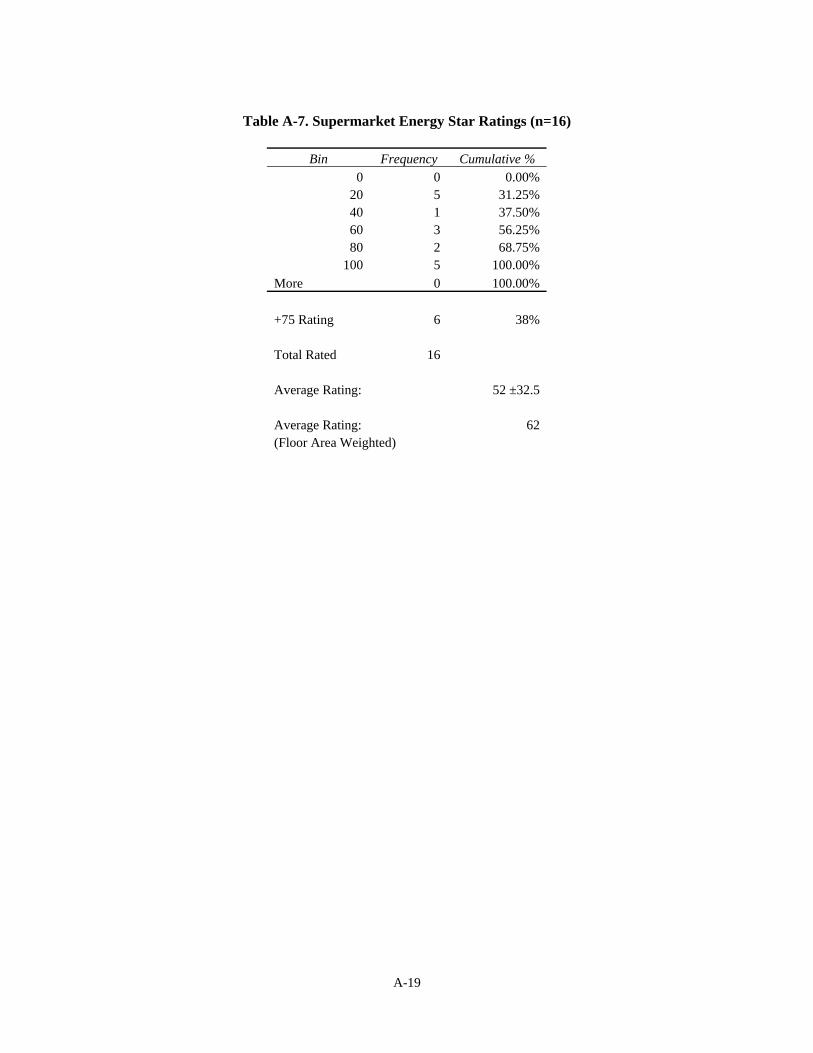
Table A-7. Supermarket Energy Star Ratings (n=16)
Bin Frequency Cumulative %
0 0 0.00% 20 5 31.25% 40 1 37.50% 60 3 56.25% 80 2 68.75%
100 5 100.00% More 0 100.00% +75 Rating 6 38% Total Rated 16 Average Rating: 52 ±32.5 Average Rating: 62 (Floor Area Weighted)
A-19
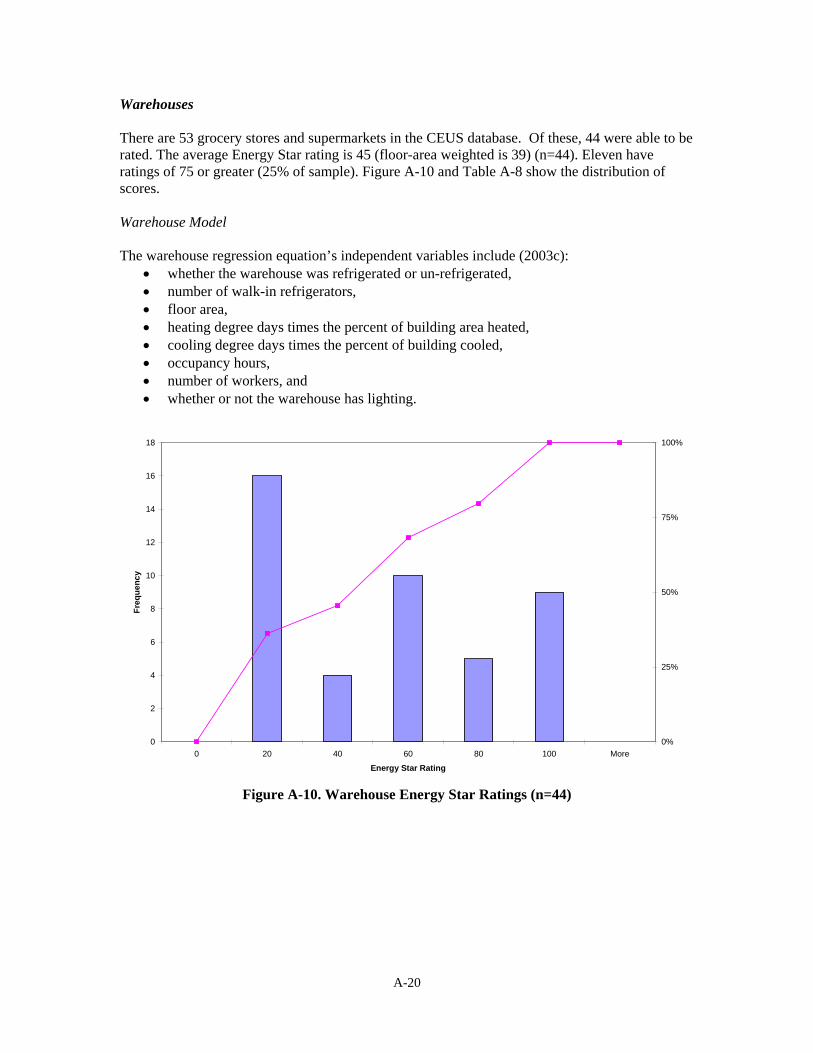
Warehouses There are 53 grocery stores and supermarkets in the CEUS database. Of these, 44 were able to be rated. The average Energy Star rating is 45 (floor-area weighted is 39) (n=44). Eleven have ratings of 75 or greater (25% of sample). Figure A-10 and Table A-8 show the distribution of scores. Warehouse Model The warehouse regression equation’s independent variables include (2003c):
• whether the warehouse was refrigerated or un-refrigerated, • number of walk-in refrigerators, • floor area, • heating degree days times the percent of building area heated, • cooling degree days times the percent of building cooled, • occupancy hours, • number of workers, and • whether or not the warehouse has lighting.
0
2
4
6
8
10
12
14
16
18
0 20 40 60 80 100 More
Energy Star Rating
Freq
uenc
y
0%
25%
50%
75%
100%
Figure A-10. Warehouse Energy Star Ratings (n=44)
A-20

Table A-8. Warehouse Energy Star Ratings (n=44)
Bin Frequency Cumulative %
0 0 0.00% 20 16 36.36% 40 4 45.45% 60 10 68.18% 80 5 79.55%
100 9 100.00% More 0 100.00% +75 Rating 11 25% Total Rated 44 Average Rating: 45 ±33.6 Average Rating: 39 (Floor Area Weighted)
Energy Star Portfolio Manager The Energy Star Portfolio Manager provides a means to review inputs and results. Users can interactively change inputs and view the change in rating for a given building. We found the import tool easy to use and that it was easy to input data for a new building directly into the portfolio manager. However, changing a number of variables for a individual building requires going through a number of screens repeatedly to change values. It is impossible to look at all inputs for a given building at one time – when changing variables one must perform multiple clicks to change one input. One possible improvement would be for the portfolio manager to provide a single page with all input variables and outputs for an individual building. The user could review the buildings alert messages, determine what the problem may be, correct the inputs as needed, and view the revised score (or alert messages). References US EPA, “Technical Description for the K-12 Model”, July 31, 2003. US EPA, “Technical Description for the Office, Bank, Financial Center, and Courthouse Model”, July 31, 2003 US EPA, “Technical Description for the Hotel/Motel Model”, December 11, 2001 US EPA, “Technical Description for the Medical Office Building Model”, January 14, 2004 US EPA, “Technical Description for the Grocery Store/Supermarket Model”, December 11, 2001 US EPA, “Technical Description for the Warehouse Model”, July 4, 2003.
A-21

A-22

Appendix B: EPA Energy Star Model Regression Equations and Input Requirements
B.1 Energy Star Regression Equations This section provides the regression equations used for each of the Energy Star models. The description of each equation includes the equation, variable definitions, sample size (N), and goodness of fit (R2). The “floor area-based” R2 is the goodness of fit of a regression equation using the floor area as the only independent variable. The regression analyses for the K-12 schools, office buildings, medical office buildings and warehouses are based on the 1999 CBECS data. The grocery and supermarket regression analyses are based on the 1992 and 1995 CBECS data. The hotel/motel regression analysis is based on data from The Hospitality Research Group’s (HRG) Trends in the Hotel Industry database. The hospital regression analysis is based on the 1997 EPRI Energy Benchmarking Survey. Mapping of Building Energy Consumption (EUI) on 1-100 Rating Scale:
• The building-type specific regression model (based on the applicable CBECS, Hotel or EPRI Hospital data) is used to predict the Actual LnSource energy consumption (EUI) for each observation in the data set (CBECS, Hotel or EPRI data). Independent variables are described in Appendix B.
• After generating EUI histograms, the Actual LnSource EUI (kBtu/ ft2-yr) data is mapped on a 1-100 point scale, with the 75% percentile Actual LnSource EUI at the 75 point level. This data is then smoothed out by fitting the data to a gamma distribution (Fitted LnSource EUI, kBtu/ft2-yr).
Energy Star Rating Calculation:
• The regression model is used to predict a specific building’s source EUI. • The Customized Source EUIs are calculated by multiplying the Fitted LnSource
EUI data by an adjustment factor ([predicted building Source EUI]/[mean model Source EUI]).
• For the hotel and supermarket models, the Customized Source EUI values are calculated by applying the adjustment factor to the Fitted LnSource EUI data and then dividing the exponent of the adjusted Fitted LnSource EUI data by the building floor area.
• The building source energy consumption (Source EUI) is weather normalized based a 30-year average weather year (See Section 2.D).
• The weather-normalized building source energy consumption is compared to the Customized Source EUI values to determine the building’s Energy Star rating.
K-12 Schools:
B-1

Ln Source EU = 4.45 + 0.843 (Ln(Sqft)) + 0.123(Ln(Edseat)) +0.149(Vent) + 0.08(Ln(PCnum)) + 6.156e-5(HDDxheatp) + 1.484e-4(CDDxcoolp) + 0.063(Ln(Wkhrs)) + 0.057(Monuse12) + 0.098(Cook) Sqft = Gross building square footage Edseat = Number of students that can be seated in all of the classrooms Vent = Mechanical ventilation present (0=no, 1=yes) PCnum = Number of personal computers HDD = Heating Degree Days (Base 65 F) Heatp = percent of the gross floor area that is heated CDD = Cooling Degree Days (Base 65 F) Coolp = percent of the gross floor area that is mechanically cooled Wkhrs = average weekly hours when building is at least 50% occupied Monuse12 = year-round use (0=no, 1=yes) Cook = Presence of an area dedicated to cooking and serving food (0=no,1=yes) N (adjusted) = 400 R2 = 0.8775 Adjusted R2 = 0.8746 Floor Area-based R2 = 0.85 Offices: Current Model:
SqFt = Gross building or facility area PCs = Number of Personal Computers WkHrs = Weekly hours of use Nwker = Number of workers HDD = Heating Degree Days (Base-65F) CDD = Cooling Degree Days (Base-65F) Bank = Facility is a bank (0=No, 1=Yes) FinCtr = Facility is a financial center (0=No, 1=Yes) Courthse = Facility is a courthouse (0=No, 1=Yes) N (adjusted) = 910 R2 = 0.9338 Adjusted R2 = 0.9331
B-2
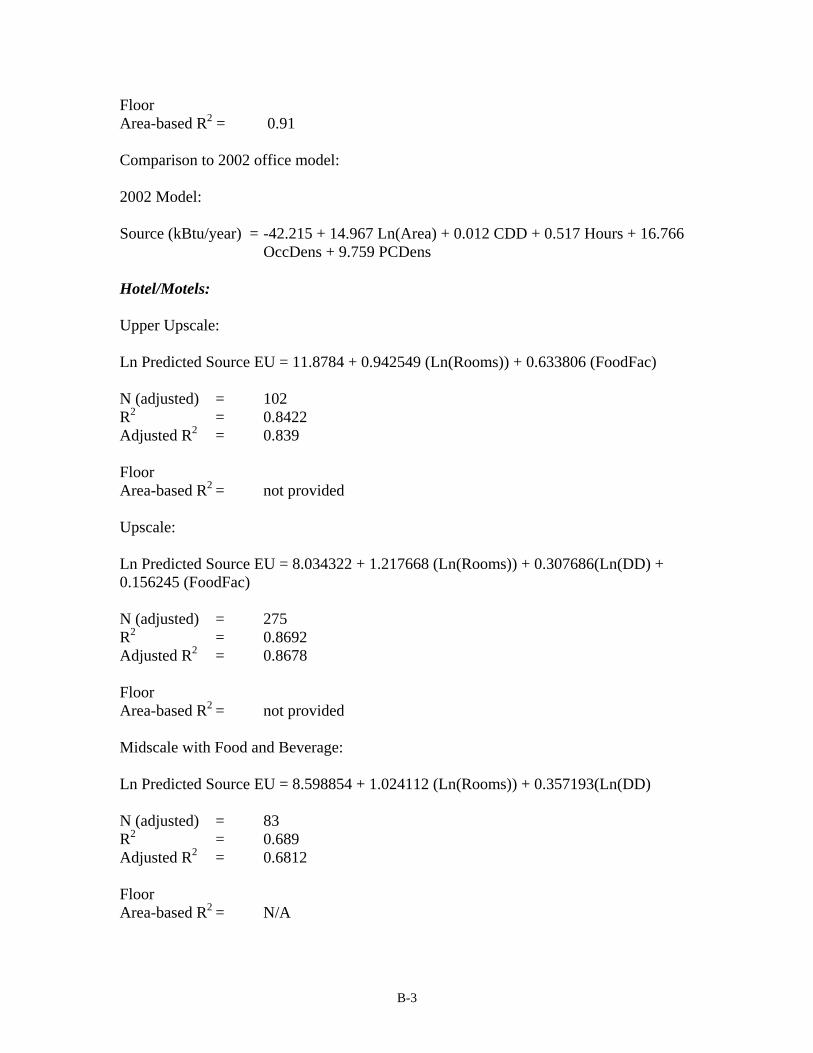
Floor Area-based R2 = 0.91 Comparison to 2002 office model: 2002 Model: Source (kBtu/year) = -42.215 + 14.967 Ln(Area) + 0.012 CDD + 0.517 Hours + 16.766
OccDens + 9.759 PCDens Hotel/Motels: Upper Upscale: Ln Predicted Source EU = 11.8784 + 0.942549 (Ln(Rooms)) + 0.633806 (FoodFac) N (adjusted) = 102 R2 = 0.8422 Adjusted R2 = 0.839 Floor Area-based R2 = not provided Upscale: Ln Predicted Source EU = 8.034322 + 1.217668 (Ln(Rooms)) + 0.307686(Ln(DD) + 0.156245 (FoodFac) N (adjusted) = 275 R2 = 0.8692 Adjusted R2 = 0.8678 Floor Area-based R2 = not provided Midscale with Food and Beverage: Ln Predicted Source EU = 8.598854 + 1.024112 (Ln(Rooms)) + 0.357193(Ln(DD) N (adjusted) = 83 R2 = 0.689 Adjusted R2 = 0.6812 Floor Area-based R2 = N/A
B-3

Midscale without Food and Beverage: Ln Predicted Source EU = 9.497230 + 1.121501 (Ln(Rooms)) + 0.15545 (Ln(DD) N (adjusted) = 159 R2 = 0.6017 Adjusted R2 = 0.5966 Floor Area-based R2 = not provided Economy: Ln Predicted Source EU = 7.728508 + 0.933250 (Ln(Rooms)) + 0.448884 (Ln(DD) + 0.466603 (FoodFac) N (adjusted) = 86 R2 = 0.8793 Adjusted R2 = 0.8749 Floor Area-based R2 = N/A Rooms = Number of hotel rooms DD = Total heating and cooling degree days (base 65F) FoodFac = Presence of revenue-generating food and beverage and/or Banquet
facility (0=no, 1=yes) Medical Offices: Ln Predicted Source EU = 2.789 + 0.914 (Ln(Sqft)) + 0.216 (Ln(Nwker)) + 0.468(Ln(Wkhrs)) + 5.32e-5 (HDDxheatp) + 2.01e-4(CDDxcoolp) N (adjusted) = 82 R2 = 0.9336 Adjusted R2 = 0.9292 Floor Area-based R2 = 0.91 Supermarkets:
B-4

Area = Gross building square footage (ft2) Hours = Average weekly hours when building is at least 50% occupied Workers = number of workers during the main occupancy of the building CDD = Cooling Degree Days (Base 65F) HDD = Heating Degree Days (Base 65F) Floors = Number of floors FoodRoom = Presence of an area dedicated to cooking and serving food (0=no,
1=yes) PCs = Number of PCs or electronic case registers TotalRefrig = Total number of refrigeration cases and walk-in units N (adjusted) = 88 R2 = 0.8118 Adjusted R2 = 0.7901 Floor Area-based R2 = 0.63 Warehouses:
RefWH = Refrigerated warehouse ( 0=no, 1=yes) Walk-InRefs = Total number of walk-in refrigerators Area = Gross building square footage (ft2) HDD = Heating Degree Days (Base-65F) HeatPer = Percent of floor area heated CDD = Cooling Degree Days (Base-65F) CoolPer = Percent of floor area air conditioned Hours = Total weekly operating hours Workers = Total employees on main shift SumHID&Halo= Floor area % lit by high intensity discharge and halogen lights N (adjusted) = 484 R2 = 0.8038 Adjusted R2 = 0.8005 Floor Area-based R2 = not provided Dormitories / Residence Halls: Ln Predicted Source EU = 4.99455 + 0.91308 (Ln(Sqft)) + 9.774e-5 (HDDxheatp) + 1.6279e-4 (CDDxcoolp) + 0.09455 (Ln(Lodgrm))
B-5
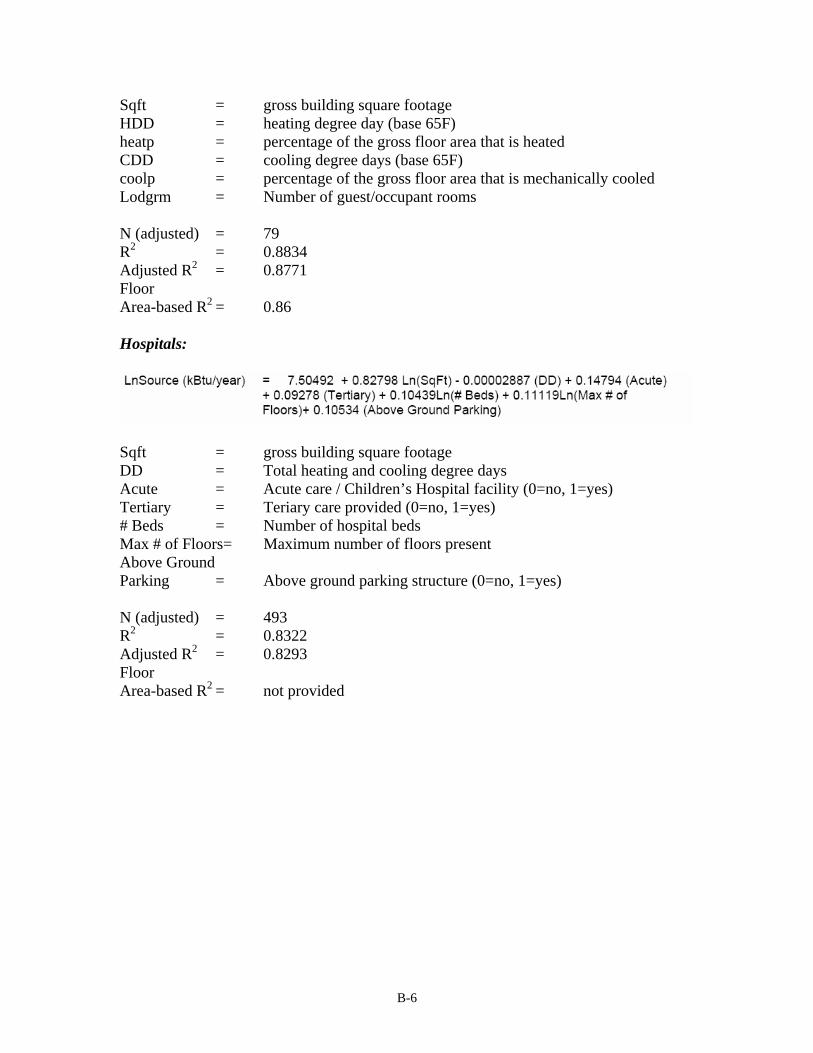
Sqft = gross building square footage HDD = heating degree day (base 65F) heatp = percentage of the gross floor area that is heated CDD = cooling degree days (base 65F) coolp = percentage of the gross floor area that is mechanically cooled Lodgrm = Number of guest/occupant rooms N (adjusted) = 79 R2 = 0.8834 Adjusted R2 = 0.8771 Floor Area-based R2 = 0.86 Hospitals:
Sqft = gross building square footage DD = Total heating and cooling degree days Acute = Acute care / Children’s Hospital facility (0=no, 1=yes) Tertiary = Teriary care provided (0=no, 1=yes) # Beds = Number of hospital beds Max # of Floors= Maximum number of floors present Above Ground Parking = Above ground parking structure (0=no, 1=yes) N (adjusted) = 493 R2 = 0.8322 Adjusted R2 = 0.8293 Floor Area-based R2 = not provided
B-6
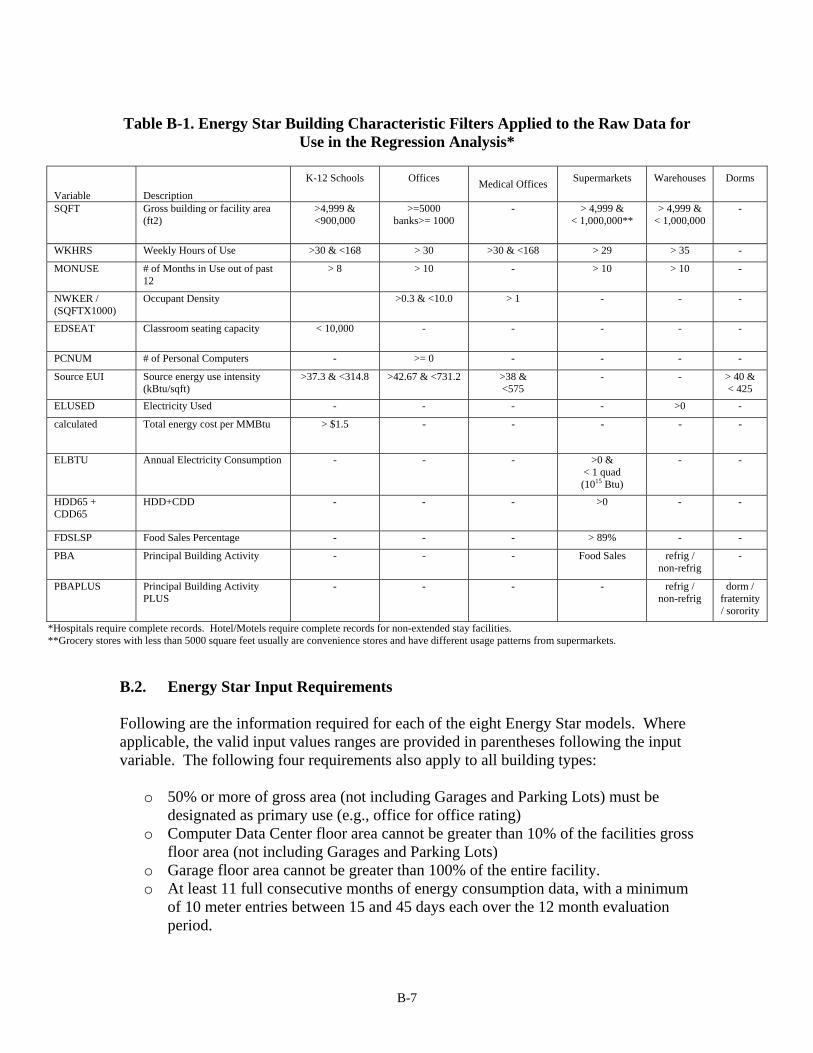
Table B-1. Energy Star Building Characteristic Filters Applied to the Raw Data for
Use in the Regression Analysis*
Variable Description
K-12 Schools
Offices Medical Offices Supermarkets
Warehouses
Dorms
SQFT Gross building or facility area (ft2)
>4,999 & <900,000
>=5000 banks>= 1000
- > 4,999 & < 1,000,000**
> 4,999 & < 1,000,000
-
WKHRS Weekly Hours of Use >30 & <168 > 30 >30 & <168 > 29 > 35 -
MONUSE # of Months in Use out of past 12
> 8 > 10 - > 10 > 10 -
NWKER / (SQFTX1000)
Occupant Density >0.3 & <10.0 > 1 - - -
EDSEAT Classroom seating capacity < 10,000 - - - - -
PCNUM # of Personal Computers - >= 0 - - - -
Source EUI Source energy use intensity (kBtu/sqft)
>37.3 & <314.8 >42.67 & <731.2 >38 & <575
- - > 40 & < 425
ELUSED Electricity Used - - - - >0 -
calculated Total energy cost per MMBtu > $1.5 - - - - -
ELBTU Annual Electricity Consumption - - - >0 & < 1 quad (1015 Btu)
- -
HDD65 + CDD65
HDD+CDD - - - >0 - -
FDSLSP Food Sales Percentage - - - > 89% - -
PBA Principal Building Activity - - - Food Sales refrig / non-refrig
-
PBAPLUS Principal Building Activity PLUS
- - - - refrig / non-refrig
dorm / fraternity / sorority
*Hospitals require complete records. Hotel/Motels require complete records for non-extended stay facilities. **Grocery stores with less than 5000 square feet usually are convenience stores and have different usage patterns from supermarkets.
B.2. Energy Star Input Requirements Following are the information required for each of the eight Energy Star models. Where applicable, the valid input values ranges are provided in parentheses following the input variable. The following four requirements also apply to all building types:
o 50% or more of gross area (not including Garages and Parking Lots) must be designated as primary use (e.g., office for office rating)
o Computer Data Center floor area cannot be greater than 10% of the facilities gross floor area (not including Garages and Parking Lots)
o Garage floor area cannot be greater than 100% of the entire facility. o At least 11 full consecutive months of energy consumption data, with a minimum
of 10 meter entries between 15 and 45 days each over the 12 month evaluation period.
B-7
K-12 Schools: The following information is required for a K-12 School Space.
• Zip code • Gross floor area (5,000 – 1,000,000 ft2) • Weekly operating hours (35 or greater) • Number of students (1- 1,000,000) • Number of months in operation (8 or more in the past 12 months) • Percent of the gross floor area of the facility that is air-conditioned • Percent of the gross floor area of the facility that is heated • Number of personal computers • Presence or absence of on-site cooking facilities • Presence or absence of mechanical ventilation
Offices: The following information is required for an Office Space.
• Zip code • Gross floor area
o General Office: 5,000 – 10,000,000 ft2 o Bank Branch: 1,000 – 20,000 ft2 o Financial Center: 20,000 – 10,000,000 ft2 o Courthouse: 5,000 – 10,000,000 ft2
• Weekly operating hours (35 or greater) • Number of occupants (1 – 25,000) • Number of personal computers (1 – 25,000)
Medical Offices: The following information is required for a Medical Office Space.
• Zip code • Number of workers (2 – 3,500 ) • Weekly operating hours (35 or greater) • Gross floor area (5,000 – 1,000,000 ft2) • Percent of the gross floor area of the facility that is air-conditioned • Percent of the gross floor area of the facility that is heated
Hotel / Motel: The following information is required for a Hotel Space.
• Zip code • Number of rooms
o Upper Upscale: 20 – 2,500 o Upscale: 30 – 2,000 o Midscale (w/food): 50 – 665
B-8

o Midscale (no food): 40 – 320 o Economy: 20 - 700
• Gross floor area (5,000 – 10,000,000 ft2) • Presence or Absence of On-site cooking
Hotel/Motel annual average occupancy must be 45% or greater. Supermarkets and Grocery Stores: The following information is required for Supermarkets and Grocery Store Spaces.
• Zip code • Gross floor area (5,000 – 250,000 ft2) • Weekly operating hours (35 or greater) • Main shift staffing (1 – 400) • Presence or absence of on-site cooking facilities • Number of registers/PCs (no more than 100) • Number of walk-in freezers/coolers (1 – 350) • Number of refrigerated/freezer cases (no more than 35) • Number of floors (no more than 3)
Warehouses: The following information is required for Refrigerated and Un-refrigerated Warehouse Spaces.
• Zip code • Gross floor area (5,000 – 1,000,000 ft2) • Number of walk-in coolers and refrigerators (no more than 35 ) • Weekly operating hours (40 or greater) • Total number of workers on main shift (no more than 4,000 workers) • Presence or absence of high-intensity discharge (HID) or halogen lighting systems
that primarily light the facility • Percent of the gross floor area of the facility that is air-conditioned • Percent of the gross floor area of the facility that is heated
Dorm: The following information is required for Residence Hall and Dormitory Spaces.
• Zip code • Number of rooms (5 – 800) • Gross floor area (5,000 – 1,000,000 ft2) • Percent of the gross floor area of the facility that is air-conditioned • Percent of the gross floor area of the facility that is heated
B-9

Hospital: The following information is required for a Hospital Space.
• Zip code • Number of licensed beds (16- 1,510) • Gross floor area (20,000 -5,000,000 ft2) • Number of floors (no more than 40) • Presence or absence of tertiary care • Presence or absence of above ground parking facilities
B-10

Appendix C: Impact of Default Values on Energy Star Ratings
There have been discussions about whether using defaults for certain Energy Star model inputs significantly impacts the resulting Energy Star rating. It has been suggested that it would be possible to run the Energy Star model using defaults for the building operational characteristics – doing so would simplify the data information requirements and reduce the effort required to obtain a general Energy Star rating for an individual building. The Energy Star office model requires building floor area, energy consumption and location (climate) plus a number of building operational characteristics (number of occupants, hours of operation, number of computers). Note that full inputs are required in order to get an Energy Star Label from EPA – an Energy Star rating based on defaults can only be used in comparative analyses. Using defaults for building occupancy characteristics reduces the Energy Star model to include floor area, energy use, location (climate) and an additional constant factor based on the default occupancy, operating hours and number of computers. As such, the varying Energy Star model inputs are the same as those required for Cal-Arch, though the Energy Star model uses location to obtain weather data (heating and cooling degree days) for the building location. The 109 California CEUS office buildings have been rated with using the Energy Star model – with and without defaults for occupancy, hours and number of computers (referenced here as the full model and the default model). Figure C-1 compares the resulting Energy Star ratings, while Figure C-2 shows the change in individual ratings and Figure C-3 shows the percent change in individual ratings. The default-based Energy Star Ratings generally correspond to the Energy Star ratings using actual building occupancy-related characteristics. However, the use of defaults can increase or decrease the individual Energy Star ratings significantly. The average change is -4.3 points, but can be as much as 40 or 50 points in either direction. The average percent change is -6%, but can result in an Energy Star rating that is up to three times higher. This can result in buildings obtaining 75+ ratings in cases where the ratings using full building inputs are much lower – and vice-versa. There are two clusters of buildings where this occurs – 8 buildings (7% of sample) which get less than 75 with the full model, but get 75+ with the default model; and 15 buildings (14% of sample) which get 75+ with the full model, but less than 75 with the default model (See Table 1). Two specific examples are highlighted in Figures C-1, C-2, and C-3 to show how the building’s actual occupancy and hours data impacts the resulting Energy Star rating. The first example is a building which has a 90 Energy Star rating using the full model inputs – this building has higher occupancy and occupied hours than that the default values. If the default values are used, this building would obtain an Energy Star rating of 50 rather than 90 – and not be eligible for an Energy Star label. The second example is a building which has a 50 Energy Star rating using the full model inputs – this building has lower occupancy and occupied hours than the default values. As such, the resulting default-
C-1

based Energy Star rating is 76, artificially high because higher than actual occupancy factors are used. Of interest is how the use of the default values impacts the migration of Energy Star ratings between Energy Star rating bins (0-24, 25-49, 50-74 and 75+). Figure C-4 shows the distribution of ratings for the full and default model cases. Figure C-5 shows how the individual building ratings migrated from one bin to another – resulting in a distribution which has less buildings obtaining 75+ ratings and more buildings obtaining <25 ratings. Overall, ratings tended to migrate one or two bins over, rather than moving from the lowest bin to the 75+ bin.
y = 0.9214x + 0.5622R2 = 0.7753
0
10
20
30
40
50
60
70
80
90
100
0 10 20 30 40 50 60 70 80 90 1
Energy Star Rating Using Full Model
Ener
gy S
tar R
atin
g ba
sed
on F
loor
Are
a, E
nerg
y U
se a
nd L
ocat
ion
- def
aults
use
d fo
r all
othe
r var
iabl
es -
00
Full Model: 90 With Defaults: 50
Full Model: 50 With Defaults: 76
Figure C-1. Energy Star Ratings
Full Model vs. Model with Operating Characteristics Defaults California CEUS Office Buildings (n=109)
C-2

Change in Energy Star Rating [Energy Star Rating (Default Model)] - [Energy Star Rating (Full Model)]
(D-F)
-60
-40
-20
0
20
40
60
0 10 20 30 40 50 60 70 80 90 1
Energy Star Rating (Full Model)
Del
ta C
hang
e in
Ene
rgy
Star
Rat
ing
by U
sing
Def
aults
in
stea
d of
Ful
l Mod
el
00
Full Model: 90 With Defaults: 50
Full Model: 50 With Defaults: 76
Figure C-2. Change in Energy Star Rating if Building Occupancy Characteristic
Defaults are Used - California CEUS Office Buildings (n=109) Percent Change over Full Model
[Energy Star Rating (Default)] - [Energy Star Rating (Full Model)][Energy Star Rating (Full Model)]
(D-F)/F
-300%
-200%
-100%
0%
100%
200%
300%
0 10 20 30 40 50 60 70 80 90 100
Energy Star Rating (Full Model)
Perc
ent C
hang
e in
Ene
rgy
Star
Rat
ing
by U
sing
Def
aults
in
stea
d of
Ful
l Mod
el
Full Model: 90 With Defaults: 50
Full Model: 50 With Defaults: 76
Figure C-3. Percent Change in Energy Star Rating if Building Occupancy Characteristic Defaults are Used - California CEUS Office Buildings (n=109)
C-3

Table C-1. Distribution of Default and Full Model Energy Star Ratings. Buildings with 75 and above can obtain an Energy Star Label.
Full Model < 75 75+
75+ 8 (7%) 32 (29%) Default Model < 75 54 (50%) 15 (14%)
0
5
10
15
20
25
30
35
40
45
50
0-24 25-49 50-74 75-100
Energy Star Rating
Num
ber o
f Bui
ldin
gs
Full ModelDefaults
16%
23%
16%14%
26% 27%
43%
37%
Figure C-4. Energy Star Rating Distributions - Full Model vs. Model Using
Building Occupancy Characteristics Defaults – California CEUS Office Buildings (n=109)
C-4

0
5
10
15
20
25
30
35
40
45
50
Full (0-24) Defaults (0-24) Full (25-49) Default (25-49) Full (50-74) Default (50-74) Full (>75) Default (>75)
Energy Star Rating
Num
ber o
f Obs
erva
tions
0-2425-5950-74>75
Full Model
Default Model
Full Model Default Model
Full ModelDefault Model
Full Model
Default Model
0 - 24 >7550 - 7425 - 49
Figure C-5. Migration of Energy Star Ratings Between Quartiles When Using
Building Occupancy Characteristics Defaults instead of Full Model – California CEUS Office Buildings (n=109)
Impact of Default Values on the Correlation between Energy Star Ratings, Whole Building EUI and Relative Cal-Arch Ranking The following two charts compare, for 109 California office buildings, the building’s Energy Star rating to the building’s whole building energy use intensities (kBtu/ft2-year) and relative Cal-Arch ranking (% of Cal-Arch office buildings with higher whole building EUIs). Figure 7 is the same chart provided in Figure 1, and provides this comparison using the full model (no defaults). Figure 8 provides the comparison for Energy Star ratings based on defaults for building operational characteristics. Regardless of whether the Energy Star rating is based on the full model or on defaults, the trends are consistent between the Energy Star ratings and the whole building EUI and relative ranking. The R2 values for the default case is higher as the resulting Energy Star ratings are primarily based on floor area, energy use and climate. However the trends are not significantly different for the full model and default cases.
C-5

Whole Building EUI = 0.0029x2 - 1.4098x + 151.01
R2 = 0.6243
% Cal-Arch Buildings with Higher EUIs= 7E-05x2 - 0.0013x + 0.1556
R2 = 0.6884
0
50
100
150
200
250
0 25 50 75 100Energy Star Rating (Full Model)
Who
le B
uild
ing
EUI
0%
25%
50%
75%
100%
% o
f Cal
-Arc
h O
ffice
Bui
ldin
gs w
ith H
ighe
r W
hole
Bui
ldin
g EU
Is
EUI_whole_building% Cal-Arch Buildings with Higher EUIs
45%
Figure C-6. Comparison between Energy Star Ratings (Full Model) and Whole Building Energy Use Intensity and Relative Cal-Arch Ranking – California CEUS
Office Buildings (n=109)
Whole Building EUI = 0.0064x2 - 1.7676x + 152.26
R2 = 0.7162
% of Cal-Arch Office Buildings with Higher Whole Building EUIs = 6E-05x2 + 0.0003x + 0.1317
R2 = 0.7537
0
50
100
150
200
250
0 25 50 75 100Energy Star Ratings - Default Values
Who
le B
uild
ing
EUI
0%
10%
20%
30%
40%
50%
60%
70%
80%
90%
100%
% o
f Cal
-Arc
h O
ffice
Bui
ldin
gs w
ith H
ighe
r Who
le B
uild
ing
EUIs
EUI_whole_building% Cal-Arch Buildings with Higher EUIs
49%
Figure C-7. Comparison between Energy Star Ratings Using Building Occupancy
Characteristics Defaults and Whole Building Energy Use Intensity and Relative Cal-Arch Ranking – California CEUS Office Buildings (n=109)
C-6