review of dcd allocation scheme: the first 6 months lisa bradbury statistics and clinical studies...
TRANSCRIPT

Review of DCD allocation scheme: the first 6 months
Lisa BradburyStatistics and Clinical Studies
Renal Transplant Services Meeting 2015

Introduction
• Organs donated for transplantation are a national resource
• Kidneys should be allocated in an open, objective and transparent way
• DCD donor kidneys are the ‘norm’ rather than the ‘exception’
90 8983 81 77
70 66 63 6156 58 61
10 1117 19 23
30 34 37 3744 42 39
0%
10%
20%
30%
40%
50%
60%
70%
80%
90%
100%
2003 2004 2005 2006 2007 2008 2009 2010 2011 2012 2013 2014
Year
Pe
rce
nt
DCD donors
DBD donors
Deceased kidney donors Deceased kidney-only transplants
91 8983 80 75
68 66 64 62 58 61 64
9 1117 20 25
32 34 35 38 42 39 36
0%
10%
20%
30%
40%
50%
60%
70%
80%
90%
100%
2003 2004 2005 2006 2007 2008 2009 2010 2011 2012 2013 2014
Year
Pe
rce
nt

•DBD kidneys Formalised national allocation scheme for both kidneysDCD kidneys Non-standardised local arrangements
•Some centres were ‘pairing-up’ to share DCD kidneys For example: North Thames area, Edinburgh and Glasgow
•Local sharing arrangements may reflect difficulty in performing two same
centre concurrent kidney transplants?
Allocation prior to implementation of the scheme
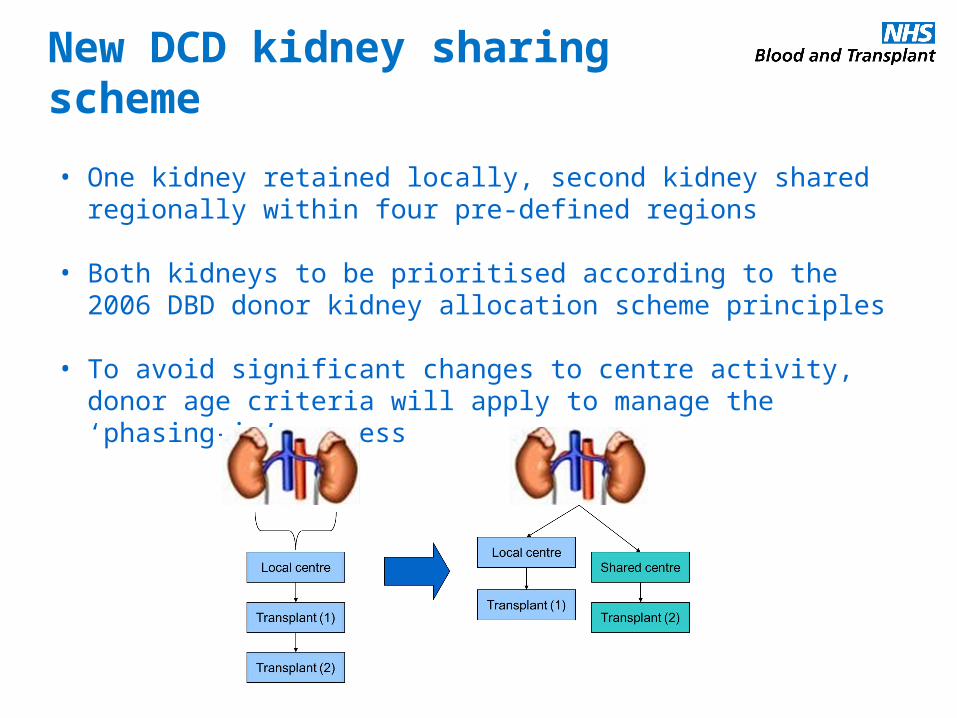
• One kidney retained locally, second kidney shared regionally within four pre-defined regions
• Both kidneys to be prioritised according to the 2006 DBD donor kidney allocation scheme principles
• To avoid significant changes to centre activity, donor age criteria will apply to manage the ‘phasing-in’ process
New DCD kidney sharing scheme
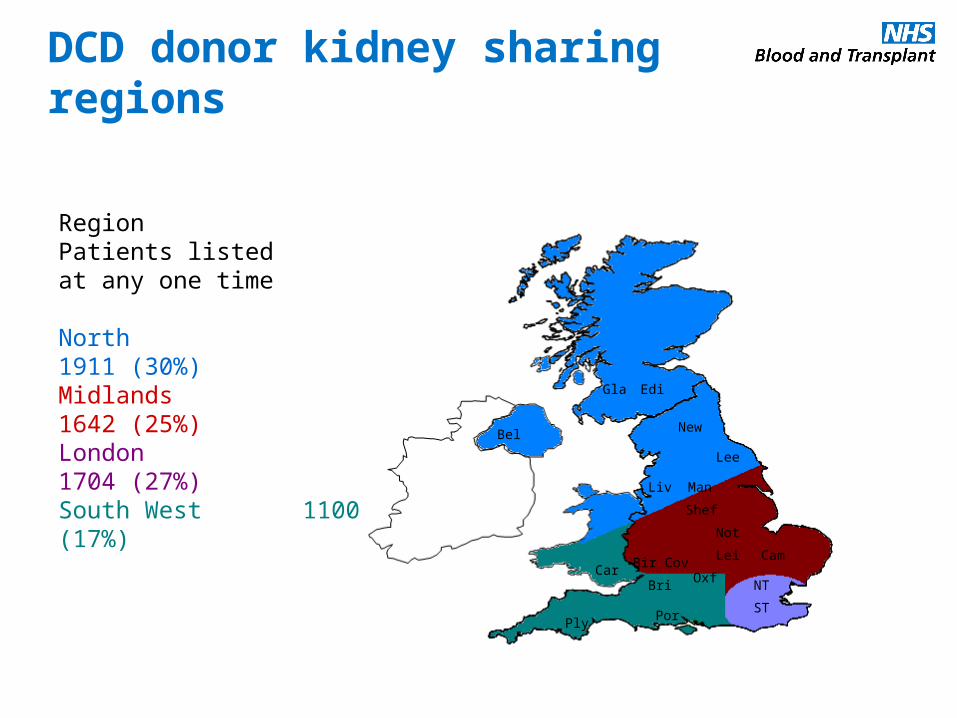
Region Patients listed at any one time
North 1911 (30%)Midlands 1642 (25%)London 1704 (27%)South West 1100 (17%) Gla Edi
BelNew
Lee
Liv Man
Shef
Not
Lei CamBir Cov
NT
ST
Car
PlyPor
BriOxf
DCD donor kidney sharing regions

Donor age criteria
Year Minimum age (years)
Maximum age (years)
% of kidneys shared
One 5 50 19%
Two 5 55 25%
Three 5 60 30%
Four 5 65 37%
Five 5 70 43%
• In the first year one kidney from donors aged 5 to 49 will be shared regionally (5 to 64 in London)
• Donors aged under 5 yearsAutomatically offered for en bloc transplantation – local first
• Upper age limit reviewed regularly - guide increments:
Phasing-in DCD kidney sharing
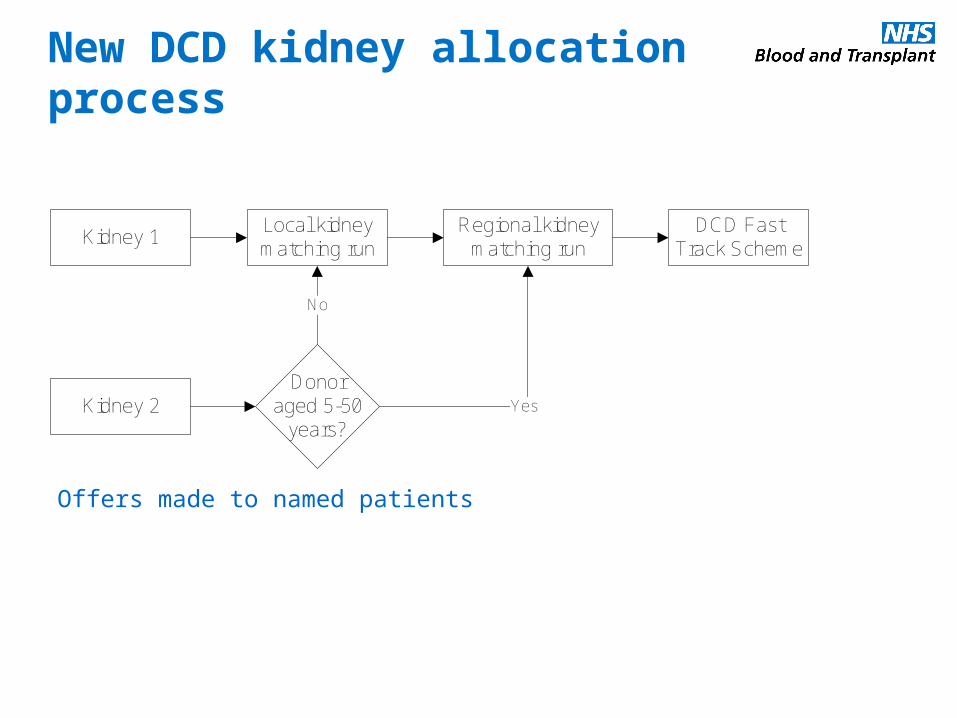
New DCD kidney allocation process
Kidney 1
Kidney 2
Local kidney matching run
Regional kidney matching run
DCD Fast Track Scheme
Donoraged 5-50
years?
No
Yes
Offers made to named patients
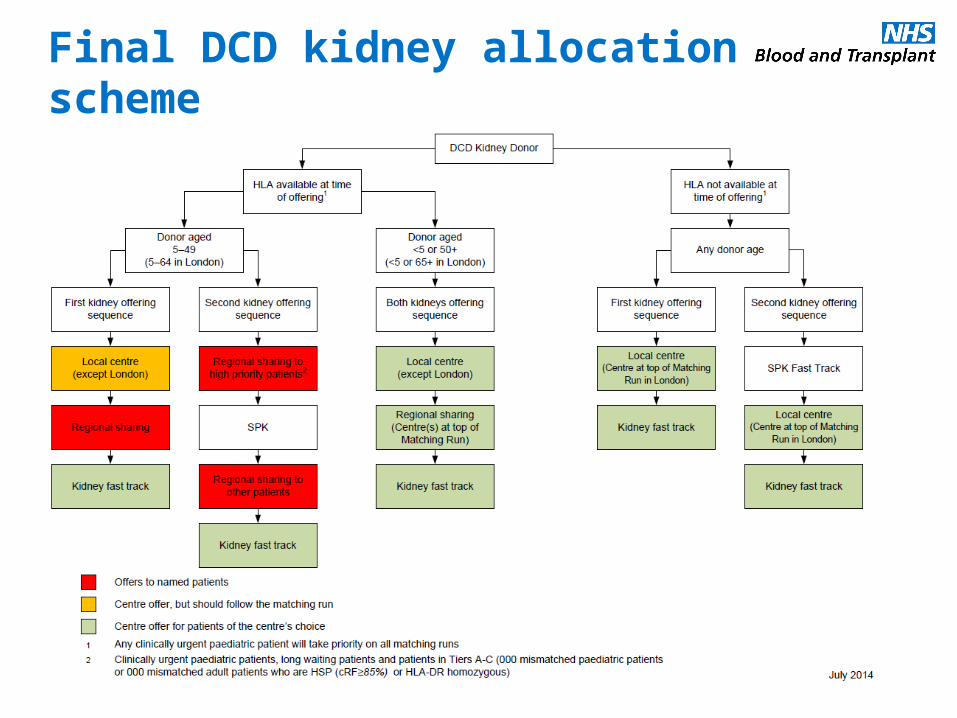
Final DCD kidney allocation scheme

Kidney donor screening
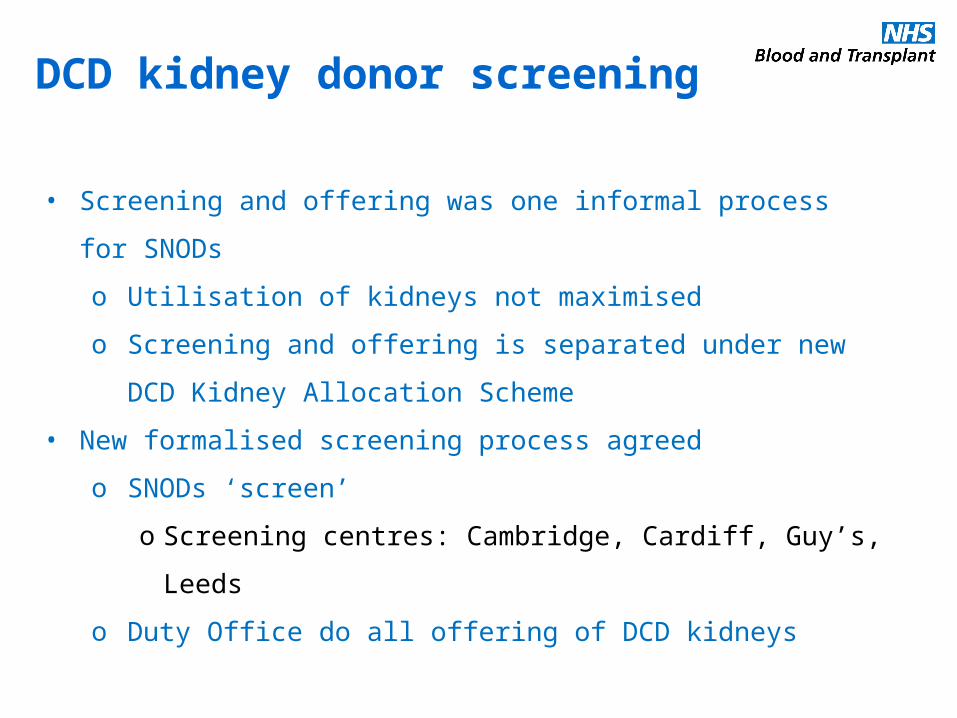
• Screening and offering was one informal process for SNODs
o Utilisation of kidneys not maximised
o Screening and offering is separated under new DCD Kidney
Allocation Scheme
• New formalised screening process agreed
o SNODs ‘screen’
o Screening centres: Cambridge, Cardiff, Guy’s, Leeds
o Duty Office do all offering of DCD kidneys
DCD kidney donor screening

Belfast
Birm
ingham
Bristol
Cam
bridge
Cardiff
Coventry
Glasgow
Guy's
Leeds
Leicester
Liverpool
Manchester
New
castle
Nottingham
Oxford
Plym
outh
Portsm
outh
Royal F
ree
Royal London
Sheffield
St G
eorge's
WLR
TC
0
10
20
30
40
50
60
70
1317
6
36
18
3
125
22
10 712
37
813
95
1217
11
35
6
1
3
1
3
1
1
1
4
6
35
6
21
51
22
7
Acceptable
Not acceptable
Transplant centre
Nu
mb
er
of
calls
(fo
rms
retu
rne
d)
Number of calls to local transplant centre (forms returned)
Of 73 deemed acceptable; 19 unknown, 25 no consent, 29 consentOf 29 who’s family gave consent; 26 kidneys retrieved and 20 transplanted

Re
gio
na
l
First O
OR
Se
con
d O
OR
Re
gio
na
l
First O
OR
Se
con
d O
OR
Re
gio
na
l
First O
OR
Se
con
d O
OR
Re
gio
na
l
First O
OR
Se
con
d O
OR
Leeds Cambridge Guy's Cardiff
0
10
20
30
40
50
60
70
80
90
63
46
20
66
50
18
6051
33
51 49
28
6
2
6
1
7
1
6
6
5
3 4
3
14
4
3
12
5
6
3
4
115
1
Acceptable
Did not respond
Not acceptable
Screening call
Nu
mb
er
of
calls
(fo
rms
retu
rne
d)
Number of calls and proportion of acceptable donors
OOR = Out of region
Of 53 deemed acceptable; 20 unknown, 18 no consent, 15 consentOf 15 who’s family gave consent; 10 kidneys retrieved and 8 transplanted
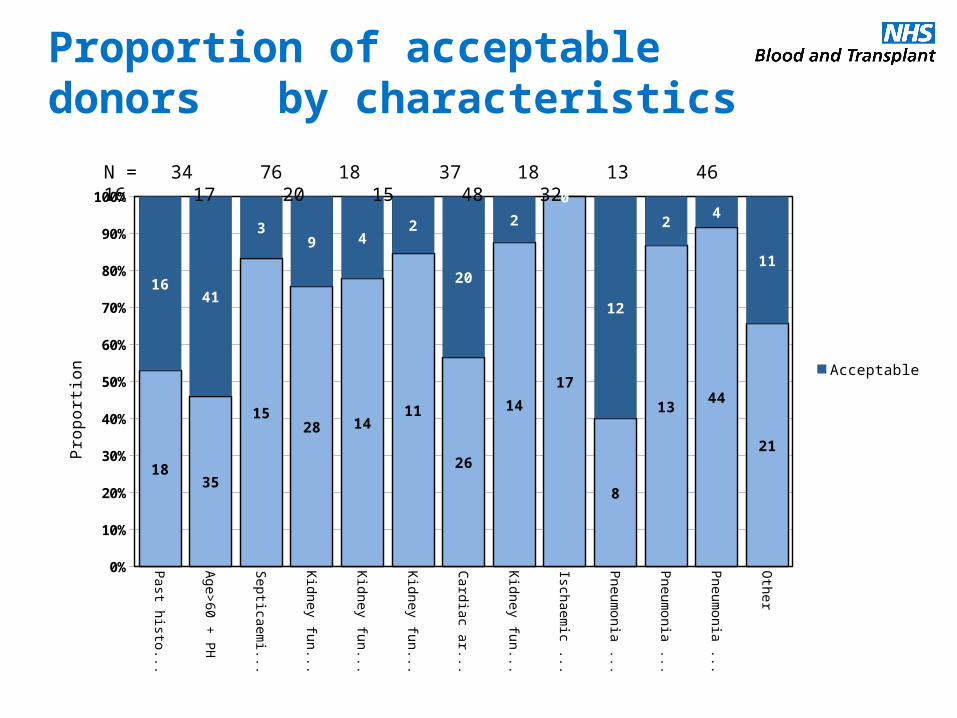
Proportion of acceptable donors by characteristics
Past history (P
H)
Age>
60 + P
H
Septicaem
ia ...
Kidney functio...
Kidney functi...
Kidney functio...
Cardiac arrest...
Kidney function...
Ischaemic bow
el
Pneum
onia + P
H
Pneum
onia + S
...
Pneum
onia + ki...
Other
0%
10%
20%
30%
40%
50%
60%
70%
80%
90%
100%
1835
1528 14
11
26
14
17
8
1344
21
1641
39 4
2
20
2
0
12
24
11
Acceptable
Not acceptable
Pro
po
rtio
n
N = 34 76 18 37 18 13 46 16 17 20 15 48 32

Donation process time intervals for potential DCD donors, where data are complete
Bef
ore
Aft
er
Bef
ore
Aft
er
Bef
ore
Aft
er
Bef
ore
Aft
er
Bef
ore
Aft
er
Bef
ore
Aft
er
Discussion with SNOD to SNOD at-
tendance
SNOD attendance to family ap-
proached
Family approached to decision made
Consent to first re-trieval team left
base
First retrieval team left base to last re-trieval team arrives
Last retrieval team arrives to operation
start/treatment withdrawn
0
2
4
6
8
10
12
14
16
Q1
Time interval by year
Ho
urs
Transplant Activity
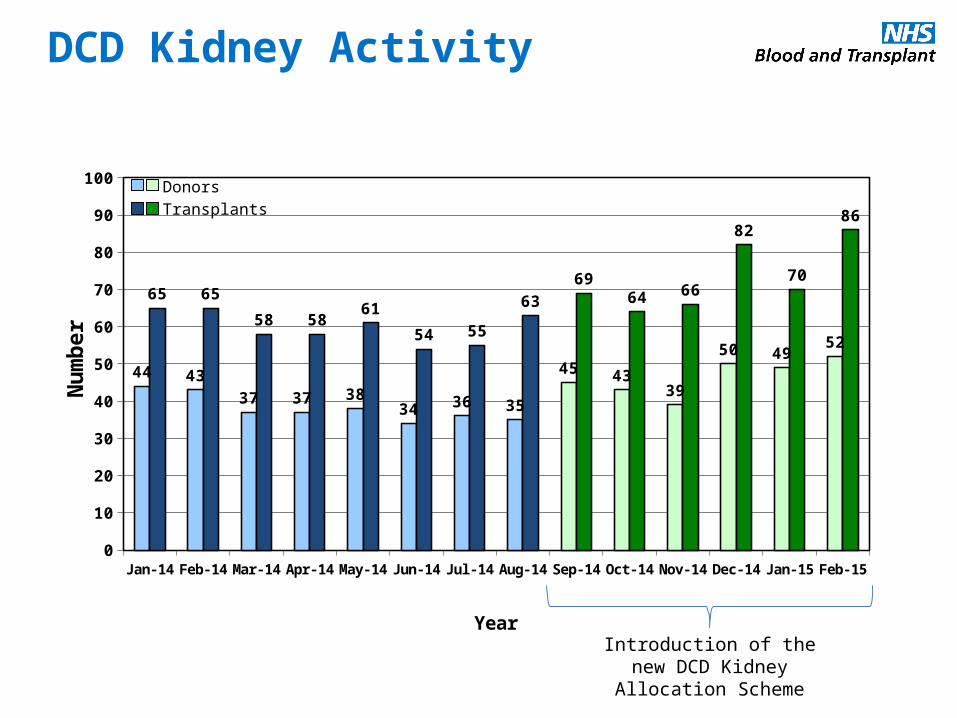
DCD Kidney Activity
Jan-14 Feb-14 Mar-14 Apr-14 May-14 Jun-14 Jul-14 Aug-14 Sep-14 Oct-14 Nov-14 Dec-14 Jan-15 Feb-150
10
20
30
40
50
60
70
80
90
100
44 43
37 37 3834 36 35
45 4339
50 4952
65 65
58 5861
54 55
63
6964 66
82
70
86
Year
Nu
mb
er
Introduction of the new DCD Kidney Allocation
Scheme
Donors
Transplants
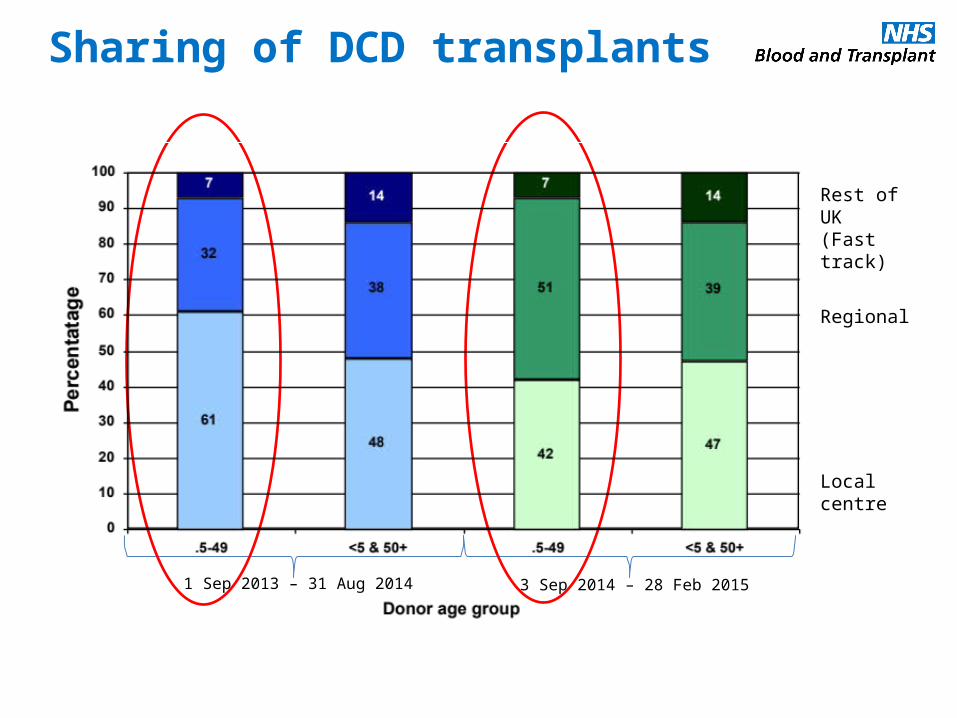
Sharing of DCD transplants
Rest of UK(Fast track)
Regional
Local centre
1 Sep 2013 – 31 Aug 2014 3 Sep 2014 – 28 Feb 2015
Transplant ActivityNorthern regionBelfast, Edinburgh, Glasgow, Leeds, Liverpool, Manchester, Newcastle

Jan-14 Feb-14 Mar-14 Apr-14 May-14 Jun-14 Jul-14 Aug-14 Sep-14 Oct-14 Nov-14 Dec-14 Jan-15 Feb-150
5
10
15
20
25
30
35
15
12
10
15
17
11
14 14
18
11
1314
17
12
23
19
2122
30
21 21
26
29
19
23
26
28
21
Year
Nu
mb
er
Introduction of the new DCD Kidney Allocation
Scheme
Donors
Transplants
DCD Kidney Activity in North
1 2 3 4 5 6 7 8 9 10 11 12 13 140
5
10
15
20
25
30
35
40
3
11
15 1619
16
3836
1513
22
33 34
21Nu
mb
er o
f tr
ansp
lan
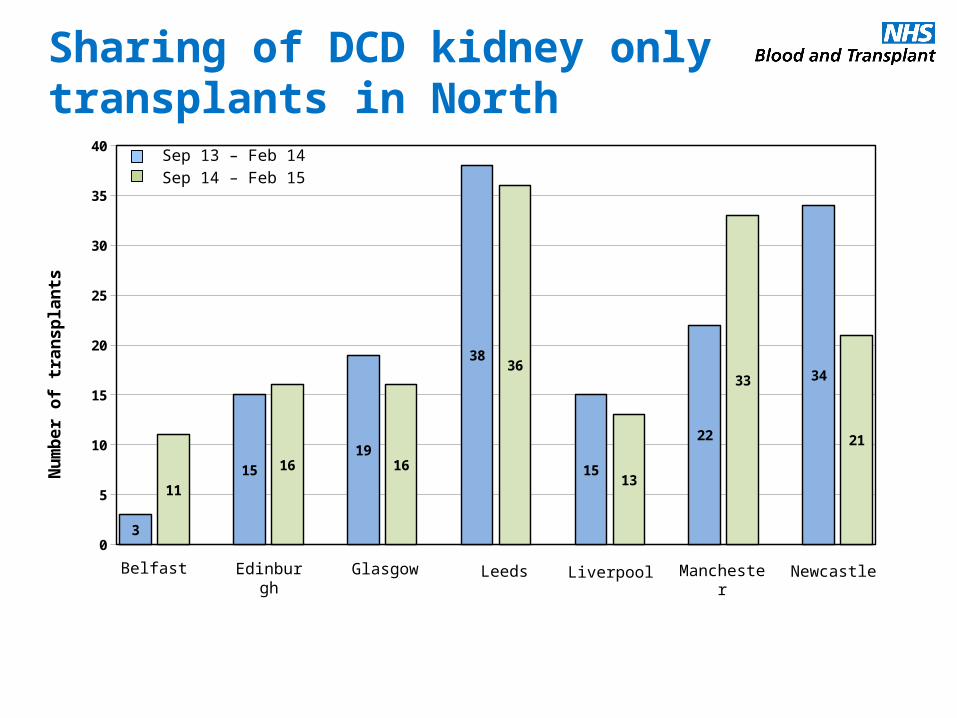
tsSharing of DCD kidney only transplants in North
Belfast Edinburgh
Glasgow Leeds Liverpool
Sep 13 – Feb 14
Sep 14 – Feb 15
Manchester Newcastle
1 2 3 4 5 6 7 8 9 10 11 12 13 140
5
10
15
20
25
30
35
40
3
11
15 15
1916
33
26
1512
22
33 32
20
1
5
10
1
2
1
Nu
mb
er o
f tr
ansp
lan
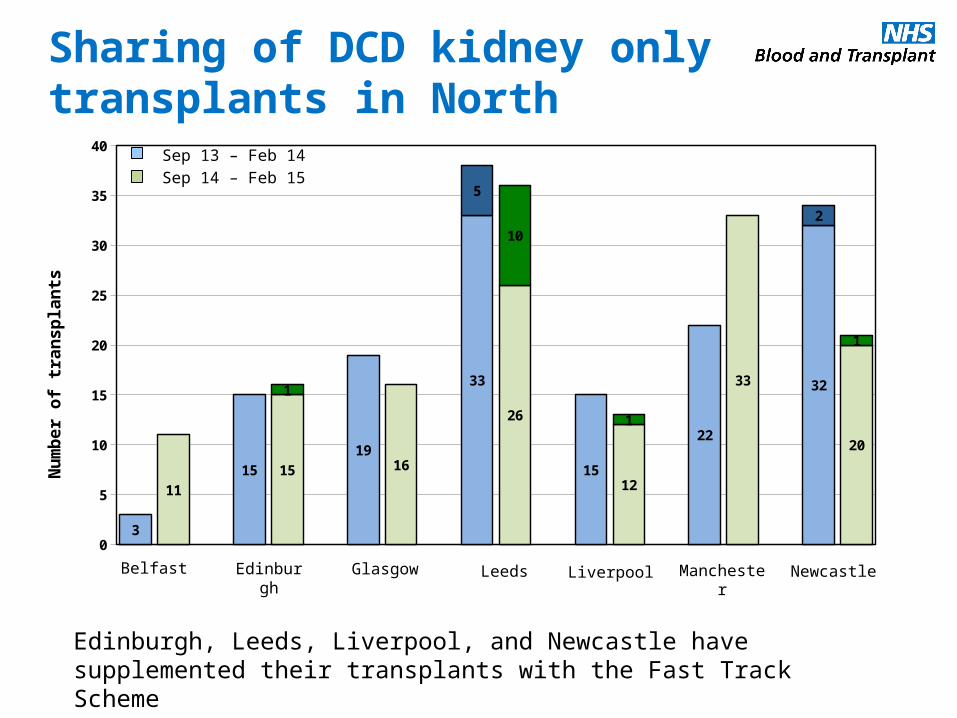
tsSharing of DCD kidney only transplants in North
Edinburgh, Leeds, Liverpool, and Newcastle have supplemented their transplants with the Fast Track Scheme
Sep 13 – Feb 14
Sep 14 – Feb 15
Belfast Edinburgh
Glasgow Leeds Liverpool Manchester Newcastle
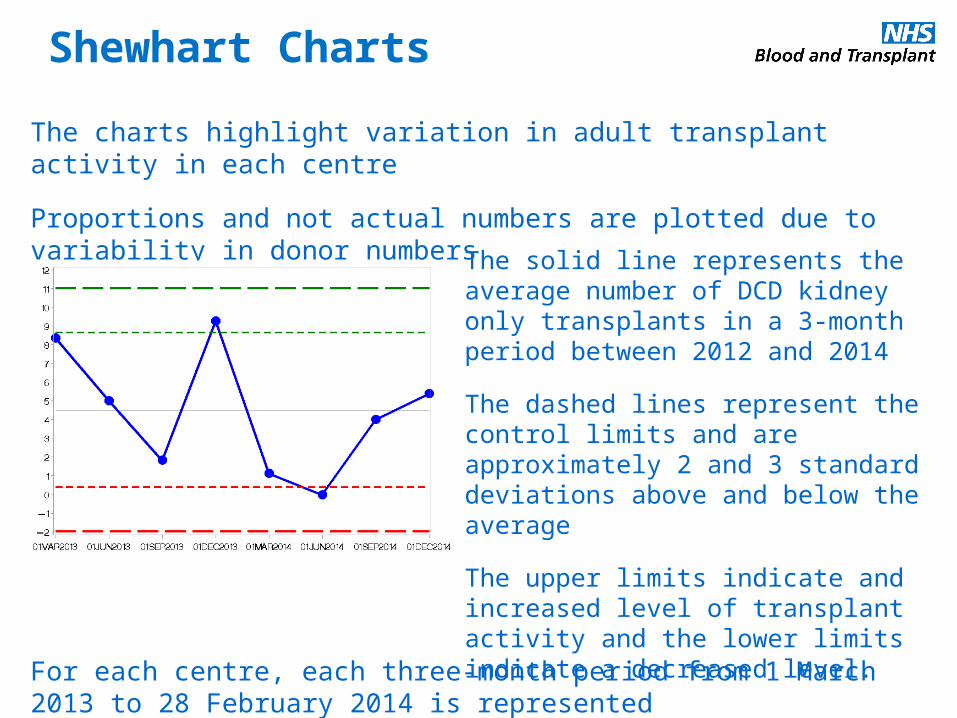
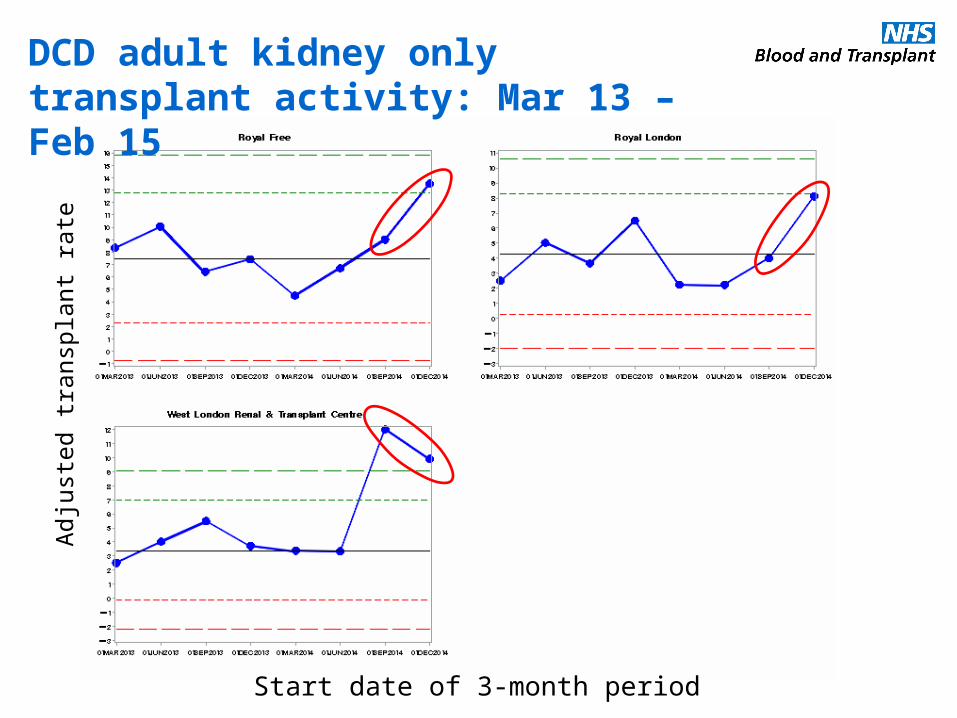
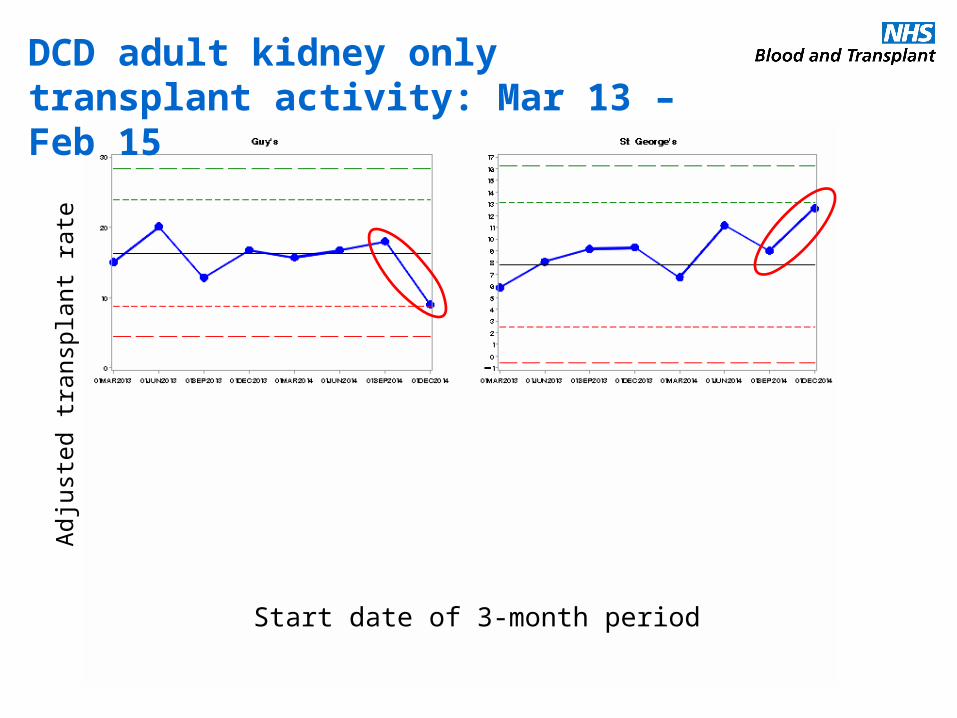
Shewhart Charts
The charts highlight variation in adult transplant activity in each centre
Proportions and not actual numbers are plotted due to variability in donor numbers
For each centre, each three-month period from 1 March 2013 to 28 February 2014 is represented
The solid line represents the average number of DCD kidney only transplants in a 3-month period between 2012 and 2014
The dashed lines represent the control limits and are approximately 2 and 3 standard deviations above and below the average
The upper limits indicate and increased level of transplant activity and the lower limits indicate a decreased level.

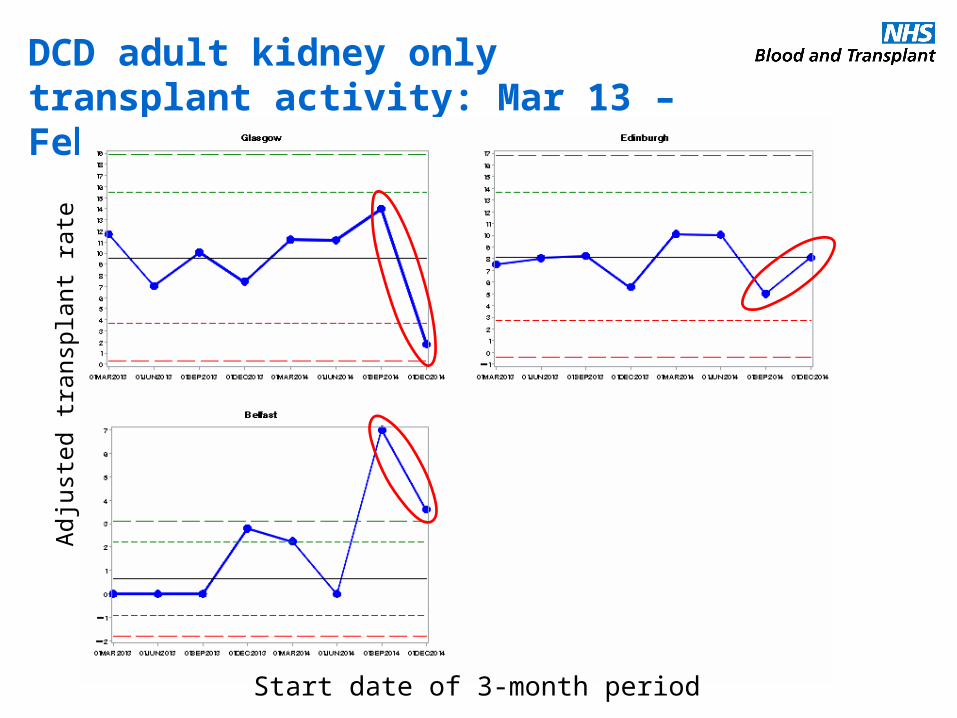
DCD adult kidney only transplant activity: Mar 13 – Feb 15
Adj
uste
d tr
ansp
lant
rat
e
Start date of 3-month period
DCD adult kidney only transplant activity: Mar 13 – Feb 15
Adj
uste
d tr
ansp
lant
rat
e
Start date of 3-month period
Transplant ActivitySouth West RegionBristol, Cardiff, Oxford, Plymouth, Portsmouth

Jan-14 Feb-14 Mar-14 Apr-14 May-14 Jun-14 Jul-14 Aug-14 Sep-14 Oct-14 Nov-14 Dec-14 Jan-15 Feb-150
2
4
6
8
10
12
14
16
18
20
1211
8 8
6
9
5
3
9
13
6
11
5
8
11
15
12
14
7
12
7 78
16
13
18
8
13
Year
Nu
mb
er
Introduction of the new DCD Kidney Allocation
Scheme
Donors
Transplants
DCD Kidney Activity in South West

1 2 3 4 5 6 7 8 9 100
5
10
15
20
25
30
35
40
1210
25
14
26
35
19
1013
7
Nu
mb
er o
f tr
ansp
lan
tsSharing of DCD kidney only transplants in South West
Bristol Cardiff Oxford Plymouth Portsmouth
Sep 13 – Feb 14
Sep 14 – Feb 15

1 2 3 4 5 6 7 8 9 100
5
10
15
20
25
30
35
40
1210
1513
1922
19
1013
7
10
1
7
13
Nu
mb
er o
f tr
ansp
lan
tsSharing of DCD kidney only transplants in South West
Cardiff and Oxford have supplemented their transplants with the Fast Track Scheme
Sep 13 – Feb 14
Sep 14 – Feb 15
Bristol Cardiff Oxford Plymouth Portsmouth

DCD adult kidney only transplant activity: Mar 13 – Feb 15
Adj
uste
d tr
ansp
lant
rat
e
Start date of 3-month period

DCD adult kidney only transplant activity: Mar 13 – Feb 15
Adj
uste
d tr
ansp
lant
rat
e
Start date of 3-month period

Transplant ActivityMidlands RegionBirmingham, Coventry, Leicester, Cambridge, Nottingham, Sheffield
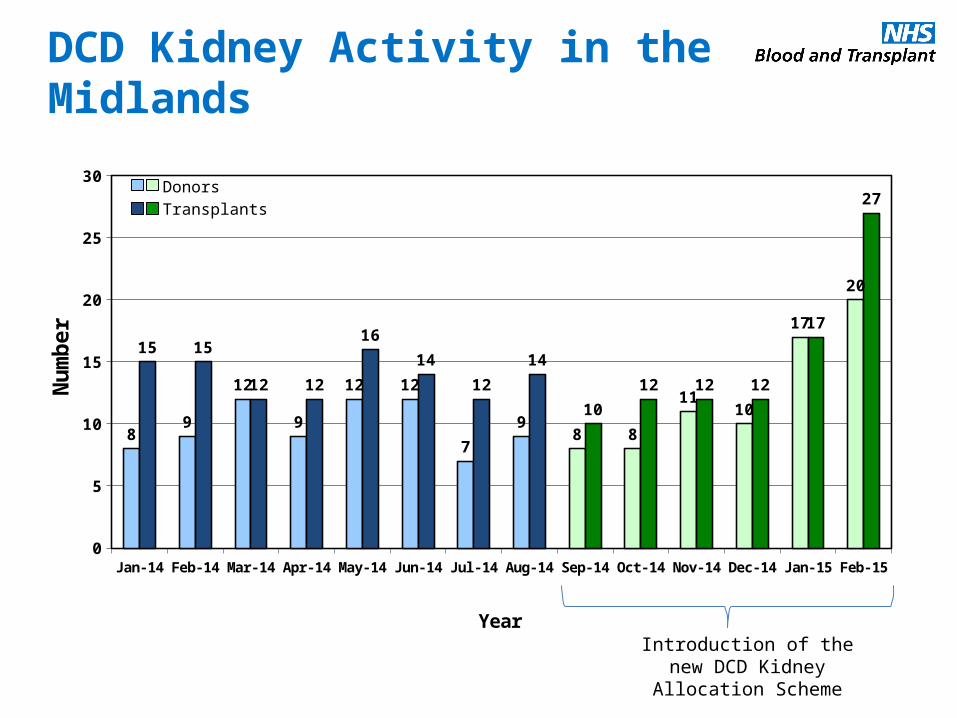
Jan-14 Feb-14 Mar-14 Apr-14 May-14 Jun-14 Jul-14 Aug-14 Sep-14 Oct-14 Nov-14 Dec-14 Jan-15 Feb-150
5
10
15
20
25
30
89
12
9
12 12
7
98 8
1110
17
20
15 15
12 12
16
14
12
14
10
12 12 12
17
27
Year
Nu
mb
er
Introduction of the new DCD Kidney Allocation
Scheme
Donors
Transplants
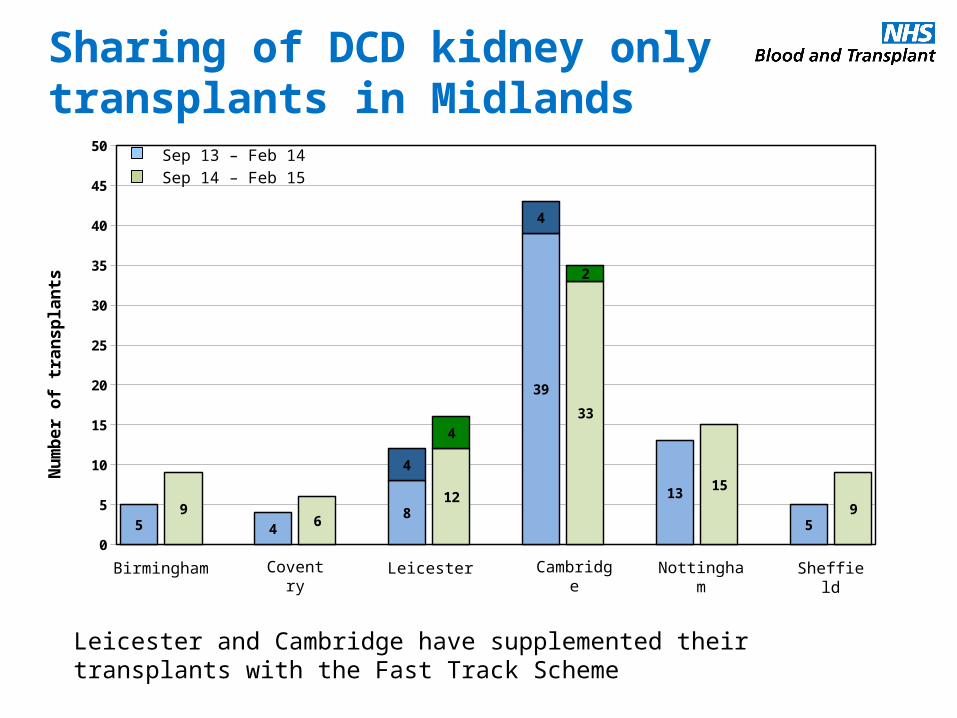
DCD Kidney Activity in the Midlands

1 2 3 4 5 6 7 8 9 10 11 120
5
10
15
20
25
30
35
40
45
50
59
46
1216
43
35
1315
59
Nu
mb
er o
f tr
ansp
lan
tsSharing of DCD kidney only transplants in Midlands
Birmingham Coventry Leicester Cambridge Nottingham Sheffield
Sep 13 – Feb 14
Sep 14 – Feb 15
1 2 3 4 5 6 7 8 9 10 11 120
5
10
15
20
25
30
35
40
45
50
59
46
812
39
33
1315
59
4
4
4
2
Nu
mb
er o
f tr
ansp
lan
tsSharing of DCD kidney only transplants in Midlands
Leicester and Cambridge have supplemented their transplants with the Fast Track Scheme
Sep 13 – Feb 14
Sep 14 – Feb 15
Birmingham Coventry Leicester Cambridge Nottingham Sheffield

DCD adult kidney only transplant activity: Mar 13 – Feb 15
Adj
uste
d tr
ansp
lant
rat
e
Start date of 3-month period

DCD adult kidney only transplant activity: Mar 13 – Feb 15
Adj
uste
d tr
ansp
lant
rat
e
Start date of 3-month period
Transplant ActivityLondon RegionRoyal London, Royal Free, WLRTC, Guy’s, St George’s, GOSH

Jan-14 Feb-14 Mar-14 Apr-14 May-14 Jun-14 Jul-14 Aug-14 Sep-14 Oct-14 Nov-14 Dec-14 Jan-15 Feb-150
5
10
15
20
25
30
9
11
7
5
32
109
1011
9
15
10
13
16 16
13
10
87
1516
22
1718
26
17
25
Year
Nu
mb
er
Introduction of the new DCD Kidney Allocation
Scheme
Donors
Transplants
DCD Kidney Activity in London

1 2 3 4 5 6 7 8 9 10 11 120
5
10
15
20
25
30
35
1114 15
25
10
23
33
29
2023
2 1
Nu
mb
er o
f tr
ansp
lan
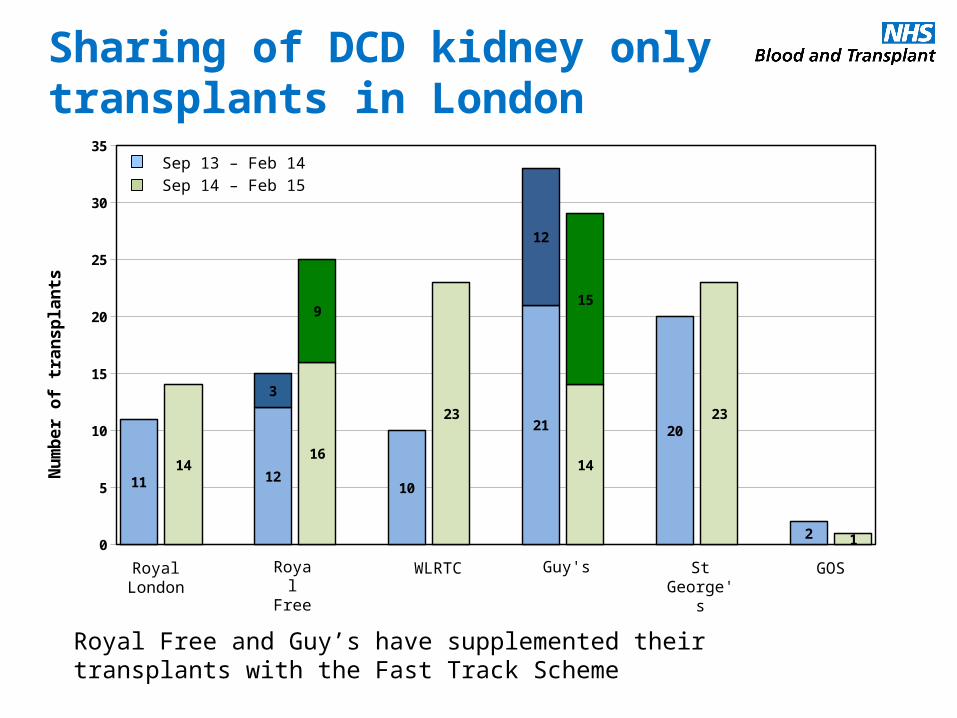
tsSharing of DCD kidney only transplants in London
Royal London
Royal Free
WLRTC Guy's St George's
GOS
Sep 13 – Feb 14
Sep 14 – Feb 15
1 2 3 4 5 6 7 8 9 10 11 120
5
10
15
20
25
30
35
1114
12
16
10
2321
14
2023
2 1
3
9
12
15
Nu
mb
er o
f tr
ansp
lan
tsSharing of DCD kidney only transplants in London
Royal London
Royal Free
WLRTC Guy's St George's
GOS
Royal Free and Guy’s have supplemented their transplants with the Fast Track Scheme
Sep 13 – Feb 14
Sep 14 – Feb 15
Adj
uste
d tr
ansp
lant
rat
e
Start date of 3-month period
DCD adult kidney only transplant activity: Mar 13 – Feb 15
Adj
uste
d tr
ansp
lant
rat
e
Start date of 3-month period
DCD adult kidney only transplant activity: Mar 13 – Feb 15

Median waiting time to transplant
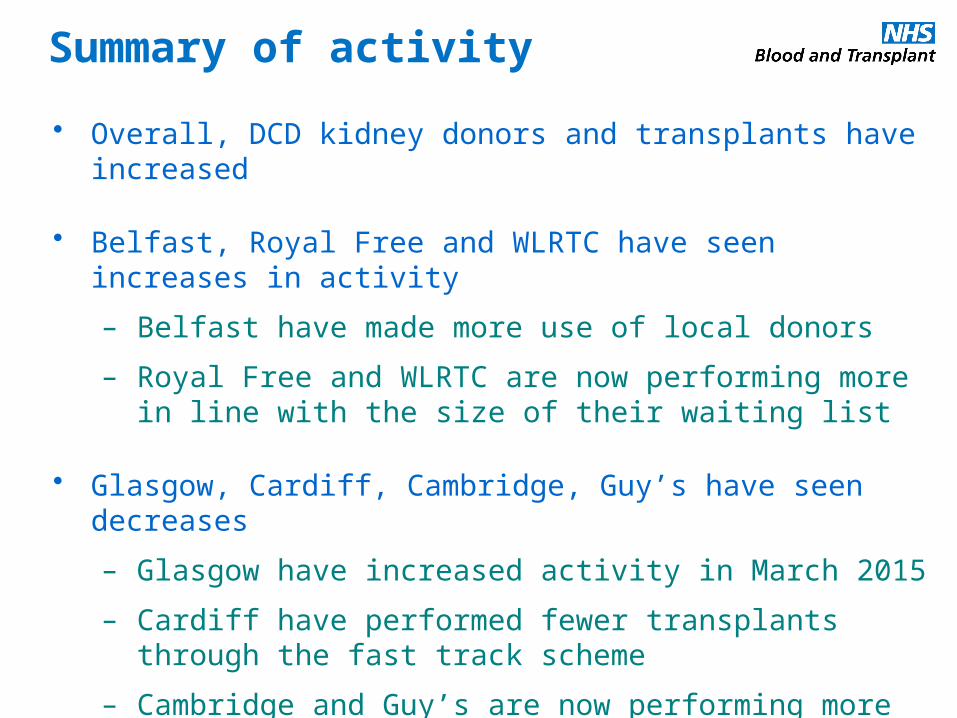
Summary of activity
• Overall, DCD kidney donors and transplants have increased
• Belfast, Royal Free and WLRTC have seen increases in activity
– Belfast have made more use of local donors
– Royal Free and WLRTC are now performing more in line with the size of their waiting list
• Glasgow, Cardiff, Cambridge, Guy’s have seen decreases
– Glasgow have increased activity in March 2015
– Cardiff have performed fewer transplants through the fast track scheme
– Cambridge and Guy’s are now performing more in line with the size of their waiting list
Equity of accessDonors aged 5 to 49 (5 to 64 in London)

Before After Before After Before After Before After Before AfterUK Northern South West Midlands London
0
10
20
30
40
50
60
70
80
90
100
3225
33 29 2921
4029 27
21
46
48
48 54 5059
40
43 47
41
1921
15 1315 17 19
14
25
31
4 7 5 4 6 3 2
15
17
Transplant centre
Per
cen
tata
ge
Long waiting patients
<1 year
1-3 years
3-5 years
<5 years
Before: 1 Sep 2013 – 31 Aug 2014After: 3 Sep 2014 – 28 Feb 2015

HLA matching of DCD transplants
Level 1(best match)
Level 2
Level 3
Level 4(worst match)
Before After Before After Before After Before After Before AfterUK Northern South West Midlands London
0
10
20
30
40
50
60
70
80
90
100
2 3 4 410
3
24
34
16
38
21 2433
1927
41
59
57
63
46
56
6653
67 63
59
146
1813
23
10 145 7
Transplant centre
Per
cen
tata
ge
Before: 1 Sep 2013 – 31 Aug 2014After: 3 Sep 2014 – 28 Feb 2015

Highly sensitised patients
Highly sensitised patients
Before After Before After Before After Before After Before AfterUK Northern South West Midlands London
0
10
20
30
40
50
60
70
80
90
100
95 95 95 94 94 97 10090 93 97
5 5 5 6 6 310 7 3
Transplant centre
Per
cen
tata
ge
Before: 1 Sep 2013 – 31 Aug 2014After: 3 Sep 2014 – 28 Feb 2015

Cold ischaemia times

Cold ischaemia time of DCD transplants
Before After Before After Before After Before After Before AfterUK Northern South West Midlands London
6
8
10
12
14
16
18
20
Q1
Transplant centre
Co
ld i
sc
ha
em
ia t
ime
(h
ou
rs)
p=0.1 p=0.4 p=0.5 p=0.1 p=0.9
Summary (1)
• Scheme went live on 3rd September 2014
• Designed to- Improve equity of access to a national resource- Optimise utilisation of DCD donor kidneys through formalised offering- Maintain (or reduce) overall cold ischaemia times
• General feedback on the scheme is positive- Potential impact on offering times needs to be addressed
• A six-month review of the screening centres to be undertaken shortly- Impact on screening centres- Donor suitability- More suitable way forward?

Summary (2)
• DCD Kidney activity has increased
• Better matching achieved through sharing
• Highly sensitised and long waiting patients have improved access to transplant
• Small reduction in cold ischaemia times
Should we increase the upper age limit for sharing DCD kidneys through the scheme?
– 5 year increments
– London experience, increase to 64 years?

AcknowledgementsDCD Kidney Allocation Working Party
Chair Susan Fuggle, Martin RafertyTransplant Centre Reps Argiris Asderakis, Peter Friend,
Lorna Marson, Justin Morgan, Chas Newstead, Gavin Pettigrew, Peter Rowe, Dominic Summers, David Talbot, John Connolly, Geoff Koffman, Keith Rigg
BSHI Andrea HarmerStatisticians Alex Hudson, Rachel Johnson,
Lisa BradburyAssociate Medical Director James NeubergerBAPN Jane TizardPAG Chair Christopher WatsonSNOD Julie Whitney
Endorsed by Members of the NHSBT Kidney Advisory Group