review of clinical applications with human accelerometry
TRANSCRIPT

Technical Report no. 06/12 ISSN: 0107-8283
Review of Clinical Applications with Human Accelerometry
Marcus Chang
Dept. of Computer Science University of Copenhagen • Universitetsparken 1
DK-2100 Copenhagen • Denmark

Review of Clinical Applicationswith Human Accelerometry
Marcus ChangDepartment of Computer Science
University of CopenhagenDenmark
Abstract
In this paper known clinical experiments based on human accelerometry are investigated. The purpose of thisis to facilitate the feasibility study on telemedicine carried out in 2006 in Næstved, Denmark. It is found that inorder to measure human activity an accelerometer with a range of at least ±6g or ±12g has to be used (dependingon the accelerometer being placed above or below the waist) and the sampling rate must be at least 40 Hz. Theuse of accelerometry, with respect to clinical applications, is reported on for the given domains: Detection ofphysical activity, fall detection, gait stability analysis, and balance assessment.
keywords: telemedicine, health care, gait, balance, fall detection, fall prevention

ContentsContents 2
1 Introduction 3
2 Reviews 42.1 Human Acceleration . . . . . . . . . . . . . . . . . . . . . . . . . . . . . . . . . . . . . . . . . 42.2 Physical Activity . . . . . . . . . . . . . . . . . . . . . . . . . . . . . . . . . . . . . . . . . . . 52.3 Fall Detection . . . . . . . . . . . . . . . . . . . . . . . . . . . . . . . . . . . . . . . . . . . . . 62.4 Balance and Gait . . . . . . . . . . . . . . . . . . . . . . . . . . . . . . . . . . . . . . . . . . . 8
2.4.1 Traditional Clinical Tests . . . . . . . . . . . . . . . . . . . . . . . . . . . . . . . . . . . 82.4.2 Finite Fourier Series . . . . . . . . . . . . . . . . . . . . . . . . . . . . . . . . . . . . . 8
3 Balance Assessment 113.1 Related Work . . . . . . . . . . . . . . . . . . . . . . . . . . . . . . . . . . . . . . . . . . . . . 113.2 Modeling . . . . . . . . . . . . . . . . . . . . . . . . . . . . . . . . . . . . . . . . . . . . . . . 133.3 Projections . . . . . . . . . . . . . . . . . . . . . . . . . . . . . . . . . . . . . . . . . . . . . . 13
3.3.1 Accelerometer below hip . . . . . . . . . . . . . . . . . . . . . . . . . . . . . . . . . . . 133.3.2 Accelerometer above hip . . . . . . . . . . . . . . . . . . . . . . . . . . . . . . . . . . . 14
3.4 Proof of Concept . . . . . . . . . . . . . . . . . . . . . . . . . . . . . . . . . . . . . . . . . . . 143.5 Summary . . . . . . . . . . . . . . . . . . . . . . . . . . . . . . . . . . . . . . . . . . . . . . . 15
4 Conclusion 16
References 17
page 2

1 IntroductionIn the years to come, the demographic evolution in Denmark will result in an increased amount of senior citizenscompared with todays figures. At the same time, the size of the danish workforce will decrease due to the recentdecades’ lower birth rates. The result of this is a huge strain on the danish welfare system. In particularly, thehealth care department will see the biggest challenges in the following years, with a larger population prone toillness, and a smaller clinical workforce to take care of the ill.
In order to relieve the strain on the hospitals and elder homes, the main strategy currently being developed is tokeep the elderly at home as long as possible instead of rehabilitating them at an elder home. This has mainly beendone with caretakers visiting the elders at their homes, and with the advent of telemedicine, caretakers are nowable to access citizens medical journals remotely, on location, with the help of wireless PDAs. This has made thecaring more direct and focused.
Another area of telemedicine being explored, is remote monitoring. Depending on the attributes being monitored,this has the potential of reliving the health care department significantly. By regularly monitoring the subjectsblood pressure, heart conditions might be prevented with preemptive medication. Similarly, by monitoring thesugar levels in the blood, caretakers can be notified immediately when a diabetes patient is in danger. This couldalso help ensure that diabetes patients with dementia receive the correct amount of insulin.
In light of this, a feasibility study in telemedicine is currently being carried out at the elder home, Marsksgårdscen-tret in Næstved, by IBM Denmark, Næstved kommune and DIKU. The first phase primarily consists of testing thedata collection infrastructure, with the key component being a Bluetooth enabled mobile phone1 acting as a gate-way between Bluetooth enabled sensors and a remote logging facility. The sensors being used is a blood pressuremonitor and an accelerometer.
While the use of blood pressure measurements taken regularly have been used by physicians for a long time andwith the effects of this well documented, the longterm benefits of this sensor is obvious. However, the continuouslymeasurement of human beings’ acceleration over a prolonged period of time, have not been done yet. In the regimeof telemedicine, the monitoring of acceleration could lead to the detection of gait and balance disorders in-time,before these effects become severe enough to cause the subject to fall and get injured. And for people with gait andbalance disorders, the continuous monitoring of acceleration could lead to an effective fall detection alarm, withthe ability to automatically call for help even though the victim is unconscious.
In this paper human acceleration measurements in the regime of clinical assessments are investigated. Section2 reviews previously work done on human acceleration and Section 3 shows how to use a single accelerometerto estimate balance. The purpose of this is to help understand the data collected in Næstved, to facilitate thedevelopment of telemedicine applications based on accelerometry and to improve the current accelerometer sensordesign.
1Sony Ericsson P910i
page 3

2 ReviewsIn this section some of the key topics with regard to clinical assessment with human accelerometry will be pre-sented. Section 2.1 reports on the normal amplitude and frequency ranges of daily activities, Section 2.2 reports onclassification of physical activities, Section 2.3 concerns detection of falls, and finally Section 2.4 describes howto use accelerometry to classify the balance and gait of an individual.
2.1 Human AccelerationThe work on human acceleration is far from new and an extensive work has already been done with wired ac-celerometers. A comprehensive list of work done both with wired and wireless accelerometers can be found in[1]. One of the key points given, is that in order to measure human acceleration, it is important to understand themotion of the human body and realize which physical property one wishes to measure. This is necessary in orderto choose the right combination of measurement range and accelerometer placement. General body motion can bemeasured with a single accelerometer placed close to the body’s center of mass, which is located within the pelvis.Other locations and applications could be:
• Thigh or ankle, to study leg movement during walking
• Wrist, to measure Parkinsonian bradykinesia2
• Arm and leg, to study Parkinsonian tremor
• Chest, to study coughing
The magnitude of the accelerations tend to increase from the head to the ankle, and are generally greater in thevertical direction. Table 1 shows some amplitude intervals for some typical activities. Closely related to theamplitude of the acceleration is the frequency. As with the amplitude, the frequency tends to decrease from theankle to the head, and are greater in the vertical direction than in the transverse plane. The major energy band fordaily activities is 0.3-3.5 Hz. Foot acceleration can reach frequencies up to 60 Hz but with 99% of the power beingbelow 15 Hz it has been concluded by [2] that in order to measure daily physical activities, the accelerometersmust be able to measure frequencies between 0 and 20 Hz, and accelerations up to ±12g in general and up to ±6gwhen attached to the waist.
Motion Vertical Horizontal ReferenceHead Body Ankle Head Body Ankle
Walking - -0.3 - 0.8 -1.7 - 3.3 -0.2 - 0.2 -0.3 - 0.4 -2.1 - 2.3 [2]Running 0.8 - 4.0 0.9 - 5.0 3.0 - 12.0 - - - [2]Trampoline 3.0 - 5.6 3.9 - 6.0 3.0 - 7.0 - - - [2]Stairs - up - - 7.4 - - - [1]Stairs - down - - 8.1 - - - [1]
Table 1: Amplitudes for different physical activities measured at different locations on the body. Allunits are in g
Another key point is the diversity of areas where accelerometry has been used in the past. The most studied being:
• Metabolic energy expenditure (which is the standard reference for the measurement of physical activities)
• Physical activity (defining and comparing group of subjects with different activity levels)
• Balance and postural sway
• Gait2Bradykinesia, or slowness of movement, is the third symptom found in Parkinsonian patients. Parkinsonian bradykinesia is often char-
acterized by a difficulty in initiating movements, but may include a slowness to perform fine motor movements and trouble with repetitivemovements. http://www.clas.ufl.edu/jur/200103/papers/paper_blue.html
page 4

• Sit-to-stand transfers (which is an important indicator for postural instability)
• Falls (especially detection of)
• Movement classification
Since the measurement ranges have an impact on the precision and cost of the accelerometers, and the frequencydetermines the sampling rate of the device, this knowledge becomes important when designing a sensor mote withthe purpose of clinical assessment. Thus, when monitoring a healthy adult an accelerometer with a range of ±6gshould be used if the accelerometer is to be attached at or above the waist, and ±12g if attached below the waist.The sampling rate should be at least 40 Hz in both cases due to the Nyquist limit.3
2.2 Physical ActivityDetection of daily physical activities by the use of a single accelerometer has been done by [3]. They used two2-axis accelerometers (ADXL210) with a range of ±10g and frequency response between 0-500 Hz. The twoaccelerometers were built into a pager-size box in a way to resemble a 3-axis accelerometer. The box also includeda AA battery, a radio, and some anti-aliasing circuitry. This resulted in a resolution of 0.025g. With a samplingrate of 45 Hz the device drew 15 mA from the 1.5V battery.
An experiment was carried out by 26 test subjects. With the device attached to the waist, each subject was toldto perform 11 distinct activities inside the laboratory. By inserting stationary periods between each activity andclosely monitoring the test subject a ground truth was established for cross-checking.
The collected data was analyzed by:
• Removing the gravitational acceleration by high-pass filtering the data with a finite impulse response filterwith cut-off frequency at 0.25 Hz4
• Each signal was averaged with a median filter of length n
• A non-overlapping moving average window of width w was applied
• For each window the value A = 1t × (
Rt |a1(t)|dt +
Rt |a2(t)|dt +
Rt |a3(t)|dt) was calculated
• A was then compared with a threshold value th in order to determine the activity in the window
The choice of A was chosen to reflect the fact that the amplitude of an activity is closely related to the duration ofit. This can be seen in Figure 1 were two stand-to-sit transitions have been measured. The upper showing a 1 sectransition and the lower a 2.5 sec transition.
By tweaking the values for n, w and th the size of A alone was enough to determine whether the subjects wereperforming any physical activity. A has been found to be proportional with the ”Metabolic energy expenditure”,a common reference for physical activity. The quantification of the daily physical activity is an important factorwhen assessing the health of a person, especially in the case of cardiac vascular diseases. An even better propertywould be the classification of the type of activity being performed, however, the authors did not try to use the valueof A for this.
Since the profile of the acceleration is a direct result of the activity being performed, it stands to reason that asuccessful classification of the profile will result in a correct classification of the activity. However, since thisprofile is lost during the integration part of calculating A, it is equally reasonable to expect that A alone is notenough to classify the activity. So, instead of just using a single threshold value, th, it might be worth segmentingA into several sets. With the help of empirical data it might be possible to define subsets for each distinct activity.Together with other parameters, such as those from Table 1, classification could be reduced to a simple tablelook-up.
3The Nyquist limit/frequency is the highest frequency that can be coded at a given sampling rate in order to be able to fully reconstruct theoriginal signal. http://mathworld.wolfram.com/NyquistFrequency.html
4The value being consistent with the results from Section 2.1, since the frequency of 0.25 Hz lies below the main energy band.
page 5

Figure 1: Comparison between two stand-to-sit transitions.
2.3 Fall DetectionAlthough not very used, a very promising application for mobile accelerometry is in the detection of falls of elderlypeople. Since falls have a huge impact on the wellbeing of elderly people, with the first fall often leading to otherillness and a reduced quality of life, the economical strain has made this one of the major concerns in the healthcaresector. A reliable fall detector would not be able to prevent falls of course, however, with the proper infrastructureit could reduce the arrival time of the paramedics when a fall had occurred, and thus greatly reducing the strain onthe body and fear of being helpless after a fall.
Several fall detection algorithms for accelerometers have been tried, with the most successful one being a patentedtwo-step algorithm by [7]. The first step is a collision detection. When an impact above a certain threshold hasoccurred the device enters a continuous monitoring stage until no more impacts are detected (this is to account fora person falling down several steps). The second step determines if the orientation of the device before and afterthe impact has changed significantly, since a walking person most likely will be lying down after a fall. A diagramof the algorithm can be seen in Figure 2. When a fall supposedly has been detected, the wearer has 20 sec to cancelthe alarm, or else a radio signal is sent to a nearby base station.
It does not appear very clear what type of sensors are being used in the device, only that a sensor is used to detectan impact above a certain threshold and that another sensor is used to calculate the orientation. In principle this canall be done with a single triaxial accelerometer, as long as it is sensitive to the Earth’s gravitational acceleration,because this can be used to calculate the orientation of the accelerometer, and thus the wearer.
The device was tested on 20 test subjects in order to detect false positives and with a mannequin 180 differentscenarios were tested for reliability. The result has been incorporated into a commercially available fall detector asseen in Figure 3.
The device operates on two 6V lithium battery cells with a lifetime of 5-6 months. It weighs 75g and measures75mm x 53mm x 28mm. It also has a panic button for immediate assistance. The device communicates with abase station similar to a regular burglar alarm. This integrates the fall detector with other sensors such as smokedetectors, pull cords, and pressure mats. A regular telephone connection (either hard line or through a GSM
page 6
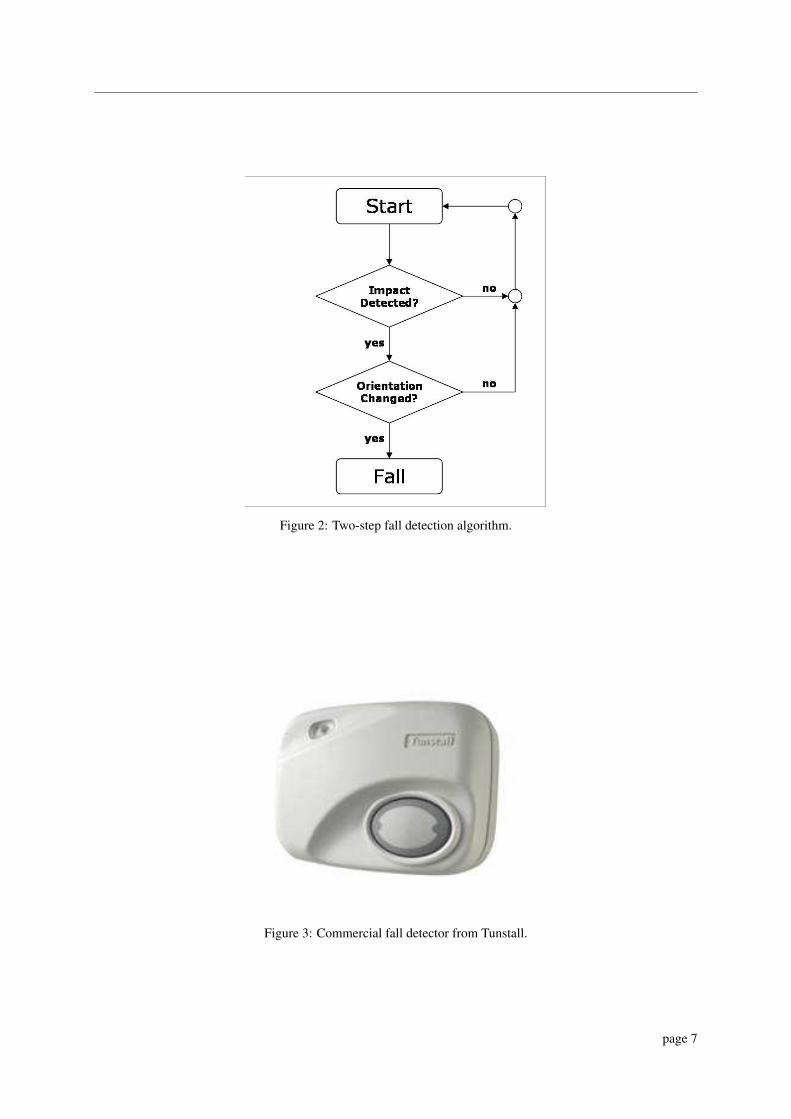
Figure 2: Two-step fall detection algorithm.
Figure 3: Commercial fall detector from Tunstall.
page 7

module) enables two-way communication with a call-center.5 The downside of this infrastructure is the limitationsof the radio link between the fall detector and base station, since the person wearing the fall detector looses allprotection when leaving the vicinity of the base station. A better approach would be to use a regular mobile phoneas a gateway for the fall detector, since a mobile phone by design is both portable and in constant contact with thephone net.
2.4 Balance and GaitAlthough fall detection certainly is invaluable when it comes to protecting the elderly, an even more desired abilityis obviously fall prevention. People with gait and balance difficulties can in many cases, with the proper exercisesand supervision, greatly improve their stability and hence reduce the risk for falling. The key issue here being ableto classify and identify people with existing or growing balance problems in-time, before the first fall occur.
Several clinical assessment tests already exist, but the extend of these tests make them time consuming and requirethe expertise of a physician. With some of the problems being expensive and difficult to operate equipment,and empirical data as a reference, which often requires a trained person to understand. One of these test is theRomberg’s Test, which will be investigated further in Section 3.
2.4.1 Traditional Clinical Tests
That accelerometry can be used to distinguish between people that is or is not frequent fallers, was concluded by[4] after testing 16 elderly people both with clinical tests and with acceleration data sampled from the hip andhead. It was found that there were significant statistically differences in the data collected from the 8 frequentfallers and the rest. Specifically the root-mean-square amplitude, standard deviation of mean amplitude, peak-to-peak amplitude, and spectral frequency content of the accelerations were calculated and compared. But, since thedata was collected while the test subjects were performing the clinical tests anyway, the value of the results arelimited since the clinical tests have already been proved correct and the supervision of a physician is still needed.
2.4.2 Finite Fourier Series
It has been shown by [5] and [6] that frequent fallers have an irregular sway of the hip, especially when walkingon a rough surface. Also, the inability to hold the head steady is also common among frequent fallers. With twotriaxial accelerometers, one attached at the head with a helmet, and the other strapped to the hip with a belt, 100elderly people were tested.6 The accelerometer on the head had a range of ±5g and the one on the hip had a rangeof ±10g.7 Both accelerometers were connected to a laptop placed in a backpack carried by the test subject. Asampling rate of 200 Hz was used.
The tests consisted of walking down a 20m long times 1.5m wide hallway. Two different surfaces were used, oneplane surface and one covered with 5mm artificial grass, two layers of 20mm thick soft foam rubber, and 20mmthick wooden blocks of varying shapes and sizes laid out in an arbitrary matter.
Each axis of the measured accelerations were approximated with a finite Fourier series. This was based on a stablerhythmic gait should exhibit a systematic stride frequency distribution. Defining a stride as two-steps, accelera-tion in the vertical and forward (anterior/posterior) direction should consist of acceleration patterns that repeat inmultiples of two, since the movement in these directions are symmetrical with regards to which leg being used.For the vertical and anterior/posterior direction the even harmonics are thus in-phase, while the odd harmonics areout-of-phase. This is clearly visible in Figure 4, were the first three even harmonics clearly dominates the rest.
A harmonic ratio can then be calculated by dividing the sum of the ten even harmonics with the sum of the tenodd harmonics. The harmonic ratio thus becomes a measure for how rhythmic the gait is. Since the sideways(medio/lateral) direction is dependent of which leg is taking the step, one should expect the odd harmonics to bein-phase and the even harmonics to out-of-phase. For the medio/lateral direction the harmonics ratio is thus defineddirectly opposite.
5http://www.tunstall.co.uk6It is unknown how many high-risk fallers were among the 100 test subjects.7These ranges being consistent with the data from Table 1.
page 8

Figure 4: The correlation between a stride and the harmonics from an approximation with a finiteFourier series.
page 9

Figure 5: Harmonic analysis of accelerometry signals at the head in the vertical and anteroposteriordirections from a low-risk subject (left) and a high-risk subject (right), normalized to the second har-monic.
The authors found that at the level of the pelvis, high-risk fallers exhibited significantly smaller vertical harmonicratios than low-risk fallers on both surfaces, and at the level of the head, the ratio was significantly smaller for boththe vertical and anterior/posterior harmonic ratios.
Figure 5 shows a harmonic analysis of acceleration signals at the head in the vertical and anterior/posterior direc-tions from a low-risk subject and a high-risk subject. Although it can clearly been seen that the low-risk fallerhas a significantly amount of energy clustered around the second harmonic and the energy are spread more evenlyfor the high-risk fallers, the authors did not pursue any other quantification than the harmonic ratio. This seemssurprisingly, since most likely a simple pattern recognition algorithm should be able to differentiate between theleft and right case shown in the figure.
In a situation were acceleration measurements were continuously sampled, the gait and balance could be evaluatedcontinuously as well. With the detection algorithm for physical activity given in Section 2.2 each interval withphysical activity could be approximated with a finite Fourier series and rated with either a harmonic ratio or apattern recognition algorithm.
page 10

3 Balance AssessmentA common way to assess the balance of a person is the Romberg’s Test, where the person must be able to standwith both feet in-line with eyes opened and side-by-side with eyes closed. A graduation and quantification ofthis test can be done by monitoring the sway of the person’s waist while performing this test. This can be donedirectly with a pen tied to a rod tied to the waist. The sway of the waist can then be outlined by the pen. Thismethod is cumbersome since the results are neither easy to analyze nor compare with reference measurements.Another common way of quantifying the sway is by using a force plate,8 and by continuously measuring the forcedisplacement on the plate an approximation of the sway can be obtained. This data can be collected by computerfor easy storage and analysis, but requires a relative expensive force-plate which in itself is awkward to transport.
Another way to obtain the same set of data is by using an accelerometer. Since the gravitational acceleration is aconstant component of the measured acceleration, one can use these measurements to establish the orientation ofthe accelerometer with regards to the earths gravity. Since the measured acceleration shifts between the three axiswhen the accelerometer is tilted, projecting the horizontal components, measured in the accelerometers referenceframe, onto a horizontal plane on the ground, one can get an outline of the accelerometers movement.
Section 3.1 describes related work on this subject. Section 3.2 and 3.3 explain the projection and the assumptionsthat are made, in more detail than the ones that are given by the authors of the article presented in the previoussection. And Section 3.4 shows a simple experiment illustrating how the projection works in practice.
3.1 Related WorkA direct comparison between measurements obtained by using a force plate and an accelerometer was performedby [8]. The equipment used was a triaxial accelerometer specifically designed for clinical applications [9] with arange of ±5g, resolution of 0.001 x g and frequency response from 0 to 300 Hz. The accelerometer was attachedto the subjects with a motorcyclist belt and connected with a data collecting device through a wire. As reference,a force plate from AMTI9 was used.
Eight subjects with no history of walking disorder were put through four different tests, each lasting 30 seconds.
• Feet comfortable position, eyes open (CPEO)
• Feet comfortable position, eyes closed (CPEC)
• Feet together, eyes open (FTEO)
• Feet together, eyes closed (FTEC)
All four tests were performed standing on the force plate with the accelerometer attached to the widest part of thehip, centered on the back, with the belt tightened to the trunk. Measurements were sampled simultaneously fromboth the force plate and accelerometer at a sampling rate of 50 Hz. The data was subsequently compensated fordrift and the noise was low-pass filtered at 5 Hz with a sixth order Butterworth filter.
Five performance parameters were calculated from center of pressure and from the tracing of the travel of theacceleration vector. These parameters were used in combination to indicate the general balance of a subject:
• mean speed (V)
• mean radius (R)
• mean frequency (F)
• displacement in the anterior-posterior (A/P) direction (Sx)8A plate similar to at bathroom scale, except that the torque induced by the applied force is measured as well, and can be used to calculate
the force displacement on the plate.9http://www.amti.biz/
page 11

• displacement in the medial-lateral (M/L) direction (Sy)
The averages and standard deviations of the accelerometer and force plate measurements can be seen in Figure6 and 7 respectively. Besides from a scaling factor the mean speed, A/P and M/L displacements are virtuallyidentical.
Figure 6: Accelerometer performance parameters, averages and standard deviations: Mean speed (V), mean radius(R), mean frequency (F), anterior-posterior displacement (Sx), and medial-lateral displacement (Sy).
Figure 7: Force platform performance parameters, averages and standard deviations: Mean speed (V), mean radius(R), mean frequency (F), anterior-posterior displacement (Sx), and medial-lateral displacement (Sy).
Statistically, in 15 out of 20 comparisons the accelerometer measurements were able to distinguish between the dif-ferent test conditions the same way as the force platform. In one case the accelerometer did not detect a differencethe force plate did, and in four cases the accelerometer detected a difference the force plate did not.
Based on these measurement the authors conclude that the accelerometer system is more sensitive than the forceplatform, since it picked up all but one of the differences the force platform picked up, and additionally it pickedup four differences the force platform did not detect.
page 12

3.2 ModelingIn order to use a single triaxial accelerometer to measure the sway of the hip by projection, one needs to makesome assumptions about the human body in order to establish the correct geometry. Since the precise positionsof the different body parts cannot be obtained by this one instrument alone, it is not possible to make an exactmodel of the human body, hence it becomes necessary to approximate the human body with a more simple model.The model must however allow for the movement of the hip and be able to hold it’s balance without moving theunderlying support, since these are the conditions for standing on a force plate. A rigid rod standing vertical is thusnot a suitable model for the human body, since the middle of the rod (the hip) cannot change position without theentire rod falling. However, by adding a second rigid rod connected to the first rod by a ball-joint, this model bothhave a displaceable hip (the ball-joint) and is capable of standing upright. This is illustrated in Figure 8.
Figure 8: Approximation of the human body. By displacing the hip, the upright posture can be maintained.
3.3 ProjectionsThe formulas for calculating the projection of the gravitational acceleration onto a horizontal plane depends onboth the placement of the accelerometer and on the subsequent tilting of the accelerometer. Since the height aboveground determines the amplitude of the projection, a greater height will result in a projection less susceptible tonoise. On the other hand the height itself must be known, within a reasonable margin of error, in order to calculatea consistent projection. By assuming the size of the ball-joint to be negligible compared to the length of the lowerrod, the optimal placement would be at the top of the lower rod just above or below the ball-joint, since the heightis only well defined on the lowest rod. Depending on which position is chosen the accelerometer undergoes twodifferent kind of tilts, and thus each position has it’s own projection associated with it.
3.3.1 Accelerometer below hip
By placing the accelerometer below the hip, the accelerometer becomes fixed to the lower rod and the measuredtilt is thus caused by the rotation of the lower rod. First, by looking only at the XZ-plane one obtains the geometrydepicted in Figure 9.
Denoting the size of the measured vector A =√
a2x +a2
y +a2z , the cosine of β can be expressed as:
cosβ = axA
cosβ = dxdz
Combining these two equations, the projected displacement, dx, can be expressed by ax, A and dz. By symmetrythe same geometry holds when calculating dy. Thus the two projected displacements can be calculated by the twoequations:
dx = dzaxA
dy = dzayA
page 13

Figure 9: Projection of the measured gravitational accelerations x-component onto the surface. Accelerometerplaced below the hip.
3.3.2 Accelerometer above hipBy placing the accelerometer above the hip, the accelerometer becomes fixed to the upper rod. The measured tiltis now caused by the tilting of the upper rod. Disregarding the displacement caused by the tilt of the lower rod andby looking only at the XZ-plane, one obtains the geometry depicted in Figure 10.
Figure 10: Projection of the measured gravitational accelerations x-component onto the surface. Accelerometerplaced above the hip.
Since the angles in the two triangles are the same, the two triangles are similar and the ratio of the two catheti isthe same, thus
dzdx
= azax
Again, by symmetry the same set of arguments holds when calculating dy, and the two projected displacementscan be calculated by
dx = dzaxaz
dy = dzayaz
3.4 Proof of ConceptA simple experiment was conducted to illustrate the correspondence between sway and projection. A FreescaleSARD mote [10] equipped with a single-axis ±1.5g [11] and a dual-axis ±1.5g accelerometer [12] was used tosample measurements at 50 Hz. The movements made were analog to the projection corresponding to having theaccelerometer strapped below the hip. The collected data was filtered with a moving average and the projectionwas plotted in MatLab. The result of this experiment can be seen on the two videos located on the DIKU computersystem at /net/urd/home/disk14/marcus/projekter/ibm/{live.wmv;matlab.wmv}.
page 14

3.5 SummaryIt has been shown that an inexpensive single triaxial accelerometer can be substitute for an expensive force platewhen it comes to measuring the sway of the hip in balance assessments. The main advantage of this is the possi-bility for a patient to perform the test at home, then have the data transmitted to a database for easy retrieval bya physician and finally for establishing empirical reference data. With a sufficiently large collection of empiricaldata, an automated alarm could be generated to a physician when critical values were detected.
page 15

4 ConclusionThe purpose of this paper has been to facilitate the feasibility study being carried out in Næstved by investigatingknown clinical experiments based on human acceleration data. This information should be used both with respectto sensor and application design.
First, by the work of [2] the measuring range of the accelerometers in question must be at least ±6g if the ac-celerometer is to be attached at or above the waist, and ±12g if attached below the waist. Also, the sampling rateshould be at least 40 Hz in both cases due to the Nyquist limit.
Second, by calculating the integral of the absolute value of the accelerations, a value proportional with the”Metabolic energy expenditure” was found by [3]. This can be used to classify whether or not a person is per-forming any physical activity. In the telemedicine regime this can be used to monitor the amount of exercise thepatient is performing.
Third, a simple two-step algorithm can be used to detect falls from triaxial acceleration data, if the accelerometeris sensitive to the Earth’s gravitational acceleration. By first detecting an impact (based on a threshold value) andsubsequently detecting a (large) change of orientation, [7] created a commercially available fall detector.
Fourth, by approximating a fixed amount of accelerometer measurements with a finite Fourier series, the numberof in-phase harmonics divided by out-of-phase harmonics could be used as an estimate for the gait stability. Thiswas shown by [6] by having 100 elderly people walk down a 20m long hallway.
Fifth, the balance, normally assessed with a force plate, was assessed by [8] with a triaxial accelerometer, byprojecting the two horizontal components of the gravitational acceleration down onto the floor. A proof-of-concepttest was performed to verify this.
page 16

References[1] M. J. Mathie, A. C. F. Coster, N. H. Lovell, and B. G. Celler: “Accelerometry: Providing an
Integrated, Practical Method for Long-term, Ambulatory Monitoring of Human Movement”,Physiological Measurement, 25. R1-R20. 2004.
[2] C. V. C. Bouten, K. T. M. Koekkoek, M. Verduin, R. Kodde, and Jan D. Janssen: “A TriaxialAccelerometer and Portable Data Processing Unit for the Assessment of Daily Physical Activity”,IEEE Transactions on Biomedical Engineering, vol. 44. no. 3. March 1997.
[3] M. J. Mathie, A. C. F. Coster, N. H. Lovell, and B.G. Celler: “Detection of Daily Physical ActivitiesUsing a Triaxial Accelerometer”, Med. Biol. Eng. Comput., 41, 296-301, 2003.
[4] C. Cho and G. Kamen: “Detecting Balance Deficits in Frequent Fallers Using Clinical andQuantitative Evaluation Tools”, Journal of the American Geriatrics Society, vol. 46. no. 4. April 1998.
[5] H. B. Menz, S. R. Lord, and R. C. Fitzpatrick: “Acceleration patterns of the head and pelvis whenwalking on level and irregular surfaces”, Gait and Posture, 18. 35-46. 2003.
[6] H. B. Menz, S. R. Lord, and R. C. Fitzpatrick: “Acceleration Patterns of the Head and Pelvis WhenWalking Are Associated With Risk of Falling in Community-Dwelling Older People”, Journal ofGerontology: Medical Sciences, vol. 58a. no. 5. 446-452. 2003.
[7] K. Doughty, R. Lewis, and A. McIntosh: “The Design of a Practical and Reliable Fall Detector forCommunity and Institutional Telecare”, Journal of Telemedicine and Telecare, vol. 6. sup. 1. 2000.
[8] R. E. Mayagoitia, J. C. Lötters, P. H. Veltink, and H. Hermens: “Standing Balance Evaluation Using aTriaxial Accelerometer”, Gait and Posture, 16. 55-59. 2002.
[9] J. C. Lötters, W. Olthuis, P. H. Veltink, and P. Bergveld: “Design, Realization and Characterization ofa Symmetrical Triaxial Capacitive Accelerometer for Medical Applications”, Sensors and ActuatorsA (Physical), 61. 303-308. 1997.
[10] Freescale Semiconductor Inc.: “Sensor Applications Reference Design (SARD) User’s Guide”,MC13192SARDUG, Rev. 1.5, 07/2005.http://www.freescale.com/files/rf_if/doc/user_guide/MC13192SARDUG.pdf
[11] Freescale Semiconductor Inc.: “ Low G Micromachined Accelerometer”, MMA1260D, Rev. 1,10/2004. http://www.freescale.com/files/sensors/doc/data_sheet/MMA1260D.pdf
[12] Freescale Semiconductor Inc.: “+/- 1.5g Dual Axis Micromachined Accelerometer”, MMA6160Q,Rev. 2, 10/2004. http://www.freescale.com/files/sensors/doc/data_sheet/MMA6260Q.pdf
page 17