review of agriculture project baseline surveying methods …pdf.usaid.gov/pdf_docs/pnacw797.pdf ·...
TRANSCRIPT

Review of Agriculture Project Baseline Surveying Methodsof Title II Funded PVOs
Part I: Socio-economic methods
Prepared for Food Aid Managementby Patricia Bonnard
September 30, 1998

Bonnard:Sept 30, 1998 i
TABLE OF CONTENTS
List of Tables, iiiAbbreviations, ivAcknowledgement, v
1. Introduction, 11.1 Review Methods and Documents Used, 11.2 Approach, 2
2. Overview of Monitoring and Evaluation, 32.1 DAP Guidelines, 3
2.1.1 USAID Reporting Needs, 32.1.2 PVO Experience in Dealing With FFP and USAID Missions, 3
2.2 Three PVO Applications of the Baseline Survey, 42.2.1 Performance Reporting Objective, 42.2.2 Project Management Objective, 42.2.3 Project Development Objective, 52.2.4 Confusing Assessments and Baselines, 5
2.3 Current Institutional Structure and Capacity of PVO Monitoring and Evaluation, 52.3.1 Consultants, 62.3.2 M&E Technical Support, 62.3.3 Use of M&E Output, 72.3.4 Summary of M&E Issues and Recommendations, 7
3. Observations on PVO Use of the Logical Framework and Baseline Survey Design, 83.1 The Logical Framework, 83.2 Confusion of Economic and Survey Terms, 9
4. Baseline Questionnaire Review, 114.1 The Respondent, 114.2 Demographics, 12
4.2.1 Migration, 134.2.2 Earnings, 13
4.3 Agricultural Production and Yields, 134.4 Accounting for Inputs, Factors of Production, and Other Area Specific Information, 154.5 Adoption of Improved Technology or Practices, 154.6 Agriculture Marketing, 17
4.6.1 Marketing Information, 174.6.2 Household Agricultural Product Sales, 18
4.7 Self-Provisioning of Food, 194.8 Issues for Baseline Data Management, 20
5. A Note About Sampling, 215.1 Defining Project Participants or Beneficiaries, 21

Bonnard:Sept 30, 1998 ii
5.2 Control Groups, 21
6. Recommendations, 226.1 Institutional Structure of PVO Monitoring and Evaluation, 226.2 Formal Baseline Questionnaire Design, 236.3 Future Studies, 23
References, 37Appendix, 41
A. List of Contacts, 41

Bonnard:Sept 30, 1998 iii
LIST OF TABLES
Table 1: Information Available for the Review of PVO Monitoring and Evaluation Methods, 24Table 2: USAID/FFP Generic Indicators for Agricultural Productivity and Natural Resource
Management, 25Table 3: Structure of Monitoring and Evaluation of PVOs With Title II-funded Agricultural
Projects, 26Table 4: Inventory of Monitoring and Evaluation Methods Used by PVOs for Title II Agriculture
Projects, By PVO, 27Table 5: Inventory of Monitoring and Evaluation Methods Used by PVOs for Title II Agriculture
Projects, By Country, 32

Bonnard:Sept 30, 1998 iv
ABBREVIATIONS
ACDI Agricultural Cooperative Development InternationalADRA Adventist Development & Relief AgencyCGIAR Consultative Group on International Agricultural ResearchCIAT Centro International de Agricultura TropicalCRS Catholic Relief ServicesDAP Development Activity ProposalFAM Food Aid ManagementFAO Food and Agricultural Organization of the United NationsFFP Food for PeaceFFW Food for WorkFHI Food for the Hungry InternationalIDB Inter-American Development BankIFPRI International Food Policy Research InstituteIMPACT Food Security and Nutrition Monitoring ProjectISNAR International Service for National Agricultural ResearchJFS João Ferreira dos SantosKP Knowledge and PracticesIIED Centre for Research and Information on Low-External-Input and Sustainable
AgricultureITAD Information Technology and Agricultural DevelopmentMSF Medicine Sans FrontierM&E Monitoring and EvaluationMOA Ministry of AgricultureMSU Michigan State UniversityNARS National Agriculture Research StationNRM Natural Resource ManagementPRA Participatory rapid appraisalPVO Private voluntary organizationRA Rapid appraisalRRA Rapid rural appraisalSave Save the Children FundSCF Save the Children FundTA Technical assistanceTNS TechnoserveUNICEF United Nations International Children’s FundUSAID United States Agency for International DevelopmentVOCA Volunteers in Overseas Cooperative AssistanceWB World BankWFP United Nations World Food ProgrammeWV World Vision

Bonnard:Sept 30, 1998 v
ACKNOWLEDGMENTS
This review required the cooperation and involvement of many individuals both within and outside thePVO community. The List of Contacts included in the appendix contains the names and affiliation ofmany of these people. In particular, the author would like to acknowledge Gaye Burpee (CRS), CarlaBriceño (Technoserve), TJ Ryan (FAM), and David Evans (FHI) for their helpful and thorough editorialcomments. TJ and Dave also played an important role in administrating this contract, providinglogistical support, and making PVO contacts. Jessica Graef and Shelia Ingram are acknowledge fortheir assistance in downloading, printing and moving documents. The author would also like to thankthe Linkages project staff for sharing the contents of their fabulous filing system.

Bonnard:Sept 30, 1998 1
Review of Agriculture Project Baseline Surveying Methodsof Title II Funded PVOs
Prepared for Food Aid Managementby Patricia Bonnard
1. Introduction
The majority of Food Aid Management (FAM) member private non-profit organizations (PVOs)had expressed an immediate need to modify and improve their baseline survey methods currentlyemployed in the implementation of United States Agency for International Development (USAID)Title II agriculture projects. This report presents the findings of a rapid first-cut review of baselinesurvey methods. Emphasis is placed on methods for which information and supporting documentswere readily available, on problems shared by the majority of member PVOs, and on short-termrecommendations that can be instituted easily by most PVOs regardless of their resource andtechnical capacity. Medium- and long-term recommendations are noted. However, theappropriateness of these recommendations is less universal and tends to be contingent upon theindividual PVO’s priorities; approach and strategies related to poverty alleviation and economicdevelopment; long-range organizational plans; and available resources.
1.1 Review Methods and Documents Used
Initially, the review was to be based on complete sets of baseline survey methods. This includedsampling methods, formal questionnaires, other participatory and informal survey guides, andenumerator instruction manuals with definitions of terms and key variables as well as explanationsof how questions were asked and measurements were made. Documentation on project objectives,selected indicators, and monitoring and evaluation (M&E) plans contained within Title IIDevelopment Activity Proposals (DAPs) were also requested. These documents were necessary inorder to establish whether the survey methods enable collection of relevant data and informationthat link directly to project goals and objectives. This approach to information gathering was highlydependent on participating PVO central office staff’s capacity to rally the cooperation of fieldstaff. The short time allotted for the review, the frequency of PVO staff travel, and the limitedmeans of communication with field offices significantly compromised this aim.
Fortunately, the USAID-funded Linkages project proved to be a valuable depository of DAPdocumentation. Many original DAPs, Previously Approved Activity Reports (PAA), ResultsReports, and questionnaires could swiftly be retrieved from their extensive files. Table 1 presentsan inventory of the documents acquired from the PVOs and the Linkages project office. Thecolumn labeled “questionnaires” refers to formal household baseline questionnaires. Only a fewinformal survey forms were located. While a number of M&E plans indicated that a mix of survey

Bonnard:Sept 30, 1998 2
methods are utilized over the life of a project, there was limited explanation as to how thesemethods were to be combined and whether they constituted a part of the baseline specifically. As aresult, the review concentrated on the formal household baseline questionnaire. Since it is theprimary and most common baseline survey tool, it is a logical place to start. The formal householdquestionnaire also provides a clear reflection of how well project objectives, implementation steps,and performance monitoring are aligned. While some PVOs and researchers may be moreinterested in developing new alternative M&E methods and feel that the formal household survey ispassé or too technically demanding for most PVO contexts, many of the issues related to designingand implementing an effective standard baseline survey tool will continue to plague thoseattempting to the design alternative methods.
Information used for the review was also gathered through interviews conducted with the staff ofmember PVOs as well as knowledgeable individuals affiliated with a number of research institutes,universities, donor agencies, and other organizations engaged in M&E work (see contact list inappendix). Collection of information from sources outside the member PVO community wasconducted on an as-time-permits basis. This activity was greatly constrained by the time-intensivenature of PVO document retrieval.
1.2 Approach
This first step in the review process was to determine which Title II projects should be included.Agriculture is a broad sector. It can encompass a wide assortment of components includingproduction, post-harvest storage and processing, marketing, extension, adaptive research, credit,farmer associations, rural micro-enterprises, etc. However, as part of its reorganization process,USAID excluded a number of these components from what it now calls agriculture and,consequently, created a new, none-standard definition of agriculture that masks the criticalrelationships between a number of the components listed above. The Linkages project was able tofurnished a list of Title II DAPs which cross referenced activities by cooperating sponsor (thePVO), country, and category: e.g., agriculture, natural resources, roads and infrastructure, etc. Forease and simplicity, this review relied on this classification system even though a number of theagriculture projects listed included large natural resource management, rural road construction,and/or rural micro-enterprise development components.
Because the assignment was to review baseline survey methods used in implementation of USAIDTitle II DAPs, the logical framework, generic impact and annual monitoring indicators, and othercomponents of the USAID DAP guidelines were taken as given and not subject to review. In theshort run, PVOs have to comply with these guidelines regardless of their preferences or theexistence of better M&E approaches. While this review illustrates how PVOs can improveperformance reporting to USAID, it also intends to help PVOs produce more relevant andmeaningful data and information which will enhance their capacity to achieve their own distinctproject management and program development aims. The report presents an overview of currentPVO M&E structure and processes, observations on PVO execution of the DAP logical frameworkas it relates to the design of effective baseline survey methods, a detailed critique of formalhousehold baseline questionnaires, a note on sampling methods, and some ideas for future studies.

Bonnard:Sept 30, 1998 3
2. Overview of Monitoring and Evaluation
The following section provides and overview of participating PVOs’ institutional structure andtechnical resources for monitoring and evaluation as well as a brief note on USAID Food ForPeace M&E guidelines. To make constructive recommendations, it was necessary to establish whatis feasible for participating PVOs given their existing resources. Agricultural baseline surveymethods developed for Title II programs are just part of a PVO’s overall M&E system whichencompasses a variety of sectors other than agriculture and both Title II and non-Title II fundedprograms. Consequently, this specific subset of tools is best examined in the context of a PVO’sboarder capacity to design and implement M&E activities. The complexity, sophistication, andefficacy of agricultural M&E methods will be constrained by the PVO’s technical and institutionalcapacity. The main objective of this report is to identify measures that improve M&E performancegiven the current capacities. However, as this overview demonstrates, there are a number of short-term actions that could reduce institutional and technical constraints and immediately improvecapacity.
2.1 DAP Guidelines
All Title II Development Activity Proposals (DAPs) have to present a “logical framework”outlining the project goals, intermediate objectives or activities, outputs, and selected performanceindicators (i.e., impact and annual monitoring indicators). Variations of this framework are used bythe World Bank (WB), Inter-American Development Bank (IDB) and the United Nations’ WorldFood Program (WFP). In conjunction with the logical framework, the cooperating sponsor (CS), orin this case the PVO, has to submit a monitoring and evaluation plan consistent with the DAPguidelines. This plan is part of the “Activity Objectives and Design” section of the guidelinesimplying that the establishment of objectives, program activities, and M&E system are integratedcomponents of the overall project design. M&E should be considered at the inception of projectplanning.
Food For Peace (FFP) also publishes detailed guidelines on how the CS should track performanceand recommends a list of generic indicators (see table 2 for a list of agriculture and naturalresource management generic indicators). The list is limited. Significant project components areomitted such as agricultural marketing, credit, and micro-enterprise development. It is not difficultto imagine why PVOs tend go beyond this list attempting to identify performance indicators thatare meaningful for their own management objectives. This review will not critique the genericindicators listed but merely notes that the PVOs are encouraged, and in some instances required, touse them.
2.1.1 USAID Reporting Needs
While M&E systems are a mechanism for observing PVO progress and performance, the datacollected also serve as inputs to USAID’s results reports and medium- to long-term programdevelopment as well as congressional releases, testimonies, and speeches. USAID, therefore, has astrategic interest in assuring that PVOs furnish relevant and reliable information. In countries orregions where there are more than one DAP with similar activities, consistent monitoring acrossDAPs assists in the compilation of USAID performance records. Under these circumstances, theguidelines encourage “...joint monitoring and evaluation plans...” (USAID, 1998:16).

Bonnard:Sept 30, 1998 4
2.1.2 PVO Experience in Dealing With FFP and USAID Missions
Complaints registered against USAID tended to be country specific. The most common criticismwas overburdening the PVO with collection of data to measure too many indicators too frequently.Attempts by the missions to institute joint monitoring and evaluation has proven to be somewhatproblematic. Some PVOs remarked that project objectives, activities, and working environmentsand activities are too dissimilar too warrant identical reporting. However, this does not precludesome degree of standardization. PVOs have also resisted the execessive frequency of datacollection mandated by several missions. When USAID’s strategic objectives and reportingrequirements changed, one mission insisted that all Title II PVOs implement a new formalhousehold survey which the mission erroneously termed a baseline. PVOs had all already initiatedtheir projects, conducted baselines and were then forced to manage two simultaneous M&Esystems. The layering was particularly burdensome for PVOs with multiple funding sources sincethey had to juggle conflicting donor opinions and requirements regarding the M&E process. Theycould not simply dismantle their original systems.
2.2 Three PVO Applications of the Baseline Survey
Although not always aware of the distinction themselves, PVOs will generally talk about threeapplications for the baseline survey: 1) performance reporting, 2) project management, and 3)program development. While these are all legitimate demands for information, the formal baselinesurvey is not always the most appropriate means of collecting the quality of data required to meetall three aims.
2.2.1 Performance Reporting Objective
Performance reporting is generally required by donors, in this case FFP. There are guidelinesconcerning report content and format, as detailed in the preceding section, and this output isincorporated into the results reports for both the mission and USAID as a whole. Using a logicalframework, the focus is on performance indicators. Performance reports are also useful for projectmanagers. If developed reliably, the results reports assist managers in tracking progress towardproject goals and objectives. But results reporting provides an indication of change, not causalityor attribution. One exception is that USAID requires PVOs to justify outcomes that fall belowestablished targets. Under these circumstances, PVOs have to attribute shortfalls to some plausiblefactor(s).
2.2.2 Project Management Objective
While performance indicators are important to project management aims, there is an even greaterneed for understanding causality, for knowing what led to the changes in indicator values, whichcomponents of the project run smoothly and why, whether project operations or expectations haveto be changed, etc. This type of information is valuable to managers even in the early stages of theproject. Although this type of information contributes substance to reports and discussions withdonors, the outputs are largely for internal consumption, and can be tailored to meet specificproject needs. PVOs are not obligated to follow guidelines in developing the M&E methods thataddress project management objectives. A formal household survey may not always be the bestapproach. In fact, expanding a formal baseline survey to incorporate broader project managementdiagnostic and other information needs, often complicates and overburdens the baseline data

Bonnard:Sept 30, 1998 5
collection process. To get at causal relationships, smaller more directed formal studies, casestudies, rapid appraisals, informal and participatory methods may better match the particularproject context.
2.2.3 Program Development Objective
The third PVO application of the baseline survey, program development, relies on data collectionto address two objectives: identifying potential future projects and building the PVO’s overallagricultural development framework or approach to alleviating household food insecurity.Accumulated experience, fortified with data, suggests that certain strategies work in certaincircumstances, e.g., fertilizer bean is readily adopted and increases soil fertility in wide range ofagroecological and socioeconomic contexts, farmer to farmer extension approaches work in onecontext but not in others, etc. Collective experience and knowledge helps develop and reinforce aPVO’s framework, strengthens future program designs, and contributes to the success of USAIDprograms. As is the case with the project management, program development requires performancemeasures as well as results that can explain behavior and imply causal relationships. The latterborders on, and in some cases includes, formal research pursuits. But, adding questions to thebaseline survey to meet these aims almost always complicates and overburdens the M&E process.Instead, PVOs should conduct more directed studies with the assistance and guidance of nationaland international agricultural research stations, local and foreign universities, and/or the privatesector.
2.2.4 Confusing Assessments and Baselines
There is one additional, but in this case inappropriate, application of the baseline survey. A numberof PVOs combine or confuse the assessment, which is tied to project identification anddevelopment of a proposal, with the execution of a baseline. The assessment uses formal andinformal survey methods and often purposive sampling in an effort to rapidly determine the needfor a project and suggest reasonable development activities based on the problems, constraints andopportunities identified. Given the time that it takes to develop, review, rework, approve and set upthe DAP, several years might elapse between the assessment and initiation of DAP field activities.This is ample time for assessed conditions to change, especially in a post-conflict context. In thiscase, data collected during the assessment could not serve as baseline indicator values. In addition,data needs are different: the assessment is diagnostic while the baseline sets representativebenchmarks against which program progress is compared throughout the monitoring process andfor the mid-term and final evaluations.
2.3 Current Institutional Structure and Capacity of PVO Monitoring and Evaluation
A look at the institutional structure of PVO monitoring and evaluation provides a quick impressionof why PVOs have difficulty instituting effective M&E systems as well as their capacity forinstituting change and recommendations. Table 3 presents an overview of the M&E structure ofparticipating PVOs. Generally, M&E functions are not given sufficient priority and are not wellintegrated into a PVO’s organizational structure. Two PVOs have no M&E staff in the field or atheadquarters. Most PVOs assign M&E field tasks to staff who already have other demandingresponsibilities. In many instances, this selected individual has minimum competency in M&E. Inmore than one case, the person was the country director, someone clearly overburdened with otheradministrative duties. The column entitled “M&E Execution” illustrates the large number and

Bonnard:Sept 30, 1998 6
variety of people who become involved in the M&E process, many of whom come from outside thePVO with limited knowledge of, and commitment to, the PVO and its on-going demands forrelevant and reliable data collection.
2.3.1 Consultants
To fill a technical gap, most PVOs have resorted to contracting local or foreign consultants toconduct some of the M&E tasks in at least one of their project countries. The experience has beenmixed. Several PVOs indicated that on the whole this system works well and they have begun todevelop a pool of consultants familiar with their PVO’s operations who can be called upon as theneed arises. Others report having had bad experiences. While it is true that some consultants takeon jobs for which they are not well-qualified or have insufficient time to adequately complete, mostPVOs do not recognize that even excellent consultants need direction and significant interactionwith field staff who have technical familiarity with M&E and agriculture.
2.3.2 M&E Technical Support
Most PVO field offices don’t have sufficient technical resources to assist them in the designingtheir M&E systems. This is also true for a number of PVOs that have developed manuals but havenot distributed them to all of their field offices. Both Care and CRS indicated that the accessibilityof technical resources and expertise varies widely across project countries, yet both produce theirown fields guides on a number of M&E and project implementation topics. In the case of Care,country and regional offices produce manuals as well. Food For the Hungry International (FHI), onthe other hand, has created, or modified existing, manuals and guides that are available at allcountry offices and at a level most field staff can understand. Most PVOs were aware of theIMPACT publications and had positive impression of assistance provided by Linkages staff. Theguidelines on agricultural productivity measures and sampling were well received and relativelywidely distributed. Some PVOs had made certain that field offices had copies as well. SeveralPVOs noted that IMPACT guidelines are too descriptive and not prescriptive enough, and that theyare written at too high of a technical level, especially where local counterparts play a significantrole in the M&E design and execution. PVOs and the Linkages project ought to considertranslating these guides into other languages: in particular, Portuguese, Spanish, and French.
Despite these shortcomings, PVOs generally felt that performance reporting for Title II fundinghad greatly improved. They had moved from accounting for project inputs and outputs to grapplingwith measuring the effects and impacts of project activities. Currently, CRS is interviewingcandiates to fill a new senior level technical M&E advisor positon and is instigating a completeoverhaul of their approach to agriculture and M&E activities. Contributing to this exercise areJohns Hopkins University, CIAT, and ITAD. ACDI/VOCA wants to increase their local capacitybuilding efforts in this area. Care is allocating substantial resources to improve their M&Esystems. The new monitoring and evaluation specialist located at the Atlanta headquarters hasdeveloped a new integrated “D+M&E” approach to program design, monitoring and evaluation.Seminars are conducted as part of field staff’s regular training sessions at the head office. Care hasalso developed a new software package, MER, which semi-automatically matches projectobjectives with Care’s extensive list of generic indicators and related survey questions. Their aim isto make MER available through the internet providing greater access and to field offices andallowing for broader sharing and exchange of information among all Care offices. Care has alsoestablished links with several US universities, IFPRI and Farmer Field Schools.

Bonnard:Sept 30, 1998 7
2.3.3 Use of M&E Output
A number of PVOs reported that data collected are rarely used other than to produce requisite FFPreports. Data analysis often drags on for more than one year and much of the data is neveranalyzed. Information does not adequately filter into management decision making. Statisticalanalysis is limited to calculations of means and percentages, in some cases measures of dispersionsuch as standard deviations, and in only one or two instances tests of statistical significance. PVOsstruggle to design and execute the statistically representative sampling methods required by FFP,but then fail to take advantage of this rigor and substantial investment.
2.3.4 Summary of M&E Issues and Recommendations
In reviewing the institutional structure and capacity of PVOs as it relates to M&E, a number oftendencies have emerged. While most PVOs can not be characterized as possessing all thesenegative tendencies, all PVOs have experienced several of these difficulties in at least one of theirproject countries. It is interesting to note that while PVOs vary greatly in both financial and humanresource capacity and how they conduct their development programs, e.g., through localcounterparts or through pre-established regional offices, they face remarkably similar problems.These tendencies are as follows:
♦ A lack of a consistent M&E system established throughout the PVO’s program;♦ A lack of M&E dedicated staff in the field and running the M&E process;♦ Many people involved in all stages of the M&E process;♦ High turnover of staff involved in M&E process;♦ No assessment of how to set up an M&E system and conduct a baseline survey in the
specific project area context;♦ A lack of M&E resources available to field staff and at their level of understanding;♦ Ιsolated and field driven M&E activities such that knowledge is not collected and
shared, hence there is no institutional knowledge building;♦ M&E results are not adequately utilized by management.
Finding appropriate solutions to these problems will depend on the specific PVO’s resources,priorities, long-range organizational plans, and method of providing development assistance. At aminimum, all PVOs should have someone with strong M&E technical skills overseeing every phaseof the M&E exercise and working closely with agriculture specialists. The best solution would beto place an M&E-dedicated specialist with appropriate skills in every field office. Whereas thismaybe possible for larger, well-funded PVOs, like World Vision (WV) and Care, it would beimpractical for smaller PVOs such as Africare and FHI. Alternatively, one or more roving M&E-dedicated specialists could be placed in a regional or head office. A significant portion of the M&Eofficer’s time would have to be spent in the field assisting and training local field staff. This doesnot exclude the use of consultants, local private businesses and universities or local counterparts.The important point is that there has to be technically competent, undistracted individualoverseeing the M&E activities of every project. This M&E officer should have sufficient sectoralexperience, and if not, s(he) should work closely with technical staff who do. PVO managers haveto provide clear explanations of their information needs early in the M&E design stage.
From a completely different angle, FFP could initiate the change. FFP could allow PVOs to expandtheir M&E budgets to allow for staffing a appropriately skilled M&E officer or contracting better,

Bonnard:Sept 30, 1998 8
longer-term consulting services. Alternatively, USAID could fund a project that would specialize inproviding technical assistance in M&E. The contract could be granted to a consortium of PVOs, tothe Linkages follow-on project, to a pre-existing organization or firm with strong background inM&E and capacity building, or to a completely new entity.
All M&E plans should be developed at the time the project is being designed. PVOs need toundertake an assessment of issues related to establishing an M&E system and conducting fieldwork, including the use of various M&E survey methods, within the specific geographic andcultural context of proposed target areas. PVOs generally do diagnostic studies or assessmentsprior to writing a project proposal, but overlook this topic. The M&E assessment could be includedin this step.
PVOs head offices need to supply field offices with useful technical resources. All field officesshould have copies of the IMPACT guidelines series, FFP DAP guidelines and other usefultechnical references such as IFPRI-IFAD discussion papers. Following the lead of FHI, thesemanuals could be tailored to meet field staff technical knowledge and capacity. Technical manualsand training guides could be shared among PVOs. An internet link or discussion group could beestablished where PVO staff could post useful information and resources as well as list questionsrelated to M&E.
The best way to get management to use M&E results is to improve the relevance, reliability andtimeliness of reporting. Head offices could establish and disseminate principles for quality, action-oriented reporting for project management purposes. These principles could highlight the differentinformation needs for different levels of management. Institutional development funds couldsupport this activity as well as training in improved analysis, presentation and use of M&E dataand information.
3. Observations on PVO Use of the Logical Framework and Baseline Survey Design
While this review is focused on the baseline survey, it was necessary to plow through projectlogical frameworks in order to determine whether the survey instrument would yield relevant andmeaningful data given the stated objectives and desired performance monitoring. A number ofgeneral observations concerning the PVOs use of USAID’s logical framework are included herebecause they illustrate weaknesses that tend to fester once the PVO moves on to development oftheir M&E system and specific baseline survey methods. Both within and across PVOs, there istremendous variation in the presentation of DAP project objectives, supporting activities, andunderlying assumptions.
3.1 The Logical Framework
Tables 4 and 5 present a somewhat modified logical framework for the PVO Title II agriculturalprojects that were reviewed. Table 4 presents the projects in alphabetical order by PVO, whiletable 5 presents the same information only grouped by country. The term “aim” replaces theproject goal since all DAPs, by definition, have the goal of improving household food securitywhich does not adequately describe what the project does. The aim attempts to summarize the mainagricultural components of the project, giving a clear sense of what the project does. “Intermediateactivities” are the specific agriculture-related actions undertaken in pursuit of the project aim. The

Bonnard:Sept 30, 1998 9
information had to be massaged in order to link objectives with activities (see number coding ontables) because it was not always clear from the documents obtained from PVOs how specificindicators were linked to activities or the overall food security goal. Apparently misplaced orillogical indicators that were clearly documented in PVO logical frameworks were listed unalteredon the tables. The following list contains a number of common problems and difficulties observed.
♦ Using output indicators, e.g. number of women receiving grants or value of grants, asa measure of impact;
♦ Indictors that are not objectively measurable such as households “benefiting” fromirrigation, improvement in “well being,” or reduction in “extreme” poverty;
♦ Listing indicators for which there is no corresponding question on the baselinequestionnaire, e.g., aiming to identify the percentage of households pruning cashewtrees but no question on pruning behavior appeared on the questionnaire;
♦ Selecting an indicator that is too difficult to measure, e.g., change in net farm income;♦ Listing a primary objective for which there is no corresponding indicator, e.g., pruning
cashew trees in one of few improved practices to be introduced but there is noindicator related to the activity, nor cashew in general;
♦ Using wealth indicators1 as a proxy measurement of income;♦ Insufficient utilization of “assumption indicators” such as rainfall or market prices;♦ Defining objectives and indicators in the identical terms;♦ Including numerous impact indicators while FFP requires one per activity;♦ Including too many annual monitoring indicators, e.g., percentage increase in
households selling nearly every possible crop measured individually;♦ Limited identification of underlying assumptions;♦ Tenuous links between program objectives and intermediate activities, or between
intermediate activities and indicators;♦ Insufficient reference to previous field experience and development literature;♦ Inclusion of many questions in the baseline questionnaire for which there was no
corresponding indicator;♦ Inclusion of many questions in the baseline questionnaire that aren’t apparently
relevant to M&E.
3.2 Confusion of Economic and Survey Terms
Some confusion concerning basic economic and survey terms were noted in reviewing the DAPdocuments. Not all PVOs made these mistakes but the mistakes were common enough to warrantnote.
Productivity: Most PVOs equate increases in production or yields with improvements inproductivity. Productivity is a relative term. It is simply output per unit input employed. MostPVOs measure output per unit of land, e.g. yields. The problem arises when PVOs make temporalcomparisons. They still use output per unit of land, but the level of one or more inputs may have 1 Wealth is measure of stock, while income is a measure of flow. Both can be used to develop classes of farmers.However, where the a project objective is to increase income, wealth proxies may not be an appropriate indicator ofchange. Poor households will tend to spend additional income, not accumlate. In this case significant income changeswill not be captured in the wealth proxy indicator. Furthermore, assets and other gauges of wealth can vary widelyacross communities, regions, and even time in the post conflict situations.

Bonnard:Sept 30, 1998 10
also changed. If tremendous amounts of fertilizer were applied to one of the fields for which theymeasured yields, the output per unit of land would tend to increase, at least in the short run, but atwhat resource cost? The yield measure does not account for all factors. Would this still be a gain inproductivity? Probably not. But using this generic indicator, performance would appear to haveimproved.
PVOs propose to increase output through the introduction of improved sustainable agriculturepractices. In many instances, what PVOs are more directly attempting to do is improve soilproductivity. Many of these practices first build the productive capacity of the soil which only laterleads to increased output. The entire process can extend over a number of years and progressesthrough several measurable phases. In these instances, other agronomic indicators that monitorchanges in soil quality would be more appropriate than the standard increased yields or productionindicators. This is especially true given relatively short project life cycles and PVO staff needs forimmediate feedback from the field.
Sustainability: Going one step further, several PVOs stated that increased production or yields fortwo years would indicate sustainability. There are dozens of ways in which sustainability has beendefined but nearly every one of them points out that sustainability has more to do with the lack ofdeterioration of inputs, than with merely expanding output.
Head of Household: A household can be defined as the group living together, eating together,producing together, sharing a budget, etc. As the definition of the household changes so does thedefinition of the logical head of household. Generally, PVOs record the customary head, in mostcases a man. However, it may be the facto head who is important, especially if gender-specificissues are relevant. Many of these DAPs claim to be gender sensitive, but not one made thisdistinction.
Unit of study: All DAPs, by definition deal with household food security. But, a number of theintermediate activities address the community, associations, agricultural decision makers within ahousehold, fields or plots, etc. Indicators and monitoring tools need to correspond to the entity orunit of study which the activity addresses. It should also be noted that there can be more than onedecision maker per household.
Off farm and Non farm: PVOs use these terms interchangeably. Off farm is a more common andstandard term. It refers to that which does not occur on the farm but does comprise part of thehousehold’s income. Usually, this is wage employment. It can be agricultural or non-agricultural innature. Non farm refers to activities not based in agriculture such as basket making or fuelwoodcollection. Some interpretations include non-agricultural off-farm employment. Still others definenon-farm production as all of that which is destined for the market.
Subsistence Verses Commercial: Subsistence crops are grown predominantly for householdconsumption. Commercial or cash crops refer to those crops which are grown primarily for sale.Examples of cash crops include cashews and cotton. “Subsistence” farmers are not strictlysubsistence producers. Sometimes they grow small quantities of cash crops, but they alsofrequently sell what are typically considered subsistence crops, e.g. maize, beans, and cassava.None of these terms are absolute.
Bonnard:Sept 30, 1998 11
4. Baseline Questionnaire Review
This review centers on the formal household baseline questionnaire. Since it is the primary andmost common baseline survey tool, it is a logical starting point. It also provides a clear illustrationof how well project objectives, implementation steps, and performance monitoring are aligned.Although some PVOs and researchers may be more interested in developing new alternative M&Emethods and feel that the formal household survey is passé or requires technical expertise beyondthat of most PVOs, many of the conceptual and operational issues related to standard formalhousehold surveys will continue to plague those attempting to design and implement alternativemethods. One advantage to reviewing formal methods is that there tends to be more and clearerdocumentation involved and, subsequently, greater transparency. Many farmer-friendly methods ofdata collection use pictures and diagrams instead of words or questions. In nearly every casereviewed here, diagrams could substitute for words. But, it should be remembered, that no matterwhat the form of the question, verbal or pictorial, the PVO still has to end up with certain data andinformation in order to properly report on performance.
Because most enumerator instruction guides were not available, it was impossible to discern howterms appearing in the questionnaire were defined or what types of measurement tools wereemployed. Therefore, many of the following comments are delivered as words of caution. Somebaseline questionnaires combine agricultural and health issues. It is recognized that what mightseem irrelevant or inappropriate for agriculture, may have been included to meet some additionalhealth objective. Comments presented below relate strictly to agriculture.
Agriculture baseline questionnaires are generally too long and have many poorly constructed andirrelevant questions. PVOs, like most field researchers, tend to load their questionnaires, preferringto retain dubious questions rather than eliminate them and uncover critical data gaps once thesurvey is completed. Unfortunately, this behavior is like an addiction. The retention of one dubiousquestion seems to lead to accumulation of many others. In the end, the focus of the questionnaire isdiluted, and insufficient time is allotted to gathering information on key baseline characteristicsmost closely related to primary project components. When it comes to questionnaire design, thereisn’t one answer to fit all situations, no indisputable approaches to probing respondents forinformation. PVOs, like all other field researchers, have to decide what level of accuracy and biasthey can tolerate. Whoever designs the baseline needs to ask: will the data be sufficient to measurethe selected performance indicators; and will the data assist in administering the project, planningnew activities, and forming lessons learned? The information acquired through the baselineexercise is as good as the baseline tool.
4.1 The Respondent
From reading the available documents, it was not clear whether enumerators were instructed tospeak with different respondents when filling in different parts of the questionnaire. Judging fromthe description contained in the M&E plans, enumerators attempted to interview just onerespondent according to the following order of preference: the head of household, then the headwife, some other adult, etc. Yet, it is absolutely critical that they interview the household membermost familiar with an activity, e.g., selling agricultural products, preparing meals, selecting seed,etc. Generally, women can correctly and swiftly answer demographic and food consumptionquestions. Men, including the head of the household, can rarely provide accurate information onthese topics. With regard to other typical components of household surveys, the appropriate
Bonnard:Sept 30, 1998 12
respondent will depend on the cultural context. Women tend to engage sales, particularly smallervolume sales of fruit, vegetables, stored grain, and processed agricultural products. Almostuniversally, they take full responsibility for all home garden tasks. Different household membersrarely know how much time other household members spend performing agricultural tasks or whatother members earn from off-farm employment.
4.2 Demographics
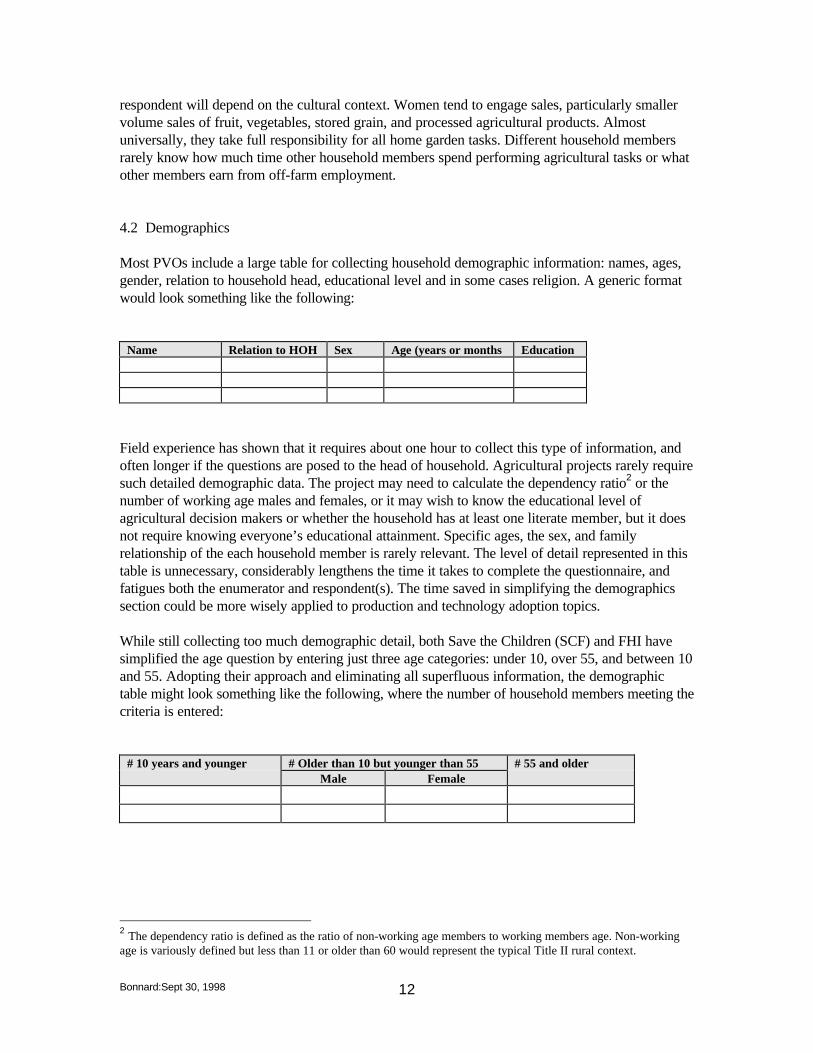
Most PVOs include a large table for collecting household demographic information: names, ages,gender, relation to household head, educational level and in some cases religion. A generic formatwould look something like the following:
Name Relation to HOH Sex Age (years or months Education
Field experience has shown that it requires about one hour to collect this type of information, andoften longer if the questions are posed to the head of household. Agricultural projects rarely requiresuch detailed demographic data. The project may need to calculate the dependency ratio2 or thenumber of working age males and females, or it may wish to know the educational level ofagricultural decision makers or whether the household has at least one literate member, but it doesnot require knowing everyone’s educational attainment. Specific ages, the sex, and familyrelationship of the each household member is rarely relevant. The level of detail represented in thistable is unnecessary, considerably lengthens the time it takes to complete the questionnaire, andfatigues both the enumerator and respondent(s). The time saved in simplifying the demographicssection could be more wisely applied to production and technology adoption topics.
While still collecting too much demographic detail, both Save the Children (SCF) and FHI havesimplified the age question by entering just three age categories: under 10, over 55, and between 10and 55. Adopting their approach and eliminating all superfluous information, the demographictable might look something like the following, where the number of household members meeting thecriteria is entered:
# 10 years and younger # Older than 10 but younger than 55 # 55 and olderMale Female
2 The dependency ratio is defined as the ratio of non-working age members to working members age. Non-workingage is variously defined but less than 11 or older than 60 would represent the typical Title II rural context.

Bonnard:Sept 30, 1998 13
4.2.1 Migration
This type of format does not account for household members who spend most of their time in otherlocations, e.g., adult males who migrate to earn income or young adults in school. In the context ofSouthern Mozambique where many men migrate to South African mines, the demographic datawould poorly represent the actual labor force and household size. Adding an additional column tocheck whether the individual is present for a pre-specified minimum period of time would accountfor this. Without doing so, the data is meaningless. While WV’s Mozambique questionnaire doesask if each individual migrated over the last year, it does not ask about the duration of the absence.WV could use the same format combined with a meaningful minimum term of absence. Settingminimums or maximums is easier and more accurate than attempting to extract specificinformation from respondents.
4.2.2 Earnings
Several PVOs chose diversification of income sources as one of their performance indicators. Inthese cases, the demographics table is frequently used to collect information about individualhousehold member’s other income earning activities, e.g., off-farm and self employment. As withthe above migration question, PVOs rarely ask for the duration of this employment or the extent towhich it contributes to overall household income. A “yes/no” answer or a code representing aspecific activity gives no indication of the importance of that activity: someone performing one dayworth of work as a hired laborer on a local commercial farm would receive equal recognition assomeone working several months in South African mines or all year as a teacher. There should be acolumn for entering the range of time an individual is engaged in the activity. If the type ofemployment is recorded, the options should be limited to a small set of meaningful categories.Although the format could be improved, ACDI/VOCA’s Cape Verde project attempted to collectinformation on categories of income generating activities, accounting for time spent and amount ofincome earned.
It should be noted, that respondents, whether male or female, tend to underestimate women’scontribution and inflate males contribution. In fact, many respondents will simply overlook whatwomen do. Enumerators have to be trained to probe for this information in order to reduce theresultant non-sampling error and bias of such tendencies.
Finally, a number of PVOs collect information on goods and assets to create a proxy for incomeand monitor changes in income over the life of the project. It should be noted that wealth ismeasure of stock, while income is a measure of flow. Both can be used to develop income classesof farmers. However, where the a project objective is to increase income, wealth proxies may notbe an appropriate indicator of change. Poor households will tend to spend additional income, notaccumlate. In this case significant income changes will not be captured in the wealth proxyindicator. Furthermore, assets and other gauges of wealth can vary widely across communities,regions, and even time in the post conflict situations.
4.3 Agricultural Production and Yields
The literature on how to measure agricultural production is expansive and inconclusive. OneIMPACT document, “Agricultural Productivity Indicators Measurement Guide,” goes into detailconcerning the pros and cons of several common methods. The issue of whether farmer estimates

Bonnard:Sept 30, 1998 14
or direct measurement are more accurate remains unresolved. As a result, many PVOs use bothapproaches, and attempt to arrive at yield and production estimates based on a triangulation ofsurvey methods. A typical set of survey questions on agricultural production and yields looks asfollows:
Crop Area (ha) Production (kg) Yield (kg/ha)MaizeBeans
However, there are several problems with this format. Data are collected for each crop withoutrecognition of the cropping system. Production and yields of maize intercropped will be muchdifferent from maize monocropped. The survey tool must keep track of what the farmer is actuallyestimating. Even with direct measurement, it is paramount to tie output and yields to the croppingsystem. For the Uganda project, ACDI/VOCA accounted for the principal cropping systems for afew targeted crops by developing a matrix of intercropping options. The table below is amodification of that table. Maize monocropping is entered in the maize by maize boxes. Maize andbean intercropping is entered in the maize by bean boxes with a separate space for maize and beanproduction.
Where it is customary for households to cultivate several non-contiguous plots, it is helpful to drawsimple maps of the plots and ask the respondent to estimate the production from each plotseparately. Such a map is also useful for keeping track of various key inputs, cultural practice andtechnology adoption.
Maize Bean Cassava Soybeanha kgs ha kgs ha kgs ha kgs
Maize m:
Beans m: b:b:
Cassava m: b: c:c: c:
Soybean m b: c: s:s s: s:
Generally, PVO questionnaires indicate that production is measured in kilograms and yields inkilograms per hectare, but farmers often use other units such as sacks, bundles, etc. Farmersshould never be requested to make the unit conversion themselves. The survey design has to includea system of standardization. In some instances, there are just one or two different units of measure.In this case, the PVO could establish average weights, e.g. 50 and 100 kg sack per sack prior toexecuting the fieldwork. Then in the field, enumerators ask farmers how many sacks and what typeof sack. Production measured in kg is calculated once the data has been entered. The same wouldbe true for yields.
Production estimation is further complicated when agricultural produce is harvested over anextended period of time as is cassava or sunflower, or in more than one form, e.g., as immature

Bonnard:Sept 30, 1998 15
grain as hunger coping strategy and as mature grain at regular harvest time. Where cassava is aprimary food crop or the project is attempting to alter cassava cultural practices in particular, itmay be necessary to ask about production for several discrete periods of time representingsegments of the full lengthy harvest season.
4.4 Accounting for Inputs, Factors of Production, and Other Area Specific Information
PVOs tend to collect data about production problems (e.g. pests) and critical inputs or factors ofproduction (e.g, improved seed, fertilizer, labor, animal traction, etc) without linking the data totargeted crops or specific fields. The latter is a more serious concern where the introduction ofimproved natural resource management (NRM) practices is a primary project intervention.
Farmers manage their various farm enterprises differently, e.g. there is a greater tendency to applyfertilizer and irrigate horticultural crops. Some crops tolerate a wide range of climatic conditions,others do not. If project activities center on a specific crop (e.g., maize, sunflower, or cashew),questions concerning pests, disease, inputs, and labor should relate to those farm enterprisesspecifically. Then the data has more meaning and can feed back into project administration and theformation of recommendations to farmers. If the project promotes technologies and practices thatare expected to build the soil quality of hillside farms, questions should reference specific plots andidentify the type of terrain and other relevant agronomic characteristics. Baseline surveys rarelydetermine whether households have multiple plots. One questionnaire asked how many fields ahousehold had and then preceded with a long list of questions about “the” field as though all farmswere comprised of one contiguous unit.
Several PVOs selected net income from agriculture as a performance indicator. It is extremelydifficult to accurately estimate costs of production over an entire year and from multiple farmenterprises. Yet, estimating the cost of production is a prerequisite to calculating net farm income.Calculating the value of equipment is meaningless in contexts characterized by high rates ofinflation and poor record keeping. With a one-time survey, it is impossible to impute the value oflabor, especially family labor, employed in a series of enterprises over an entire season. Farmerscan’t remember. Enumerators won’t be able to easily discern whether the farmer is recalling laborused in all farm activities, in production of primary crop or in the one just harvested. Data onhousehold labor use will not be reliable.
Questions concerning the costs of hired labor are universally too simplistic. There is no distinctionbetween wages paid for different tasks performed, seasons, genders, or ages (i.e., child versesadult). Treating all wages rates the same introduces non-sampling error. Moreover, there is norecord of in-kinds payments such as meals or local liquor. Such modes of payment can be theprominent mode, particularly in Africa.
PVOs should be discouraged from selecting performance indicators that are based on such detailedaccounting of costs. The baseline might include specific and detailed questions on an input, such asfamily labor allocation, if the project is to introduce a technology which is expected to dramaticallyalter that input use. But, in general, if project managers have a need for farm budget information,small tailored studies of representative farm types would be more suitable than large formalhousehold surveys. Vaguely constructed questions concerning production costs and constraints willonly yield confounding results and misrepresent household behavior.

Bonnard:Sept 30, 1998 16
4.5 Adoption of Improved Technology or Practices
Adoption of improved technology or practices is treated separately from other inputs because it isone of the primary intermediate strategies included in most agricultural DAPs. The sustainableagricultural practices specified in nearly all the DAPs reviewed, are practices and technologies thatare adopted at the household as opposed to the community level. The latter fall under naturalresource management and are not included in this review.
The only monitoring and evaluation plan that mentions using visual inspection of farmer fields toverify adoption of improved practices is the SCF’s Mozambique project. They do the same forimproved storage technology. The rest of the PVOs apparently rely on household baselinequestionnaire responses for adoption data. Most formal household questionnaires include atechnology or sustainable agricultural practices section. Typically, there is a check list ofhousehold adoption which relies on farmer reporting and looks like the following:
Practice Adopted (yes/no) Source of InformationCompostContour plantingPlant in linesImproved seed
There are problems associated with depending on respondents for adoption information and askingsuch simplistic questions. First, farmers are not always familiar with the terminology of improvedsustainable agricultural practices. They may not use the term contour, stating that they don’t plantin straight lines. This can create confusion between contour planting and planting in straight lines,both considered sustainable agricultural practices and promoted by a number of DAPs. Second,farmers often want to please or impress their interviewers and will claim to have adopted practiceswhen, in fact, they have not. In some cases, they will not have heard of the practice. Third, somefarmers will be just experimenting with a practice, they haven’t actually accepted it yet. In thiscase, they probably will have established it in a small area, only a portion of a field. They mayhave chosen a less productive area hoping to minimize the risk associated with innovating. Finally,farmers often think that they are using a practice when, in fact, they have only partially adopted orimplemented the practice incorrectly. The above method of recording adoption information fallsprey to all of these situations leaving much room for non-sampling error.
For monitoring purposes, project technical staff can verify farmer practices through personalcontact and field visits. However, making site checks in order to establish the baseline isimpractical. Households generally have more than one field and the fields are often widelydispersed at distances of an hour or more travel by foot.
Project staff should develop a broad local vocabulary specific to the improved practices they intendto introduce. This can be done during the M&E assessment. Staff accumulate suitable localexpressions through informal discussions with farmers, supported by diagrams and field visits.Then, enumerators equipped with the appropriate vocabulary can also use the diagrams as aids inconducting the baseline survey. It is extremely important that field staff receive ample training in

Bonnard:Sept 30, 1998 17
the use of new terminology as well as clear explanations of the individual practices. These stepswill eliminate some of the miscommunication.
PVOs need to develop techniques to sort out cases where farmers are misrepresenting theirpractices. Additional conditional questions probing for clarification of how the practice isemployed can be added to the baseline questionnaire. FHI uses the Knowledge and Practices (KP)survey. When a farmer states that s(he) uses a practice, the enumerator asks a series of qualifyingquestions. It is the enumerator who makes the final determination as to whether the farmer is anadopter. This method requires well-trained field staff.
As with production and yield data, the enumerator and respondent should jointly draw a map of thedifferent fields. The respondent then indicates which fields have which practices, and over whatgeneral area (e.g. the entire area, half, a corner, one row, etc). This is particularly helpful todetermine whether the placement of trees constitutes an agroforestry practice or a simple planting.The enumerator can also ask how long the respondent has used the practice. Systematic collectionof data in the form of maps can be later transcribed into simple computer codes.
4.6 Agriculture Marketing
Being largely informal, and in post-conflict situations thin and disarticulated, agriculturalmarketing in the context of most Title II programs is difficult to characterize and measure.Therefore, it is not surprising that there are many problems related to PVO approaches toestablishing a baseline for monitoring and evaluating of agricultural marketing. Some problemsrelate to the design of questions concerning household agricultural product sales. Others relate tobroader market performance issues. This distinction between improving agricultural marketingsystems and increasing the level of household agricultural marketing is not always clearlyarticulated in the justification of DAP project activities, the selection of indicators, and thesubsequent drafting of interview questions.
4.6.1 Marketing Information
Marketing components of DAPs are not homogenous (see tables 4 and 5). In Mozambique, severalPVOs limit their agricultural marketing intermediate activities to the promotion of higherhousehold agricultural outputs and sales. Others engage in establishing and improving marketinginformation systems, rehabilitating roads, forming or reinforcing farmer associations, etc. A formalhousehold baseline questionnaire can not serve as the primary method of collecting information onproduct flows along rural roads, or performance of farmer associations. It may not be the bestmethod of collecting benchmark information on potential household benefits from project marketinterventions.
Households benefit from improved marketing systems in a number of ways. They receive improvedselling prices, and have access to a greater number and variety of buyers as well as improved andless expensive transportation for themselves and their commodities. Households also have betteraccess to cheaper inputs. A rapid rural appraisal (RRA) of the marketing system could be a moreeffective, time saving and less expensive approach to gathering basic market baseline data.Through systematic coverage and interviewing of key informants, field researchers can determineprices and costs at various points along the marketing chain, key constraints confronting differentmarket participants, and other relevant market information. One drawback of RRAs is that they

Bonnard:Sept 30, 1998 18
require the field researchers to have a relatively high level of expertise in rural agriculturalmarketing. This implies greater costs per field researcher but the since RRA are of short duration,the overall costs may be lower as compared to alternative methods.
PVOs can also collect data relevant to these benefits with a formal household questionnaire butwithout having to inquire about specific transactions. Enumerators can collect baseline farmgateprice data in the following manner:
Crop Season Price/Unit Unit Unit Weight
This data can be collected from every household, or just once per village. Crops could be limited toa pre-determined set of common or targeted crops. The season would be recorded by a coderepresenting each relevant season. Relevancy would be determined prior to initiation of thefieldwork. If sales at locations other than the farmgate are common or will be promoted through theproject, another table could be introduced in order to capture baseline values for sales conducted atbuying posts, stores, etc.
Many PVO baseline questionnaires contain question regarding buyers, means of transportation,etc. Generally the respondents are asked to list all types of buyers with whom they trade.Respondents are not asked to indicate who is their primary buyer. Nor do they reference the cropthat is transacted. If the objective of the project is to improve oilseed or cashew marketing,questions should refer to oilseed or cashew. General, poorly specified questions induce non-sampling error, and the data simply confound the analyst’s ability to interpret them, indicatorvalues, and important relationships.
4.6.2 Household Agricultural Product Sales
Collecting reliable data on household agricultural sales is extremely difficult and time consuming.It is important that the enumerator speaks directly to the individual household member whoconducts the transactions. As mentioned above, it is rarely necessary to collect specific householdagricultural sales data in order to monitor marketing, but since some PVOs chose a value ofagricultural sales indicator, issues related to collecting the supporting data are discussed here.
PVOs have many problems collecting data on household agricultural product sales. The mostobvious shortcomings are: asking farmers about their sales as though there was just one aggregatesale per crop, and disregarding important reference information. Households tend to make severallarge sales directly after harvest and then many smaller less regular sales later in the season. To bemeaningful, price data has to reference the time, location, and type of buyer. Customarily, pricesare reported in local currency per kilogram. Where there are standard units of measure such as 50kg sacks, the price per sack can be recorded in the field, and later converted to kilograms. Sales bythe sack are more common closest to harvest. Sales occurring latter in the agricultural season tendto be small and more irregular. Units vary more as well. Although there is great variety amongPVOs, a typical baseline sales table might look something like the following:
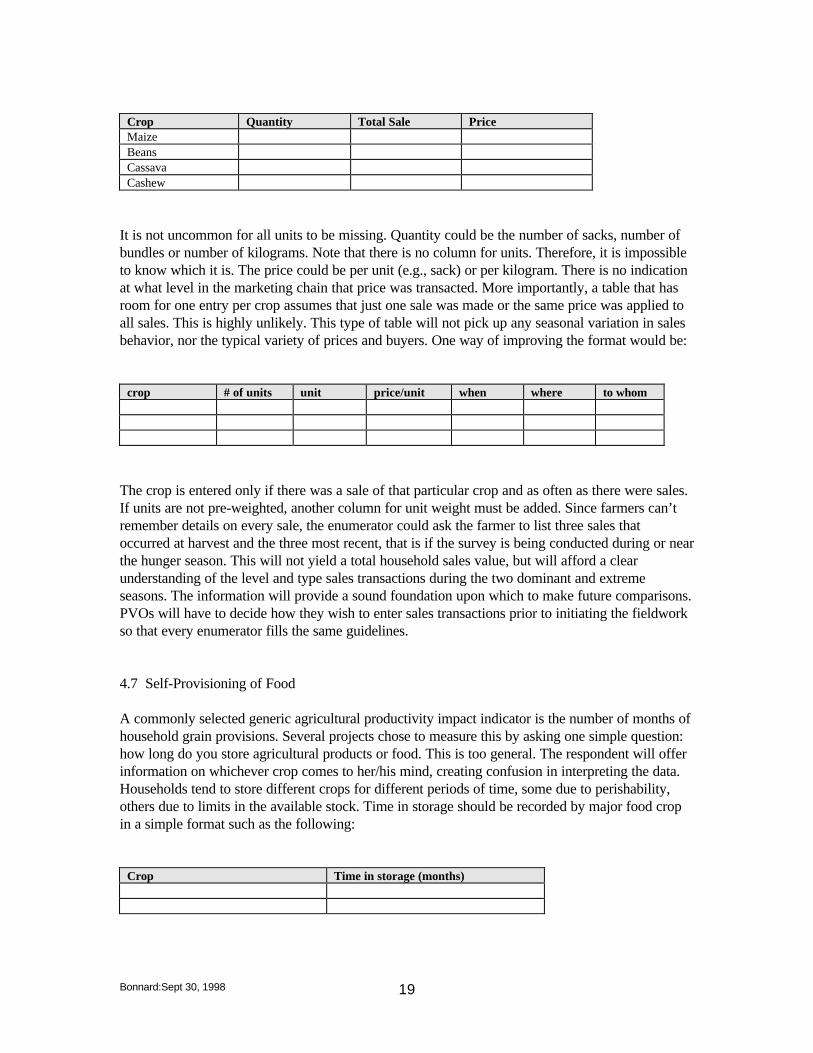
Bonnard:Sept 30, 1998 19
Crop Quantity Total Sale PriceMaizeBeansCassavaCashew
It is not uncommon for all units to be missing. Quantity could be the number of sacks, number ofbundles or number of kilograms. Note that there is no column for units. Therefore, it is impossibleto know which it is. The price could be per unit (e.g., sack) or per kilogram. There is no indicationat what level in the marketing chain that price was transacted. More importantly, a table that hasroom for one entry per crop assumes that just one sale was made or the same price was applied toall sales. This is highly unlikely. This type of table will not pick up any seasonal variation in salesbehavior, nor the typical variety of prices and buyers. One way of improving the format would be:
crop # of units unit price/unit when where to whom
The crop is entered only if there was a sale of that particular crop and as often as there were sales.If units are not pre-weighted, another column for unit weight must be added. Since farmers can’tremember details on every sale, the enumerator could ask the farmer to list three sales thatoccurred at harvest and the three most recent, that is if the survey is being conducted during or nearthe hunger season. This will not yield a total household sales value, but will afford a clearunderstanding of the level and type sales transactions during the two dominant and extremeseasons. The information will provide a sound foundation upon which to make future comparisons.PVOs will have to decide how they wish to enter sales transactions prior to initiating the fieldworkso that every enumerator fills the same guidelines.
4.7 Self-Provisioning of Food
A commonly selected generic agricultural productivity impact indicator is the number of months ofhousehold grain provisions. Several projects chose to measure this by asking one simple question:how long do you store agricultural products or food. This is too general. The respondent will offerinformation on whichever crop comes to her/his mind, creating confusion in interpreting the data.Households tend to store different crops for different periods of time, some due to perishability,others due to limits in the available stock. Time in storage should be recorded by major food cropin a simple format such as the following:
Crop Time in storage (months)

Bonnard:Sept 30, 1998 20
Typical crops to include would be: maize, rice, sorghum, millet, tef, beans and peanuts. The choiceis context specific. The reference period should be the previous year.
Improved storage questions are equally vague and rarely crop specific. Just as with time stored, theuse of improved storage technology should be recorded per crop. A third column for recording thetype of storage facility could be added to the table above. This variable could be coded accordingto the range of expected storage practices.
4.8. Management of Baseline Data
Reading through the baseline questionnaires, a number of problems related to entering andmanaging the data were identified. The following is a list of the more common mistakes that werereadily identified and are easily corrected:
♦ If variables have numeric names, the first digit or two should provide a reference towhich section of the questionnaire the variable is linked, e.g. vi1 and vii28 where viand vii are respectively the production and sales portion of the questionnaire.
♦ Do not permit multiple responses in answer blanks set aside for just one response.♦ There should be a code to distinguish between no reply, no, and not relevant.♦ Codes for “yes” and “no” should be the same throughout the questionnaire. Using “0”
rather than “2” for “no” simplifies programming.♦ Where similar replies are expected, keep the coding the same, e.g., the codes for a 50
kg sack or for maize should be the same throughout the questionnaire.♦ To facilitate data entry and programming, questions should follow a similar format
where possible.♦ Coded responses should be mutually exclusive, e.g, truck and vehicle are not mutually
exclusive; car and bicycle are.♦ Do not ask respondents to use fractions or percentages. They do not understand these
abstractions. Africare used an acceptable method to get around this problem. A pile ofbeans was portioned out by the respondent to indicate proportions of output and inputallocations.
7. A Note About Sampling
It was difficult to retrieve information on PVO sampling designs. Monitoring and evaluation plansincluded in the DAPs did not contain enough detail, and PVO headquarters generally did not havespecific information from the field. As table 2 indicates only FHI’s head office was able to providesampling information for all projects. FHI applies one basic sampling method, and has developed afield level manual and training course that all project offices receive. ACDI/VOCA Uganda fieldstaff and Africare’s oilseed project in Mozambique both furnished documents containing clear andconcise explanations of sampling procedures. All three PVOs used the same sampling designs andcalculations of sample size that are outlined in IMPACT’s “Sampling Guide.”
Despite the limited documentation, PVO head office staff expressed an interest in sampling andrequested that at least a brief note be included in this report. Several of the head office staff felt

Bonnard:Sept 30, 1998 21
that their field offices did not have the technical expertise to design baseline sampling procedures.The IMPACT sampling guide is short, only 45 pages, uncluttered, and relatively easy tounderstand. PVOs are encouraged to acquire and disseminate copies to their field offices. SeveralPVO staff members commented that the guidelines were descriptive but not prescriptive, andwritten at a technical level too high for most of their field staff, particularly local counterparts. Onesolution would be for the PVOs to rewrite and tailor the IMPACT guidelines to fit their specificneeds. PVOs and the Linkages project are encouraged to translate these manuals into othercommonly-spoken languages such as Portuguese, Spanish, and French. Development of materialsin other local languages should be the responsibility of the PVO with the specific need.
Given that good, readily available guides already exist and little specific information was availablefrom the field, this review will not attempt to critique PVO sampling methods nor instruct PVOs onhow to design and conduct sampling. However, the IMPACT sampling guide did not discuss thedefinition of project participants or different types of controls groups. Therefore they will be dealtwith briefly here.
7.1 Defining Project Participants or Beneficiaries
The way in which a PVO defines its’ project participants or beneficiaries will influence the samplesize. Some PVOs are restrictive. They focus on a relatively small and highly targeted group. Thebeneficiaries participate in training and other activities and project technical staff continuallyfollow up with them in the field. As a consequence, the PVO knows every individual beneficiary.Other PVOs are more expansive in defining their beneficiaries. They select districts in which theywill work and then assume that eventually every individual in that district will in some way beaffected by the project. As a result, the number of beneficiaries is large and level of involvement inproject activities varies widely among beneficiaries. In the latter situation, change will tend be moregradual and uneven among participants. Consequently, there will be smaller changes in theindicator values. With smaller changes in indicator values, greater numbers are required forrepresentative sampling. The costs of M&E rise. PVOs are encouraged to be more specific andrealistic in defining who will benefit from the project.
7.2 Control Groups
Control groups are useful tools in M&E because, as the name implies, they control for manyconfounding factors that can influence the interpretation of project results. There are essentiallythree types of control groups: internal, external and historical. The use of each has its’ advantagesand disadvantages. PVOs can use one or more types of control groups for monitoring andevaluating a single project. There is no preferred method. The intention here is only to make PVOsaware of different design methods. UNICEF and IFPRI publications noted on the reference list areuseful sources of additional information on the use of control groups.
An internal control group is constructed from within the project areas and it comprised ofhouseholds that could have participated in the project but did not. An advantage with this method isthat exogenous or extraneous factors tend to effect participants and non-participants equally. Inaddition, using internal control groups is logistically simpler and cheaper since all sampledhouseholds are located in the same area. A disadvantage is that it is difficult to establish a goodoperational definition of participant, especially since many agricultural programs are designed to

Bonnard:Sept 30, 1998 22
have wide range effects, e.g.., improving market information systems, or chain reactions, e.g.,farmer-to-farmer extension.
An external control group is comprised of households situated outside the range of projectinfluence but with similar key characteristics as participating households. The disadvantage withexternal control groups is that it may be difficult to find areas with the same characteristics as theparticipant group but outside the area of project influence. In addition, there is no guarantee thatextraneous events such as drought and floods will have equally impact in both areas.
The historical control group is composed of participant households only. The comparison, in thiscase, is made over time: before and after the project. The advantage to historical control groups isthat since the same group is sampled in both instances, the key characteristics are same. Thedisadvantage is that it is difficult to control for extraneous events.
8. Recommendations
Recommendations are organized into three categories: those related to the institutional structure ofmonitoring and evaluation systems, the baseline questionnaire design, and future FAM projects.For detailed explanations or examples, the reader is encouraged to peruse the specific sections ofthe main body of the report.
8.1 Institutional Structure of PVO Monitoring and Evaluation
♦ PVOs should have an M&E officer in the field who is responsible for all M&E relatedactivities at all stages of the process. That individual should have strong appropriate training inM&E and preferably experience in M&E applied to agriculture.
♦ Where PVO operations are small and resources limited, the M&E officer could be situated in aregional office or even the head office provided that a significant portion of her/his time wasspent in the field assisting and training local field staff. If consultants are required, the officershould work closely with the consultants providing clear orientation and continuity.
♦ M&E plans should be developed early on in the project design stage.♦ PVOs should conduct an assessment of issues related to establishing the M&E system and
conducting field work within the specific geographic and cultural context of the proposedtarget areas. This could be incorporated into the initial project assessment phase.
♦ Managers need to provide clear explanations of their information needs early in the M&Edesign stage.
♦ PVOs should develop information sharing within their PVO either through the internet and/orpublication and distribution of manuals and guidelines. This would include guides to M&Edesign and implementation as well as templates for quality action-oriented reporting. PVOsshould make certain that IMPACT guides are available in all field offices.
♦ PVOs should develop information sharing mechanism among themselves. Through the internet,PVOs could air questions and concerns and share experiences.
♦ FFP could permit PVOs to include additional M&E staffing costs in their DAPs or FFP couldfund an alternative form of M&E technical assistance.
♦ Where possible, PVOs should make links with ministries, national and international researchstations, universities and other sources of technical assistance.

Bonnard:Sept 30, 1998 23
8.2 Formal Baseline Questionnaire Design
♦ PVOs should keep the monitoring and evaluation process simple. This includes limiting thenumber of indicators to monitor and streamlining the amount of data required to measure theselected indicators. Additional complementary studies establishing causation between factorsand results can be conducted separately.
♦ PVOs should avoid selecting indicators that require extensive and rigorous data collectionbeyond that which is reasonably possible with a one-time formal survey or with the availableresources and technical expertise.
♦ Every question on the baseline questionnaire should have a clear purpose and expected use forthe resultant data.
♦ Data needs related to project management and program development but not performancereporting should be acquired through other smaller tailored surveys and not through thebaseline survey.
♦ In general, PVOs need to apply much more attention to formulating baseline questions.♦ PVOs should use the formats described above to guide baseline questionnaire design.
8.3 Further Studies
♦ A number of reputable institutes have been developing alternative approaches to M&E. FAMcould conduct a review of approaches proposed by UNICEF, ISNAR, ITAD and a number ofother organizations and evaluate the varies approaches in terms of their suitability for memberPVOs.
♦ FAM could undertake a review of alternatives methods to assess and measure key agriculturaltopics such as technology adoption, soil conservation, market access, etc. This would includeparticipatory and non-participatory as well as informal and formal methods.
♦ Conduct an analysis of M&E costs. The analysis could be broken down into several strategicsubcomponents, e.g., implementing the baseline, repetitive monitoring tasks, comparingdifferent methods for collecting data. Cost studies are highly dependent on PVO cooperation.To reduce the administrative burden of such a studies, particular PVO projects could beselected as case studies.
♦ Develop a series of performance measures and compare PVO operations based on thesemeasures. Such a study would require significant disclosure and cooperation on the part ofPVOs.
♦ Develop a series of technical guides for use by member PVO field staff.

Bonnard:Sept 30, 1998 24
Table 1: Information Available For the Review of USAID Title II PVOAgriculture Monitoring and Evaluation Methods:
PVO Country/Project DAP Obj Indicators Sampling Questionnaire Complete1 FieldContact
CRS Kenya**Guatemala, SC*** xEthiopia x x xGambia x xIndia x x n
Africare Chad/Ouaddai FS x x x x xMozambique, oilseed x x x x x xEritrea, irrigated ag x x x x xUganda
ACDI/VOCA Cabo Verde x x x x xUganda x x x x x x
World Vision Mozambique x x x x xEthiopia x x x x
Food For the Hungry Mozambique x x x x x xKenya*** x x x NAEthiopia x x x x x xBolivia x x x n x
CARE Ethiopia x x x x xKenyaHonduras x x x xMozambique x x x x xPeruBangladesh** m m mGuatemala*
Technoserve Peru, Cochinilla, Tuna x x x xGhana x xKenya***
Save the Children Ethiopia x xMozambique x x x x
ADRA Ghana x x nKenyaMadagascar***Mozambique x x x xHaiti*** x xBoliviaPeruGuatemala*
Multiple PVO**** Ethiopia x x x1 indicates that all prerequisite documents are available. All of these projects were reviewed, with the acceptation of Care Honduras and Technoserve Ghana.x in consultant’s possession.m baseline might have been completed prior to FY 97, questionnaire and other DAP material may be at Linkages.n DAPs exist or a baseline was completed but Linkages does not have a copy of the documents.* listed as FY 97 results activity but no mention on list of Title II project (as of 2/25/98) .** listed on FY 97 results activity as an agriculture project but documents at Linkages suggests only health components.*** DAP available at Linkages suggests that the project is too new.**** Multiple PVO includes CRS, CARE, FHI, Save, and WV. USAID/Ethiopia requested that all Title II PVOs implement a “Special Objective Food Security andNutrition Baseline Survey.” Because PVOs were at different stages in the project cycle when the survey was implemented, it did not actually constitute a “baseline.”Still the questionnaire was reviewed. Each PVO had their own set of objectives and indicators in place. See specific Ethiopia projects for details.NA either baseline not yet implemented or PVO stated materials are not available.

Bonnard:Sept 30, 1998 25
Table 2. USAID/FFP Generic Indicators forAgricultural Productivity and Natural Resource Management
Category Type of Indicator IndicatorAgricultural Productivity Impact annual yield of targeted crops
yield gaps (actual vs potential)value of agricultural production per vulnerable householdmonths of household grain provisionspercent of crops lost to pests or environment
Annual Monitoring annual yield of targeted cropsnumber of hectares in which improved practices are adoptednumber of storage facilities built and used
Natural Resource Management Impact imputed soil erosionimputed soil fertilityyields or yield variability
Annual Monitoring number of hectares in which NRM practices usedseedling/sapling survival rateyields or yield variability

Bonnard:Sept 30, 1998 26
Table 3. Structure of Monitoring and Evaluation of PVOs With USAID Title II-Funded Agriculture Projects
PVO Head OfficeM&E
Field OfficeM&E
M&E Execution Technical Support Use of sigtesting
Impression of USAID and DAPprocess
ACDI/VOCA no yes: M&Eofficer hasother tasks aswell
Field staff assisted by head office FFPstaff and consultant for design. Fieldstaff, local gov inst, local universityand local private firms for training.Field staff and local inst for execution.
IMPACT guidelines.Limited use of FAOmaterials or otherreferences for sampling.
no No indicators for micro-enterprise andcredit programs
ADRA yes noAfricare no no Country rep, proj leader, head office
staff, board member, and consultantsfor design. Field staff, consultants andlocal inst for training and execution.
IMPACT guidelinesand staff. Assistancefrom MSF-CIS. WHOmaterials for sampling
no Mission known to add burden to M&Eactivity. Generic indicators not alwaysappropriate
CARE yes varies: M&Eofficer canhave othertasks as well
Field staff and consultants for designand training. Field staff and local instfor execution. New CARE software forM&E (MER).
CARE manuals limited andin only a fewcases
Can interfere with the HHLS projectidentification and design process.
CRS* no varied:countrydirectordecides
Field staff, local university,consultants, and local inst for design,training and execution.
Limited assistance inagriculture fromIMPACT, more fromLinkages. ComposingCRS manuals.
no Need greater appreciation of PVOresources, capacity, and objectives.Some difficulties working w/missions.Some interference related to USAID’sown reporting needs. Generic indicatorsnot always appropriate. Confusion inthe field concerning DAP requirements.
FHI yes varies Local and field office for design, fieldoffice and consultants for training,field staff for execution.
FHI manuals, IMPACTguidelines and FAOpublications
some use Missions need to be more flexible,request that data be collected toofrequently. Some interference related toUSAID’s own reporting needs.
Save yes, but notfor ag
varies Field and head office staff and Localuniversity consultants for design,training and execution
IMPACT manualsComposing Savemanuals
no Mission known to add burden to M&E
Technoserve no no Mostly field staff but some assistancefrom consultants for design. Field stafffor training and execution.
IMPACT guidelines.Used CARE’s baseline
no Generic indicators not alwaysappropriate esp wrt marketing andcredit.
World Vision yes yes Field staff and consultants for design,training and execution. Field staff forcrop cutting.
no Mission known to add burden to M&Eactivity. Sometimes difficult to matchUSAID and other funding sources M&Eneeds, some interference related toUSAID’s own reporting needs.
*CRS is currently redesigning a complete overhaul of their approach to agriculture and M&E activities.NOTE: Staff at Save the Children and ADRA were not available for a meeting. Any information listed here was extracted from documents.

Bonnard:Sept 30, 1998 27
Table 4: Inventory of Monitoring and Evaluation Methods Used by PVOs for Title II Agriculture* Projects, By PVO
PVO Country Aim With Respectto Agriculture**
Intermediate Activities Impact and Intermediate Indicators Method Comment
ACDI/VOCA Cape Verde Sustainedimprovement in hhincome andagriculturalproductivity throughsoil and waterconservation (SWC),introduction ofimproved agpractices, andpromotion of micro-enterprise.
1) imp access to food, 2)imp NRM and agproductivity in marginalareas; 3) imp creditfacilities.
1) % inc targeted hh’s income, inc # meals consper day, inc dietary diversity scores of targetedhh, % inc hh income from irrig land, % inc netreturns to land and water, % inc hh income ofloan recip, % inc per cap food expenditure ofloan recip; 2) m3 top soil, ha reclaimed for cult,% inc maize and bean yields, % dec soilerosion, % rural works constructed by assoc, inc# assoc completing SWC contracts, % assocprofitable; 3) % inc loan recip, % loan recovery.
Mixed: formal hh andloan recip surveys, cropbudgets, loan analysisdocuments, andprogram records.
Targeted refers tovulnerable andfemale headedhouseholds.
ACDI/VOCA Uganda Increase hh foodsecurity throughincreased productionof target food cropsand increased ruralincome from agmarketing includingexports.
1) Capitalization of FoodSec Fund (FSF) to providegrants for target crop prod,2) capitalization Co-opBank (CB) to providecredit for target crop prod,3) training for CB, 4)provide grants for mkt infoand rural roadrehabilitation.
inc target crop prod, inc hh net income, inc realvalue of ag prod, inc hh diet diversity; 2) totalvalue of loans; 3) ave loan processing time,performing loans as % tot loans; 4) inc road use.
Mixed: formal hhsurvey, FSF forms, CBrecords, and trafficcounts.
Also tracks %grant beneficiariesand loandisbursement bygender.
ADRA Mozambique
Maganja deCosta DistrictZambeziaProvince
Increase hh incomederived fromproduction ofnutrient-rich foodcrops and cash crops,mainly cashew.
1) inc mkting of ag prod, 2)inc prod cashew and foodvia intercrop, 3) inc availof food, 4) imp capacity offarmer assoc, 5) incdiversity of crops.
% inc hh w/assets, ave # mon of food stks; 1)inc % hh selling cashew, inc % hh selling crops,2) inc % hh intercrop w/cashew, ave cashewprod; 3) inc % hh storing crops, inc % hh useimp seed; 4) inc % assoc w/”good functioning”status; 5) inc % hh w/fruit, inc % hh w/1+ veg.
Mixed: formal hhsurvey, and participantand farmer groupsurveys.
Collaborates withORAM, a localPVO.
Africare Mozambique
ManicaProvince
Oilseed FoodSecurity Initiative:developsusustainable, small-scale oil seed
1) inc knowledge of, andinterest in, oilseed prod; 2)facilitate oilseed mkting; 3)credit for presses; 4)training in sales and
1) % of target area w/oilseed prod andprocessing, inc % of hh w/oilseed prod, inc %hh w/oilseed processing, # or field demos,estab partners for oil seed enterprise, # seedsold, # presses sold, # parts produced, # of
Mixed: formal hhsurvey, price data fromlocal mkt surveys,quarterly and annualreports.

Bonnard:Sept 30, 1998 28
PVO Country Aim With Respectto Agriculture**
Intermediate Activities Impact and Intermediate Indicators Method Comment
(sunflower andsesame) productionan processingindustry.
maintenance of presses. entities that multi and dist planting material.
CARE Ethiopia
E. HarargheW. HarargheE. ShoaAddis Ababa
Food and LivelihoodProgram: increaseproduction of, andaccess to, basic foodcrops.
1) inc food prod via dev ofirrig and flood control,seed mult, and intro of impag pract; 2) inc income viainc ag prod.
% inc hh assets, % inc diversity of incomesources, % inc primary edu attend; 1+2) % incstaple food prod, % inc value of tree crop prod,% inc hh w/short-cycle var, % inc hh w/imp agpract, % inc hh w/NRM pract; 2) % inc value ofhh assets, % inc diversity of hh income sources.
Mixed: formal hh andcommunity surveys,3x/yr assessments ofpotential ag prod, casestudies on seed supply,focus groups,community interviews,and livelihood securityassessments.
Used cropassessments forprod monitoringbut no explanationof how measured.Farmer estimateon formal baseline.Value of tree cropby ag extensionteam.
CARE Mozambique
Nampula andZambeziaProvinces
VIDA: Oil seed(sunflower)production andprocessing (OPEN).Introduce sus agpracts, provideextension, andimprove ag mkting(SAC). Developmentof sustainable oilseedenterprises (SOEC).
Sus Ag Comp (SAC):1) inc prod of crops, 2) incprod’vity w/imp seed, IPM,and imp sus ag pract 3) incincome from crop sales.
1+2) inc prod of selected crops, inc % hh w/impseed pract, inc % hh w/2+ imp soil fert practs(for 2 yrs+), inc % hh grow 1+ new crop or var(for 2 yrs+), % dec harvest loss in % hh, inctime crop stored, inc # of seed producers; 3) inchh sell 1+ new crop, inc % hh use mkt info, %inc value of sales, inc # of self-managed farmermkt groups, inc access to 1+ mkt outlet, decgeographic difference in oil price, dec # hhw/out oil cons.
Mixed: formal hhsurvey, MSU pricesurvey, PRA, casestudies, on-station trialsw/INIA, on-farm trials,and weekly extensionreports.
Each indicator hastarget for %women. Hasindicators forproject operations.Say will monitoryields but nomethod given.
Catholic ReliefServices
NA
Food for the Hungry Ethiopia
South Gondarand WolloZones
Sus improvement inhh food security thatincludes NRM (inclpasture) and “cropprod’ivity anddiversification”(CPD).
CPD: 1) train farmers inseed select, sus ag pract,fert app; 2) ext thru farmerdemo plots; 3) input supplythru co-ops; 4) imp small-scale irrig.
inc yields and prod of major crops, 1+2) inc %hh w/imp fert pract, inc % hh w/imp ag pract,inc % hh growing veg or tubers, inc % hhw/imp var.
Formal hh survey. For seedcomponent workedw/MOA. Soil conand livestkseparate from agprod’ivity. (seeMoz for yieldcalc).
Food for the Hungry Mozambique
SofalaProvince
Ag Productivity,Mkting, andEnterprise Program:Increase availability
1) inc hh income from agsales, 2) inc total prod ofmaize and sorghum; 3) incself-provisioning of grain;
% inc in tot hh income; 1) inc % hh selling agprod, inc hh income from ag sales, 2) % inctotal prod maize and sorghum, 3) inc 4+ monthshh able to subsist from own prod, 4) inc maize
Mixed: formal hh andKP surveys, and annualreporting by FHI/Mozresearch and extension
Has a set ofgeneric surveymethods, includingsampling

Bonnard:Sept 30, 1998 29
PVO Country Aim With Respectto Agriculture**
Intermediate Activities Impact and Intermediate Indicators Method Comment
of food via adoptionof sustainable agpract and improvedstorage. Initiatefarmer associationsand training, adaptiveresearch, and farmer-to farmer techtransfer. Improveinput supply andmarketinginformation systems.
4) inc maize and sorghumprod’vity, 5) inc avail of aginputs, 6) imp knowledgeof sus ag pract, 7) inc assocmember adoption of pract,8) inc ag infrastructure, 9)Inc # assoc and members.
and sorghum yields, dec % maize and sorghumstorage loss; 5) # agents selling ag inputs, 6) %hh adopted imp practices, % using imp storage,# assisted by FHI extensionist, # leader farmerstrained, # extensionists participated in training,# org received FHI research results, 7) inc %assoc members adopt sus ag pract, 8) inc #demo plots, on-farm research, trails at researchstation, community gardens; inc # practdeveloped and extended, 9) inc # of assoc, inc #of members.
staff and assocdevelopment teams.
procedure and“template”baseline and otherquestionnaires.Crop cuttings usedto measure yields,tape measure forarea.
Multiple PVO*** Ethiopia Improve HouseholdFood Security.
1) increase ag prod, 2) hhincome, and 3) imp naturalresource management.
dec % stunting, inc # months hh have sufficientfood stocks, dec # months hh uses coping mech;1) % inc yields 5 major crops, % inc prod of 5major crops, % inc hh w/fert, % inc hh w/impseed, % inc area irrigated, % inc hh w/otherimp ag pract; 2) % inc hh w/inc in livstkownership, % inc hh w/imp physical state ofhouse, % inc hh w/inc diversity food cons or incluxury cons, % inc hh w/inc savings; 3) inccommunal area protected, dec soil erosion usingUSLE.
Save The Children Ethiopia 1) inc ag prod. % women w/inc income, % women w/2nd loan;1) % inc grain prod, % hh w/imp ag inputs, %people cons fruits.
Save The Children Mozambique
NampulaProvince(Nacala-A-Velha andMembaDistricts)
Food Sec, RoadRehabilitation, andCommunity-basedNatural ResourceManagement.
1) inc mkt access via roadrehab, 2) inc sustainablefood and cash crop prod viaextension of imp NRMpract, intro of imp seed andstorage, estab researchtrials, demonstration plots,nurseries, and seed mult.
1) % inc transpt of produce; 2) % hh w/incyields, inc area under prod, inc # crops/hh, decin post-harvest losses, inc income by proxy, #farmers trained w/demo plots, # of farmerstrained in cashew tree grafting, # farmers w/impseed and storage pract, % trained farmers w/2+imp sus ag pract.
Mixed: formal hhsurvey, yield data inconjunction with MOA,and visual inspection ofstorage.
MSF/CIS assists inestablishing andconductingbaseline andPRAs.Collaborates withADRA and JFSagroprocessing andtrading firm.
Technserve Peru
Huanta,Lamas. and
Improving foodavailability andaccess focusing oncoffee and pole bean
1) imp ag prod’vity, 2) impag process and mkting, 3)inc rural employment andhh income, 4) imp access
1) Tech assistance to # of rural enterprises, inctarget product prod, inc target crop yields, inccochineal prod and prod’vity, inc value of drycochineal prod, % inc alpaca profit; 2) inc # hh
Mixed: formal hhsurvey; community,sub-sector, and casestudies; and secondary

Bonnard:Sept 30, 1998 30
PVO Country Aim With Respectto Agriculture**
Intermediate Activities Impact and Intermediate Indicators Method Comment
Puno districts in Lamas, cochinealand prickly pear inHuanta, and Alpacain Pumo.
to credit. w/imp post-harvest pract, inc # hh w/imp NRM,inc rural income, inc % export quality drycochineal prod, inc # hh w/imp cochineal andalpaca pract, inc cochineal and prickly pearprice; 3) % inc hh income, inc # employopportunities, dec % pop in extreme poverty,inc % pop consuming min calories; 4) inc creditavail, inc % small farmer credit recipients, incsmall farmer savings, inc % hh w/land titles.
data.
World Vision Mozambique
Nampula,Zambezia,Sofala, andTete Provinces
Increase ruralhousehold income.
1) intro imp sus ag andNRM pract; 2) imp accessto mkt and mkt info; 3)intro small-scale agprocessing.
Inc % hh w/assets, % inc hh w/non-ag incomesource, inc % hh w/livsk, inc % hh prod fruitand veg, inc % hh prod high-protein food, % inchh cons of edible oils, inc women & child consdiversity; 1) % inc in maize and rice yields, %inc maize and rice yields per hectare, dec yieldgaps, % inc ave # of crops grown and sold, %inc hh prod veg and fruit, % inc hh prodprotein-rich food, % inc hh prod oilseeds, % inchh w/imp ag pract, % inc hh knowledge and useof NRM pract, % inc hh w/non-timber treeproduct; 2) inc volume mkt ag prod, inc valuemkt ag prod, inc diversity of ag prod sold, dectransport costs, % inc ag prod for sale, % inc hhmkting fruit and veg, % inc hh prod bean,potato, onion or garlic, % inc mkt processed agprod; 3) % inc hh w/ag processing, % inc hhmkt processed ag prod.
Mixed: formal hhsurveys, yieldevaluations, landmeasurement surveys,seed surveys, grouprecords, monthly andquarterly reports, andPRA.
World Vision Ethiopia
Tigray,Oromia,Amhara andSNNPR
NA 1) intro of imp ag pract, 2)provision of ag credit, 3)intro of imp NRM pract.
% inc per capita cons, % inc per capita prod, inc% irrig farms 1) inc % hh w/fruit trees, % inchh using livstk management, inc % hh w/vegprod, inc % hh w/correct fert use, inc % hhw/recommended weeding pract, % inc areaunder irrig, inc % hh benefiting from irrig, inc% of hh w/imp sus ag pract, # hh able tomaintain water pipes, inc % hh w/modernbeehives, inc % hh w/forage manipulation; 2)inc % hh w/credit, inc % hh w/chem fert, inc %hh w/imp seed; 3) % hh w/tree plantation, inc% hh w/income from tree plantation, kg seed
Formal hh survey.

Bonnard:Sept 30, 1998 31
PVO Country Aim With Respectto Agriculture**
Intermediate Activities Impact and Intermediate Indicators Method Comment
collected, kg seed dist, % seedling surviving 1styr, ha of land protected and reforested, inc % hhraise own seedlings for mkt.
distinction between what is a component of agricultural, agroprocessing, and natural resource management projects is not consistent across all projects. Therefore, what is considered agriculture for one project may not be includedin agriculture under another project. This inventory was intended to be limited to those components monitored using, in part, the baseline survey tool. Extension activities, for example, are often monitored more extensively throughother means. However, the connection between indicator and survey tool was not always clear from the available documents.** Since all DAPs have the goal of increasing food security, this was not generally noted. The project “aim” was limited to the main agricultural components of the program.*** Multiple PVO includes CRS, CARE, FHI, Save, and WV. USAID/Ethiopia requested that all Title II PVOs implement a “Special Objective Food Security and Nutrition Baseline Survey.” Because PVOs were at differentstages in the project cycle when the survey was implemented, it did not actually constitute a “baseline.” Still the questionnaire was reviewed. Each PVO had had their own set of objectives and indicators in place. See specificEthiopia projects for details.

Bonnard:Sept 30, 1998 32
Table 5: Inventory of Monitoring and Evaluation Methods Used by PVOs for Title II Agriculture* Projects, By Country
PVO Country Aim With Respectto Agriculture**
Intermediate Activities Impact and Intermediate Indicators Method Comment
ACDI/VOCA Cape Verde Sustainedimprovement in hhincome and agproductivity throughsoil and waterconservation (SWC),introduction ofimproved agriculturalpractices, andpromotion of micro-enterprise.
1) imp access to food, 2)imp NRM and agproductivity in marginalareas; 3) imp creditfacilities.
1) % inc targeted hh’s income, inc # meals consper day, inc dietary diversity scores of targetedhh, % inc hh income from irrig land, % inc netreturns to land and water, % inc hh income ofloan recip, % inc per cap food expenditure ofloan recip; 2) m3 top soil, ha reclaimed for cult,% inc maize and bean yields, % dec soilerosion, % rural works constructed by assoc, inc# assoc completing SWC contracts, % assocprofitable; 3) % inc loan recip, % loan recovery.
Mixed: formal hh andloan recip surveys, cropbudgets, loan analysisdocuments, andprogram records.
Targeted refers tovulnerable andfemale headedhouseholds.
CARE Ethiopia
E. HarargheW. HarargheE. ShoaAddis Ababa
Food and LivelihoodProgram: increaseproduction of, andaccess to, basic foodcrops.
1) inc food prod via dev ofirrig and flood control,seed mult, and intro of impag pract; 2) inc income viainc ag prod.
% inc hh assets, % inc diversity of incomesources, % inc primary edu attend; 1+2) % incstaple food prod, % inc value of tree crop prod,% inc hh w/short-cycle var, % inc hh w/imp agpract, % inc hh w/NRM pract; 2) % inc value ofhh assets, % inc diversity of hh income sources.
Mixed: formal hh andcommunity surveys,3x/yr assessments ofpotential ag prod, casestudies on seed supply,focus groups,community interviews,and livelihood securityassessments.
Used cropassessments forprod monitoringbut no explanationof how measured.Farmer estimateon formal baseline.Value of tree cropby ag extensionteam.
Food for the Hungry Ethiopia
South Gondarand WolloZones
Sus improvement inhh food security thatincludes NRM (inclpasture) and “cropprod’ivity anddiversification”(CPD).
CPD: 1) train farmers inseed select, sus ag pract,fert app; 2) ext thru farmerdemo plots; 3) input supplythru co-ops; 4) imp small-scale irrig.
inc yields and prod of major crops, 1+2) inc %hh w/imp fert pract, inc % hh w/imp ag pract,inc % hh growing veg or tubers, inc % hhw/imp var.
Formal hh survey. For seedcomponent workedw/MOA. Soil conand livestkseparate from agprod’ivity. (seeMoz for yieldcalc).
Multiple PVO*** Ethiopia Improve HouseholdFood Security.
1) increase ag prod, 2) hhincome, and 3) imp naturalresource management.
dec % stunting, inc # months hh have sufficientfood stocks, dec # months hh uses coping mech;1) % inc yields 5 major crops, % inc prod of 5major crops, % inc hh w/fert, % inc hh w/imp

Bonnard:Sept 30, 1998 33
PVO Country Aim With Respectto Agriculture**
Intermediate Activities Impact and Intermediate Indicators Method Comment
seed, % inc area irrigated, % inc hh w/otherimp ag pract; 2) % inc hh w/inc in livstkownership, % inc hh w/imp physical state ofhouse, % inc hh w/inc diversity food cons or incluxury cons, % inc hh w/inc savings; 3) inccommunal area protected, dec soil erosion usingUSLE.
Save The Children Ethiopia 1) inc ag prod. % women w/inc income, % women w/2nd loan;1) % inc grain prod, % hh w/imp ag inputs, %people cons fruits.
World Vision Ethiopia
Tigray,Oromia,Amhara andSNNPR
NA 1) intro of imp ag pract, 2)provision of ag credit, 3)intro of imp NRM pract.
% inc per capita cons, % inc per capita prod, inc% irrig farms 1) inc % hh w/fruit trees, % inchh using livstk management, inc % hh w/vegprod, inc % hh w/correct fert use, inc % hhw/recommended weeding pract, % inc areaunder irrig, inc % hh benefiting from irrig, inc% of hh w/imp sus ag pract, # hh able tomaintain water pipes, inc % hh w/modernbeehives, inc % hh w/forage manipulation; 2)inc % hh w/credit, inc % hh w/chem fert, inc %hh w/imp seed; 3) % hh w/tree plantation, inc% hh w/income from tree plantation, kg seedcollected, kg seed dist, % seedling surviving 1styr, ha of land protected and reforested, inc % hhraise own seedlings for mkt.
Formal hh survey.
ADRA Mozambique
Maganja deCosta DistrictZambeziaProvince
Increase hh incomederived fromproduction ofnutrient-rich foodcrops and cash crops,mainly cashew.
1) inc mkting of ag prod, 2)inc prod cashew and foodvia intercrop, 3) inc availof food, 4) imp capacity offarmer assoc, 5) incdiversity of crops.
% inc hh w/assets, ave # mon of food stks; 1)inc % hh selling cashew, inc % hh selling crops,2) inc % hh intercrop w/cashew, ave cashewprod; 3) inc % hh storing crops, inc % hh useimp seed; 4) inc % assoc w/”good functioning”status; 5) inc % hh w/fruit, inc % hh w/1+ veg.
Mixed: formal hhsurvey, and participantand farmer groupsurveys.
Collaborates withORAM, a localPVO.
Africare Mozambique
ManicaProvince
Oilseed FoodSecurity Initiative:develop sustainable,small-scale oil seed(sunflower andsesame) productionan processingindustry.
1) inc knowledge of, andinterest in, oilseed prod; 2)facilitate oilseed mkting; 3)credit for presses; 4)training in sales andmaintenance of presses.
1) % of target area w/oilseed prod andprocessing, inc % of hh w/oilseed prod, inc %hh w/oilseed processing, # or field demos,estab partners for oil seed enterprise, # seedsold, # presses sold, # parts produced, # ofentities that multi and dist planting material.
Mixed: formal hhsurvey, price data fromlocal mkt surveys,quarterly and annualreports.
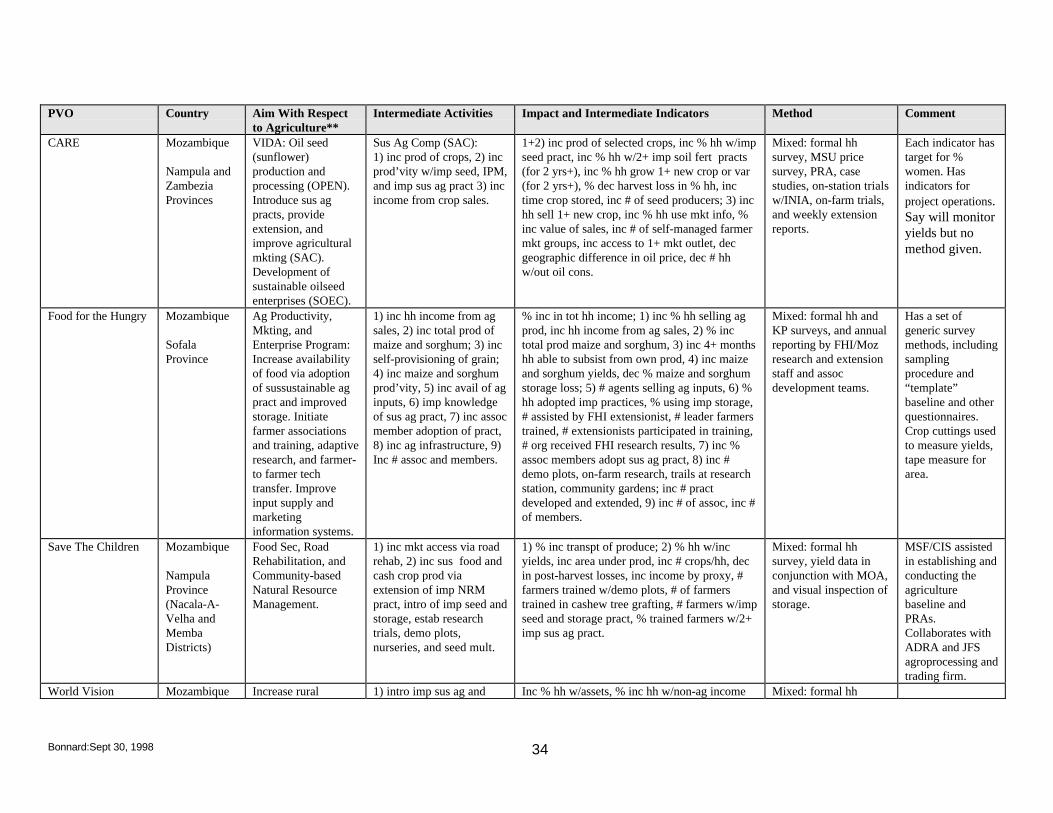
Bonnard:Sept 30, 1998 34
PVO Country Aim With Respectto Agriculture**
Intermediate Activities Impact and Intermediate Indicators Method Comment
CARE Mozambique
Nampula andZambeziaProvinces
VIDA: Oil seed(sunflower)production andprocessing (OPEN).Introduce sus agpracts, provideextension, andimprove agriculturalmkting (SAC).Development ofsustainable oilseedenterprises (SOEC).
Sus Ag Comp (SAC):1) inc prod of crops, 2) incprod’vity w/imp seed, IPM,and imp sus ag pract 3) incincome from crop sales.
1+2) inc prod of selected crops, inc % hh w/impseed pract, inc % hh w/2+ imp soil fert practs(for 2 yrs+), inc % hh grow 1+ new crop or var(for 2 yrs+), % dec harvest loss in % hh, inctime crop stored, inc # of seed producers; 3) inchh sell 1+ new crop, inc % hh use mkt info, %inc value of sales, inc # of self-managed farmermkt groups, inc access to 1+ mkt outlet, decgeographic difference in oil price, dec # hhw/out oil cons.
Mixed: formal hhsurvey, MSU pricesurvey, PRA, casestudies, on-station trialsw/INIA, on-farm trials,and weekly extensionreports.
Each indicator hastarget for %women. Hasindicators forproject operations.Say will monitoryields but nomethod given.
Food for the Hungry Mozambique
SofalaProvince
Ag Productivity,Mkting, andEnterprise Program:Increase availabilityof food via adoptionof sussustainable agpract and improvedstorage. Initiatefarmer associationsand training, adaptiveresearch, and farmer-to farmer techtransfer. Improveinput supply andmarketinginformation systems.
1) inc hh income from agsales, 2) inc total prod ofmaize and sorghum; 3) incself-provisioning of grain;4) inc maize and sorghumprod’vity, 5) inc avail of aginputs, 6) imp knowledgeof sus ag pract, 7) inc assocmember adoption of pract,8) inc ag infrastructure, 9)Inc # assoc and members.
% inc in tot hh income; 1) inc % hh selling agprod, inc hh income from ag sales, 2) % inctotal prod maize and sorghum, 3) inc 4+ monthshh able to subsist from own prod, 4) inc maizeand sorghum yields, dec % maize and sorghumstorage loss; 5) # agents selling ag inputs, 6) %hh adopted imp practices, % using imp storage,# assisted by FHI extensionist, # leader farmerstrained, # extensionists participated in training,# org received FHI research results, 7) inc %assoc members adopt sus ag pract, 8) inc #demo plots, on-farm research, trails at researchstation, community gardens; inc # practdeveloped and extended, 9) inc # of assoc, inc #of members.
Mixed: formal hh andKP surveys, and annualreporting by FHI/Mozresearch and extensionstaff and assocdevelopment teams.
Has a set ofgeneric surveymethods, includingsamplingprocedure and“template”baseline and otherquestionnaires.Crop cuttings usedto measure yields,tape measure forarea.
Save The Children Mozambique
NampulaProvince(Nacala-A-Velha andMembaDistricts)
Food Sec, RoadRehabilitation, andCommunity-basedNatural ResourceManagement.
1) inc mkt access via roadrehab, 2) inc sus food andcash crop prod viaextension of imp NRMpract, intro of imp seed andstorage, estab researchtrials, demo plots,nurseries, and seed mult.
1) % inc transpt of produce; 2) % hh w/incyields, inc area under prod, inc # crops/hh, decin post-harvest losses, inc income by proxy, #farmers trained w/demo plots, # of farmerstrained in cashew tree grafting, # farmers w/impseed and storage pract, % trained farmers w/2+imp sus ag pract.
Mixed: formal hhsurvey, yield data inconjunction with MOA,and visual inspection ofstorage.
MSF/CIS assistedin establishing andconducting theagriculturebaseline andPRAs.Collaborates withADRA and JFSagroprocessing andtrading firm.
World Vision Mozambique Increase rural 1) intro imp sus ag and Inc % hh w/assets, % inc hh w/non-ag income Mixed: formal hh
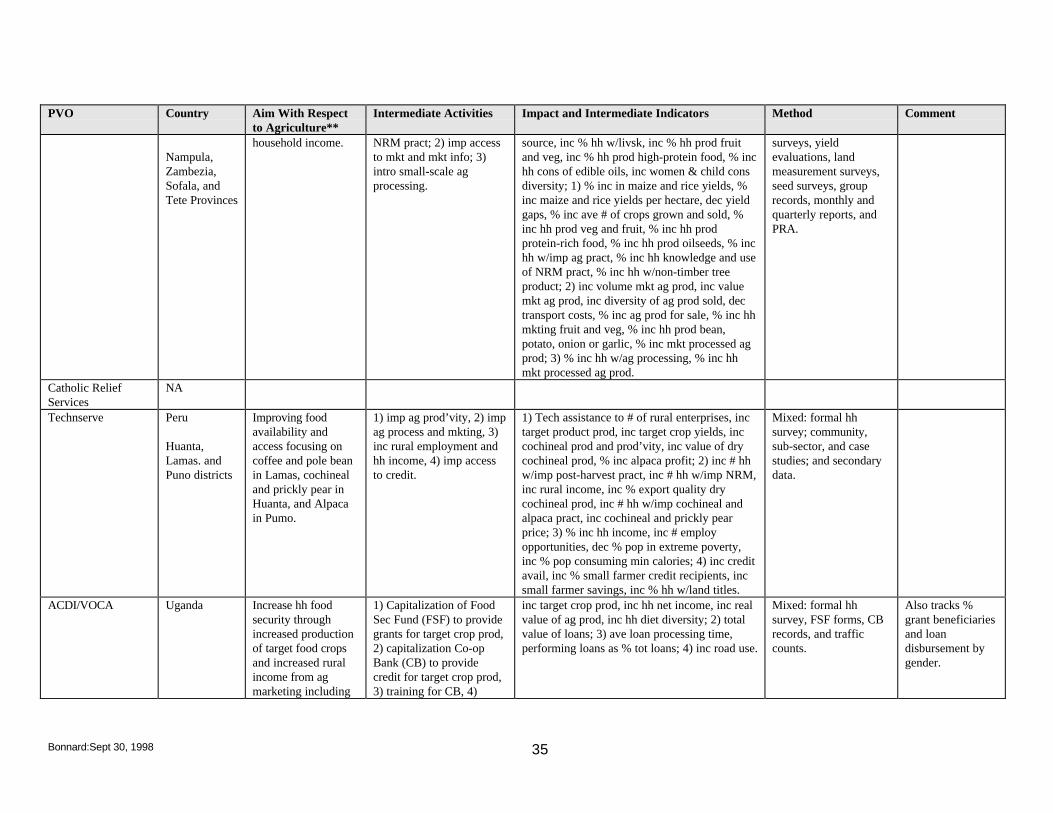
Bonnard:Sept 30, 1998 35
PVO Country Aim With Respectto Agriculture**
Intermediate Activities Impact and Intermediate Indicators Method Comment
Nampula,Zambezia,Sofala, andTete Provinces
household income. NRM pract; 2) imp accessto mkt and mkt info; 3)intro small-scale agprocessing.
source, inc % hh w/livsk, inc % hh prod fruitand veg, inc % hh prod high-protein food, % inchh cons of edible oils, inc women & child consdiversity; 1) % inc in maize and rice yields, %inc maize and rice yields per hectare, dec yieldgaps, % inc ave # of crops grown and sold, %inc hh prod veg and fruit, % inc hh prodprotein-rich food, % inc hh prod oilseeds, % inchh w/imp ag pract, % inc hh knowledge and useof NRM pract, % inc hh w/non-timber treeproduct; 2) inc volume mkt ag prod, inc valuemkt ag prod, inc diversity of ag prod sold, dectransport costs, % inc ag prod for sale, % inc hhmkting fruit and veg, % inc hh prod bean,potato, onion or garlic, % inc mkt processed agprod; 3) % inc hh w/ag processing, % inc hhmkt processed ag prod.
surveys, yieldevaluations, landmeasurement surveys,seed surveys, grouprecords, monthly andquarterly reports, andPRA.
Catholic ReliefServices
NA
Technserve Peru
Huanta,Lamas. andPuno districts
Improving foodavailability andaccess focusing oncoffee and pole beanin Lamas, cochinealand prickly pear inHuanta, and Alpacain Pumo.
1) imp ag prod’vity, 2) impag process and mkting, 3)inc rural employment andhh income, 4) imp accessto credit.
1) Tech assistance to # of rural enterprises, inctarget product prod, inc target crop yields, inccochineal prod and prod’vity, inc value of drycochineal prod, % inc alpaca profit; 2) inc # hhw/imp post-harvest pract, inc # hh w/imp NRM,inc rural income, inc % export quality drycochineal prod, inc # hh w/imp cochineal andalpaca pract, inc cochineal and prickly pearprice; 3) % inc hh income, inc # employopportunities, dec % pop in extreme poverty,inc % pop consuming min calories; 4) inc creditavail, inc % small farmer credit recipients, incsmall farmer savings, inc % hh w/land titles.
Mixed: formal hhsurvey; community,sub-sector, and casestudies; and secondarydata.
ACDI/VOCA Uganda Increase hh foodsecurity throughincreased productionof target food cropsand increased ruralincome from agmarketing including
1) Capitalization of FoodSec Fund (FSF) to providegrants for target crop prod,2) capitalization Co-opBank (CB) to providecredit for target crop prod,3) training for CB, 4)
inc target crop prod, inc hh net income, inc realvalue of ag prod, inc hh diet diversity; 2) totalvalue of loans; 3) ave loan processing time,performing loans as % tot loans; 4) inc road use.
Mixed: formal hhsurvey, FSF forms, CBrecords, and trafficcounts.
Also tracks %grant beneficiariesand loandisbursement bygender.

Bonnard:Sept 30, 1998 36
PVO Country Aim With Respectto Agriculture**
Intermediate Activities Impact and Intermediate Indicators Method Comment
exports. provide grants for mkt infoand rural road rehab.
distinction between what is a component of agricultural, agroprocessing, and natural resource management projects is not consistent across all projects. Therefore, what is considered agriculture for one project may not be includedin agriculture under another project. This inventory was intended to be limited to those components monitored using, in part, the baseline survey tool. Extension activities, for example, are often monitored more extensively throughother means. However, the connection between indicator and survey tool was not always clear from the available documents.** Since all DAPs have the goal of increasing food security, this was not generally noted. The project “aim” was limited to the main agricultural components of the program.*** Multiple PVO includes CRS, CARE, FHI, Save, and WV. USAID/Ethiopia requested that all Title II PVOs implement a “Special Objective Food Security and Nutrition Baseline Survey.” Because PVOs were at differentstages in the project cycle when the survey was implemented, it did not actually constitute a “baseline.” Still the questionnaire was reviewed. Each PVO had had their own set of objectives and indicators in place. See specificEthiopia projects for details.

Bonnard:Sept 30, 1998 37
REFERENCES3
Abbot, J and I. Guijt. (1998). “Changing Views on Change: Participatory Approaches toMonitoring and Evaluation.” London, IIED, Discussion Paper No 2.
Barton, Tom. (1997). “Guidelines to Monitoring and Evaluation: How Are We Doing?” Atlanta,Care, Uganda Office.
Belbase, Krishn P. (1991). “Rural Household Data Collection in Developing Countries: DesigningInstruments and Methods for Collecting General Household Information Data.” Ithaca,Cornell University, Working Papers in Agricultural Economics, No 91-13.
Bonnard, Patricia. (1985). “Increasing Food Production in the Third World: A Review of ResearchMethods and Their Relevance to Female Farmers.” East Lansing, Michigan StateUniversity, Department of Agricultural Economics, MS Thesis.
Bunch, Rolando. (1995). Two Ears of Corn: A Guide to People-Centered AgriculturalImprovement. Oklahoma City, World Neighbors, Inc.
Care. (1998). “The Application of Household Livelihood Security Indicators in Baseline Studies.”Atlanta, Care, Latin America and Caribbean Regional Technical Committee.
_____ . (1997). “Nineteen-Ninety-Seven Asia Monitoring and Evaluation Workshop Series.”Atlanta, Care.
. (1996). “Care-International Food Security Policy and Guidelines.” Atlanta, Care.
______. (19??). Guidelines for Assessing and Enhancing the Impact of Agriculture and NaturalResource Projects. Atlanta, Care, Agriculture and Natural Resource Unit.
Casley, Dennis and K. Kumar. (1990). Project Monitoring and Evaluation in Agriculture.Washington, DC, World Bank.
Casley, Dennis J. and Denis A Lury. (1988). “Data Collection in Developing Countries.” Oxford,Clarendon Press.
_____. (1982). Monitoring and Evaluation of Agriculture and Rural DevelopmentProjects. Washington, DC, World Bank.
Chambers, Robert. (1994). “Participatory Rural Appraisal: Analysis and Experience.” WorldDevelopment, Vol 22(9):1253-1268.
3 Does not include the list of DAPs, PAAs, Results Reports, untitled internal documents, and informal email communications relied uponin order to complete this assignment.

Bonnard:Sept 30, 1998 38
CIMMYT. (1993). The Adoption of Agricultural Technology: A Guide for Survey Design. MexicoCity, CIMMYT.
CRS. (January, 1998). “Community-level Grain Storage Projects (Cereal Banks): Why Do TheyRarely Work and What Are the Alternatives? Baltimore, CRS, Notes from a workshop inDakar, Senegal..
Devereux, Stephen and John Hoddinott, eds. (1993). Fieldwork in Developing Countries. Boulder,Lynn Reinner Press.
Diskin, Patrick. (1997). “Agricultural Productivity Indicators Measurement Guide.” Washington,DC, USAID, Food Nutrition Monitoring (IMPACT) Project.
FAO. (1982). “Estimation of Crop Areas and Yields in Agricultural Statistics.” Rome, FAO.
Feldstein, Hilary Sims and Janice Jiggins, eds. (1994). Tools for the Field: MethodologiesHandbook for Gender Analysis in Agriculture. West Hartford, Kumarian Press.
Ferris-Morris, Margie and Gabrielle Dennis. (1997). “Proceedings of the USAID Workshop onPerformance Measurement for Food Security.” Washington, DC, Management SystemsInternational, PRISM Project.
FFP Development Program Team. (January, 1998). “Final PL 480 Title II Guidelines for FiscalYear 1999 Program Proposals: New Development Activity Concept Papers, NewDevelopment Activity Proposals, Development Activity Proposal Amendments andPreviously Approved Activity Submissions, and Fiscal Year 1997 Annual ResultsReports.” Washington, DC, USAID, BHR, FFP.
Gittenger, Price. (1982). Economic Analysis of Agricultural Projects, 2nd Edition, Baltimore,Johns Hopkins University Press.
Guijt, Irene. (1998). Participatory Monitoring and Impact Assessment of Sustainable AgricultureInitiatives. London, IIED, Discussion Paper #1.
Habicht, JP; CG Victoria; and JP Vaughan. (1998). “Linking Evaluation Needs to Design Choices:A Framework Developed With Reference to Health and Nutrition.” New York, UNICEF.
Harris, Robin F.; Douglas L Karlen; and David J Mulla. (1996). “A Conceptual Framework forAssessment and Management of Soil Quality and Health.” In , Soil Science Society ofAmerica. (1996). Methods for Assessing Soil Quality Madison. Madison, SSSA, SpecialPublication No 49.
Henry, Gary T. (1990). Practical Sampling. London, Sage Publications, Inc.
Hoddinott, John. (1998). “Targeting: Principles and Practice.” Washington, DC, IFPRI, IFPRI-IFAD TAG, Technical Guide #9. DRAFT.

Bonnard:Sept 30, 1998 39
Holtzman, John S. (1986). “Rapid Reconnaissance Guidelines For Agricultural Marketing andFood System Research in Developing Countries.” East Lansing, Michigan StateUniversity, Department of Agricultural Economics, Working Paper No 30.
Kumar, Krishna. (1995). Rapid Appraisal Methods. Washington, DC, World Bank.
Magnani, Robert. (1997). “Sampling Guide.” Washington, DC, USAID, Food NutritionMonitoring (IMPACT) Project.
Mascarenhas, James; Parmesh Shah; Sam Joesph; Ravi Jayakaran; John Devavaram; VidyaRamachandran; Aloysius Fernandez; Robert Chambers; and Jules Pretty; eds. (1991).“Participatory Rural Appraisal: Proceedings of the February 1991 Bangalore PRATrainers Workshop.” London, IIED.
Maxwell, Simon and Tim Frankenberger. (1995). “Household Food Security: Concepts, Indicators,Measurements: A Technical Review.” New York, UNICEF and IFAD.
Morris, Saul S. (1998). “Measuring Nutritional Dimensions of Household Food Security.” Washington, DC, IFPRI, IFPRI- IFAD TAG, Technical Guide #4. DRAFT.
Murphy, Josette. (1985). “Using Evaluations for Planning and Management: An Introduction.”The Hague, ISNAR, Working Paper No. 2.
Murphy, Josette; Dennis J Casley; and John J Curry. (1991). “Farmers’ Estimations as a Source ofProduction Data: Methodological Guidelines for Cereals in Africa.” Washington, DC,World Bank.
Murphy, Josette and Leendert H Sprey. (1991). “Introduction to Farm Surveys.” Wageningen,International Institute for Land Reclamation and Improvement.
Pearce, David W., ed (1992). The MIT Dictionary of Modern Economics, 4th Edition, Cambridge,MIT Press.
Poate, CD and Dennis J Casley. (1985). “Estimating Crop Production in Development Projects,Methods and Their Limitations.” Washington, DC, World Bank.
Ralte, Anne. (1997). “Operationalizing Indicators and Setting Targets.” Harrisonburg, VA,Eastern Mennonite University, Food Aid Management Monitoring and EvaluationWorkshop Proceeding.
Remington, Tom. (1997). “Measuring the Impact of CRS Agriculture Project Activities on CropYield.” Baltimore, Catholic Relief Services.
______. (1996). “Strategic Planning and Performance Monitoring and Evaluation in CRS Title IIAgricultural Programs.” Baltimore, Catholic Relief Services.
Riely, Frank. (1998). “Evaluation Guide For US Title II Food Aid Activities.” Washington, DC,USAID, Food Nutrition Monitoring (IMPACT) Project (DRAFT).
Bonnard:Sept 30, 1998 40
Riely, Frank; Nancy Mock; Bruce Cogill; Laura Beiley; and Eric Kenfick. (1997). “Food SecurityIndicators and Framework for Use in the Monitoring and Evaluation of Food AidPrograms.” Washington, DC, USAID, Food Nutrition Monitoring (IMPACT) Project.
Rozelle, Scott. (1991). “Rural Household Data Collection in Developing Countries: DesigningInstruments for Collecting Farm Production Data.” Ithaca, Cornell University, WorkingPapers in Agricultural Economics, No 91-17.
Roming, Douglas E; M Jason Garlynd; Robin F Harris. (1996). “Farmer-Based Assessment ofSoil Quality: A Soil Health Scorecard.” In , Soil Science Society of America. (1996).Methods for Assessing Soil Quality Madison. Madison, SSSA, Special Publication No 49.
Scarborough, Vanessa; Scott Killough; Debra A Johnson; and John Farrington, eds. (1997).Farmer-Led Extension: Concepts and Practices. London, Overseas Development Institute
Swindale, Anne and Punam Ohri-Vachaspati. (1997). “Household Food Consumption IndicatorGuide.” Washington, DC, USAID, Food Nutrition Monitoring (IMPACT) Project(DRAFT).
Tisdell, C. (1995). “Economic Indicators to Assess the Sustainability of Conservation FarmingProjects: An Evaluation.” Agriculture, Ecosystems and Environment, Vol 57(2-3):117-131.
Van Veldhuizen, Larurens; Ann Waters-Bayer; Ricardo Ramírez; Debra A Johnson; and JohnThompson, eds. (1997). Farmers’ Research in Practice: Lessons from the Field. London,Intermediate Technology Publication.
WFP. (1991). “Monitoring, Reporting and Evaluation: Proposals for Change: Final Report.”London, ITAD.
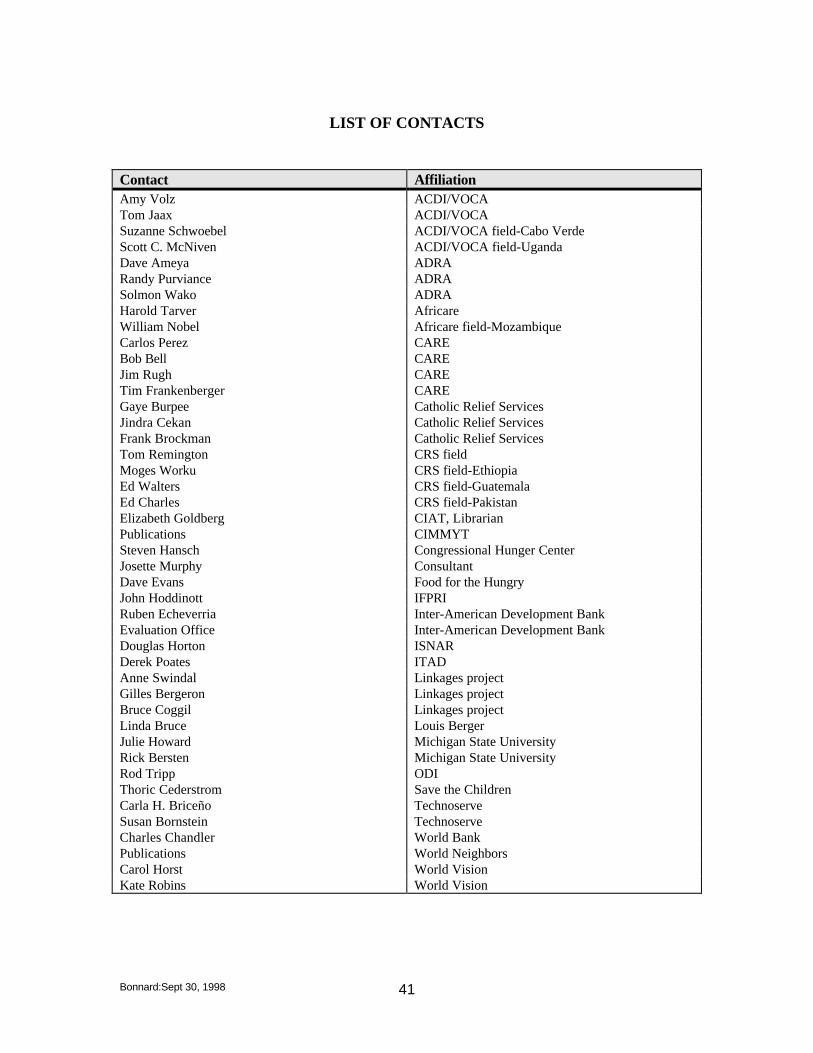
Bonnard:Sept 30, 1998 41
LIST OF CONTACTS
Contact AffiliationAmy Volz ACDI/VOCATom Jaax ACDI/VOCASuzanne Schwoebel ACDI/VOCA field-Cabo VerdeScott C. McNiven ACDI/VOCA field-UgandaDave Ameya ADRARandy Purviance ADRASolmon Wako ADRAHarold Tarver AfricareWilliam Nobel Africare field-MozambiqueCarlos Perez CAREBob Bell CAREJim Rugh CARETim Frankenberger CAREGaye Burpee Catholic Relief ServicesJindra Cekan Catholic Relief ServicesFrank Brockman Catholic Relief ServicesTom Remington CRS fieldMoges Worku CRS field-EthiopiaEd Walters CRS field-GuatemalaEd Charles CRS field-PakistanElizabeth Goldberg CIAT, LibrarianPublications CIMMYTSteven Hansch Congressional Hunger CenterJosette Murphy ConsultantDave Evans Food for the HungryJohn Hoddinott IFPRIRuben Echeverria Inter-American Development BankEvaluation Office Inter-American Development BankDouglas Horton ISNARDerek Poates ITADAnne Swindal Linkages projectGilles Bergeron Linkages projectBruce Coggil Linkages projectLinda Bruce Louis BergerJulie Howard Michigan State UniversityRick Bersten Michigan State UniversityRod Tripp ODIThoric Cederstrom Save the ChildrenCarla H. Briceño TechnoserveSusan Bornstein TechnoserveCharles Chandler World BankPublications World NeighborsCarol Horst World VisionKate Robins World Vision