reverse vsp and crosswell seismic imaging at the savannah .../67531/metadc... · a document...
TRANSCRIPT

- ... -.
Reverse VSP and Crosswell Seismic Imaging at the . Savannah River Site
by R. J. Cumbest Westinghouse Savannah River Company Savannah River Site Aiken, South Carolina 29808 J. 0. Pam Southwest Research Institute TX USA
B. J. zadc Southwest Research Institue TX USA
C. Addington Tornoseis Institute TX USA
V. Price
A document prepared for SOCIETY OF EXPLORATION GEOPHYSICS EXTENDED ABSTRACTS GEOPHYSICS at Denver from 0411 5/96 - 04/15/96.
DOE Contract No. DE-AC09-89SR18035
This paper was prepared in connection with work done under the above contract number with the U. S. Department of Energy. By acceptance of this paper, the publisher andor recipient acknowledges the U. S. Government's right to retain a nonexclusive, royalty-free license in and to any copyright covering this paper, along with the right to reproduce and to authorize others to reproduce all or part of the copyrighted paper.
YSTRIBUTION OF mrs DOCUMEM IS UNLIMITED

DISCLAWR
Portions of this document may be illegible in electronic image products. Images are produced from the best available original document.

DECLAIMER
ms report was prepared as an account of work sponsored by an .agency of-the United States Government. Neither the United States Government nor any agency thereof, nor any of their employees, makes any warranty, express or implied, or assumes any legal liability or. msponsibiity for the accuracy, completeness, or' u se fhess of &y information, I apparatus, product, or pro~ess disclosed,.or represents that itS usc woda not infringe privately owned rights. Reference hcreh to any specific commercial product, process, or service by trade name, , trad&nark, manufacturer, or otherwise does not necessarily constitute or imply its endorsement,. recommendation, or favoring by the United States Government or any agency thereof.. The views and opinions of authors expressed herein do not necessarily state or reflect those of the United States Governnient or any agency thereof.
This report has been reproduced directly from the best available copy. - .
Available to DOE and DOE dontractors from the Office of Sciientific and Tdhrhcal Information, P.O. .Box 62, Oak Ridge, TN 37831; prices available from (615) 576-8401.
Available to the public from the,National Technical-Infomation Service, U.S. Department of Commerce, 5285 Port Royal Road, Springfield, VA 22161.

REVERSE VSP AND CROSSWELL SEISMIC IMAGING AT THE SAVANNAH RIVER SITE
J. 0. Parra B. J. Zook
C. Addington R. J. Cumbest V. Price
February 1996
. . z

ABSTRACT
Analysis of crosswell and three-component seismic data integrated with well logs have
produced information on the distribution of subsurface heterogeneities below the In-Tank
Precipitation facility at the Savannah River Site (SRS). The travel time P-wave tomogram and
reflection imaging delineate lateral and vertical structural details of the formations. In particular, the
high-resolution P-wave tomogram captures a low-velocity zone within the carbonates. This zone is
surrounded by reflection events between depths of 150 and 200 R in the reflection imaging. The
reflections are caused by the acoustic impedance contrast between the low velocity zone of "soupy"
sand mixtures of unconsolidated materials and the more rigid and dense competent surrounded
medium. The time-frequency analysis of fbll waveforms particle velocity identifies guided waves in
form of leaky and normal modes at the depths of about 138 to 150 R. This resulting change in
lithology associated with the presence of guided waves is consistent with a velocity low observed in
the vertical velocity profile determined from the inversion of three-component seismic data. This
low-velocity zone intercepted by the wells H-BOR-34 and H-BOR-50 correlates with the conductive
Griffins Landing Member, which is located above the carbonates. The result of the experiments
demonstrate that the present high-resolution crosswell seismic measurement technique (using
frequencies up to 1500 Hz) meets the resolution requirements to map geological and geotechnical
targets in the vicinity of the In-Tank Precipitation facility at the Savannah River Site.
1

INTRODUCTION
Adequate characterization techniques are needed to meet the ultimate goal of evaluating the
seismic and structural safety of existing and planned facilities at the Savannah River Site (SRS). In
particular, methodologies and technologies are needed to satisfjr the resolution requirements for
specific geologic and geotechnical targets in the vicinity of the In-Tank PrecipitationExtended Sludge
Processing Facility and H-Tank Farm areas of SRS.
The geologic setting at the SRS is in unlithified to poorly lithified upper Coastal Plain
sediments in South Carolina. The carbonate bodies of interest are stratigraphically confined, typically
discrete bodies from 80 to 150 R depth. The hydrologic confining units in this setting are typically
non-fissile clay strata. These units may or may not be faulted. In particular, a technique is needed
to resolve the extent and boundaries of the carbonate bodies in addition to the presence of internal
voids and high porosity zones.
Crosswell seismic techniques hold promise of investigating the sediment properties (e.g.
porosity, permeability, density, etc.) while also depicting its heterogeneous structural features (e.g.
boundaries, faults, internal voids, etc.). High-resolution seismic measurements between two or more
boreholes may be an efficient tool for resolving the geological structures at SRS. Traveltime
tomography inversion application can be used in estimating the compressional wave velocity
distribution between boreholes. Direct arrival time data selected fi-om interwell seismic measurements
represent only a small portion of the seismic events contained in a seismic section. Reflection events
observed in fill waveforms may be appropriate for resolving the layered structure in the target zone
of interest at the SRS. In fact, interwell seismic reflection data acquired with a piezoceramic source
have been analyzed and processed using state-of-the-art mapping techniques to produce high-
2
---- .- -.- I ,. a

resolution of the subsurface geology at the Devine test site, near San Antonio, Texas, as reported by
Lazaratos, et al(l994).
Substantial developments have been made recently in seismic sources, receivers and
processing techniques (Hardage, 1992; Chen et al., 1990; Kennedy et al., 1988; Laurent et al., 1990;
Chen, 1993; Balogh et al., 1988; and Becquey et al., 1992). The geological conditions at the
Savannah River Site (SRS) present unique geotechnical problems for the applicability of high-
resolution interwell seismic techniques (ie., crosswell tomography and reverse verticl seismic
profiling). Because of the potential use of high-resolution seismic techniques for mapping
heterogeneous geological formations, it is anticipated that this technology may be appropriate for the
characterization of the subsurface geology for the evaluation of existing and planned facilities. The
objective of this work is to evaluate the applicability of a 1200-joule arc discharge borehole seismic
source and a piezoceramic source to conduct crosswell experiments and reverse vertical seismic
profiling at the SRS and to select the appropriate technology/methodology to image geological and
geotechnical features beneath SRS facilities in support of engineering studies. The principal
application of these seismic measurements is to investigate the propagation characteristics of seismic
waves in a target zone formed by carbonate bodies, clay beds and loosely consolidated sands at the
SRS. The processing efforts included the inversion of travel-time data to be used to produce
compressional wave velocity, distributions (tomograms) fiom multiple offset seismic measurements
using the arc-discharge source and the piezoceramic source. In addition, reflection imaging fiom
multiple offsets seismic measurements is produced to determine the presence of interfaces or thin beds
within the target zone of interest. Furthermore, reverse VSP velocity distributions are produced and
integrated with the geology and compared with the reflection imaging to evaluate the borehole
seismic technology.
3
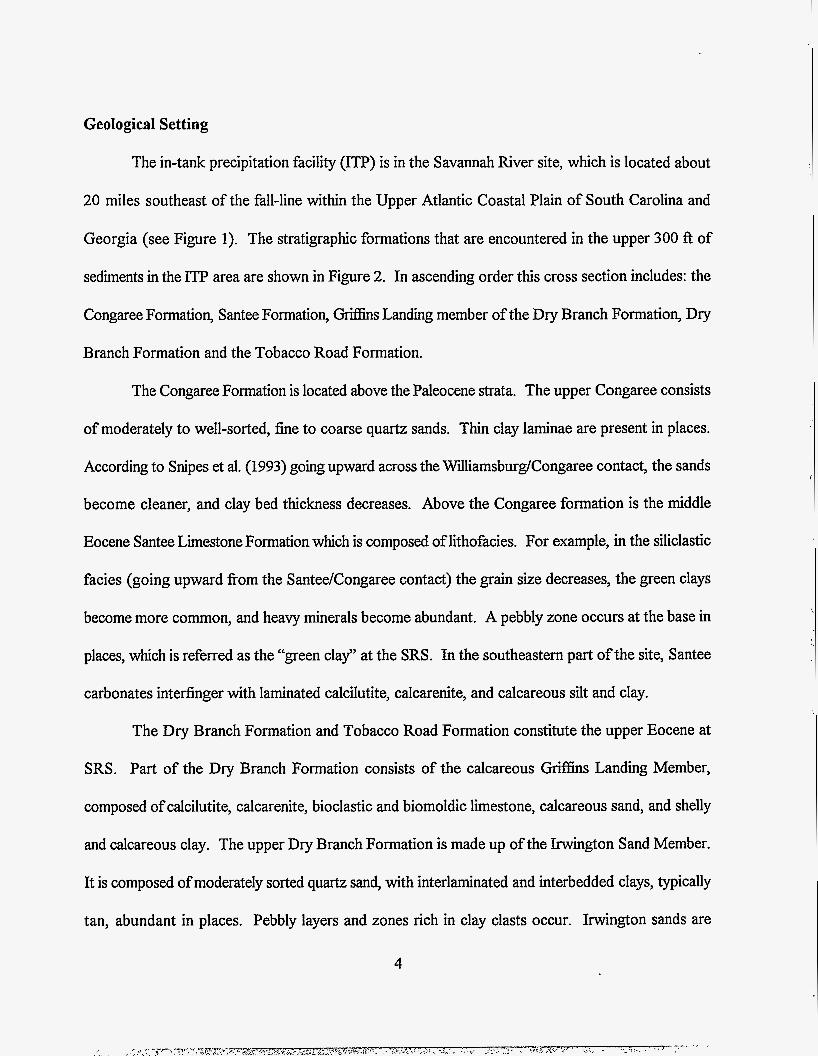
Geological Setting
The in-tank precipitation facility (ITP) is in the Savannah River site, which is located about
20 miles southeast of the fall-line within the Upper Atlantic Coastal Plain of South Carolina and
Georgia (see Figure 1). The stratigraphic formations that are encountered in the upper 300 ft of
sediments in the ITP area are shown in Figure 2. In ascending order this cross section includes: the
Congaree Formation, Santee Formation, GrBIns Landing member of the Dry Branch Formation, Dry
Branch Formation and the Tobacco Road Formation.
The Congaree Formation is located above the Paleocene strata. The upper Congaree consists
of moderately to well-sorted, fine to coarse quartz sands. Thin clay laminae are present in places.
According to Snipes et al. (1993) going upward across the WdiamsburgKongaree contact, the sands
become cleaner, and clay bed thickness decreases. Above the Congaree formation is the middle
Eocene Santee Limestone Formation which is composed of lithofacies. For example, in the siliclastic
facies (going upward from the SanteeKongaree contact) the grain size decreases, the green clays
become more common, and heavy minerals become abundant. A pebbly zone occurs at the base in
places, which is referred as the “green clay” at the SRS. In the southeastern part of the site, Santee
carbonates interfinger with laminated calcilutite, calcarenite, and calcareous silt and clay.
The Dry Branch Formation and Tobacco Road Formation constitute the upper Eocene at
SRS. Part of the Dry Branch Formation consists of the calcareous Griffins Landing Member,
composed of calcilutite, calcarenite, bioclastic and biomoldic limestone, calcareous sand, and shelly
and calcareous clay. The upper Dry Branch Formation is made up of the Irwington Sand Member.
It is composed of moderately sorted quartz sand, with interlaminated and interbedded clays, typically
tan, abundant in places. Pebbly layers and zones rich in clay clasts occur. Irwington sands are
4

generally coarser than those of the underlying Santee siliciclastics, and glauconite and heavy minerals
are less abundant.
The Late Eocene Tobacco Road Formation conformally overlies the Dry Branch Formation.
The base of the unit is marked by a coarse layer that in places can contain flat quartz pebbles. The
formation consists of moderately to poorly sorted quartz sands. The Tobacco Road Formation crops
out over much of the southwestern South Carolina Plain and is widely exposed at the SRS.
The Borehole Layout and the Well Logs
In order to conduct crosswell seismic experiments WSRC drilled five 300 R deep boreholes
which surround the Tank 51 area. The wells penetrate the Tertiary sands and limestones. The
location of these wells is given in Figure 3. The well logs available for this project are from wells H-
BOR-34, H-BOR-50, H-BOR-44, and HTF-B-1.
The well logs recorded in wells H-BOR-34, H-BOR-50, and H-BOR-44 are correlated with
the geologic cross section shown in Figure 2, using the above lithologic descriptions. The resistivity
logs between 250-300 ft. given in Figure 4 show that there is an increase in resistivity going upward
across the CongareN.iamsburg contact. At the same time the gamma ray count (shown in Figure
5) decreases, which corresponds to much cleaner sands. This high resistivity anomaly is shown in the
three wells. In general, the resistivity of wells H-BOR-44 and H-BOR-50 are very similar, which
indicates that the geologic units between those wells are connected. Alternatively, the difference of
resistivity signatures with respect to well H-BOR-34 indicates that the Santee Limestone is not
intercepted by well H-BOR-34.
In addition, the well logs in the three wells show that the SanteeKongaree contact is
associated with a low-resistivity zone, which corresponds to the green clay layer. This thin
conductive zone correlates with a high gamma ray count. The Santee Formation is associated with
5

a large low-resistivity anomaly having higher resistivity than that associated with the green clay layer.
A second low-resistivity zone is observed in the three wells above the Santee Formation which is
associated with the tan clay thin layer which separates the Dry Branch Formation from the Santee
Limestone Formation. In addition, the tan clay layer correlates with a low-velocity anomaly observed
in wells H-BOR-44 and H-BOR-50.
In summary, the low-resistivity signatures associated with the tan clay (above the Santee) and
the green clay (below the Santee) can be observed in the short normal, long normal and guard
resistivity logs recorded in the three wells. In addition the tan clay layer correlates with a low
compressional wave velocity observed in well logs recorded in wells H-BOR-44 and H-BOR-50. The
presence of this low-velocity layer is not evident in the compressional wave velocity log of well H-
BOR-34 (Parra et al., 1995).
The Geological Problem
Underneath the ITP facility there are soft zones associated with the apparent dissolutioning
of calcareous sediments. The purpose of the geophysical measurements is aimed at characterizing
the subsurface below Tank 51 based on the following two main issues: (1) The carbonate is not a
continuous geologic unit in its lateral extent. In this case the objective is to delineate the edge of the
transition zone. Geologists believe the transition zone may be a fairly rapid termination, possibly due
to faulting or dissolutioning. The carbonate exists at about an elevation of 150-200 feet (MSL) and
is about 20-50 feet thick. The limestone has a P-wave velocity of about 10,000 ft/s, and the
surrounding material has a P-wave velocity of 5000 Ws; and (2) soft zones or cavities associated with
the calcareous sediments are present in the formation. The successful application of crosswell seismic
measurements technique will be to demonstrate if the soft zoneskavities in the calcareous sediments
can be detected and characterized
6
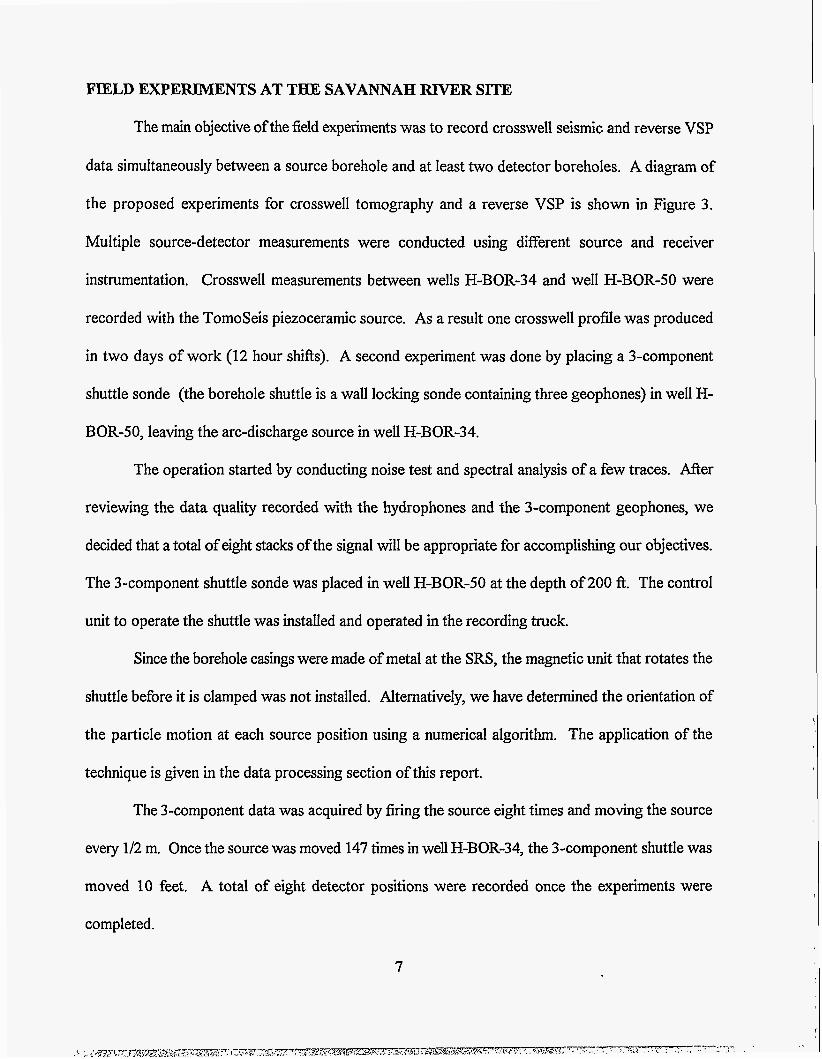
FIELD EXPERIMENTS AT THE SAVANNAH RZVER SITE
The main objective of the field experiments was to record crosswell seismic and reverse VSP
data simultaneously between a source borehole and at least two detector boreholes. A diagram of
the proposed experiments for crosswell tomography and a reverse VSP is shown in Figure 3.
Multiple source-detector measurements were conducted using different source and receiver
instrumentation. Crosswell measurements between wells H-BOR-34 and well H-BOR-50 were
recorded with the TomoSeis piezoceramic source. As a result one crosswell profile was produced
in two days of work (12 hour shifts). A second experiment was done by placing a 3-component
shuttle sonde (the borehole shuttle is a wall locking sonde containing three geophones) in well H-
BOR-50, leaving the arc-discharge source in well H-BOR-34.
The operation started by conducting noise test and spectral analysis of a few traces. M e r
reviewing the data quality recorded with the hydrophones and the 3-component geophones, we
decided that a total of eight stacks of the signal will be appropriate for accomplishing our objectives.
The 3-component shuttle sonde was placed in well H-BOR-50 at the depth of 200 R. The control
unit to operate the shuttle was installed and operated in the recording truck.
Since the borehole casings were made of metal at the SRS, the magnetic unit that rotates the
shuttle before it is clamped was not installed. Alternatively, we have determined the orientation of
the particle motion at each source position using a numerical algorithm. The application of the
technique is given in the data processing section of this report.
The 3-component data was acquired by firing the source eight times and moving the source
every 1/2 m. Once the source was moved 147 times in well H-BOR-34, the 3-component shuttle was
moved 10 feet. A total of eight detector positions were recorded once the experiments were
completed.
7

DATA PROCESSING AND ANALYSIS
Processing of 3- Component Interwell Seismic Data
The 3 -component detector data recorded using the 1200-Joule arc-discharge source was
analyzed for the presence of shear waves. The 3-component data was processed by rotating the
seismograms recorded at the Savannah River Site using several processing methods (see Parra, 1995).
Also F-K filtering was applied to some of the 3-component seismic data to suppress undesirable
events that obstruct the view of more important reflections.
The analysis of the 3-component seismic data suggested that converted and direct shear waves
are strongly attenuated by the presence of fluid in the formation. As a consequence, direct shear
wave energy may be required for the propagation of shear wave in the formations at the SRS. We
believe that a shear source will be more appropriate to use for the generation of direct shear waves.
If shear waves propagate in the fluid-filled porous saturated formation a 3-component detector tool
coupled to the formation should be used to capture the particle motion of the shear wave polarization
in the different directions.
M e r the rotation of 3-component common detector seismograms we have observed trapped
energy (or channel waves) for the detector placed above the Santee Limestone Formation at a depth
of 140 feet. The trapped energy (or channel waves) can be used as an indicator of the connectivity
or continuity of low-velocity zones. As a consequence the waveforms recorded within these low-
velocity zones were analyzed, in particular time-frequency and group velocity contour plots were
analyzed to identifjr the events that may be associated with leaky and normal modes.
Time-Frequency Analysis
The intenvell seismic data contains several different events, which can be seen as different
arrivals in the full waveforms. These various events, such as P-waves, shear waves, and tube waves,
8

generally have very different spectral content as well. One way of analyzing signals is to examine
how the spectral content of the signal varies in time (within the signal). We do this using time-
fiequency analysis, which shows the spectrum as a fbnction of time. This technique is particularly
usefid in detecting guided waves, which exhibit velocity dispersion (velocity is a function of
frequency). Such dispersion is apparent in time-frequency plots.
There are many time-frequency methods. The one we have used in our analysis of the
Savannah River triaxial data is the spectrogram, which is just the squared magnitude of the short-time
Fourier transform. Descriptions of other techniques can be found in the literature (Cohen, 1989;
Hlawatsch and Boudreaux-Bartels, 1992; Zook, 1994).
We are using time-frequency analysis to examine the data for evidence of trapped guided
waves, indicating continuous low-velocity layers. Locating such channels helps us determine the
lithology as well as identifl layers of interest (e.g. porous and fluid flow transport layers or
impermeable layers), (Parra and Xu, 1994).
The data analyzed in this section is the horizontal particle velocity component, which was
recorded for the receiver stationed at a depth of 140 ft, and the source moving at increments of 1.5
ft., in a well H-BOR-34. A portion of this common receiver seismogram is shown in Figure 6. The
time-frequency representation of all the traces were produced to ident% regions in which time-
fiequency signatures are similar. Our primary assumption in this case is that these regions corresponds
to lithology changes. Since space does not allow us to show time-frequency plots of all the traces,
we present below those plots that are representative of three regions of interest.
The first region corresponds to source positions below 150 ft, the second region is for source
positions between 150 R and 138 ft, and the third region is for source positions above 138 R. For
example, when the source is stationed at 160.5 ft, we observed a direct event (P-wave) at about
9

25 ms in the fiequency interval of 100 to 700 Hz (see Figure 7a). We also observed a low frequency
event (200 Hz) arriving at about 100 ms. As the source moves up in the borehole, we selected a
second trace which was recorded at the source position of 145.5 ft (see Figure 7b). The time
frequency representation of this trace shows that the direct event is split in three parts, a low, an
intermediate (about 500 Hz) and a high frequency contour. The high-frequency energy observed
above 700 Hz corresponds to backgiound noise. Alternatively, the energy captured below 200 Hz
( which arrives after 30 ms) corresponds to reflection events and tube waves. In addition, Figure 7b
shows two time-frequency contours of 500 Hz at 75 ms and 100 ms. A similar time-frequency
signature (given in Figure 7c) is produced when the source is moved at 138 R. In this case the
contour (or an event) at 100 ms is much larger than that shown in the previous Figure 7b.
Next, if we focus in those three contours of about 500 Hz (as is shown in Figure 7d)
associated with a source placed at a depth of 129 ft feet, the signatures aniving at 25 ms have
merged into one contour, and the other two signatures arriving at 75 ms and 100 ms have changed
their characteristics. This analysis suggests that the change in signature (i.e., when the signature split
in two major contours), as the source moves upward is associated with a change in lithology that
occurs approximately between the depths of 138 R and 150 ft. This lithology of interest corresponds
to a low-velocity zone that trapped energy as the waves propagate'between the source and detector
boreholes. In fact, the event arriving at 25 ms at the frequency of 500 Hz is a leaky mode and the
event arriving at about 100 ms (having the same frequency of 500 Hz) is a shear wave followed by
a normal mode. This last event shows dispersion in the range of 500-600 Hz, which proves a low-
velocity region has been identified between the depths of 138-150 ft using time-frequency analysis.
In addition, a boundary is detected in the logs at 150 ft, which is consistent with the bottom boundary
of a velocity low in the vertical velocity distribution observed in Figure 8.
10

P-wave Tomography and P-wave Reflection Imaging
The field data was edited and the first arrival travel times were picked. These first arrival
times were input to a travel time inversion algorithm to produce a P-wave velocity tomogram. The
data was initially inverted by constraining the velocity function to one dimension. Additional
iterations were performed allowing progressively more freedom by reducing the horizontal bin size
to a point where artifacts of the inversion begin to dominate the velocity function. The inversion
process was stopped at this point to produce the final P-wave velocity tomogram.
The data prepared for the velocity tomogram was used to generate a reflection image of the
interwell area. A velocity model was generated by interactively raytracing and modifjling a velocity
model until the predicted first arrival times matched the first arrivals of the data within less than 1 ms.
Coherent arrivals which do not represent reflection events were filtered from the data (wavefield
separation), and the resulting reflection data were VSP-CDP mapped. These mapped data have their
reflection energy positioned correctly in the interwell area. The mapped data are then sorted on
reflection incidence angle, and stacked over the optimal angle range.
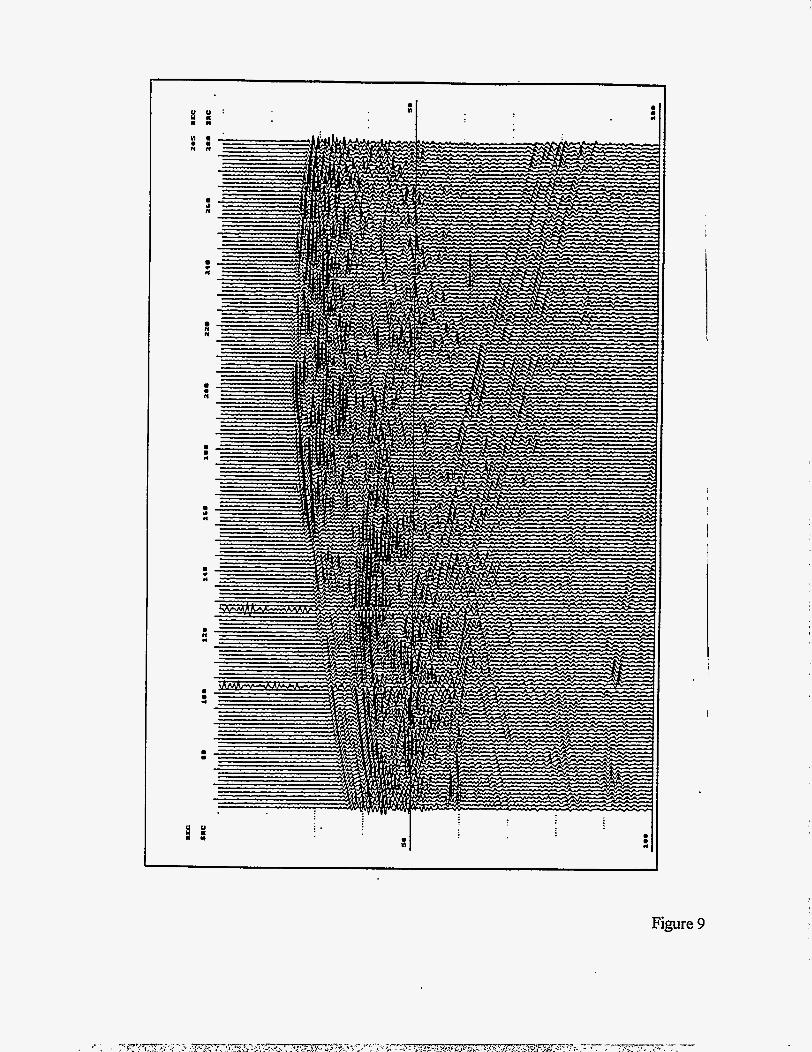
The difficulty of wavefield separation for this profile is the tube wave removal. As we can
see from the full wavefield data displays that the P-wave reflection moveouts are very close to the
tube wave moveout because the P-wave velocity is close to the tube wave velocity (see Figure 9).
This causes some inseparable tube wave residuals left behind when the P-wave reflections are
preserved.
INTERPRETATION
Integration of Geophysical, Geological and Well Log Data
Since resistivity and gamma ray logs are valuable information we combined these logs
recorded in wells H-BOR-34, H-BOR-50, and H-BOR-44 to estimate the petrophysical boundaries.
11

The logs shown in Figures 4 and 5 were used to correlate the petrophysical boundaries at the
borehole scale with the interwell seismic results. As we previously discussed, the well logs indicated
that the SantedCongaree contact is associated with a low-resistivity anomaly and a high gamma ray
count which represents the effect of the green clay layer at a depth of about 210 R. Furthermore, this
geologic unit correlates with a compressional wave velocity low in the P-wave velocity profile (see
Figure 8) which was produced from the 3-component seismic data using an algorithm developed by
Jackson and Tweeton (1994).
In addition, a second low-resistivity anomaly is observed in the three wells above the Santee
Formation at depths of 140 ft to 150 R. This conductive zone separates the Dry Branch Formation
from the Santee carbonates and correlates with a compressional wave velocity low in the P-wave
velocity profile. We believe that this low-velocity zone corresponds to a conductive clay layer within
the M n s Landing Member intercepted by the wells H-BOR-34 and H-BOR-50. To determine if
this conductive low-velocity target is connected between the wells H-BOR-34 and H-BOR-50, we
analyzed the seismic waves recorded at the depths o f 140 R - 150 R for the presence of trapped
waves. Since there is a P-wave velocity contrast between the target of interest and the host medium,
trapped seismic energy in the form of leaky modes was detected using time-frequency analysis. In
fact, the group velocity plot calculated from waveforms records for the detector at 140 ft. where the
source was placed at 140.5 R exhibits P-wave spectral components which contain low- and high-
frequency distributions (see Figure 7b).
In a similar manner we analyzed the data associated with the green clay layer to determine if
this layer is connected between wells H-BOR-34 and H-BOR-50. In this case the common detector
seismogram for the depth of 200 R was considered for the analysis. Several waveforms recorded
when the source was placed above, below and within the green clay layer were processed using time-
12

frequency representations. The group velocity contour plots of these waveforms did not show
evidence of trapped seismic energy. The time-fiequency analysis of the 3-component seismic data
recorded at the detector position of 200 ft suggests that the conductive material (green clay)
intercepted by H-BOR-34 and H-BOR-50 is not connected between these wells, or that the detector
was not placed in the green clay layer. For example, a detector placed in the low-velocity zone at a
depth of 205 R may coupled better to the formation than a detector placed at 210 ft to detect trapped
seismic energy associated with the green clay layer. Indeed, to test this concept in more detail it will
require to take more 3-component measurements at several detector positions above and below and
within the green clay layer to thoroughly determine if guided waves can be detected in this zone.
An additional interpretation was made by comparing the velocity profiles given in Figure 8
with the resistivity and gamma ray logs given in Figures 4 and 5. The maximum resistivity anomaly
observed between the depths of 150 ft to 180 ft in well log H-BOR-50 correlated with a local
maximum P-wave velocity anomaly and a low-gamma count. In this zone, the natural gamma count
is low and the resistivity and the P-wave velocity are high. These petrophysical characteristics are
typical of those of carbonate rocks. In addition, the resistivity log of well H-BOR-34 shows a small
resistivity anomaly which may correspond to a heterogeneity not associated with carbonate rock.
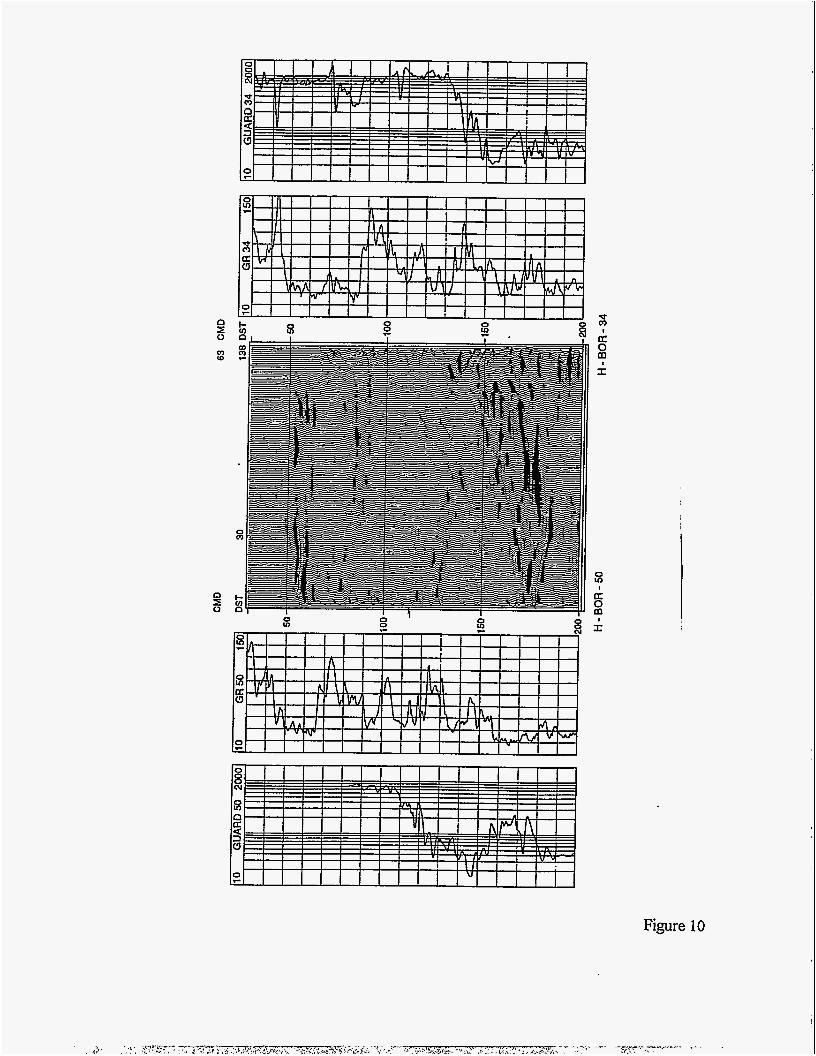
The top and bottom of the carbonate rock at a depth of about 170 ft correlates with
reflections observed in the reflection image plots in Figure 10. This reflection image shows that the
carbonate has been intercepted by sands and other lateral changes of the region of interest. A weak
reflection is observed at the depth of 145 ft which correlates with the tan clay unit. In addition, in
the upper portion of the reflection image, two reflections are observed. The first reflection is at a
depth of about 55 ft, which is associated with the boundary between the Tobacco Road Formation
13

and the Upper Dry Branch Formation. The second reflection is observed at a depth of about 85 ft,
an it correlates with the Lower Dry Branch Formation.
Integration of Travel Time Tomograms and Reflection Imaging
Travel times acquired from the H-BOR-34 and H-BOR-50 survey were inverted to produce
a velocity tomogram. This tomogram has delineated the lateral and vertical heterogeneous conditions
of the formation between the depths of 140 and 200 R. In particular, the lateral contact between the
carbonate (intercepted by well H-BOR-50) and the klly saturated sediments (intercepted by well H-
BOR-34) is captured in the high-resolution traveltime tomogram given in Figure 11. These results
are similar to those determined by Majer et al. (1995). Majer also inverted the seismic amplitudes
recorded between wells H-BOR-50 and H-BOR-34 to produce an attenuation tomogram.
The carbonate is a higher velocity unit and the water saturated sands are much lower velocity
zones. In addition, the carbonates are associated with a low quality factor and the water saturated
sands are associated with a higher quality factor (see Majer et al. 1995). Since the heterogenous
carbonate unit is porous and vuggy the fluid will flow in and out of the porous when the waves
propagate through the carbonate matrix. Under this conditions energy loss will occur by reducing
the wave amplitude as the wave travels between wells. Alternatively, the low velocity zone formed
by filly saturated sands will not allow the fluid to flow in and out of a more uniform sand matrix, as
a consequence no energy loss will occur by the presence of the fluids in the sands. Indeed energy
losses may occur by the presence of viscoelasticity in the sands or any other material present in the
formation. In the present application we expect that the viscoelastic losses will be much less than
those associated with fluid flow.
The integration of the velocity tomogram and the P-wave reflection imaging has yielded a final
characterization of the subsurface in the region under study (see Figures 10 and 11). In these plots
14

the soft sands delineated by the velocity tomogram as a blue zone (between 22 to 140 R in the
horizontal direction) are surrounded by reflection events observed between depths of 150 ft and
200 ft in the reflection imaging. These reflection events were originated by the acoustic impedance
contrast between the low velocity zones of "soupy" sand mixtures (unconsolidated materials) and the
more rigid and dense (competent) surrounded medium .
CONCLUSIONS
The integration of well logs and the 3-component seismic data as well as the reflection image
delineated a clay layer within the Griffins Landing Member, and the carbonate rock units. The
rotation of the 3-component data indicated the presence of trapped seismic energy associated with
the connectivity of the tan clay layer between wells H-BOR-34 and H-BOR-50. On the other hand,
the results of the interpretation suggested that there is not sufficient data to prove whether the green
clay unit is connected or not.
In general, the Santee sediments are associated with a large velocity low relative to the Dry
Branch (above) and Congaree (below) high-velocity formations. In several, this low-velocity anomaly
a P-wave velocity which correlates with the resistivity logs. A local P-wave velocity and resistivity
maxima correlates with the carbonate rocks which are associated with low-gamma ray counts. In
addition, the large velocity anomaly is consistent with the compressional wave velocity logs given in
Figures 4 and 5. Compressional wave velocities less than the compressional wave velocity of the
water (in shallow geophysical applications) is not unusual in low shear-wave velocity formations
having bulk densities greater than the density of the water.
The processing and analysis of the seismic data suggested that additional 3-component seismic
measurements should be conducted at shorter spacing to resolve the heterogeneities within the Santee
15

Limestone formation, and to determine whether the green clay unit is continuous between wells, and
to predict other lithologic features of interest.
The combined P-wave reflection imaging and the travel time velocity tomogram has delineated
a large soft zone of sand mixtures (in the inter-well area between wells H-BOR-50 and H-BOR-34)
at a depth of 150-200 R. The length of the soft zone is 120 R between wells H-BOR-50 and H-BOR-
34 , and the extension of this zone beyond well H-BOR-34 is unknown.
ACKNOWLEDGMENTS
This work was supported by the Westinghouse Savannah River Company, Subcontract
number AB6239N. The conclusions and opinions of the authors do not necessarily reflect those of
the United States Department of Energy.

REFERENCES
Balogh, W.T., Owen, T.E., and Harris, J.M. (1988). "A new piezoelectric transducer for hole-to-
hole seismic applications," Expanded Abstracts, Paper DEV2.5 58th Ann. Int'l. Meeting SEG;
Anaheim, CA, Oct. 30-Nov. 3.
Barr, F.J., Beasley, T.R., and Piggin, R.H. (1989). "Method and apparatus for seismic exploration
of strata surrounding a borehole," US. Patent No. 4,873,675.
Becquey, M., Bermet-Rollande, J.O., Laurent, J., and Noual, G. (1 992). "Imaging reservoirs -- A
cross-well seismic experiment, "First Break (EAEG), Vol. 10, pp. 337-344.
Chen, S.T., (1993). "A Single-well profiling tool and tube wave suppression system", Expanded
Abstracts, Paper BGl.4,63rd Ann. Int'l Meeting SEG, Washington, DC.
Chen, S.T., Zimmerman, L.J., and Tugnait, J.K. (1990b). "Subsurface imaging using reverse VSP
and cross-hole tomographic methods, "Geophys., Vol. 55, pp. 1478-87.
Cohen, L., (1989). "Time-Frequency Distributions - A Review," Proc. I%IEE, Vol. 77, No. 7,941-
981.
Hardage, B.A (1992). Cross-Well Seismolom and Reverse VSP, Geophysical Press, Ltd. London.
Hlawatsch, F., and Boudreaux-Bartels, G.F., (1992). ''Linear and Quadratic Time-Frequency Signal
Representations," IEEE Signal ProcessingMag., Vol. 9,22-67.
Jackson, M. J., and Tweeton, D.R., (1994). "MIGRATOM-Geophysical Tomography using
Wavefront Migration and Fuzzy Constraints," Report of Investigations #9497, Bureau of
Mines, United States Department of Interior.
Journel, A.G. (1 989), "Fundamentals of geostatistics in five lessons," American Physical Union,
Washington, DC, Vol. 8.
17

Kennedy, W.S., Wiggins, W., and Aronstam, P. (1988). "Swept-frequency borehole source for
inverse VSP and cross-borehole surveying," Expanded Abstracts, Paper DEV2.6; 58th Ann.
Int'l. Meeting SEG; Anaheim, CA, Oct. 30-Nov. 3..
Laurent, J., Layotte, P.C., Meyneir, P. and Noual, G. (1990). "A mechanical wall-clamped borehole
source and its use in inverse VSP and cross-hole seismic surveying, "Abstracts, Paper 13-19;
52nd Meeting EAEG; Copenhagen, Denmark; 28 May - 1 June.
Lazaratos, S.K., Langan, R., and Harris, J.M. (1994). "Shear-wave crosswell reflection imaging in
West Texas," Expanded Abstracts, Paper DP3.2, Ann. Int'l Meeting SEG, Los Angeles, CA,
October 23-27.
Majer, E., Peterson, J., Hubbard, S., Daley, T., and Vasco, D., (1995). "Evaluation of the
applicability of high resolution crosshole seismic imaging beneath the H-Tank area for
geomechanical properties" Final Report, Lawrence Berkeley Laboratory, Berkeley, California.
Majer, E., Peterson, J., Hubbard, S. , Daley, T., and Vasco, D., (1995). "Evaluation of high
resolution crosshole seismic imaging beneath the H-tank area for geomechanical properties,"
Final Report, Lawrence Berkeley National Laboratory, Berkeley, California.
Mosher, C.C. and Mason, I.M., (1983). "Borehole-to-borehole sem-wave transmission," Expanded
Abstracts, Paper C1.4, 53rd Ann. Int'l Meeting SEG, Las Vegas, NV, Sept. 11-15.
Owen, T.E. and Shirley, D.J. (1985). "Cylindrical bender-type vibration transducer," U.S. Patent No.
4,525,645.
Parra, J.O., and Xu, P-C., (1994), "Dispersion and attenuation of acoustic guided waves in layered
fluid-filled porous media," J . Acoust. SOC. Am., 95, 91-98.
Parra, J.O., (1995). "A feasibility study of high-resolution reverse VSP and interwell seismic
methods for hydrocarbon reservoir characterization," The Log AnaZyst, May-June, 64-8 1.
18

Raytheon Engineers and Constructors, (1 994). "Geophysical investigations, in-tank precipitation
facility, Task 176", Final Report, Westinghouse Savannah River Company Project
Engineering Service Contract.
Rowe, P. and Mason, I.M., (1 982). "Downhole recharged electrolytic sleeve exploder," Expanded
Abstracts, Paper S14.8, 52nd Ann. Int'l Meeting SEG, Dallas, TX, Oct. 17-21.
Staron, P., kens, G., and Gros, P. (1988). Method of instantaneous acoustic logging within a
borehole," U.S. Patent No. 4,718,048.
Snipes, D.S., Fallaw, W.C., Price, V., and Cumbest, R.S., (1993). The pen branch fault:
Documentation of late cretaceous-tertiary faulting in the coastal plain of South Carolina:
Southeastern geology, 33, 195-218.
Zook, B.J., (1994). "Using Guided Waves to Characterize Gas Reservoir Continuity, Phase I: Data
Processing," Topical Report #GRI-94/0384.2, Gas Research Institute.
19

Figure 1.
Figure 2.
Figure 3.
Figure 4.
Figure 5.
Figure 6 .
LIST OF CAPTIONS The upper Atlantic coastal plain of South Carolina and Georgia.
A simplified cross-section of the In-Tank Precipitation site geology at the Savannah River Site.
A plan view of the five wells at the In-Tank Precipitation site.
Display of resistivity logs for wells H-BOR-34, H-BOR-50, and H-BOR-44.
Display of gamma ray logs for wells H-BOR-34, H-BOR-50, and H-BOR-44.
A common receiver particle velocity seismogram for a detector depth of 140 ft. The seismic data was produced using a 1200 Joule arc discharge source and a shuttle 3- component detector.
Figure 7a. Time-fi-equency spectrogram of a trace recorded at the source depth of 160.5 A, given in the seismogram of Figure 6.
Figure 7b. Time-fi-equency spectrogram of a trace recorded at the source depth of 145.5 ft, given in the seismogram of Figure 6.
Figure 7c. Time-fi-equency spectrogram of a trace recorded at the source depth of 138 A, given in the seismogram of Figure 6.
Figure 7d. Time-fi-equency spectrogram of a trace recorded at the source depth of 129 ft, given in the seismogram of Figure 6.
Figure 8.
Figure 9.
Compressional wave velocity profle derived fiom three-component detector data.
A common receiver pressure seismogram for a hydrophone depth of 205 ft. The seismic data was produced using a piezoelectric source and an array of hydrophones.
Figure 10. Comparison of down going reflection image with resistivity and gamma ray logs from wells H-BOR-50 and H-BOR-34.
Figure 1 1. P-wave velocity tomogram showing a low-velocity zone formed by soft materials.
20

SOUTH CAROLINA
I
0 10 20 30 40 50 60 70 - MILES
0 25 50 u KILOMETERS
Figure 1
I

+
Figure 2
H-BOR-34
HTF-B-I
Figure 3

DEPTH 0
50
100
150
20 0
250
Figure 4

DEPTH FEET
50
100
150
200
250
Figure 5

Savannah R i v e r D a t a
-..
100.5 140.0
103.5 140.0
106.5 140.0
109.5 140.0
112.5 140.0
115.5 140.0
118.5 140.0
9 121.5 140.0 ct 124.5 140.0
5 127.5 140.0-
' 130.5 140.0 11) ' 133.5 140.0
0 136.5 140.0
139.5 140.0 L 3 0 II] 142.5 140.0
145.5 140.0
148.5 140.0
151.5 140.0
154.5 140.0
157.5 140.0
160.5 140.0
n
0 30 6 0
T ime 90
( m s ) 120 150
Figure 6
.

n N I
>\ 0 S a, 3
u
0-
G f!
Fan #7-X, 160.5 ft (SPEC, 1.OE-3) . . 1000 i .... >
900
800
700
600
500
400
300
200
100
0 0
.-.. .. i
* I % L ..... , .
.... . . .... , .. , . . . : ! . f * -. . i * . I -*
Q . '2.
..........
Key - dB ........ 1 -12.00
2 -10.00 3 -8.00 4 -6.00 5 -4.00 6 -2.00
- ........ - ........ -
25 50 75 Time (ms)
100 125
Figure 7a

n N I I
- - - - 900 1 -
800 4 700
600
500
400
300
200
100
0
.*. Y':
- - - - - - - - - - - ........ - - - ......... - - - - - - - - - - - - - - .... - ...... - - - ... - ..a- e*:- - .... - -.: - - .. . - .... *.' . . . . . .
Key - dB ........ 1 -12.00
2 -10.00 3 -8.00 4 -6.00 5 -4.00 6 -2.00
- ........ - ........ -
0 25 50 75 Time (ms)
100 125
Figure 7b

1000
900
800
700
Fan #7-X, 138.0 f t (SPEC, 1.OE-3) - - - - - - ......... - .. - - - - - - - .............
n N
2 600 3 s 500
cr 400 P
a, 3
Key - dB ........ 1 -12.00
2 -10.00 3 -8.00 4 -6.00 5 -4.00
- 6 -2.00
- ........ - ........
0 25 50 75 Time (ms)
100 125
Figure 7c

n N I
x 0 c
W
Fa 1000
800
700 1
n #7-X, 129 .o f t (SPEC, 1 .OE-3) Key - dB
1 -12.00 2 -10.00 3 -8.00 4 -6.00 5 -4.00 6 -2.00
. . . . . . . . - . . . . . . . . - ..- ..... -
0 25 50 75 Time (ms)
100 125
Figure 7d

!? 0 In
I
Figure 8
u u : u s s a
n n
U #
0
n
0
n
t
n
0 n
0 .(
0 .(
0 t .(
0 V I
0
U
w
Figure 9
0 ’ 0 0 0 ln
Figure 10

Figure 11