revenue per pupil report by school district for fy …rfa.sc.gov/files/revenue per pupil report fy...
TRANSCRIPT

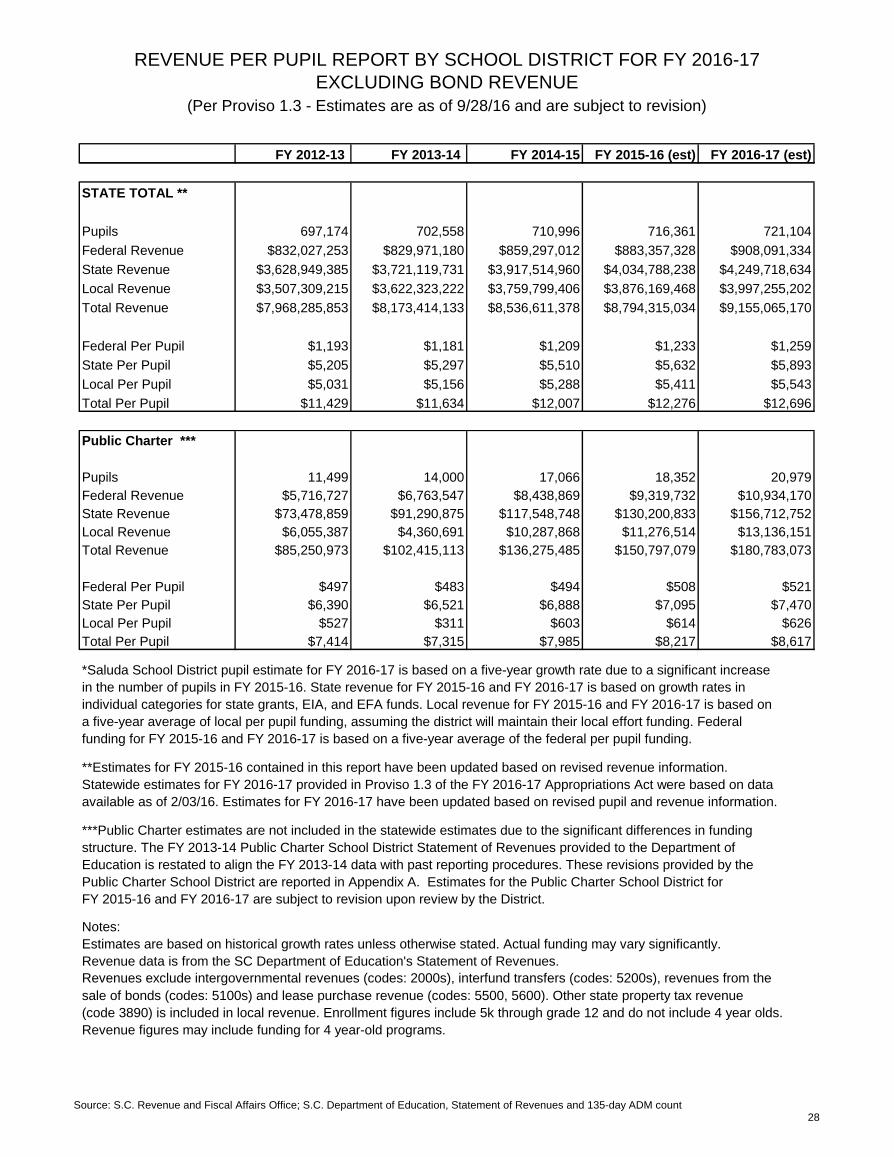
REVENUE PER PUPIL REPORT BY SCHOOL DISTRICT FOR FY 2016-17
EXCLUDING BOND REVENUE
(Per Proviso 1.3 - Estimates are as of 9/28/16 and are subject to revision)
FY 2012-13 FY 2013-14 FY 2014-15 FY 2015-16 (est) FY 2016-17 (est)
ABBEVILLE
Pupils 3,046 3,016 2,994 2,968 2,941
Federal Revenue $3,697,356 $3,767,018 $3,802,312 $3,815,086 $3,829,732
State Revenue $18,251,681 $17,960,192 $18,273,594 $18,159,835 $18,469,830
Local Revenue $9,622,407 $10,436,598 $9,855,917 $9,822,281 $9,792,369
Total Revenue $31,571,444 $32,163,808 $31,931,823 $31,797,202 $32,091,931
Federal Per Pupil $1,214 $1,249 $1,270 $1,285 $1,302
State Per Pupil $5,992 $5,954 $6,103 $6,118 $6,280
Local Per Pupil $3,159 $3,460 $3,292 $3,309 $3,330
Total Per Pupil $10,364 $10,663 $10,665 $10,712 $10,912
AIKEN
Pupils 23,783 23,784 23,860 23,845 23,816
Federal Revenue $24,309,402 $21,792,988 $21,637,899 $21,569,606 $21,511,871
State Revenue $117,309,665 $117,630,467 $128,308,357 $130,571,955 $135,916,841
Local Revenue $82,305,024 $83,100,118 $92,435,706 $95,115,068 $97,907,039
Total Revenue $223,924,091 $222,523,573 $242,381,962 $247,256,630 $255,335,751
Federal Per Pupil $1,022 $916 $907 $905 $903
State Per Pupil $4,932 $4,946 $5,378 $5,476 $5,707
Local Per Pupil $3,461 $3,494 $3,874 $3,989 $4,111
Total Per Pupil $9,415 $9,356 $10,159 $10,370 $10,721
ALLENDALE
Pupils 1,255 1,231 1,243 1,171 1,103
Federal Revenue $3,866,832 $3,485,949 $3,327,951 $3,350,204 $3,374,212
State Revenue $9,998,352 $9,344,716 $9,958,194 $9,552,281 $9,385,488
Local Revenue $6,779,013 $7,390,415 $6,199,542 $6,199,992 $6,202,720
Total Revenue $20,644,197 $20,221,080 $19,485,687 $19,102,477 $18,962,419
Federal Per Pupil $3,080 $2,832 $2,677 $2,860 $3,058
State Per Pupil $7,964 $7,591 $8,011 $8,154 $8,506
Local Per Pupil $5,400 $6,004 $4,987 $5,292 $5,621
Total Per Pupil $16,444 $16,427 $15,676 $16,306 $17,185
Source: S.C. Revenue and Fiscal Affairs Office; S.C. Department of Education, Statement of Revenues and 135-day ADM count1
REVENUE PER PUPIL REPORT BY SCHOOL DISTRICT FOR FY 2016-17
EXCLUDING BOND REVENUE
(Per Proviso 1.3 - Estimates are as of 9/28/16 and are subject to revision)
FY 2012-13 FY 2013-14 FY 2014-15 FY 2015-16 (est) FY 2016-17 (est)
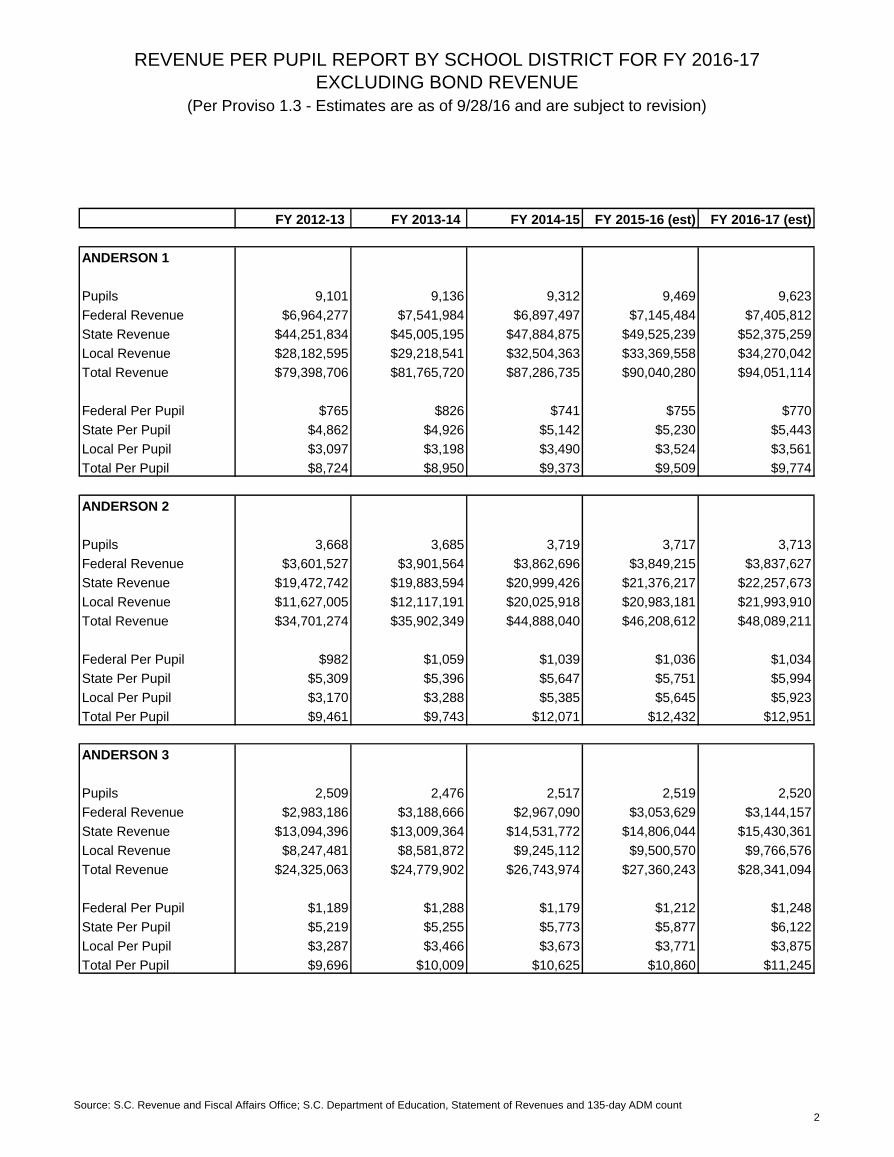
ANDERSON 1
Pupils 9,101 9,136 9,312 9,469 9,623
Federal Revenue $6,964,277 $7,541,984 $6,897,497 $7,145,484 $7,405,812
State Revenue $44,251,834 $45,005,195 $47,884,875 $49,525,239 $52,375,259
Local Revenue $28,182,595 $29,218,541 $32,504,363 $33,369,558 $34,270,042
Total Revenue $79,398,706 $81,765,720 $87,286,735 $90,040,280 $94,051,114
Federal Per Pupil $765 $826 $741 $755 $770
State Per Pupil $4,862 $4,926 $5,142 $5,230 $5,443
Local Per Pupil $3,097 $3,198 $3,490 $3,524 $3,561
Total Per Pupil $8,724 $8,950 $9,373 $9,509 $9,774
ANDERSON 2
Pupils 3,668 3,685 3,719 3,717 3,713
Federal Revenue $3,601,527 $3,901,564 $3,862,696 $3,849,215 $3,837,627
State Revenue $19,472,742 $19,883,594 $20,999,426 $21,376,217 $22,257,673
Local Revenue $11,627,005 $12,117,191 $20,025,918 $20,983,181 $21,993,910
Total Revenue $34,701,274 $35,902,349 $44,888,040 $46,208,612 $48,089,211
Federal Per Pupil $982 $1,059 $1,039 $1,036 $1,034
State Per Pupil $5,309 $5,396 $5,647 $5,751 $5,994
Local Per Pupil $3,170 $3,288 $5,385 $5,645 $5,923
Total Per Pupil $9,461 $9,743 $12,071 $12,432 $12,951
ANDERSON 3
Pupils 2,509 2,476 2,517 2,519 2,520
Federal Revenue $2,983,186 $3,188,666 $2,967,090 $3,053,629 $3,144,157
State Revenue $13,094,396 $13,009,364 $14,531,772 $14,806,044 $15,430,361
Local Revenue $8,247,481 $8,581,872 $9,245,112 $9,500,570 $9,766,576
Total Revenue $24,325,063 $24,779,902 $26,743,974 $27,360,243 $28,341,094
Federal Per Pupil $1,189 $1,288 $1,179 $1,212 $1,248
State Per Pupil $5,219 $5,255 $5,773 $5,877 $6,122
Local Per Pupil $3,287 $3,466 $3,673 $3,771 $3,875
Total Per Pupil $9,696 $10,009 $10,625 $10,860 $11,245
Source: S.C. Revenue and Fiscal Affairs Office; S.C. Department of Education, Statement of Revenues and 135-day ADM count2

REVENUE PER PUPIL REPORT BY SCHOOL DISTRICT FOR FY 2016-17
EXCLUDING BOND REVENUE
(Per Proviso 1.3 - Estimates are as of 9/28/16 and are subject to revision)
FY 2012-13 FY 2013-14 FY 2014-15 FY 2015-16 (est) FY 2016-17 (est)
ANDERSON 4
Pupils 2,814 2,828 2,809 2,784 2,758
Federal Revenue $3,298,890 $3,023,470 $2,972,068 $3,039,903 $3,110,743
State Revenue $14,981,406 $15,289,643 $15,908,444 $16,461,757 $17,417,716
Local Revenue $15,967,766 $16,949,535 $18,173,665 $18,608,225 $19,060,012
Total Revenue $34,248,062 $35,262,648 $37,054,177 $38,109,885 $39,588,471
Federal Per Pupil $1,172 $1,069 $1,058 $1,092 $1,128
State Per Pupil $5,323 $5,407 $5,663 $5,912 $6,315
Local Per Pupil $5,674 $5,994 $6,469 $6,683 $6,910
Total Per Pupil $12,169 $12,470 $13,190 $13,687 $14,353
ANDERSON 5
Pupils 12,239 12,348 12,340 12,456 12,566
Federal Revenue $14,338,733 $14,442,786 $15,124,630 $15,627,432 $16,154,442
State Revenue $64,720,024 $65,864,854 $67,212,389 $68,885,388 $72,204,482
Local Revenue $46,876,077 $47,693,684 $51,574,600 $52,235,021 $52,923,089
Total Revenue $125,934,834 $128,001,324 $133,911,619 $136,747,841 $141,282,013
Federal Per Pupil $1,172 $1,170 $1,226 $1,255 $1,286
State Per Pupil $5,288 $5,334 $5,447 $5,530 $5,746
Local Per Pupil $3,830 $3,863 $4,179 $4,194 $4,211
Total Per Pupil $10,290 $10,366 $10,852 $10,978 $11,243
BAMBERG 1
Pupils 1,367 1,368 1,321 1,356 1,391
Federal Revenue $2,094,944 $2,013,050 $2,215,902 $2,188,832 $2,163,143
State Revenue $9,149,921 $9,146,907 $9,275,773 $9,335,791 $9,613,665
Local Revenue $5,539,099 $5,826,864 $6,086,437 $6,366,317 $6,661,407
Total Revenue $16,783,964 $16,986,821 $17,578,112 $17,890,941 $18,438,215
Federal Per Pupil $1,532 $1,472 $1,677 $1,614 $1,555
State Per Pupil $6,692 $6,688 $7,021 $6,884 $6,910
Local Per Pupil $4,051 $4,260 $4,607 $4,694 $4,788
Total Per Pupil $12,275 $12,420 $13,304 $13,192 $13,253
Source: S.C. Revenue and Fiscal Affairs Office; S.C. Department of Education, Statement of Revenues and 135-day ADM count3
REVENUE PER PUPIL REPORT BY SCHOOL DISTRICT FOR FY 2016-17
EXCLUDING BOND REVENUE
(Per Proviso 1.3 - Estimates are as of 9/28/16 and are subject to revision)
FY 2012-13 FY 2013-14 FY 2014-15 FY 2015-16 (est) FY 2016-17 (est)
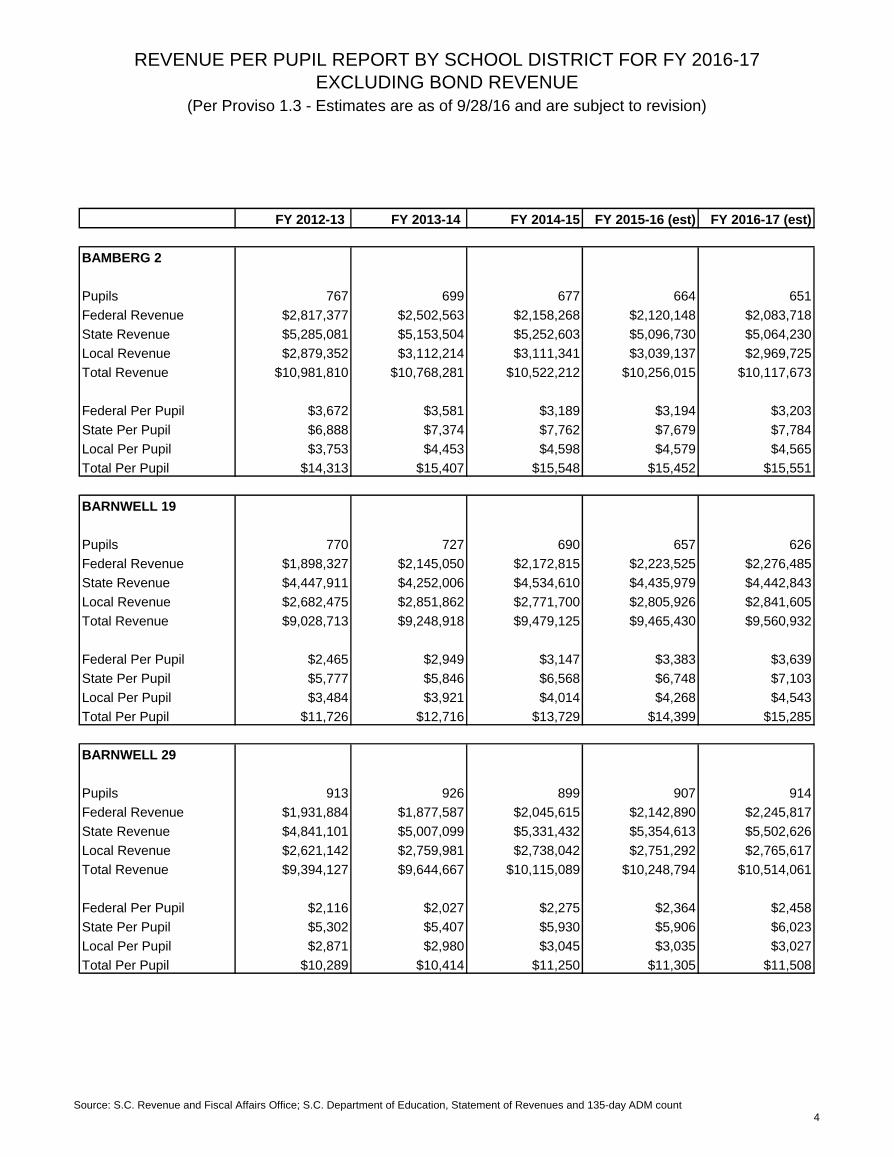
BAMBERG 2
Pupils 767 699 677 664 651
Federal Revenue $2,817,377 $2,502,563 $2,158,268 $2,120,148 $2,083,718
State Revenue $5,285,081 $5,153,504 $5,252,603 $5,096,730 $5,064,230
Local Revenue $2,879,352 $3,112,214 $3,111,341 $3,039,137 $2,969,725
Total Revenue $10,981,810 $10,768,281 $10,522,212 $10,256,015 $10,117,673
Federal Per Pupil $3,672 $3,581 $3,189 $3,194 $3,203
State Per Pupil $6,888 $7,374 $7,762 $7,679 $7,784
Local Per Pupil $3,753 $4,453 $4,598 $4,579 $4,565
Total Per Pupil $14,313 $15,407 $15,548 $15,452 $15,551
BARNWELL 19
Pupils 770 727 690 657 626
Federal Revenue $1,898,327 $2,145,050 $2,172,815 $2,223,525 $2,276,485
State Revenue $4,447,911 $4,252,006 $4,534,610 $4,435,979 $4,442,843
Local Revenue $2,682,475 $2,851,862 $2,771,700 $2,805,926 $2,841,605
Total Revenue $9,028,713 $9,248,918 $9,479,125 $9,465,430 $9,560,932
Federal Per Pupil $2,465 $2,949 $3,147 $3,383 $3,639
State Per Pupil $5,777 $5,846 $6,568 $6,748 $7,103
Local Per Pupil $3,484 $3,921 $4,014 $4,268 $4,543
Total Per Pupil $11,726 $12,716 $13,729 $14,399 $15,285
BARNWELL 29
Pupils 913 926 899 907 914
Federal Revenue $1,931,884 $1,877,587 $2,045,615 $2,142,890 $2,245,817
State Revenue $4,841,101 $5,007,099 $5,331,432 $5,354,613 $5,502,626
Local Revenue $2,621,142 $2,759,981 $2,738,042 $2,751,292 $2,765,617
Total Revenue $9,394,127 $9,644,667 $10,115,089 $10,248,794 $10,514,061
Federal Per Pupil $2,116 $2,027 $2,275 $2,364 $2,458
State Per Pupil $5,302 $5,407 $5,930 $5,906 $6,023
Local Per Pupil $2,871 $2,980 $3,045 $3,035 $3,027
Total Per Pupil $10,289 $10,414 $11,250 $11,305 $11,508
Source: S.C. Revenue and Fiscal Affairs Office; S.C. Department of Education, Statement of Revenues and 135-day ADM count4

REVENUE PER PUPIL REPORT BY SCHOOL DISTRICT FOR FY 2016-17
EXCLUDING BOND REVENUE
(Per Proviso 1.3 - Estimates are as of 9/28/16 and are subject to revision)
FY 2012-13 FY 2013-14 FY 2014-15 FY 2015-16 (est) FY 2016-17 (est)
BARNWELL 45
Pupils 2,356 2,353 2,268 2,183 2,100
Federal Revenue $4,241,184 $4,581,865 $4,663,780 $4,910,394 $5,172,402
State Revenue $12,836,853 $12,797,417 $12,734,474 $12,619,818 $12,800,187
Local Revenue $5,538,997 $5,740,566 $5,785,398 $5,840,359 $5,897,989
Total Revenue $22,617,034 $23,119,848 $23,183,652 $23,370,571 $23,870,578
Federal Per Pupil $1,800 $1,947 $2,056 $2,250 $2,463
State Per Pupil $5,449 $5,438 $5,615 $5,781 $6,096
Local Per Pupil $2,351 $2,439 $2,551 $2,676 $2,809
Total Per Pupil $9,601 $9,824 $10,222 $10,706 $11,368
BEAUFORT
Pupils 19,637 19,897 20,456 20,745 21,027
Federal Revenue $25,473,431 $22,806,368 $21,121,033 $21,392,573 $21,677,862
State Revenue $74,747,439 $79,173,679 $84,712,835 $90,047,280 $97,814,564
Local Revenue $175,176,704 $170,097,680 $179,606,077 $184,904,497 $190,427,153
Total Revenue $275,397,574 $272,077,727 $285,439,945 $296,344,350 $309,919,578
Federal Per Pupil $1,297 $1,146 $1,032 $1,031 $1,031
State Per Pupil $3,806 $3,979 $4,141 $4,341 $4,652
Local Per Pupil $8,921 $8,549 $8,780 $8,913 $9,056
Total Per Pupil $14,025 $13,674 $13,954 $14,285 $14,739
BERKELEY
Pupils 29,927 30,755 31,402 32,177 32,954
Federal Revenue $35,696,337 $34,664,494 $36,068,345 $36,962,098 $37,895,719
State Revenue $154,505,835 $160,013,024 $166,917,544 $172,351,771 $181,977,101
Local Revenue $122,667,434 $134,068,538 $145,479,524 $150,626,208 $156,010,306
Total Revenue $312,869,606 $328,746,056 $348,465,413 $359,940,077 $375,883,126
Federal Per Pupil $1,193 $1,127 $1,149 $1,149 $1,150
State Per Pupil $5,163 $5,203 $5,316 $5,356 $5,522
Local Per Pupil $4,099 $4,359 $4,633 $4,681 $4,734
Total Per Pupil $10,455 $10,689 $11,097 $11,186 $11,406
Source: S.C. Revenue and Fiscal Affairs Office; S.C. Department of Education, Statement of Revenues and 135-day ADM count5

REVENUE PER PUPIL REPORT BY SCHOOL DISTRICT FOR FY 2016-17
EXCLUDING BOND REVENUE
(Per Proviso 1.3 - Estimates are as of 9/28/16 and are subject to revision)
FY 2012-13 FY 2013-14 FY 2014-15 FY 2015-16 (est) FY 2016-17 (est)
CALHOUN
Pupils 1,614 1,659 1,694 1,672 1,651
Federal Revenue $2,472,039 $2,657,601 $2,829,838 $2,823,751 $2,819,032
State Revenue $9,158,939 $9,096,720 $10,366,688 $10,441,287 $10,759,641
Local Revenue $9,938,140 $9,894,879 $9,973,337 $10,147,311 $10,328,048
Total Revenue $21,569,118 $21,649,200 $23,169,863 $23,412,349 $23,906,720
Federal Per Pupil $1,531 $1,601 $1,671 $1,688 $1,708
State Per Pupil $5,673 $5,482 $6,121 $6,243 $6,519
Local Per Pupil $6,156 $5,963 $5,889 $6,067 $6,257
Total Per Pupil $13,360 $13,046 $13,681 $13,999 $14,483
CHARLESTON
Pupils 42,869 43,799 44,896 46,149 47,413
Federal Revenue $73,140,517 $78,170,049 $74,157,773 $76,300,973 $78,542,697
State Revenue $195,056,502 $190,770,512 $198,574,859 $203,992,445 $214,309,086
Local Revenue $396,833,547 $399,983,219 $416,347,667 $430,315,915 $444,910,886
Total Revenue $665,030,566 $668,923,780 $689,080,299 $710,609,333 $737,762,668
Federal Per Pupil $1,706 $1,785 $1,652 $1,653 $1,657
State Per Pupil $4,550 $4,356 $4,423 $4,420 $4,520
Local Per Pupil $9,257 $9,132 $9,274 $9,324 $9,384
Total Per Pupil $15,513 $15,272 $15,348 $15,398 $15,560
CHEROKEE
Pupils 8,601 8,607 8,619 8,546 8,470
Federal Revenue $9,878,079 $9,890,108 $10,243,885 $10,472,032 $10,710,282
State Revenue $43,740,743 $46,490,783 $48,955,547 $49,924,043 $52,074,543
Local Revenue $37,436,983 $39,212,634 $38,267,688 $38,762,321 $39,277,588
Total Revenue $91,055,805 $95,593,525 $97,467,120 $99,158,396 $102,062,413
Federal Per Pupil $1,148 $1,149 $1,189 $1,225 $1,265
State Per Pupil $5,085 $5,402 $5,680 $5,842 $6,148
Local Per Pupil $4,353 $4,556 $4,440 $4,536 $4,637
Total Per Pupil $10,586 $11,107 $11,308 $11,602 $12,050
Source: S.C. Revenue and Fiscal Affairs Office; S.C. Department of Education, Statement of Revenues and 135-day ADM count6
REVENUE PER PUPIL REPORT BY SCHOOL DISTRICT FOR FY 2016-17
EXCLUDING BOND REVENUE
(Per Proviso 1.3 - Estimates are as of 9/28/16 and are subject to revision)
FY 2012-13 FY 2013-14 FY 2014-15 FY 2015-16 (est) FY 2016-17 (est)
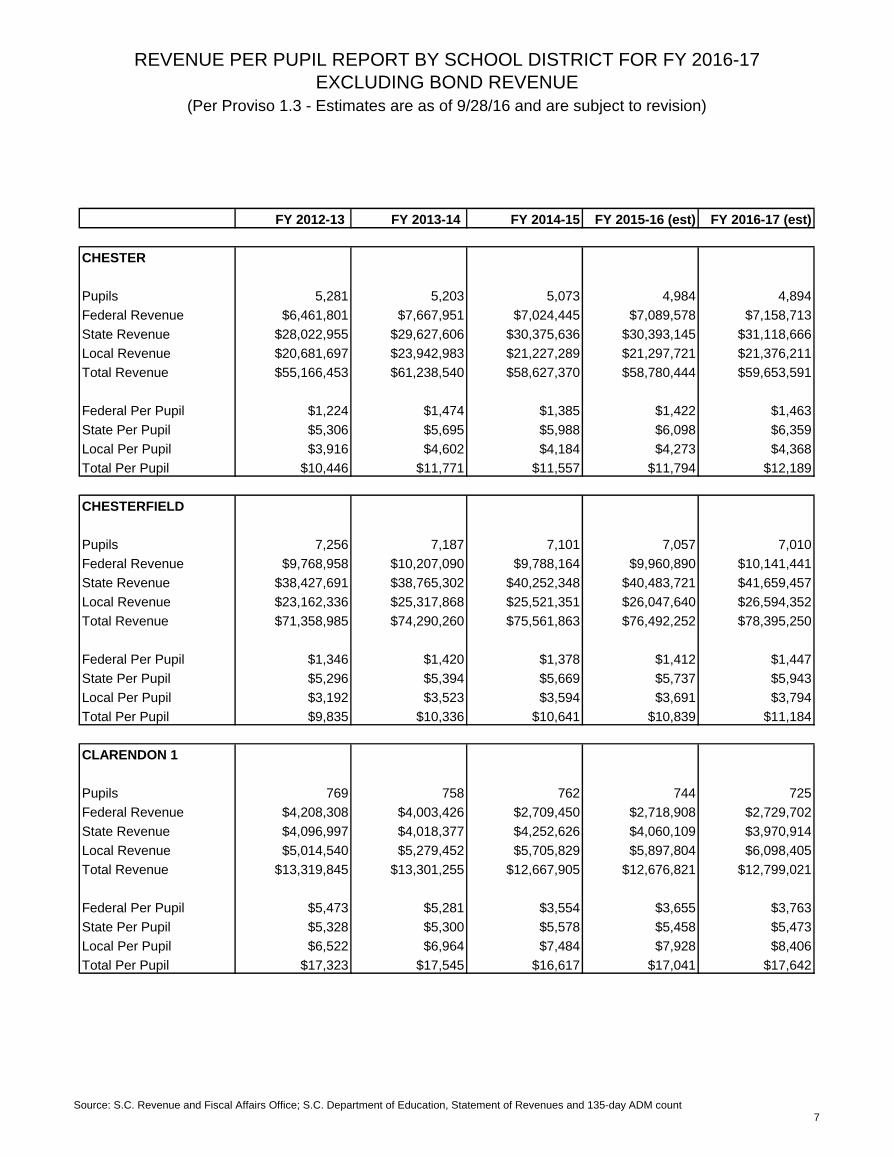
CHESTER
Pupils 5,281 5,203 5,073 4,984 4,894
Federal Revenue $6,461,801 $7,667,951 $7,024,445 $7,089,578 $7,158,713
State Revenue $28,022,955 $29,627,606 $30,375,636 $30,393,145 $31,118,666
Local Revenue $20,681,697 $23,942,983 $21,227,289 $21,297,721 $21,376,211
Total Revenue $55,166,453 $61,238,540 $58,627,370 $58,780,444 $59,653,591
Federal Per Pupil $1,224 $1,474 $1,385 $1,422 $1,463
State Per Pupil $5,306 $5,695 $5,988 $6,098 $6,359
Local Per Pupil $3,916 $4,602 $4,184 $4,273 $4,368
Total Per Pupil $10,446 $11,771 $11,557 $11,794 $12,189
CHESTERFIELD
Pupils 7,256 7,187 7,101 7,057 7,010
Federal Revenue $9,768,958 $10,207,090 $9,788,164 $9,960,890 $10,141,441
State Revenue $38,427,691 $38,765,302 $40,252,348 $40,483,721 $41,659,457
Local Revenue $23,162,336 $25,317,868 $25,521,351 $26,047,640 $26,594,352
Total Revenue $71,358,985 $74,290,260 $75,561,863 $76,492,252 $78,395,250
Federal Per Pupil $1,346 $1,420 $1,378 $1,412 $1,447
State Per Pupil $5,296 $5,394 $5,669 $5,737 $5,943
Local Per Pupil $3,192 $3,523 $3,594 $3,691 $3,794
Total Per Pupil $9,835 $10,336 $10,641 $10,839 $11,184
CLARENDON 1
Pupils 769 758 762 744 725
Federal Revenue $4,208,308 $4,003,426 $2,709,450 $2,718,908 $2,729,702
State Revenue $4,096,997 $4,018,377 $4,252,626 $4,060,109 $3,970,914
Local Revenue $5,014,540 $5,279,452 $5,705,829 $5,897,804 $6,098,405
Total Revenue $13,319,845 $13,301,255 $12,667,905 $12,676,821 $12,799,021
Federal Per Pupil $5,473 $5,281 $3,554 $3,655 $3,763
State Per Pupil $5,328 $5,300 $5,578 $5,458 $5,473
Local Per Pupil $6,522 $6,964 $7,484 $7,928 $8,406
Total Per Pupil $17,323 $17,545 $16,617 $17,041 $17,642
Source: S.C. Revenue and Fiscal Affairs Office; S.C. Department of Education, Statement of Revenues and 135-day ADM count7
REVENUE PER PUPIL REPORT BY SCHOOL DISTRICT FOR FY 2016-17
EXCLUDING BOND REVENUE
(Per Proviso 1.3 - Estimates are as of 9/28/16 and are subject to revision)
FY 2012-13 FY 2013-14 FY 2014-15 FY 2015-16 (est) FY 2016-17 (est)
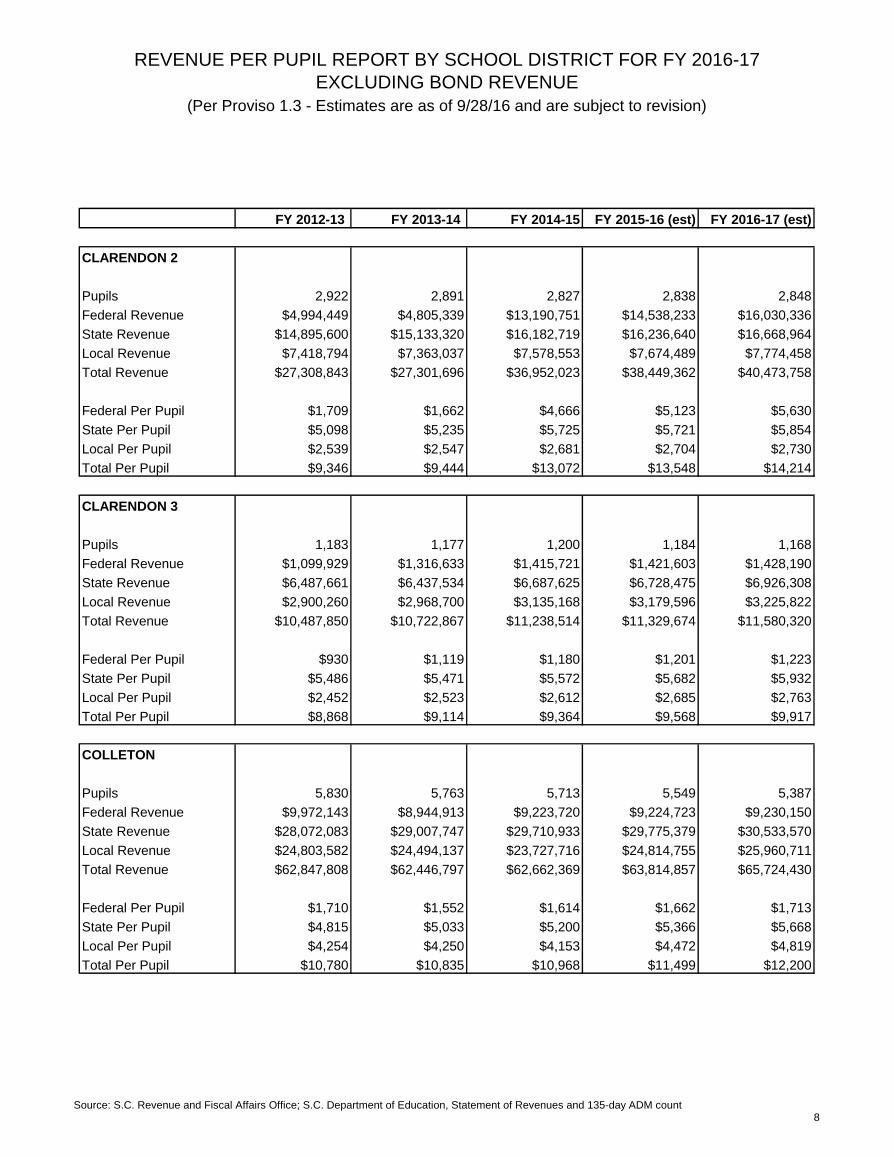
CLARENDON 2
Pupils 2,922 2,891 2,827 2,838 2,848
Federal Revenue $4,994,449 $4,805,339 $13,190,751 $14,538,233 $16,030,336
State Revenue $14,895,600 $15,133,320 $16,182,719 $16,236,640 $16,668,964
Local Revenue $7,418,794 $7,363,037 $7,578,553 $7,674,489 $7,774,458
Total Revenue $27,308,843 $27,301,696 $36,952,023 $38,449,362 $40,473,758
Federal Per Pupil $1,709 $1,662 $4,666 $5,123 $5,630
State Per Pupil $5,098 $5,235 $5,725 $5,721 $5,854
Local Per Pupil $2,539 $2,547 $2,681 $2,704 $2,730
Total Per Pupil $9,346 $9,444 $13,072 $13,548 $14,214
CLARENDON 3
Pupils 1,183 1,177 1,200 1,184 1,168
Federal Revenue $1,099,929 $1,316,633 $1,415,721 $1,421,603 $1,428,190
State Revenue $6,487,661 $6,437,534 $6,687,625 $6,728,475 $6,926,308
Local Revenue $2,900,260 $2,968,700 $3,135,168 $3,179,596 $3,225,822
Total Revenue $10,487,850 $10,722,867 $11,238,514 $11,329,674 $11,580,320
Federal Per Pupil $930 $1,119 $1,180 $1,201 $1,223
State Per Pupil $5,486 $5,471 $5,572 $5,682 $5,932
Local Per Pupil $2,452 $2,523 $2,612 $2,685 $2,763
Total Per Pupil $8,868 $9,114 $9,364 $9,568 $9,917
COLLETON
Pupils 5,830 5,763 5,713 5,549 5,387
Federal Revenue $9,972,143 $8,944,913 $9,223,720 $9,224,723 $9,230,150
State Revenue $28,072,083 $29,007,747 $29,710,933 $29,775,379 $30,533,570
Local Revenue $24,803,582 $24,494,137 $23,727,716 $24,814,755 $25,960,711
Total Revenue $62,847,808 $62,446,797 $62,662,369 $63,814,857 $65,724,430
Federal Per Pupil $1,710 $1,552 $1,614 $1,662 $1,713
State Per Pupil $4,815 $5,033 $5,200 $5,366 $5,668
Local Per Pupil $4,254 $4,250 $4,153 $4,472 $4,819
Total Per Pupil $10,780 $10,835 $10,968 $11,499 $12,200
Source: S.C. Revenue and Fiscal Affairs Office; S.C. Department of Education, Statement of Revenues and 135-day ADM count8

REVENUE PER PUPIL REPORT BY SCHOOL DISTRICT FOR FY 2016-17
EXCLUDING BOND REVENUE
(Per Proviso 1.3 - Estimates are as of 9/28/16 and are subject to revision)
FY 2012-13 FY 2013-14 FY 2014-15 FY 2015-16 (est) FY 2016-17 (est)
DARLINGTON
Pupils 10,224 10,097 10,060 9,941 9,817
Federal Revenue $15,020,773 $14,328,114 $15,034,351 $15,183,250 $15,340,903
State Revenue $51,105,126 $52,723,490 $57,316,647 $57,638,613 $59,305,028
Local Revenue $45,910,891 $46,130,931 $47,558,922 $48,273,267 $49,016,076
Total Revenue $112,036,790 $113,182,535 $119,909,920 $121,095,130 $123,662,008
Federal Per Pupil $1,469 $1,419 $1,494 $1,527 $1,563
State Per Pupil $4,999 $5,222 $5,698 $5,798 $6,041
Local Per Pupil $4,491 $4,569 $4,728 $4,856 $4,993
Total Per Pupil $10,959 $11,210 $11,920 $12,182 $12,596
DILLON 3
Pupils 1,555 1,550 1,586 1,574 1,561
Federal Revenue $1,886,941 $1,793,279 $1,957,664 $1,955,728 $1,954,731
State Revenue $7,385,054 $7,531,388 $7,908,470 $7,987,470 $8,253,315
Local Revenue $2,757,812 $2,910,840 $2,956,494 $3,020,406 $3,086,809
Total Revenue $12,029,807 $12,235,507 $12,822,628 $12,963,603 $13,294,855
Federal Per Pupil $1,214 $1,157 $1,234 $1,242 $1,252
State Per Pupil $4,750 $4,860 $4,985 $5,074 $5,286
Local Per Pupil $1,774 $1,878 $1,864 $1,919 $1,977
Total Per Pupil $7,737 $7,895 $8,083 $8,235 $8,514
DILLON 4
Pupils 4,092 4,143 4,135 4,076 4,015
Federal Revenue $7,653,642 $7,338,721 $7,125,548 $7,092,415 $7,062,837
State Revenue $20,540,931 $21,068,423 $21,935,937 $21,953,914 $22,483,318
Local Revenue $6,642,231 $6,855,607 $6,729,358 $6,777,833 $6,829,148
Total Revenue $34,836,804 $35,262,751 $35,790,843 $35,824,163 $36,375,303
Federal Per Pupil $1,871 $1,771 $1,723 $1,740 $1,759
State Per Pupil $5,020 $5,086 $5,305 $5,386 $5,599
Local Per Pupil $1,623 $1,655 $1,627 $1,663 $1,701
Total Per Pupil $8,514 $8,512 $8,656 $8,789 $9,059
Source: S.C. Revenue and Fiscal Affairs Office; S.C. Department of Education, Statement of Revenues and 135-day ADM count9

REVENUE PER PUPIL REPORT BY SCHOOL DISTRICT FOR FY 2016-17
EXCLUDING BOND REVENUE
(Per Proviso 1.3 - Estimates are as of 9/28/16 and are subject to revision)
FY 2012-13 FY 2013-14 FY 2014-15 FY 2015-16 (est) FY 2016-17 (est)
DORCHESTER 2
Pupils 23,174 23,817 24,530 24,945 25,353
Federal Revenue $16,317,284 $16,045,976 $17,083,148 $17,966,545 $18,904,239
State Revenue $122,204,838 $126,223,224 $132,269,503 $138,954,560 $149,213,520
Local Revenue $74,634,093 $74,086,859 $78,293,987 $80,901,788 $83,626,173
Total Revenue $213,156,215 $216,356,059 $227,646,638 $237,822,894 $251,743,931
Federal Per Pupil $704 $674 $696 $720 $746
State Per Pupil $5,273 $5,300 $5,392 $5,570 $5,885
Local Per Pupil $3,221 $3,111 $3,192 $3,243 $3,298
Total Per Pupil $9,198 $9,084 $9,280 $9,534 $9,929
DORCHESTER 4
Pupils 2,106 2,133 2,113 2,120 2,126
Federal Revenue $3,971,125 $3,917,439 $3,838,753 $3,913,671 $3,991,929
State Revenue $12,141,659 $12,774,620 $13,302,976 $13,399,532 $13,808,915
Local Revenue $13,282,422 $12,984,165 $12,926,219 $13,112,346 $13,305,970
Total Revenue $29,395,206 $29,676,224 $30,067,948 $30,425,549 $31,106,814
Federal Per Pupil $1,885 $1,836 $1,817 $1,846 $1,878
State Per Pupil $5,765 $5,988 $6,296 $6,320 $6,495
Local Per Pupil $6,306 $6,086 $6,118 $6,185 $6,258
Total Per Pupil $13,956 $13,911 $14,231 $14,352 $14,631
EDGEFIELD
Pupils 3,348 3,271 3,313 3,326 3,336
Federal Revenue $5,365,557 $4,822,439 $5,011,629 $5,099,740 $5,191,846
State Revenue $20,004,023 $19,488,623 $20,597,539 $20,670,670 $21,225,571
Local Revenue $13,340,347 $14,417,753 $13,776,630 $13,993,094 $14,218,101
Total Revenue $38,709,927 $38,728,815 $39,385,798 $39,763,504 $40,635,517
Federal Per Pupil $1,603 $1,474 $1,513 $1,533 $1,556
State Per Pupil $5,975 $5,958 $6,216 $6,215 $6,362
Local Per Pupil $3,984 $4,408 $4,158 $4,207 $4,261
Total Per Pupil $11,562 $11,840 $11,887 $11,956 $12,179
Source: S.C. Revenue and Fiscal Affairs Office; S.C. Department of Education, Statement of Revenues and 135-day ADM count10

REVENUE PER PUPIL REPORT BY SCHOOL DISTRICT FOR FY 2016-17
EXCLUDING BOND REVENUE
(Per Proviso 1.3 - Estimates are as of 9/28/16 and are subject to revision)
FY 2012-13 FY 2013-14 FY 2014-15 FY 2015-16 (est) FY 2016-17 (est)
FAIRFIELD
Pupils 2,757 2,652 2,645 2,598 2,551
Federal Revenue $4,883,956 $4,803,750 $5,171,789 $5,199,696 $5,230,247
State Revenue $15,026,355 $14,766,924 $15,735,148 $15,458,225 $15,546,310
Local Revenue $24,439,771 $28,218,542 $31,280,868 $32,548,495 $33,879,449
Total Revenue $44,350,082 $47,789,216 $52,187,805 $53,206,416 $54,656,005
Federal Per Pupil $1,771 $1,812 $1,955 $2,001 $2,050
State Per Pupil $5,449 $5,569 $5,949 $5,949 $6,093
Local Per Pupil $8,863 $10,642 $11,827 $12,526 $13,278
Total Per Pupil $16,084 $18,023 $19,732 $20,476 $21,421
FLORENCE 1
Pupils 15,434 15,546 15,720 15,713 15,698
Federal Revenue $15,860,768 $17,431,950 $16,245,810 $16,453,379 $16,671,490
State Revenue $84,711,452 $87,397,486 $93,858,532 $97,672,260 $103,915,702
Local Revenue $62,020,405 $63,731,288 $67,095,657 $68,850,494 $70,676,523
Total Revenue $162,592,625 $168,560,724 $177,199,999 $182,976,134 $191,263,715
Federal Per Pupil $1,028 $1,121 $1,033 $1,047 $1,062
State Per Pupil $5,489 $5,622 $5,971 $6,216 $6,620
Local Per Pupil $4,018 $4,100 $4,268 $4,382 $4,502
Total Per Pupil $10,534 $10,843 $11,272 $11,645 $12,184
FLORENCE 2
Pupils 1,178 1,221 1,166 1,133 1,099
Federal Revenue $1,473,616 $1,540,641 $1,504,202 $1,499,199 $1,494,931
State Revenue $6,614,124 $6,777,416 $6,962,062 $7,071,981 $7,348,362
Local Revenue $2,563,076 $2,658,091 $3,099,618 $3,130,035 $3,161,901
Total Revenue $10,650,816 $10,976,148 $11,565,882 $11,701,215 $12,005,194
Federal Per Pupil $1,251 $1,261 $1,290 $1,324 $1,360
State Per Pupil $5,617 $5,549 $5,969 $6,244 $6,685
Local Per Pupil $2,177 $2,176 $2,657 $2,764 $2,877
Total Per Pupil $9,045 $8,987 $9,916 $10,331 $10,922
Source: S.C. Revenue and Fiscal Affairs Office; S.C. Department of Education, Statement of Revenues and 135-day ADM count11

REVENUE PER PUPIL REPORT BY SCHOOL DISTRICT FOR FY 2016-17
EXCLUDING BOND REVENUE
(Per Proviso 1.3 - Estimates are as of 9/28/16 and are subject to revision)
FY 2012-13 FY 2013-14 FY 2014-15 FY 2015-16 (est) FY 2016-17 (est)
FLORENCE 3
Pupils 3,571 3,559 3,602 3,561 3,518
Federal Revenue $7,327,156 $7,446,118 $7,958,396 $7,996,246 $8,038,110
State Revenue $20,405,049 $20,732,185 $22,525,398 $22,790,259 $23,589,094
Local Revenue $8,824,216 $8,836,988 $9,370,720 $9,529,940 $9,695,366
Total Revenue $36,556,421 $37,015,291 $39,854,514 $40,316,444 $41,322,570
Federal Per Pupil $2,052 $2,092 $2,210 $2,246 $2,285
State Per Pupil $5,715 $5,826 $6,254 $6,401 $6,705
Local Per Pupil $2,471 $2,483 $2,602 $2,677 $2,756
Total Per Pupil $10,238 $10,402 $11,065 $11,323 $11,746
FLORENCE 4
Pupils 738 693 709 685 662
Federal Revenue $1,548,582 $1,582,671 $1,597,988 $1,593,943 $1,590,673
State Revenue $3,984,360 $3,964,225 $4,276,318 $4,065,909 $3,960,597
Local Revenue $3,251,283 $3,087,465 $3,131,765 $3,192,643 $3,255,877
Total Revenue $8,784,225 $8,634,361 $9,006,071 $8,852,495 $8,807,147
Federal Per Pupil $2,097 $2,285 $2,253 $2,327 $2,405
State Per Pupil $5,397 $5,724 $6,030 $5,935 $5,987
Local Per Pupil $4,404 $4,458 $4,416 $4,660 $4,922
Total Per Pupil $11,898 $12,466 $12,699 $12,921 $13,314
FLORENCE 5
Pupils 1,409 1,379 1,353 1,307 1,262
Federal Revenue $1,520,902 $1,635,401 $1,514,770 $1,509,917 $1,505,803
State Revenue $7,913,757 $7,895,830 $8,183,514 $8,240,445 $8,489,724
Local Revenue $4,212,811 $4,069,939 $4,188,192 $4,097,305 $4,009,895
Total Revenue $13,647,470 $13,601,170 $13,886,476 $13,847,666 $14,005,422
Federal Per Pupil $1,080 $1,186 $1,120 $1,156 $1,194
State Per Pupil $5,618 $5,728 $6,050 $6,307 $6,730
Local Per Pupil $2,991 $2,952 $3,096 $3,136 $3,179
Total Per Pupil $9,689 $9,866 $10,267 $10,598 $11,102
Source: S.C. Revenue and Fiscal Affairs Office; S.C. Department of Education, Statement of Revenues and 135-day ADM count12
REVENUE PER PUPIL REPORT BY SCHOOL DISTRICT FOR FY 2016-17
EXCLUDING BOND REVENUE
(Per Proviso 1.3 - Estimates are as of 9/28/16 and are subject to revision)
FY 2012-13 FY 2013-14 FY 2014-15 FY 2015-16 (est) FY 2016-17 (est)
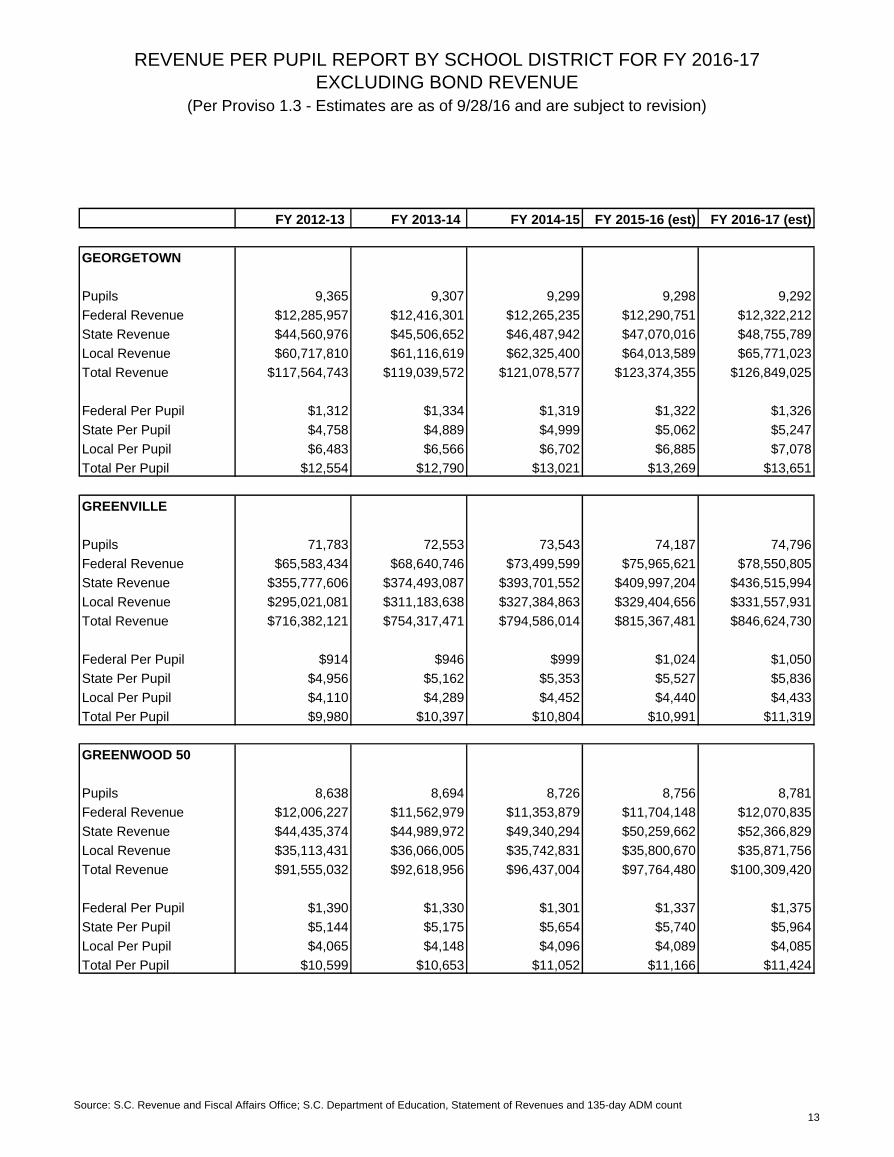
GEORGETOWN
Pupils 9,365 9,307 9,299 9,298 9,292
Federal Revenue $12,285,957 $12,416,301 $12,265,235 $12,290,751 $12,322,212
State Revenue $44,560,976 $45,506,652 $46,487,942 $47,070,016 $48,755,789
Local Revenue $60,717,810 $61,116,619 $62,325,400 $64,013,589 $65,771,023
Total Revenue $117,564,743 $119,039,572 $121,078,577 $123,374,355 $126,849,025
Federal Per Pupil $1,312 $1,334 $1,319 $1,322 $1,326
State Per Pupil $4,758 $4,889 $4,999 $5,062 $5,247
Local Per Pupil $6,483 $6,566 $6,702 $6,885 $7,078
Total Per Pupil $12,554 $12,790 $13,021 $13,269 $13,651
GREENVILLE
Pupils 71,783 72,553 73,543 74,187 74,796
Federal Revenue $65,583,434 $68,640,746 $73,499,599 $75,965,621 $78,550,805
State Revenue $355,777,606 $374,493,087 $393,701,552 $409,997,204 $436,515,994
Local Revenue $295,021,081 $311,183,638 $327,384,863 $329,404,656 $331,557,931
Total Revenue $716,382,121 $754,317,471 $794,586,014 $815,367,481 $846,624,730
Federal Per Pupil $914 $946 $999 $1,024 $1,050
State Per Pupil $4,956 $5,162 $5,353 $5,527 $5,836
Local Per Pupil $4,110 $4,289 $4,452 $4,440 $4,433
Total Per Pupil $9,980 $10,397 $10,804 $10,991 $11,319
GREENWOOD 50
Pupils 8,638 8,694 8,726 8,756 8,781
Federal Revenue $12,006,227 $11,562,979 $11,353,879 $11,704,148 $12,070,835
State Revenue $44,435,374 $44,989,972 $49,340,294 $50,259,662 $52,366,829
Local Revenue $35,113,431 $36,066,005 $35,742,831 $35,800,670 $35,871,756
Total Revenue $91,555,032 $92,618,956 $96,437,004 $97,764,480 $100,309,420
Federal Per Pupil $1,390 $1,330 $1,301 $1,337 $1,375
State Per Pupil $5,144 $5,175 $5,654 $5,740 $5,964
Local Per Pupil $4,065 $4,148 $4,096 $4,089 $4,085
Total Per Pupil $10,599 $10,653 $11,052 $11,166 $11,424
Source: S.C. Revenue and Fiscal Affairs Office; S.C. Department of Education, Statement of Revenues and 135-day ADM count13

REVENUE PER PUPIL REPORT BY SCHOOL DISTRICT FOR FY 2016-17
EXCLUDING BOND REVENUE
(Per Proviso 1.3 - Estimates are as of 9/28/16 and are subject to revision)
FY 2012-13 FY 2013-14 FY 2014-15 FY 2015-16 (est) FY 2016-17 (est)
GREENWOOD 51
Pupils 954 939 917 899 881
Federal Revenue $1,209,039 $1,238,235 $1,233,785 $1,251,263 $1,269,588
State Revenue $5,460,356 $5,497,797 $5,888,932 $5,862,224 $5,972,201
Local Revenue $3,013,691 $3,225,905 $3,089,098 $3,054,034 $3,020,490
Total Revenue $9,683,086 $9,961,937 $10,211,815 $10,167,521 $10,262,278
Federal Per Pupil $1,268 $1,318 $1,345 $1,392 $1,442
State Per Pupil $5,725 $5,854 $6,419 $6,521 $6,783
Local Per Pupil $3,160 $3,435 $3,367 $3,397 $3,430
Total Per Pupil $10,153 $10,607 $11,131 $11,309 $11,655
GREENWOOD 52
Pupils 1,639 1,652 1,634 1,585 1,537
Federal Revenue $1,289,439 $1,476,333 $1,316,457 $1,355,644 $1,396,648
State Revenue $7,984,563 $8,166,923 $8,630,116 $9,088,052 $9,781,931
Local Revenue $7,875,081 $8,163,845 $8,093,424 $8,114,458 $8,138,529
Total Revenue $17,149,083 $17,807,101 $18,039,997 $18,558,155 $19,317,108
Federal Per Pupil $787 $894 $806 $855 $909
State Per Pupil $4,873 $4,944 $5,281 $5,732 $6,363
Local Per Pupil $4,806 $4,942 $4,953 $5,118 $5,294
Total Per Pupil $10,466 $10,779 $11,039 $11,706 $12,566
HAMPTON 1
Pupils 2,384 2,352 2,337 2,290 2,243
Federal Revenue $4,828,703 $5,022,823 $5,282,063 $5,517,898 $5,766,909
State Revenue $14,024,959 $13,819,155 $14,421,340 $14,485,211 $14,886,787
Local Revenue $7,097,841 $7,147,567 $7,385,580 $7,436,356 $7,490,213
Total Revenue $25,951,503 $25,989,545 $27,088,983 $27,439,465 $28,143,909
Federal Per Pupil $2,025 $2,136 $2,260 $2,410 $2,572
State Per Pupil $5,882 $5,877 $6,170 $6,325 $6,638
Local Per Pupil $2,977 $3,039 $3,160 $3,247 $3,340
Total Per Pupil $10,884 $11,052 $11,590 $11,982 $12,550
Source: S.C. Revenue and Fiscal Affairs Office; S.C. Department of Education, Statement of Revenues and 135-day ADM count14
REVENUE PER PUPIL REPORT BY SCHOOL DISTRICT FOR FY 2016-17
EXCLUDING BOND REVENUE
(Per Proviso 1.3 - Estimates are as of 9/28/16 and are subject to revision)
FY 2012-13 FY 2013-14 FY 2014-15 FY 2015-16 (est) FY 2016-17 (est)
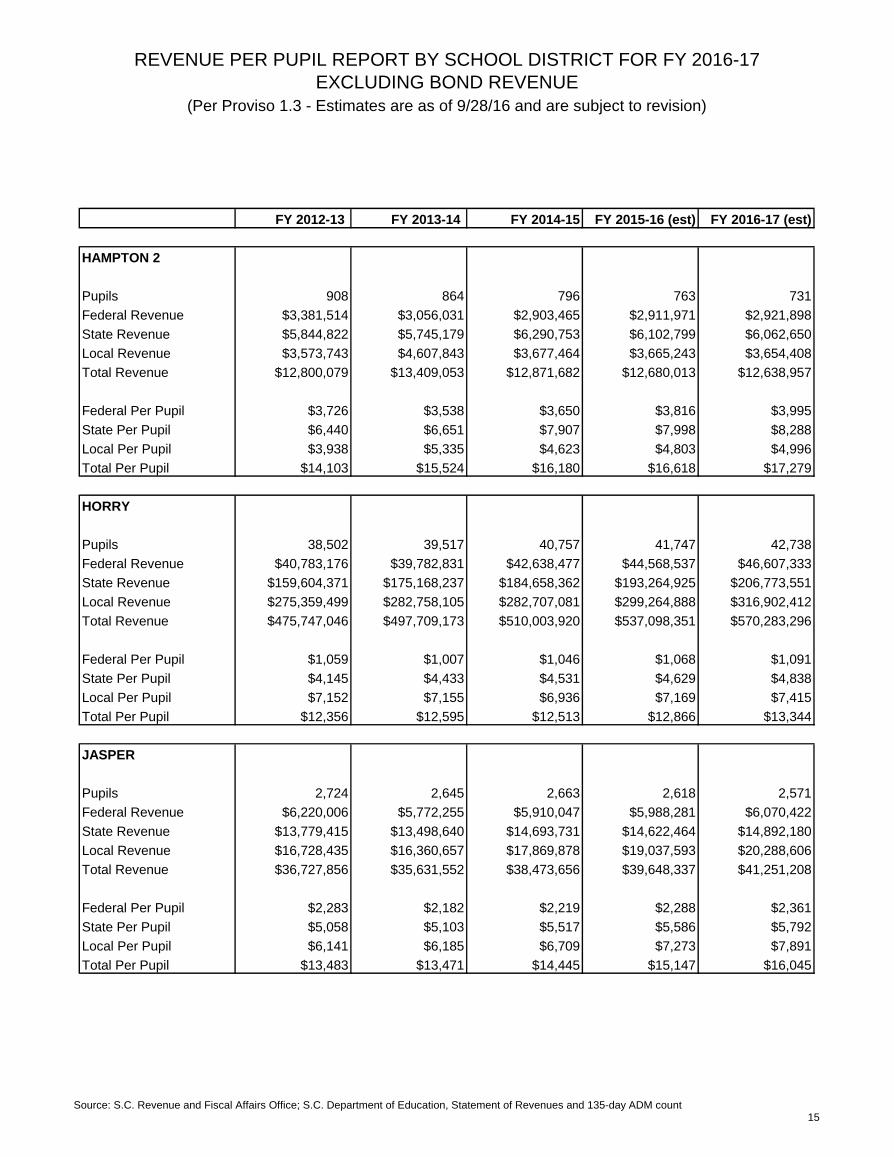
HAMPTON 2
Pupils 908 864 796 763 731
Federal Revenue $3,381,514 $3,056,031 $2,903,465 $2,911,971 $2,921,898
State Revenue $5,844,822 $5,745,179 $6,290,753 $6,102,799 $6,062,650
Local Revenue $3,573,743 $4,607,843 $3,677,464 $3,665,243 $3,654,408
Total Revenue $12,800,079 $13,409,053 $12,871,682 $12,680,013 $12,638,957
Federal Per Pupil $3,726 $3,538 $3,650 $3,816 $3,995
State Per Pupil $6,440 $6,651 $7,907 $7,998 $8,288
Local Per Pupil $3,938 $5,335 $4,623 $4,803 $4,996
Total Per Pupil $14,103 $15,524 $16,180 $16,618 $17,279
HORRY
Pupils 38,502 39,517 40,757 41,747 42,738
Federal Revenue $40,783,176 $39,782,831 $42,638,477 $44,568,537 $46,607,333
State Revenue $159,604,371 $175,168,237 $184,658,362 $193,264,925 $206,773,551
Local Revenue $275,359,499 $282,758,105 $282,707,081 $299,264,888 $316,902,412
Total Revenue $475,747,046 $497,709,173 $510,003,920 $537,098,351 $570,283,296
Federal Per Pupil $1,059 $1,007 $1,046 $1,068 $1,091
State Per Pupil $4,145 $4,433 $4,531 $4,629 $4,838
Local Per Pupil $7,152 $7,155 $6,936 $7,169 $7,415
Total Per Pupil $12,356 $12,595 $12,513 $12,866 $13,344
JASPER
Pupils 2,724 2,645 2,663 2,618 2,571
Federal Revenue $6,220,006 $5,772,255 $5,910,047 $5,988,281 $6,070,422
State Revenue $13,779,415 $13,498,640 $14,693,731 $14,622,464 $14,892,180
Local Revenue $16,728,435 $16,360,657 $17,869,878 $19,037,593 $20,288,606
Total Revenue $36,727,856 $35,631,552 $38,473,656 $39,648,337 $41,251,208
Federal Per Pupil $2,283 $2,182 $2,219 $2,288 $2,361
State Per Pupil $5,058 $5,103 $5,517 $5,586 $5,792
Local Per Pupil $6,141 $6,185 $6,709 $7,273 $7,891
Total Per Pupil $13,483 $13,471 $14,445 $15,147 $16,045
Source: S.C. Revenue and Fiscal Affairs Office; S.C. Department of Education, Statement of Revenues and 135-day ADM count15

REVENUE PER PUPIL REPORT BY SCHOOL DISTRICT FOR FY 2016-17
EXCLUDING BOND REVENUE
(Per Proviso 1.3 - Estimates are as of 9/28/16 and are subject to revision)
FY 2012-13 FY 2013-14 FY 2014-15 FY 2015-16 (est) FY 2016-17 (est)
KERSHAW
Pupils 10,192 10,281 10,342 10,376 10,405
Federal Revenue $11,371,592 $11,240,001 $11,341,822 $11,656,658 $11,985,823
State Revenue $54,450,903 $56,147,251 $58,807,965 $59,915,141 $62,438,728
Local Revenue $40,151,711 $39,774,462 $40,217,097 $41,548,748 $42,939,757
Total Revenue $105,974,206 $107,161,714 $110,366,884 $113,120,547 $117,364,309
Federal Per Pupil $1,116 $1,093 $1,097 $1,123 $1,152
State Per Pupil $5,343 $5,461 $5,686 $5,774 $6,001
Local Per Pupil $3,940 $3,869 $3,889 $4,004 $4,127
Total Per Pupil $10,398 $10,423 $10,672 $10,902 $11,279
LANCASTER
Pupils 11,581 11,742 12,094 12,420 12,748
Federal Revenue $13,694,840 $14,372,159 $14,460,328 $14,821,002 $15,197,779
State Revenue $60,611,227 $60,811,596 $64,652,620 $66,251,521 $69,433,070
Local Revenue $43,616,021 $43,591,219 $47,000,442 $48,702,577 $50,484,247
Total Revenue $117,922,088 $118,774,974 $126,113,390 $129,775,100 $135,115,096
Federal Per Pupil $1,183 $1,224 $1,196 $1,193 $1,192
State Per Pupil $5,234 $5,179 $5,346 $5,334 $5,447
Local Per Pupil $3,766 $3,712 $3,886 $3,921 $3,960
Total Per Pupil $10,182 $10,115 $10,427 $10,449 $10,599
LAURENS 55
Pupils 5,554 5,624 5,786 5,699 5,610
Federal Revenue $7,084,341 $7,268,153 $7,519,304 $7,684,473 $7,856,955
State Revenue $30,138,150 $31,223,267 $34,301,788 $35,040,274 $36,610,819
Local Revenue $18,727,106 $19,214,867 $20,345,637 $20,922,229 $21,522,849
Total Revenue $55,949,597 $57,706,287 $62,166,729 $63,646,976 $65,990,622
Federal Per Pupil $1,275 $1,292 $1,300 $1,348 $1,400
State Per Pupil $5,426 $5,552 $5,928 $6,148 $6,526
Local Per Pupil $3,372 $3,417 $3,516 $3,671 $3,836
Total Per Pupil $10,073 $10,261 $10,744 $11,168 $11,763
Source: S.C. Revenue and Fiscal Affairs Office; S.C. Department of Education, Statement of Revenues and 135-day ADM count16

REVENUE PER PUPIL REPORT BY SCHOOL DISTRICT FOR FY 2016-17
EXCLUDING BOND REVENUE
(Per Proviso 1.3 - Estimates are as of 9/28/16 and are subject to revision)
FY 2012-13 FY 2013-14 FY 2014-15 FY 2015-16 (est) FY 2016-17 (est)
LAURENS 56
Pupils 2,911 2,933 2,970 2,996 3,021
Federal Revenue $6,421,968 $7,687,313 $8,643,397 $9,288,507 $9,986,220
State Revenue $16,576,474 $16,744,031 $17,830,431 $17,955,697 $18,500,102
Local Revenue $10,322,839 $10,821,002 $10,966,955 $11,288,474 $11,623,567
Total Revenue $33,321,281 $35,252,346 $37,440,783 $38,532,679 $40,109,889
Federal Per Pupil $2,206 $2,621 $2,910 $3,100 $3,305
State Per Pupil $5,694 $5,708 $6,003 $5,992 $6,123
Local Per Pupil $3,546 $3,689 $3,692 $3,767 $3,847
Total Per Pupil $11,446 $12,017 $12,605 $12,859 $13,276
LEE
Pupils 2,133 2,116 2,046 2,047 2,048
Federal Revenue $4,753,267 $4,522,015 $4,960,905 $4,913,961 $4,869,817
State Revenue $13,670,945 $13,646,618 $15,563,236 $15,505,867 $15,809,925
Local Revenue $6,304,150 $6,308,189 $6,237,138 $6,225,116 $6,215,403
Total Revenue $24,728,362 $24,476,822 $26,761,279 $26,644,944 $26,895,146
Federal Per Pupil $2,228 $2,137 $2,425 $2,400 $2,378
State Per Pupil $6,409 $6,450 $7,607 $7,573 $7,719
Local Per Pupil $2,956 $2,982 $3,049 $3,040 $3,035
Total Per Pupil $11,593 $11,569 $13,081 $13,013 $13,132
LEXINGTON 1
Pupils 22,935 23,363 23,953 24,418 24,879
Federal Revenue $12,210,996 $13,089,271 $14,853,030 $15,387,504 $15,948,589
State Revenue $140,517,054 $144,532,679 $152,214,813 $160,679,891 $173,357,618
Local Revenue $115,628,358 $120,857,793 $132,214,390 $139,540,134 $147,323,049
Total Revenue $268,356,408 $278,479,743 $299,282,233 $315,607,529 $336,629,256
Federal Per Pupil $532 $560 $620 $630 $641
State Per Pupil $6,127 $6,186 $6,355 $6,580 $6,968
Local Per Pupil $5,041 $5,173 $5,520 $5,715 $5,922
Total Per Pupil $11,701 $11,919 $12,495 $12,925 $13,530
Source: S.C. Revenue and Fiscal Affairs Office; S.C. Department of Education, Statement of Revenues and 135-day ADM count17

REVENUE PER PUPIL REPORT BY SCHOOL DISTRICT FOR FY 2016-17
EXCLUDING BOND REVENUE
(Per Proviso 1.3 - Estimates are as of 9/28/16 and are subject to revision)
FY 2012-13 FY 2013-14 FY 2014-15 FY 2015-16 (est) FY 2016-17 (est)
LEXINGTON 2
Pupils 8,522 8,653 8,639 8,643 8,643
Federal Revenue $9,407,590 $10,314,087 $9,569,782 $10,153,622 $10,777,950
State Revenue $45,556,107 $46,138,527 $49,991,318 $50,700,093 $52,599,873
Local Revenue $38,685,358 $38,767,924 $40,026,473 $41,192,215 $42,407,043
Total Revenue $93,649,055 $95,220,538 $99,587,573 $102,045,930 $105,784,867
Federal Per Pupil $1,104 $1,192 $1,108 $1,175 $1,247
State Per Pupil $5,345 $5,332 $5,787 $5,866 $6,086
Local Per Pupil $4,539 $4,480 $4,633 $4,766 $4,907
Total Per Pupil $10,989 $11,004 $11,528 $11,807 $12,240
LEXINGTON 3
Pupils 1,880 1,875 1,903 1,926 1,948
Federal Revenue $2,658,176 $2,497,542 $2,694,902 $2,708,998 $2,724,466
State Revenue $12,178,072 $12,433,837 $13,014,241 $13,186,356 $13,667,898
Local Revenue $9,856,467 $9,913,849 $10,518,276 $10,687,488 $10,863,349
Total Revenue $24,692,715 $24,845,228 $26,227,419 $26,582,841 $27,255,713
Federal Per Pupil $1,414 $1,332 $1,416 $1,406 $1,398
State Per Pupil $6,479 $6,630 $6,837 $6,845 $7,015
Local Per Pupil $5,244 $5,286 $5,526 $5,548 $5,575
Total Per Pupil $13,137 $13,248 $13,779 $13,800 $13,988
LEXINGTON 4
Pupils 3,139 3,102 3,098 3,103 3,107
Federal Revenue $3,829,783 $4,156,865 $4,454,597 $4,533,377 $4,615,724
State Revenue $20,708,794 $20,212,157 $21,980,016 $22,580,813 $23,723,968
Local Revenue $10,927,799 $11,363,465 $10,746,443 $10,937,360 $11,135,687
Total Revenue $35,466,376 $35,732,487 $37,181,056 $38,051,549 $39,475,378
Federal Per Pupil $1,220 $1,340 $1,438 $1,461 $1,486
State Per Pupil $6,597 $6,516 $7,095 $7,276 $7,635
Local Per Pupil $3,481 $3,663 $3,469 $3,524 $3,584
Total Per Pupil $11,298 $11,519 $12,002 $12,262 $12,705
Source: S.C. Revenue and Fiscal Affairs Office; S.C. Department of Education, Statement of Revenues and 135-day ADM count18

REVENUE PER PUPIL REPORT BY SCHOOL DISTRICT FOR FY 2016-17
EXCLUDING BOND REVENUE
(Per Proviso 1.3 - Estimates are as of 9/28/16 and are subject to revision)
FY 2012-13 FY 2013-14 FY 2014-15 FY 2015-16 (est) FY 2016-17 (est)
LEXINGTON 5
Pupils 16,238 16,321 16,461 16,622 16,775
Federal Revenue $12,600,611 $14,620,869 $15,051,246 $15,620,372 $16,218,507
State Revenue $106,153,586 $108,548,856 $112,187,990 $116,815,890 $124,355,286
Local Revenue $89,387,512 $93,618,244 $97,101,046 $99,627,846 $102,257,003
Total Revenue $208,141,709 $216,787,969 $224,340,282 $232,064,108 $242,830,796
Federal Per Pupil $776 $896 $914 $940 $967
State Per Pupil $6,538 $6,651 $6,815 $7,028 $7,413
Local Per Pupil $5,505 $5,736 $5,899 $5,994 $6,096
Total Per Pupil $12,819 $13,283 $13,629 $13,961 $14,475
MARION 10
Pupils 4,928 4,883 4,775 4,719 4,661
Federal Revenue $10,002,158 $9,757,887 $8,980,501 $8,678,440 $8,390,700
State Revenue $28,666,034 $27,786,042 $28,129,094 $27,784,815 $28,092,039
Local Revenue $11,638,974 $11,186,153 $11,066,162 $10,995,140 $10,928,613
Total Revenue $50,307,166 $48,730,082 $48,175,757 $47,458,395 $47,411,352
Federal Per Pupil $2,030 $1,998 $1,881 $1,839 $1,800
State Per Pupil $5,817 $5,690 $5,891 $5,888 $6,027
Local Per Pupil $2,362 $2,291 $2,317 $2,330 $2,345
Total Per Pupil $10,209 $9,979 $10,089 $10,057 $10,172
MARLBORO
Pupils 4,118 4,063 4,019 3,954 3,888
Federal Revenue $8,406,398 $7,253,694 $8,033,541 $8,095,353 $8,161,522
State Revenue $23,363,365 $23,583,117 $25,012,437 $24,948,795 $25,466,503
Local Revenue $11,871,533 $13,972,999 $13,696,731 $13,909,303 $14,130,285
Total Revenue $43,641,296 $44,809,810 $46,742,709 $46,953,451 $47,758,310
Federal Per Pupil $2,041 $1,786 $1,999 $2,047 $2,099
State Per Pupil $5,673 $5,805 $6,223 $6,310 $6,550
Local Per Pupil $2,883 $3,439 $3,408 $3,518 $3,634
Total Per Pupil $10,598 $11,030 $11,630 $11,874 $12,283
Source: S.C. Revenue and Fiscal Affairs Office; S.C. Department of Education, Statement of Revenues and 135-day ADM count19

REVENUE PER PUPIL REPORT BY SCHOOL DISTRICT FOR FY 2016-17
EXCLUDING BOND REVENUE
(Per Proviso 1.3 - Estimates are as of 9/28/16 and are subject to revision)
FY 2012-13 FY 2013-14 FY 2014-15 FY 2015-16 (est) FY 2016-17 (est)
MCCORMICK
Pupils 777 765 778 750 723
Federal Revenue $1,677,274 $1,623,685 $1,639,700 $1,596,757 $1,555,703
State Revenue $5,932,197 $5,820,406 $6,257,780 $6,389,817 $6,673,473
Local Revenue $5,470,062 $5,516,753 $5,075,810 $5,061,776 $5,049,641
Total Revenue $13,079,533 $12,960,844 $12,973,290 $13,048,350 $13,278,817
Federal Per Pupil $2,160 $2,121 $2,108 $2,128 $2,151
State Per Pupil $7,638 $7,604 $8,043 $8,516 $9,227
Local Per Pupil $7,043 $7,207 $6,524 $6,746 $6,982
Total Per Pupil $16,841 $16,933 $16,675 $17,390 $18,360
NEWBERRY
Pupils 5,717 5,846 5,888 5,889 5,886
Federal Revenue $7,946,454 $7,870,895 $7,632,015 $7,746,565 $7,866,549
State Revenue $32,308,549 $33,578,664 $35,408,525 $36,080,764 $37,606,173
Local Revenue $27,999,263 $27,851,884 $29,885,582 $30,811,969 $31,778,391
Total Revenue $68,254,266 $69,301,443 $72,926,122 $74,639,298 $77,251,113
Federal Per Pupil $1,390 $1,346 $1,296 $1,316 $1,336
State Per Pupil $5,651 $5,744 $6,014 $6,127 $6,389
Local Per Pupil $4,897 $4,764 $5,076 $5,232 $5,399
Total Per Pupil $11,938 $11,854 $12,385 $12,675 $13,124
OCONEE
Pupils 10,442 10,169 10,098 10,056 10,009
Federal Revenue $10,922,359 $10,656,317 $10,761,420 $10,931,725 $11,109,967
State Revenue $48,543,767 $49,509,366 $52,019,041 $52,973,190 $55,178,715
Local Revenue $64,209,131 $66,554,742 $65,929,261 $67,323,429 $68,771,812
Total Revenue $123,675,257 $126,720,425 $128,709,722 $131,228,344 $135,060,494
Federal Per Pupil $1,046 $1,048 $1,066 $1,087 $1,110
State Per Pupil $4,649 $4,869 $5,151 $5,268 $5,513
Local Per Pupil $6,149 $6,545 $6,529 $6,695 $6,871
Total Per Pupil $11,844 $12,462 $12,746 $13,049 $13,493
Source: S.C. Revenue and Fiscal Affairs Office; S.C. Department of Education, Statement of Revenues and 135-day ADM count20

REVENUE PER PUPIL REPORT BY SCHOOL DISTRICT FOR FY 2016-17
EXCLUDING BOND REVENUE
(Per Proviso 1.3 - Estimates are as of 9/28/16 and are subject to revision)
FY 2012-13 FY 2013-14 FY 2014-15 FY 2015-16 (est) FY 2016-17 (est)
ORANGEBURG 3
Pupils 2,839 2,784 2,796 2,758 2,719
Federal Revenue $8,633,633 $7,540,659 $7,566,872 $7,838,251 $8,123,121
State Revenue $16,262,440 $16,212,980 $17,606,250 $17,517,092 $17,836,456
Local Revenue $14,676,815 $16,511,272 $16,941,652 $17,279,601 $17,630,640
Total Revenue $39,572,888 $40,264,911 $42,114,774 $42,634,944 $43,590,217
Federal Per Pupil $3,041 $2,708 $2,706 $2,842 $2,987
State Per Pupil $5,729 $5,823 $6,297 $6,351 $6,560
Local Per Pupil $5,170 $5,930 $6,059 $6,265 $6,484
Total Per Pupil $13,941 $14,462 $15,062 $15,458 $16,031
ORANGEBURG 4
Pupils 3,714 3,669 3,716 3,647 3,577
Federal Revenue $5,319,614 $4,969,757 $5,297,336 $5,384,065 $5,474,795
State Revenue $18,892,182 $19,243,025 $20,302,020 $20,390,858 $20,955,075
Local Revenue $15,045,983 $15,662,114 $17,533,724 $17,799,899 $18,076,654
Total Revenue $39,257,779 $39,874,896 $43,133,080 $43,574,821 $44,506,523
Federal Per Pupil $1,432 $1,355 $1,426 $1,476 $1,530
State Per Pupil $5,086 $5,245 $5,463 $5,591 $5,858
Local Per Pupil $4,051 $4,269 $4,718 $4,881 $5,053
Total Per Pupil $10,569 $10,869 $11,607 $11,948 $12,442
ORANGEBURG 5
Pupils 6,413 6,395 6,475 6,275 6,078
Federal Revenue $13,649,859 $11,922,016 $11,531,149 $11,716,143 $11,909,723
State Revenue $37,229,444 $37,684,264 $42,086,650 $42,268,839 $43,436,440
Local Revenue $31,173,680 $31,214,525 $32,407,174 $32,565,493 $32,736,549
Total Revenue $82,052,983 $80,820,805 $86,024,973 $86,550,475 $88,082,712
Federal Per Pupil $2,128 $1,864 $1,781 $1,867 $1,959
State Per Pupil $5,805 $5,893 $6,500 $6,736 $7,146
Local Per Pupil $4,861 $4,881 $5,005 $5,190 $5,386
Total Per Pupil $12,794 $12,638 $13,286 $13,792 $14,491
Source: S.C. Revenue and Fiscal Affairs Office; S.C. Department of Education, Statement of Revenues and 135-day ADM count21

REVENUE PER PUPIL REPORT BY SCHOOL DISTRICT FOR FY 2016-17
EXCLUDING BOND REVENUE
(Per Proviso 1.3 - Estimates are as of 9/28/16 and are subject to revision)
FY 2012-13 FY 2013-14 FY 2014-15 FY 2015-16 (est) FY 2016-17 (est)
PICKENS
Pupils 16,107 16,139 16,081 16,011 15,934
Federal Revenue $15,251,431 $13,605,110 $14,134,447 $14,453,820 $14,787,340
State Revenue $79,982,810 $80,289,716 $84,005,966 $85,450,182 $88,909,585
Local Revenue $65,110,533 $67,276,786 $69,271,391 $72,263,532 $75,411,467
Total Revenue $160,344,774 $161,171,612 $167,411,804 $172,167,535 $179,108,391
Federal Per Pupil $947 $843 $879 $903 $928
State Per Pupil $4,966 $4,975 $5,224 $5,337 $5,580
Local Per Pupil $4,042 $4,169 $4,308 $4,513 $4,733
Total Per Pupil $9,955 $9,986 $10,411 $10,753 $11,241
RICHLAND 1
Pupils 22,849 23,033 23,293 23,101 22,898
Federal Revenue $37,087,934 $31,601,760 $35,289,297 $35,636,283 $36,003,767
State Revenue $112,056,675 $117,290,986 $122,939,027 $123,068,700 $126,065,362
Local Revenue $216,910,958 $230,169,097 $226,183,249 $233,259,232 $240,642,279
Total Revenue $366,055,567 $379,061,843 $384,411,573 $391,964,214 $402,711,407
Federal Per Pupil $1,623 $1,372 $1,515 $1,543 $1,572
State Per Pupil $4,904 $5,092 $5,278 $5,327 $5,506
Local Per Pupil $9,493 $9,993 $9,710 $10,098 $10,510
Total Per Pupil $16,020 $16,457 $16,503 $16,968 $17,588
RICHLAND 2
Pupils 25,866 26,081 26,530 26,688 26,832
Federal Revenue $24,244,758 $25,676,114 $30,770,454 $33,556,193 $36,610,221
State Revenue $153,673,160 $158,892,477 $164,477,656 $175,084,343 $190,452,170
Local Revenue $143,033,584 $150,378,718 $157,319,025 $165,614,224 $174,407,662
Total Revenue $320,951,502 $334,947,309 $352,567,135 $374,254,760 $401,470,054
Federal Per Pupil $937 $984 $1,160 $1,257 $1,364
State Per Pupil $5,941 $6,092 $6,200 $6,561 $7,098
Local Per Pupil $5,530 $5,766 $5,930 $6,206 $6,500
Total Per Pupil $12,408 $12,843 $13,289 $14,024 $14,962
Source: S.C. Revenue and Fiscal Affairs Office; S.C. Department of Education, Statement of Revenues and 135-day ADM count22

REVENUE PER PUPIL REPORT BY SCHOOL DISTRICT FOR FY 2016-17
EXCLUDING BOND REVENUE
(Per Proviso 1.3 - Estimates are as of 9/28/16 and are subject to revision)
FY 2012-13 FY 2013-14 FY 2014-15 FY 2015-16 (est) FY 2016-17 (est)
SALUDA * (See Notes)
Pupils 2,110 2,092 2,117 2,628 2,659
Federal Revenue $3,349,197 $3,294,204 $3,500,292 $4,407,055 $4,459,940
State Revenue $12,130,932 $12,048,891 $12,491,445 $15,353,038 $16,982,559
Local Revenue $6,139,171 $6,591,557 $6,558,182 $7,888,791 $7,983,456
Total Revenue $21,619,300 $21,934,652 $22,549,919 $27,648,884 $29,425,955
Federal Per Pupil $1,587 $1,575 $1,653 $1,677 $1,677
State Per Pupil $5,750 $5,761 $5,900 $5,842 $6,386
Local Per Pupil $2,910 $3,151 $3,097 $3,002 $3,002
Total Per Pupil $10,247 $10,487 $10,650 $10,521 $11,065
SPARTANBURG 1
Pupils 4,836 4,724 4,883 4,787 4,691
Federal Revenue $4,427,418 $4,204,544 $4,527,321 $4,670,671 $4,820,800
State Revenue $29,672,260 $29,567,532 $31,325,269 $32,509,880 $34,496,444
Local Revenue $18,675,688 $18,931,244 $19,465,404 $19,889,700 $20,330,552
Total Revenue $52,775,366 $52,703,320 $55,317,994 $57,070,251 $59,647,795
Federal Per Pupil $916 $890 $927 $976 $1,028
State Per Pupil $6,136 $6,259 $6,415 $6,791 $7,353
Local Per Pupil $3,862 $4,007 $3,986 $4,155 $4,334
Total Per Pupil $10,913 $11,156 $11,329 $11,921 $12,714
SPARTANBURG 2
Pupils 9,730 9,730 9,745 9,662 9,574
Federal Revenue $7,564,714 $8,244,730 $7,815,583 $8,200,749 $8,608,829
State Revenue $53,429,023 $54,008,665 $56,961,514 $59,424,474 $63,377,885
Local Revenue $29,426,686 $30,235,269 $33,621,033 $34,784,129 $36,000,241
Total Revenue $90,420,423 $92,488,664 $98,398,130 $102,409,352 $107,986,956
Federal Per Pupil $777 $847 $802 $849 $899
State Per Pupil $5,491 $5,551 $5,845 $6,151 $6,620
Local Per Pupil $3,024 $3,107 $3,450 $3,600 $3,760
Total Per Pupil $9,293 $9,505 $10,097 $10,600 $11,280
Source: S.C. Revenue and Fiscal Affairs Office; S.C. Department of Education, Statement of Revenues and 135-day ADM count23

REVENUE PER PUPIL REPORT BY SCHOOL DISTRICT FOR FY 2016-17
EXCLUDING BOND REVENUE
(Per Proviso 1.3 - Estimates are as of 9/28/16 and are subject to revision)
FY 2012-13 FY 2013-14 FY 2014-15 FY 2015-16 (est) FY 2016-17 (est)
SPARTANBURG 3
Pupils 2,824 2,759 2,841 2,796 2,751
Federal Revenue $2,593,944 $2,819,380 $3,388,962 $3,456,277 $3,526,586
State Revenue $16,611,327 $16,287,098 $17,665,684 $18,064,162 $18,892,376
Local Revenue $14,562,552 $15,435,645 $15,531,844 $15,718,854 $15,913,890
Total Revenue $33,767,823 $34,542,123 $36,586,490 $37,239,292 $38,332,853
Federal Per Pupil $918 $1,022 $1,193 $1,236 $1,282
State Per Pupil $5,881 $5,902 $6,218 $6,460 $6,867
Local Per Pupil $5,156 $5,594 $5,467 $5,621 $5,785
Total Per Pupil $11,956 $12,518 $12,879 $13,317 $13,934
SPARTANBURG 4
Pupils 2,658 2,616 2,623 2,635 2,647
Federal Revenue $2,608,422 $2,827,574 $2,629,947 $2,720,079 $2,814,604
State Revenue $14,388,620 $14,280,060 $15,475,170 $15,748,986 $16,394,481
Local Revenue $7,329,558 $7,615,697 $9,216,849 $9,335,148 $9,458,395
Total Revenue $24,326,600 $24,723,331 $27,321,966 $27,804,213 $28,667,480
Federal Per Pupil $981 $1,081 $1,003 $1,032 $1,063
State Per Pupil $5,413 $5,459 $5,900 $5,976 $6,194
Local Per Pupil $2,757 $2,911 $3,514 $3,542 $3,574
Total Per Pupil $9,151 $9,452 $10,417 $10,550 $10,831
SPARTANBURG 5
Pupils 7,538 7,692 7,820 7,838 7,852
Federal Revenue $5,279,609 $5,766,254 $5,937,717 $6,084,757 $6,238,356
State Revenue $39,685,777 $40,414,115 $42,370,810 $44,624,325 $48,036,910
Local Revenue $38,169,127 $40,513,463 $41,823,841 $43,177,970 $44,591,804
Total Revenue $83,134,513 $86,693,832 $90,132,368 $93,887,052 $98,867,071
Federal Per Pupil $700 $750 $759 $776 $795
State Per Pupil $5,265 $5,254 $5,418 $5,693 $6,118
Local Per Pupil $5,064 $5,267 $5,348 $5,509 $5,679
Total Per Pupil $11,029 $11,271 $11,526 $11,979 $12,592
Source: S.C. Revenue and Fiscal Affairs Office; S.C. Department of Education, Statement of Revenues and 135-day ADM count24

REVENUE PER PUPIL REPORT BY SCHOOL DISTRICT FOR FY 2016-17
EXCLUDING BOND REVENUE
(Per Proviso 1.3 - Estimates are as of 9/28/16 and are subject to revision)
FY 2012-13 FY 2013-14 FY 2014-15 FY 2015-16 (est) FY 2016-17 (est)
SPARTANBURG 6
Pupils 10,602 10,779 10,769 10,827 10,879
Federal Revenue $8,900,542 $9,466,175 $9,051,920 $9,427,136 $9,822,426
State Revenue $55,706,210 $57,821,067 $59,777,949 $62,251,892 $66,278,038
Local Revenue $41,842,966 $44,232,546 $46,938,703 $48,046,516 $49,198,127
Total Revenue $106,449,718 $111,519,788 $115,768,572 $119,725,544 $125,298,591
Federal Per Pupil $840 $878 $841 $871 $903
State Per Pupil $5,254 $5,364 $5,551 $5,750 $6,092
Local Per Pupil $3,947 $4,104 $4,359 $4,438 $4,522
Total Per Pupil $10,041 $10,346 $10,750 $11,058 $11,518
SPARTANBURG 7
Pupils 6,822 6,866 6,781 6,798 6,811
Federal Revenue $12,847,330 $11,101,771 $11,096,365 $11,178,905 $11,267,420
State Revenue $43,783,407 $43,668,136 $45,143,649 $45,015,595 $45,936,554
Local Revenue $49,584,099 $51,003,396 $55,084,761 $56,695,925 $58,375,043
Total Revenue $106,214,836 $105,773,303 $111,324,775 $112,890,425 $115,579,016
Federal Per Pupil $1,883 $1,617 $1,636 $1,645 $1,654
State Per Pupil $6,418 $6,360 $6,658 $6,622 $6,745
Local Per Pupil $7,268 $7,429 $8,124 $8,341 $8,571
Total Per Pupil $15,570 $15,406 $16,418 $16,607 $16,970
SUMTER 1
Pupils 16,275 16,141 16,314 16,511 16,702
Federal Revenue $21,637,619 $23,209,530 $24,627,977 $24,689,375 $24,762,764
State Revenue $86,151,017 $87,320,175 $95,160,740 $96,263,025 $99,620,364
Local Revenue $51,501,794 $52,672,088 $53,821,423 $54,970,957 $56,165,239
Total Revenue $159,290,430 $163,201,793 $173,610,140 $175,923,357 $180,548,367
Federal Per Pupil $1,330 $1,438 $1,510 $1,495 $1,483
State Per Pupil $5,294 $5,410 $5,833 $5,830 $5,965
Local Per Pupil $3,165 $3,263 $3,299 $3,329 $3,363
Total Per Pupil $9,788 $10,111 $10,642 $10,655 $10,810
Source: S.C. Revenue and Fiscal Affairs Office; S.C. Department of Education, Statement of Revenues and 135-day ADM count25
REVENUE PER PUPIL REPORT BY SCHOOL DISTRICT FOR FY 2016-17
EXCLUDING BOND REVENUE
(Per Proviso 1.3 - Estimates are as of 9/28/16 and are subject to revision)
FY 2012-13 FY 2013-14 FY 2014-15 FY 2015-16 (est) FY 2016-17 (est)
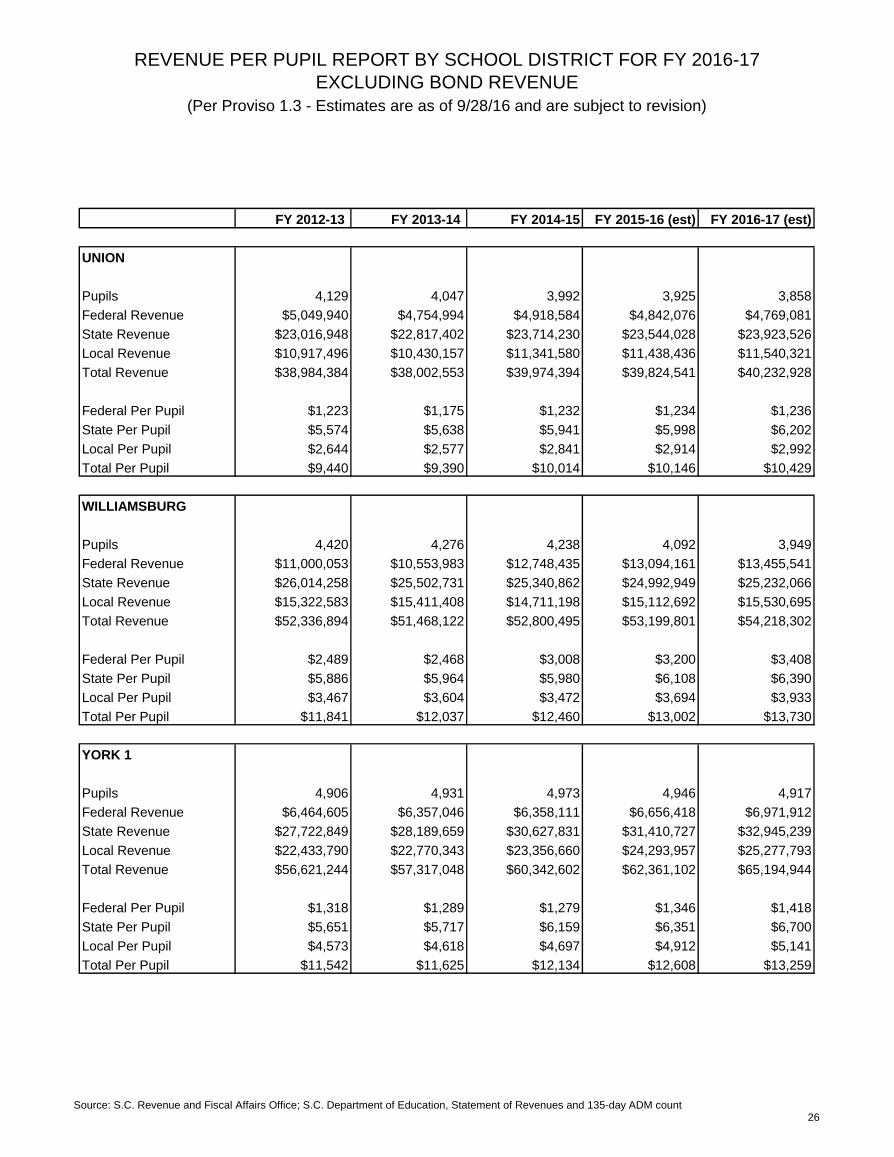
UNION
Pupils 4,129 4,047 3,992 3,925 3,858
Federal Revenue $5,049,940 $4,754,994 $4,918,584 $4,842,076 $4,769,081
State Revenue $23,016,948 $22,817,402 $23,714,230 $23,544,028 $23,923,526
Local Revenue $10,917,496 $10,430,157 $11,341,580 $11,438,436 $11,540,321
Total Revenue $38,984,384 $38,002,553 $39,974,394 $39,824,541 $40,232,928
Federal Per Pupil $1,223 $1,175 $1,232 $1,234 $1,236
State Per Pupil $5,574 $5,638 $5,941 $5,998 $6,202
Local Per Pupil $2,644 $2,577 $2,841 $2,914 $2,992
Total Per Pupil $9,440 $9,390 $10,014 $10,146 $10,429
WILLIAMSBURG
Pupils 4,420 4,276 4,238 4,092 3,949
Federal Revenue $11,000,053 $10,553,983 $12,748,435 $13,094,161 $13,455,541
State Revenue $26,014,258 $25,502,731 $25,340,862 $24,992,949 $25,232,066
Local Revenue $15,322,583 $15,411,408 $14,711,198 $15,112,692 $15,530,695
Total Revenue $52,336,894 $51,468,122 $52,800,495 $53,199,801 $54,218,302
Federal Per Pupil $2,489 $2,468 $3,008 $3,200 $3,408
State Per Pupil $5,886 $5,964 $5,980 $6,108 $6,390
Local Per Pupil $3,467 $3,604 $3,472 $3,694 $3,933
Total Per Pupil $11,841 $12,037 $12,460 $13,002 $13,730
YORK 1
Pupils 4,906 4,931 4,973 4,946 4,917
Federal Revenue $6,464,605 $6,357,046 $6,358,111 $6,656,418 $6,971,912
State Revenue $27,722,849 $28,189,659 $30,627,831 $31,410,727 $32,945,239
Local Revenue $22,433,790 $22,770,343 $23,356,660 $24,293,957 $25,277,793
Total Revenue $56,621,244 $57,317,048 $60,342,602 $62,361,102 $65,194,944
Federal Per Pupil $1,318 $1,289 $1,279 $1,346 $1,418
State Per Pupil $5,651 $5,717 $6,159 $6,351 $6,700
Local Per Pupil $4,573 $4,618 $4,697 $4,912 $5,141
Total Per Pupil $11,542 $11,625 $12,134 $12,608 $13,259
Source: S.C. Revenue and Fiscal Affairs Office; S.C. Department of Education, Statement of Revenues and 135-day ADM count26
REVENUE PER PUPIL REPORT BY SCHOOL DISTRICT FOR FY 2016-17
EXCLUDING BOND REVENUE
(Per Proviso 1.3 - Estimates are as of 9/28/16 and are subject to revision)
FY 2012-13 FY 2013-14 FY 2014-15 FY 2015-16 (est) FY 2016-17 (est)
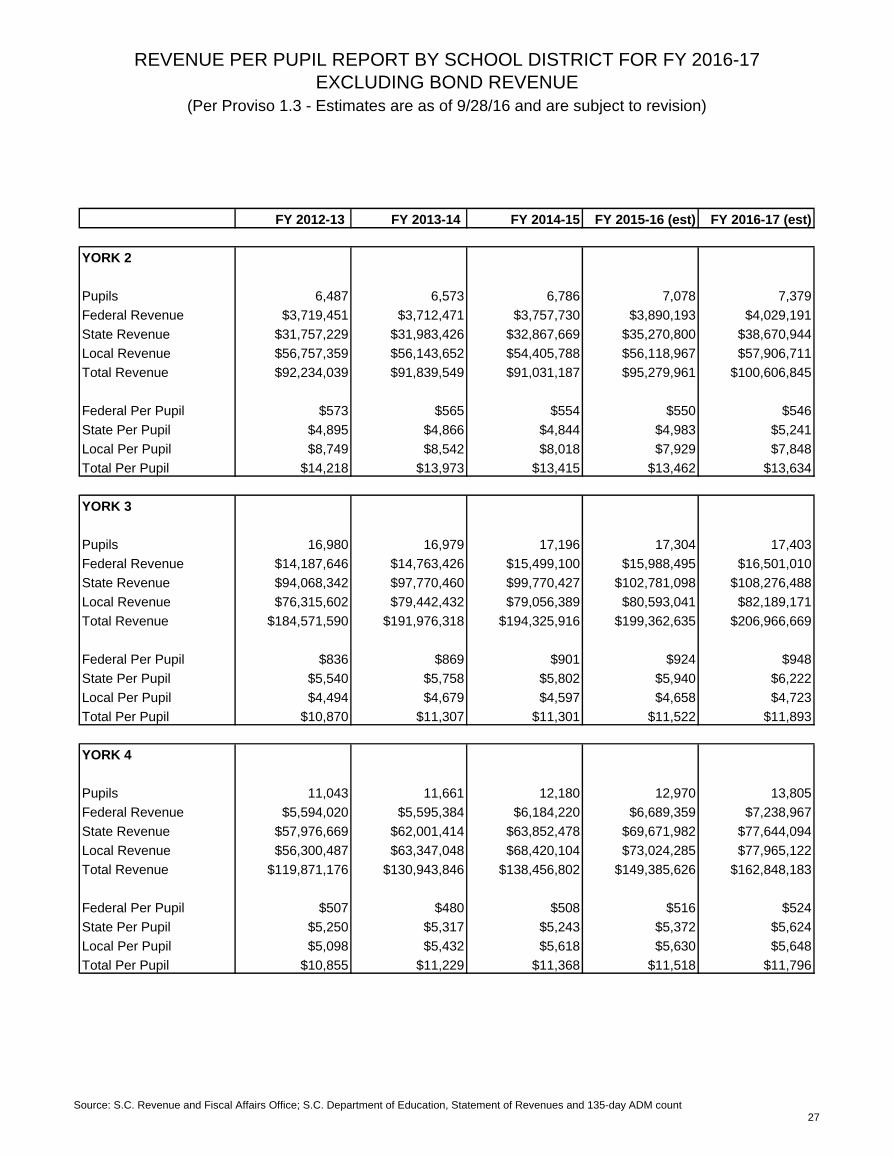
YORK 2
Pupils 6,487 6,573 6,786 7,078 7,379
Federal Revenue $3,719,451 $3,712,471 $3,757,730 $3,890,193 $4,029,191
State Revenue $31,757,229 $31,983,426 $32,867,669 $35,270,800 $38,670,944
Local Revenue $56,757,359 $56,143,652 $54,405,788 $56,118,967 $57,906,711
Total Revenue $92,234,039 $91,839,549 $91,031,187 $95,279,961 $100,606,845
Federal Per Pupil $573 $565 $554 $550 $546
State Per Pupil $4,895 $4,866 $4,844 $4,983 $5,241
Local Per Pupil $8,749 $8,542 $8,018 $7,929 $7,848
Total Per Pupil $14,218 $13,973 $13,415 $13,462 $13,634
YORK 3
Pupils 16,980 16,979 17,196 17,304 17,403
Federal Revenue $14,187,646 $14,763,426 $15,499,100 $15,988,495 $16,501,010
State Revenue $94,068,342 $97,770,460 $99,770,427 $102,781,098 $108,276,488
Local Revenue $76,315,602 $79,442,432 $79,056,389 $80,593,041 $82,189,171
Total Revenue $184,571,590 $191,976,318 $194,325,916 $199,362,635 $206,966,669
Federal Per Pupil $836 $869 $901 $924 $948
State Per Pupil $5,540 $5,758 $5,802 $5,940 $6,222
Local Per Pupil $4,494 $4,679 $4,597 $4,658 $4,723
Total Per Pupil $10,870 $11,307 $11,301 $11,522 $11,893
YORK 4
Pupils 11,043 11,661 12,180 12,970 13,805
Federal Revenue $5,594,020 $5,595,384 $6,184,220 $6,689,359 $7,238,967
State Revenue $57,976,669 $62,001,414 $63,852,478 $69,671,982 $77,644,094
Local Revenue $56,300,487 $63,347,048 $68,420,104 $73,024,285 $77,965,122
Total Revenue $119,871,176 $130,943,846 $138,456,802 $149,385,626 $162,848,183
Federal Per Pupil $507 $480 $508 $516 $524
State Per Pupil $5,250 $5,317 $5,243 $5,372 $5,624
Local Per Pupil $5,098 $5,432 $5,618 $5,630 $5,648
Total Per Pupil $10,855 $11,229 $11,368 $11,518 $11,796
Source: S.C. Revenue and Fiscal Affairs Office; S.C. Department of Education, Statement of Revenues and 135-day ADM count27
REVENUE PER PUPIL REPORT BY SCHOOL DISTRICT FOR FY 2016-17
EXCLUDING BOND REVENUE
(Per Proviso 1.3 - Estimates are as of 9/28/16 and are subject to revision)
FY 2012-13 FY 2013-14 FY 2014-15 FY 2015-16 (est) FY 2016-17 (est)
STATE TOTAL **
Pupils 697,174 702,558 710,996 716,361 721,104
Federal Revenue $832,027,253 $829,971,180 $859,297,012 $883,357,328 $908,091,334
State Revenue $3,628,949,385 $3,721,119,731 $3,917,514,960 $4,034,788,238 $4,249,718,634
Local Revenue $3,507,309,215 $3,622,323,222 $3,759,799,406 $3,876,169,468 $3,997,255,202
Total Revenue $7,968,285,853 $8,173,414,133 $8,536,611,378 $8,794,315,034 $9,155,065,170
Federal Per Pupil $1,193 $1,181 $1,209 $1,233 $1,259
State Per Pupil $5,205 $5,297 $5,510 $5,632 $5,893
Local Per Pupil $5,031 $5,156 $5,288 $5,411 $5,543
Total Per Pupil $11,429 $11,634 $12,007 $12,276 $12,696
Public Charter ***
Pupils 11,499 14,000 17,066 18,352 20,979
Federal Revenue $5,716,727 $6,763,547 $8,438,869 $9,319,732 $10,934,170
State Revenue $73,478,859 $91,290,875 $117,548,748 $130,200,833 $156,712,752
Local Revenue $6,055,387 $4,360,691 $10,287,868 $11,276,514 $13,136,151
Total Revenue $85,250,973 $102,415,113 $136,275,485 $150,797,079 $180,783,073
Federal Per Pupil $497 $483 $494 $508 $521
State Per Pupil $6,390 $6,521 $6,888 $7,095 $7,470
Local Per Pupil $527 $311 $603 $614 $626
Total Per Pupil $7,414 $7,315 $7,985 $8,217 $8,617
*Saluda School District pupil estimate for FY 2016-17 is based on a five-year growth rate due to a significant increase
in the number of pupils in FY 2015-16. State revenue for FY 2015-16 and FY 2016-17 is based on growth rates in
individual categories for state grants, EIA, and EFA funds. Local revenue for FY 2015-16 and FY 2016-17 is based on
a five-year average of local per pupil funding, assuming the district will maintain their local effort funding. Federal
funding for FY 2015-16 and FY 2016-17 is based on a five-year average of the federal per pupil funding.
**Estimates for FY 2015-16 contained in this report have been updated based on revised revenue information.
Statewide estimates for FY 2016-17 provided in Proviso 1.3 of the FY 2016-17 Appropriations Act were based on data
available as of 2/03/16. Estimates for FY 2016-17 have been updated based on revised pupil and revenue information.
***Public Charter estimates are not included in the statewide estimates due to the significant differences in funding
structure. The FY 2013-14 Public Charter School District Statement of Revenues provided to the Department of
Education is restated to align the FY 2013-14 data with past reporting procedures. These revisions provided by the
Public Charter School District are reported in Appendix A. Estimates for the Public Charter School District for
FY 2015-16 and FY 2016-17 are subject to revision upon review by the District.
Notes:
Estimates are based on historical growth rates unless otherwise stated. Actual funding may vary significantly.
Revenue data is from the SC Department of Education's Statement of Revenues.
Revenues exclude intergovernmental revenues (codes: 2000s), interfund transfers (codes: 5200s), revenues from the
sale of bonds (codes: 5100s) and lease purchase revenue (codes: 5500, 5600). Other state property tax revenue
(code 3890) is included in local revenue. Enrollment figures include 5k through grade 12 and do not include 4 year olds.
Revenue figures may include funding for 4 year-old programs.
Source: S.C. Revenue and Fiscal Affairs Office; S.C. Department of Education, Statement of Revenues and 135-day ADM count28

Appendix A
SC PUBLIC CHARTER SCHOOL DISTRICT
FY14 PAYMENTS TO SCHOOLS
FY 2013-14
Statement of
Revenues
SCPCSD
Subtractions
From FY 2013-14
Statement of
Revenues
Line Number From
FY 2013-14 Statement
of Revenues
Amended
FY 2013-14
Revenue
(1) (2) (3) (4)
100 - CHARTER FUNDING 74,392,186 36,617,648.61 line 77, revenue 3138 37,774,537
100 - Contributions & Donations 1,136,737 25,000.00 line 45, revenue 1920 1,111,737
100 - EDUCATION FINANCE ACT
EFA - Kindergarten 1,958,365.50 line 122, revenue 3399
EFA - Primary 5,477,461.92 line 122, revenue 3399
EFA - Elementary 9,243,360.00 line 122, revenue 3399
EFA - High School 10,966,280.96 line 122, revenue 3399
EFA - Trainable Mentally Handicapped 20,606.04 line 122, revenue 3399
EFA - Speech Handicapped 1,064,292.60 line 122, revenue 3399
EFA - Homebound 19,227.60 line 122, revenue 3399
EFA - Emotionally Handicapped 187,082.28 line 122, revenue 3399
EFA - Educable Mentally Handicapped 114,333.66 line 122, revenue 3399
EFA - Learning Disabilities 2,435,610.24 line 122, revenue 3399
EFA - Hearing Handicapped 60,230.52 line 122, revenue 3399
EFA - Visually Handicapped 25,419.87 line 122, revenue 3399
EFA - Orthopedically Handicapped 57,319.92 line 122, revenue 3399
EFA - Vocational 2,331,934.29 line 122, revenue 3399
EFA - Autism 484,434.72 line 122, revenue 3399
TOTAL for line 122, revenue 3399 35,955,712 34,445,960.12 1,509,752
100 - FRINGE BENEFITS ER CONTRIBUTION 10,582,188.01 line 88, revenue 3180
100 - RETIREE INSURANCE 339,579.00 line 88, revenue 3180
TOTAL for line 88, revenue 3180 21,814,338 10,921,767.01 10,892,571
201 - TITLE I 4,564,149 2,337,507.00 line 182, revenue 4310 2,226,642
203 - IDEA 1,097,392.74 line 202, revenue 4510
204 - Extended School Year 902.26 line 202, revenue 4510
TOTAL for line 202, revenue 4510 2,580,782 1,098,295.00 1,482,487
207 - CATE 259,851 129,919.00 line 180, revenue 4210 129,932
267 - Title II 249,787 26,444.17 line 193, revenue 4351 223,343
268 - Teacher Incentive Fund 128,000 83,272.04 line 192, revenue 4348 44,728
280 - Medicaid 8,522 4,131.54 line 46, revenue 1930 4,390
802 - Food Services Program 156,248 10,561.25 line 206, revenue 4810 145,687
311 - PROFESSIONAL DEVELOPMENT 129,009 64,051.71 line 127, revenue 3511 64,957
318 - Formative Assessment 13,653 7,899.52 line 128, revenue 3518 5,753
325 - VOCATIONAL EDUCATION EQUIPMENT 66,007 58,032.00 line 129, revenue 3525 7,975
326 - Science Kits Refurb 80,111 39,677.78 line 130, revenue 3526 40,433
332 - NATIONAL BOARD CERTIFICATION 593,437 289,797.15 line 131, revenue 3532 303,640
333 - TEACHER OF THE YEAR 2,174 1,076.50 line 132, revenue 3533 1,098
338 - AT RISK FUNDING 3,604,803 1,808,007.94 line 133, revenue 3538 1,796,795
340 - 4 YR EARLY CHILDHOOD 227,002 86,521.04 line 134, revenue 3540 140,481
344 - High Achieving 329,398 163,392.14 line 136, revenue 3544 166,006
350 - TEACHER SALARY INCREASE 2,386,652 1,180,824.37 line 137, revenue 3550 1,205,828
355 - EMPLOYERS CONTRIBUTION 312,195 157,004.69 line 139, revenue 3555 155,190
358 - READING 109,423 51,084.30 line 141, revenue 3558 58,339
377 - TEACHER SUPPLIES 308,551 154,550.00 line 144, revenue 3577 154,001
381 - School Nurse Salaries 309,267 247,412.95 line 146, revenue 3581 61,854
385 - Special ED MOE 65,877 32,894.74 line 147, revenue 3585 32,982
392 - SCHOOL TO WORK 65,279 32,969.00 line 149, revenue 3592 32,310
394 - EEDA Supp Programs 43,381 23,514.96 line 150, revenue 3594 19,866
397 - Aid to Districts 1,309,629 653,863.35 line 151, revenue 3597 655,766
926 - Summer Reading 34,164 17,780.28 line 87, revenue 3177 16,384
928 - EEDA CAREER SPECIALISTS 814,960 407,480.00 line 66, revenue 3118 407,480
960 - K-5 ENHANCEMENT Reading Math 590,530 285,103.83 line 156, revenue 3610 305,426
965 - Digital Instruc Materials 124,298 63,905.20 line 157, revenue 3620 60,393
967 - 6-8 ENHANCEMENT TO SCHOOLS 65,205 32,329.81 line 155, revenue 3607 32,875
152,831,317 91,559,679.00 61,271,638
Note: Column 2 - The FY 2013-14 Public Charter School District Statement of Revenues provided to the Department of Education is restated to
align the FY 2013-14 data with past reporting procedures.
Date 4/15/16 29