revealing the structure deformation in multi- component
TRANSCRIPT

Revealing the structure deformation in multi-component lipids by dynamic speckle patternanalysisMajid Panahi
University of ZanjanVahideh Farzam Rad
Institute for Advanced Studies in Basic Sciences (IASBS)Shiva Sasan
University of ZanjanRamin Jamali
Institute for Advanced Studies in Basic Sciences (IASBS)Ali-Reza Moradi
Institute for Advanced Studies in Basic Sciences (IASBS)Ahamd Darudi ( [email protected] )
University of Zanjan
Research Article
Keywords: lipid bilayers, interlayer smectic ordering, dynamic speckle pattern
Posted Date: April 9th, 2021
DOI: https://doi.org/10.21203/rs.3.rs-396278/v1
License: This work is licensed under a Creative Commons Attribution 4.0 International License. Read Full License

Revealing the structure deformation in
multi-component lipids by dynamic speckle pattern
analysis
Majid Panahi1,2, Vahideh Farzam Rad2, Shiva Sasan1, Ramin Jamali2, Ali-Reza Moradi2,3,and Ahamd Darudi1,*
1Department of Physics, Faculty of Science, University of Zanjan, 45371-38791, Zanjan, Iran2Department of Physics, Institute for Advanced Studies in Basic Sciences (IASBS), Zanjan 45137-66731, Iran3School of Nano Science, Institute for Research in Fundamental Sciences (IPM), Tehran 19395-5531, Iran*[email protected]
ABSTRACT
In the bio-molecular field of Liquid-crystalline, the stacked lipid bilayers phase represents an extensive issue. It was proven that
in addition to the typical smectic order, multi-component multilayer membranes could present columnar order arising from the
coupling of two-dimensional intralayer phase separation. Interlayer smectic ordering distributes across hundreds of membrane
lamellae, resulting in long-range alignment of phase-separated domains. In the current paper, the self-ordering of the sample
over time is investigated by dynamic speckle pattern analysis. Temporal alteration of the sample is associated with changes
in the intensity and contrast of the speckle pattern. We have used different factors, including motion history, co-occurrence,
and time history speckle pattern, to examine the structure evolution of lipid mixtures, which are done by sequence images of
speckle pattern over time. Roughness parameters inclusive of skewness and kurtosis of speckle pattern were investigated that
are related to the domain size evolution of the sample. It is shown that the activity is decreasing by increasing the cholesterol
content and inertia moment is inversely proportional with the growth of domain formation. The experimental setup, data
recording, and data analysis are presented too.
1 Introduction
Multilayer lipid membranes are essential to life, perform many essential functions in biology, and regulate many cellular
processes1. Multilayered lipid membranes have a variety of functional advantages over single-lipid membranes, such as to
organize processes spatially, significantly increase membrane protein concentration because of an increase in surface area,
and compartmentalize molecules2. Lipid bilayers composed of a ternary mixture of lipids, including sphingomyelin (SM),
unsaturated phospholipid, 1,2-dioleoyl-sn-glycero-3-phos- phocholine (DOPC), and cholesterol (Chol). In bio-membranes,
this kind of raft or domains for signaling activities is being used. For example, aligning the ion channels is because of ion
channels localized in liquid-ordered (Lo) and aligned domains3. The alignment of domains across several bilayers may be
useful in the functionality of single bilayer coupling. Phase separation into coexisting liquid-disorder (Ld) and Lo phases
occur at temperatures below a miscibility transition temperature. The Ld and Lo phases are enriched in phase consisting
primarily of unsaturated DOPC and enriched in Chol and SM designated, respectively. Using such bilayers, an insight into
Chol-mediated phase separation has been gained4–7. The SM and Chol tend to form a Lo phase, and the accumulation of
unsaturated phospholipids in a liquid-disordered phase, where the chains do not pack in a straight all-trans conformation,
results in a phase transition. These roughly spherical domains appear to have important consequences in biological systems
by bringing together sets of functionally interacting proteins8. The Ld and Lo phases transition can be seen as lipid bilayer
model membranes containing a single lipid species. Membranes with a mixture of lipid species can undergo phase separation to
facilitate the membrane trafficking enhancer protein insertion into the membrane. Investigation of phase separations yields
information about interactions among lipid molecules9. A continuous columnar arrangement across many bilayers is formed
by domains in stacked membranes aligned on top of each other. An increase in the size of domains with the number of
stacked layers, proportional to the samples’ thickness, results from the interlayer coupling between lamellae. Promoting
domain-domain coalescence occurs over time when inter-lamellar coupling aligns vicinity domains as soon as smaller domains
form independently within each bilayer when the membrane stacks are prepared10, 11.
The Chol effects were investigated in a lot of studies from different points of view, such as solubility of cholesterol in
lipid membranes12 and interaction of common drugs and Chol in lipid bilayers13. Chol and lipid rafts have been signified

T-cell activation14, 15 and HIV entry into T-cells by membrane fusion16. The Chol with both increasing mechanical strength
and decreasing permeability plays a pivotal role in modulating the physicochemical properties of bio-membranes. Chol also
can play the same position in vesicle-based delivery systems, including liposome-based drug delivery systems. However, its
position in the partitioning of drug molecules to lipid membranes is poorly identified1. In general, Chol can modify the physical
properties of a lipid membrane. Chol changes the mechanical property and morphology of lipid bilayers17. The presence
of Chol increases the mechanical strength of the lipid bilayer18–21, which leads to increased stability and decreases inactive
permeability to water, ions, and small polar molecules22–27.
Using digital holographic microscopy (DHM) for phase separation phenomena show this alignment and interlayer coupling
by investigating the relative height changes. Recently, the coupling between intralayer phase separations and interlayer liquid
crystal ordering in multicomponent membranes was studied, and DHM provided the information of area and volume evolution
of lipid domains. It is shown that the volume and height follow the power law as the area3, 28.
In biological science and medicine, several qualitative and quantitative techniques are exploited to assess the properties of
the dynamic phenomenon at different scales for both basic science and clinical applications. One of the methods can be DHM
to investigate the lipid bilayer examinations under different conditions of thermal and humidity situations. Besides, atomic
force microscopy (AFM) is another method to measure the characteristic of different kinds of cells, which is expensive and
destructive. The lipid bilayers’ planar nature makes them a perfect sample for examination by AFM. Lipid phases can be
detected by the AFM because of changes in bilayer thickness stemming from the differences in acyl chain packing29. Another
method to examine the biological phenomenon can be considered by optical coherency tomography (OCT)28, 30–32. In spite
of being fluorescent probes highly versatile in reporting on the membrane structure, its function possibility interacts with the
membrane and becomes problematic in the measurement.
Here we are going to investigate the phase separation by dynamic speckle pattern analysis. The advantage of DHM and
speckle analysis is non-invasive and non-contact. Moreover, the dynamic speckle pattern is less expensive and gives more
information related to more parameters which are different from DHM. The dynamic speckle phenomenon is produced when
light from a coherent source is scattered by samples with time-dependent surface activity. This activity can be due to internal
or surface changes of the sample, such as particle movements, etc., causing random changes of speckle intensity. Biological
samples show this behavior when they are illuminated with a laser. However, there are other dynamic processes where this
behavior is also observed [46]. As stated, during phase separation, the domain surfaces are changing due to coalescence,
thus giving dynamic surfaces. This activity could be due to domain motions. Immediately after the initial domain formation
and coalescence, the dynamic of speckle will start. The sample preparation and experimental procedure are presented in the
materials and methods section. To examine the domain formation and its coalescence in multi-component lipids, we have
studied different parameters including, time history speckle pattern (THSP), co-occurrence matrix (COM), inertia moment
(IM), roughness parameters, including kurtosis and skewness, and motion history image (MHI) in various concentrations that
be explained in the results and discussion section. Examine these parameters for different Chol concentrations will make clear
the relation between activity and different Chol concentrations.
2 Materials and Methods
2.1 Sample preparationThe samples we used for membrane multi-lamellar are nonuniform mixture systems consisting of single lipid mixtures
composed of Chol, sphingomyelin (SM), unsaturated phospholipid, 1,2-dioleoyl-sn-glycero-3-phosphocholine (DOPC), as
putative raft-forming ternary. The lipid multi-bilayers are prepared on the surface of clean and dry glass slide substrates. To
prepare the lipid multi-bilayers, we have purchased the powder form of the lipid from Avanti™ and then dissolve the powder
using chloroform. Droplets with a volume of 1 to 5 µl of the prepared solution were put onto the cleaned glass substrate. The
samples were kept in a vacuum overnight until all of the chloroform was evaporated and then were incubated for 48 to 72 h at
50◦C to 60◦C in an environment with a relative humidity of 98%. In each experiment, by quick immersion of the dried plaques
of multi-lamellar lipids in deionized bulk water, the phase separation regime is achieved from quenching the homogeneous
phase’s high temperature. In order to investigating phase separation, we varied Chol concentration in equimolar mixtures of SM
and DOPC systematically (1:1 SM/DOPC + xChol; x = 10–30% (molar)). These lipid mixtures are known to phase-separate
into two coexisting liquid phases when organized as single bilayers under their miscibility transition temperature.
2.2 Experimental procedure
Figure 1(a) shows the schematic of the experimental procedure for recording dynamic speckle patterns. The laser beam (He-Ne
Laser, 632.8 nm, 5 mW) is expanded by the beam expander BE, then the speckle pattern produced by diffuser D (Thorlabs,
DG05-120-MD) is reflected by mirror M on the sample through the condenser (Thorlabs, CSC2001, Achromatic, NA=0.78,
WD=6.6 mm). The sample is immediately moved to the microscopy stage after immersion in humidity and temperature for
48-72 hours. The domains are formed and evolved in time. The generated speckle patterns are pass through the microscope
2/11

µ
Figure 1. (a) Experimental setup schematically for dynamic speckle capture; Sh: shutter, BE: beam expander, D: Diffuser, M:
mirror, C: Condenser, S: Sample, MO: Microscope Objective, L: collecting lens. (b) Speckle patterns of domain evolution over
times.
objective MO (Olympus, 40X, Plan Achromat, NA=0.65, WD=0.6 mm) and recorded by a digital camera (DCC1545M,
Thorlabs, 8-bit dynamic range, 5.2 µm pixel pitch) with a collecting lens (L). L has a focal length of 50 mm. The digital
camera is set to record 1280×1024 pixels under its central region with an exposure time of 0.22 ms. The speckle patterns are
recorded in video format for 90 seconds with a 25 fps frame rate. It should be noted that the He-Ne laser possesses adequate
coherency and stability. The laser is turned on at least half an hour before the operation to ensure intensity stability, which is
highly significant in speckle analysis. Using the shutter (Sh), the exposure time of the sample is controlled.
In order to ensure the low effect of noise, such as vibration, time-dependent contaminants in optical elements, and
background environmental light, a controlling experiment is conducted. For control data, the experimental conditions such as
temperature are kept constant and the specimen is fixed. Since only a part of the specimen area is owned by the lipid specimen,
an empty area in the vicinity of the specimen, is taken as a reference area. The speckles analysis procedures that are presented
in this paper is applied to the reference data. The results of the controlling experiment are presented in Supplementary Material.
2.3 Numerical processing
An encouraging optical method for evaluating biological processes is dynamic laser speckle. A beneficial description of the
surface properties of the sample is provided through dynamic speckle analysis in the characterization procedure field. Different
analysis results could reveal the sample’s activity, particularly in biomaterials, which facilize quantitative and qualitative
information on the processes making dynamic changes in the sample under examination. The objectivity of the present research
is to characterize the phase separation activity of ternary lipids mixture as a function of time. The recorded speckle patterns
are numerically processed, and multiple useful statistical parameters defined in this section are calculated33, 34. Illuminating
an active object by a laser causes dynamics speckle patterns. The static speckle pattern is possible when the wavelength and
intensity of the laser are stable, and also sample has no movement. Therefore, when the wavelength and the intensity of the
laser are stable, mobility detected by the dynamic laser speckle in biomaterials is due to their internal feature, for example,
growth and cell division, biochemical reactions, water-related activities, as well as scaffold activity detection35–41. In phase
separation of domains, the activity-related measurements, which can be in terms of coalescing of domains, are associated with
the interlayer alignment of intralayer domains’ structure of multi-component lipids3, 28. We name the mentioned structural
3/11

variations as “domain–domain coalescence activities”. The time history speckle pattern (THSP) is a two-dimensional matrix
that representing the time evolution of a set of M points, so-called image datapack points, in sequential speckle patterns, where
M represents the number of points in the THSP matrix, which is equal to the raws number of the image in the datapack. Also,
the THSP has N columns, where N represents the number of images in the datapack. Thereby, a raw of the THSP matrix show
this set of points in a speckle pattern, while its columns show the time evolution. From the initial pattern, the set of M points is
randomly chosen to reconstruct the first column of the THSP matrix. The corresponding points in successive patterns are used
for constructing the other columns of the THSP matrix.
The THSP provides a graphical sign of the sample activity level that the higher the THSP line variation represents the higher
activity of the sample under study42. The concept of the THSP is the foundation of numerical results exemplary co-occurrence
matrix (COM), inertia moment (IM), and so on. In addition, several parameters can be investigated independently of using the
THSP, such as motion history image (MHI), roughness parameters (kurtosis, skewness, etc.), contrast, and homogeneity related
to activity types43.
COM is an intermediary matrix, which evaluated the dispersion of successive pixels in a THSP of M points monitoring by
N speckle patterns. COM demonstrates a transition intensities histogram:
COM(i, j) =M
∑m=1
N−1
∑n=1
1, if THSP(m,n) = i
and THSP(m,n+1) = j,
0, otherwise.
(1)
IM is considered as statistical and numerical activity indicator that is calculated by Eq. 1:
IM = ∑i
∑j
COM(i, j)
∑m COM(i,m)|i− j|2. (2)
In order to reduction of the inhomogeneities effect in the analyzed images, the normalization is applied in a way that the
sum of values in each line of the COM equal to 1. The inertia moment’s name is derived from the mechanical resembling of
this operation.
The average alternation of intensities to mean value of data is defined as RP1, while definition the standard deviation of the
distribution is the root mean square of intensities (RP2):
RP1 =1
P Q
P
∑p=1
Q
∑q=1
|I(p,q)−〈I(p,q)〉|, (3)
RP2 =
[
1
P Q
P
∑p=1
Q
∑q=1
[I(p,q)−〈I(p,q)〉]2]
12
, (4)
where P and Q are the horizontal and vertical sizes of the speckle patterns, p and q count the pixel numbers, and I is the
intensity all over the speckle patterns RP1. The RP1 is called the average roughness. These metrics can be used to providing a
general distribution roughness estimation. Equivalent, skewness, RP3, and kurtosis, RP4, are other usual roughness parameters
that can be used to evaluate the samples:
RP3 =1
P Q R3P2
P
∑p=1
Q
∑q=1
[I(p,q)−〈I(p,q)〉]3 , (5)
RP4 =1
P Q R4P2
P
∑p=1
Q
∑q=1
[I(p,q)−〈I(p,q)〉]4 . (6)
According to the definition of RP3, which is the third moment of the deviation from the mean value, it is a measure of the
symmetry’s degree related to the intensities distribution. Positive skewness represents a “peaky” distribution, while negative
skewness represents a superiority of valleys, i.e., low intensities. On the other hand, RP3 = 0 represents symmetric intensity
distribution of surface. The parameter that measures the distribution sharpness all over the pattern is kurtosis, RP4. Kurtosis is
the indicator of the intensity distribution width44. Another parameter that is related to the activity of the samples is the Motion
History Image (MHI). It is used to characterize movements within a row of images in time. The MHI indicates a static pattern
that the pixel intensity is a function of the recent image sequence motion and contains the fundamental information in order
to determine the motion of the object during the activity45, 46. MHI has been used profoundly for visualizing the perfusion
changes locations during different stimuli47. Furthermore, MHI finds out the object’s motion depends on the pixel’s timestamps
4/11
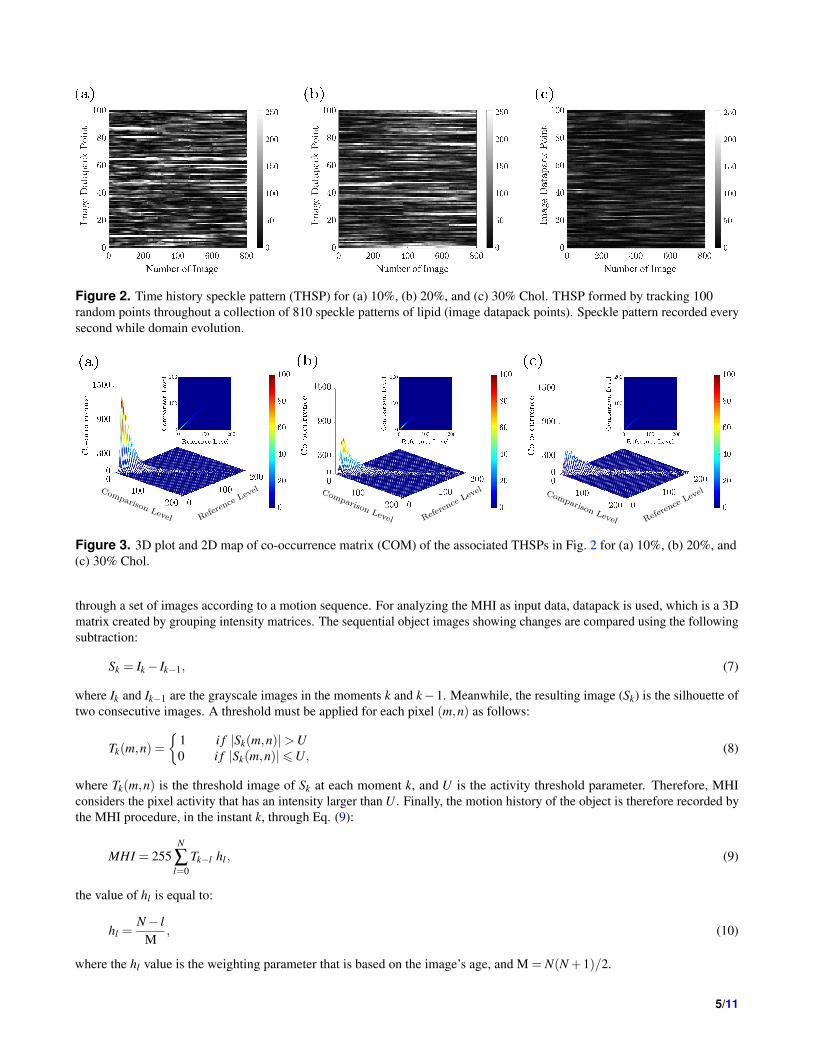
Figure 2. Time history speckle pattern (THSP) for (a) 10%, (b) 20%, and (c) 30% Chol. THSP formed by tracking 100
random points throughout a collection of 810 speckle patterns of lipid (image datapack points). Speckle pattern recorded every
second while domain evolution.
Figure 3. 3D plot and 2D map of co-occurrence matrix (COM) of the associated THSPs in Fig. 2 for (a) 10%, (b) 20%, and
(c) 30% Chol.
through a set of images according to a motion sequence. For analyzing the MHI as input data, datapack is used, which is a 3D
matrix created by grouping intensity matrices. The sequential object images showing changes are compared using the following
subtraction:
Sk = Ik − Ik−1, (7)
where Ik and Ik−1 are the grayscale images in the moments k and k−1. Meanwhile, the resulting image (Sk) is the silhouette of
two consecutive images. A threshold must be applied for each pixel (m,n) as follows:
Tk(m,n) =
{
1 i f |Sk(m,n)|>U
0 i f |Sk(m,n)|6U,(8)
where Tk(m,n) is the threshold image of Sk at each moment k, and U is the activity threshold parameter. Therefore, MHI
considers the pixel activity that has an intensity larger than U . Finally, the motion history of the object is therefore recorded by
the MHI procedure, in the instant k, through Eq. (9):
MHI = 255N
∑l=0
Tk−l hl , (9)
the value of hl is equal to:
hl =N − l
M, (10)
where the hl value is the weighting parameter that is based on the image’s age, and M = N(N +1)/2.
5/11

Figure 4. Inertia moment (IM) of lipid samples’ THSP as a function of time for (a) 10%, (b) 20%, (c) 30% Chol. The
power-law function is fitted on each graph.
3 Results and discussion
After recording the speckle pattern of domain evolution, we have analyzed the speckle image sequence derived from the
recorded movies. As it is shown in Fig. 1(b), while the domains are coalescing, the speckle patterns change. This evolution
is because of phase separation in the stacked lipid bilayer. Figures 2(a), 2(b), and 2(c) show the THSP matrices for samples
with different Chol content (concentrations of Chol combined with the lipid sample). THSPs are built by putting together
the intensity of 100 random pixels throughout a collection of 810 speckle patterns. The fluctuations in the intensity of the
pixels will be the result of the activity of lipids related to coalescing. As the increasing percentage of Chol concentration, the
amplitude of the intensity of horizontal lines decreases, which indicates the relatively lower activity of the lipid by adding Chol
concentration of the solution. In 30% and higher Chol concentration, the THSP pattern approaches a structure with relatively
uniform intensity and shows less activity.
Moreover, for better understanding, the change in the lipids’ activity, the associated COM matrices of the samples are
calculated at the aforementioned Chol concentration. Figures 3(a), 3(b), and 3(c) show the 3D plot and 2D map of COM matrix
of the THSPs of lipid’s domain evolution (indicated in Fig. 2), at 10%,20%, and 30% Chol, respectively. The original images
are 8-bit, and due to lack of data, the axes are limited to 200. Figure 3 shows that by increasing the Chol, the width of the
pattern through the diagonal elements is increased and also shows a lower peak value is an indication of lower activities during
domain coalescing. Accordingly, the distributions around the principal diagonal, non-zero elements of the COM matrices
represent the evolution of the sample with different Chol concentrations. To provide a quantitative assessment of the spread of
the COM values around the principal diagonal as an activity indicator for the lipid samples, the IM values of several samples
are computed as a function of time. Figures 4(a), 4(b), and 4(c) show the IM value of the lipids during 90 s for 10%, 20%, and
30% Chol, respectively. It should be noted that in Fig. 4, each point is the average value of IM for two seconds intervals. IM
is defined as summation on the squared row distance to the principal diagonal of THSP; therefore, it is the right quantitative
illustration to the “cloudiness”, such as the amount of data spreading of COM distribution around its principal diagonal. The
larger width is proportional to higher activity. Figure 4 shows the decreasing IM values and activity of the lipid samples in
various concentrations at different times. The decrease of the IM is an indication of lower activity that can be attributed to the
less mobility due to big domain size resulting in domain-domain coalescence. It is clear in Fig. 4, there is a general downward
change as a function of time. Moreover, It has shown that the average area of domains is increasing over time3, 28, which makes
the surface more uniform and causes a decrease in the roughness of the sample or IM value. Therefore, we believe that the
change of IM is proportional to the inverse of the growth of domain formation. In order to prove it, a power-law function is
fitted on IM graphs in Fig. 4. The exponent is about -0.9, in which the positive exponent is in agreement with the reported
value3. According to reports, the temporal evolution of the average area of domains in bilayers follows the universal growth
law, h ∼ t2n, and the growth exponent, n, is 1/3 < n < 1/23, 28.
The lipid activity and coalescence are associated with the surface structure that is given by surface roughness. Here we
examined the roughness parameters by calculating the kurtosis and skewness for the samples. Kurtosis and skewness values are
generally interpreted together. For a sample with 20% Chol, the kurtosis parameter for 1s, 30s, 60s, and 90s time intervals are
shown in Figs. 5(a), 5(b), 5(c), and 5(d), respectively. Also, the skewness parameter for 1s, 30s, 60s, and 90s time intervals are
6/11

Figure 5. (a), (b), (c), and (d) Temporal speckle kurtosis matrix of 20% Chol. (e), (f), (g), and (h) Temporal speckle skewness
matrix of 20% Chol.
Figure 6. (a) Average kurtosis, and (b) Average skewness of 100 speckle patterns of lipid surface as a function of time at 20%
Chol.
shown in Figs. 5(e), 5(f), 5(g), and 5(h), respectively.
In order to reduce the computational time, a portion of the original speckle pattern with 64 by 64 pixels is selected for
calculations. The blue pixels in which indicating less activity, are increased over time. It is obvious that the changes in skewness
are greater than kurtosis.
For better demonstration, the average value of the kurtosis and skewness are shown in Figs. 6(a) and 6(b), respectively.
7/11

Figure 7. The intensity profile of two speckle patterns and corresponding intensity histograms at two different times, (a) t=10s
and (b) t=90s, illustrate positive and negative skewness respectively.
Figure 8. Motion history image (MHI) for (a) 10%, (b) 20%, (c) 30% Chol. Each MHI was generated from a stack of speckle
pattern images.
The same behaviour for kurtosis and skewness for different Chol concentrations were observed. Each error bar is obtained by
calculating the kurtosis and skewness values over 100 speckle patterns. The variation of kurtosis and skewness shows that the
surface of the samples’ gets smoother in longer times due to the domain coalescence and enlarging the domains.
Figure 7 shows the profile of the speckle pattern at the first and final time and corresponding intensity distributions. In 48, 49,
it is illustrated that in a dynamic surface, by increasing the number of bright pixels, the roughness of the surface is decreasing.
The profiles of the speckle patterns in Fig. 7 clearly show that at the beginning the number of bright pixels are less and then
becomes larger at last. Figure 7(a) and 7(b) show the lower bright pixels (positive skewness) and the higher bright pixels
(negative skewness), respectively. For quantitative purposes, it seems the same interpretation can be presented by calculating
the skewness. The behaviour of skewness of the speckle pattern in Fig. 6(b), shows that at the beginning it is positive then
becomes negative at last. Therefore, we believe, the skewness of the speckle pattern is a good parameter to show the evolution
of the surface roughness.
Figure 8 shows the MHI images generated from a stack of speckle patterns. During increasing the concentration of Chol,
there is an effect that could be detected by following the MHI maps. MHI is a method used to recognize motion within a row of
images through time. In the MHI maps, the background was illustrated in blue, and the higher density of dots demonstrated a
great change in the activity, while the smaller density of dots presented low activity. According to Fig. 8, the motion of domains
or activity decreased by increasing the concentration of Chol, as well as shows the movement of the domain while coalescing.
Therefore, by following the MHI images, it becomes possible to demonstrate the surface activity and domain evolutions over
time.
In Supplementary Material, Figs. S1-S3, we have also presented a similar investigation of THSP, COM, MHI, IM, and
8/11

roughness parameters for controlling the experiment.
4 Conclusion
The dynamic speckle analysis has been used for measuring the self-ordering epitaxial films of stacked lipid bilayers. Different
factors such as time history, co-occurrence, inertia moment, roughness parameters, and motion history image of speckle patterns
have been used to show the rate of activity over time and also at different the Chol concentration. It is observed that less activity
happens at higher concentrations in which predict the liquid-liquid coexistence is abandoned at higher Chol concentrations (x >
40%). According to the results, we suggest that the change of inertia moment can be proportional to the inverse of the growth
of domain formation and the trend of these changes is related to the temporal evolution of the average area of domains. Also,
we believe that the skewness of the speckle pattern is a good parameter to show the roughness evolution of the surface.
Disclosures
The authors declare no conflicts of interest.
Acknowledgements
The authors would like to thank Dr. Lobat Tayebi for the preparation of the samples.
References
1. Poojari, C. et al. Cholesterol reduces partitioning of antifungal drug itraconazole into lipid bilayers. The J. Phys. Chem. B
124, 2139–2148 (2020).
2. Heath, G. R. et al. Multilayered lipid membrane stacks for biocatalysis using membrane enzymes. Adv. Funct. Mater. 27,
1606265 (2017).
3. Tayebi, L. et al. Long-range interlayer alignment of intralayer domains in stacked lipid bilayers. Nat. materials 11,
1074–1080 (2012).
4. Veatch, S. L. & Keller, S. L. Organization in lipid membranes containing cholesterol. Phys. review letters 89, 268101
(2002).
5. McConnell, H. M. & Vrljic, M. Liquid-liquid immiscibility in membranes. Annu. review biophysics biomolecular structure
32, 469–492 (2003).
6. Hammond, A. et al. Crosslinking a lipid raft component triggers liquid ordered-liquid disordered phase separation in
model plasma membranes. Proc. Natl. Acad. Sci. 102, 6320–6325 (2005).
7. Bacia, K., Schwille, P. & Kurzchalia, T. Sterol structure determines the separation of phases and the curvature of the
liquid-ordered phase in model membranes. Proc. Natl. Acad. Sci. 102, 3272–3277 (2005).
8. Brown, D. & London, E. Functions of lipid rafts in biological membranes. Annu. review cell developmental biology 14,
111–136 (1998).
9. Elson, E. L., Fried, E., Dolbow, J. E. & Genin, G. M. Phase separation in biological membranes: integration of theory and
experiment. Annu. review biophysics 39, 207–226 (2010).
10. Bechinger, B. Domains stack up. Nat. Mater. 11, 1005–1006 (2012).
11. Ursell, T. S., Klug, W. S. & Phillips, R. Morphology and interaction between lipid domains. Proc. Natl. Acad. Sci. 106,
13301–13306 (2009).
12. Barrett, M. A. et al. Solubility of cholesterol in lipid membranes and the formation of immiscible cholesterol plaques at
high cholesterol concentrations. Soft Matter 9, 9342–9351 (2013).
13. Alsop, R. J. et al. Cholesterol expels ibuprofen from the hydrophobic membrane core and stabilizes lamellar phases in
lipid membranes containing ibuprofen. Soft matter 11, 4756–4767 (2015).
14. Gaus, K., Chklovskaia, E., Fazekas de St. Groth, B., Jessup, W. & Harder, T. Condensation of the plasma membrane at the
site of t lymphocyte activation. The J. cell biology 171, 121–131 (2005).
15. Biancotto, A. et al. Hiv-1–induced activation of cd4+ t cells creates new targets for hiv-1 infection in human lymphoid
tissue ex vivo. Blood, The J. Am. Soc. Hematol. 111, 699–704 (2008).
9/11
16. Campbell, S., Crowe, S. M. & Mak, J. Lipid rafts and hiv-1: from viral entry to assembly of progeny virions. J. Clin. Virol.
22, 217–227 (2001).
17. Gao, Q., Wu, G. & Lai, K. W. C. Cholesterol modulates the formation of the aβ ion channel in lipid bilayers. Biochemistry
59, 992–998 (2020).
18. Pan, J., Tristram-Nagle, S. & Nagle, J. F. Effect of cholesterol on structural and mechanical properties of membranes
depends on lipid chain saturation. Phys. Rev. E 80, 021931 (2009).
19. Khatibzadeh, N., Gupta, S., Farrell, B., Brownell, W. E. & Anvari, B. Effects of cholesterol on nano-mechanical properties
of the living cell plasma membrane. Soft Matter 8, 8350–8360 (2012).
20. Khelashvili, G. & Harries, D. How cholesterol tilt modulates the mechanical properties of saturated and unsaturated lipid
membranes. The J. Phys. Chem. B 117, 2411–2421 (2013).
21. Al-Rekabi, Z. & Contera, S. Multifrequency afm reveals lipid membrane mechanical properties and the effect of cholesterol
in modulating viscoelasticity. Proc. Natl. Acad. Sci. 115, 2658–2663 (2018).
22. Saito, H. & Shinoda, W. Cholesterol effect on water permeability through dppc and psm lipid bilayers: a molecular
dynamics study. The J. Phys. Chem. B 115, 15241–15250 (2011).
23. Milianta, P. J., Muzzio, M., Denver, J., Cawley, G. & Lee, S. Water permeability across symmetric and asymmetric droplet
interface bilayers: interaction of cholesterol sulfate with dphpc. Langmuir 31, 12187–12196 (2015).
24. Issack, B. B. & Peslherbe, G. H. Effects of cholesterol on the thermodynamics and kinetics of passive transport of water
through lipid membranes. The J. Phys. Chem. B 119, 9391–9400 (2015).
25. Shinoda, W. Permeability across lipid membranes. Biochimica et Biophys. Acta (BBA)-Biomembranes 1858, 2254–2265
(2016).
26. Dotson, R. J., Smith, C. R., Bueche, K., Angles, G. & Pias, S. C. Influence of cholesterol on the oxygen permeability of
membranes: insight from atomistic simulations. Biophys. journal 112, 2336–2347 (2017).
27. Lopez, M. et al. Effects of acyl chain unsaturation on activation energy of water permeability across droplet bilayers of
homologous monoglycerides: Role of cholesterol. Langmuir 34, 2147–2157 (2018).
28. Farzamrad, V., Moradi, A.-R., Darudi, A. & Tayebi, L. Digital holographic microscopy of phase separation in multicompo-
nent lipid membranes. J. biomedical optics 21, 126016 (2016).
29. Connell, S. D. & Smith, D. A. The atomic force microscope as a tool for studying phase separation in lipid membranes.
Mol. membrane biology 23, 17–28 (2006).
30. Rebelo, L. M., de Sousa, J. S., Mendes Filho, J. & Radmacher, M. Comparison of the viscoelastic properties of cells from
different kidney cancer phenotypes measured with atomic force microscopy. Nanotechnology 24, 055102 (2013).
31. Engler, A. J., Rehfeldt, F., Sen, S. & Discher, D. E. Microtissue elasticity: measurements by atomic force microscopy and
its influence on cell differentiation. Methods cell biology 83, 521–545 (2007).
32. Schmitt, J. M. Optical coherence tomography (oct): a review. IEEE J. selected topics quantum electronics 5, 1205–1215
(1999).
33. Braga, R. A., González-Peña, R. J., Viana, D. C. & Rivera, F. P. Dynamic laser speckle analyzed considering inhomo-
geneities in the biological sample. J. Biomed. Opt. 22(4), 045010 (2017).
34. Murialdo, S. et al. Analysis of bacterial chemotactic response using dynamic laser speckle. J. Biomed. Opt. 14, 064015
(2009).
35. Braga, R. A., Dupuy, L., Pasqual, M. & Cardoso, R. Live biospeckle laser imaging of root tissues. Eur. Biophys. J. 38(5),
679–686 (2009).
36. Cardoso, R. & Braga, R. Enhancement of the robustness on dynamic speckle laser numerical analysis. Opt. Lasers Eng.
63, 19–24 (2014).
37. Grassi, H. C. et al. Quantitative laser biospeckle method for the evaluation of the activity of trypanosoma cruzi using vdrl
plates and digital analysis. PLoS Neglected Trop. Dis. 10(12), e0005169 (2016).
38. Ramírez-Miquet, E. E. et al. Digital imaging information technology for biospeckle activity assessment relative to bacteria
and parasites. Lasers Med. Sci. 32(6), 1375–1386 (2017).
39. Zdunek, A., Adamiak, A., Pieczywek, P. M. & Kurenda, A. The biospeckle method for the investigation of agricultural
crops: A review. Opt. Lasers Eng. 52, 276–285 (2014).
10/11

40. Vladimirov, A. et al. Applicaton of speckle dynamics for studies of cell metabolism. In Optical Methods for Inspection,
Characterization, and Imaging of Biomaterials II, vol. 9529, 95291F (International Society for Optics and Photonics,
2015).
41. Rad, V. F., Panahi, M., Jamali, R., Darudi, A. & Moradi, A.-R. Non-invasive in situ monitoring of bone scaffold activity by
speckle pattern analysis. Biomed. optics express 11, 6324–6336 (2020).
42. Braga, R., Silva, W., Sáfadi, T. & Nobre, C. Time history speckle pattern under statistical view. Opt. Commun. 281(9),
2443–2448 (2008).
43. Dhandayuthapani, B., Yoshida, Y., Maekawa, T. & Kumar, D. S. Polymeric scaffolds in tissue engineering application: a
review. Int. J. Polym. Sci. 2011 (2011).
44. Gadelmawla, E., Koura, M., Maksoud, T., Elewa, I. & Soliman, H. Roughness parameters. J. Mater. Process. Technol.
123(1), 133–145 (2002).
45. Davis, J. W. Hierarchical motion history images for recognizing human motion. In Proceedings IEEE Workshop on
Detection and Recognition of Events in Video, 39–46 (IEEE, 2001).
46. Ansari, M. Z., Ramírez-Miquet, E. E., Otero, I., Rodríguez, D. & Darias, J. G. Real time and online dynamic speckle
assessment of growing bacteria using the method of motion history image. J. Biomed. Opt. 21, 066006 (2016).
47. Ansari, M. Z., Humeau-Heurtier, A., Offenhauser, N., Dreier, J. P. & Nirala, A. K. Visualization of perfusion changes with
laser speckle contrast imaging using the method of motion history image. Microvasc. research 107, 106–109 (2016).
48. Kayahan, E., Oktem, H., Hacizade, F., Nasibov, H. & Gundogdu, O. Measurement of surface roughness of metals using
binary speckle image analysis. Tribol. Int. 43, 307–311 (2010).
49. Fuh, Y.-K., Hsu, K. C. & Fan, J. R. Roughness measurement of metals using a modified binary speckle image and adaptive
optics. Opt. Lasers Eng. 50, 312–316 (2012).
11/11

Figures
Figure 1
(a) Experimental setup schematically for dynamic speckle capture; Sh: shutter, BE: beam expander, D:Diffuser, M: mirror, C: Condenser, S: Sample, MO: Microscope Objective, L: collecting lens. (b) Specklepatterns of domain evolution over times.

Figure 2
Time history speckle pattern (THSP) for (a) 10%, (b) 20%, and (c) 30% Chol. THSP formed by tracking 100random points throughout a collection of 810 speckle patterns of lipid (image datapack points). Specklepattern recorded every second while domain evolution.
Figure 3
3D plot and 2D map of co-occurrence matrix (COM) of the associated THSPs in Fig. 2 for (a) 10%, (b)20%, and (c) 30% Chol.

Figure 4
Inertia moment (IM) of lipid samples’ THSP as a function of time for (a) 10%, (b) 20%, (c) 30% Chol. Thepower-law function is �tted on each graph.
Figure 5
(a), (b), (c), and (d) Temporal speckle kurtosis matrix of 20% Chol. (e), (f), (g), and (h) Temporal speckleskewness matrix of 20% Chol.

Figure 6
(a) Average kurtosis, and (b) Average skewness of 100 speckle patterns of lipid surface as a function oftime at 20% Chol.
Figure 7
The intensity pro�le of two speckle patterns and corresponding intensity histograms at two differenttimes, (a) t=10s and (b) t=90s, illustrate positive and negative skewness respectively.
Figure 8
Motion history image (MHI) for (a) 10%, (b) 20%, (c) 30% Chol. Each MHI was generated from a stack ofspeckle pattern images.
Supplementary Files
This is a list of supplementary �les associated with this preprint. Click to download.
SR2020SpLipidSupplementaryMaterials.pdf

SR2020SpLipidSupplementaryMaterials.pdf