rev. ivoir. sci. technol., 19 (2012) 12 – 25 12. ivoir. sci. technol., 19 (2012) 12 – 25...
TRANSCRIPT

Rev. Ivoir. Sci. Technol., 19 (2012) 12 – 25
ISSN 1813-3290, http://www.revist.ci
Lemeyonouin A. G. POHAN and Lassiné OUATTARA
12
ELECTROCHEMICAL BEHAVIOUR IN A SLIGHTLY HEATED ACIDIC SUPPORTING ELECTROLYTE OF THE THERMALLY
PREPARED BULK IRIDIUM DIOXIDE ELECTRODE
Lemeyonouin Aliou Guillaume POHAN and Lassiné OUATTARA *
Laboratoire de Chimie Physique, UFR SSMT, Université de Cocody,
Abidjan, 22 BP 582 Abidjan 22, Côte d’Ivoire __________________________ *Corresponding author, e-mail : [email protected]
ABSTRACT A bulk iridium dioxide electrode was prepared thermally on a titanium substrate. Its morphology was characterized by a scanning electron microscope and its surface presents a ‘’cracked mud’’ structure with aggregate of IrO2 particles distributed over the coating layer. The prepared electrode was studied in perchloric acid heated slightly at 25°C, 30°C and 39,4°C. The IrO2 surface does not change in morphology when it is used in the slightly heated perchloric acid electrolyte. The electrolyte temperature increase led to the increase of the total, external and internal voltammetric charge about 45%, 72,8% and 20,22% respectively. The temperature effect is much more pronounced for the external charge than the internal charge. The activation energies were determined and they were about 4,0 kJ/mol and 3,2 kJ/mol for the low and the high potential scan rates respectively. The Tafel slopes determined for the oxygen evolution reaction are almost the same, around 43 mV/decade and they are independent of the temperature. That indicated that the slight temperature increase does not change the rate determining step in the oxygen evolution reaction. That electrode, even after being used in slightly heated acidic electrolytes possesses its electrochemical characteristic towards a simple redox couple such as potassium ferri/ferrocyanide. Keywords : Iridium dioxide, voltammetry, differential capacitance, Tafel
slope, temperature.

Rev. Ivoir. Sci. Technol., 19 (2012) 12 – 25
Lemeyonouin A. G. POHAN and Lassiné OUATTARA
13
RÉSUMÉ COMPORTEMENT ÉLECTROCHIMIQUE DANS UN
ÉLECTROLYTE ACIDE LÉGÈREMENT CHAUFFE DE L’ÉLECTRODE D’OXYDE D’IRIDIUM ÉPAISSE PRÉPARÉE PAR VOIE THERMIQ UE Une électrode de dioxyde d’iridium épaisse a été préparée par voie thermique sur un support en titane. Sa morphologie a été caractérisée par un microscope électronique à balayage et sa surface présente une structure craquelée avec des agrégats de particules d’IrO2 distribuées sur la couche déposée. L’électrode préparée a été étudiée dans l’acide perchlorique chauffé légèrement à 25°C, 30°C et 39,4°C. La morphologie de la surface de l’IrO2 ne change pas lorsque l’électrode d’oxyde d’iridium est utilisée dans un électrolyte d’acide perchlorique légèrement chauffé. L’augmentation de la température de l’électrolyte a conduit à l’augmentation de la charge voltamétrique totale, de la charge voltamétrique externe et de la charge voltamétrique interne de 45%, 72,8% et de 20,22% respectivement. L’effet de la température est beaucoup plus important sur la charge voltamétrique externe que sur la charge interne. Les énergies d’activation ont été déterminées et elles sont de 4,0 kJ/mol et de 3,2 kJ/mol pour les faibles et les fortes vitesses de balayage en potentiel respectivement. Les pentes de Tafel déterminées pour la réaction de dégagement de l’oxygène sont presque les mêmes, environ 43 mV/décade et elles sont indépendantes de la température. Ceci indiquerait que la légère augmentation de la température ne modifie pas l’étape cinétiquement déterminante de la réaction de dégagement d’oxygène. Cette électrode, même après avoir été utilisée dans un électrolyte acide faiblement chauffé possède ses caractéristiques électrochimiques vis-à-vis d’un couple rédox simple comme le ferri/ferrocyanure de potassium Mots-clés : dioxyde d’iridium, voltamétrie, capacitance différentielle, pente de Tafel, température. . I – INTRODUCTION Interest in electrodes with high electrocatalytic performances is steadily acquiring importance in technologies after the introduction of the Dimensionally Stable Anodes (DSA®) in the chlor-alkali cells[1-3]. Among the DSAs, iridium dioxide (IrO2) base metallic oxide catalysts applied for oxygen evolution has attracted researchers attention in the past decade[4-7]. This is because IrO2 catalyst exhibits high corrosion-resistant properties than others such as RuO2. The electrochemistry of the iridium dioxide electrodes has been extensively studied by several authors[8-12] and IrO2 presents a

Rev. Ivoir. Sci. Technol., 19 (2012) 12 – 25
Lemeyonouin A. G. POHAN and Lassiné OUATTARA
14
high capacitance due to its pseudocapacitance behaviour which makes it to be a promishing candidate for application in electrochemical supercapacitors [13-15]. Investigation on electrode surface properties is of fundamental importance for understanding their electrochemical behaviour. From literature, most of the voltammetric investigations realized on the iridium dioxide electrode were made at ambient temperature[16,17]. Some investigations have been carried out in electrolyte heated at temperature ranging from 20 to 200°C on platinum, iridium, zirconium[18] and RuO2[19]. Those investigations have shown that temperature increase led to an increase of the voltammetric charge. On RuO2, low values of the Tafel slopes around 4,3 kJ/mol for the oxygen evolution reaction were estimated[19]. But, it has been found that less systematic investigations were made on the study of the influence of electrolyte temperature on the electrochemical behaviour of other DSAs[20]. Therefore, a charge/discharge process was investigated in acidic electrolytes at several temperature on a very thin IrO2 electrode[21] recently. Generally, the investigations that were carried out on DSAs are related to the electrochemical behaviour of the electrodes after their substrates (supports) were being heated under several temperatures. When the iridium dioxides electrodes were used for wastewater treatment for example, authors used generally thicker electrodes and they tend to increase the waste solution temperature to perform a high degradation yield of the pollutants. Thus, it becomes imperative to investigate such electrode surface behaviour when the electrolyte temperature increases. In the following work, a thick iridium dioxide electrode will be prepared thermally and its surface properties and its electrochemical behaviour will be investigated. II – EXPERIMENTAL The coating precursor was prepared from H2IrCl6 (Fluka) which was dissolved in isopropanol (Fluka). The commercial products were used as received without any further treatment. The titanium substrate with the following dimension 1,6 cm x 1,6 cm x 0,5 cm was sandblasted to ensure good adhesion of the deposit on its surface. After sandblasting, the substrate was washed vigourously in water and then in isopropanol to clean its surface from residual sands. The substrate was then dried in an oven at 80°C and weighted. The precursor was applied by a painting procedure on the titanium (Ti) substrate then put in an oven for 15 min at 80 °C to allow the solvent evaporation. Then after, it is put in a furnace at 450 °C for 15 min to allow the decomposition of the precursor. Theses steps were repeated until the

Rev. Ivoir. Sci. Technol., 19 (2012) 12 – 25
Lemeyonouin A. G. POHAN and Lassiné OUATTARA
15
desired weight of the coating is reached. A final decomposition of 1 h was done at 450 °C. The deposit morphology was analyzed with a Philips XL30 SFEG microscope operating at a field emission of 1-30 kV. The electrochemical measurements were performed in a three-electrode electrochemical cell using an Autolab PGStat 20 (Ecochemie). The counter electrode was a platinum wire and the reference electrode was a silver-silver chloride electrode (Ag-AgCl). All the potential were reported against Ag-AgCl in the whole text. To overcome the potential ohmic drop, the reference electrode was mounted in a luggin capillary and placed close to the working electrode by a distance of 1 mm. The apparent exposed area of the working electrode was 0,78 cm2. The experiments were made at various temperatures 25 °C; 30 °C and 39,4 °C. The supporting electrolyte used was 1 M perchloric acid (HClO4, Fluka) for the temperature effect investigation. Potassium chloride (KCl) 0,5M was used as supporting electrolyte only for the investigations made with the potassium ferri/ferrocyanide (Fluka) redox couple. In that case, the luggin capillary was filled with 0,5 M KCl (Fluka). All the solutions were made with distilled water. III - RESULTS AND DISCUSSION
III-1. Morphological characterization of the prepared electrodes Representative SEM micrographs of the substrate and that of deposited IrO2 (5 g/m2) are presented in (Figure 1A-C.)
A
B C
Figure 1: SEM images of sandblasted titanium (A) and IrO2 deposit at two magnifications (B (x6500) and C(x2500))

Rev. Ivoir. Sci. Technol., 19 (2012) 12 – 25
Lemeyonouin A. G. POHAN and Lassiné OUATTARA
16
The sandblasted titanium surface (Figure 1A) is rough as expected for good adhesion of the coating layer. The coating presents the ‘’cracked mud’’ morphology (Figure 1B-C), characteristic of IrO2-based electrode materials. The substrate seems to be totally covered by the deposit. Increasing the magnification, the micrograph in Figure 1C shows aggregate particles distributed over the coating surface. These particles were observed by other authors and they have been identified as IrO2 particles[22-24]. III-2. Electrochemical measurements III-2-1. Study of the voltammetric charge of the bulk iridium dioxide in 1M
HClO4
(Figure 2a) shows cyclic voltammograms (CV) recorded at several scan rates (5 mV/s-600 mV/s) for the bulk IrO2 electrode in 1M HClO4. The results show the typical feature generally observed with the iridium dioxide electrodes. The CV is characterized by one pair of a broad peak located in the potential domain of 0,6V-1,2V.
That observation is in accordance with the results presented in literature with the iridium dioxide electrodes prepared thermally[25]. That broad peak overlaps two redox surface transition processes such as Ir(III)/Ir(IV) and Ir(IV)/Ir(VI) [26, 27]. The redox transition Ir(III)/Ir(IV) occurring at potential around 0,6 V is the most important contribution to the double layer charging process and involves proton exchange between the oxide-OH surface groups and the electrolyte according to the following equation [26]:
(1) The voltammetric charge obtained by the integration of the CVs is plotted against the scan rates for several temperatures and the result is presented in (Figure 2b). All the curves present the same shape. The voltammetric charge seems to be almost constant for the high value of the scan rate (> 0,1 V/s) and it increases when the scan rate is lowered. The voltammetric charge increases as the temperature increases. The voltammetric charges recorded at the high scan rates and plotted against the inverse of the square root of the scan rate (Figure 2c) led to the determination of the more accessible external charge (Qext) [1, 14].

Rev. Ivoir. Sci. Technol., 19 (2012) 12 – 25
Lemeyonouin A. G. POHAN and Lassiné OUATTARA
17
Figure 2: Evolution of the voltammetric charge of bulk IrO2 electrodes in HClO4 1M at different temperatures, WE: IrO2/Ti; RE: Ag-AgCl; CE: Pt wire
At low scan rate, the inverse of the voltammetric charge plotted versus the square root of the scan rates (Figure 2d) allowed the total voltammetric charge (QT) to be determined [1, 14]. All the obtained values are reported in
a
b
c
d
Rev. Ivoir. Sci. Technol., 19 (2012) 12 – 25
Lemeyonouin A. G. POHAN and Lassiné OUATTARA
18
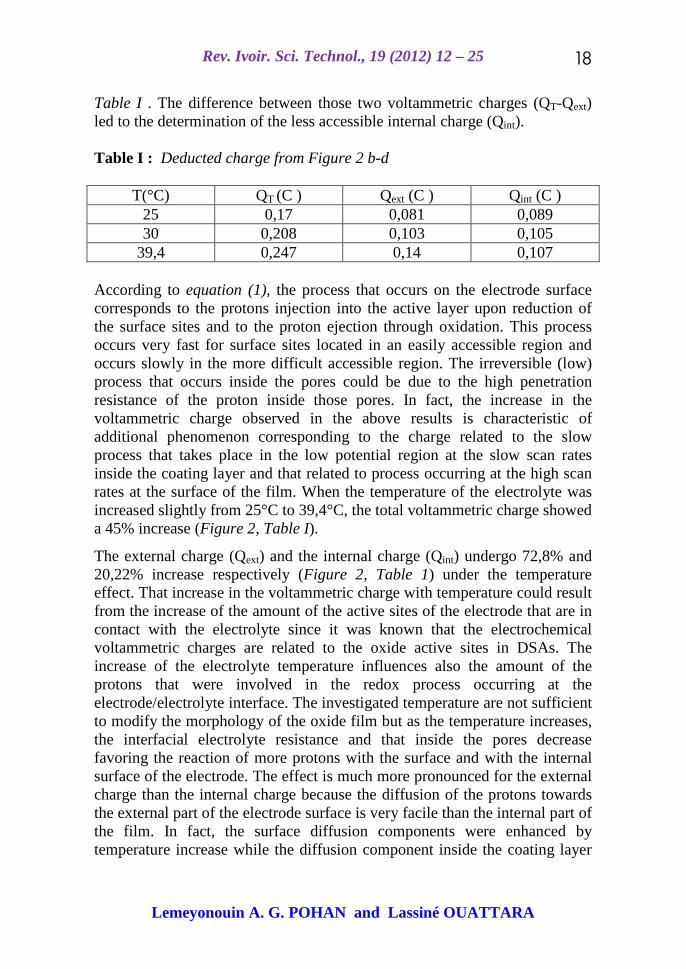
Table I . The difference between those two voltammetric charges (QT-Qext) led to the determination of the less accessible internal charge (Qint). Table I : Deducted charge from Figure 2 b-d
T(°C) QT (C ) Qext (C ) Qint (C ) 25 0,17 0,081 0,089 30 0,208 0,103 0,105
39,4 0,247 0,14 0,107 According to equation (1), the process that occurs on the electrode surface corresponds to the protons injection into the active layer upon reduction of the surface sites and to the proton ejection through oxidation. This process occurs very fast for surface sites located in an easily accessible region and occurs slowly in the more difficult accessible region. The irreversible (low) process that occurs inside the pores could be due to the high penetration resistance of the proton inside those pores. In fact, the increase in the voltammetric charge observed in the above results is characteristic of additional phenomenon corresponding to the charge related to the slow process that takes place in the low potential region at the slow scan rates inside the coating layer and that related to process occurring at the high scan rates at the surface of the film. When the temperature of the electrolyte was increased slightly from 25°C to 39,4°C, the total voltammetric charge showed a 45% increase (Figure 2, Table I).
The external charge (Qext) and the internal charge (Qint) undergo 72,8% and 20,22% increase respectively (Figure 2, Table 1) under the temperature effect. That increase in the voltammetric charge with temperature could result from the increase of the amount of the active sites of the electrode that are in contact with the electrolyte since it was known that the electrochemical voltammetric charges are related to the oxide active sites in DSAs. The increase of the electrolyte temperature influences also the amount of the protons that were involved in the redox process occurring at the electrode/electrolyte interface. The investigated temperature are not sufficient to modify the morphology of the oxide film but as the temperature increases, the interfacial electrolyte resistance and that inside the pores decrease favoring the reaction of more protons with the surface and with the internal surface of the electrode. The effect is much more pronounced for the external charge than the internal charge because the diffusion of the protons towards the external part of the electrode surface is very facile than the internal part of the film. In fact, the surface diffusion components were enhanced by temperature increase while the diffusion component inside the coating layer

Rev. Ivoir. Sci. Technol., 19 (2012) 12 – 25
Lemeyonouin A. G. POHAN and Lassiné OUATTARA
19
was little affected. The activation energy calculated at the low scan rates is 4,0 kJ/mol and that calculated at the high scan rates is about 3,2 kJ/mol. The fact that the activation energy of the surface process is high at the low scan rates than that at the high scan rates could be due to the irreversible process that occurs inside the coating pores. Because of the slow proton diffusion process that takes place inside the coating pores, more energy was necessary to allow the protons to diffuse inside them. The small magnitude of the activation energies could also point out that the process that occurs at the electrode/electrolyte interface is physical rather than chemical [19, 21].
The current density recorded at the electrode/electrolyte interface was normalized over the scan rates for all the temperature investigated. It allowed the differential capacitance to be determined. That differential capacitance was determined by making the ratio of the current density to the potential scan rate. The obtained results were presented in (Figure 3). One observes in that figure that the differential capacitance increases in the whole potential domain when the potential scan rate decreases. Change in the differential capacitance is observed in the whole anodic direction while in the cathodic direction, drastic change is observed only in the domain of the low potential and for the low scan rates. Those capacitances were influenced by the transition process (solid state redox process) that occurs on the electrode surface for all the temperatures investigated. For all the potential scan rates investigated, the differential capacitance is almost constant in the reversal part of the curves in the potential domain between 0,5V and 1,2V. As the temperature increases, the differential capacitance increases too. That result is in agreement with that obtained by Silva and al.[28].
Temperature increase does not change the mechanism of the process occurring at the electrode/electrolyte interface but only increases the number of the active sites that are involved in the process. The anodic part of the curve seems to be influenced by the process that occurs in the low potential domain in the cathodic direction. That influence diminishes considerably for higher scan rates. Those observations indicated that the processes that occur at lower scan rates in the cathodic direction are very sluggish and they are regained as the potential is scanning in the positive direction. The process that occurs mainly in that region is the reduction of the protons on the electrode surface.

Rev. Ivoir. Sci. Technol., 19 (2012) 12 – 25
Lemeyonouin A. G. POHAN and Lassiné OUATTARA
20
-200
-150
-100
-50
0
50
100
150
200
-0.5 0 0.5 1 1.5
C (mF/ cm2)
E(V/ Ag-AgCl)
decreasing potentialscan rate
decreasing potentialscan rate
a
b
c
Figure 3: Influence of scan rate on the differential capacitance of iridium oxide electrode in HClO4 1M for various temperature a: 25°C, b: 30°C, c: 39,4°C, RE: Ag-AgCl, CE:Pt wire

Rev. Ivoir. Sci. Technol., 19 (2012) 12 – 25
Lemeyonouin A. G. POHAN and Lassiné OUATTARA
21
III-2-2. Study of the oxygen evolution reaction (OER) on bulk IrO2/Ti electrode at several temperatures of the supporting electrolyte (1M HClO4)
Figure 4 presents the polarization curves and the Tafel lines. No correction of the ohmic drop is made. To minimize the uncompensated ohmic drop, a concentrated supporting electrolyte and a luggin capillary were used.
1.25
1.26
1.27
1.28
1.29
1.3
1.31
1.32
-1 -0.5 0 0.5 1
E(V/ Ag-AgCl)
log(J)
25°C
30°C
39,4°C
Figure 4: Influence of the temperature on the tafel slope of the oxygen evolution reaction on the bulk IrO2 electrode in HClO4 1M, a: at low potential; b: at high potential, v=1mV/s, RE: Ag-AgCl, CE: Pt wire
The Tafel lines show at each temperature the Tafel slopes that are reported in Table II. Table II : Tafel slopes in the domain of OER at several temperatures 25°C 30°C 39,4°C Tafel slope at low potential (mV/dec.) 43 43 45 The Tafel slope is around 43 mV/decade and it does not considerably change with temperature. According to the obtained Tafel slopes, the following mechanism can be proposed.

Rev. Ivoir. Sci. Technol., 19 (2012) 12 – 25
Lemeyonouin A. G. POHAN and Lassiné OUATTARA
22
(2) (3)
(4) (5)
Where, S represents the active sites on the oxide surface. , , correspond to the adsorption intermediates. and possess the same chemical structure but have different energy state. The process that governs the overall oxygen evolution kinetic is known to depend on the Tafel slope. From the obtained results, it appears that the rate determining step of the OER does not change as the temperature was slightly changed. The rate determining step of the process is found to be equation (4) and that is in accordance with the mechanism proposed in literature [29, 30]. That result indicated that the mechanism of the oxygen evolution reaction was not perturbed under the slight increase of the temperature of the supporting electrolyte. III-2-3. Study of the outer sphere redox couple on the bulk IrO2 electrode in
0,5M KCl After the electrode was used in the slightly heated electrolyte, the same electrode was used in the potassium ferri/ferrocyanide redox couple solution at ambient temperature. The potential scan rate was 50 mV/s. The voltammograms in Figure 5 are obtained after the background correction.
a
b
Figure 5 : Investigation of the outer sphere redox couple on the bulk IrO2
electrode, WE: IrO2; RE: Ag-AgCl; CE: Pt wire ; potential scan rate: 50 mV/s; supporting electrolyte : KCl 0,5 M

Rev. Ivoir. Sci. Technol., 19 (2012) 12 – 25
Lemeyonouin A. G. POHAN and Lassiné OUATTARA
23
The anodic and cathodic peaks generally observed for such a couple are observed in Figure 5a. The concentration of the redox couple was varied from 0 to 10 mM and a linear evolution is observed for current density versus the couple concentration (Figure 5b). The gap between the peak potentials, the ratio of the absolute value of the anodic to cathodic peak current density, apparent equilibrium potential for equimolar redox couple were determined and consigned in Table III. Table III : Deducted parameters from (Figure 5)
C(mM) ∆Ep Ipa/I pC E°’(V/Ag-AgCl) 2,5 0,0733 0,970 0,246 5 0,093 0,939 0,246
7,5 0,117 0,983 0,248 10 0,122 1,036 0,251
One observes that the gap of the peak potential is high than 60 mV and that gap increases as the redox couple concentration increases. The ratio of the peak current density is almost 1 and the apparent (or formal) standard redox potential is equal to 0,246V/Ag-AgCl. That apparent (or formal) standard redox potential value is known to depend on the kind of the electrolyte used and the obtained result is in agreement with that found in literature[31]. From Figure 5b, the diffusion coefficient of the redox couple is about 3,7.10-5 cm2/s for the potassium ferrocyanide and of 3,7.10-5 cm2/s for the potassium ferricyanide. The diffusion coefficients determined in that work are in the same order of magnitude as that found in literature to be around 0,763.10-5 cm2/s [31]. That slight change in the values of the diffusion coefficients could result from the use of the geometric surface area instead of the electrode real surface area for its determination and also from the history of the electrode. Nevertheless, on such an electrode, the coating after having been used in the slightly heated electrolyte led to a quasi-reversible behaviour like the results presented in literature on as grown electrodes utilized only at ambient temperature [25]. Those results demonstrated that no modification of the electrodes structures occurs during its use in the slightly heated electrolyte. That observation is in agreement with the result already obtained in the above investigations that were carried out in perchloric acid used as supporting electrolyte. IV - CONCLUSION The prepared bulk IrO2 electrode presents a ‘’cracked mud’’ structure with aggregate IrO2 particles distributed over the coating surface. The IrO2 surface does not change in morphology when it is used in the slightly heated perchloric acid

Rev. Ivoir. Sci. Technol., 19 (2012) 12 – 25
Lemeyonouin A. G. POHAN and Lassiné OUATTARA
24
electrolyte. The increase of electrolyte temperature slightly from 25°C to 39,4°C led to an increase of the total voltammetric charge about 45%. The external charge (Qext) and the internal charge (Qint) undergo 72,8% and 20,22% increase respectively. The external part of the deposit undergoes significant influence of temperature than the internal part. The increase in the voltammetric charge as the temperature increases has been explained by the increase of the amount of the active sites of the electrode and also by the increase of amount of the protons that were involved in the solid state surface redox process on the electrode surface. As the electrolyte temperature was increased, a decrease of the interfacial electrolyte resistance or a decrease of the proton diffusion resistance inside the film pores occurs.
The activation energies were determined and they were about 4,0 kJ/mol and 3,2 kJ/mol for the low and the high scan rates respectively. The small magnitude of the activation energies could also point out that the process that occurs at the electrode/electrolyte interface is physical rather than chemical. And due to the slow proton diffusion process that takes place inside the coating pores, more energy was necessary to allow the protons to diffuse inside them. The polarization investigation led to Tafel lines that present almost to the same slope which value is around 43 mV/decade. That slope was found to be independent of temperature. As the temperature increases, the rate determining step in the oxygen evolution reaction does not change so is the reaction mechanism. That electrode, even after being used in a slightly heated electrolyte possesses its electrochemical characteristic towards a simple redox couple such as ferri/ferrocyanide.
Acknowledgments
The authors thank Professor Christos Comninellis and his collaborators at the Swiss Federal Institutes of Technology of Lausanne for their help for the physical characterization of the electrode surface.
REFERENCES
[1] - S. Ardizzone; A. Carugati and S. Trasatti, J. Electroanal. Chem., 126 (1981) 287.
[2] - L. J. J. Jansen; L. M. C. Starmans; J. G. Visser and E. Barendrecht, Electrochim. Acta, 22 (1977) 1093.
[3] - A. Nidola, in Electrodes of ConductiveMetallic Oxides, ed. S. Trasatti. Vol. Part B. Amsterdam:(1981) Elsevier.
[4] - L. D. Burke and R. A. Scanell, J. Electroanal. Chem., 175 (1984) 119. [5] - A. De Oliveira-Sousa; M. A. S. Da Silva; S. A. S. Machado; L. A. Avaca
and P. De Lima-Neto, Electrochimica Acta, 45 (2000) 4467-4473.

Rev. Ivoir. Sci. Technol., 19 (2012) 12 – 25
Lemeyonouin A. G. POHAN and Lassiné OUATTARA
25
[6] - M. V. T. Kortenaar; J. F. Vente; D. J. W. Ijdo; S. Müller and R. Kötz, J. of Power Sciences, 56 (1995) 51.
[7] - L. D. Burke and J. M. O'Sullivan, J. Electroanal. Chem., 117 (1981) 155. [8] - P. F. Pickup and V. I. Birss, J. Elecroanal. Chem., 240 (1988) 185. [9] - L. Ouattara; S. Fierro; O. Frey; M. Koudelka and C. Comninellis, J. Appl.
Electrochem., 39 (2009) 1361. [10] - Y. Y. Hou; J. M. Hu; L. Liu; J. Q. Zhang and C. N. Cao, Electrochim.
Acta, 51 (2006) 6258. [11] - J. Backholm; E. Avendano; A. Azens; G. D. M. Azevedo; E. Coronel; G.
A. Niklasson and C. G. Granqvist, Solar Energy Materials and Solar Cells, 92 (2008) 91.
[12] - S. S. Kim and S. D. Kim, Thin Solid Films, 516 (2008) 3673. [13] - B. E. Conway, In Electrochemical Supercapacitors, ed. M. A.
Norwell:(1999) Kluwer Academic Publishers. [14] - S. Trasatti, Electrochim. Acta, 36 (1991) 225. [15] - Y. Takasu and Y. Murakami, Electrochim. Acta, 45 (2000) 4135 [16] - K. W. Kim; E. H. Lee; J. S. Kim; K. H. Shin and B. I. Jung, Electrochim.
Acta, 47 (2002) 2525. [17] - O. Simond and C. Comninellis, Electrochim. Acta, 42 (1997) 2013. [18] - J. V. Dobson; T. Dickinson and P. R. Snodin, J. Elecroanal. Chem., 69
(1976) 215-217. [19] - E. W. Tsai and K. Rajeshwar, Electrochim. Acta, 36 (1991) 27-30. [20] - C. C. Jara; D. Fino; G. Saracco and V. Sepecchia, Chemical Engineering
Science, 62 (2007) 5644. [21] - S. Fierro; L. Ouattara; E. H. Calderon and C. Comninellis, Electrochim.
Acta, 36 (2008) 955. [22] - G. P. Vercesi; J.-Y. Salamin and C. Comninellis, Electrochimica Acta, 36
(1991) 991-998. [23] - S. Nijjer; J. Thonstad and G. M. Haarberg, Electrochimica Acta, 46 (2001)
3503-3508. [24] - Y. E. Roginskaya and O. V. Morozova, Electrochim. Acta, 40 (1995) 1995. [25] - L. Ouattara; T. Diaco; I. Duo; M. Panizza; G. Foti and C. Comninellis, J. of
Electrochem. Soc., 150 (2003) D41-D45. [26] - T.A.F. Lassali; J. F. C. Boodts and L. O. S. Bulhoes, Electrochimica Acta,
44 (1999) 4203-4216. [27] - L. D. Burke and D. P. Whelan, J. Elecroanal. Chem., 162 (1984) 121. [28] - F. Silva; C. Gomes; M. Figueiredo; R. Costa; A. Martins and C. M. Pereira,
J. Electroanal. Chem., 622 (2008) 153. [29] - L. A. D. Faria; J. F. C. Boodts and S. Trasatti, J. Appl. Electrochem., 35
(1990) 831. [30] - C. N. Ho and B. J. Hwang, J. Elecroanal. Chem., 14 (1984) 389. [31] - P. J. Richard and W. R. Fawcett, Langmuir, 14 (1998) 3011