return to competitive pay pricing for the class iii formula daniel smith, esq. special counsel, mdia...
TRANSCRIPT

Return to Competitive Pay Pricing For the Class III Formula
Daniel Smith, Esq.Special Counsel, MDIA
Ryan Miltner, Esq.Counsel, DPNM
Paul ChristConsultant, MDIA

History of Competitive Pay Pricing
• 1961: Department adopts the M-W Pricing Series
• 1994: Department replaces M-W with BFP• declines to adopt end product pricing formula
• 1996 - 2000 FAIR ACT Milk Market Order Reform: Department adopts end product pricing
• rejects competitive pay pricing
• 2007: MDIA Proposes Replacement of End Product Pricing with Competitive Pay Pricing

How Would This Competitive Premium be Used?
• Average competitive pay price would become the new Class III price.
• No change in protein or butterfat pricing.• The other solids price would represent the
residual value of the competitive pay price.• The new Class III price would be one of the
“higher of” values used to set Class I prices.• Purchases of milk in competitive areas would
be deregulated.

Part 1
Defining the Competitive Zones

How to Define Competition
• We chose to use the Herfindahl-Hirschman index (HHI).
• Used by the U. S. Department of Justice in antitrust enforcement.

Eight US Milksheds

Competitive Zone Definition 1
Representation of Most Competitive 25%
Regional Production of Milk,By County (FMMOs)

Counties in FMMO Regions With Most Competition For MilkComprising 25% of Region’s Milk Production (Dec 2008)

Map/Data Set SummaryLargest County-Level HHI
By Milkshed, Up to 25% of Pooled Milk
Milkshed Counties’ % Share of Pooled Milk
Largest County HHI
Central 25.42 .44
Mideast 25.07 .31
Northeast 26.20 .24
Northwest 28.31 >.50
Southeast 25.03 .48
Southwest 25.11 >.50
Upper Midwest 27.64 .15

Competitive Zone Definition 2
Establish Governing Herfindahl Index of
.33

Summary of Competitive Zone Data
Milkshed Name Largest HHI Share
Central Less than .33 17.85%
Mideast 0.31 25.0%
Northeast 0.24 26.20%
Northwest None None
Southeast Less Than .33 10.23%
Southwest Less Than .33 3.55%
Upper Midwest 0.15 27.64&

Central RegionMilkshed Counties with HHI of .33 or less, and Representing
17.85% of Pooled Milk (Dec ’08)
Illinois Iowa Wisconsin
Whiteside Buchanan Grant
Cedar
Chickasaw
Clayton
Dubuque
Jackson
Johnson
Sioux

Mideast Region Milkshed Counties with Lowest HHI Comprising 25% of
Pooled Milk (Dec ‘08)
Indiana Ohio PennsylvaniaElkhart Carroll ArmstrongNoble Columbiana ButlerWayne Highland Fayette
Holmes Lawrence
Maryland Huron Mercer
Garrett Knox Washington Mahoning Westmorelad
Ohio Paulding
Michigan Richland Allegan Stark Barry Tuscarawas Ionia Wayne
Kalamazoo Montcalm Ogemaw

Northeast RegionMilkshed Counties with Lowest HHI Comprising 25% of
Pooled Milk (Dec ‘08)
New York PennsylvaniaHerkimer Berks Livingston Bradford
Montgomery Chester Wayne Cumberland
Wyoming Juniata Lancaster Perry Somerset Susquehanna York

Northwest RegionMilkshed Counties with HHI Less Than .33
Comprising Some Portion of Pooled Milk (Dec ‘08)
None Reported

Southeast MilkshedMilkshed Counties with HHI of .33 or less, and Representing
Some Amount Less than 10.33% of Pooled Milk (Dec ’08)
Kentucky North Carolina Virginia
Adair Alleghany Bedford
Barren Davie Floyd
Green Iredell Franklin
Hart Rowan Washington
Metcalfe Tennessee
Wythe
Taylor Marshal

Southwest MilkshedMilkshed Counties with HHI of .33 or less, and Representing
Some Amount Less than 3.55% of Pooled Milk (Dec ’08)
Texas
Bailey

Upper MidwestMilkshed Counties with Lowest HHI Comprising 27.64%
of Pooled Milk (Dec ‘08)
Wisconsin
Brown Lafayette
Calumet Marathon
Clark Shawano
Dodge Sheboygan
Door Vernon
Fond Du Lac Waupaca

Part 2
ImpactAnalysis

FMMO Pooled Milk Production (Bil. Lbs)and Percentage By Region

Does Competition Make a Difference?
• We compared blend prices for the largest competitive county in each region to mailbox prices for 36 months. We found consistent premiums.
• We asked the Market Administrators to compare the Federal Order statistical uniform price (at test) to gross payments to producers in the competitive counties.
• Any differences were weighted by milk volume and averaged to represent the region.

Competitive Counties Weighted Difference by Milkshed
December 2008 • Milkshed Name Difference• Central $1.22• Mideast $1.02• Northeast $1.10• Northwest no data• Southeast $1.09• Southwest ($0.72)• Upper Midwest $1.14

National Impact
• We have competitive data for six of the seven Federal Order regions. These represented 93.71 percent of Federal Order milk in 2010.
• Using the premiums (and discounts) paid in the qualifying competitive counties in these regions, and weighting them by regional milk volume, the December 2008 premium was $.89.

• The Class III price would go up. This would not affect cheese makers in competitive areas, because they will no longer be subject to Federal Order minimum prices, and most are already paying premium prices.
• Cheese makers who are outside the competitive areas will be subject to higher minimum Class III prices.
• The Class I price would go up whenever the Class III price drives the Class I price.
Impact of the New Price on Buyers

• The Federal Order blend price would go up as both the Class I and Class III prices went up.
• Producers in competitive areas (the Upper Midwest) would get about the same prices, since they already get the premiums.
• Producers outside the competitive areas would likely get more than they now do.
• The Producer Price Differential (PPD) would go down.
Impact of the New Price on Producers
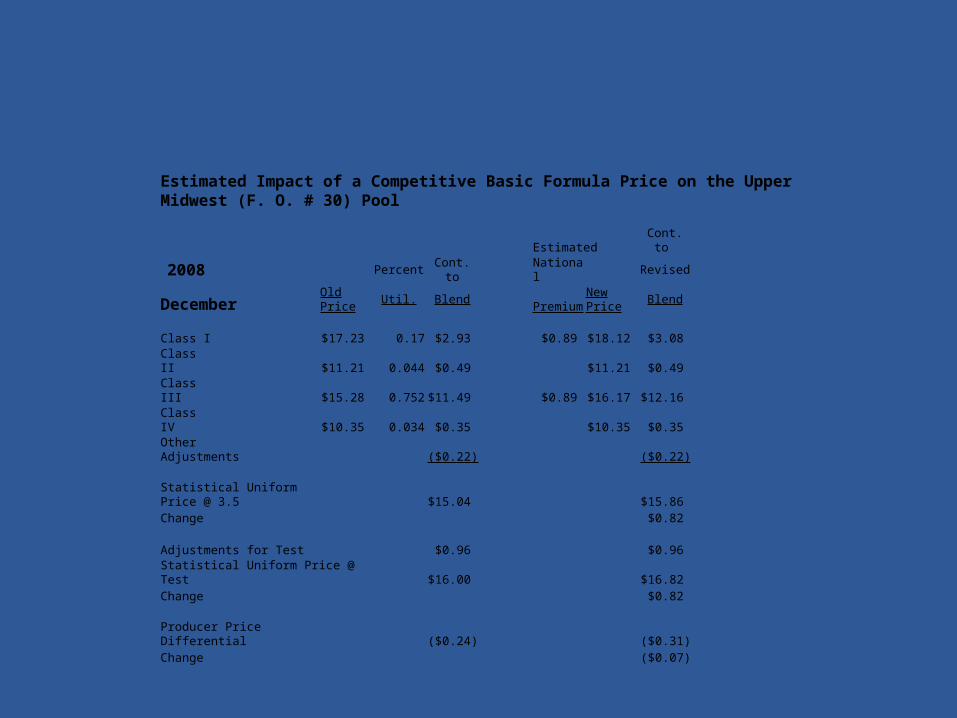
Estimated Impact of a Competitive Basic Formula Price on the Upper Midwest (F. O. # 30) Pool
Estimated Cont. to
2008 Percent Cont. to National Revised
December Old Price Util. Blend Premium New Price Blend
Class I $17.23 0.17 $2.93 $0.89 $18.12 $3.08 Class II $11.21 0.044 $0.49 $11.21 $0.49 Class III $15.28 0.752 $11.49 $0.89 $16.17 $12.16 Class IV $10.35 0.034 $0.35 $10.35 $0.35 Other Adjustments ($0.22) ($0.22)
Statistical Uniform Price @ 3.5 $15.04 $15.86 Change $0.82
Adjustments for Test $0.96 $0.96 Statistical Uniform Price @ Test $16.00 $16.82 Change $0.82
Producer Price Differential ($0.24) ($0.31)Change ($0.07)

Estimated Impact of a Competitive Basic Formula Price on the Upper Midwest (F. O. # 30) PoolAssumed National Competitive Price Premium of $0.89
Estimated Cont. to
2012 Percent Cont. to National Revised
January Old Price Util. Blend Premium New Price Blend
Class I $20.60 0.116 $2.39 $0.89 $21.49 $2.49 Class II $17.67 0.03 $0.53 $17.67 $0.53 Class III $17.05 0.82 $13.98 $0.89 $17.94 $14.71 Class IV $16.56 0.034 $0.56 $16.56 $0.56 Other Adjustments ($0.02) ($0.02)
Statistical Uniform Price @ 3.5 $17.44 $18.27 Change $0.83
Adjustments for Test $0.61 $0.61 Statistical Uniform Price @ Test $18.05 $18.88 Change $0.83
Producer Price Differential $0.39 $0.33 Change ($0.06)

Estimated Impact of a Competitive Basic Formula Price on the Northeast (F.O. # 1) pool
Estimated Cont. to
2008 Percent Cont. to National Revised
December Old Price Util. Blend Premium New Price Blend
Class I $18.68 0.441 $8.24 $0.89 $19.57 $8.63 Class II $11.21 0.175 $1.96 $11.21 $1.96 Class III $15.28 0.233 $3.56 $0.89 $16.17 $3.77 Class IV $10.35 0.151 $1.56 $10.35 $1.56 Other Adjustments ($0.26) ($0.26)
Statistical Uniform Price @ 3.5 $15.06 $15.66 Change $0.60
Adjustments for Test $0.96 $0.96 Statistical Uniform Price @ Test $16.02 $16.62 Change $0.60
Producer Price Differential ($0.22) ($0.51)Change ($0.29)

Estimated Impact of a Competitive Basic Formula Price on the Northeast (F.O. # 1) poolAssumed National Competitive Price Premium of $0.89
Estimated Cont. to
2012 Percent Cont. to National Revised
January Old Price Util. Blend Premium New Price Blend
Class I $22.05 0.412 $9.08 $0.89 $22.94 $9.45 Class II $17.67 0.231 $4.08 $17.67 $4.08 Class III $17.05 0.233 $3.97 $0.89 $17.94 $4.18 Class IV $16.56 0.124 $2.05 $16.56 $2.05 Other Adjustments $0.18 $0.18
Statistical Uniform Price @ 3.5 $19.37 $19.94 Change $0.57
Adjustments for Test $0.89 $0.89 Statistical Uniform Price @ Test $20.26 $20.83 Change $0.57
Producer Price Differential $2.32 $2.00 Change ($0.32)

Estimated Impact of a Competitive Basic Formula Price on the Southwest (F.O. 126) Pool
Estimated Cont. to
2008 Percent Cont. to National Revised
December Old Price Util. Blend Premium New Price Blend
Class I $18.43 0.608 $11.21 $0.89 $19.32 $11.75 Class II $11.21 0.141 $1.58 $11.21 $1.58 Class III $15.28 0.02 $0.31 $0.89 $16.17 $0.32 Class IV $10.35 0.231 $2.39 $10.35 $2.39 Other Adjustments ($0.73) ($0.73)
Statistical Uniform Price @ 3.5 $14.75 $15.31 Change $0.56
Adjustments for Test $1.36 $1.36 Statistical Uniform Price @ Test $16.11 $16.67 Change $0.56
Producer Price Differential ($0.53) ($0.86)Change ($0.33)

What About the Pacific Northwest?• Two Options:
1. Ignore the competitive data for this region because it does not meet the standards of the other regions.
2. Use a special standard for this region. For example, select the largest milk production county among the most competitive 25% of the milk supply (Yakima County, Washington).

Conclusions
• It is possible to measure competition in the raw Grade A milk market.
• Significant competition does exist in some areas of each Federal Order region (except the Pacific Northwest).
• Actual competitive pay prices can be used to set Federal milk order prices.

Measures of Competition
1. Number of handlers from all orders buying milk in a county.
2. Herfindahl Index: Market share of each competitor is squared.
Market Share MS Squared Firm 1 .40 .16 Firm 2 .30 .09 Firm 3 .20 .04 Firm 4 .10 .01 Herfindahl Index: .30