return on investment from online banking services: …web.mit.edu/smadnick/www/wp2/2002-12.pdfreturn...
TRANSCRIPT

Return on Investment from Online BankingServices: An Analysis of Financial Account
Aggregation
Tereza Cristina Melo de Brito CarvalhoMichael Siegel
CISL WP#02-12August 2002
Sloan School of ManagementMassachusetts Institute of Technology
Cambridge, MA 02142

Return on Investment from Online Banking Services: An Analysisof Financial Account Aggregation
Tereza Cristina Melo de Brito CarvalhoAssistant Professor of Information Systems and Technical Director
Laboratory of Computer Architecture and Networks at the University of Sao Paulo - [email protected]
Michael SiegelPrincipal Research Scientist
Sloan School of ManagementMassachusetts Institute of Technology
Abstract
The successful adoption of Financial Account Aggregation requires a careful analysis of the businessmodel. The business model must be defined in a way that provides value to both customers and financialinstitutions. This paper identifies business models for adoption of Account Aggregation technology;proposes a method for calculating the return on investment related to the adoption of this technology; andapplies the proposed method to estimate this return for various business models. The results show howthe return on investment is affected by parameters such as initial investment, customer acquisition andretention cost and product and service cross-selling. This analysis is applicable to financial and non-financial institutions considering Account Aggregation or other new online account applications.
1. Introduction
Account Aggregation is considered to be one of the most compelling technologies on the Internet. From asingle site, customers can access and manage their entire financial lives, gaining transparency, efficiency,savings, and cost reduction. In the United States, it is estimated that by 2003, there will be 22 millionaggregation users corresponding to 40% of total online banking and brokerage customers [McVEY0O].
This paper emphasizes the factors related to the business models and the financial return that the adoptionof this technology can bring. In addition, other aspects are considered such as the constraints of eachbusiness model and recommendations to maximize returns. This paper presents the results of researchwhose objectives are as follows:* Identify business models for adoption of Account Aggregation technology.
* Develop a method for calculating the return on investment related to the adoption of this technology.* Apply the proposed method to estimate the return on investment related to Account Aggregation
technology adoption.
* Analyze the results for different business models.
" Recommend the actions to be taken in order to maximize return on investment.
This paper has five sections. In Section 1 we present the objectives and the motivation for the research. InSection 2 we present a conceptual view of Account Aggregation. In addition, we define the basic AccountAggregation business models that can be adopted by a financial institution. In Section 3 we describe threescenarios for evaluating the return on investment of an Account Aggregation project. We describe thecomponents of the return on investment related to the development, implementation and maintenance of

this project by a financial institution. In Section 4 we present the results of simulations that weredeveloped for each of the three scenarios defined in Section 3. Finally, in Section 5 we present theresearch results, along with recommendations for guaranteeing a positive return on investment for anAccount Aggregation project of a financial institution, and its optimization.
2. Conceptual View about Account Aggregation Business Models
Account Aggregation is a tool that allows individuals to view all their financial, credit, reward programsand other online accounts at different institutions from one site on the Internet.
In the Account Aggregation service arena, there are two major players: the web aggregators and theaggregation service providers. The web aggregators provide technical resources for aggregatingaccounts from different financial and non-financial institutions. They maintain the login and passwordinformation related to these customer accounts. They are also capable of transacting, allowing electronicbill presentment and fund transfer, and providing allocation asset advice based on financial analysis.
The aggregation service providers are the entities (e.g. financial institutions) with which customers havethe contracts to provide aggregation and other services. Financial Account Aggregation services areprovided not only by financial institutions such as banks, credit card and brokerage companies, but alsoby portals and web aggregators.
Financial institutions have two basic ways to provide Account Aggregation. The web aggregatorfunctions can be outsourced or implemented in house by the financial institutions. With the first option, athird party company that maintains the customer information in its database performs the web aggregatorfunctions. With the second option, the financial institution implements the web aggregator functions in-house. The financial institution can acquire this implementation in the market and incorporate newfeatures to achieve differentiated capabilities or it can build the Account Aggregation application from thescratch. The former solution can demand a significant investment and resource commitment.
In the case of Financial Account Aggregation from one single site, customers can access all of theirfinancial accounts. Figure 2.1 presents an example of Financial Account Aggregation where there are twobank accounts, two credit card accounts, and an investment account.
2.1 Basic Concepts
In this section we present the building blocks of an Account Aggregation system, when a financialinstitution provides the Account Aggregation services. The Account Aggregation system is composed ofthree basic components, as depicted in Figure 2.1:
e Financial Accounts: these are comprised of various financial accounts such as brokerage, bank,retirement, and credit card, which are kept by a customer.
* Web Aggregator: this maintains, in its database, information related to customer accounts,usernames and passwords. It is comprised of the following.
1. Browser Emulator: this is deployed to access the web sites of the customer's financial accounts.
2. Information Acquisition: The information provided by the web aggregator can be acquiredprimarily through the following:

a) Screen Scraper: Scrapes out the useful data fields from any online account. The aggregatormust analyze the account web pages and determine where the necessary information islocated on each of these pages. Every bank or financial institution has its web pages laid outin different ways, and the web page layouts can change from time to time. It makes lifedifficult for the account aggregator and frequently leads to delays, lack of accuracy, and lowperformance. Screen scraping is normally done with automated scripts, often without consentor knowledge of the aggregatee (eg, financial institution).
Consumer's Financial AccountsBrokerage Account Credit card Account Retirement plan Account Banks' Account
I. ~ -MEN=
01774N(@
....... * ................... ...... . . . .. .. .. .. ...... .. . .. .. ........... .. ......................... . . . ........... ...Z-----------..................................
Web AggregatorUser's accounts, usernames andpasswords stored in webaggregator's database
I
Browser Emulator
Screen Acquisitor
Value Added Applicationst
Presentation
User single login and- passwords for all
financial accounts
Figure 2.1 - Account Aggregation System Organization
The aggregator logs into the account of customers using their usernames and passwords,which are stored in the database, and retrieves all the desired information. This information isconsolidated and formatted for presentation to the end-user.
As the financial institutions can change their sites from time to time, the screen scraper canretrieve inaccurate data. This lack of accuracy is the most significant drawback of the screenscraping method. In order to avoid such inaccuracy, the aggregator has to check often for website layout changes. This results in poorer performance and higher maintenance costs.
b) Screen Reader: Instead of doing a screen scraper, the web aggregator can simply obtain thedesired information from the aggregatee web sites. This is possible if these web sites areimplemented deploying specific standards developed for the financial services industry, suchas OFX, and standards designed to make web pages more accessible by softwareapplications, such as XML. The aggregator obtains information from the OFX servers.However, the financial institutions can control what data are transmitted via their OFXservers. Thus, the aggregators can only access the data whose access is permitted.

OFX is a more accurate, cost-effective, scalable solution than screen scraping. Unfortunately,OFX and XML are not widely employed for electronic banking, making screen scraping themost deployed alternative at this time.
3. Value-Added Applications: In order to differentiate among Account Aggregation services, it isimportant that the web aggregators support some value-added applications. In the case offinancial institutions, they can support, for instance, fund transfers between accounts fromdifferent institutions and asset allocation, analysis, and interest rate optimization.
4. Presentations: The final web page containing information from the aggregatee accounts shouldbe created and stored in the web server and/or wireless web server. Any normal browser canaccess the web server. The wireless web server can be accessed by mobile phones that support,for example, WAP (Wireless Application Protocol) in the case of 2G technologies.
5. Database: The aggregator stores the customer login, password and account data. The amount andtype of account data vary from one aggregator to another. Most aggregators store transaction datafor a period of up one year.
* Customer Browser: Customers have a single login and password for all financial accounts. Theynormally call the site of the aggregation service provider. At this point, the customers must loginusing this single login and password. If they want to perform more complex transactions, they canjump to the financial institution's web site without have to log in again. The web aggregatorautomatically enters the user's passwords.
2.2 Business Models
The business models to be adopted may vary from country to country and from continent to continent.The models will depend on how the banking industry is organized in each country, on bank empowermentand on local legislation.
The aggregator bank and the aggregatee banks may or may not have an agreement. In the case of noagreement, the information is acquired from aggregatee banks without their knowledge or permission.There has been fierce competition for the first mover advantage and financial institutions will strive tomaximize the number of early customer adopters. After the Account Aggregation service is consolidated,the competition should occur at the post-aggregation service level. It can include financial services atlower cost and higher diversity and quality, but also home shopping services, reward programs alliances,communication, news and information.
If the aggregator bank and the aggregatee banks have an agreement among themselves that establishesrules to be followed for providing aggregation services, they should agree on the time when thistechnology should be adopted and will compete only at the level of post-aggregation services. However,the competitive advantage will be based not only on the quality of the provided services, but also onsecurity issues and brand.
In both cases, the basic business models are as follows:
* Aggregation with Web Aggregator In-House: In this case, the web aggregator function can beimplemented within the aggregator bank. The aggregator bank has a very high initial investmentrelated to the computer and network infrastructure acquisition and the development of the accountaggregation system.

* Aggregation with Outsourced Web Aggregator: In this case, a third party company supports theweb aggregator functions. The aggregator bank normally pays an initial license fee and monthly feeper user to this company.
In the future, some hybrid models can be adopted. For instance, if the financial institutions begin tosupport open standards, they can aggregate in-house accounts that can be accessed via open standards,and they may aggregate via outsourced aggregators accounts that can be accessed only through screenscraping.
3. Return On Investment
The return on investment of the Account Aggregation technology will be evaluated using the calculationof the EBIT (Earnings Before Interest and Taxes) NPV (Net Present Value).
The EBIT is obtained as the revenue of the Account Aggregation project minus the sum of the expensesrelated to investments, fixed and variable costs.
EBIT = Revenues - (Investments + Fixed Costs + Variable Costs)
The return on investments of the Account Aggregation project is a function of the business model to beadopted. In order to evaluate this return, some scenarios are defined in the next section.
3.1 Scenarios For Return On Investment Evaluation
There are three scenarios defined to evaluate the return on Investments of an Account Aggregation projectas follows.
a. Scenario 0 - No Account Aggregation Support: In this scenario, the Account Aggregation serviceis not provided. The purpose of this scenario is to evaluate how much a financial institution will gainor lose if it does not provide Account Aggregation services.
b. Scenario 1 - Aggregation with Web Aggregator In-House: The web aggregator functions areimplemented in-house and the Account Aggregation service is provided without any extra costs to thecustomers. The information from the aggregatee banks is normally obtained through screen scrapingwithout knowledge or permission of the aggregatee banks.
c. Scenario 2 - Aggregation with Outsourced Web Aggregator: A third-party company implementsthe web aggregator functions and the Account Aggregation service is provided without any extracosts to the customers. The information from the aggregatee banks is normally obtained throughscreen scraping without knowledge or permission of the aggregatee banks.
Table 3.1 presents an overview on EBIT components for the two business models: Account Aggregationwith Web Aggregator In-House and Account Aggregation with Outsourced Web Aggregator.
In Scenario 1 the web aggregator can collect revenue from the aggregator bank for the provided service aswell from the aggregatee banks for prioritizing their information on the aggregated pages. services.In Scenario 2, the costs related to computational and network infrastructure, its administration andmaintenance, and contract of broadband access, are paid by the web aggregator and to some extent sharedamong the aggregatee banks.
However, the intangible cost related to the risk involved in outsourcing should also be considered. Theaggregator bank passes the control of its customer accounts to the web aggregator. If a problem occurs,the aggregator bank is likely to be affected by customer dissatisfaction.

Aggregation with Web Aggregation with OutsourcedAggregator in-house Web Aggregator
Investment e Computer and Network * License FeeInfrastructure e Cross-Selling Fee
" Technology Acquisition Fee . Cross-Selling Implementation" CustomizationCustomisation &Implementation
. Cross-Selling Implementation
Fixed Costs * Maintenance and Management o Maintenance Fee* Insurance
Variable Costs o Customer Acquisition o Customer Acquisitiono Customer Retention o Customer Retentiono Customer Attrition Due Account * Customer Attrition Due AAA.ggregation (AA) o AA Fees to Web Aggregator.
Revenue o Customer Acquisition o Customer Acquisitiono Customer Savings o Customer Savings* Cross-Selling o Cross-Selling
Table 3.1 - Components of EBIT for the Aggregator Banks
3.2 Investments
3.2.1 Web Aggregator In-House
In the case of implementing the web aggregator in-house, the following initial investments have to betaken into account.
" Computational and Network Infrastructure: In order to support Account Aggregation, the financialinstitution needs to acquire computational and network infrastructure required to build-up the system.This system will host customer information such as account, login and passwords at other financialinstitutions and software programs to be deployed to support Account Aggregation services.
" Technology acquisition fee: The financial institution can develop an Account Aggregationapplication from the beginning or it can acquire the core system from a vendor. In the later case, atechnology acquisition fee would be paid to this vendor. The major advantage here is the timesavingsin the initial development.
" Customisation and implementation: If the financial institution has decided to purchase the AccountAggregation core system from a vendor, this core system must be customized and complemented withadditional features to assure a differentiated Account Aggregation service. In the case ofimplementation from the beginning, the project would be comprised of various phases, includingfunctional specification, project design, development and tests, and it will likely take more time tobecome operational.
" Cross-Selling implementation: As will be shown later, the cross-selling features are the mostimportant ones to guarantee a positive financial return from an Account Aggregation project. Thepurpose is to cross-sell financial products and services. It requires that the financial institution be ableto access information about the financial products and services that the customer holds at this

institution and other institutions. Based on this information, it would be possible to offer alternativesthat are advantageous to the to customer.
To some extent, the cross-selling implementation requires some degree of integration andinteroperability among database systems in different parts of the organization. These database systemsusually store customer information related to various banking products and services.
3.2.2 The Outsourced Web Aggregator
In the case of outsourcing web aggregator functions, some important initial investments have to be taken,including the following:
* License Fee: when the web aggregator is outsourced to a third-party company, the company chargesthe financial institution a license fee, which represents an initial payment for Account Aggregationservice implementation and for customer data hosting. This license fee varies from $10,000 to$750,000 [MOORE01].
* Cross-Selling License Fee: Cross-selling implementation requires that the financial institution canaccess information about the financial products and services that the customers hold within theinstitution as well as other institutions. If the web aggregator functions are outsourced, at least theinformation related to the other institutions should be provided by the web aggregator. Normally, theweb aggregator charges a fee for this service that varies from 10% to 30% of the AccountAggregation fee (This data was obtained direct from interviews with professionals in the bankingindustry).
" Cross-Selling implementation: This requires a computational infrastructure, the development ofcross-selling applications, and the integration of database systems located in different parts of theorganization. These database systems store customer information related to various banking productsand services.
3.3 Costs
The costs are comprised of fixed costs and variable costs. The fixed costs correspond to the expensesrelated to physical assets, such as computational and network resources. The variable costs involvecustomer marketing and services.
3.3.1 Fixed Costs
3.3.1.1 Web Aggregator in House
The fixed costs include the following.
* Management and Maintenance: The continuous operation of the Account Aggregation servicesshould be assured. The management system is deployed to monitor and control performance, faultoccurrence, security and workload of the Account Aggregation system. Based on the collectedinformation about its operation, it would be possible to perform capacity planning, take correctivemeasures and define maintenance procedures.
* Insurance: Every IT system can experience security threats that are physical or systemic in nature.Examples of a physical threat are fire, flood and any natural or provoked incidents that can causepartial or total system destruction. Example of a system threat would involve any data modification orcorruption caused by voluntary or non-voluntary access, or any data read by unauthorized user.

In the case of physical threat, insurance should cover the system replacement and reinstallation. In thecase of system threat, the security attack can damage one to several customers, who must recover theirlosses.
3.3.1.2 Outsourced Web Aggregator
The fixed costs include only the maintenance fee, which is due to the web aggregator, is related tomanagement and maintenance of web aggregator functions. It includes changes and improvement of theprovided functions.
3.3.2 Variable Costs
3.3.2.1 Web Aggregator in House
The variable costs include the following.
" Customer Acquisition: This cost comprises the marketing budget, which is spent to attract Internetbanking customers to the Account Aggregation services.
There are four categories of customer acquisition costs:
a) Acquisition Cost of new Internet Banking Customers: If customers decide to switch theirInternet banking because their financial institution does not provide Account Aggregation service,the bank should spend the equivalent of the acquisition cost of new online banking customers.
b) Acquisition Cost for Account Aggregation and no Cross-Selling: When a financial institutionwants to persuade online customers to sign up for the Account Aggregation service, it will spendthe equivalent of the acquisition cost for Account Aggregation and no cross-selling.
c) Acquisition Cost for Account Aggregation and Cross-Selling: When a financial institutionwants to convince online customers not only to sign up for the Account Aggregation service, butalso purchase some banking products and services, it will spend the equivalent of the acquisitioncost for Account Aggregation and cross-selling.
d) Acquisition Cost for Account Aggregation and Aggressive Cross-Selling: If the financialinstitution wants to convince online customers to sign up for the Account Aggregation service, andto improve its cross-selling towards customers, it will spend the equivalent of the acquisition costfor Account Aggregation and aggressive cross-selling.
The acquisition cost for Account Aggregation and aggressive cross-selling is the highest, while theacquisition cost for Account Aggregation and no cross-selling is the lowest.
* Customer Retention: This cost includes marketing and services expenses, invested to retaincustomers who have already signed up for Account Aggregation services.
" Customer Attrition Due Account Aggregation: When a financial institution loses customers due totheir dissatisfaction with the Account Aggregation services, there is an associated cost referred to ascustomer attrition cost.
3.3.2.2 Outsourced Web Aggregator
In addition to those costs already described to the Web Aggregator In-house, in the case of theOutsourced Web Aggregator, the variable costs also includes the Account Aggregation Fees to the

Web Aggregator. Besides a license fee, the financial institution will likely pay an Account Aggregationfee to the web aggregator. This fee is charged per active aggregation user. Its value varies from $5 to $12per year [MOORE01].
3.4 Revenues
The Account Aggregation services can generate some revenues such as the following.
* Customer Acquisition due to Account Aggregation: Account Aggregation services can have asignificant value as a customer retention and acquisition tool. By offering Account Aggregationservices, financial institutions can acquire a competitive advantage over other institutions that do notoffer these services, and thus provide a compelling reason for customers to open an account. Suchcustomer acquisition is counted as revenue for the Account Aggregation services.
" Customer savings: The cost savings over traditional delivery channels, of online banking are derivedfrom reduced calls to live customer service centers, reduced application-processing costs, reducedstatement-issuing costs, electronic payment cost savings, and a reduction in direct marketing expensesdue to weak prospects [MOORE01]. The Account Aggregation services are generally used by onlinebanking customers and they do not result in meaningful savings.
" Cross-Selling: Financial institutions can take advantage of access to the customers' aggregatedinformation to support cross-selling and to maximize the returns on many of their banking productsand services. These banking products and services include the following.
* Funds transfer: This can involve accounts within the same bank or accounts from different financialinstitutions. In the case of the Account Aggregation, it is considered only the revenue derived fromthe real time fund transfer between accounts from different financial institutions.
" Asset Allocation: This is one of the most important services that can be provided as a result of anAccount Aggregation offering. Since the financial institution can have access to the customers'aggregated financial information, it knows the amount and where the customers' assets are located.Thus, it is capable of managing the customers' assets in order to maximize their return.
" Credit card: The financial institution knows the customers' aggregated financial information,including which credit cards they hold and how much they pay in annual rates for these credit cards.It can attempt to sell them another credit card at a lower rate or an upgrade of their credit cards (e.g.,from a gold card to a platinum card).
* Consumer loans: Consumers can apply online for bank loans, including consumer, auto and home-secured loans. Online lending generates direct revenues in the form of loan initiation fees and loaninterest income [MOOREO 1]. As the financial institution has customer information, such as accountbalances and goods ownership (e.g., auto), it can offer online lending when it is appropriated.
* Mortgage: Similar to consumer loans, customers can apply for mortgage and credit lines when theywant to purchase, for example, a house or land. The financial institution can offer online mortgageswhen it is proper. The mortgage also generates direct revenues in the form of mortgage initiation feesand mortgage interest income [MOORE01].
* Car Insurance: The financial institution normally knows whether their customers have cars.Through the customers' aggregated information, it can also know if they have car insurance withsome other financial institution or insurance agency. In this case, the financial institution can simply

offer car insurance or car insurance at a lower price than that offered by other financial institutions oragencies.
" Home Insurance: Similar to cars, the financial institution knows the properties that their customersown and if these properties carry insurance. It can offer property insurance or insurance at a lowerprice than that offered by other financial institutions or agencies.
* Brokerage: The financial institution can suggest an investment in stock options and bonds. Forrevenue, the financial institution can earn a percentage of the customer gain (e.g., separately managedaccounts).
* Online Advice: The financial institution can provide online advice based on information that it ownsabout customers' financial life. This service can be charged for based on connection time or trafficvolume.
* Wireless Aggregation: The access to aggregated accounts can be offered through mobile devicessuch as cell phones, deploying WAP (Wireless Application Protocol), or PDAs (Personal DigitalAssistants) [McVey0l]. This type of access provides consumers with a great deal of convenience andwill enhance the usefulness of the Account Aggregation services. This service can be charged forbased on wireless connection duration and on number and type of financial operations that wereperformed.
Table 3.1 shows how the investments, fixed and variable costs, and revenue are distributed in the case ofthe two scenarios, including Aggregation with Web Aggregator In-House and Aggregation withOutsourced Web Aggregator.
4. Account Aggregation Business Model Evaluation
The primary objectives of this work are to evaluate :
* Which Account Aggregation business model yields the greatest return on investment.* How the return on investment is affected by changes in certain project parameters, such as initial
investment, fixed and variable costs, and revenue.* Which of these parameters are more relevant to maximize return on investment.* How do size and type of financial institution influence return on investment.
4.1 Description of Scenarios and Parameters
The business models to be evaluated corresponds to the following scenarios:
a. Scenario 0 - No Account Aggregation Support: The purpose of this scenario is to evaluate thepotential loses by a financial institution to not provide the Account Aggregation service. In this case,the customer attrition rate due to no Account Aggregation Service support should be estimated.
b. Scenario 1 - Aggregation with Web Aggregator In-House: In this model, the initial investment ishigher than the initial investment taken when the web aggregator functions are outsourced. Thisinitial investment is comprised of computer and network infrastructure acquisition, a technologyacquisition fee, customisation and implementation costs, and cross-selling implementation. Normally,the financial institutions have exercised the option of acquiring the basic technology platform, whosefeatures are customized and complemented in order to fulfil the requirements for a differentiatedAccount Aggregation service.

The fixed costs include the management, maintenance and insurance expenses. The most relevantvariable costs are customer acquisition and retention costs.
The main source of revenue is cross-selling. This model is evaluated according to how the return oninvestments of the Account Aggregation is affected by changes to the computer and networkinfrastructure cost, the customer acquisition cost, the customer retention cost and the level of cross-selling level. This evaluation is performed for small, medium and large banks.
c. Scenario 2 - Aggregation with Outsourced Web Aggregator: A third-party company implementsthe web aggregator functions, and the Account Aggregation service is provided without cost. Theinformation from the aggregatee banks is normally obtained through screen scraping withoutknowledge or permission of the aggregatee banks.
In this case, the financial institution pays the initial license fees to the web aggregator. The licensefees are for the Account Aggregation service provision and the cross-selling support when applicable.Some financial institutions are implementing the Account Aggregation services in two phases: withand without cross-selling support.
The relevant variable costs are related to the customer acquisition, customer retention and theAccount Aggregation fees paid per customer to the web aggregator.
The main source of revenue is the cross-selling. This model is evaluated based on how the return oninvestment of the Account Aggregation project is affected by changes of the customer acquisitioncost, the customer retention cost, the web aggregator fees and the cross-selling level. This evaluationis performed for small, medium and large banks.
4.2 Simulation Assumptions
In order to evaluate the return on investment of Account Aggregation for various scenarios and differentparameters, the following assumptions were made:
" Bank Size: Three basic bank sizes according to the number of its online customer accounts wereconsidered. Small banks were taken those with 240,000 to 1.6 millions of online accounts; mediumbanks, those with 2.8 to 6.0 millions online accounts; and large banks, those with 8.0 to 16 millionsonline accounts.
" Period: the simulation was run for five consecutive years. Year 1, the Account Aggregation projectis initiated and all meaningful investments are made. The cross-selling functions do not have to beimplemented in Year 1. Its implementation and support depend on the value of cross-selling level ineach specific year.
* Average Percentage of Active Account Aggregation: Normally, less than 50% of the AccountAggregation accounts are kept active after their enrolment. [GRAEBER01]
* Customer growth rate: Three customer growth rates were assumed: regular banking, Internetbanking and Account Aggregation customer growth rate. The Account Aggregation customer is anInternet banking customer. An Internet banking customer is a banking customer. The regularbanking customer growth rate is about 1% and is a very steady value. The other rates have increasedfrom year to year and were obtained from specialized literature [MOOREO1].
* Cross-Selling level: The financial institutions can implement cross-selling after Year 1. If the cross-selling level is equal to zero, the cross-selling functionality is not supported. The number of financialproducts and services that can be offered as cross-selling can vary from one year to the next. Thisvariation is translated in the cross-selling level value.
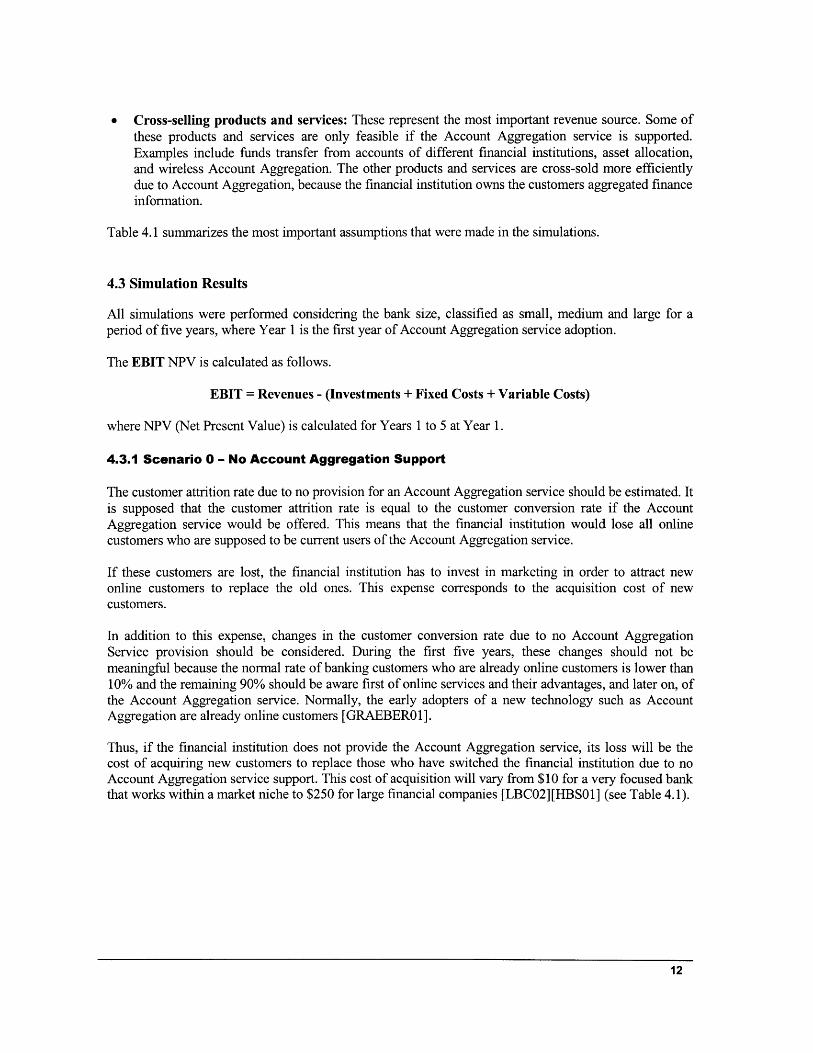
* Cross-selling products and services: These represent the most important revenue source. Some ofthese products and services are only feasible if the Account Aggregation service is supported.Examples include funds transfer from accounts of different financial institutions, asset allocation,and wireless Account Aggregation. The other products and services are cross-sold more efficientlydue to Account Aggregation, because the financial institution owns the customers aggregated financeinformation.
Table 4.1 summarizes the most important assumptions that were made in the simulations.
4.3 Simulation Results
All simulations were performed considering the bank size, classified as small, medium and large for aperiod of five years, where Year 1 is the first year of Account Aggregation service adoption.
The EBIT NPV is calculated as follows.
EBIT = Revenues - (Investments + Fixed Costs + Variable Costs)
where NPV (Net Present Value) is calculated for Years 1 to 5 at Year 1.
4.3.1 Scenario 0 - No Account Aggregation Support
The customer attrition rate due to no provision for an Account Aggregation service should be estimated. Itis supposed that the customer attrition rate is equal to the customer conversion rate if the AccountAggregation service would be offered. This means that the financial institution would lose all onlinecustomers who are supposed to be current users of the Account Aggregation service.
If these customers are lost, the financial institution has to invest in marketing in order to attract newonline customers to replace the old ones. This expense corresponds to the acquisition cost of newcustomers.
In addition to this expense, changes in the customer conversion rate due to no Account AggregationService provision should be considered. During the first five years, these changes should not bemeaningful because the normal rate of banking customers who are already online customers is lower than10% and the remaining 90% should be aware first of online services and their advantages, and later on, ofthe Account Aggregation service. Normally, the early adopters of a new technology such as AccountAggregation are already online customers [GRAEBERO1].
Thus, if the financial institution does not provide the Account Aggregation service, its loss will be thecost of acquiring new customers to replace those who have switched the financial institution due to noAccount Aggregation service support. This cost of acquisition will vary from $10 for a very focused bankthat works within a market niche to $250 for large financial companies [LBC02][HBS01] (see Table 4.1).

Type of Description DefaultInformation AssumptionsGeneral Bank Size - Number of Online Customer AccountsInformation o Small 240 k-1.6 mil
" Medium 2.8 - 6.0 mil
" Large 8.0 - 16 milAverage percentage of active Account Aggregation users 50%Banking customer growth Rate (per year) 1 %Discount rate (per year) 12%Mortgage rate (per year) 8%
Banking License fee for Account Aggregation (initial payment) $ 10K - $750KCosts Cross-selling fee (per year) (percentage of license fee) 10% - 30%
Account Aggregation fee (per customer per year) $5 - $12Computer & network infrastructure per customer $ .25 - $ 1Acquisition cost of new online customers (per year) $ 40 - $ 200Acquisition cost for A Aggregation & no X-Selling (per year) $ 3 - $ 9Acquisition cost for A Aggregation and X-Selling (per year) $ 4.5 - $ 18Acquisition cost for AA and aggressive X-Selling (per year) $ 6 - $ 24Customer retention cost (per year) $25- $75
Banking Average number of fund transfers per year 10Income Average Fee for asset allocation management 1% of Assets
Average percentage of AA online customer applying for credit card per 1 %yearAverage annual fee for credit card $ 20Average annual interest for credit card $25Average consumer loan $ 10,000Percentage of AA online customers applying for consumer loans annually 0.45 %Average mortgage $ 100,000Percentage of AA online customers applying for mortgage annually 0.30%Average car value for insurance $20,000Percentage of AA online customers applying for car insurance per year 5.00 %Average home value for insurance $150,000Percentage of AA online customers applying for home insurance per year 3.00 %Average health insurance value per year $ 1,500.00Percentage of AA online customers applying for health insurance per year 5.00 %Average value of brokerage applications $ 220.00Percentage of AA online customers doing brokerage operations per year 2.00 %Average expenses with online advice $10.00Percentage of online customers using online advice per year 1.00 %Average annual fee for wireless aggregation $ 24.00Percentage of online customers using wireless aggregation per year 3.00 %
Table 4.1 - Primary Assumptions
Figure 4.1 shows how much the banks of various sizes will lose if they do not provide an AccountAggregation service. It presents the NPV from Year 1 to Year 5 at Year 1 for different bank sizes (from240,000 online customer accounts to 16 million) and acquisition costs varying from $40 to $200.

Loss x Bank Size x Acquisition Cost240000 1600000 4000000 8000000 16000000
$0
-$500,000,000
-$1,000,000,000
0 -$1,500,000,000
-$2,000,000,000
-$2,500,000,000
-$3,000,000,000
Bank Size (Number of Online Accounts)
Annual Acquisition Cost per Customer
- - - - Mnimum $40.00 Typical $100.00 - Maximum $200.00
Figure 4.1 - Loss Evaluation for No Account Aggregation Provision
4.3.2 Scenarios I and 2 - Aggregation with Web Aggregator In-House and Outsourced
For Scenarios 1 and 2, it was determined how the return on investment for Account Aggregation isaffected by changes in the customer acquisition cost, the customer retention cost and the cross-sellinglevel. In Scenario 1, the computer and network infrastructure cost is also an important component becauseit increases with customer growth. Similarly, in Scenario 2, the Account Aggregation fee that is paid tothe web aggregator should be considered.
4.3.2.1 Customer Acquisition Cost
In the case of the Scenario 1, if the customer retention cost, the computer and network infrastructure cost,and the cross-selling level are kept at typical values, and the acquisition cost varies from $4.5 to $18[GRAEBER01], it can be seen that the earnings of the Account Aggregation project are greater for loweracquisition costs (see Figure 4.2-a left). The same result was obtained for the Scenario 2, keeping thecustomer retention cost, Account Aggregation fee and cross-selling level at typical values and varying theacquisition cost within the same range defined for Scenario 1 (see Figure 4.2-b right).
EBIT x Bank Size x Acquisition Cost$250,000 000
$200,000,000
L$150,000,000Z
$100,000,000
$50,000,000 -
$0240000 1600000 4000000 8000000 16000000
Bank Size (Number of Online Accounts)
Annual Acqusition Cost per Customer
- - - - Mrinum $4.50 Typical $9.00 ------ Maximum$18.00
EBIT x Bank Size x Acquisition Cost$250,000,000
$200,000,000
$150,000,000 ..Z
$100,000,000
$50,000,000
$0240000 1600000 4000000 8000000 16000000
Bank Size (Number of Online Accounts)
Anual Acqusition Cost per Customer
---- Mnrium$4.50 - Typical$9.00 -... n. Maium$18.00
Figure 4.2 -Evaluation of EBIT as function of Bank Size and Acquisition Cost for Scenarios 1 and 2

Comparing the charts in Figure 4.2, it can be seen that both scenarios present the same degree of earningsvariation when the acquisition cost varies.
4.3.2.2 Customer Retention Cost
In the case of the Scenarios 1 and 2, if the customer acquisition cost, the Account Aggregation fees, thecomputer and network infrastructure cost, and the cross-selling are kept at typical values and the customerretention cost varies from $25 to $75 [GRAEBER01], the earnings of the Account Aggregation projectdecrease, but remain positive (Figure 4.3).
EBIT x Bank Size x Retention Cost$300,000,000
$250,000,000
$200,000,000
$150,000,000
$100,000,000
$50,000,000
$0240000 1600000 4000000 8000000 1600001
Bank Size (Number of Online Accounts)
Annual Retention Cost per Customer
- - - - Minimum $25.00 -- Typical $50.00 ------- Maximum $75.00
$250,000,000
$200,000,000
$150,000,000z
w $100,000,000
$50,000,000
$0
EBIT x Bank Size x Retention Cost
240000 1600000 4000000 8000000Ban* Size (Nunter of Online Accomts)
Ana Redan Cost Per Custom- - - - Mnimirn$25.00 Typical $50.00 ---- mum $75.00
Figure 4.3 - Evaluation of EBIT as function of Bank Size and Retention Cost for Scenarios 1 and 2
The customer retention cost is related to marketing and services that are provided in order to retaincustomers who were already acquired. It has less influence on the final earnings of the AccountAggregation project than the acquisition cost. It can be easily explained because the total acquisition costcorresponds to a more significant portion of the total cost than the total retention cost.
4.3.3.3 Cross-Selling
For typical values of the acquisition cost, the retention cost, the computer and network infrastructure costand the aggregation fee, it is possible to evaluate the influence of cross-selling in the return oninvestment, taking the following into account.
* Different costs of the financial product and services.* Different levels of cross-selling: The level of cross-selling is related to the percentage of Account
Aggregation customers who are cross-sold.
Table 4.1 presents typical values for financial products and services, such as credit cards, loans,mortgages and insurance. The minimum and maximum values correspond respectively to half and doubleof the typical values. Some of these values are taken from specialized literature [GRAEBER01],[MOORE01], [MOORE2], [McVEYOO] and others from interviews with professionals from the bakingindustry. Table 4.2 contains the values that were adopted for both typical and aggressive levels of cross-selling. It is assumed that the cross-selling level increases from year to year since the Year 1, when theAccount Aggregation project was implemented [GRAEBER01].

Year 1 Year 2 Year 3 Year 4 Year 5Typical 0.10 0.12 0.14 0.18 0.24Aggressive 0.10 0.14 0.18 0.22 0.28
Table 4.2 - Cross-Selling Levels
In addition, it was assumed that not all financial products and services are provided in the first year ofAccount Aggregation adoption. Table 4.3 shows the evolution of the financial product and serviceoffering during the first five years since the Account Aggregation support [This information was obtainedfrom interviews with professionals in the banking industry].
Year 1 Year 2 Year 3 Year 4 Year 5Bill Payment x x x x x
Fund Transfer x x x x x
Asset Allocation Management x x x
Credit Card x x x x x
Consumer Loan x x x x x
Mortgage x x x x xCar Insurance x x x x
Home Insurance x x
Health Insurance x x
Brokerage x x x x x
Online Advice x x x
Wireless Aggregation x x x
Table 4.3 - Financial Offerings during the first 5 years since Account Aggregation adoption
For different cross-selling levels, different earnings were achieved as follows:
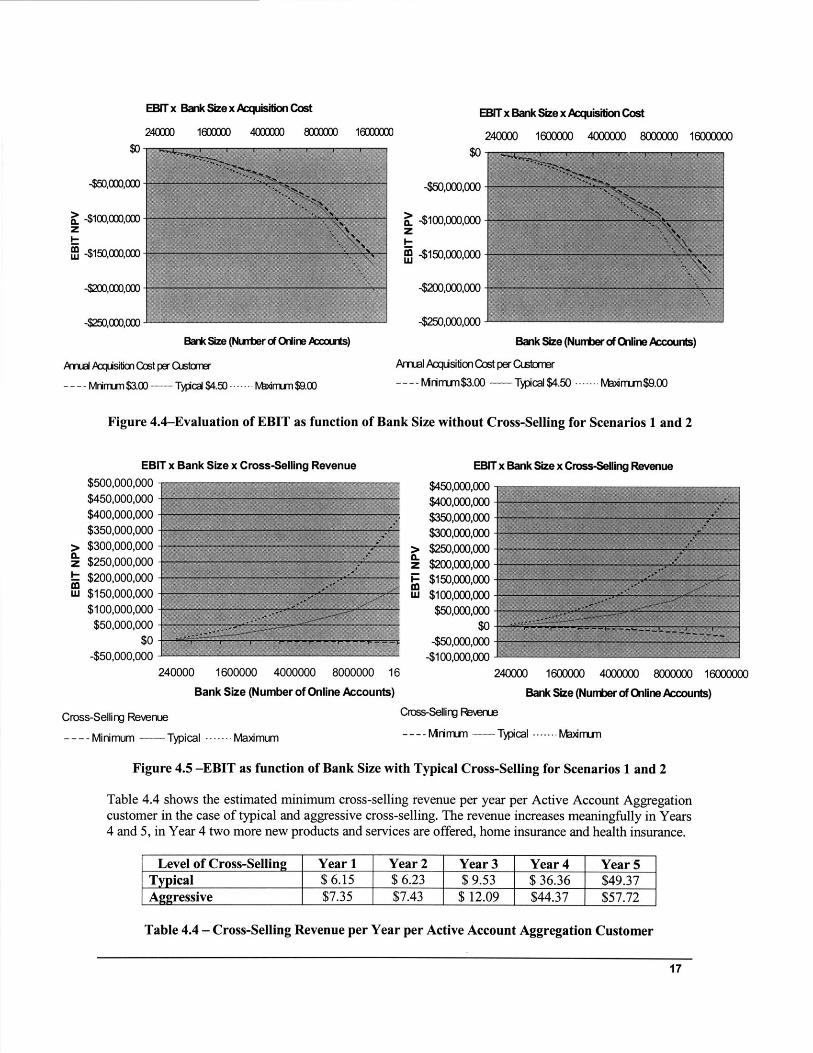
* No cross-selling: When cross-selling functions are not supported, Account Aggregation incurs lossesfor Scenarios 1 and 2. Figure 4.4a shows the EBIT NPV for Years 1 to 5 at Year 1 for Scenario 1.The EBIT NPV has a negative value for different acquisition costs, varying from $5 to $20, and forall bank sizes. Similar values of EBIT NPV are obtained for Scenario 2 (Figure 4.4b).
* Typical cross-selling: When cross-selling functions are implemented, the return on investment ispositive for typical and maximum revenue levels of the cross-sold products and services for bothScenarios 1 and 2. Figure 4.5a shows the EBIT NPV for Years 1 to 5 at Year 1 for Scenario 1. LowerEBIT NPVs are obtained for Scenario 2 for all bank sizes (Figure 4.5b).
* Aggressive cross-selling: In the case of aggressive cross-selling, the financial institution tries to pushproduct and service sales through a more focused marketing based on market segmentation. Thismarket segmentation is defined taking as basis the customers' profile, which can be known throughthe aggregated data owned by the financial institution. In addition, the financial institution offers itsproducts and services to customers more often than in the case of typical cross-selling.
When aggressive cross-selling is delivered, the return on investment is positive for typical andmaximum revenue levels of the cross-sold products and services for both Scenarios 1 and 2. Figure4.6a presents the EBIT NPV for Years 1 to 5 at Year 1 for Scenario 1. Lower EBIT NPVs areobtained for Scenario 2 for all bank sizes (Figure 4.6b).
EBIT x Bank Size x Acquisition Cost
240000 1600000 4000000 8000000 16000000
$0
450,000,000
( -$100,000,000z
-$150,000,000
-$20,000,000
$250,000,000
Bank Size (Nuter of Online Acunts)
- - - - Mninun $3.00 - Tpical $4.50 -- -dn um$9.00
EBIT x Bank Size x Acquisition Cost
240000 1600000 4000000 8000000 16000000$0
-$50,000,000
a -$100,000,000z
-$150,000,000
4200,000,000
-$250,000,000
Bank Size (Nunter ofOnline Accounts)
Amm- Acqusition Cost per Cwtomer
- - - - Mnirm$3.00 - Typical $4.50 -- Mxirrum$9.00
Figure 4.4-Evaluation of EBIT as function of Bank Size without Cross-Selling for Scenarios 1 and 2
EBIT x Bank Size x Cross-Selling Revenue$500,000,000$450,000,000$400,000,000$350,000,000
> $300,000,000z $250,000,000I $200,000,000w $150,000,000
$100,000,000$50,000,000
$0-$50,000,000
240000 1600000 4000000 8000000
Bank Size (Number of Online Accou
Cross-Selling Revenue
- - - -Minimum - Typical ------- Madmum
EBIT x Bank Size x Cross-Selling Revenue
$450,000,000$400,000,000$350,000,000$300,000,000$250,000,000$200,000,000$150,000,000$100,000,000
$50,000,000$0
450,000,000-$100,000,000
240000 1600000 4000000 800000016E
nts) Bank Size (Number of Online Accounts)Ciss-Selirg - RM m Te
----Mnimun -- Typical...Maim
Figure 4.5 -EBIT as function of Bank Size with Typical Cross-Selling for Scenarios 1 and 2
Table 4.4 shows the estimated minimum cross-selling revenue per year per Active Account Aggregationcustomer in the case of typical and aggressive cross-selling. The revenue increases meaningfully in Years4 and 5, in Year 4 two more new products and services are offered, home insurance and health insurance.
Level of Cross-Selling Year 1 Year 2 Year 3 Year 4 Year 5Typical $ 6.15 $ 6.23 $ 9.53 $ 36.36 $49.37Aggressive $7.35 $7.43 $ 12.09 $44.37 $57.72
Table 4.4 - Cross-Selling Revenue per Year per Active Account Aggregation Customer
16000000

EBITx Bank Size x Cross-Selling RevenueEBIT x Bank Size x Cross-Selling Revenue
$600, 000 $E00,000,000
$500,000,000 $500,000,000
>$400,000,000 $400,000,000
Z $300,000,000 IL$300,000,000
$00,000,000 $200,000,000
$00000,000$100,000,000$0
$
S$200,000,000w
240000 1600000 4000000 8000000 1600000 -$100,000,000
Bank Size (Number of Online Accounts) Bank Size (Nmnber of Wine Aouni
CmssSdlirU Fberw QOss-Selling lemwMinim - Typcal -...... Maximm - - - -Mnimumn - Typical -.... - idrum
Figure 4.6 - Evaluation of EBIT as function of Bank Size with Aggressive Cross-Selling
Comparing the different levels of cross-selling, it was verified that if the cross-selling is not supported,the Account Aggregation project earnings tend to be negative. In the case of the typical and theaggressive cross-selling, the earnings have positive values when the revenue from products and servicesare at typical and maximum values. The aggressive cross-selling always results in greater earnings thanwith typical cross-selling.
4.3.3.4 Account Aggregation Fee
In Scenario 2, the web aggregator functions are outsourced. Here, the financial institution must pay aninitial license fee at project start-up and a monthly per user Account Aggregation fee. This AccountAggregation fee varies from $5 to $12 per year [MOORE02].
Figure 4.7 shows how the return on investment of the Account Aggregation project is influenced by theAccount Aggregation fee variation for typical values of acquisition cost, retention cost and cross-selling.Within this range, the Account Aggregation fee has less impact on the earnings than acquisition cost,retention cost and cross-selling.
4.3.3.5 Computer and Network Infrastructure Costs
In Scenario 1, the computer and network infrastructure costs are comprised of an initial investment and anannual investment due to the customer base growth. The initial investment includes the acquisition of thecomputer and network infrastructure, as well as the technology acquisition fee and the customisation andimplementation cost. It is assumed that the initial system has a scalability of 30%. Then, if the customerbase growth rate per year is greater than 15%; it becomes necessary to do new investments in thecomputer and network infrastructure.
For typical values of the customer acquisition cost, the customer retention cost and the cross-selling levelsand for the computer and network costs per user varying from $0.25 to $1.00, earnings have positivevalues for all bank sizes (Figure 4.8). The computer and network cost has less impact on the earningsvalues than acquisition cost, retention cost and cross-selling.

EBIT x Bank Size x Account Aggregation Fee
$200,000,000$180,000,000$160,000,000$140,000,000
i $120,000,000zp $100,000,000g $80,000,000
$60,000,000
$40,000,000$20,000,000
$0240000 1600000 4000000 8000000 16000000
Bank Size (Number of Online Accounts)
Annual Account Aggregation Fee---- Minimum $5.00 Typical$10.00 . Maximum $12.00
Figure 4.7 - Evaluation of EBIT as function of Bank Size and Account Aggregation Fee
4.3.3.6 The Active Account Aggregation Customer
Finally, it is important to note that the percentage of active Account Aggregation customers has a majorimpact on Account Aggregation returns, as it can be seen in Figure 4.9. As the cross-selling is the mostimportant source of revenue, if a lower percentage of the Account Aggregation customers are cross-sold,it immediately results in lower earnings. This indicates that the financial institution should attempt tokeep these customers active through focused marketing or promotion campaign.
EBIT x Bank Size x Computer and Network Cost
$250,000,000
$200,000,000
2 $150,000,000zI-
2 $100,000,000
$50,000,000
$0240000 1600000 4000000 8000000 16000000
Bank Size (Number of Online Accounts)
Annual Computer and Network Cost per Customer- - - - Mnimum $0.25 Typical $0.50 . -Maximum $1.00
Figure 4.8 - Evaluation of EBIT as function of Bank Size and Computer and Network Cost

EBIT x Bank Size
180,000 000
160,000,000140,000 000
> 120,000 000I.z 100,000,000
| 80,000 000LU60,000,000
40,000 000
20,000 000
0240000 1600000 4000000 8000000 16000000
Bank Size (Number of Online Customers)
Percentage of Active Account Aggregation
---- 30% 40% ------- 50%
Figure 4.9 - Impact of Active Account Aggregation on EBIT
4.4 Web Aggregator In-House versus Outsourced
In Scenario 1, if the computer and network costs vary within the specified range, the simulation revealsthat they do not have a meaningful impact on the final return on investment. Similar results were obtainedfor the Account Aggregation fee in Scenario 2.For both scenarios, the cross-selling and the customer acquisition cost are the factors that have thegreatest effect on the return on investment. They are followed by the customer retention cost. Thecustomer acquisition cost should be reduced through well-focused marketing and proper marketsegmentation. The cross-selling should be improved through better knowledge of customer needs and amore comprehensive offer of financial products and services.
Comparing Scenarios 1 and 2 with Scenario 0, it was verified that Scenario 0 and Scenarios 1 and 2without cross-selling support have a negative EBIT NPV. Both Scenarios 1 and 2 will have a positiveEBIT NPV for typical and aggressive cross-selling when the financial products and services have at leasttypical revenues. Figure 4.10 compares the NPV for the Scenarios 0 and 2 with typical, aggressive and nocross-selling. Similar results were obtained for Scenario 1.
The business model associated with Scenario 1 is more profitable and results in somewhat earlier earningsthan the business model associated with Scenario 2. Given typical values for the cross-selling, theacquisition cost, the retention cost and the computer and network cost, Scenarios 1 and 2 begin togenerate a significant positive earnings in the fourth year after the Account Aggregation project waslaunched (see Figures 4.11 a and b).

EBIT NPV x Bank Size
$400,000,000$200,000,000
$0
> -$200,000,000z -$400,000,0002 -$600,000,000W -$800,000,000
-$1 000,000,000-$1,200,000,000-$1,400 000,000 .......
240000 1600000 4000000 8000000 16000000Bank Size (Nunber Online Acounts)
No AccountAggregation No Cross-Selling- - Normal Cross-Selling - Aggressive Cross-Selling
Figure 4.10 - EBIT Comparison for Scenario 0 and 2
5. Account Aggregation Analysis
5.1 Business Model Analysis
Two basic business models were analyzed Aggregation with Web Aggregator In-House andAggregation with Outsourced Web Aggregator.
For each of these business models, the EBIT of an Account Aggregation project was estimated and theimpact on these earnings related to the customer acquisition cost, customer retention cost, the cross-selling level, the Account Aggregation fee paid to the web aggregator, the computer and network cost,and the Account Aggregation cost charged to the customer, were evaluated. This evaluation wasperformed through a series of simulations, the results of which were discussed in Section 4.
The following are the primary conclusions of this investigation.
* Account Aggregation is a compelling technology that should become a commodity in the sense thatmost important banks will provide it, and it will represent no more a differentiated competitiveadvantage. If the financial institutions decide not to provide Account Aggregation service, they willlose customers and the acquisition cost of new customers to replace old ones will be significant. Inthe case of the simulations, the proposed business models were compared to the business modelwithout the support of an Account Aggregation service. Taking into account a steady acquisition costover a period of five years, the loss for not supporting Account Aggregation is very high, particularlyfor the larger banks.
* Account Aggregation services without cross-selling results in losses for a financial institution. Itmeans that Account Aggregation makes little sense without cross-selling, especially in long termwhen it will turn a commodity. It is better to provide Account Aggregation without cross-sellinginstead of not providing Account Aggregation at all.

Scenario I - EBIT per Year for Different Bank Sizes
$350,000,000$300,000,000$250,000,000$200,000,000
|- $150,000,000W $100,000,000
$50,000,000-$5li00
-$50,000,000-$100,000,000
Period since the Adoption of Account Aggregation
Scenario 2 - EBIT per Year for Different Bank Sizes
$350,000,000
$300,000,000$250,000,000
$200,000,000
|- $150,000,000
u $100,000,000
$50,000,000$0
-$50,000,000-$100,000,000
Period Since Account Aggregation Adoption
Bank Size (Number of Online Accounts)M 240 K * 800 K El 1.6 mil E 2.8 mil E 4.0 mil E 6.0 mil 0 8.0 mil[512 mil 0 16 mil
Figure 4.11 - EBIT per Year since Account Aggregation Adoption for Scenarios 1 and 2
Two levels of cross-selling were considered: typical and aggressive. The typical level supposes that,in Year 1 of the Account Aggregation adoption, only 10% of the Account Aggregation customers willbe cross-sold, and its level reaches the maximum value of 24% in Year 5. The aggressive level beginsat the same start value, increases faster and reaches 28% in Year 5. For these cross-selling levels,three revenue ranges of the cross-sold products and services were defined: minimum, typical andmaximum. The typical corresponds to the current price of these products and services, the minimumto the half of the typical values, and the maximum to the double of the typical values.
For the typical level of cross-selling and the typical revenue of the cross-sold products and services,the earnings of the Account Aggregation project is positive, but very sensitive to the revenue of thosecross-sold products and services. If there is some reduction in this revenue, the earnings tend to benegative.
Theoretically, then, the solution would be to increase the revenue (increasing, for example, the priceof the products) or the cross-selling level. But the first option may have to be discarded, becauseAccount Aggregation makes the banking market even more competitive and should drive downprices. Then the only solution would be to enhance the level of cross-selling. The enhancement ofcross-selling can be achieved through very focused marketing and an integrated CRM solutioncapable of pooling aggregated data to produce sophisticated customer profiles [McVEYOO].
* Another important component of an Account Aggregation project is the cost of customer acquisition,which is related to marketing expenses. It should be minimized through focused marketing strategybased on sophisticated customer profiles.
* The cross-selling and the customer acquisition cost are followed by the customer retention cost. Theretention cost is related to the marketing and services expenses incurred in retaining AccountAggregation customers. As the Account Aggregation is considered a sticky technology, in the longrun, it will be necessary to spend less to retain customers. As consequence, the effect of the retentioncost on the earnings of the Account Aggregation project tends to be low [McVEYOO].
* In the case of the outsourced web aggregator, the Account Aggregation fee paid to the webaggregator has no major impact on the earnings of the Account Aggregation project. If a financialinstitution has outsourced the web aggregator, it normally implements the cross-selling in-house andpays the web aggregator for the customer data necessary to implement the cross-selling. Thispayment corresponds to an annual fee, and has no major impact on the final project earnings.
* When the web aggregator is outsourced, the Account Aggregation project begins to have a positivevalue in the fourth year. If it is not outsourced earnings will also begin in the fourth year but will besomewhat greater. This implies that the Aggregation with Web Aggregator In-House is the mostprofitable.
* Finally, the percentage of active Account Aggregation accounts has a significant impact on projectearnings. In the simulations, it was assumed a percentage of 50% active customers, however theactual percentage may be much lower. Thus, it is recommended that financial institutions adopt astrategy in order to keep active a higher percentage of the aggregated accounts.
5.2 Short and Long-Term Recommendations
Based on the analysis of return on investments and on the trends of the Account Aggregation, we makethe following recommendations:
* As Account Aggregation is a sticky technology and it is very important to maintain the relationshipwith the customer, the first mover advantage is crucial.
If the financial institution decides to implement the web aggregator functions in-house, it will takemore time to provide the Account Aggregation service than those financial institutions that outsourceit. Thus, in the short run, to outsource the web aggregator function seems to be a reasonable solution.However, it should move towards an in-house implementation due to greater earnings and controlover the customer data. To have control over customer data gives the financial institution moreautonomy to implement cross-selling and protection against security, as well as the ability to addressother administrative problems with the web aggregator. If the web aggregator company is sold to a

competitor financial institution, it cannot be guaranteed what will happen with the other aggregatedfinancial institutions.
An intermediary solution would be to acquire the Account Aggregation system from market vendorsand then customize it. This approach decreases the time to launch the Account Aggregation service,and, in the long run, turns the Account Aggregation project more profitable.
* Cross-selling has a very positive impact on the earnings of the Account Aggregation project. Toenhance it, sales tool, such as sales advisor [URBANO2], and an integrated CRM solution capable ofpooling aggregated data to produce sophisticated customer profiles, can be adopted. However, theimplementation of the cross-selling function requires integrated data not only of the investment andcommercial banks, but also of the credit card operators. Normally, there is not such integration in thebanks. Thus, the implementation of cross-selling functions is not straightforward and it will take time.
* Screen scraping technology has problems with accuracy and scalability. So, in the long run, AccountAggregation should move towards an open solution and continue to support screen scraping in orderto access institutions that do not adopt open standards.
* Cross-selling has a very positive impact on the earnings of the Account Aggregation project. Toenhance it, sales tool, such as sales advisor [URBANO2], and an integrated CRM solution capable ofpooling aggregated data to produce sophisticated customer profiles, can be adopted. However, theimplementation of the cross-selling function requires integrated data not only of the investment andcommercial banks, but also of the credit card operators. Normally, there is not such integration in thebanks. Thus, the implementation of cross-selling functions is not straightforward and it will take time.
* Financial institutions should attempt to improve the percentage of the Account Aggregationcustomers who continue to use the service after enrollment.
7. Acknowledgements
The authors would like to thank a number of organizations that supported this research, including but arenot limited to Fleet Bank, Suruga Bank, Citibank, Bradesco, Merrill Lynch, and the Center for eBusinessat MIT.
8. References
ABRIL, L.; MADNICK, S.; SIEGEL, M. Information Aggregation: Changing the Way Businesses doBusiness. MIT Report. December 2001.
CARVALHO, T. Analysis of Account Aggregation return On Baking Services. Thesis related to MBADegree. MIT. Sloan School of Management. May 2002.
CARVALHO, T. C. et al. Account Aggregation. Final Project Report of 15.567 Introduction toeBusiness. MIT. Sloan School of Management. December 2001.
DEWAN, R.; SEIDMANN, A. Current Issues in E-Banking. Communications of ACM, Vol. 44, NO. 6,June 2001.
GANDY, A. Aggregation: The Killer Application? Special Report. Financial World.http://www.unisysfinancial.com September 2001.
GRAEBER, C.; SHEVLIN, R.; RENYI, C. Account Aggregation: The elusive ROI. The ForresterReport. July 2001.
HBS. Merrill Lynch: Integrated Choice. HBS 9-500-090. Boston, March 2001.
HOLLAND, C. P.; WESTWOOD, J. B. Product-Market and Technology: Strategies in Banking.Communications of ACM, Vol. 44, NO. 6, June 2001.
LBC. Super Models: Using Analytics to Increase Sales. Moving Customers Online.http://www.cyberdialogue.com/library/lbc.html. March, 2002.
McVEY, H. H.; KUMAR, P. H. Internet and Financial Services. Morgan Stanley Dean Witter. IndustryReport. 2000.
MOORE, A. M. The State of the Account Aggregation. CELENT, January 2002.
MOORE, A. M.; KATKOV, N. Finding the ROI from Online Retail Banking Applications. CELENT,October 2001.
URBAN, G. InSite Marketing Technology. MIT Business Case. 2002