retrospective pre/posttest design and response-shift bias
TRANSCRIPT

Loyola University Chicago Loyola University Chicago
Loyola eCommons Loyola eCommons
Dissertations Theses and Dissertations
2016
Retrospective Pre/Posttest Design and Response-Shift Bias in an Retrospective Pre/Posttest Design and Response-Shift Bias in an
Urban After-School Program for Teens: A Mixed Methods Study Urban After-School Program for Teens: A Mixed Methods Study
Jill Young Loyola University Chicago
Follow this and additional works at: https://ecommons.luc.edu/luc_diss
Part of the Education Commons
Recommended Citation Recommended Citation Young, Jill, "Retrospective Pre/Posttest Design and Response-Shift Bias in an Urban After-School Program for Teens: A Mixed Methods Study" (2016). Dissertations. 2156. https://ecommons.luc.edu/luc_diss/2156
This Dissertation is brought to you for free and open access by the Theses and Dissertations at Loyola eCommons. It has been accepted for inclusion in Dissertations by an authorized administrator of Loyola eCommons. For more information, please contact [email protected].
This work is licensed under a Creative Commons Attribution-Noncommercial-No Derivative Works 3.0 License. Copyright © 2016 Jill Young

LOYOLA UNIVERSITY CHICAGO
RETROSPECTIVE PRE/POSTTEST DESIGN AND RESPONSE-SHIFT BIAS IN AN
URBAN AFTER-SCHOOL PROGRAM FOR TEENS: A MIXED METHODS STUDY
A DISSERTATION SUBMITTED TO
THE FACULTY OF THE GRADUATE SCHOOL
IN CANDIDACY FOR THE DEGREE OF
DOCTOR OF PHILOSOPHY
PROGRAM IN RESEARCH METHODOLOGY
BY
JILL Y. YOUNG
CHICAGO, ILLINOIS
AUGUST 2016

Copyright by Jill Y. Young, 2016 All rights reserved.
iii
ACKNOWLEDGEMENTS
I would like to thank all of the people who made this dissertation possible,
starting with my professors at Loyola University Chicago. I offer a very special thank
you to my committee chair, Dr. Leanne Kallemeyn, whose expertise in evaluation and
calm demeanor managed to both keep me motivated and sane during this process. I
would also like to thank my committee members Dr. David Ensminger and Dr. Meng-Jia
Wu for their thoughtful feedback and guidance. Lastly, I would like to thank Dr. Terri
Pigott, who encouraged me to pursue my doctorate after I completed my coursework for
my master’s degree.
I would like to extend my gratitude to Dr. Mary Ellen Caron, CEO of After
School Matters, for allowing me to conduct my research with the organization as a full-
time employee. Dr. Caron has been a mentor and a source of support and encouragement
throughout my graduate school process. Additionally, I would like to thank my team
members, Amanda Lambie and Eboni Prince-Currie, for graciously assisting me in the
data collection process. It would not have been possible to complete this dissertation
without their help. Special thanks to my colleague Mark Jamrozek for proofreading my
dissertation. Many thanks also to the After School Matters instructors and teens that
participated in my research. The teens in our programs are nothing short of remarkable,
and they make me incredibly hopeful about Chicago’s future.

iv
Finally, I would like to thank my family for their support, including my mother,
Cheryl Young, whose work ethic has been a lifelong inspiration; to my sister, Melody
Fuqua, and her beautiful family for making me laugh and giving me perspective on what
is most important in life; and to my partner, Eric Richter, whose unwavering support kept
me motivated on a daily basis. Many thanks to my other family and friends, who
understood the importance of this undertaking and have been with me every step of the
way. I feel fortunate every day to be surrounded by such a supportive group of people.

v
TABLE OF CONTENTS
ACKNOWLEDGEMENTS iii LIST OF TABLES vii LIST OF FIGURES viii ABSTRACT ix CHAPTER ONE: INTRODUCTION 1 Background 1 Problem Statement 14 Purpose 16 Limitations 17 Summary 18 CHAPTER TWO: LITERATURE REVIEW 20 Introduction 20 Cognitive Process in Self-report Measures 20 Self-report Biases 31 Retrospective Pretest/Posttest Designs 42 Importance of Current Study 58 Summary 59 CHAPTER THREE: METHODS 61 Introduction 61 Problem and Purposes Overview 61 Epistemological Assumptions 62 Research Questions 63 Research Design 63 Researcher Role and Experience 69 Program Background 70 Study Design 72 Summary 96 CHAPTER FOUR: RESULTS 97 Introduction 97 The Presence of Response-shift Bias 99 Why Response-shift Bias Occurs 106 The Cognitive Process of Teens Responding to Retrospective Pretest Questions 120 Summary 137 CHAPTER FIVE: DISCUSSION 139 Introduction 139

vi
Response-shift Bias in Teen Programs 139 Using Mixed Methods to Investigate Response-shift Bias 147 Implications 150 Limitations 153 Future Research 156 Summary 162 APPENDIX A: AFTER SCHOOL MATTERS LETTER OF COOPERATION 165 APPENDIX B: PILOT STUDY BACKGROUND AND RESULTS 167 APPENDIX C: AFTER SCHOOL MATTERS PRE-SURVEY 170 APPENDIX D: AFTER SCHOOL MATTERS POST-SURVEY 173 APPENDIX E: WAIVER OF DOCUMENTATION FOR INFORMED CONSENT 184 APPENDIX F: BACKGROUND OF TEENS INTERVIEWED 186 APPENDIX G: COGNITIVE INTERVIEW PROTOCOL 188 APPENDIX H: PROGRAM EXPERIENCE INTERVIEW PROTOCOL 190 APPENDIX I: INTERVIEW CHECKLIST 193 APPENDIX J: INTERVIEW REFLECTION SHEET 195 APPENDIX K: CONSENT TO PARTICIPATE IN RESEARCH: PARENTS OF PARTICIPANTS UNDER AGE 18 197 APPENDIX L: CONSENT TO PARTICIPATE IN RESEARCH: PARTICIPANTS 18+ 201 APPENDIX M: ASSENT TO PARTICIPATE IN RESEARCH: PARTICIPANTS UNDER AGE 18 205 APPENDIX N: RECRUITMENT SCRIPT 209 APPENDIX O: REGRESSION ANALYSIS RESULTS 212 REFERENCE LIST 216 VITA 222

vii
LIST OF TABLES
Table 1. Overview of Self-report Biases 34
Table 2. Comparison of Population and Sample Characteristics 74
Table 3. Instrument Items 76
Table 4. Response Rates by Test 78
Table 5. Reliability Estimates 80
Table 6. Cognitive Interview Participant Characteristics 86
Table 7. Overview of Research Results 98
Table 8. Average Ratings by Test Type 100
Table 9. Average Change Scores by Test Type 102
Table 10. T-test Results and Effect Sizes 103
Table 11. Significant Predictors from the Linear Regression Model 115
Table 12. Comparison of Quantitative and Qualitative Sample Teen Characteristics 118
Table 13. Response Rates by Item and Test Administration 122

viii
LIST OF FIGURES Figure 1. Overview of the Design 68

ix
ABSTRACT
Evaluators need more design options to meet the challenges they face in detecting
change or growth. Researchers have offered the retrospective pretest/posttest design as a
remedy to curb response-shift bias and better estimate program effects, but few studies
have used this approach with youth. After School Matters, a Chicago nonprofit that
provides after-school programs to teens tested the retrospective pretest/posttest design
using a mixed methods design to determine whether response-shift bias exists. My study
provided several findings. First, though my quantitative analysis did not indicate
response-shift bias was as prevalent as literature would indicate, my qualitative findings
indicated that response-shift bias was in fact an issue. Second, I found a relationship
between teens’ self-reported interpersonal skills and response-shift bias. Teens who
reported positive interactions with their peers and instructors tended to display large
shifts in their responses from traditional pretest to retrospective pretest. Third, teens
preferred to see the posttest and retrospective questions in chronological order, which is
contrary to the literature. Fourth, I found acquiescence to be the biggest potential bias
when using the design with teens. Overall, the retrospective pretest/posttest design is a
practical and useful design to evaluate youth self-reported change. The mixed methods
design led to dissonance, iterative data analysis, and some inconclusive findings, but also
a much deeper understanding of response-shift bias.

1
CHAPTER ONE
INTRODUCTION
Retrospective pretests are gaining momentum in program evaluation as an
alternative to the traditional pretest, as evidenced by its emergence in articles and
presentations (e.g., Allen & Nimon, 2007). Retrospective pretests take less time to
administer than traditional pretests, create less of a burden for respondents, and reduce
response-shift bias (Lamb, 2005). This alternative has been used in several studies as a
way to measure perceived changes in behaviors or attitudes of respondents (Howard,
Ralph, Gulanick, Maxwell, Nance, & Gerber; 1979; Cantrell, 2003; Hill & Betz, 2005;
Pelfrey & Pelfrey, 2009; Moore & Tananis, 2009; Nimon, Zigarmi, & Allen, 2011), yet
few studies examined the issue with high school youth (Klatt & Taylor-Powell, 2005;
Colosi & Dunifon, 2006). This dissertation tested the retrospective pretest/posttest design
in conjunction with the traditional pretest/posttest design in order to determine whether
response-shift bias exists and to better understand response shift-bias with urban high
school students in an after-school program using a mixed methods design. The study also
investigated the cognitive process for completing a retrospective pretest question.
Background
After School Matters
About the organization. After School Matters (ASM) is a non-profit that
provides after-school programs to Chicago public high school youth. Programs focus on

2 project-based learning and provide youth with skills for college, career, and beyond.
ASM partners with independent instructors and instructors from community
organizations to offer programs. These instructors are professionals in fields such as arts,
communication, sports, science, and technology. There are over 1,000 programs and
23,000 program opportunities available to over 15,000 unique teens at over 300 different
sites in Chicago. These programs are offered during three program sessions each year,
with each session serving between 7,000-9,500 students. Summer sessions run
approximately six weeks from July to mid-August. Fall and spring sessions run
approximately 10 weeks, from October to early December, and February through
April/May, respectively.
Project-based learning approach. ASM mostly offers apprenticeship-type
programs that focus on project-based learning. According to the Buck Institute for
Education, project-based learning is a “teaching method in which students gain
knowledge and skills by working for an extended period of time to investigate and
respond to an engaging and complex question, problem, or challenge” (“What is PBL,”
n.d.). Essential components of project-based learning include key knowledge,
understanding and success skills; challenging problems or questions; sustained inquiry;
authenticity; student voice and choice; reflection; critique and revision; and public
product. Project-based learning makes school more engaging for students; improves
learning; builds skills for college, career, and life; helps address standards; provides
opportunities for students to use technology; and connects students and schools with
communities and the real world (Buck Institute for Education, “Why PBL?”, n.d.).

3 21st century skill development. ASM’s mission is to provide Chicago public
high school teens opportunities to explore and develop their talents, while gaining critical
skills for work, college and beyond. Programs are founded on the apprenticeship model
that allows teens to work with industry experts to learn both technical skills in the craft
they are studying as well as social and emotional skills that will serve them well beyond
high school. A 2016 report by the American Youth Policy Forum identified ASM as a
nonprofit with promising practices for developing college and career readiness skills in
teens. The report noted, “through the creation of student-centered experiences in
internships and apprenticeships, ASM demonstrates that both content area and skill
competencies can be developed through participating in activities outside of the
classroom” (American Youth Policy Forum, 2016, p. 4).
These 21st century skills are vital for teens to graduate from high school prepared
for college or a career. According to the Forum for Youth Investment (2010), youth are
inadequately prepared for life after high school; only three in 10 high school seniors are
college ready based on graduation rates, high school transcripts, and National Assessment
of Educational Progress reading scores. Additionally, college readiness varies by student
race, with white youth twice as likely to be ready for college compared to African-
American and Hispanic students. Further, about one-fourth of all first year students at
four-year institutions do not return for their second year, and this continues to be
particularly true for African-American and Hispanic students (Forum for Youth
Investment, 2010).
Youth are also unprepared for work after high school. Only four in 10 high school
graduates are considered work ready according to a 2006 report conducted by Partnership

4 for 21st century skills. The organizations surveyed over 400 employers to determine the
skills they seek in entry-level workers and evaluate their satisfaction with high school
graduates in entry-level positions. Employers reported that four in 10 high school
graduates are “grossly deficient” in work readiness skills (Partnership for 21st Century
Skills, 2006, p. 12). Unfortunately, employers are not always prepared to train new
employees in some of these deficiencies; of those employers that reported they offer
some workforce training, only 40% said they offered training in the skills they most
wanted entry-level employees to possess (Forum for Youth Investment, 2010). The
financial cost of the gap in skills includes “recruitment costs, training costs, and turnover
costs. In addition…the cost of lost innovation and productivity is substantial” (Corporate
Voices for Working Families, 2008, p. 5). Corporate Voices for Working Families
(2008) estimated the financial cost of under-prepared high school graduates in the
workforce is as much as $16 billion annually.
Though there is consensus on the importance of 21st century skills, the definitions
and terminology vary depending on the source. The Educational Improvement Center
described 21st century skills as the “content knowledge, skills, and habits that students
must possess to be successful in post-secondary education or training that leads to a
sustaining career” (n.d., para 1). The Forum for Youth Investment (2010) reported that
labels for these skills include developmental assets, social and emotional skills, character,
21st century skills, and new basic skills. According to a similar report by the Partnership
for 21st Century Skills (2006), there are basic skills, such as writing, math, and science,
and applied skills. Applied skills include critical thinking, problem solving, oral and
written communication, teamwork, diversity, information technology, leadership,

5 creativity/innovation, self-direction, work ethic, and social responsibility. In this same
report, employers identified the following as the most important skills for entry-level job
performance: professionalism/work ethic, teamwork/collaboration, oral communication,
ethics/social responsibility, and critical thinking/problem solving.
Evaluation at ASM. ASM evaluates the impact of programs on youth using
several methods, but one of the primary methods is a teen survey. Given the diversity of
the programs in content, context, and location, as well as the restricted capacity of the
staff and a limited evaluation budget, ASM administers one online post-program survey
to teens every session via Survey Monkey. The survey is open for the last three weeks of
program and three weeks after programs end. Response rates vary by session, typically
75-80%. The survey measures several constructs related to student experience,
satisfaction, and skill development. ASM measures students’ specific self-reported gains
in 21st century skills that the organization deems important and inherent to its programs,
including leadership, teamwork, problem solving, meeting deadlines, public speaking,
and receiving feedback. The results of the survey are used for various organizational
needs, including improving programs, measuring outcomes, communicating impact, and
fulfilling funding requirements.
Practical Problems in Evaluation
Several practical problems exist for program evaluators. Bamberger, Rugh,
Church, and Fort (2004) discussed the constraints evaluators face in conducting rigorous
evaluations to determine program effect. The first is time, which is typically true when an
evaluator is not brought into a project until it is already underway, or the evaluator is
responsible for tasks at the organization other than evaluation. The second constraint is

6 budget, which translates to a lack of dedicated evaluation funds. The third and last
constraint is data. Often, evaluators do not have baseline data before the start of the
project because data are unavailable, incomplete, inaccessible, or unorganized. Allen and
Nimon (2007) elaborated on potential problems when collecting repeated measure data,
such as participants arriving late or leaving early and constructing instruments with
strong psychometric properties that can detect program change. They determined, “the
practical response to these challenges is that many programs do not benefit from a formal
evaluation process, thereby leaving administrators with little information regarding
program effectiveness” (p. 28).
Another practical problem in evaluation is competing priorities between funders
and program providers. A complaint from ASM staff and funders alike is that ASM does
not collect baseline data, and therefore cannot measure impact or change, particularly in
the area of skill development, a core component of ASM programs. As Benzies, Clarke,
Barker, and Mychasiuk (2012) pointed out, rigorous evaluation requires reliable and valid
measurement instruments, yet program providers and funders often have different ideas
on what reliable and valid actually mean. Program providers prefer evaluations that are
unobtrusive to program participants and can be collected quickly and with few logistical
barriers, while funders prefer tools with strong psychometric properties. Azzam (2010)
highlighted the powerful influence funders and other stakeholders often have in shaping
evaluations. He noted, “Stakeholder needs often place evaluators in an awkward position
where they have to weigh the value of modifying an evaluation against technical and
ethical standards” (p. 45). What often results is that one group’s goal is achieved, but at
the expense of the other group’s goal. Hill and Betz (2005) reiterated this idea, noting

7 that evaluators are hindered by the lack of design options available to them, with
insufficient time and funding that force evaluators to make tradeoffs in reliability and
validity. Ideally, evaluators construct instruments with strong psychometric properties
before they begin data collection. This may not occur when timelines are quick and
resources are scarce, as is often the case in program evaluation.
A 2010 report by Reed and Morariu summarized many of the practical issues
evaluators generally face. Nearly all of the 1,072 organizations surveyed (96%) said that
limited staff time was a challenge in conducting evaluation, as was limited staff expertise
(81%). Only 13% of organizations had at least one full-time staff member dedicated to
evaluation. Another challenge reported was insufficient financial resources (84%). Less
than a quarter of the organizations surveyed dedicated at least 5% of organizational
budget to evaluation; only one in eight organizations spent any funding on evaluation at
all in the previous year. Finally, insufficient support from leadership was also a challenge
(42%). Evaluation was shown to be the second lowest organizational priority, with the
last organizational priority being research.
Program Evaluation Designs
Studies by Azzam (2011) and Christie and Fleischer (2010) demonstrated that
evaluators primarily use non-experimental methods to evaluate programs, and many of
these designs are quantitative. Azzam (2011) conducted a survey of American Evaluation
Association evaluators to determine common design elements in evaluation and how
likely they were to implement those designs. Common methodological choices included
experimental, quasi-experimental, case study, ethnography, and correlation/descriptive
study. He categorized these methodological choices as either inferential or descriptive

8 methodologies. Inferential methods included experimental and quasi-experimental
designs, and they were most commonly used when trying to make claims about a
program’s effectiveness. Case study, ethnography, and correlational studies were
classified as descriptive methodologies because they helped evaluators describe the
program. While this study demonstrated that quantitative designs were most common, it
did not shed light on the prevalence of self-report designs that used posttest only,
traditional pretest/posttest, and retrospective pretest/posttest methods.
To better understand the designs and methods used in evaluation studies, Christie
and Fleischer (2010) conducted a content analysis of 117 evaluation studies published in
eight evaluation-focused journals for a three-year period. They reported 15% of the
designs were experimental, 34% were quasi-experimental, and 51% were non-
experimental. The methods used across the three types of designs were primarily
quantitative (44%) and mixed methods (43%), followed by qualitative methods (14%).
Descriptive designs were most common (25%), followed by pretest/posttest designs
(15%), case study designs (15%), and longitudinal designs (13%). The least common
designs were posttest only designs (2%) and regression discontinuity designs (2%).
Christie and Fleischer also reviewed common designs based on the studies’ substantive
field. Of the 36 education programs included in the study, 17% used experimental
methods, 34% used quasi-experimental, and 49% used non-experimental methods. The
most common designs in program evaluations of educational programs were case study
(22%), descriptive (19%), longitudinal (17%), pretest/posttest (14%), interrupted time-
series (8%), cross-sectional (6%), regression discontinuity (6%), time-series (3%), cost
analysis (3%), and one design classified as “other” (3%). These findings seemed to

9 indicate traditional pretest/posttest designs and posttest only designs were not prevalent,
and the researchers did not document the use of the retrospective pretest/posttest design.
However, the authors noted that their study was limited in its focus, and that unpublished
studies, studies outside their selected time period, and studies published in journals that
do not focus exclusively on evaluation could produce different findings.
The 2010 report by Reed and Morariu also found that organizations used
quantitative evaluation methods more frequently than qualitative methods, with feedback
forms or surveys being the largest practice. In fact, this finding was true across small,
medium-sized, and large organizations, with the percentage of organizations using
surveys at 63%, 71%, and 81%, respectively. The Center for Disease Control (2008)
noted that questionnaires are important in youth program evaluation when resources are
limited, a large sample size is needed, or the privacy of the participants is important.
These reports pointed to the fact that survey methods are quite common in program
evaluation.
Posttest only designs. Though Christie and Fleischer (2010) found posttest only
designs to be less common, it is the method ASM currently uses to assess programs. In
the one-group posttest only design, the researcher obtains one observation on participants
after they have experienced a treatment, with no control groups or pretests. Shadish,
Cook, and Campbell (2002) noted that often researchers use this design due to a need to
focus more on construct or external validity, practical issues such as funding, and
logistical constraints. According to Shadish, Cook, and Campbell, “the design has merit
in rare cases in which much specific background knowledge exists about how the
dependent variable behaves” (p. 107). Though the design is convenient, posttest only

10 designs make it difficult to determine what would have happened without the
treatment. Additionally, Shadish, Cook, and Campbell (2002) warned that this design is
prone to nearly all threats to internal validity, with the exception of ambiguity about
temporal precedence. In particular, they mentioned history as a threat because other
events could have taken place at the same time as the intervention, creating an observed
treatment effect.
Traditional pretest/posttest designs. According to Shadish, Cook, and Campbell
(2002), one way to improve upon the posttest only design is to add a traditional pretest,
which provides information about the counterfactual inference. In this design, program
participants typically complete a survey before the intervention and again after the
intervention. However, Campbell and Stanley (1963) stated that simply adding a pretest
is only a small improvement, noting several flaws in pretest/posttest designs, including
rival explanations for change and practice effects associated with pretests. Threats to
internal validity remain, including maturation or history. Another threat to validity in this
design is response-shift bias. Bhanji, Gottesman, de Gave, Steinert, and Winer (2012)
discussed how self-report assessment relies on a common metric, or that “the
participant’s standard of measurement for the dimension being assessed is stable from
one data point to the next. When learners’ understanding of the dimension(s) being
measured changes, they recalibrate their criteria for self-rating” (p. 189). This
phenomenon is referred to as response-shift bias, and it poses a threat to validity in the
traditional pretest/posttest design and also introduces measurement error.
Additionally, attrition is a major concern. The evaluator must collect data at two
different time periods from the same sample, which is not always feasible. Attrition of

11 data reduces sample sizes and the power the statistical tests possess, thereby reducing
the statistical conclusion validity. Colosi and Dunifon (2006) added to the list of concerns
about traditional pretests, pointing out that they tend to burden participants with
completing the same survey twice. Given some of the practical issues around collecting
data multiple times and incomplete datasets, as well as the complexity of ASM programs,
traditional pretests present a big challenge for ASM to administer.
Retrospective pretest/posttest designs. The retrospective pretest/posttest design
grew out of the desire to alleviate some of the issues presented by the posttest only
designs and the pretest/posttest. In a retrospective pretest/posttest design, program
participants are asked to rate themselves on a variable of interest based on how they feel
currently, and then they are asked to rate themselves on that same variable based on how
they felt at the beginning of the program (Howard, Ralph, Gulanick, Maxwell, Nance, &
Gerber; 1979). The pretest and posttest responses are collected at the same time. The
retrospective pretest is intended to reduce the respondents’ bias because they are using
the same context to answer questions at the same point in time, making their
understanding of the questions and their responses to the question more valid.
In Harvard Family Research Project’s Evaluation Exchange, Theodore Lamb
(2005) wrote that retrospective pretests are a practical but imperfect design. Strengths of
the design include that it takes less of participants’ time, and therefore is less likely to
turn off participants; it can be useful when traditional pretests are not possible for
logistical or other reasons; and it does not confuse participants by introducing terms
before they are ready for them. Another advantage is the reduction of attrition. In
retrospective pretest/posttest design, the instrument is usually administered once rather

12 than twice, thereby reducing the amount of missing data and increasing the statistical
power. Shadish, Cook, and Campbell (2002) also noted that the retrospective pretest can
combat rival hypotheses of history, selective mortality, and shifts in initial selection.
Although retrospective pretests reduce response-shift bias, threats to validity that
are common in self-reported data still exist, creating measurement error. Additionally,
Lamb (2005) noted that retrospective pretests are still often perceived as less rigorous
than other more traditional approaches. Lamb also noted that although less attrition data
can be an advantage, it can also be a disadvantage; a drawback of retrospective surveys is
that data are only collected from students who complete the program, so the evaluator
loses possibly valuable information about participant attrition (Colosi & Dunifon, 2006).
Previous Research on the Retrospective Pretest/Posttest Design
Though there are several studies that have included the retrospective
pretest/posttest design (Howard, Ralph, Gulanick, Maxwell, Nance, & Gerber; 1979;
Cantrell, 2003; Hill & Betz, 2005; Pelfrey & Pelfrey, 2009; Moore & Tananis, 2009;
Nimon, Zigarmi, & Allen, 2011), there are fewer studies that have examined response-
shift bias with high school students (Colosi & Dunifon, 2006; Klatt & Taylor-Powell,
2005). In my examination of the literature on retrospective pretest/posttest designs with
older youth, I could only locate two studies that have implemented both the traditional
pretest/posttest design and the retrospective pretest/posttest design in order to detect
response-shift bias. A study by Moore and Tananis (2009) tested the designs with gifted
high school teens in a summer academic program. The sample included 100 academically
gifted juniors, the majority of whom were female (60%) and white (72%). The sample
used in this study is quite different from ASM, where students are more representative of

13 the general Chicago Public School (CPS) population in academic ability and primarily
non-white. Not enough is known about the retrospective pretest/posttest design and how
population demographics are affected by response-shift bias. Klatt and Taylor-Powell
(2005) noted that answering retrospective pretest questions may be difficult, depending
on respondents’ culture, literacy level, native language, or age.
In the evaluation of after-school programs that were part of a grant focused on
science, technology, engineering, and math (STEM), researchers Kanter and Brohawn
(2014) implemented both traditional and retrospective pretests after hypothesizing that
response-shift bias was responsible for scores that seemed to imply programs made
students less interested in STEM at posttest than they were at traditional pretest. The
sample in their most recent study included 632 youth, 49% of whom were in grades 9
through 12. Nearly all of these high school students were participants in ASM, who
completed the surveys as part of a grant requirement. The researchers observed response-
shift bias across all ages, including the ASM high school students. The researchers were
not able to conduct cognitive interviews as part of the study to gain further insight on
response-shift bias.
All published reports that test the retrospective pretest/posttest design and
investigate response-shift bias have used a quantitative design, and they have typically
used statistical methods such as ANOVA or t-tests to detect response-shift bias. Several
reports mentioned collecting some qualitative data such as open-ended survey questions
or focus groups to better understand program participants’ responses, but none made the
inclusion of qualitative evidence an important part of the response-shift bias story. My
study provided quantitative data from a retrospective pretest, traditional pretest, and

14 posttest to determine whether a response-shift bias exists for the population in this
setting. Responses from the surveys were used to target students for interviews with the
hope of illuminating how response-shift bias works for urban teens in an after-school
program, and how teens cognitively process retrospective pretest questions.
My study built upon previous studies to investigate response-shift bias by
administering both a traditional pretest and retrospective pretest along with a posttest.
The study also included a qualitative component to better understand response-shift
biases and potentially other self-report biases such as effort justification and implicit
theory of change. Knowing whether response-shift bias exists in an after-school program
for teens and how teens interpret and understand retrospective pretest questions informs
whether the retrospective pretest/posttest design is a viable option for other youth serving
education after-school programs. It also provides evaluators with additional tools to
evaluate program effectiveness.
Problem Statement
As the literature suggests, evaluators face several practical issues when trying to
evaluate the effectiveness of a program. The reality is that some of the commonly used
designs cited by Azzam (2011) and Christie and Fleischer (2011) for measuring change
in program participants are not always feasible due to lack of staff expertise or capacity,
limited funding, or lack of leadership support (Reed & Morariu, 2010). Additionally,
evaluators must balance the competing priorities of providers and stakeholders while
using sound designs that produce reliable and valid results (Hill & Betz, 2005).
Evaluators may not be brought into an evaluation project until it is underway, leaving
them with insufficient time to successfully implement more rigorous evaluation designs,

15 such as an experimental design that includes a control group and baseline data
(Bamberger, Rugh, Church, & Fort, 2004). Multiple data collection periods, required by
designs such as the traditional pretest/posttest design, may be a burden to both program
providers and participants (Hill & Betz, 2005). Hill and Betz (2005) pointed out that the
traditional pretest/posttest design may be unrealistic at best, and in the worst-case
scenario, it may offend program participants. Providers may not have the time or staff to
accommodate multiple data collection periods. Also, when measuring program impact
relies on multiple data collection periods, the evaluator must be prepared for attrition and
possibly smaller datasets, resulting in lower statistical power and an inability to draw
meaningful conclusions (Bray, Maxwell, & Howard, 1984). Aside from the practical
issues presented by traditional pretest/posttest design, the design may not be desirable
because it presents a new bias called response-shift bias. When program participants are
asked to rate themselves at pretest on a dimension they do not clearly understand, the
evaluator may observe results on the posttest indicating the program was ineffective at
achieving its objectives. Response-shift bias is particularly common in training programs,
where the purpose of the program is to teach participants certain knowledge or skills
(Hoogstraten, 1982).
Evaluators need more design options to meet the challenges they face in
detecting change or growth in program participants as a result of the program.
Researchers have offered the retrospective pretest/posttest design as a remedy to curb
response-shift bias and better estimate program effects. This design typically includes one
data collection period where participants concurrently rate their current or final status on

16 a given dimension and their status at the beginning of the program at the program’s
conclusion.
Purpose
The purpose of this study was to test the retrospective pretest/posttest design in
conjunction with the traditional pretest/posttest design to determine whether response-
shift bias exists and to better understand response shift-bias with urban high school
students in an after-school program using a mixed methods design. The implications are
both practical and theoretical. From a practical perspective, understanding whether the
retrospective pretest reduces response shift bias helped ASM determine whether the
organization could implement a retrospective pretest/posttest design as a way to measure
participants’ improvement in skills and appease both program staff and external
stakeholders alike. In a theoretical sense, there is little information using the retrospective
pretest/posttest design with urban high school students in after-school programs, and this
study was able to expand the literature in this area. Additionally, though studies have
included interviews with program participants as part of their investigation into response-
shift bias, no study to date has taken a mixed methods approach to understand how
response-shift bias works for program participants. Qualitative information from these
students shed further light on whether response-shift bias was in fact an issue, and
whether the retrospective pretest/posttest design should be used with older urban youth in
out-of-school time settings.
Research Questions
My research questions for this study were as follows:

17 1. Is response-shift bias present when comparing scores from traditional pretest
and retrospective pretest surveys for urban high school youth in an after-school
program?
2. If traditional pretest and retrospective pretest scores are different, why do these
differences exist according to the perspective of the survey respondents?
3. What is the cognitive processing of youth when completing a retrospective
pretest/posttest?
These questions helped me address whether ASM should use a retrospective pre-survey
method at ASM, and contributed to the literature on retrospective pretest/posttest
methodology and response-shift bias.
Limitations
There were some limitations to this research. First, the research in this study did
not examine differences in how the retrospective pretest is presented and administered.
Schwarz (1999) noted that retrospective and posttest items placed next to each other on
an instrument could impact how participants reconstruct their initial status and increase
bias in measuring the outcomes. Terborg and Davis (1982) investigated the impact of
administrating the retrospective pretest and posttest as two separate instruments or one
survey, and found no difference between the two administration times, but did find that
ratings were slightly higher when collected with one survey versus two. My study did not
examine this issue, and the lack of available literature in this area makes it one worthy of
further research. Additionally, some researchers claim that although retrospective pretests
may reduce response-shift bias, they add additional biases, such as effort justification and
implicit theory of change (Taylor, Russ-Eft, & Taylor, 2009). The quantitative part of this

18 study attempted to protect against response biases such as social desirability,
acquiescence, effort justification, and implicit theory of change. However, this study did
not explicitly examine the effect of these self-report biases, though information related to
these biases emerged through qualitative data collection.
Summary
This chapter presented background relevant to the practical challenges in program
evaluation as well as ASM’s evaluation challenges. Evaluators often lack the capacity or
resources to conduct the rigorous evaluations required by stakeholders, resulting in
competing priorities and potential tradeoffs in reliability and validity for convenience.
Retrospective pretest/posttest designs present another alternative to rigorously evaluate
programs without some of the pitfalls of traditional pretest/posttest designs, such as
multiple data collection periods, attrition and incomplete datasets, and response-shift
bias. But little is known about whether response-shift bias exists with urban teens in an
after-school program, and no studies have implemented a mixed methods design to better
understand how response-shift functions in this population and setting. This study used a
mixed methods approach to address whether response-shift bias exists and how it
functions in urban high school students in an after-school program.
Next, chapter two presents a literature review relevant to the retrospective
pretest/posttest design, including a discussion of relevant topics in self-report measures
such as the cognitive processes used by respondents in self-report measures and threats to
internal validity in the form of biases. I also provide a history of the retrospective
pretest/posttest design, results of relevant studies, the fields and populations for which the
design has been used, and variations in administration of the design. Chapter three

19 presents an overview of the research methodology used in this study, which was mixed
methods. Chapter three also describes ASM participants and programs in greater detail,
well as data collection, instrumentation, and analysis techniques. Chapter four provides
the results of the study, while chapter five discusses the implications of the findings.

20
CHAPTER TWO
LITERATURE REVIEW
Introduction
The retrospective pretest (also called thentest) is gaining popularity in program
evaluation due to its ease of administration, low burden on program participants and
providers, and its ability to control for response-shift bias. This section provides an
overview of literature relevant to the retrospective pretest/posttest design, starting with a
discussion of relevant topics in self-report measures. These topics include the cognitive
processes used by respondents in self-report measures and threats to internal validity in
the form of biases, such as social desirability, acquiescence, effort justification, implicit
theory of change and response-shift. I also provide a history of the retrospective
pretest/posttest design, results of relevant studies, the fields and populations for which the
design has been used, and variations in administration of the design.
Cognitive Process in Self-report Measures
Self-report measures are included in all types of evaluation, including needs
assessment, service utilization, program process, and outcome evaluation (Lam and
Bengo, 2003). These measures are commonly used to assess impact in program
evaluation (Bray & Howard, 1984; Lam & Bengo, 2003, Harty, 1997; Newcomer, 1997;
Hill & Betz, 2005). Such measures are often inexpensive for evaluators to collect and
present less of a burden to program participants and providers.

21 Historically, all self-report instruments are approached with suspicion and
skepticism due to a prevalent positivist view that self-report techniques are considered
less rigorous than objective ones, such as supervisor ratings of employees. Howard
(1980) acknowledged that all self-report instruments are prone to biases, which threaten
internal validity. Aiken and West (1990) echoed this sentiment, noting, “self-report
measures vary in the extent to which they are subject to external validation” (p. 381).
Researchers generally advise evaluators to include multiple objective measures, such as
performance or behavior assessments, administrative records, and so on to protect against
threats to internal validity that are considered inherent to self-report ratings (Hill & Betz,
2005). Yet, such measures are often unavailable or difficult to obtain (Howard, Schmeck,
and Bray, 1979). Moore and Tananis (2009) pointed out the paradox evaluators face:
“although self-report measures have their own documented limitations, evaluators are
also hindered by a lack of design options, which in turn can be exacerbated by
insufficient time and money as well as restrictive situations which force trade-offs in
reliability and validity” (p. 189). Therefore, evaluators generally accept self-report
measures as a helpful but fallible tool in measuring program impact.
Cognitive Processes in Survey Respondents
Process. When completing a survey, respondents engage in a cognitive process to
answer the questions asked of them. Whether and to what degree respondents complete
this process is pivotal to the validity of the information collected through self-report
measures. Evaluators hope that survey respondents will a) understand the question being
asked, b) identify the behavior of interest, retrieve relevant information from memory, c)
correctly identify the relevant time period referenced, d) search the time period to retrieve

22 all relevant information, e) correctly identify instances within that time period, and f)
correctly determine a frequency report based on that information. Respondents need to
map this frequency back to the response choices available and select a choice. Schwarz
and Oyersman (2001) pointed out that evaluators hope “people know what they do and
can report on their behavior with candor and accuracy, although they may not always be
willing to do so” (p. 129).
This next section provides an overview of the complex cognitive process
respondents must utilize to answer survey questions. In step one, respondents must
understand the question. Step two requires respondents to recall relevant behavior, and
step three requires the respondent to make inferences and estimations. In step four,
respondents select a response, and then they edit that response in step five.
Step one: Understanding the question. Schwarz (1999) described the cognitive
processes required for survey respondents to answer a question. First, respondents are
tasked with understanding the question they are asked. The issue at the first step of the
process is the degree to which the respondent’s understanding of the question matches the
researcher or evaluator’s intention with the question. Respondents may not answer the
question asked if they do not understand the question, leading to disparate interpretations
and possibly under-reporting or over-reporting of the construct in question. Question
comprehension itself is a complicated process; it requires two interrelated processes. The
first process relates to the semantic understanding of the word. Schwarz stated,
“comprehending the literal meaning of a sentence involves the identification of words,
the recall of lexical information from semantic memory, and the construction of a
meaning of the utterance, which is constrained by its context” (p. 94). Respondents must

23 understand the pragmatic meaning of the question, which requires the respondent to
make inferences about the evaluator’s intentions.
The process for doing this follows the same assumptions that apply to everyday
conversation. Schwarz (1999) outlined four maxims developed by Paul Grice to describe
the process involved in everyday conversation: relation, quantity, manner, and quality. In
the first maxim, relation, speakers use contextual information to contribute to a
conversation. With the second maxim, quantity, speakers decide what they want to
contribute to the conversation and think about the information the questioner wants to
elicit versus the information that comes to mind for the speaker. The third maxim is
manner, and it focuses on the idea that the speaker’s contribution should be concise and
clear, rather than verbose and ambiguous. The fourth and final maxim is quality, which
urges speakers to provide only contributions that are true or those for which the speaker
has evidence to support.
Schwarz and Oyersman (2001) provided helpful suggestions to make sure
questions are interpreted correctly. Closed questions provide the respondents with
context, so the list of response choices must be exhaustive. Frequency scale questions
must be clear because scales themselves also carry meaning, and respondents are
sensitive to reference periods. And finally, researchers and evaluators should not draw
attention to their affiliation to avoid cluing respondents in to certain aspects of the survey
that may evoke a particular response.
Step two: Recalling relevant behavior. Evaluators commonly use people’s
recollections to assess the effectiveness of a program, making recall an important aspect
of the cognitive process in completing surveys. This second step in the cognitive process

24 is recalling relevant behavior. This step is important because it contributes to the
understanding of the processes by which people construct their beliefs, attitudes, and
behaviors. Rather than strictly recalling and reporting information, survey respondents
use other estimation strategies, which can lead to over- or under-reporting events and
information. Finney (1981) also warned about the complexity of recall and the impact it
has when estimating program effects, explaining, “recollective distortions are likely to
occur in ‘approved’ directions which improve consistency or reduce personal conflict, or
on more subjective, attitudinal or complex matters” (p. 216).
Schwarz (1999) discussed three important facts about memory recall. First,
memory naturally decreases over time, even for events that are significant and unique.
According to Ross (1989), “memories consistent with people’s beliefs are often more
accessible than memories inconsistent with beliefs” (p. 342). Schwarz outlined two types
of accessibility: chronic and temporary. Information that is chronically accessible always
comes to mind when the respondent thinks of the topic. Temporarily accessible
information may come to mind, but not as consistently as information that is chronically
accessible. This is not sufficient for evaluative judgments. Ross described two major
steps involved in long-term memory of personal attributes. First, the respondents assess
their current status on the attribute, serving as a benchmark since it is usually more
available than previous statuses. In the second step, respondents “may invoke an implicit
theory of stability or change to guide their construction of the past. Implicit theories are
schema-like knowledge structures that include specific beliefs regarding the inherent
stability of the attribute, as well as a set of general principles concerning the conditions
likely to promote personal change or stability” (p. 342).

25 Second, if a question asks about a frequent behavior, the respondent will most
likely not remember detailed episodic information about the behavior. Respondents may
have difficulty with recall on several types of questions, but the level of difficulty varies
with the type of question. Simple objective questions run the least risk in eliciting a recall
bias, whereas complex or evaluative questions run a higher risk. Respondents with poorer
recall are more likely to be influenced by the response choices available than respondents
with better recall abilities (Schwarz, 1999). Additionally, memory decreases as time
passes, “even when the event is relatively important and distinctive” (Schwarz and
Oyerman, 2001, p. 136). Survey participant memory is also influenced by the format of
the question. Closed questions provide respondents with cues that have the potential to
increase other biases, such as social desirability.
Third, people do not organize their memories necessarily in the way the question
or responses require. Schwarz and Oyerman (2011) pointed out “autobiographical
knowledge is not organized by categories of behavior” (p. 137). If respondents are not
able to retrieve all the information related to the question being asked, they truncate the
retrieval process as soon as they have enough information to answer the question. This
means judgment is based on information most accessible to the respondent, rather than
what is most relevant to the question.
Schwarz (1999) warned that the choice options in a frequency question influences
the interpretation of the question, and respondents use the frequency scale as a frame of
reference. These types of questions are prone to problems because of issues with recall,
and respondents with poor memory are likely to be heavily influenced by the options
presented in the frequency scale compared to respondents with better memory. Schwarz

26 advised to instead ask frequency questions in an open-ended format and avoid words
such as “sometimes” or “frequently”. Other suggestions to improve this step include
specifying the reference period and providing recall cues, disaggregating confusing
categories by breaking them into smaller ones, giving respondents enough time to search
their memory, recommending respondents start by searching their memories for the most
recent occurrence of a behavior, and providing landmarks such as holidays to set
reference periods.
Step three: Making inferences and estimations. Step three in the cognitive
process relates to inference and estimation. Respondents make inferences using various
strategies. One strategy is to use decomposition or extrapolation. In this strategy,
respondents recall information as they deconstruct what it is they are being asked about.
They also make inferences based on subjective theories, using their current behavior as a
benchmark to determine whether and how much they have changed. Schwarz (1999)
warned they may detect change within themselves even when none has occurred, or they
may view their previous state more negatively so as to confirm the success of an
intervention. Finally, respondents may make inferences based on the survey instrument –
specifically, the scales used in the survey. The scales themselves can influence a
respondent’s judgments and choice selection, resulting in under- or overestimation.
Step four: Selecting a response. In the fourth step, the respondents map the
answer they arrived at in their mind with the response choices available to them on the
survey. Schwarz and Oyersman (2001) discussed the issue of response order effects, or
the idea that the order of the responses may influence the choice selection of a survey
respondent. These effects may occur for several reasons. First, respondents may become

27 fatigued if the survey is too long, the questions are too complex, or the response
choices are too long. Second, the respondent’s retrieval efforts for the current question
may be clouded by the information they had to recall for a previous question. Third,
respondents may be less motivated to answer each question diligently because they feel
they have shared enough information.
How a question is worded affects how survey respondents select their choices.
Schwarz (1999) noted, “self-reports are a fallible source of data, and minor changes in
question wording, question format, or question context can result in major changes in the
obtained results” (p. 93). Additionally, because of the context they provide, response
choices themselves also play an important role in how respondents process questions and
select answers. Two common types of closed-ended questions on surveys are scale and
frequency questions. In both types of questions, the response choices can lead to
interpretations on the part of the respondents that they then use to select their choice. A
range from negative to positive conveys that the dimension in question is bipolar, where
one scale represents absence of the dimension while the other end of the scale represents
presence. When only positive numbers are used, respondents assume the dimension is
unipolar and the numbers represent degrees of the attribute. The evaluator must keep this
in mind when writing items for self-report measures.
Step 5: Editing answers. Finally, respondents edit their answer in step five. At
this step, they may edit their response for reasons related to social desirability and self-
presentation. Schwarz and Oyersman (2001) suggested the researcher could minimize
such self-report biases by normalizing questions or making them less threatening.

28 Satisficing and optimizing. The five-step process outlined represents the ideal
process a respondent moves through in order to respond to each question. When
respondents successfully complete this process, it is called optimizing (Krosnick, 1999).
Krosnick pointed out, “a great deal of cognitive work is required to generate an optimal
answer to even a single question, so the cumulative effort required to answer a long series
of questions on a wide range of topics seems particularly substantial” (p. 547). He
explained that there are many motives for why a respondent may expend the cognitive
effort to respond optimally, such as “desires for self expression, interpersonal response,
intellectual challenge, self-understanding, feelings of altruism, or emotional catharsis” (p.
547).
Though optimizing is the ideal process evaluators want respondents to use when
completing a survey, it does not always happen. Most of the time, respondents are not
motivated to engage in the full cognitive process throughout the survey. They may begin
the survey by providing high-quality answers, but become fatigued by the end of the
survey. Respondents may also complete the survey out of compliance. Krosnick (1999)
said, “respondents then face a dilemma: They are not motivated to work hard, and the
cognitive costs of hard work are burdensome” (p. 548). In these situations, respondents
adapt their response strategy in what Krosnick called satisficing. In weak satisficing,
respondents execute all steps in the cognitive process, but do so less rigorously, resulting
in satisfactory answers rather than accurate ones. Some respondents skip one or more of
any of the following steps: comprehension, retrieval, judgment, and response selection. In
this case, a respondent arbitrarily selects an answer. Krosnick calls this strong satisficing.
Respondents offer the most socially desirable answer or the most neutral answer to avoid

29 expending the effort to engage in the entire cognitive process. In the worst-case
situation, respondents randomly select a response. Satisficing is more likely to occur the
greater the task difficulty, the lower the respondent’s ability, and the lower the
respondents’ motivation. Task difficulty involves interpreting the meaning of the survey
question and the available responses, retrieving information, the reading pace of the
respondent, and distractions, among other things. Ability is more often associated with
surveys that require complicated cognitive processes. Motivation is influenced by the
respondent’s personal interest in the question topic, belief about the consequences of the
survey, and fatigue.
Improving Self-report Measures
Schwarz (2001) concluded evaluators should first answer every question in their
survey themselves. Second, evaluators must remember that measurement tools are not
neutral; they provide context, which respondents then use to answer the questions. Third,
Schwarz recommended reviewing models of quality questions based on research. Fourth,
he suggested piloting the survey to determine early on if there may be issues with recall
or comprehension. Fifth, evaluators should become familiar with the cognitive processes
that are required for responding to surveys. Sixth, evaluators should motivate respondents
to provide accurate results by recognizing that recall may be difficult, but stressing that
accuracy is important and respondents can take the time they need. The seventh
recommendation Schwarz made is to provide meaningful context to aid in respondents’
recall process. His final recommendation was to make certain that if interviewers are
being used to collect the data that they understand the intended meaning of the questions.
30 Adolescents and Self-report Measures
Cognitive process in survey responses. Cognitive functioning varies depending
on the survey respondent’s age (Borgers & Hox, 2011). According to De Leeuw (2011),
cognitive functioning is well developed by the time youth reach adolescence at age 12.
Youth of this age follow the same cognitive steps as adults in responding to survey
questions, but researchers must pay additional attention to certain steps.
Adolescents are able to understand logical operators (e.g., and, or) and negations
(e.g., not), and their memory capacity is fully developed. However, memory speed is not,
so youth may require more time to respond to questions that require recall. In terms of
memory recall, the reference period must be very clear for adolescents, especially for
youth under the age of 12. Though the memory capacity of adolescents and the
constructive processes they use are fully developed by age 12, adolescents still require
additional processing time. De Leeuw (2011) noted, “Even a child of 12 still needs
approximately 1.5 times as time as an adult to process information” (p. 16). While young
children are able to recall salient memories, their responses become unreliable if youth
are not interested in the subject. Additionally, younger children have greater difficulty
distinguishing between actual and imagined events.
Finally, De Leeuw (2011) reported that youth ages 12 and older are very sensitive
to peer pressure and group norms, and advised researchers to ensure the privacy and
confidentiality of adolescent interviewees and survey respondents. Young children may
want to please the researcher, resulting in socially desirable responses. The researcher
must remind youth that there are no correct answers.

31 Recommendations for using self-report measures with adolescents. To
improve surveys used with children and adolescents, the literature (De Leeuw, 2011;
Borgers & Hox, 2011) recommended short and clear introductory text and questions that
avoid negative statements, ambiguous terms, complex constructs, suggestive phrases, or
double-barreled statements. De Leeuw (2011) suggested keeping questions simple and
accompanying them with introductions that explain the topic and expectations of the
respondent. She also recommended examining the readability of the survey using the
Flesch-Kincaid readability formula. She noted, “children have an extremely low
threshold for ambiguity and vagueness in questions and cannot cope with it” (De Leeuw,
2011, p. 13). Adolescents are sensitive to language, so evaluators should avoid leading
questions. In aiding youth to retrieve relevant information from their memory, the
evaluator must keep the question simple and specify a reference period. How youth
retrieve the information is based on the sensitivity of the question, the balance of the
question, and the question’s position in the survey.
When providing response options, De Leeuw (2011) and Borgers and Hox (2011)
recommended providing a number of response categories appropriate to the ages of the
youth survey respondents, offering midpoints, labeling scale points, and offering a “don’t
know” filter. Krosnick & Fabrigar (1997) advised five to seven response categories for
adults, and the same is true for adolescents by age 16 (Borgers and Hox, 2011). Response
categories should be clearly labeled to avoid ambiguity (De Leeuw & Otter, 1995).
Self-report Biases
Despite how commonly self-report measures are used in program evaluation,
researchers have raised several important concerns about using these types of measures to

32 evaluate the effectiveness of a program. D’Eon and Trinder (2014) acknowledged that
self-report assessments are sometimes “notoriously inaccurate and often subject to
systematic bias” (p. 458). Ross (1989) warned, “when self-reports are a primary indicant
of improvement, a conspiracy of ignorance may emerge in which both the helper and the
helped erroneously believe in the achievement of their common goal” (p. 354). Biases are
important to discuss in self-report measures because they threaten validity and can harm
the psychometric properties of surveys. Furr and Bacharach (2014) argued that biases can
undermine test and survey properties related to reliability and validity by introducing
measurement error, which can in turn “compromise the decisions that are made about
individuals, and it can cause problems for interpreting research based on those measures”
(p. 274).
Researchers classify relevant self-report biases in several ways, indicating
inconsistency in the literature. For example, Krosnick (1999) discussed biases in relation
to the cognitive functions of optimizing or satisficing. Hill and Betz (2005) categorized
biases as prospective or retrospective based on survey administration and design. Hill and
Betz (2005) said that in prospective tests, such as a pretest, the main bias is response-shift
bias. Retrospective biases, which are collected in post-surveys and retrospective pre-
surveys, include social desirability, subject acquiescence, effort justification, implicit
theory of change, and cognitive dissonance. Taylor, Russ-Eft, and Taylor (2009)
classified biases as motivational or cognitive. Motivational biases include social
desirability and effort justification, while cognitive biases include implicit theory of
change and cognitive dissonance.

33 Though the classification of biases for self-report measures related to
retrospective pretest/posttest designs varied across researchers, the biases commonly
discussed in relation to retrospective pretest/posttest designs tend to be consistent. For
this reason, only the self-report biases that are most relevant to the retrospective
pretest/posttest are discussed, including social desirability, acquiescence, effort
justification, implicit theory of change, and response-shift bias (Howard, 1980; Hill &
Betz, 2005; Taylor, Russ-Eft, & Taylor, 2009; Nimon, Zigarmi, & Allen, 2011). The
table below provides an overview of the self-report biases described, drawing on
definitions from Krosnick (1999), Furr and Bacharach (2014), Ross (1989), Taylor, Russ-
Eft, and Taylor (2009), and Howard (1980).

34 Table 1. Overview of Self-report Biases
Bias Definition Impact on Effect Estimates
Social desirability Respondents over-report more socially accepted attitudes and behaviors, and under-report those that are less socially accepted.
Overestimate
Acquiescence Respondents endorse item statements, regardless of content (“yea-saying” or “nay-saying”).
Overestimate
Effort justification Respondents exaggerate change in order to justify the investment they made into a program or intervention.
Overestimate
Implicit theory of change Respondents assume the program or intervention achieved its desired effect.
Overestimate
Response-shift bias Respondents’ perceptions of themselves change as a result of the program or intervention.
Underestimate
Social Desirability
A well-known bias in self-report survey research is social desirability, where
respondents over-report more socially accepted attitudes and behaviors, and under-report
those that are less socially accepted (Krosnick, 1999). That is, respondents distort their
self-report to align with what they interpret as good or poor scores. Krosnick (1999)
provided the example of voting as evidence of social desirability bias, in which the
percentage of survey respondents who report voting is typically greater than the
percentage of the population that voted according to official records.

35 This bias presents problems for researchers and evaluators. Respondents
exaggerate the degree to which they improved, which results in an overinflated program
effect and the introduction of error into the measurement of program effectiveness. This
is because when participants are motivated to appear socially desirable, their responses
will not reflect their true levels of the construct being measured. Doing so can lead
evaluators to find treatment effects that are under or overestimated, creating artificial
correlations and compromising decisions. Ross (1989) noted that respondents may
deliberately fabricate their own memories in order to respond to questions in a favorable
manner. He argued, “biased retrospections obtained in survey research may lead, among
other things, to inaccurate conceptions of human behavior” (p. 354).
Furr and Bacharach (2014) outlined three sources for social desirability. First, the
content of the instrument affects whether respondents will be susceptible to responding in
socially desirable ways. Some constructs carry greater consequences for social appeal
than others, such as honesty versus extraversion. Honesty is generally deemed a positive
trait, whereas extraversion is more of a neutral trait. Therefore, an instrument assessing
honesty would likely elicit more socially desirable responses than one assessing
extraversion. The second source for social desirability is the context itself. Respondents
whose answers are identifiable are more likely to answer in socially desirable ways than
respondents whose responses are anonymous. Additionally, if the outcomes for the test or
survey are high-stake, such as job placement, the respondents will be more prone to
responding in ways to make themselves more socially desirable. Finally, the personality
of respondents is a source for social desirability. Some people may be more personally
inclined to answer in socially desirable ways due to personality traits.

36 As part of Schwarz and Oyersman’s (2001) cognitive process, respondents may
edit their response for reasons related to social desirability and self-presentation. This
under- or over-reporting may be deliberate or unconscious. Furr and Bacharan (2014)
described two processes through which social desirability occurs: impression
management and self-deception. Impression management is a state-like process in which
respondents intentionally attempt to make themselves appear desirable. This process is a
reaction to the immediate situation of responding to a survey. Self-deception, on the other
hand, is trait-like. There are some people who are predisposed to make themselves seem
socially desirable, and they likely do this in multiple contexts.
Krosnick (1999) provided a possible solution for discouraging social desirability
bias by “explicitly alerting respondents to potential memory confusion and encouraging
them to think carefully to avoid such confusion” (p. 546). Researchers and evaluators can
also make instruments anonymous to encourage honest responses or alert respondents
that dishonest answers will be detected.
Acquiescence
Acquiescence bias is “the tendency to endorse any assertion made in a question,
regardless of its content” (Krosnick, 1999, p. 552). This bias can also be referred to as
“yea-saying or nay-saying.” Subject acquiescence is more common among people with
limited cognitive skills, less cognitive energy, and those who are not motivated or do not
like to think. It is also more common when the question is difficult or ambiguous,
respondents are encouraged to guess, or after respondents have become fatigued. Like
social desirability, acquiescence typically produces an overestimate of program effects.

37 Krosnick (1999) noted the popularity of agree/disagree, true/false, and yes/no
questions in surveys, but warned that they are problematic due to their susceptibility to
bias. He estimated an average acquiescence effect of 10% in surveys. His studies
suggested that subject acquiescence is common across questions and time. He stated, “the
correlations between acquiescence on different sets of items measuring different
constructs on the same occasion average 0.34 for agree/disagree questions, 0.16 for
yes/no questions, and 0.37 for true/false questions” (Krosnick, 1999, p. 554). He
explained that respondents’ agreeable personalities only partially explain acquiescence
and that yes/no questions may illicit less acquiescence than agree/disagree or true/false
items.
According to psychologists, one explanation for why respondents might do this is
that they are agreeable people. Sociologists, however, hypothesize that the relationship
between the respondent and the researcher may drive acquiescence because respondents
may perceive interviewers as having a higher social status, and therefore “defer to them
out of courtesy and respect, yielding a tendency to endorse assertions apparently made by
the researchers and /or interviewers” (Krosnick, 1999, p. 553). Another explanation is
satisficing. Krosnick noted respondents have a confirmatory bias, so most begin by
looking for reasons to agree with statements rather than disagree because it requires
cognitive processing. Krosnick called this weak satisficing, and this is especially true if
the respondent’s cognitive skills or motivation are low. Strong satisficing is also a factor;
as Krosnick explained, “the social convention to be polite is quite powerful, and agreeing
with others is more polite than disagreeing” (p. 554).

38 Effort Justification
Some programs or interventions require participants to invest time, effort, and
money. To justify the investment he or she has made, a participant who did not find the
intervention particularly effective may alter his or her responses in retrospective
assessment to exaggerate change. Under this bias, retrospective pretest ratings will be
lower and posttest ratings will be higher, causing an overestimate of program effect. Hill
and Betz (2005) provided an example of people who attend a program to improve their
parenting skills. The participants did not think their parenting skills improved, but they
exaggerated their responses to make it appear as though their skills did improve because
of the amount of time or money they spent on the program.
Nimon, Zigarmi, and Allen (2011) explained, “if individuals perceive no positive
effects from participating in an intervention, they may reconstruct their initial status to
avoid the cognitive dissonance associated with the time and effort they invested in the
program” (p. 10). In cognitive dissonance, participants are uncomfortable because they
hold conflicting attitudes or beliefs, and they alter their responses so that the responses
are more in line with what participants think should have occurred. This bias often results
in respondents overestimating program effects.
Implicit Theory of Change
Sometimes respondents assume they must have changed because they participated
in the program intervention. In other words, they assume the intervention had its desired
effect. Ross explained, “people possess implicit theories of change, ideas about the
conditions that are likely to foster alterations in themselves and others” (p. 341). Such
theories are then used to guide recall. When respondents are trying to remain consistent,

39 they may exaggerate the degree to which their previous and current states are similar,
even if a change has occurred. Yet, respondents may also overestimate the amount of
change that has occurred because they have ideas about how they should have changed
due to an intervention. If coupled with retrospective survey design, respondents
exaggerate the change produced by the intervention by providing lower estimates of their
pretest ratings to justify the effort they have invested.
According to Ross, (1989), two forms of systematic bias exist. In the first form,
respondents over exaggerate their consistency, and in the second, they overestimate the
extent to which they changed. These forms of bias are related to people’s “implicit
theories of stability and change for the attribute in question” (p. 351). Respondents may
come to this conclusion based on the best information available to them at the time, and
assume their past attitudes are similar to their current attitudes.
Implicit theories of change may serve to help respondents organize their
memories into a more coherent pattern of information that is consistent with the expected
program outcome. Hill and Betz (2005) explained, “people who expect change are likely
to report that they have changed, even in the absence of an actual intervention” (p. 504).
When respondents are asked to recall previous responses they have provided, as is the
case in retrospective pretests, they derive their response based on their current state. This
means responses are likely biased when cognitive states “a) have changed and
respondents are unaware of the change, b) have changed and respondents uniformly
miscalculate the degree or nature of the change, and c) are stable and respondents assume
that they have changed in a particular fashion” (Ross, 1989, p. 351).

40 Response-shift Bias
Sometimes the purpose of the intervention is to change a subject’s understanding
or awareness of a particular construct. This is especially true in training programs.
According to Howard (1980), “the change in how he [the respondent] perceives his initial
level of functioning on that dimension has confounded his report of improved
functioning” (p. 94). Howard referred to this change as response-shift bias. Response-
shift bias occurs when survey respondents overestimate or underestimate themselves at
pretest because they do not have an adequate understanding of the construct on which
they are evaluating themselves – the knowledge, skills, and attitudes that the program
intends to affect (Lam and Bengo, 2003). Bray, Maxwell, and Howard (1984) described
the issue when response-shift bias effects are present. According to them, “the traditional
methods of analysis have a loss in power ranging from about 5% with small response-
shift effects to approximately 90% with large response-shift effects” (p. 794). Therefore,
presence of response-shift bias reduces power and can reduce or nullify any true
treatment effects.
One major assumption in using self-report measures in a pre/posttest design is that
a common metric exists between the scores. If this were not the case, any comparison
between the scores would be invalid. Howard, Schmeck, and Bray (1979) noted,
“researchers assume that the individuals evaluating themselves have an internalized
standard for judging their level of functioning with regard to a given dimension, and that
this internalized standard will not differ from experimental to control group or change
from one testing to the next” (p. 130). They cited Cronbach and Furby’s assertion that
researchers must be able to say a common metric was used at both times of

41 administration – that a set of scores from pretest is equivalent to the set of scores from
the posttest. But if the standard of measurement changes between the two administration
points, any difference in scores will not only reflect actual changes due to treatment, but
also due to changes in the standard of measurement, causing any comparisons of the
scores to become invalid.
According to Hoogstraten (1982), the causes of response-shift bias include an
initial lack of information, memory effects, and subject response-style effects. Shadish,
Cook, and Campbell (2002) cited influential factors in retrospective pretests such as
“whether material is easily distorted, length of time since the events being recalled,
demand characteristics, specificity versus generality of information needed, and the
emotions elicited by the recall” (p. 114). Sprangers and Schwarz (1999) distinguished
between three types of response-shift bias. The first is recalibration, where the
respondents’ internal standards of measurement change. The second is reprioritization,
where the respondents reevaluate the importance of the construct and change their values.
The last type is reconceptualization, which is when participants redefine the target
construct. According to Aiken and West (1990), response-shift bias is common in
training programs whose objectives are to build abstract skills in participants such as
leadership. Such a bias often results in respondents overrating themselves at pretest, but
after participants have been trained on the dimension, they rate themselves more
stringently, leading to underestimated program effects. At pretest, participants may not
have an adequate understanding to respond to questions on certain constructs. Aiken and
West asserted that, “subjects…may change or increase their understanding of the

42 dimensions, particularly when the program in whole or in part aims to redefine more
clearly the concepts in question” (p. 375).
Retrospective Pretest/Posttest Designs
Background
Hill and Betz (2005) discussed the conflicting goals practitioners and evaluators
face in program evaluation. These practitioners and evaluators want to gather meaningful
data that accurately assess whether the program has had its intended effects, and uses
measurement tools with strong psychometric properties. But they also need to do this in a
way that makes the evaluation as unobtrusive to program participants as possible. This
means evaluation activities should take minimum program time to avoid overburdening
program staff or participants, it should be inexpensive to administer, analysis should be
straightforward, and the evaluation activities should have face validity with program
participants and staff. As Hill and Betz pointed out, achieving all of these goals is often
impossible and typically requires meeting one goal at the expense of the other: “the more
scientifically rigorous the evaluation, the greater the burden imposed on program
resources, providers, and participants. Conversely, adjustments made to allow for quicker
and easier evaluation may result in lower reliability and validity of results” (p. 502). The
rigor of the evaluation is important because it affects the accuracy of the feedback, and if
results are unreliable or invalid, the evaluator cannot accurately determine whether the
program had an effect on participants.
Retrospective pretests, also called thentests, are gaining popularity as an
evaluation tool. As Allen and Nimon (2007) asserted, the retrospective pretest design
helps evaluators address the practical and measurement challenges associated with

43 assessing program effects. Hill and Betz (2005) discussed several attributes of
retrospective pretests. Retrospective pretests assess individual perceptions of change,
allow time to establish trust, conserve time, and allow for provider-guided reflection. The
main argument for using the retrospective pre/posttest design is that it can reduce
response-shift bias when respondents do not have enough information to accurately
assess their initial level of functioning. When pre-program and post-program ratings are
collected at the same time, it is assumed that individuals will use the same standard of
measurement for both sets of ratings. According to Hill and Betz (2005), “participants
develop different awareness and judgments of their earlier behaviors as a function of
knowledge gained during an intervention, and thus the metric they use to rate those
behaviors is different than at the beginning of the program” (p. 503). They noted that this
change in the participants’ standard of measurement would lead to a paradoxical effect
where participants seem to have worsened over the course of the treatment despite the
fact that they actually improved. As Hoogstraten (1982) described, “the treatment
intervention may provide subjects with more adequate information, and moreover,
change their understanding of the dimension being measured, and at the same time
change their perception of their initial level of functioning” (p. 200). When this happens,
responses in the traditional pretest and posttest are based on different scales, weakening
the comparisons that can be made by the two response sets.
Retrospective pretest ratings are typically collected at the same as posttest ratings
to ensure that both sets of scores represent individuals’ current understanding of the
construct in quest. Individuals are asked to answer each item based on how they feel at
the current point and then answer each item based on how they feel they had been at the

44 beginning of their treatment. Howard, Schmeck, and Bray (1979) recommended the
retrospective pretest/posttest design for evaluation using self-report measures. They
described the typical process participants go through in this design:
First, they are to report how they perceive themselves to be at present (post). Immediately after answering each item in this manner, they answer the same item again, this time in reference to how they now perceive themselves to have been just before the workshop was conducted (retrospective pre). (p. 130)
Recommendations for Use
Howard et al. (1979) recommended adding the retrospective pretest to the
traditional pretest/posttest designs in order to detect and manage response-shift bias. This
preliminary analysis could then guide which set of data is used for further analyses.
Shadish, Cook, and Campbell (2002) cautioned against using retrospective
pretest/posttest design as a standalone method, and instead suggested using the design to
supplement other methods. Hoogstraten (1982) indicated that there are too many
questions that remain about the validity of retrospective pretests for them to be a safe
substitution for traditional pretest/posttest designs.
However, current evaluators recommended using the retrospective pretest instead
of the traditional pretest/posttest design. Allen and Nimon (2007) cited Lamb and
Tschillard (2005), who argued that retrospective pretest design is “just as useful as the
traditional pretest in determining program impact in the absence of response-shift bias
and is even more useful when subjects’ understanding of their level of functioning
changes as a consequence of the intervention” (p. 30). Allen and Nimon (2007) also cited
Raidl et al. (2002), who noted that retrospective pretest designs are preferable to
traditional pretest/posttest designs because they often provide more complete datasets.

45 Pelfrey and Pelfrey (2009) echoed these sentiments, arguing the retrospective
pretest/posttest design is sufficient as a standalone design.
Howard (1980) acknowledged that some researchers are uneasy about
retrospective pretest/posttest designs. He cited two reasons for this. The first is the
historical and philosophical suspicion associated with self-report instruments because
they are subjective. The second reason researchers are cautious about retrospective
ratings is the problem of biases, such as social desirability, acquiescence, and recall.
Howard investigated the issue of social desirability and impression management bias by
creating a bogus pipeline procedure in which respondents were told the researcher could
determine the accuracy of their responses. His results did not provide evidence of greater
bias for retrospective ratings; in fact, retrospective ratings reduced bias.
Recommendations from the field have included an informed pretest, where
participants are given a description of the variable of interest prior to responding to
questions on the pretest. Howard (1980) found this unsuccessful in two studies. The most
comprehensive way to evaluate a program is to integrate self-report, objective, and
behavioral measures, and the self-report measurement should include traditional
pretest/posttest and retrospective pretest/posttest to obtain information about participants’
perception of self-growth (Howard, 1980; Lam & Bengo, 2003).
Previous Research
Retrospective pretests have been used in several fields and across various
populations. They were first implemented in psychology, according to Howard (1980).
He reviewed the fields in which retrospective pretest have been used. Studies in the field
of psychology included the patterns of child rearing (Sears et al., 1957), studies

46 predicting the outcomes for institutionalized patients (Paul, 1969), measurements of
fear (Walk, 1956), assessing students’ pre-instruction knowledge, and evaluating the
effects of racially mixed housing on prejudice (Deutsch & Collins, 1951). Another field
in which retrospective pretest/posttest designs were used is program evaluation. It
continues to be especially common in professional development, training, or education
programs, where the purpose of the program is to improve participants’ knowledge,
attitudes, behaviors, or skills around a certain dimension (Bray & Howard, 1980; Mathei,
1997; Lam & Bengo, 2003; Allen & Nimon, 2007; Pelfrey & Pelfrey, 2009).
Howard and his colleagues renewed interest in the use of retrospective pretests
with a series of studies. Howard, Ralph, Gulanick, Nance, and Gerber (1979) conducted
five studies using retrospective pretest/posttest design to examine the response-shift bias
issue. These studies evaluated communication skills workshops for commissioned
officers at Air Force bases, a program designed to promote positive skills in women that
are generally deemed masculine, and finally, a communications course for undergraduate
students. The first study focused on communications skills workshops in Air Force bases
across the study, and the participants were commissioned officers. Using a traditional
pretest/posttest design, the researchers found that participants’ scores decreased from
pretest to posttest, making it appear that the program worsened participants’ condition.
Additional conversations with participants revealed they did not know enough about the
construct to respond adequately to questions about it at pretest.
Study two aimed to identify whether response-shift bias was at work. Participants
were randomly assigned to two groups, with one receiving the traditional pretest/posttest
design and the other group receiving the retrospective pretest/posttest design. The scores

47 for the two types of pretests were dramatically different, but no differences were
observed between the two posttests. The researchers concluded response-shift bias
existed and a retrospective pretest/posttest design might yield more accurate change
scores.
The third study focused on programs designed to promote androgyny in women
and examined the development of positive skills typically stereotyped as masculine by
society. Participants completed both a traditional pretest/posttest and retrospective
pretest/posttest, and workshop facilitators provided objective ratings of the participants.
Ratings in the retrospective pretest/posttest produced more significant results than those
in the traditional pretest/posttest, and the retrospective pretest/posttest ratings were more
in alignment with objective measurements. Participants were again asked to discuss their
retrospective pretest ratings, and several “were extremely articulate in documenting the
differences between their pre and then ratings and in pinpointing the specific events
within the group which caused them to doubt the validity of their pre ratings” (p. 11). The
fourth study was an expansion of the third study, which replicated the study’s results.
The fifth study focused on undergraduate students in a communications class who
participated in the study through a course, and again, the researchers saw evidence of
response-shift bias. The researchers concluded, “taken together, these five studies lend
strong support to the contention that when self-report measures are used in a pre/post
manner, the results might well be confounded by a response-shift” (p. 16). They
continued, “in every instance, the bias operated to increase the probability that the
experimental hypothesis would be rejected,” causing studies using the traditional

48 pretest/posttest design to provide overly conservative results that mask true program
effects (p. 16).
Bray and Howard (1980) examined the effects of three types of teacher training
programs on graduate assistants’ teaching behavior, perception of teaching ability, and
their students’ ratings of effectiveness. They observed a response-shift bias, and this
study extended the context of response-shift bias beyond psychology to program
evaluation in educational settings. Shortly after, Hoogstraten (1982) tested the method on
university students in an experimental psychology class, focusing on a training program
called Seeing Problems Strategy. In this study, he found a program effect in retrospective
pretest/posttest comparisons, but did not for the traditional pretest/posttest comparisons.
He concluded the retrospective pretest ratings were more valid because response-shift
bias had occurred, causing participants to overestimate their capacities in the traditional
pretest. Similarly, Mathei (1997) used the design to evaluate master’s level counselors in
training. The results of the analysis produced three groups of responses. The first group
had traditional pretest scores that were equal to their retrospective pretest scores. The
researchers later determined this group already had high level skill levels in the area of
interest, and the class only reaffirmed their beliefs about their skill levels. The second
group of respondents had traditional pretest scores that were lower than their
retrospective pretest scores. The researchers interviewed this group and discovered that
the training gave participants a better understanding of their beginning skill level. The
final group of respondents had traditional pretest scores that were higher than their
retrospective pretest scores. Interviews with this group revealed that students

49 overestimated their beginning skill levels, and the training helped them realize this
discrepancy.
Lam and Bengo (2003) evaluated elementary teachers’ changes in perception on
teaching and learning mathematics in relationship to a testing program. They tested four
administration variations of the retrospective design and found the amount of change
varied depending on the method of retrospective self-report. They recommended the
retrospective pretest/posttest design to minimize response-shift bias and to measure
changes related to socially desirable behavior, but urged researchers to investigate the
design in light of satisficing and social desirability bias.
Hill and Betz (2005) evaluated a program focused on strengthening families for
parents and youth, and administered to parent participants in the program both the
traditional pretest/posttest design and the retrospective pretest/posttest design. Hill and
Betz observed response-shift bias in their results and found a higher effect size for
retrospective pretest/posttest design than for the traditional pretest/posttest design. They
concluded, “when people expect to change and feel that they should have changed on
certain dimensions, they are more likely to magnify the degree of change on those
dimensions” (p. 512). Given this finding, the program being evaluated and the goals of
the evaluation should drive the decision of which type of pretest to use. Retrospective
ratings allow program participants the opportunity to reflect on their growth due to the
program and how they have changed. When the goals of the evaluation are to have
program participants describe their perceived change or how they feel about the program
and their own growth, retrospective ratings provide the best option. If the goal is to
benchmark against other programs, traditional pretest ratings are best as they are still the

50 most commonly used. The authors advocated for inclusion of objective criteria that can
be used to compare to retrospective pretest/posttest scores to improve confidence in the
results. They also called for more advanced statistical techniques to be used for drawing
out sources of error. Additionally, they asked future researchers to examine how
individual and contextual factors influence responses in both types of pretest. Finally,
they asked that more attention be given to how item wording affects results.
Allen and Nimon (2007) tested the retrospective pretest to see if it would be a
reliable instrument to use to evaluate a professional development conference for
secondary teachers and administrators. They found the retrospective pretest tool to be
highly reliable. They cautioned that the retrospective pretest is not meant to replace
traditional pretest/posttest designs completely; rather, it is “an evaluation technique best
utilized when the ability to independently assess learning and performance improvement
gains is limited due to time and resources” (p. 38). In 2011, they examined several
variations of administration in their evaluation of a leadership program for managers.
They concluded that participants lacked the information they needed to provide valid
ratings of their pre-intervention abilities. They also found near zero correlation between
objective performance ratings and traditional pretest scores, but strong evidence of
criterion validity for retrospective pretest ratings. Nimon, Zigarmi, and Allen (2011)
recommended administering the posttest and retrospective pretest separately for the most
valid results.
Moore and Tananis (2009) evaluated an intensive summer program in
international affairs for talented high school students. They found significant differences
between the traditional pretest and retrospective pretest scores. They concluded that

51 participants were overestimating their pre-intervention levels, and that relying on a
traditional pretest underestimates program effects. The researchers recognized social
desirability as the most likely bias at play in retrospective pretest ratings, and they
recommended incorporating open-ended questions and focus groups to provide clarity
around differences in responses and bolster evidence of validity. They also advised to be
mindful of reducing measurement error by paying attention to the wording of items, item
context, and recall context. They concluded, “if the retrospective pretest methodology
truly means trading one type of bias for another, the question becomes which of the two
biases is less desirable” (p. 200).
Criticisms
Though many studies comparing the traditional pretest/posttest and retrospective
pretest/posttest design report observing response-shift bias, researchers still raise
concerns about using the design in program evaluation. One is that the design trades one
bias for others. Krosnick (1999) noted that self-reports in general are susceptible to social
desirability and acquiescence bias. This is true for both the traditional pretest/posttest and
retrospective pretest/posttest designs. However, the traditional pretest/posttest is also
susceptible to response-shift bias because the pre-condition questions are asked before
the respondents have a clear understanding of the construct in question. The retrospective
pretest/posttest design also has certain biases that it is more prone to, including effort
justification and implicit theory of change. Effort justification bias occurs when a
program respondent adjusts his or her answers to reflect the investment he or she has put
into the program, while implicit theory of change bias occurs when a respondent reports
change because he or she assumes the program accomplished what it was supposed to

52 accomplish. This is the major criticism of the retrospective pretest/posttest design:
while it reduces response-shift bias, it invites others. Taylor, Russ-Eft, and Taylor (2009)
noted that researchers could reduce effort justification and implicit theory of change
biases by administering the retrospective pretest and posttest separately or adding control
items. These control items include skills or knowledge the program did not actually
provide.
In Harvard Family Research Project’s Evaluation Exchange, Theodore Lamb
(2005) noted that the retrospective pretest/posttest design reduces attrition and provides
more complete datasets. But Colosi and Dunifon (2006) pointed out that lack of attrition
data prohibits process evaluation. Evaluators only have data on participants who
completed the program, and may not have enough information to determine why some
dropped out of the program while others stayed. Colosi and Dunifon also stated that
surveying only participants who completed the program could overinflate program effects
because the people being surveyed are those who found the program worthwhile enough
to stay, or had another reason to complete the program.
Population
The majority of high quality research on the retrospective pretest/posttest design
has been conducted on adults in education or training programs (Bray & Howard, 1980;
Mathei, 1997; Lam & Bengo, 2003; Allen & Nimon, 2007; Pelfrey & Pelfrey, 2009).
Few studies have tested the retrospective pretest/posttest design with youth. Moore and
Tananis (2009) conducted one such study. They evaluated an intensive summer program
in international affairs for academically talented and highly motivated high school
students. The program spanned a period of five weeks, and included, “formal

53 coursework, independent and collaborative research, experiential learning through
simulations and fieldwork as well as special events and cultural activities with a heavy
emphasis on interdisciplinary and multidisciplinary learning” (p. 193). The research
included 100 high school juniors, with 40% males and 60% females. Nearly three-
quarters or 72%, of the students were white, 20% were Asian American, 3% were Latino,
0% African American, 1% mixed races, 1% Native American, and 3% other (p. 193).
Kanter and Brohawn (2014) implemented a retrospective pretest in addition to a
traditional pretest/posttest design through an evaluation of a program called Frontiers in
Urban Science Exploration (FUSE). The researchers added this component to their
research after hypothesizing that response-shift bias was responsible for decreasing
scores from traditional pretest to posttest. Results in years two, three, and four of their
study confirmed this hypothesis, showing drastically different results from traditional
pretest to posttest and retrospective pretest to posttest. They conducted this evaluation on
632 youth in the fourth year of the evaluation, with 29% in grades kindergarten through
5th grade, 17% in grades 6th through 8th grade, 49% in grades 9th through 12th grade, and
5% of students’ grade levels were unknown. The sample was nearly evenly split between
females and males.
Design issues
Researchers have investigated several design issues, including time of
administration, display, types of items, reliability and validity, and incorporating
interviews.
Time of administration. Terborg and Davis (1982) tested differences in scores
based on administering the retrospective pretest separately or concurrently with the

54 posttest and found no statistical differences, though the retrospective pretest ratings
tended to be slightly higher when only one survey was used. This finding suggested
program effects might be exaggerated if participants are aware of the expected outcomes
of the intervention. Terborg and Davis suggested researchers examine the impact of
administering the posttest followed by the retrospective pretest, or the retrospective
pretest followed by the posttest. Sprangers and Hoogstraten (1989) also suggested
instructing respondents to respond to all posttest items on one form, and then all
retrospective pretest items on a second form to control for biases such as implicit theory
of change.
Lam and Bengo (2003) tested several variations of administration to improve their
understanding of how methods of measuring change impacts responses. The first type of
administration they tested was posttest with a retrospective pretest. The second was
perceived change or post-then-only method, where participants are asked to estimate the
amount and direction of change that has happened due to the intervention. The third was
a posttest plus perceived change, in which respondents report their status at posttest and
also estimate the amount and direction of their change due to the program. The last
variation was a posttest only. The researchers found the amount of change that occurred
depended on the type of retrospective self-report used. They recommended the
retrospective pretest/posttest design to minimize response-shift bias and to minimize the
bias of social desirability.
Nimon, Zigarmi and Allen (2011) continued this research and tested several types
of administrations. First, they tested traditional pretest, posttest, and retrospective pretest,
in which the posttest and retrospective pretest were administered as two separate surveys,

55 with the posttest administered first. Second, they tested the traditional pretest, posttest,
and retrospective test with the posttest and retrospective test administered within the
same survey. Again, the posttest items were presented first. Third, the researchers
examined posttest and the retrospective pretest, with both surveys administered
separately and the posttest administered first. Finally, they employed a posttest and
retrospective pretest design where both items were presented in the same instrument, with
the posttest items appearing first. Nimon, Zigarmi, and Allen determined that the most
valid data and least biased program effects were produced when posttests were
administered separately from the retrospective test. They suggested the least valid method
was to administer the posttest and retrospective pretest at the same time with the items
adjacent to each other, as doing so invites biases such as implicit theories of change,
effort justification, and social desirability.
Item wording. Krosnick (1999) discussed what he called response-order effects,
and warns, “presentation order does have effects, but it has not been clear when such
effects occur and what their direction might be” (p. 549). He cited studies that have
shown both primacy and recency effects. Primacy effects are when respondents are more
likely to choose the first options they see, while recency effects are when respondents are
more likely to choose the most recent options they see. Other studies have found no order
effects.
In the Hill and Betz (2005) study comparing traditional pretest and retrospective
pretest results, the authors also examined differences between the two designs in types of
items. Specifically, they were interested in comparing responses at traditional pretest and
retrospective pretest for socially desirable items (“I enjoy spending time with my youth”)

56 versus socially undesirable items (“Getting my youth to do homework is a problem”).
The authors found the average for desirable and undesirable items to be about the same,
but parents rated themselves significantly lower on socially desirable items in the
retrospective pretest than they did on the traditional pretest. Undesirable items were not
rated significantly different. They recommended for the future that researchers draw out
sources of error in results by using advanced analyses.
Reliability and validity. A small number of studies have been conducted to
investigate the reliability and validity of retrospective pretest/posttest designs. Findings
indicated the retrospective pretest design provided a more accurate representation of pre-
intervention levels because individuals were able to use the knowledge they gained
through the intervention to assess both pre- and post-intervention levels using the same
standard of measurement at both administration points. Howard, Ralph, Gulanic, Nance,
and Gerber (1979) found retrospective pretest scores had greater concurrent validity
when compared with objective ratings compared to traditional pretest scores. They noted
that greater concurrent validity between retrospective pretest ratings and objective ratings
is true across several types of training, including assertiveness, interview skills, helping
skills, and interpersonal effectiveness. Bray, Maxwell, and Howard (1984) suggested that
retrospective pretest ratings are more valid indices of true treatment-related change. Later
research by Allen and Nimon (2007) cited Martineau (2004), who argued that
retrospective pretest scores correlate more highly with objective measures of change than
traditional pretest scores. Moore and Tananis (2009) also found greater reliability in
retrospective pretest measures compared to traditional pretest measures, as indicated by
Cronbach’s alpha. They hypothesized that students may have a more coherent

57 understanding of the construct in question, though they acknowledged they did not
enough information to determine whether this was the case.
Inclusion of interviews in study. Though no studies have investigated response-
shift bias and the retrospective pretest/posttest design using mixed methods, a handful of
studies have included qualitative information to bolster the validity of their findings.
Howard (1980) added that interviews provide a way to check retrospective pretest ratings
for validity. Howard, Ralph, Gulanick, Nance, and Gerber (1979) interviewed program
participants from a workshop on dogmatism to discuss their traditional pretest responses.
Participants were shown their traditional pretest responses and their retrospective pretest
responses and asked to discuss any discrepancies. Interviewees typically admitted they
did not have a good understanding of the construct at the time of the traditional pretest
and felt their retrospective pretest ratings were more valid. Howard (1980) further
discussed the results of the studies he and his colleagues conducted. He added anecdotal
evidence from program participants who believed their traditional pretest ratings were
inaccurate, and their retrospective pretest ratings were more valid. According to Howard,
“subjects were typically aware that their retrospective ratings provided a differing picture
of their pretreatment levels of functioning than their self-report pretest responses and
volunteered explanations of why they believed their pretests to be inaccurate” (p. 97-98).
Cantrell (2003) used the design to assess the impact of methods and practicum
classes on teacher self-efficacy beliefs of pre-service science teachers. To get a better
understanding of why they observed differences in the retrospective pretest compared to
the traditional pretest, the researcher selected eight students at random, and asked them to
clarify the differences in their responses to items for both pretests. Participants were

58 shown their responses and asked to explain those differences. The interviews indicated,
“the students seemed to doubt validity of their initial responses, because at the time they
did not have enough information up on which to base their beliefs” (p. 181). Moore and
Tananis (2009) incorporated open-ended questions, focus groups, and whole-group
debriefings to better understand the response-shift they detected in their research.
Students reported they had overestimated their initial knowledge and skills before the
program. One student reported, “I really thought I knew a lot about [global issues] before
coming here…but when I got here and started going to classes and doing [the
simulations] I found out just how little I really did know” (p. 1999).
Importance of Current Research
Youth
This study tested whether a response-shift bias exists for urban high school
students in an after-school setting. Though youth-serving programs face many of the
same challenges in evaluation as other programs, few published or readily available
reports exist to provide evidence of how the retrospective pretest/posttest design performs
when surveys are completed by youth. Furr and Bacharach (2014) pointed out that
psychometric properties such as reliability and validity are sample-dependent: the
characteristics of the survey respondents and the contexts in which they complete the
survey matter. Moore and Tananis (2009) utilized the method with gifted high school
students in an academic summer program, but this population and setting are quite
different from the students served by ASM and the types of programs in which they
participate.

59 Mixed Methods Design
Another study by Kanter and Browhan (2014) examined the retrospective
pretest/posttest and design with high school students in after-school programs, a majority
of whom were ASM participants. In this study, only quantitative data were collected.
Some studies of other populations have included interviews or focus groups as part of
their study on the retrospective pretest/posttest design and response-shift bias (Howard,
Ralph, Gulanick, Nance, & Gerber, 1979; Cantrell 2003; Moore & Tananis, 2009). The
qualitative evidence collected often provided confirmation that participants did not
understand what they did not know when they completed their traditional pretest. Though
this type of evidence is collected, researchers generally focus more on the quantitative
analysis. My study utilized a mixed method design to quantitatively determine whether a
statistical difference exists between traditional pretest and retrospective pretest scores,
but then incorporated qualitative methods to explore response-shift bias and the cognitive
process for completing retrospective pretest questions with program participants at ASM.
Summary
This chapter provided an overview of topics in self-report measures that are
relevant to the retrospective pretest/posttest design, including the cognitive processes
required by survey respondents, and biases that threaten internal validity in self-report
measures. Biases such as social desirability, acquiescence, effort justification, implicit
theory of change, and response-shift bias can harm on the psychometric properties of
self-report measures.
The review of the literature also indicated several areas for further research.
Researchers have called for additional research on controlling for other self-report biases

60 when using the retrospective pretest/posttest design method, continued testing of
variations in administration and display methods, and further examination of issues
related to reliability and validity. Two areas specifically are not commonly addressed in
the literature. One is that there is little research on how participants’ age affects their
ability to complete a retrospective pretest. There are only two studies readily available
that test the design with youth. Second, though qualitative data are sometimes collected
through focus groups, interviews, and open-ended questions, no studies have examined
response-shift bias in this design through a mixed methods approach. These gaps
provided an exciting direction for my research. Chapter three provides details on the
mixed method design used to examine the response-shift bias, the retrospective
pretest/posttest design, and teens’ cognitive process when completing survey questions
under this design.

61
CHAPTER THREE
METHODS
Introduction
This section provides an overview of the research design and methods used to
investigate whether response-shift bias exists for urban high school students in an after-
school program, students’ perspective on why their responses changed, and the cognitive
process they used to respond to retrospective pretest questions. The study employed a
mixed methods design, incorporating both quantitative and qualitative data collection and
analysis. The quantitative and qualitative activities are described separately in this
chapter, followed by an overview of how the two strands of data collection were mixed.
Problem and Purposes Overview
Evaluators face several challenges in conducting program evaluation, including
limited staff time and expertise, limited budget, lack of support from leadership, and
constraints related to data (Bamberger, Rugh, Church, & Fort, 2004; Reed & Morariu,
2010). Additionally, evaluators and program providers often have evaluation priorities
that compete with those of the stakeholders (Hill & Betz, 2005). These challenges and
competing priorities often result in a lack of design options for evaluators (Hill & Betz,
2005). The purpose of this study was to test the retrospective pretest/posttest design in
conjunction with the traditional pretest/posttest design to determine whether response-
shift bias exist and to better understand response shift-bias with urban high school

62 students in an after-school program using a mixed methods design. Additionally, the
purpose was to understand the cognitive process for retrospective pretest questions.
Epistemological Assumptions
Epistemological assumptions are important to note because they guide the
researcher as he or she conducts research. This research was conducted using a pragmatic
epistemology. According to Creswell and Plano Clark (2012) and Greene (2007),
pragmatism is often associated with mixed methods. In pragmatism, the research
questions hold more importance than the research methods; in fact, the questions drive
the methods. Creswell and Plano Clark described pragmatism as “pluralistic and oriented
toward ‘what works’ and practice” (2012, p. 41). They noted that pragmatism focuses on
the consequences of actions, centers on a specific problem, utilizes pluralistic approaches,
and orients itself in real-world practice. This worldview aligned with my research in
several ways. First, my research explored the consequences of administering a traditional
pretest and retrospective pretest in ASM programs, which traditionally only complete
posttest surveys. Second, my research questions arose from a specific problem I
encountered at ASM, which was a lack of design options in program evaluation given
limited resources and capacity. Third, my research incorporated plurality through the
mixed methods design, which includes both quantitative and qualitative components.
Finally, my study was situated in real-world practice. I am the director of research and
evaluation at ASM, and this issue continues to be of special interest to me because I have
faced several challenges in implementing wide-scale measurement tools to assess student
change. These reasons indicate that pragmatism was the best epistemological approach
for my research.

63 Research Questions
This study used mixed methods to address the following research questions:
1. Is response-shift bias present when comparing scores from traditional pretest and
retrospective pretest surveys for urban high school youth in an after-school
program?
2. If traditional pretest and retrospective pretest scores are different, why do these
differences exist according to the perspective of the survey respondents?
3. What is the cognitive processing of youth when completing a retrospective
pretest/posttest?
Research Design
Mixed Method Design
Definition. Creswell and Plano Clark (2012) provided characteristics of mixed
methods research rather than offering a definition. In this type of research, the researcher
collects and analyzes both quantitative and qualitative data; mixes both types of data
either concurrently, sequentially, or embeds one in the other; and gives priority to one or
both types of data. The researcher also implements procedures in either a single or
multiphase study; frames the procedures within philosophical and theoretical views; and
combines these procedures into the design, using them to direct the plan for
implementing the study. This description from Creswell and Plano Clark led me to
classify my design as a mixed methods study.
Purpose. There are several reasons a researcher might want to mix methods.
Greene, Caracelli, and Graham (1989) presented a typology that includes five purposes
for mixing quantitative and qualitative research methods. This includes triangulation

64 (seeking convergence), complementarity (seeking elaboration), development (using
one method to inform the other), initiation (discovery of paradox and contradiction), and
expansion (using different methods for different questions). My study used mixed
methods primarily for the purposes of triangulation and complementarity. According to
Greene (2007), triangulation “seeks convergence, corroboration, or correspondence of
results from multiple methods,” with the primary rationale being to “increase the validity
of construct and inquiry inferences by using methods with offsetting biases” (p. 100). In
my study, I used quantitative research to determine whether a response-shift bias exists
for my population, and I used qualitative research to provide further evidence and
explanation of response-shift bias. I also used mixed methods for purposes of
complementarity. This purpose indicates the desire to seek “broader, deeper, and more
comprehensive social understandings by using methods that tap into different facets or
dimensions of the same complex phenomenon” (Greene, 2007, p. 101).
My primary justification for using mixed methods to investigate response-shift
bias was that this cognitive phenomenon is a complex issue that cannot be easily
understood through quantitative or qualitative data alone. According to Greene, “there are
multiple legitimate approaches to social inquiry and…any given approach to social
inquiry is inevitably partial” (p. 20). Greene’s point is that both quantitative and
qualitative data have their advantages and disadvantages; neither is perfect. Secondly,
there were no studies that provide adequate qualitative evidence to explain the cognitive
process; research generally focuses on whether the response-shift bias exists using
quantitative methods. While some studies of other populations have included interviews
or focus groups as part of the study on the retrospective pretest/posttest design and

65 response-shift bias (Howard, Ralph, Gulanick, Nance, & Gerber, 1979; Cantrell 2003;
Moore & Tananis, 2009), these studies did not provide an understanding of the cognitive
process a respondent goes through. The studies also did not provide information about
how the cognitive process may differ for younger respondents. The research study
described in this dissertation utilized a mixed method design to quantitatively determine
whether a statistical difference exists between traditional pretest and retrospective pretest
scores. It then incorporated qualitative methods to explore the cognitive process youth
utilize to complete retrospective pretest questions, as well as their reflection on why their
answers changed or remained the same from pretest to retrospective pretest.
Challenges in using mixed methods design. Cresswell and Plano Clark (2012)
acknowledged that mixed methods is not appropriate for every researcher or problem. It
requires:
…having certain skills, time, and resources for extensive data collection and analysis, and perhaps, most importantly, educating and convincing others of the need to employ a mixed methods design so that the scholarly community will accept a researcher’s mixed methods study. (p. 13)
The first requirement is that the researcher has experience in conducting quantitative and
qualitative research separately before embarking on a mixed methods research study.
This includes an understanding of data collection and analytic techniques as well as how
reliability and validity are defined for each method. Additionally, the researcher should
be well-versed in the literature on mixed methods research to ensure an understanding of
best practices and the latest techniques using mixed methods.
The second requirement relates to time and resources. Researchers need to make
sure they have sufficient time to collect and analyze two types of data and whether they
66 have sufficient resources from which to collect and analyze these types of data. They
also need to determine if appropriate skills and personnel are available for the study.
Creswell and Plano Clark (2012) pointed out that qualitative data collection and analysis
generally takes more time than quantitative data, and multiple phases in the study
lengthen the timeline needed to complete the project. They also pointed out the expenses
that come with mixed methods studies, including having both quantitative and qualitative
data analysis software, the printing of instruments and materials, and recording and
transcription costs. Because mixed methods takes a fair amount of resources and time,
Creswell and Plano Clark recommended working in teams with others and “bringing
together individuals with diverse methodological and content expertise and of involving
more personnel in the mixed methods project” (p. 15).
Finally, Creswell and Plano Clark (2012) noted the challenge of convincing others
of the value of mixed methods research, as it is relatively new as a methodology. They
recommended identifying and sharing exemplary mixed methods studies in literature with
others. Since the term “mixed methods” is still new, the authors recommended
identifying appropriate studies by searching for terms such as “mixed method,”
“quantitative and qualitative,” “multi-method,” and “survey and interview.”
I was, and still am, well-positioned to overcome these limitations. First, I was
very fortunate that I did not need to justify the value of mixed methods research to After
School Matters (ASM) leadership. Improving program evaluation remains an interest to
ASM, and there are already dedicated resources to both quantitative and qualitative
research. Second, I was able to combat issues of time and incorporating diverse
perspectives to the study by including both of my team members at ASM in the research

67 and evaluation department as part of this study. Each team member has a unique
background. I have several years of experience in quantitative and qualitative data
collection and analysis in the field of education, and I have also studied and read several
pieces of literature related to mixed methods research. Another staff member has a few
years of experience in quantitative data collection and analysis experience, conducting
one-on-one interviews in the field of psychology, assessing programs via observation,
and conducting informal one-on-one feedback sessions with ASM program staff and
instructors. The final staff member has several years experience managing and providing
support to program instructors. She also has a few years of experience assessing
programs via observation and conducting informal focus groups with ASM instructors.
Quantitative and qualitative strands. In mixed methods research, a strand is “a
component of a study that encompasses the basic process of conducting quantitative or
qualitative research: posting a question, collecting data, analyzing data, and interpreting
results based on that data” (Teddlie & Tashakkori, 2009 as cited in Creswell & Plano
Clark, 2012, p. 63). This study included a quantitative strand and qualitative strand. The
figure below provides an overview of the process.

68 Figure 1. Overview of the Design
Priority. In mixed methods studies, the quantitative or qualitative strand receives
priority, or both strands have equal priority. This study set both methods at equal priority
because each one played an equally important role in answering the research questions.
The quantitative analysis determined whether response shift-bias exists, and it is the
prevalent method for making this determination in previous research (Howard, 1980;
Cantrell, 2003; Moore & Tananis, 2009). However, the qualitative strand was also
important because it has been underutilized or under-reported in previous research, and it
added valuable context on why the response-shift bias is occurring to inform how to
improve the method in practice.
1 QUAN
Administer traditional pretest
2 QUAN
Administer retrospective
pretest/posttest +
QUAL Conduct cognitive
interviews
3 QUAN
+ QUAL
Data analysis
6 QUAN
+ QUAL
Interpretations
5 QUAL
Conduct program experience interviews
4 QUAN
+ QUAL
Interpretations

69 Timing. The quantitative and qualitative strands can occur concurrently,
sequentially, and in multiple phases. In my study, I used multiphase combination of
timing. The traditional pretest survey was administered first at the beginning of the
program, and the retrospective pretest and posttest surveys were administered at the end
of the program. This was the quantitative strand. However, some interviews took place as
students completed the retrospective pretest and posttest (cognitive interviews), and
others occurred after both surveys were completed (program experience interviews). This
multiphase combination of timing demonstrated that at times, the strands were sequential,
and other times they were concurrent.
Mixing. Mixing is the integration of the quantitative and qualitative strands.
There are several points in the process that the researcher can integrate the two strands:
interpretation, data analysis, data collection, and level of design (Creswell & Plano Clark,
2012). My study mixed the quantitative and qualitative strands in a few ways. First, I
mixed at the point of data collection. I used the quantitative strand to identify specific
cases to target for program experience interviews after the program ended. For example,
students with extremely different scores from traditional pretest to retrospective pretest
were recruited to participate in interviews to learn more about their program experiences
and thinking processes. I also mixed during my interpretation. Any conclusions I drew in
answering my research questions are based on what was learned from both the qualitative
and quantitative strands.
Researcher Role and Experience
I have worked at ASM as the internal evaluator for five years. For three of those
years, I was the sole full-time staff member dedicated to research and evaluation. In July

70 2014, I was promoted to director of research and evaluation, and I hired an analyst and
a specialist to join my team. Our team is responsible for all research and evaluation
activities, including the collection, analysis, interpretation, and reporting of data.
I served as the principal investigator in this study, but both of my team members
assisted me in qualitative data collection. I included them in the research for a few
reasons. First, qualitative data collection can be time consuming, and having three
interviewers allowed us to collect information more quickly. Second, Creswell and Plan
Clark (2012) advocated for multiple researchers when implementing a mixed methods
design. Finally, my research is not just important to me; it affects my team and many
other people at ASM. Therefore, my team members have a stake in improving how we
measure the impact of programs.
I conducted all quantitative analysis for this study. I have over 10 years of
experience in developing surveys and analyzing survey data. I was also one of three
researchers collecting qualitative data. I have five years experience conducting
observations, focus groups, and interviews. My team members also conducted interviews.
The analyst and specialist on my team both have experience in conducting informal
interviews. I provided training to them on the interview protocols used in this study to
ensure the process was implemented uniformly across interviews and with fidelity.
Program Background
ASM programs were chosen for this study for several reasons. First, ASM is the
largest provider of out-of-school-time opportunities to teenagers in Chicago. The purpose
of this research was to determine whether response-shift bias exists for this population
and how teens speak about changes in their traditional pretest and retrospective pretest

71 scores, making ASM programs appropriate to study. Second, ASM encounters many of
the same challenges other organizations face when trying to evaluate programs. One
challenge is balancing program provider and stakeholder objectives. Priorities often
compete with each other, with funders wanting baseline data and ASM staff having
difficulty collecting data at more than one time point from a teen population. Another
challenge is staff capacity and time. For several years, ASM employed one full-time
employee to evaluate programs. This was difficult to do given ASM’s programming;
ASM offers over 1,000 programs to 23,000 teens each year at over 300 different sites
across the city of Chicago. Additionally, ASM has a limited budget for research and
evaluation activities, coming in lower than the recommended 5% of the total
organizational budget (Reed & Morariu, 2010). On a promising note, ASM leadership
recently made an investment in research and evaluation, expanding the team of one
person to a team of three people. This investment in research and evaluation demonstrates
that ASM leadership sees it as a priority. This investment also indicated such a study
could be successfully completed at ASM. Appendix A includes a letter of cooperation
from ASM.
The final reason ASM was a logical choice to study this issue is that there is now
a team of three internal evaluators with different backgrounds. As previously mentioned,
Creswell and Plano Clark (2012) noted the importance of having a team with different
backgrounds to conduct mixed methods studies.
It is important to note that ASM programs vary greatly by content area. Teens
may participate in programs in five different content areas: arts, communications, sports,
science, and technology. Even within each content area, programs vary. For example, the

72 arts content area includes culinary arts, visual arts, performance arts, and more, while
science includes urban gardening, robotics, computer science, and so on. Additionally,
ASM programs differ by geographic area, as they are spread throughout the city. These
areas provide different programs, serve different teens, and operate in different
communities. Because these nuances by content area and geographic exist, I took them
into account when developing the sampling strategy.
Study Design
This study took place during the fall 2015 program session at ASM, with data
collection beginning in August and ending in December (note: additionally, a pilot study
took place summer 2015 to test implementation, schedules, and protocols. More
information about the pilot is provided in Appendix B). This section describes the
quantitative strand, qualitative strand, and the mixed methods approach used in the study.
Quantitative Strand
Population description. There were 7,891 students enrolled in programs in fall
2015, and 6,574 students completed the program. The students included in this
population were all high school students, ages 13 to 19 and grades 9 through 12. The
gender breakdown of all fall 2015 ASM participants was 60.6% female, 38.6% male, and
the remaining students chose not to identify. The racial and ethnic breakdown of the
students was similar to previous program sessions, with 56.4% Black/African-American,
32.6% Hispanic/Latino, 4.5% two or more races, 2.9% Asian, 2.7% Caucasian, and the
remainder were other ethnicities. Students at ASM are typically from lower
socioeconomic backgrounds, with 87% of students who receive free or reduced lunch in

73 their schools. Students come from each of the 77 community areas in Chicago; the
largest proportion of students is from the Austin neighborhood (7%).
Selection process and sampling. In order to obtain a large and diverse sample,
all 7,891 teens that registered for the fall 2015 program session were invited to complete
the traditional pretest as part of the application process and the retrospective
pretest/posttest as part of the ASM teen post-program survey. The quantitative part of the
study included only students who actually attended programs and completed all six
survey items for the traditional pretest, posttest, and retrospective pretest questions,
resulting in a sample size of 4,311. This sample of students was very similar to the
overall population of enrolled students. See Table 2 for the comparison.

74 Table 2. Comparison of Population and Sample Characteristics
Characteristics Population (n=6,574) Sample (n=4,311)
Gender Choose Not To Identify 0.7% 0.8%
Female 60.6% 62.4% Male 38.6% 36.8% Race/Ethnicity
American Indian/Alaskan Native 0.5% 0.5% Asian 2.9% 3.3% Black/African American 56.4% 54.6% Hispanic 32.6% 34.7% Native Hawaiian/Other Pacific Islander 0.2% 0.1% Two or More Races 4.5% 4.1% White 2.7% 2.7% Not Reported 0.0% 0.0% Grade
8th 0.3% 0.2% 9th 19.4% 19.2% 10th 30.8% 32.5% 11th 26.5% 26.9% 12th 22.8% 21.3% College Freshman 0.1% 0.0%
Using G*Power 3.1, I conducted a power analysis to determine an adequate
sample size for a two-way t-test using two dependent means with an alpha of 0.05, an
effect size of 0.5, and power of 0.8. The power analysis determined that I needed at least
54 students, which would amount to less than two programs. I chose to oversample for
several reasons. For one, not all programs have 100% of their students complete a
posttest, and this study added a traditional pretest at the beginning of the program. This
created an extra burden and potential obstacle to meeting my sample size requirements.
Another important factor in my consideration to oversample was that not all youth make

75 it to the end of the program. In fact, if enrollment and attendance are low, programs
may be canceled before the program session ends. These issues could have potentially
reduced my sample size, and therefore reduced my power, making it necessary for me to
oversample for my study in order for my data and interpretations to be meaningful.
Because my sample was much higher than the 54 needed to adequately power my study,
there was a possibility for my study to be overpowered. Mertens (2010) recommended
reporting an effect size estimate when reporting a p value, and Howell (2010) added to
report confidence intervals around effect size. These figures add context to my study.
Instrumentation. ASM was most interested in demonstrating changes in specific
21st century skills. The items of interest related to 21st century skills were leadership,
teamwork/collaboration, problem solving, public speaking and oral communication,
meeting deadlines, and accepting constructive criticism. It is important to note that in no
way was this construct meant to be a true psychological construct; it was not exhaustive
of all relevant 21st century skills. This construct was strictly for program evaluation
purposes. These skills were chosen based on literature on 21st century skills for youth,
commonly reported skills in ASM instructors’ weekly plans, and teens’ self-reported
open-ended comments about skills they have learned in programs. My hope for the future
is that this construct will eventually be more robust, or ASM will find a more suitable
measurement tool. Table 3 describes the items included in the traditional pretest,
retrospective pretest, and posttest.

76 Table 3. Instrument Items
Item Name I know how to lead a team or group activity. I work well with others on team/group projects. I am good at solving problems. I am comfortable speaking in front of a group or audience. I get things done on time. I am open to receiving feedback about my work.
For the traditional pretest and the posttest, the directions asked students to rate the
items based on how much they agreed, using an agreement scale. Students could select
“Strongly disagree,” “Disagree,” “Neutral,” “Agree,” or “Strongly agree.” The question
stated, “How much do you agree with the following statements? Please rate these items
based on your skill level at the TODAY.” Appendix C depicts the traditional pretest
questions in a document called After School Matters Pre-survey. For the retrospective
pretest, which was administered at the same time via the same instrument as the posttest,
the scale and items remained the same, but the directions for the items were slightly
different. The directions stated, “How much do you agree with the following statements?
Please rate these items based on your skill level at the BEGINNING of your program.”
Additionally, after the posttest and retrospective pretest items, students had the chance to
answer an open-ended question that asked them to describe the skills they learned in their
program. These responses help to support any self-reported change from the youth.
Appendix D provides the After School Matters Teen Post-survey, which includes the
retrospective pretest/posttest.
Procedures. In order to participate in an ASM program, teens must submit an
online application. Students were given a traditional pretest as part of their application for

77 fall 2015. Students who participated in an ASM program in the summer and elected to
participate in the same program in the fall did not need to reapply. These students
received a separate traditional pretest with the same questions via Survey Monkey.
Responses for students who did not participate in the program were not included in the
study.
As part of the ASM evaluation process, ASM works with its instructors to
administer a post-program survey to all teens. Though administration of the survey to
teens is a requirement for instructors, not all instructors actually do it; the response rate to
the ASM teen post-program survey was 82.6%. All surveys were administered online
through Survey Monkey for the retrospective pretest and posttest. The retrospective
pretest and posttest were administered during weeks nine and 10 of the 10-week program
session. Posttest questions appeared first in the survey, and retrospective pretest questions
appeared second on a separate page in the Survey Monkey. This procedure followed
Schwarz’s (1999) recommendation; Schwarz reported higher criterion validity for
retrospective pretest scores when posttest questions were shown first. Additionally,
displaying the posttest question before the retrospective pretest is thought to reduce
biases related to implicit theory of change, effort justification, and social desirability.
Respondents were informed that their responses were confidential and would not
be shared outside of the research and evaluation team unless there was concern for the
student’s safety. This is ASM’s standard practice for the teen survey. Note that responses
were not anonymous to the researcher; name, birthdate, and email address are captured so
that responses can be mapped back to other program-related data for other organizational
reporting purposes. After that process occurred, students were de-identified for analysis,

78 and all analysis occurred at the aggregate level (i.e. overall results or by results by
program). This was explained to students in an effort to make them more honest and
reduce social desirability bias.
The response rates for the traditional pretest, posttest, and retrospective pretest
varied, as demonstrated by Table 4. Given that the traditional pretest was included as part
of the application process, it was much higher than the response rate for the other test
administration at 84.8%. The response rates were lower for the posttest and retrospective
pretest at 77.7% and 77.1%, respectively, due to the difference in procedures of
administration. The response rate for students who completed all six items in all three
tests was 65.6%, which is lower than the typical ASM teen post-program survey response
rate of 77%. A lower response rate was expected due to the addition of another test
administration, but it is not cause for concern, as the characteristics of population and the
sample are very similar.
Table 4. Response Rates by Test
Test Completed Total Response Rate Traditional Pretest 6,688 7,891 84.8% Posttest 5,111 6,574 77.7% Retrospective Pretest 5,066 6,574 77.1% All Tests 4,311 6,574 65.6%
Data analysis. Data analysis included descriptive statistics of the sample and
reliability estimates on the scores from the traditional pretest, retrospective pretest, and
posttest. I used a two-tailed dependent sample t-test to determine differences between
traditional pretest and retrospective pretest, and effect sizes to determine the magnitude
of the differences. All data analyses were conducted using SPSS.

79 Descriptive statistics. The means and standard deviations were calculated for
each item as well as each type of test: traditional pretest, posttest, and retrospective
pretest. Additionally, I calculated mean change scores and standard deviations for each
item and test combination, including traditional pretest and retrospective pretest,
traditional pretest and posttest, and retrospective pretest and posttest.
Differences in scores. I used a two-tailed dependent sample t-test to determine
whether significant differences exist between average scores of the traditional pretest and
retrospective pretest for each item and for the set of items overall (e.g., Howard, Ralph,
Gulanick, Maxwell, Nance, & Gerber, 1979; Bray & Howard, 1980; Lam & Bengo,
2003; Moore & Tananis, 2009).
Effect sizes. Studies that compare traditional pretest and retrospective pretest
scores often include effect sizes (e.g., Hill & Betz, 2005; Nimon, Zigarmi, & Allen, 2007;
Moore & Tananis, 2009). Effect sizes are especially important because they signify the
magnitude of difference, and they are not influenced by sample size (Furr & Bacharach,
2014). I also provided effect sizes for each of the items and the set of items overall.
Missing data. Students completed a traditional pretest at the beginning of the
program, and a retrospective pretest and posttest at the end of the program. While
response rates for the traditional pretest, retrospective pretest, and posttest varied, the
characteristics across each type of test did not. For the purposes of this study, I was only
concerned about students who completed all six items on all three surveys, so I removed
students who did not meet this criterion from my analysis. The characteristics of the
population and my sample were very similar, so missing data were not a concern.

80 Reliability and validity. I examined the reliability of my survey items and
protected against certain threats to validity in this study.
Reliability. I calculated the reliability estimates for the difference scores for each
item using internal consistency. According to Furr and Bacharach (2014), “the
fundamental idea behind the internal consistency approach is that the different ‘parts’ of a
test can be treated as different forms of a test” (p. 132). Internal consistency looks at how
consistently people answer items in a domain, and it requires that respondents complete
only one test at only one point in time. Based on my review of the literature, internal
consistency is the most commonly reported reliability estimate in retrospective
pre/posttest studies (e.g., Nimon, Zigarmi, & Allen, 2007; Moore & Tananis, 2009). I
also calculated reliability estimates for differences scores for the traditional pretest and
retrospective pretest. All three tests demonstrated internal consistency. The traditional
pretest had a Cronbach’s alpha of 0.87, the posttest Cronbach’s alpha was 0.91, and the
retrospective pretest Cronbach’s alpha was 0.89, indicating high internal reliability of the
items as a scale.
Table 5. Reliability Estimates
Internal Consistency Cronbach's
alpha Traditional Pretest 0.87 Posttest 0.91 Retrospective Pretest 0.89
Validity. This study did not examine the validity of the survey items in question,
nor did it examine the validity of the items as a scale. However, the quantitative part of
this study focused on protecting internal validity by controlling for certain self-report

81 biases. Researchers have warned that placing retrospective and posttest items next to
each other on the instrument can introduce self-report biases such as effort justification or
implicit theory of change (Schwarz, 1999; Terborg & Davis, 1982; Taylor, Russ-Eft, &
Taylor, 2009). To minimize the possibility of students responding with these biases, the
retrospective pretest and posttest questions were not shown side by side, but rather as two
separate questions. In order to minimize social desirability, the directions encouraged
students to be honest in their answers and informed them that there are no correct or
incorrect responses (Furr & Bacharach, 2014). Respondents were also told that their
answers were anonymous to everyone outside the research and evaluation team, unless
there was concern for their safety or the safety of another student (Krosnick, 1999).
Ethics. The data analyst on my team was the only other person who had access to
the raw survey data. She has been with ASM for over two years, first as an intern and
then as a full-time analyst. In her role, she works with our participant management
system vendors to match teen survey responses to their participant record in our system
so that we can link the data back to program information for further analysis by content
area, region, and so on. She then reports the aggregate level results of the surveys to the
organization for evaluation purposes.
I sought a waiver of documentation of informed consent for the quantitative
portion of this study (Appendix E). As part of the survey, students received a consent
statement that informed them about the research and gave them an option to opt out of the
study. The language at the beginning of the survey is available in Appendix C. All survey
results were reported aggregate form, and no individual responses were shared unless
there was concern for a student or instructor’s safety.

82 Qualitative Strand
The qualitative strand of the study included two interviews at two time periods;
one set as students were completing the retrospective pretest/posttest (cognitive
interviews) during the second to last week of program, and the other during the final
week of programs, after surveys were completed (program experience interviews).
Sampling. For my qualitative sample, I first purposively selected youth at the
program level as a means to streamline recruiting. Using historical data, I chose five
programs to represent the different content areas and parts of the city based on several
criteria. I then used both cluster sampling for selecting teens for the cognitive interviews
and purposive sampling for selecting youth for the program experience interviews.
Program sampling. First, I purposively selected youth at the program level to
participate in the qualitative strand of the study. Merriam (2009) explained purposive
sampling is “based on the assumption that the investigator wants to discover, understand,
and gain insight and therefore must select a sample from which the most can be learned”
(p. 77). There are typically 15 to 30 youth in each program, managed by one or more
instructors. Random selection at the youth level would have almost surely resulted in an
insufficient sample size; at the program level, I was able to work with instructors to
ensure a higher overall participation rates in the interviews.
In purposive sampling, the researcher must determine the criteria for selection. In
selecting the actual programs to include, I started with a broad list of programs and
historical data about those programs. First, I removed programs that historically do not
have high survey response rates. Since the purpose of my study is to learn about the
retrospective pretest/posttest design and response-shift bias, I needed to focus on

83 programs that typically do not struggle with survey completion. The same was true for
program completion. In order to learn as much as possible about response-shift bias, my
participants for the program experience interviews needed to complete the traditional
pretest, retrospective pretest, and posttest, which meant students needed to complete the
program in order to be present for the second survey administration. This meant that
programs with high drop rates were excluded from the study. Third, I also identified
programs that generally have a good mix of new and returning students. I suspected that
students who are new to ASM and students who have participated with ASM several
times may respond differently to questions about skills gained. Finally, I removed
programs with low average daily attendance rates. Typically, programs with low average
daily attendance rates are struggling with recruitment or enrollment issues, and cannot
participate in an additional research project.
I chose five programs as part of this sampling process. The five programs
selected, as well as their alternates, were chosen to be representative of ASM’s general
population, the four regions, and the five content areas. At the time of this study, ASM
organized programs into four regions that represented different areas of the city, all of
which were managed separately. I selected one program from the north region, one from
central region, two from the south region, and one from the downtown region. I selected
two programs from the south region because it was the largest of the four regions in terms
of space covered as well as number of teens served. I also selected an alternative for each
region and two for the south region. Finally, as noted earlier, ASM also has five content
areas, including arts, communications, science, sports, and technology. I worked with

84 program specialists to select one program per content area for the pilot, and one
program per content area as alternates.
In summary, the selection criteria are listed below, in order of priority:
• Representative of ASM regions
• Representative of ASM content areas
• Diverse and representative demographic characteristics
• Mix of returning/new students
• High survey completion rates
• High program completion rates
• High average daily attendance rates
After I narrowed down my list of potential programs, I worked with ASM
program specialists to identify five programs for the pilot that fit my criteria. Program
specialists serve as the day-to-day contact for program instructors, and they also provide
coaching to instructors around program quality and compliance. Program specialists
know programs best and have important knowledge about the program, including other
projects and special initiatives in which programs are involved, as well as the programs’
strengths and weaknesses. This information was pivotal in choosing programs that are
likely to cooperate and successfully complete an additional research project. Working
with program specialists, I finalized a list of five programs and five alternates. Two of the
final five programs included in the study were alternates because my first choice
programs were not able to participate in the research during the fall 2015 program
session.

85 Sampling of individual youth. My highest priority in the qualitative strand was
to select students purposively that were representative of ASM’s overall demographics,
regions, and content areas. A total of 30 students were interviewed. There were two types
of interviews conducted at two time periods, and the sampling methods differed for each
type of interview. In the first round of interviews, two or more students were selected
from each program to participate in cognitive interviews as he or she completed the
retrospective pretest and posttest. The purpose of these interviews was to understand the
cognitive process in which students engage as they complete the survey. For these
interviews, I used cluster sampling to select teens to participate. Teddlie and Tashakkori
(2009) described cluster sampling as way to obtain a more efficient probability sample by
groups or clusters that naturally occur in the population. I selected at least two students
from each program in an effort to achieve representativeness of ASM populations,
regions, and content areas, for a total of 16 students. While I was able to interview at least
two teens per program to represent the different regions and content areas, I was not able
to match the characteristics of the general teen population. As Table 6 indicates, males,
Latino/Hispanic youth, and 10th grade students were underrepresented in my sample
compared to the overall population. There are a few reasons for this. First, I selected
programs based on historical data. Though a program may have served a group of
students similar to ASM overall in the past, there is no guarantee that the program will
continue to do so. Many changes can occur in a program between one session and the
next; the program may change locations, instructors, type of apprenticeship, or even the
curriculum. Second, my sample selection was limited by which students returned a
completed consent and assent form.

86 Table 6. Cognitive Interview Participant Characteristics
Characteristics Population (n=6,574) Sample (n=16)
Gender Choose Not To Identify 0.7% 0.0%
Female 60.6% 75.0% Male 38.6% 25.0% Race/Ethnicity
American Indian/Alaskan Native 0.5% 0.0% Asian 2.9% 6.3% Black/African American 56.4% 56.3% Latino/Hispanic 32.6% 25.0% Native Hawaiian/ Pacific Islander 0.2% 0.1% Two or More Races 4.5% 4.1% White 2.7% 12.5% Not Reported 0.0% 0.0% Grade
8th 0.3% 0.0% 9th 19.4% 31.3% 10th 30.8% 6.3% 11th 26.5% 37.5% 12th 22.8% 25.0% College Freshman 0.1% 0.0%
The second round of interviews occurred after the retrospective pretest and
posttest have been completed. These program experience interviews focused on students’
reflection on their program experience and their responses on the traditional pretest,
retrospective pretest, and posttest surveys. Again, at least two students per program were
interviewed. These students were selected purposively using the unique sampling
strategy. Merriam (2009) described this as a focus on “unique, atypical, perhaps rare
attributes or occurrences of the phenomenon of interest” (p. 78). These students were
identified after they completed the ASM teen post-program survey based on their
responses; more specifically, students were chosen based on their average change score

87 across all six items from traditional pretest to retrospective pretest. I selected a
representative group of students with no/small change, moderate change, or large change.
This selection process allowed me to compare and contrast qualitative data based on
change groups.
My team interviewed 14 teens about their program experience. The majority of
these students were female (85.7%). The racial and ethnic breakdown of the students
included 42.9% Black/African American, 50.0% Latino/Hispanic, and 7.0% were two or
more races. Students from each grade level were chosen, with 35.7% in 9th grade, 14.3%
in 10th grade, 28.6% in 11th grade, and 21.4% in 12th grade. Of these 14 students, 35%
demonstrated high change (change scores between 0.8 and 1.0), 42.9% exhibited
moderate change (change scores between 0.3 and 0.79), and 21.4% indicated little change
or no change at all (0.0 to 0.29).
Appendix F lists pseudonyms of teens interviewed, and includes teen information
such as gender, race/ethnicity, and grade, and program information such as content area
and region. Finally, the list includes the type of interview teens participated in and their
change level from traditional pretest to retrospective pretest.
Instrumentation. Interviews were conducted at two separate times; this includes
interviews while teens completed their retrospective pretest/posttest and interviews with
teens after they completed all surveys. The interviews that took place as students
completed the retrospective pretest and posttest are called cognitive interviews, and the
interviews that occurred after programs have ended are called program experience
interviews.

88 Cognitive interviews. According to Willis (1999), cognitive interviews are used
as a way to evaluate response error in surveys. Because of the complexity of the cognitive
process a respondent undergoes in responding to surveys (Krosnick, 1999; Schwarz,
1989), researchers and evaluators can never really know what happens in a respondent’s
mind. Cognitive interviewing sheds light on this process. In this study, I used the think-
aloud technique as my cognitive interview strategy. In this technique, the interviewer
asks the participant to think aloud as they answer survey questions. While this method
places more burden on the interviewee, it offers freedom from interviewer-imposed bias,
requires minimal interviewer training, and provides a more open-ended format (Willis,
1999). In this study, interviewers asked the teens to read the survey questions, answer the
questions, and explain their thought process. Possible probes were available to improve
the overall quality of the ASM surveys, but the probes that were especially important to
this study were those related to questions 13 and 14 in Appendix D. The protocol for the
cognitive interviews is available in Appendix G.
Program experience interviews. The program experience interviews served a few
purposes. First, these interviews provided valuable feedback about the teens’ experiences
in their program, which in turn provided ASM information on how to improve programs.
Second, the interviews provided an opportunity to speak with students whose traditional
pretest and retrospective pretest scores changed drastically, moderately, or not at all. If
differences between the traditional pretest and retrospective pretest in fact represents
response-shift bias, then these students with the greatest differences provide the most
opportunity for learning more about how response-shift bias functions for teens.

89 Interviewing students whose responses did not change or changed only moderately
allowed me to compare and contrast findings.
Students were asked to share information about their program experience,
including what they liked and what they would change. The interview also collected
information on the skills students believe they gained as a result of the program. Finally,
the interviewers asked teens to reflect and provide feedback on completing the traditional
pretest and retrospective pretest questions, including the accuracy of their responses, their
understanding of concepts or terms described in the survey items, and why their scores
might have or might not have changed between the two survey administrations.
The program experience interview protocol is provided in Appendix H.
Procedures. Before the fall 2015 program session began, I identified programs
for participation in the study and received approval from the program specialists for those
programs to participate in the study. Two of the programs I wanted to solicit could not
participate in the program due to other obligations, so I selected two alternatives that
were similar. I then contacted the program instructors to explain the purpose of the
project, the process and time of the project, and the expectations for participating in the
study. Within the first few weeks of the program session, I coordinated with the
instructors of each of the programs to schedule a time where I could attend the program
to introduce myself, discuss the research with the teens, and distribute consent and assent
forms for interviews. I then followed up with instructors each week for the rest of
programs to determine which youth returned the consent and assent forms. I worked with
the instructors to schedule the cognitive interviews for second to last week of programs
(week nine in a 10-week program session). I also asked that programs complete the ASM

90 teen post-program survey during that time, as the final week of programs is typically
hectic for instructors and teens.
The program experience interviews took place the final week of programs. By
having the programs complete the ASM teen post-survey the week before, I was able to
complete the quantitative analysis, which allowed me to identify students for program
experience interviews whose scores changed drastically, moderately, or not at all. This
was an important step in completing the program experience interviews, as my pilot study
indicated that waiting to interview students after the program ended would have been too
difficult to track down teens due to incorrect contact information or lack of engagement
(See Appendix B for more information about the pilot study). Implementation issues for
the fall 2015 program session were minor, though most of the program instructors
required several reminders to collect student consent and assent forms as well as requests
to administer the ASM teen post-program survey during week nine of programs.
All interviewers used the interview guide. The structure for interviews was semi-
structured. With this method, the researcher assumes that “individual respondents define
the world in unique ways” (Merriam, 2009, p. 90). This structure usually has specific
information that is needed from the respondents, but it allows flexibility in question
wording and order. Merriam noted “this format allows the researcher to respond to the
situation at hand, to the merging worldview of the respondent, and to new ideas on the
topic” (p. 90).
My two team members and myself conducted all interviews. Because my team
members had not conducted formal interviews with teens for research purposes before, I
developed a training during the fall program session to acclimate them to the research

91 project, purposes, procedures, and protocol. This training included an overview of the
research project, its purpose and methods, protocols, and process. Team members were
able to ask questions both before and as they conducted interviews. I also listened to their
interview recordings after each interview to provide prompt feedback.
Interviews were digitally recorded, and interviewers took notes during the
interview. Interviewers also completed the Interview Checklist in Appendix I for each
student. After the interviews, interviewers completed the Interview Reflection Tool in
Appendix J as a way to interpret what they observed and heard during conversations with
teens as well as document any issues that arose. I collected the recordings, interview
notes, the Interview Checklist, and the Interview Reflection Tool from each interviewer
as the interviews occurred. Finally, I transcribed all interview recordings and interviewer
reflections and entered them into Nvivo for analysis. All digital recordings were erased
within 90 days of being collected, and all transcriptions were saved on a password-
protected file on a password-protected computer, and backed up on the ASM One Drive
(which also requires a password).
Teens who completed the interview received a $20 check as a token of
appreciation for their time. It is standard practice at ASM to compensate teens for their
participation in focus groups and interviews.
Data analysis. I followed Merriam’s (2009) process for qualitative data analysis.
I started with themes I knew were important based on my literature review. I also
constructed categories using open coding. In open coding, the researcher is open to
emergent findings (Merriam, 2009). The researcher reviews recordings, reflections, notes,
and other materials collected, and then constructs categories based on emergent themes

92 and assigns pieces of data to those themes. Qualitative data analysis is a highly
inductive and iterative process, as categories may combine or separate into multiple
categories. Ultimately, the researcher should reduce themes or categories until he or she
has determined a list that is responsive to the purpose of the research, exhaustive,
mutually exclusive, sensitizing, and conceptually congruent (Merriam, 2009). More
specifically, I took a phenomenological approach to analyzing the qualitative data, which
“attends to ferreting out the essence or basic structure of a phenomenon” (Merriam, 2009,
p. 198-199). In this study, I specifically looked for themes related to the five steps of the
cognitive process and evidence of self-report biases. I also allowed themes to emerge.
Once I completed my first round of qualitative data analysis, I combined and separated
the themes I coded several times until I arrived on my final categories.
My team was not trained in qualitative data analysis, so they were not actively
involved in the analysis process. Additionally, I was the only one at ASM with a license
for Nvivo, which was used to analyze the qualitative data. Finally, I was the only one
trained to use the software. However, my team was provided access to the transcripts
from all interviews, interview reflections, and memos so they could practice qualitative
data analysis. They were also given the opportunity to review results of both my
quantitative data analyses to provide feedback on how my findings relate to their
experiences in the study. As a team, we agreed on the findings and themes that emerged
from the research.
Reliability and validity. Reliability in qualitative research focuses on the
consistency in which data were collected. One way I addressed this was to train both staff
members on conducting interviews. As discussed, the training was largely based on

93 Merriam’s (2009) approach to qualitative research. I also required an interview
checklist to be completed for each interview (Appendix I).
In order to increase the internal validity of the results, I incorporated triangulation.
Merriam (2009) defined this as the “use of multiple methods, multiple sources of data,
multiple investigators, or multiple theories to confirm emerging findings” (p. 215). This
study triangulated findings in a few different ways. First, I triangulated across
investigators. There were three of us from the research and evaluation team conducting
interviews. Second, it triangulated across sources of data. We interviewed 30 youth.
Third, I incorporated both quantitative and qualitative methods to better understand
response-shift bias. Finally, I shared my findings with the team members that assisted in
data collection during a peer review meeting. I also provided them with an audit trail,
including interview transcripts, tables from the quantitative analysis, and node counts
from the qualitative analysis.
Ethics. Parents of students under the age of 18 were required to sign and return
the consent form in Appendix K. Students 18 and older were required to sign and return a
consent form as well (Appendix L). Finally, students under the age of 18 were also
required to sign and complete an assent form (Appendix M). Appendix N includes the
recruitment script I used to explain the research study to students in each program.
Students’ names were kept confidential, and only pseudonyms were used in reports. I
maintained one password-protected file with the names of the interviewees and the
associated pseudonyms for tracking purposes only.

94 Mixed Methods
This study is what Greene (2007) considers an integrated mixed methods study.
Greene describes this as a study “in which the methods intentionally interact with one
another during the course of the study” (p. 125). This section provides a brief overview of
the three ways in which the quantitative and qualitative strands were mixed: data
collection, data analysis, and interpretation.
Data collection. This study mixed at the point of data collection. Creswell and
Plano Clark (2012) described mixing at the data collection phase as connecting the two
strands. Strands are connected by “using the results of the first strand to shape the
collection of data in the second strand by specifying research questions, selecting
participants, and developing data collection protocols or instruments” (p. 67). In my
study, quantitative results informed the sample selection process in part of the qualitative
phase. Students with very different scores from traditional pretest to retrospective pretest,
students with moderately different scores, and students with no difference in their scores
were asked to participate in program experience surveys to shed light and why or why not
response shift bias occurs.
Data analysis. This study also mixed during data analysis, utilizing a strategy that
Teddlie and Tashakkori (2009) call parallel mixed data analysis. In this strategy, the
quantitative and qualitative analyses occur separately, but knowledge from both are
combined into meta-inferences. Teddlie and Tashakkori note, “although the two sets of
analyses are by design independent, in practice the investigators might allow either
knowledge of one to shape their analysis of the other” (p. 266). As Greene (2007) points
out, this is often a highly iterative process. In this study, I allowed the analysis of one

95 type of data to inform my analysis of another type of data, often resulting in several
iterations of analysis.
Interpretation. Mixing also occurred at the stage interpretation. This happens
after quantitative and qualitative data have been collected and analyzed. According to
Creswell and Plano Clark (2012), it “involves the researcher drawing conclusions or
inferences that reflect what was learned from the combination of results from the two
strands of the study” (p. 67).” Findings from both strands were used to make
interpretations and draw conclusions about the results of my study based on the research
questions.
Validity. My study drew upon Creswell and Plano Clark’s (2012)
recommendations for protecting against validity threats in a mixed methods study. First, I
used a large sample size for my quantitative strand and a small sample size for my
qualitative strand. Second, I used both strands to answer my mixed methods research
questions. Additionally, the researchers on my team took time to evaluate the overall
project objectives and discuss our philosophical and methodological differences.
As previously mentioned, one of the purposes for using mixed methods is
triangulation. What is especially important in mixed methods research focused on
triangulation is that it occurs across methods. In the case of my study, I triangulated
across quantitative and qualitative methods, including surveys and two types of
interviews. Greene (2007) noted that “when two or more methods that have offsetting
biases are used to assess a given phenomenon, and the results of these methods converge
or corroborate one another, then the validity or credibility of inquiry finding is enhanced”
(p. 43). This approach enabled me to enhance the validity of my findings.

96 Summary
This chapter provided an overview of a mixed methods design to better
understand response-shift bias and how it functions for urban teens in an after-school
program. I provided a definition of mixed methods research and my rationale for
employing this design to address my research program.
This study included quantitative and qualitative strands. The quantitative strand
included two survey administrations: the traditional pretest and the retrospective
pretest/posttest. The qualitative strand comprised two types of interviews: cognitive
interviews and interviews focused on program experience. The next chapter presents the
results of this mixed methods study.

97
CHAPTER FOUR
RESULTS
Introduction
The purpose of my study was to use mixed methods to determine whether
response-shift bias exists for teens in an urban after-school program, explore why
differences between responses on the traditional pretest and retrospective pretest might
occur, and better understand the cognitive process that teens use to complete
retrospective pretest questions. The results are organized by research question, with each
question drawing evidence across both the quantitative and qualitative strands when
relevant. Figure 2 provides an overview of the research questions and the results provided
by the quantitative and qualitative data.

98
Table 7. Overview of Research Results
Research Question Quantitative Results Qualitative Results 1. Presence of response shift bias.
Response-shift bias was evident for individual items, but not as a scale. Items with the largest shifts included working well with others on team/group projects and being open to receiving feedback about work. Acquiescence may have played a role in minimizing response-shift bias.
Response-shift bias was present for a majority of teens. Acquiescence emerged as a prominent response bias.
2. Why response-shift bias occurs.
Factors related to larger changes between traditional pretest and retrospective pretest generally included interpersonal skills related to student-student and student-instructor interactions, such as meeting new teens, working well with teens in the program, and teens in the program treating each other with respect. Open-ended survey results supported this finding.
The most common types of response-shift bias were recalibration and reconceptualization. Response-shift bias was reported for each skill in the survey, but especially for the items related to leading and working with teams or groups on projects. Program quality factors related to a supportive environment and youth engagement elicited larger shifts from traditional pretest to retrospective pretest.
3. Cognitive process for retrospective pretest questions.
Students were able to cognitively process retrospective pretest questions.
Students were able to cognitively process retrospective pretest questions, but made suggestions to make the questions easier to understand and recall.

99
As Table 7 indicates, both the quantitative and qualitative data provided
evidence that response-shift existed, though I could not detect it for the skills as a scale.
Acquiescence bias seemed to present itself, potentially masking evidence of response-
shift bias, but I could not determine its existence with certainty. Changes from traditional
pretest to retrospective pretest were largely explained by students’ self-reported gains in
interpersonal skills for both student-student and instructor-student interactions.
Differences in program quality may have facilitated higher levels of learning that led to
larger response-shift bias, particularly indicators of program quality related to support
environment and youth engagement. Finally, students were able to execute each step in
the cognitive process typical to survey respondents, but they shared recommendations to
help improve comprehension and recall for the retrospective question going forward. The
following sections provide detailed results for each research question.
The Presence of Response-shift Bias
My first question sought to determine whether response-shift bias was present
when comparing scores from traditional pretest and retrospective pretest surveys for
urban high school youth in an after-school program. In order to address this question, I
examined descriptive statistics by item and across items for each test type (traditional
pretest, retrospective pretest, and posttest), including ratings and change scores. Then, I
conducted a two-tailed dependent sample t-test to determine whether the average rating
scores across items in the traditional pretest and retrospective pretest scores were
statistically different. Finally, I calculated effect sizes to determine the magnitude of the
differences.
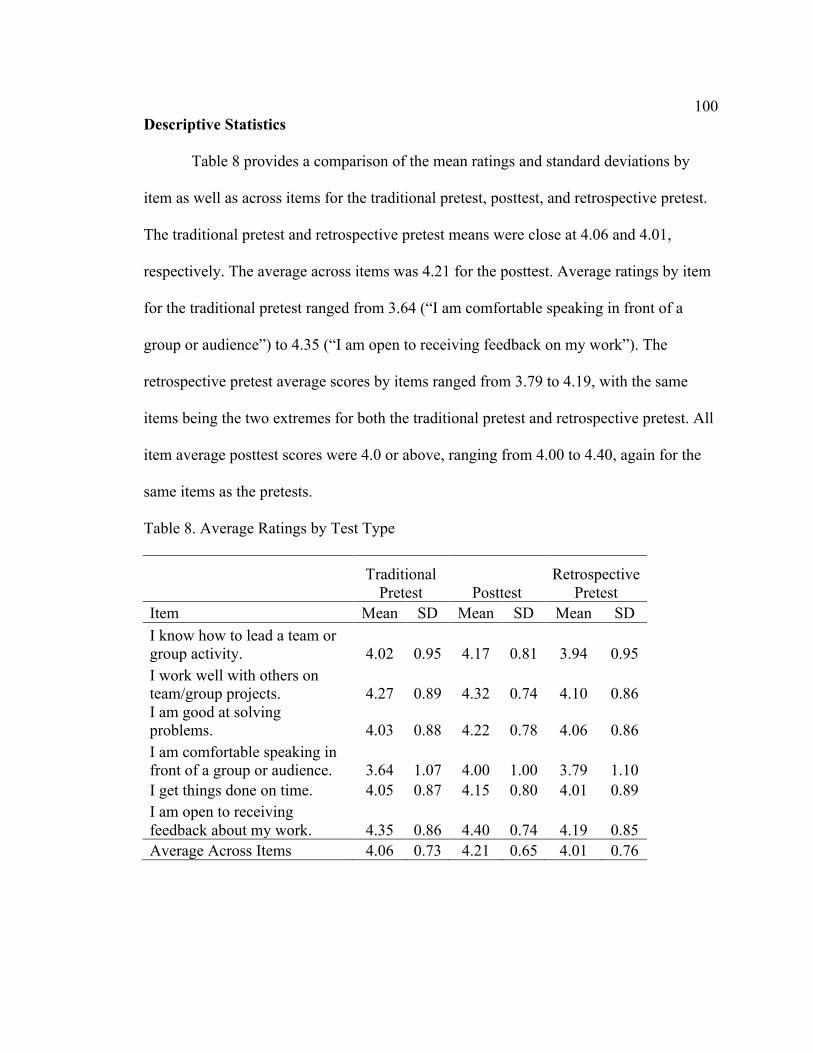
100
Descriptive Statistics
Table 8 provides a comparison of the mean ratings and standard deviations by
item as well as across items for the traditional pretest, posttest, and retrospective pretest.
The traditional pretest and retrospective pretest means were close at 4.06 and 4.01,
respectively. The average across items was 4.21 for the posttest. Average ratings by item
for the traditional pretest ranged from 3.64 (“I am comfortable speaking in front of a
group or audience”) to 4.35 (“I am open to receiving feedback on my work”). The
retrospective pretest average scores by items ranged from 3.79 to 4.19, with the same
items being the two extremes for both the traditional pretest and retrospective pretest. All
item average posttest scores were 4.0 or above, ranging from 4.00 to 4.40, again for the
same items as the pretests.
Table 8. Average Ratings by Test Type
Traditional
Pretest Posttest Retrospective
Pretest Item Mean SD Mean SD Mean SD I know how to lead a team or group activity. 4.02 0.95 4.17 0.81 3.94 0.95 I work well with others on team/group projects. 4.27 0.89 4.32 0.74 4.10 0.86 I am good at solving problems. 4.03 0.88 4.22 0.78 4.06 0.86 I am comfortable speaking in front of a group or audience. 3.64 1.07 4.00 1.00 3.79 1.10 I get things done on time. 4.05 0.87 4.15 0.80 4.01 0.89 I am open to receiving feedback about my work. 4.35 0.86 4.40 0.74 4.19 0.85 Average Across Items 4.06 0.73 4.21 0.65 4.01 0.76

101
I also examined average change by item and across items from the traditional
pretest to retrospective pretest, retrospective pretest to posttest, and traditional pretest to
posttest. The average change score across items from traditional pretest to retrospective
pretest was 0.04. Changes by items were also small between the pretests, with the largest
changes in “I work well with others on team/group projects” (0.17) and “I am
comfortable speaking in front of a group or audience” (-0.15). The smallest change was
“I get things done on time” (0.04). The average change from retrospective pretest to
posttest was higher at 0.20. The items with the largest change were “I know how to lead a
team or group activity” (0.77) and “I work well with others on team/group projects”
(0.74), while the items with the smallest change were “I am good at solving problems”
and “I get things done on time” (both 0.69). The average change across items from the
traditional pretest to posttest was 0.15, lower than the average change from retrospective
pretest to posttest. The item that exhibited the largest change was “I am comfortable
speaking in front of a group or audience” (0.37) and the smallest change was for the item
“I work well with others on a team or group project (0.05). Table 9 provides more
information.

102
Table 9. Average Change Scores by Test Type
Traditional Pretest to
Retrospective Pretest
Retrospective Pretest to Posttest
Traditional Pretest to Posttest
Item Mean SD Mean SD Mean SD I know how to lead a team or group activity. 0.08 1.19 0.23 0.77 0.15 1.09 I work well with others on team/group projects. 0.17 1.17 0.22 0.74 0.05 1.07 I am good at solving problems. -0.03 1.12 0.16 0.69 0.19 1.04 I am comfortable speaking in front of a group or audience. -0.15 1.32 0.21 0.86 0.37 1.20 I get things done on time. 0.04 1.15 0.14 0.69 0.10 1.06 I am open to receiving feedback about my work. 0.16 1.14 0.21 0.72 0.06 1.03 Average Across Items 0.04 0.96 0.20 0.55 0.15 0.85
T-test Results and Effect Sizes
I used a two-tailed dependent samples t-test to compare the average ratings across
items in the traditional pretest and the retrospective pretest. There was a significant
difference between the traditional pretest (M=4.06, SD=0.73) and the retrospective pretest
(M=4.01, SD=0.76); t=3.031(4310), p=.002. These results suggest that teens’ ratings of
themselves at the beginning are significantly higher than when they rate their beginning
skill level at the end of the program. I calculated the effect size using Cohen’s d to
determine the mean difference between the ratings at traditional pretest and retrospective
pretest. The effect size was 0.06. I used Cohen’s conventions to interpret effect sizes,
where a small effect is 0.20, a moderate effect is 0.50, and a large effect is 0.80 (Howell,
2010). These results indicate that while response-shift bias occurred from traditional

103
pretest to retrospective pretest, the substantive difference between the two test
administrations was negligible.
I then examined differences at the item level. All of the items were significantly
different from traditional pretest to retrospective pretest, with the exception of the item “I
am good at solving problems.” However, the effect sizes were trivial for all items but “I
work well with others on team/group projects,” “I am comfortable speaking in front of a
group or audience,” and “I am open to receiving feedback about my work.” More detail
about the results is provided in Table 10.
Table 10. T-test Results and Effect Sizes
Item t Sig. Cohen's
d I know how to lead a team or group activity. 4.51 <.001 0.08 I work well with others on team/group projects. 9.54 <.001 0.19 I am good at solving problems. -1.46 .14 -0.03 I am comfortable speaking in front of a group or audience. -7.64 <.001 -0.14 I get things done on time. 2.09 .04 0.05 I am open to receiving feedback about my work. 8.97 <.001 0.19 Average Across Items 3.03 <.001 0.06
As Table 10 indicates, there were small effects for these items, with teens increasing their
retrospective pretest ratings on working well with others and receiving feedback about
their work, and decreasing their ratings of themselves for how comfortable they are
speaking with an audience. Finally, this analysis was adequately powered at 0.97.

104
Comparing the Results to the Literature
While my results indicate that response-shift bias exists for three of the items, the
items as a whole did not provide evidence for response-shift bias. These results differ
from literature on retrospective pretests (Howard, Ralph, Gulanick, Maxwell, Nance, &
Gerber; 1979; Cantrell, 2003; Hill & Betz, 2005; Pelfrey & Pelfrey, 2009; Moore &
Tananis, 2009; Nimon, Zigarmi, & Allen, 2011) as well my results from the summer
2015 pilot. During the summer 2015 program session, I selected five programs to pilot
my study using both quantitative and qualitative methods. My final sample for the
quantitative analysis during the pilot included 77 teens. There was a significant difference
between the traditional pretest (M=3.97, SD=0.44) and the retrospective pretest (M=3.82,
SD=0.61); t=2.29(76), p=.03. The effect size for the pilot was 0.28, which is considered a
small effect size by Cohen’s standards (Howell, 2010). The analysis was sufficiently
powered at 0.80. These results indicate there was a small effect for response-shift bias
across all items. The administration of posttest survey, which included the posttest and
retrospective pretest questions of interest, differed in the pilot and in the full
implementation. For example, students who participated in the pilot completed the
posttest and retrospective pretest questions separately from the rest of the ASM teen post-
program survey. This was largely due to a miscommunication with instructors, but it
means that students had a much shorter survey to complete in the summer compared to
the fall. Second, I used paper surveys in the summer to lessen the burden on programs to
entice them to participate in the pilot, but in the fall, we used our standard method of
online survey administration.

105
Student interviews in both the summer 2015 pilot and the fall 2015 full
implementation provided evidence of acquiescence, which occurs when survey
respondents select responses regardless of the content of the question. Acquiescence is a
form of satisficing, and it is more common when the question is difficult or ambiguous,
respondents are encouraged to guess, or after respondents have become fatigued. Eight of
the 12 teens interviewed in the pilot, and 20 of the 30 teens in the full study complained
that the survey was too long, and some students admitted they did not always take the
time to respond thoughtfully. One student shared, “The survey gets long and boring so
we’ll just go straight to this and answer it,” indicating that he did not read question stems
after a certain point in the survey.
I wanted to investigate whether acquiescence was present and perhaps masking
any response-shift bias. Selecting the same response for every item could potentially
indicate “yea-saying” or “nay-saying.” I removed students who selected the same
response for all six items for the posttest question and all six items for the retrospective
pretest (e.g. students who responded “strongly agree” to all 12 items covered in the two
questions). I determined that 28.1% of respondents selected the same answer for all 12
items across the two questions. I then conducted an independent sample t-test to
determine if the group that potentially acquiesced was different from the rest of the
sample. There was a significant difference in average change between pretests between
the “acquiescence” group (M=-0.25, SD=0.99) and the “non-acquiescence” group
(M=0.17, SD=91); t=-12.91(2250), p<.001. The effect size for this analysis was 0.44,
which is considered a small to moderate effect size (Howell, 2010).

106
Based on the finding that the two groups were indeed different, I re-ran the
two-way dependent sample t-test for the “non-acquiescence” group to detect the presence
of response-shift bias. The results were more congruent with literature on response-shift
bias as well as my pilot results. There was a significant difference between the traditional
pretest (M=4.16, SD=0.82) and the retrospective pretest (M=4.44, SD=0.73); t=-
9.79(1212), p<.001. The effect size was 0.36, which is considered a small effect size
(Howell, 2010). These results indicate that response-shift bias does in fact exist for the
skills questions as a whole. But the results of this analysis of the data should be
interpreted with caution. First, my study did not explicitly examine or attempt to detect
acquiescence. Second, there is no way to determine without additional data collection
whether students truly were acquiescing in their responses, or they simply did not feel
they changed at all. I identified five students in my qualitative sample that responded the
same way to all 12 items across the two questions. Three of these students provided
evidence of potential acquiescence, but the other two truly felt they were already strong
in those skills, so they had not changed. More information about findings related to
acquiescence is provided under my third research question, and more detail about the
pilot is available in Appendix M.
Why Response-shift Bias Occurs
The second research question in this study asked: if traditional pretest and
retrospective pretest scores are different, why do these differences exist according to the
perspective of the survey respondents? Though my results indicated response-shift bias
was not an issue for the items as a scale, I found evidence of response-shift bias collected

107
through cognitive and program experience interviews. This section provides evidence
of response-shift bias and provides a better understanding of why it occurred and for
whom.
Evidence of Response-shift Bias
Response-shift bias occurs when survey respondents overestimate or
underestimate themselves at pretest because they do not have an adequate understanding
of the construct on which they are evaluating themselves – the knowledge, skills, and
attitudes that the program intends to affect (Lam & Bengo, 2003). According to
Sprangers and Schwarz (1999), there are three types of response-shift bias. The first is
recalibration, where the respondents’ internal standards of measurement change. The
second is reconceptualization, which is when participants redefine the target construct.
The last type is reprioritization, where the respondents reevaluate the importance of the
construct and change their values. Nearly two-thirds (63.3%) of the teens that participated
in cognitive and program interviews provided some evidence that response-shift bias had
taken place for them.
Recalibration. This type of response-shift bias is related to the respondent’s
internal scale of measurement. In recalibration, the respondent’s frame of reference
changes, making traditional pretest scores less accurate. This type of response-shift bias
was common among students interviewed.
Students were asked which set of responses they felt were more accurate – their
traditional pretest or retrospective pretest responses. They commonly reported trouble
with answering their traditional pretest questions. For some students, their traditional

108
pretest scores were inaccurate because the way they evaluate the skills in question
changed after completing their After School Matters program. One student reflected:
I would kind of be iffy about answering the [traditional pretest] questions in general because I wouldn’t know what my skill level was until I tried things and realized I’m not so good at this. They would just be lower in general because I’d think, ‘oh, I’ve never done this before so I’m really bad,’ but I wouldn’t know if it was actually just average…Now, like I’d be able to explain why I was worse, but if you asked me at the beginning, I don’t know why I’m bad at it. (Nicole)
Nicole felt she was better at the skills than she initially thought because she had not
actually tried them before. She was concerned that her traditional pretest scores would be
lower than what they actually should be because she did not know enough at the time to
accurately rate herself. Another student echoed the sentiment that her internal frame of
reference changed from traditional pretest to retrospective pretest:
I think this one [retrospective pretest] was more accurate because then you realize how much you improved at the time. ‘Cause in the first one [traditional pretest] you already know like, ‘oh, I think I’m so good at this, I’m so good at that,’ but then after you see yourself improve, you’re like, you think, ‘I wasn’t that good as how I am now.’ (Maria)
For Maria, she felt she overrated herself in the traditional pretest because she did
not understand the degree to which she could improve. This changed her internal scale of
measurement from traditional pretest to retrospective pretest. Other teens worried about
how they originally assessed themselves, including one student who reported, “If it were
at the moment I’d be like, ‘No, I’m not a shy person’ but at the moment I really was”
(Lisa).
Other students shared the perspective that they did not feel they knew enough
about themselves to accurately rate themselves on the skills in the traditional pretest. One
student said, “I think this one [retrospective pretest] is more accurate because you’re

109
taking a reflection over the two months compared to when you’re just starting out.
You don’t really know as much about yourself ‘cause you haven’t tested yourself”
(Yamika). This student’s response echoes that of other students who felt they needed to
try using the skills before they could accurately rate themselves. Similarly, another
student reported her traditional pretest scores were inaccurate “because I really didn’t
know how to think of myself before this and what I could do.” (Jazmine)
A few students specifically reported that the context of the program and the
experiences it provided gave them the ability to rate their beginning skill level more
accurately because they were too unsure of themselves at the time. One student shared “I
think it’s better to wait because at the beginning really you don’t really understand how
much you can actually change during the program” (Imani). This same student reported
her retrospective pretest scores were more accurate “since I joined this program, I
understand myself more” (Imani). One student elaborated:
Interviewer: Which responses were more accurate, the ratings at the beginning or the end of the program? Student: Yeah, that one [the end]. Interviewer: Why? Student: Well, if it’s before the program, it’s like, you’re not really sure of yourself. I think it’s easier, better for us to do it at the end because we learn stuff that…if we do it just as soon as we get in, we don’t really know…we don’t know each other, you don’t know your instructor, you don’t know the people sitting next to you, so…it’s better to do it at the end. (Kayla) Reconceptualization. In the second type of response-shift bias, respondents’
understanding of the constructs in question change as a result of the program. The actual
definitions or meanings of the words or concepts on which the respondents rate

110
themselves changes over time, making their responses at traditional pretest and
posttest incongruent.
Students were asked in the program interviews whether they understood the skills
on which they rated themselves at the beginning and end of the programming and
whether their understanding of those skills changed. Several students reported such a
change, especially for the skills related to leading or working in groups or teams on a
project. One student shared that she thought she understood the skills in question, but the
meaning of those skills changed after she completed her program:
When I first took it, I thought I did [understand], but when we say work well with teams in group projects…it was like, I thought about math and like huddling together in a circle discussing, I don’t know why. But when you get into After School Matters, it’s not really that…you walk around and discuss different artists and techniques and give each other feedback. (Maria)
Maria associated group projects with math problems at school, and she had difficulty
translating what that might look like in an arts-based after-school program. After she
completed the program, her definition of working with groups or teams broadened as a
result of his program experience. Her understanding of the other skills changed as well.
One example was problem solving, which several students reported they interpreted
specifically as math problems in the traditional pretest. Maria did not know how to
interpret the skill in the traditional pretest. She shared, “Something that could be worded
differently is like I’m good at solving problems because the first thing that popped up
was like math and English, stuff like that. What do you mean by solving problems? Life
problems? Math problems? Problems with other people in the class?” (Maria).
Another student similarly mentioned that her definitions of the skills were limited
to the context of school, and this changed after she completed the program.

111
Interviewer: Did any of these words change meaning for you? Student: Definitely, yeah. So for the first one, I know how to lead a group or team activity. I didn’t really realize what group work was until I actually got to join in with a few students from the program and talk about how we were going to do these pieces, what we could do better, what we could do at our outstanding level. Group projects…If I were to be in regular school, I probably would have said neutral because I had no idea what that actually like meant. We just got pieces, you work on this, you work on that, here it’s like we’re all working on this together and we all have each other’s backs. (Jazmine)
One student shared that his role changed during the course of the program. He entered the
program as an equal to the other students, but took on the additional role of serving as the
instructor’s assistant. This role changed the way he understood the skills. When asked if
his understanding of any of the skills changed, he responded, “Working well with others
on a team/group…just being in a person of somewhat of authority and having to like still
be relatable to other people…just having to keep in mind the position I’m in”
(Alexander). For this teen, working well with people in groups no longer equated to just
being collaborative. His role meant he had to balance the skills of leadership with the
being a good teammate in order to keep the project moving smoothly.
A few students reported deeper understanding or redefined constructs on a few
skills. One student shared:
Interviewer: How accurate were your ratings on the pretest you took at the beginning of the program? Student: I’m good at solving problems…I don’t think that was accurate. I was not good at solving problems. I rated it as neutral…but I disagree. Interviewer: Has your understanding of any of those words changed now that you’ve taken the program? Student: Yes. Interviewer: How so?

112
Student: Because…I get things done on time. Like, I thought that meant just like, turning things in like a day late or something…like, I thought that was on-time. But now I get that it’s like you do it earlier or you do it on the day. (Brittany)
Like other students interviewed, Brittany gained clarity on what skills such as solving
problems and meeting deadlines meant after she participated in the program.
Reprioritization. In the final type of response-shift bias, respondents reevaluate
the importance of the construct, resulting in different traditional pretest and retrospective
pretest scores. Instead of the standard of comparison changing, as is the case with
recalibration, the respondents’ selected experiences change. I did not see evidence of
reprioritization in the interviews. There are a couple reasons for this. First, students
seemed to place importance on the skills throughout each of the tests, perhaps because
these are skills teens have heard before in school or through other after-school activities.
Second, my protocols did not specifically aim to discern types of response-shift bias.
Though recalibration and reconceptualization became evident through the interviews,
reprioritization did not.
Exploring Divergence in the Data
The purposes for mixing methods in this study were triangulation and
complementarity. Both of these purposes seek converge between quantitative and
qualitative strands in the study (Greene, 2007). The quantitative analysis from my first
research question indicated that response-shift bias was present for three items, but
minimal for the other three items and for the scale as a whole. Yet qualitative data
collected through cognitive and program interviews indicated that response-shift bias was
in fact present and much more widespread. Greene (2007) acknowledges initiation as

113
another purpose of mixing methods. Studies that mix methods for this purpose are
looking for “paradox, contradiction, divergence – all in the service of fresh insights,
perspectives, original understandings” (p. 103). She calls this divergence “a puzzle that
warrants further investigative analysis, which in turn can lead to important insights and
new learnings” and points out that such a puzzle can arise in a mixed methods study with
different prescribed purposes for mixing (p. 103). Most importantly, Greene asserts that
such dissonance should not be interpreted as a failure in a mixed methods study because
it is consistent with a mixed methods way of thinking. In order to explore and explain
some of the dissonance between the quantitative and qualitative data, I carried out
additional analyses to determine whether response-shift bias exists and for whom.
Factors related to change. First, I ran a linear regression model to determine
which factors were correlated were larger changes from traditional pretest to
retrospective pretest. I included student demographics, student attendance, program
content area, program quality measures, and responses to other items on the ASM post-
program teen survey. Student characteristics included race (Black/African-American and
Hispanic; reference group was all other races), gender (female; reference group was
males and those who chose not to identify), and grade (lower classmen, grades 9 and 10;
reference group was grades 11 and 12). Student participation characteristics included
program hours attended for the current program and number of programs in which the
student previously participated. Program characteristics included program model
(internship, pre-apprenticeship, and advanced apprenticeship; reference group was
apprenticeship), and content area (science, sports, technology, and communication;
reference group was arts). Program quality measures included the four domains of the

114
Youth Program Quality Assessment tool developed by David Weikart Center for
Youth Program Quality. The domains are safe environment, supportive environment,
peer interaction, and youth engagement. Finally, I included teen survey responses
covering several constructs, such as program experience, future orientation, instructor
preparation, instructor support, teen interaction, safety, and program satisfaction.
The results of the regression indicated that these predictors explained 10.4% of
the variance (R2=0.10, F(46,3100)=8.92, p<.001). Table 11 shows the statistically
significant variables in the model, and Appendix O provides the full results of the
regression analysis. The linear regression provided evidence that interpersonal
relationships between teens and their peers as well as their instructors predicted larger
changes from traditional pretest to retrospective pretest. Predictors included teen survey
items related to helping others in the community, interacting with new teens, providing
input for program activities, respect among students, the students in the program working
well together, and student’s willingness to recommend ASM to a friend. Students who
rated these items positively on the ASM post-survey tended to rate themselves lower on
skills in the retrospective pretest compared to their traditional posttest ratings, indicating
that perhaps these interpersonal relationships altered students’ views of themselves. The
only significant predictor related to the program was the advanced apprenticeship model.
Advanced apprenticeships provide opportunities for teens that are skilled in a content
area to refine their skills. These programs require more hours and are often highly visible
through the products or performances they provide.

115
Table 11. Significant Predictors from the Linear Regression Model
Variable Unstandardized
Beta Std.
Error Standardized
Beta t p-value I had the opportunity to help others in the community through my program. -0.07 0.02 -0.07 -3.03 <.001 I got the opportunity to interact with teens I probably would not have met otherwise. 0.09 0.03 0.08 3.48 <.001 My instructor let me have input into what we do in the program. -0.09 0.03 -0.08 -2.76 .01 Students in my program treat each other with respect. -0.09 0.03 -0.08 -2.92 <.001 Students in my program work well together. -0.07 0.03 -0.07 -2.24 .03 I would recommend After School Matters to a friend. -0.09 0.04 -0.07 -2.28 .02 Advanced Apprenticeship 0.13 0.05 0.04 2.43 .02
Qualitative responses from the survey supported this finding. Nearly a quarter of
students (24.2%) that responded to the open-ended question on the post-survey about
additional skills they learned in the program reported gaining interpersonal skills. Teens
reported improved skills in compromising as part of a team, working through
disagreements, understanding others’ perspectives, developing friendships and interacting
with new students, helping others, and general communication skills. Teens also
mentioned general improvements related to trust, respect, and patience. Below are quotes
from student surveys about interpersonal skills they gained:

116
• I learned how to talk to people like I would want to be talked to. • I learned to compromise and have things done other people's way as well as mine.
I learned to calm myself after receiving a feedback that I might not think is right. I learned to be helpful to others who needed it.
• I learned how to be patient with others since we all learn differently. • I learned how to communicate better with my teachers and maintain a good and
healthy relationship with them. • How to talk to others properly and to take directions from people in authority no
matter if they are my age or younger than me. • I learned how to communicate and be more open and have trust with the people
that I work with. These examples of interpersonal skills were the most common in the open-ended survey
responses.
Subgroup analysis. Though there were some descriptive differences between the
quantitative and qualitative sample, further examination of both datasets based on several
indicators showed no evidence of significant or substantive differences. In the
quantitative data, I examined differences in change scores overall as well as by item for
gender, race/ethnicity, grade level, previous participation, or change level. While some
individual items were statistically significant, effect sizes were less than 0.005. I also re-
analyzed the qualitative data based on student and program characteristics. Two findings
emerged: more males than females asked questions about the answer options, and only
returning participants asked for clarification on what the retrospective pretest question
meant by the word “beginning.” However, these findings did not shed much light on
which students or programs might exhibit more response-shift bias.
I also compared the student characteristics in the quantitative and qualitative
sample to investigate potential differences that could further explain the dissonance in the
quantitative and qualitative data. There were some descriptive differences between the

117
samples. First, the qualitative sample included a higher proportion of girls compared
to the quantitative sample (75.0% compared to 62.4%). Second, the proportion of
students from each grade level varied between the quantitative and qualitative samples.
The qualitative sample contained a much higher percentage of 9th graders and 11th
graders, and a much lower percentage of 10th graders. The percentage of seniors was
fairly close. Third, the qualitative sample included a smaller proportion of
Hispanic/Latino teens than the quantitative sample (25.0% compared to 34.7%). Fourth,
the percentage of teens that were new to ASM was much smaller in the qualitative
sample (26.7% compared to 44.5% in the quantitative sample). Finally, the qualitative
sample has more people with moderate (0.8 to 1.0) or high (0.3 to 0.79) change than the
quantitative sample (78.3% compared to 71.7%). Again, examination of the quantitative
and qualitative data based on student characteristics revealed no important differences.

118
Table 12. Comparison of Quantitative and Qualitative Sample Teen Characteristics
Characteristic Quantitative (n=4,311)
Qualitative (n=30)
Gender Choose Not To Identify 0.8% 0.0%
Female 62.4% 75.0% Male 36.8% 25.0% Race/Ethnicity
American Indian/Alaskan Native 0.5% 0.0% Asian 3.3% 6.3% Black/African American 54.6% 56.3% Hispanic 34.7% 25.0% Native Hawaiian/Other Pacific Islander 0.1% 0.1% Two or More Races 4.1% 4.1% White 2.7% 12.5% Not Reported 0.0% 0.0% Grade
8th 0.2% 0.0% 9th 19.2% 31.3% 10th 32.5% 6.3% 11th 26.9% 37.5% 12th 21.3% 25.0% College Freshman 0.0% 0.0% Previous Participation
New 44.5% 26.7% Returning 55.5% 73.3% Change Level
Low 29.0% 21.7% Moderate 35.7% 47.8% High 35.4% 30.4%
Next, I compared program characteristics. Program region was not examined
because its chief importance was as a sampling criterion, not an attribute that I assumed
would play importance in whether response-shift bias occurred. One program per region
was chosen to draw my qualitative sample, with the exception of the south region, where
I selected two programs since that region is the largest. Each program represented a

119
different content area, which is a much more meaningful characteristic to investigate
because it relates to the program curriculum. The qualitative sample included a smaller
percentage of arts students (23.3% compared to 46.8%) and a larger percentage of
communications students (26.7% compared to 3.9%). Because only one of each program
content area was included in the qualitative sample, it is difficult to determine how
content area may have affected response-shift bias. Students from each program type
reported some form of response-shift bias during interviews, with the exception of
students from the sports program. Two of the four students interviewed from the sports
program said the skills in the retrospective pretest and posttest questions did not apply to
their program.
Finally, I examined the quality of the programs from which I drew my qualitative
sample compared to programs overall based on the four domains of the Youth Program
Quality Assessment tool developed by David Weikart Center for Youth Program Quality.
The domains are safe environment, supportive environment, peer interaction, and youth
engagement. There was a significant difference between the programs in the quantitative
sample and the qualitative sample for two of the four domains: supportive environment
and youth engagement. Supportive environment in the qualitative sample programs
(M=4.70, SD=0.21) was significantly higher than that of the quantitative sample
(M=3.84, SD=0.10); t=11.58 (79), p<.001). The effect size was moderate at 0.73
(Howell, 2010). Supportive environment on the Youth Program Quality Assessment
includes warm welcome, session flow, active engagement, skill building, encouragement,
and reframing conflict. For the youth engagement domain, again, the qualitative sample
(M=4.17, SD=0.35) was significantly higher than that of the quantitative sample

120
(M=3.36, SD=1.10); t=15.50 (65), p<.001). The effect size for was 0.99, which is
considered a large effect size (Howell, 2010). The youth engagement domain on the
Youth Program Quality Assessment tool measures planning, choice, and reflection. These
results indicate that perhaps the programs chosen as part of the qualitative sample were of
higher quality, which could have affected the degree to which response-shift bias
occurred. They also indicate that higher quality programs may facilitate learning related
to the 21st skills in question, which in turn may affect response-shift bias. Many of the
skills students spoke to in their open-ended comments align with these two domains,
including warm and respectful interactions with instructors and resolution of
disagreements or conflicts between teens. Results from the linear regression model also
reflected elements of these two domains from the Youth Program Quality Assessment
tool, such as students reporting being invited to provide input about program activities.
The Cognitive Process of Teens Responding to Retrospective Pretest Questions
The third and final research question sought to understand the cognitive process
youth use when completing the retrospective pretest/posttest and to determine which self-
report response biases were present.
Cognitive Process
According to Krosnick (1990), survey respondents must 1) understand the
question, 2) recall relevant behavior, 3) make inferences and estimates, 4) select a
response, and 5) edit a response.
Understanding the question. The first step in the cognitive process for a survey
respondent is understanding the question. In order to determine whether students
understood the retrospective pretest and posttest questions, I first examined response rates

121
by test administration, with specific focus on the posttest and retrospective pretest
questions, which were administered at the same time. If students were confused by the
retrospective pretest question, I would expect a large drop in the response rates from the
posttest to the retrospective pretest. However, the response rate for the posttest questions
was 77.7%, and it was 77.1% for the retrospective pretest questions. This indicates that
only a small number of students completed the posttest question but skipped the
retrospective pretest questions altogether.
Second, I examined response rates for each item by test administration to
determine if perhaps certain skills were confusing to teens. Table 13 provides the
response rates for each item and test administration. As the table demonstrates, response
rates were at least 99% for each item, indicating that students generally understood each
item in each test administration enough to answer them on the survey.

122
Table 13. Response Rates by Item and Test Administration
Item Traditional
Pretest Posttest Retrospective
Pretest I know how to lead a team or group activity. 100.0% 99.5% 99.9% I work well with others on team/group projects. 100.0% 99.5% 99.7% I am good at solving problems. 100.0% 99.5% 99.3% I am comfortable speaking in front of a group or audience. 100.0% 99.8% 99.5% I get things done on time. 99.9% 99.6% 99.3% I am open to receiving feedback about my work. 100.0% 99.5% 99.3%
Finally, I examined the percentage of students who completed the survey question
at each survey administration to determine the percent of students that completed all six
items. A majority of the students answered all six items for the traditional pretest,
posttest, and retrospective, at 99.9%, 98.1%, and 97.5%, respectively. Together, these
data points indicated that students generally understood the items and questions at each
test administration.
Cognitive and program interviews revealed similar results, but shed light on the
cognitive process students used to complete the posttest and retrospective pretest.
Students generally understood the retrospective pretest question, but noted that it took

123
them longer to complete because it followed the posttest question rather than
preceding it. Students recommended switching the order of the questions to make them
less confusing. Additionally, some students asked clarifying questions because they were
not sure whether the question was referring to the first ASM program they ever
participated in or their current program.
Researchers recommended that the posttest question appear before the
retrospective pretest question to reduce the potential of effort justification bias and
implicit theory of change (Howard, 1980; Sprangers & Hoogstraten, 1989; Taylor, Russ-
Eft, &Taylor, 2009). However, nearly all students (93.3%) interviewed reported the order
of the posttest question and retrospective pretest question was confusing for them or
could be confusing for other students, and that the confusion could be remedied by
switching the questions so that the retrospective pretest question appears before the
posttest question. Some students indicated they were confused as they answered the
questions in cognitive interviews.
Student: [Reads question]. What? How much do you agree? But like, compared to before? Interviewer: [Explains question]. Now that you know what we’re trying to do, how do we make it less confusing? Student: I think this one [retrospective pretest question] should be 13 and this one [posttest question] should be 14 because that one would tell you what you’re comparing with. Now I kind of get it. (Emily)
Several students shared that while they understood the retrospective pretest and posttest
questions, the questions would be easier to process if they appeared in chronological
order because it would be easier to follow.

124
I honestly think the first one should go before the today one because when I was doing it, I was looking at today and thinking in the now and then I was thinking maybe I didn’t feel that way long ago. So if you bring up the throwback first, then you’ll have them thinking of this and they won’t get confused. I think the older one should go first and then the current one. (Yamika)
Students cited several reasons for wanting the two questions switched. Some reported
that it would make the question easier for them to understand.
Interviewer: Was it easy to understand and follow these questions? Or were they confusing? Student: Yeah, you should do the think back to when you first entered the program and how has that changed you today be first. (Jade)
Other students simply preferred to see the questions in chronological order.
Interviewer: How can we make this question less confusing? Student: Chronological order. I think you should put this question [retrospective pretest] before the other question [posttest question]. (Nicole)
Similarly, a student shared, “I wondered about that. I was considering maybe you should
probably change that and make it chronological.” (Lisa)
While many students did in fact understand the question, some teens worried that
other students might not. One student shared this concern, noting, “I personally would put
this one first, like how did you feel on the first day, and how do you feel now. I would
bold the ‘how do you feel now.’ They [other students] may ask why is this twice”
(Tomasz). Another student recommended, “I think it would be better if you flipped it
because like once you see this you’ll probably just put the same exact thing you put up
here…so if you put this first, they’ll [other students] probably like think back on it”
(Monique). Below is an example of another student who recommended switching the
order of the questions so teens were less confused:

125
Interviewer: Were both of these questions clear to you? Student: They were clear to me, but I’m not sure whether it was clear for other people. Interviewer: How could we make these questions less confusing? Student: It should be flipped, you should ask before and then now…You could ask us to think about before and then now. After we think back on ourself [sic] we can realize how much we’ve actually changed so I think it would be easier for people to think back and then realize what differences they have. (Imani)
Four students recommended changing the tense of the retrospective pretest
question to make it more clear to students that the two questions are unique and asking
about different time periods. Also, some students noted that the question stems were too
similar. For three students, interviewers had to explain the retrospective question because
students were confused. These teens skipped the question stem, which distinguished the
time period for which teens were supposed to reference to answer the questions. Because
they did not read the stem questions carefully, they thought the posttest and retrospective
pretest questions were the same, and the repetition was a mistake in the survey. One
student shared his thoughts on this:
I’d probably ask to get this question [retrospective pretest] first and get this one [posttest question] last because usually some kids don’t really read the whole question through and we just rate them based on today or back then. (Jazmine) The retrospective pretest questions were a little more difficult to understand for
students who had participated in ASM programs previously. They were unsure whether
the retrospective pretest question was referring to the first program they ever attended or
their current program. Examples included:
Roman: First day of this one or very first session? Willie: Is this talking about this year’s day of first program, or overall?

126
Willie: Is this the very beginning or the beginning of this fall’s program? Kayla: So they want us to go back to the first day, and this is asking on the first day do we know how to do these? Willie: I feel like through the summer internship and this, I feel like I haven’t stopped writing poetry in a more structured program so it’s kind of hard to tell the differences.
One student noted that it might be difficult for students who have participated in other
ASM programs to reflect and respond to the retrospective pretest question.
Interviewer: Was it hard for you to reflect back on your beginning skill level in this program? Student: Not for me because I changed a lot during this program but I think for other students it might be hard because they been here really longer than me. (Mariah)
Other students understood the time frame the questions were referring to, but were
confused about the setting in which the skills occur.
If you like give examples like, in like school, or like…what do people do in a group that’s not here? Because I would like be thinking of like a group project in my school because we don’t have group projects here. (Emily)
Another student thought of these skills as school skills only, and did not see the relevance
to her program.
[Leading a group or team activity] These are kinda not applicable. That’s not really something I do, so neutral. [Working with a group or team] We don’t do group projects, so neutral. [Solving problems] Not really something we do. [Speaking in public] We don’t usually, we don’t do that much but sometimes we have critiques where you have to speak in front of everyone. [Getting things done on time]: Well, we had a lot of breaks this semester, so… [Receiving feedback] Agree. It’s nice to have other people around so you ask, “oh does this hand look right?” or something. (Nicole)

127
It was also difficult for some students to report change based on their current program
because they participated in other activities that they felt contributed to any gains in
skills.
Interviewer: How accurate do you think your ratings were on these questions [retrospective pretest]? Student: For thinking back? I feel like they were pretty accurate, though I wouldn’t…I don’t’ know if I would rate these certain things … because what I was kind of struggling with is I know I’ve made a big jump in another internship, so I made a big hop, so it’s kind of…it’s kind of odd because I made another big hop here, so it’s kind of hard for me to tell you know what setting I improved the most…I guess, I don’t know. I guess I was being truthful, but it’s just two programs together helped me a lot. (Willie)
These results indicate that while teens generally understood the retrospective
pretest question, they needed additional time to process it. Student recommendations to
address any confusion included switching the order of the question so that it appears
before the posttest question and clarifying both the time period and the setting.
Recalling behavior and making inferences. The second step in the cognitive
process of a survey respondent is recalling behavior, and the third step is making
inferences. The majority of students interviewed did not report issues with recall (70.0%).
Students generally felt that they knew themselves well enough to accurately recall and
assess their beginning skill level at the end of the program.
Interviewer: Was it easy or difficult to rate your beginning skill level at the end of the program? Student: It was definitely easy because by then I already knew what I thought about myself, how my skills had improved. And I knew how to put that out there now because I can say what I think without feeling judged. (Jazmine)

128
Several students shared this sentiment. Below are several examples of students who
shared they did not have difficulty recalling their beginning skill level.
Yamika: Thinking back, they were pretty much easy to understand and rate myself ‘cause I knew that I was kind of reserved again and stuff like that so it was pretty easy to identify with.
Monique: Well, I think you can never lose knowledge, you can only gain it, so of course, it’s a higher number from where I started at the beginning. Victoria: It wasn’t that difficult because I already knew that I’ve come really far. Kayla: It’s not that hard because you just overcame it.
Tomasz: It’s fairly simple. People generally remember their first initial feeling from starting things it’d be hard if it was in the middle of how we felt halfway but I think this is good. Roman: I’ve always been pretty confident in these areas, so even when I first started, I’d be like strongly agree, strongly agree, except getting things done on time. That’s always been a problem for me. I think it’s not that hard looking back on yourself because it’s yourself and you’re constantly with yourself.
Nine students (approximately 30.0%) reported they had some difficulty recalling
their beginning skill level.
Interviewer: Is it hard to think back? Student: A little bit, yea, ‘cause it like feels like forever ago… but it flies by…it’s harder to remember where I was but like I can kinda see to a point where I was ‘cause like I know. (Marta)
Students who had difficulty recalling their beginning skill level varied in terms of
whether they felt their traditional pretest scores or their retrospective pretest scores were
more accurate.
Interviewer: Was it easy or difficult to rate your beginning skill level at the end of the program? Student: That was kind of hard. Like I couldn’t really remember like exactly how I was…I was like stuck in the moment of present, like how I’ve like grown.

129
Interviewer: How accurate would you say your ratings are here [retrospective pretest]? Student: I don’t know, I guess, a little more accurate. Interviewer: Why do you think that? Student: ‘cause like it’s more recent I guess so. (Chelsey)
Another teen agreed that her retrospective responses were more accurate, but she had
difficulty with recall.
Interviewer: Were these questions easy or difficult to answer [retrospective pretest]? Student: Sometimes it takes a little while to think back, so it took me some time but other than that, it was mainly just the concepts of having to remember everything. Interviewer: How accurately are you able to recall your beginning skill level? Student: Pretty easily from the beginning of the program. Interviewer: Which set of responses do you think are more accurate [traditional pretest or retrospective pretest]? Student: The end where I reflected on my program experience…because from then to now because it’s more recent, I’d say it would be more accurate. (Kelly)
One teen thought that his answers for the retrospective pretest question could be biased
based on his ability to recall his beginning skill level, and consequently, he thought his
traditional pretest ratings were more accurate.
Interviewer: Which set of responses do you think are more accurate [traditional pretest or retrospective pretest]? Student: Well definitely rating myself at the beginning because then I know where I am at the time instead of having to think back about it where it’s kind of like having to remember and then memories can kinda be sometimes tainted. (Alexander)

130
As previously mentioned, some students had difficulty interpreting the
questions because they had previously participated in an ASM program and were not sure
whether the retrospective pretest question referred to the beginning of their current
program, their first program, or some other starting point. This affected some students’
ability to recall and make inferences about their abilities because they were unsure of the
reference period.
Interviewer: Is it hard to think back and answer this question [retrospective pretest]? Student: A little bit because well at least during the survey because I can pick up something I did on the last day and something I did on the first day like oh this is a little better…it’s a little strange but I’ve done more than one program here so it’s easy for me to say it wasn’t that different from last year but it’s only like 8 weeks, it’s not going to be a noticeable change. (Nicole)
Selecting and editing responses. In the fourth and fifth steps of the cognitive
process, survey respondents select a response and then edit the response. Selecting and
editing the responses did not appear to be an issue. As discussed previously, response
rates were consistent between posttest question items and retrospective pretest question
items. This is one indication that students did not have trouble selecting and editing their
responses. While the protocols for the interviews did not specifically address selecting
and editing responses, three students mentioned during their interviews that they had
issues with this step in the cognitive process. The word option “neutral” was confusing
one teen.
Interviewer: Do you think your responses to this question [retrospective pretest] were accurate? Student: Kinda. Interviewer: Kinda? Why is that?

131
Student: Well…just because of neutral. I don’t really know what that means. Does that mean no change has happened? (Alexander)
Another student explained she did not know how to rate herself using the words and
recommended a number rating scale instead.
Student: I don’t know why the neutral would be here. Interviewer: Too many answer options? Student: I’ve just been clicking agree or disagree because I don’t know what strongly agree would mean...it’s weird…what about a number rating, if you could rate from 1 to 5 your skill level. (Emily)
Finally, the third student who reported an issue with selecting and editing a response
noted that he either needed more answer options or the posttest and retrospective pretest
questions needed to be switched in order for him to accurately select an answer.
Interviewer: Would you change anything about this section? Student: There should be more options. Interviewer: Why so? Student: My dilemma was that I strongly agreed with how I’ve enhanced my abilities, but when I started a lot of stuff I said I was strongly agree so I feel like this one [retrospective pretest] should go before the other one [posttest]. (Willie)
Interesting to note is that issues around response selection and editing the response were
primarily brought up by males in the qualitative sample.
Evidence of Response Biases
Though this study did not explicitly intend to find evidence of response biases
other than response-shift bias, some evidence did present itself. This section provides
discussion about what evidence emerged related to acquiescence, social desirability,
effort justification bias, and implicit theory of change.

132
Social desirability. In this response bias, respondents over-report more
socially accepted attitudes and behaviors, and under-report those that are less socially
accepted (Krosnick, 1999). Social desirability may be present in a survey for a variety of
reasons, including the survey content, context, or the personality of the respondent (Furr
& Bacharach, 2014). What results is an overestimation of program effects.
The survey did not include additional scales or items to detect social desirability
bias. The survey instructions requested that students answer the questions honestly, and
informed them that their responses were confidential unless there was a safety concern. I
examined the responses to each test type to determine whether any students only
answered favorably by selecting agree or strongly agree for each item. On the traditional
pretest, 16.6% of students responded agree or strongly agree to every time, compared to
36.4% in the posttest and 35.0% in the retrospective pretest. These figures could
potentially indicate social desirability bias; they could also indicate acquiescence or
students’ actual perceived changes.
In interviews, it was difficult to ascertain whether students were responding a
certain way because they wanted to please the interviewer. Each interviewer started off
the conversation by explaining that the intention of the interview was to collect honest
feedback about the survey in order to make it easier for teens to complete. Interviewers
explained to students that their responses were confidential, and their responses would
not be connected to their name in any way. As part of the consent process, students were
also told that they could stop the interview at any time. Program experience interviews
built rapport with students by asking them questions about their programs first.

133
Additionally, the items in question were not sensitive in nature, and they were not
high stakes.
Acquiescence. This response bias occurs when survey respondents select
responses regardless of the content of the question. It is often called “yea-saying or nay-
saying,” and represents of a form of satisficing. It is more common among people with
limited cognitive skills, less cognitive energy, and those who are not motivated or do not
like to think. It is also more common when the question is difficult or ambiguous,
respondents are encouraged to guess, or after respondents have become fatigued. Like
social desirability, acquiescence produces an overestimate of program effects.
The survey did not include additional scales or items to detect the presence of
acquiescence. However, evidence of acquiescence emerged from the student interviews,
leading me to reexamine the survey data. In doing so, I determined that acquiescence may
in fact be an issue. In the traditional pretest, 21.1% of students who completed the survey
selected the same answer for every item. This was true for 41.7% of students on the
posttest and 40.2% of students on the retrospective pretest; 28.1% of students who
completed both the posttest and retrospective pretest question selected the same response
for all 12 items across the two questions. Students whose responses did not vary
depending on the question could potentially indicate acquiescence. This was much higher
than in the pilot, where one student out of 77 responded the same way to all items.
Four of the 30 students interviewed provided responses in their interviews that
indicated possible acquiescence. I coded instances of students reporting that they
responded with the same answer to every item as acquiescence because it indicated that
perhaps they did not implement the full cognitive process to respond to survey questions.

134
Students’ responses generally indicated their reason for acquiescence was related to
being confused about either the question or the answer choice. When asked about
whether the order of the posttest and retrospective pretest questions was confusing, one
student responded:
I think it would be better if you flipped it because like once you see this you’ll probably just put the same exact thing you put up here…so if you put this first, they’ll probably like think back on it. (Monique)
The student points out that other students may not actually put forth the cognitive effort
to answer the retrospective question because the order or the question could be confusing.
Another student admitted her traditional pretest was not accurate because she did not
know how to answer the questions, and consequently selected “neutral” for each item.
One student said she selected “agree” for every item because this was her first ASM
experience, and she was unsure how to rate herself. Another student said she too selected
“agree” for every item. A fourth student indicated acquiescence because she did not
understand one of the answer options.
Student: I don’t know why the neutral would be here. Interviewer: Too many answer options? Student: I’ve just been clicking agree or disagree because I don’t know what strongly agree would mean...it’s weird…what about a number rating, if you could rate from 1 to 5 your skill level. (Emily)
These examples led me to re-analyze my qualitative data for students in my
qualitative sample who were part of the 28.1% of students that answered the same way
for all items in the skills-based posttest and retrospective pretest questions. Five students
in my qualitative sample fit this criterion. Three of these students provided evidence of
potential acquiescence, but the other two truly did not feel they had changed. One student

135
shared, “I don’t think I gained like as much because I came from a middle school
structure like this…I’m learning the same thing” (Fatoumata). The other student also felt
he did not observe large changes in himself, stating, “I feel like through the summer
internship and this, I feel like I haven’t stopped writing poetry in a more structured
program so it’s kind of hard to tell the differences” (Willie).
Since the rates are similar for posttest and retrospective pretest, it seems that the
reason for acquiescence may be less related to satisficing due to issues in understanding
and perhaps more related to another factor, such as being burnt out by the survey. Several
students shared in their interviews that the survey, while shorter than it has been in
previous program sessions, is still too long.
Effort justification. A program participant may exaggerate his or her responses
to justify the investment he or she has made into a program. This is called effort
justification bias, and this bias can overinflate program effects.
One argument against the retrospective pretest is that its use may reduce response-
shift bias but increase effort justification bias. If this were the case, we would see a large
decrease in the ratings from traditional pretest to retrospective pretest. However, though
the change between the ratings at both time periods was significantly different, they were
not substantially different (4.06 compared to 4.01, respectively). This indicates that
students did not increase their effort justification bias by answering the posttest and
retrospective pretest questions at the same time.
Effort justification is difficult to detect in survey responses. It was also difficult to
detect in the student interviews. In coding this response bias, I was looking for students
who mentioned the time they put into the program and how that impacted how they rated

136
themselves or their perceived skill gains. Only one student mentioned time as it
related to gaining skills, but her concern was that a 10-week program was not enough
time to see large gains. Therefore, I did not find evidence of effort justification bias in my
study.
Implicit theory of change. Respondents may assume the program they
participated in was successful in achieving its desired effect. This assumption of change
when one did not actually take place is called implicit theory of change. Like social
desirability and effort justification bias, implicit theory of change inflates change scores.
Similar to effort justification bias, implicit theory of change can be difficult to
determine based on survey responses. Again, if implicit theory of change bias increased
as a result of including a retrospective pretest questions, I would expect to see a larger
decrease in scores from traditional pretest to retrospective pretest, but I did not. This
indicates that students did not increase their implicit theory of change by answering the
posttest and retrospective pretest questions at the same time.
For the interview data, I coded any time a student made an assumption that they
would change from being in the program without evidence as to how or why as evidence
of implicit theory of change. For example:
Student: Thinking back, they [the retrospective questions] were pretty much easy to understand and rate myself ‘cause I knew that I was kind of reserved again and stuff like that so it was pretty easy to identify with. But now, looking back, of course, it’s not the same. Like at first it would be, not strongly disagree but just a slight disagreement but now it’s strongly agree. (Yamika)
This student seems to assume she changed when she says, “of course it’s not the same.”
She was confident she had changed, but did not elaborate on the specific changes she

137
experienced as it relates to each skill. Similarly, another student assumed her
retrospective pretest ratings should be lower, while her posttest ratings should be higher.
The first one would be way different. I’d like probably disagree with stuff and today I’d probably agree with a lot of other things. I think you can never lose knowledge; you can only gain it, so of course it’s a higher number from where I started at the beginning. (Monique)
Below is an example shared previously:
Student: I honestly think the first one should go before the today one because when I was doing it I was looking at today and thinking in the now and then I was thinking maybe I didn’t feel that way long ago. So if you bring up the throwback first, then you’ll have them thinking of this and they won’t get confused. I think the older one should go first and then the current one. (Yamika)
This interview excerpt was used to indicate students’ preference for switching the order
of the posttest and retrospective pretest questions. This is also potentially evidence of
implicit theory of bias, as the student is reassessing her responses to the retrospective
pretest based upon what she responded for the posttest questions.
Summary
Chapter four provided results to address the three research questions in this mixed
method study. The results indicate that response-shift bias exists for three of the six skills
teens rated themselves on, including working with others as a team, speaking in front of a
group, and being open to feedback. However, there was no evidence of response-shift
bias for the six items as a scale. Yet, qualitative interviews provided more widespread
evidence of response-shift bias than did the quantitative data.
Teens who participated in interviews demonstrated two of three types of
response-shift bias, including recalibration and reconceptualization. Subsequent analysis
of quantitative data revealed that student characteristics were not predictive of the degree

138
of response-shift bias, but several factors related to personal interactions between
teens and instructors were. This finding was supported by open-ended comments from
the teen survey. Finally, a comparison of the quantitative and qualitative samples
provided evidence that the qualitative programs from which the interview sample was
drawn are better at creating supportive environments and providing opportunities for
youth engagement, both of which indicate higher levels of quality. Students in these
programs may have experienced more response-shift bias because the programs were
higher quality.
Finally, teens were for the most part able to complete Krosnick’s (1990) cognitive
process while taking the survey, but not without issues. Teens needed more time for the
retrospective pretest question and recommended the retrospective question precede the
posttest survey to decrease confusion. They also recommended clarifying the question
about the time period and context so students who have participated in ASM before could
easily understand the reference period for the retrospective pretest question. Teens
provided potential evidence of acquiescence and implicit theory of change. Though these
biases were not explicitly targeted as part of this study, they could have affected the
results of the study.
Chapter five offers conclusions about this study, shares implications, discusses
limitations of the study, and provides direction for future research.

139
CHAPTER FIVE
DISCUSSION
Introduction
First, I will discuss my key findings on response-shift bias in teen programs as
well as using mixed methods to study the phenomenon with this particular population.
Second, I will discuss the implications of my conclusions by outlining recommendations
for the retrospective pretest/posttest design at After School Matters as well as other youth
serving programs. Third, I will examine the methodological and practical limitations in
my study. Finally, I will outline several areas for future research.
In this section, I present my overall findings concerning response-shift bias and
the use of retrospective pretest/posttest design in an urban after-school program for teens.
I also discuss the advantages and disadvantages associated with applying a mixed
methods design to study response-shift bias as a phenomenon.
Response-shift Bias in Teen Programs
The Existence of Response-shift Bias
The results in my study were somewhat inconclusive as it relates to response-shift
bias because my results differ from some of the literature. Several studies have found
evidence of response-shift bias and have advocated for the use of retrospective
pretest/posttest design as a means to detect and reduce response-shift bias (Howard,
Ralph, Gulanick, Maxwell, Nance, & Gerber; 1979; Cantrell, 2003; Hill & Betz, 2005;

140
Pelfrey & Pelfrey, 2009; Moore & Tananis, 2009; Nimon, Zigarmi, & Allen,
2011). Two studies explicitly explored response-shift bias and the retrospective
pretest/posttest design with teens, finding that response-shift bias was in fact present
(Moore & Tananis, 2009; Kanter & Browhawn, 2014). Moore and Tananis (2009) found
a response-shift bias for their survey items as a scale, with effect sizes ranging from 0.42
to 0.73 for three years of data. Kanter and Brohawn (2014) provided item level changes,
showing significant shifts for items, but did not investigate the items as a scale or provide
effect sizes.
I found that five of the six items with my scale were significantly different from
traditional pretest to retrospective pretest, with three of those items having large enough
effect sizes to warrant important differences. The three items’ effect sizes ranged from
0.14 to 0.19, much lower than what Moore and Tananis detected in their study.
Unfortunately, the Moore and Tananis study did not provide item level changes, and the
Kanter and Browhawn study did not provide effect sizes. My results ultimately differ
from what has been reported in response-shift bias literature for all respondents. Since
there are only two studies that have investigated response-shift bias for teen programs, I
am limited in terms of grounding my findings in current literature for this particular
population. Because there is a lack of studies to compare mine to, it is difficult to make a
conclusive statement about the ability to detect response-shift bias for teens at the scale
level.
The Importance of Qualitative Data in Detecting Response-shift Bias
Though my quantitative analysis did not show response-shift bias to be as
prevalent as literature would indicate, my qualitative findings provided ample evidence

141
that response-shift bias was in fact an issue. A small number of studies have included
qualitative information to bolster the validity of their findings related to response-shift
bias. Howard, Ralph, Gulanick, Nance, and Gerber (1979) interviewed program
participants from a workshop on dogmatism to discuss their traditional pretest responses.
Interviewees typically admitted they did not have a good understanding of the construct
at the time of the traditional pretest and felt their retrospective pretest ratings were more
valid. Howard (1980) further discussed the results of the studies he and his colleagues
conducted, adding that anecdotal evidence from program participants who believed their
traditional pretest ratings were inaccurate, and their retrospective pretest ratings were
more valid. Cantrell (2003) also included interviews to get a better understanding of why
changes occurred between the retrospective pretest and the traditional pretest, asking
participants to clarify the differences in their responses to items for both pretests. The
interviews indicated respondents no longer trusted their initial responses because they did
not feel they knew enough at the time of traditional pretest to make accurate assessments.
Moore and Tananis (2009) also incorporated open-ended questions, focus groups, and
whole-group debriefings to better understand the response-shift they detected in their
research. Students reported they had overestimated their initial knowledge and skills
before the program.
My study placed a much larger emphasis on qualitative data as part of the
investigation into response-shift bias than previous researchers, making the qualitative
findings equally important to the quantitative findings. Like Howard, Ralph, Gulanick,
Nance, and Gerber (1979), Howard (1980), Cantrell (2003), and Moore and Tananis
(2009), qualitative data provided a deeper understanding of response-shift bias. Two-

142
thirds of teens provided evidence of response-shift bias. While response-shift bias
was not evident for every teen in the qualitative sample, it was certainly a strong factor in
many teens’ responses. Response-shift bias and why it occurs or how it manifests in teens
would have been difficult to explain without qualitative data provided by teen interviews.
Unlike previous literature (Howard, Ralph, Gulanick, Nance, & Gerber, 1979; Cantrell
2003; Moore & Tananis, 2009), my qualitative results did not bolster my quantitative
results; instead, it indicated that perhaps response-shift bias was more widespread than
my quantitative results implied.
The Effect of Interpersonal Relationships on Response-shift Bias
My study provided evidence that interpersonal skills played a role in the existence
and degree of response-shift bias teens experienced. Few studies I came across used the
retrospective pretest/posttest design to detect response-shift bias related to
communication or interpersonal skills. Howard, Ralph, Gulanick, Nance, and Gerber
(1979) conducted five studies using retrospective pretest/posttest design to examine the
response-shift bias issue. Two of these five studies focused on response-shift bias related
to a workshop and a class meant to increase communication skills. The first study
focused on communications skills workshops in Air Force bases across the study, and the
participants were commissioned officers. Using a traditional pretest/posttest design, the
researchers found that participants’ scores decreased from pretest to posttest, making it
appear that the program worsened participants’ condition. Additional conversations with
participants revealed they did not know enough about the construct to respond adequately
to questions about it at pretest. The other study focused on undergraduate students in a

143
communications class that participated in the study through a course to assess
assertiveness. The researchers identified the existence of response-shift bias for the scale.
Though these studies examined response-shift bias as it relates to communication
skills, they did not provide enough information for me to ground my study’s findings on
interpersonal skills and their affect on response-shift bias in current literature. However, I
was not surprised that interpersonal relationships matter to youth in ASM programs.
ASM hires instructors who are experts in their field and trains them in youth
development. Instructors then mentor the teens in their programs, and using elements
from the Youth Program Quality Intervention, create a safe and supportive environment
while providing opportunities for peer interaction and youth engagement. While my
findings indicate the importance of interpersonal relationships in response-shift bias,
additional research is needed to better understand the nature of interpersonal
relationships, and how and why it causes larger shifts in response-shift bias.
The Order of Retrospective Pretest and Posttest Questions
Though literature suggests that the posttest question should precede the
retrospective pretest question, doing so confused many teens. Howard, Schmeck, and
Bray (1979) recommended asking respondents first how they perceive themselves at
present and then how they perceived themselves at the beginning as the optimal way to
detect response-shift bias. Several researchers recommend using two separate
administrations for the posttest and the retrospective pretest, while the least desirable
format is showing the pretest and posttest questions side by side (Sprangers, 1988;
Sprangers & Hoogstraten, 1989; Taylor, Russ-Eft, &Taylor, 2009; Nimon, Zigarmi, &
Allen, 2011). Following this order reduces implicit theory of change and effort

144
justification bias, which the retrospective pretest/posttest design may increase
(Sprangers & Hoogstraten, 1989; Taylor, Russ-Eft, & Taylor, 2009).
I chose to keep the questions in the same form to obtain several of the benefits
retrospective pretest/posttest designs provide aside from reducing response-shift bias
(Hill & Betz, 2005). I followed the recommendation of the literature to have the posttest
question precede the retrospective pretest question in the post-program survey. The
questions appeared on two different pages to also reduce risk of implicit theory of change
and effort justification bias. Though the quantitative data did not indicate issues with
comprehension, the qualitative data generated through the interviews did. They
recommended switching the order to make the questions appear in chronological order.
Teens felt doing so would increase question comprehension. This recommendation is in
line with research on the adolescent cognitive process while completing surveys.
Literature indicates that youth need more time to process, understand, and respond to
surveys (De Leeuw, 2011). Additionally, Schwarz and Oyersman (2011) warned of
increased response biases when survey respondents become fatigued or confused.
The Presence of Other Response Biases
The literature focuses on the potential of the retrospective pretest/posttest design
to increase social desirability, implicit theory of change, and effort justification bias
(Sprangers & Hoogstraten, 1982; Hill & Betz, 2005; Taylor, Russ-Eft, &Taylor, 2009;
Moore & Tananis, 2009;), but I found acquiescence to be the biggest potential bias when
using the design with teens (Lam & Bengo, 2002). For example, Taylor, Russ-Eft, and
Taylor (2009) warned that while the design may reduce response-shift bias, it could also
increase implicit theory of change and effort justification bias. In order to combat those

145
biases, the researchers recommended having two separate administrations for the
posttest and retrospective pretest questions. Moore and Tananis (2009) identified social
desirability bias as the strongest alternative explanation for the results they observed in
their study, and noted that students might be underestimating retrospective pretest scores
and/or overestimating posttest scores due to effort justification bias.
My results were more in line with those of Lam and Bengo (2002), who
highlighted several potential biases at play in their study, but they also suspected the
presence of satisficing. In my study, I found acquiescence to be the largest threat to
detecting response-shift bias in teen programs. While many of the studies discussed
hypothesized that the presence of other response biases could have overinflated
participants’ self-reports of change, I suspect that acquiescence masked the existence of
response-shift bias in my study, likely due to survey fatigue or confusion about the
retrospective pretest question. Krosnick (1991) noted that survey respondents may
satisfice if they are fatigued by a long survey or they do not understand the question, and
several teens reported these issues. Nearly a third of students answered the same way for
12 items across two questions, which could indicate they experienced no change, but it
could also indicate that they did not put forth the optimal cognitive effort to respond to
the question honestly and thoughtfully. Additionally, there were teens that admitted
during interviews that they selected one response repeatedly because they did not
understand the question or they thought the question was repeated. Finally, several teens
complained the survey was too long. These findings led me to conclude there is a strong
possibility that acquiescence could be hiding some of the response-shift bias, which
would also explain where there was some dissonance in my quantitative and qualitative

146
data. That being said, it is difficult to detect bias in general without using validity
scales, so I cannot conclude with certainty its existence in the quantitative data.
The Retrospective Pretest/Posttest Design as an Evaluation Option for Teen
Programs
Despite the fact that I cannot conclude that response-shift bias happens for all
teens across programs and skills, I can conclude that the retrospective pretest/posttest
design is a practical and useful design for evaluating youth self-reported change. Several
researchers have concluded that the retrospective pretest/posttest design is a sufficient
standalone design (Lamb & Tschillard, 2005; Allen & Nimon, 2007; Pelfrey & Pelfrey,
2009). Additionally, Hill and Betz (2005) cited several practical reasons for using this
design in program evaluation. They discussed the conflicting goals practitioners and
evaluators face in program evaluation. These practitioners and evaluators want to gather
meaningful data that accurately assess whether the program has had its intended effects,
and uses measurement tools with strong psychometric properties. But they also need to
do this in a way that makes the evaluation as unobtrusive to program participants as
possible. This means evaluation activities should take minimum program time to avoid
overburdening program staff or participants, it should be inexpensive to administer,
analysis should be straightforward, and the evaluation activities should have face validity
with program participants and staff. As Hill and Betz pointed out, achieving all of these
goals is often impossible and typically requires meeting one goal at the expense of the
other. The retrospective pretest/posttest can reduce some of these practical issues.
In my study, the traditional pretest and retrospective pretest scores as a scale were
not different, and given this result, adding a retrospective pretest question did not seem to

147
increase implicit theory of change or effort justification bias. These results indicated
that the two are interchangeable and an evaluator can choose what is most practical.
However, the evidence of response-shift bias in my qualitative data was overwhelming
enough for me to determine it did exist and that the traditional pretest may not be the best
method for assessing change. The traditional pretest was important to this study in that it
allowed me to detect response-shift bias, but since it was not the focus of the study, I
cannot draw conclusions about its value.
Using Mixed Methods to Investigate Response-shift Bias
While mixed methods as a design for studying response-shift bias led to
dissonance, iterative data analysis, and some inconclusive findings, I would not have had
as deep of an understanding of response-shift bias without it. I experienced a few cases of
dissonance. First, I encountered dissonance between the quantitative data and qualitative
data. The quantitative data indicated that response-shift bias was present only for certain
items, while the qualitative data indicated that response-shift bias was in fact much more
widespread and present for all of the items in the scale. Second, I encountered dissonance
between the pilot data and the full implementation. My full study produced a negligible
effect size for response-shift bias in the items as a scale, while my pilot produced a small
effect size (0.06 compared to 0.36, respectively). Finally, I encountered dissonance
between the literature and the results of my study. The literature indicated that response-
shift bias at the scale level was commonly detected, but I only detected it at the item
level.
I chose mixed methods as my design to investigate response-shift bias because
response-shift bias is a complex cognitive phenomenon that cannot be easily understood

148
through quantitative or qualitative data alone. Secondly, there are no studies that
provide adequate qualitative evidence to explain the cognitive process; research generally
focuses on whether the response-shift bias exists using quantitative methods. While some
studies of other populations have included interviews or focus groups as part of the study
on the retrospective pretest/posttest design and response-shift bias (Howard, Ralph,
Gulanick, Nance, & Gerber, 1979; Cantrell 2003; Moore & Tananis, 2009), they do not
provide an understanding of the cognitive process a respondent goes through, nor do they
provide information about how the cognitive process may differ for younger respondents.
Additionally, I utilized mixed methods to study response-shift bias for purposes of
triangulation and complementarity (Greene, Caracelli, & Graham, 1989). I made the
assumption that the results of my quantitative and qualitative data analysis would
reinforce one another, allowing me to draw stronger, richer conclusions about response-
shift bias as a phenomenon for teens in an urban after-school program. Unfortunately,
that is not what happened, and because of the dissonance between the two types of data,
the purpose of my study refocused on initiation as a means to make sense of the
dissonance. Greene (2007) acknowledged that dissonance can occur in studies with a
different purpose for mixing, but such dissonance should be seen as a puzzle that can
inspire new insights rather than as a failure of the design.
Greene (2007) also noted that mixed methods can lead to iterative analyses.
Because of the dissonance in my results, I carried out several additional analyses to help
me better understand my findings and help reduce dissonance. These iterative analyses
did in fact help me interpret some of my findings as it relates to response-shift bias. I was
able to identify a connection between response-shift bias and interpersonal skills, and I

149
discovered differences in the quality of the programs selected for the qualitative
sample versus my quantitative sample. Additionally, after I identified that 28.1% of teens
responded the same way to all items in both the posttest and retrospective pretest
questions in my quantitative sample, I was able to reanalyze my qualitative sample and
identified five students who responded this way. This reanalysis of my data indicated that
three of the students were in fact acquiescing when they responded, but the other two
entered the program feeling strong in those skills.
Despite the dissonance, engaging in a mixed methods design to investigate
response-shift bias with teens was invaluable. Without the qualitative data I collected, I
would have underestimated the presence of response-shift bias. I also would have had
difficulty interpreting the results of my model and the effect of interpersonal
relationships. If I had more time, I would have interviewed more students to better
understand the connection between response-shift bias and interpersonal skills and to
determine the presence of acquiescence bias or satisficing. That being said, a mixed
methods study is a large undertaking. Researchers and evaluators who want to engage in
this kind of study should heed the recommendations of Creswell and Plano Clark (2012).
They shared that a mixed methods study requires skills, time, and resources. I was
fortunate to have a team to assist me in the qualitative data collection piece. This was
particularly stressful because of the short turnaround time we had for administering the
retrospective pretest/posttest and using that data to select students to participate in
program experience interviews. Also, for future mixed methods studies, I will create a
plan in advance to deal with dissonance, as it can require additional time and resources.

150
Implications
Implementing the Retrospective Pretest/Posttest Design at After School Matters
Based on the findings of my research, I will advocate for the use of the
retrospective pretest/posttest design at ASM. The quantitative results indicated that
response-shift bias was prominent enough for a few items to warrant its use. The scale
averages for the traditional pretest and retrospective pretest were not different, leading
me to conclude that either pretest can be used.
However, the post-program survey instrument requires some revisions before I
can implement it widely at ASM. First, the teen survey overall should be shortened to
reduce survey burnout and potential acquiescence bias issues. Several teens complained
that the teen survey is too long and that by the end of the survey, they randomly select
answers without reading the questions or thinking through their responses just so they can
finish the survey. Such response patterns can make survey results difficult to interpret or
worse, make the results unreliable. To reduce this, I will work with program staff at ASM
to reduce the number of questions included on the survey. Second, I will revise the
retrospective pretest and posttest questions to make them less confusing for teens. I will
change the order of the questions, as teens were very clear that putting the questions in
chronological order will help them understand the question. I will also change the tense
of the retrospective pretest question to make the retrospective pretest and posttest
questions distinct to survey respondents. I will continue to have the two questions appear
on separate pages to reduce effort justification and implicit theory of change biases.
Third, I will add a question to the survey related to interpersonal skills, as these seem to
be most related to response-shift bias for teens in ASM programs. Capturing additional

151
data related to interpersonal skills will help me understand how these skills relate to
changes in 21st century skills.
I will also improve the survey administration process by standardizing it across
programs and instructors. I will create a one-page document that outlines how to
administer the survey so that administration will happen more uniformly across
programs. Currently, instructors vary in terms of how they administer the teen survey,
with some walking through the survey with teens and others simply setting teens up at
computers. Finally, I will pilot all of these changes before implementing them widely,
and will continue to incorporate teen cognitive interviews as part of the survey revision
process.
Recommendations for Using the Retrospective Pretest/Posttest Design in Other
Youth Programs
The retrospective pretest/posttest design can be used with other youth programs,
but there are several elements that should be included before an evaluator adopts this
design for all youth programs. First, I recommend that evaluators heed Schwarz’s (2001)
advice to pilot any survey instrument before implementing it broadly to program
participants. My pilot prepared me for potential problems with the broad implementation
of the retrospective pretest/posttest questions. For example, I learned during the pilot that
instructors varied in how they administered the survey and distributed the consent forms
to recruit teens to participate in the cognitive and program experience interviews. I was
also able to identify ahead of time through the pilot that the order of the retrospective
pretest/posttest questions was confusing to some teens. This finding then allowed my
colleagues and I to ask more pointed questions about the question order during the

152
cognitive interviews in the full implementation. Piloting my instrument also gave me
a framework for what to expect for the full implementation. The response-shift effect size
for my items as a scale was much higher in the pilot than it was in the full
implementation (0.28 compared to 0.06, respectively), and this discrepancy tipped me off
to other potential issues, including acquiescence, which then led to several helpful
additional analyses.
Second, I recommend that any program interested in examining response-shift
bias or testing the retrospective pretest/posttest design with youth incorporate cognitive
interviews as part of the data collection process. Cognitive interviews were very
revealing for my research; I gained a much deeper understanding of the ways in which
response-shift bias manifested itself in teens, and I was also able to explore reasons some
teens or programs may experience larger response-shift bias. Additionally, the qualitative
data provided evidence of other response biases that I may not have detected otherwise.
Third, I recommend that evaluators integrate youth or teen findings from the pilot
and the cognitive interviews to streamline the survey they plan to implement with a larger
group. This includes rewording any confusing items to increase comprehension and
removing any items that are unnecessary or repetitive. The literature suggests that lack of
comprehension and survey burnout can invite acquiescence bias (Schwarz, 2011;
Schwarz & Oyersman; 2001). I found this to be true in my study, so I encourage
evaluators to seriously consider the findings from piloting their tool and conducting
cognitive interviews and use those findings as a guide for how to shorten their survey.
Doing so could potentially decrease acquiescence in the survey responses, thus making it
easier to detect response-shift bias if it truly exists.

153
Finally, evaluators should consider the response biases and attempt to
minimize them, especially acquiescence. Moore and Tananis (2009) recognized social
desirability as the most likely bias at play in retrospective pretest ratings, but I saw more
evidence of acquiescence bias due to satisficing in my study. This bias was evident in
both the quantitative and qualitative data, but I could not conclude it existed based on the
design of my study. Evaluators should consider addressing these response biases and
controlling for them to enable them to detect response-shift bias without increasing other
response biases.
Limitations
Methodological Limitations
My study was not without its limitations. First, there were limitations in terms of
the design of the study. This study was designed to understand the retrospective
pretest/posttest design and its relationship with response-shift bias for teens in an urban
after-school program. I did not explicitly examine other response biases such as social
desirability, acquiescence, effort justification, and implicit theory of change. There is
literature that demonstrates the use of the retrospective pretest/posttest design may reduce
response-shift bias, but at the expense of increasing other response biases (Taylor, Russ-
Eft, & Taylor, 2009; Nimon, Zigarmi, & Allen, 2011). While I saw evidence for the
existence of some of these biases, especially acquiescence, I cannot conclude the extent
to which they were present. This limits what I can conclude about the implications of
using the retrospective pretest/posttest design with teens.
A related methodological limitation is that I did not include an objective measure
to determine whether traditional pretest or retrospective pretest measures are more highly

154
correlated with objective measures of the same construct. Several studies indicate the
retrospective pretest scores are more highly correlated with related objective measures,
which indicates more concurrent validity (Howard, Ralph, Gulanic, Nance, & Gerber,
1979; Bray, Maxwell, & Howard, 1984; Martineau, 2004; Hill & Betz, 2005). ASM does
not currently require instructors to assess their students on skills. No objective measure
related to skills existed at ASM in order to replicate this analysis as part of my study.
Such evidence would shed light on which pretest administration is perhaps most accurate.
Practical Limitations
A second area of limitations relates to the practical issues that occur when running
a large-scale study with a large multi-site nonprofit serving thousands of youth. First, the
survey administration process was not standardized across programs. Because ASM
offers hundreds of programs across the city of Chicago, it is difficult to standardize the
survey administration process. Through my program visits to collect qualitative data, I
noticed that some instructors walked their teens through the entire survey and clarified
questions as they arose, while others said little more than how to access the survey. This
variation meant that some teens had the benefit of the context of the survey, knowledge
of how the survey would be used, and the option to ask for help if needed, while others
did not. Such variation could lead to teens interpreting the questions in the survey
differently, which ultimately affects the interpretations I make as researcher and
evaluator. For future program sessions, I will create standard instructions for instructors
to administer the survey to eliminate some of the variation that I observed.
Second, the traditional pretest was much shorter compared to the retrospective
pretest/posttest. The traditional pretest was administered as part of ASM’s application.

155
The teen application was lengthy, but it only included one question with six items.
However, the retrospective pretest/posttest included several other survey questions. The
additional survey items in the retrospective pretest/posttest could have caused more
survey fatigue for teens, potentially increasing acquiescence bias.
Third, my qualitative sample was not representative of the quantitative sample. I
identified a few reasons for this. First, I used historical data to select programs from
which to draw my qualitative sample, but the reality is that programs can change
drastically if they move locations, switch instructors, change program models, or make
some other modification to curriculum. Additionally, the teens themselves change. There
is no way to conclusively know before a program begins what the demographic makeup
of teens is going to be for that program, even with historical data as a starting point.
Second, while all teens in the programs I selected received a consent and assent form, not
all returned the forms. Forms were not returned because teens lost them, forgot about
them, or did not want to participate. Instructors were also an issue in collecting signed
forms. One program instructor lost the consent forms, so all students had to be provided
with a new form. Such issues further limited my qualitative sample because not all
students had permission to participate in the study. This led to differences in the
demographic makeup of my quantitative and qualitative data.
Finally, another difference was the quality of the programs in the quantitative and
qualitative sample. The quantitative sample included all programs, but the qualitative
sample was drawn from programs that were representative of the five content areas and
four regions at ASM. They were also programs with historically high survey completion
and attendance rates, and low drop rates. Based on quality assessment data from the

156
YPQA, programs in the qualitative sample were rated higher in the domains of
supportive environment and youth engagement, meaning these programs were of higher
program quality than those included in the quantitative sample. This could have been why
I saw more detectable evidence of response-shift bias in my qualitative sample than my
quantitative sample. But this difference in my quantitative and qualitative sample
presents another limitation to my study.
Future Research
Given the limitations that existed in my research, there are several areas for future
research related to response-shift bias and utilizing the retrospective pretest/posttest
design with teens for program evaluation. These areas for future research are directly
related to limitations in my study as well as areas of interest that have been investigated
for adult survey respondents in response-bias literature.
The Order of the Posttest and Retrospective Pretest Questions
Additional studies on the use of retrospective pretests with teens are needed to test
order effects of the posttest and retrospective pretest questions. Specifically, future
studies should examine if by making questions easier for teens to follow, the evaluator is
increasing the possibility of implicit theory of change or effort justification bias. In
keeping with recommendations from the literature (Howard, 1979) while balancing the
practical realities of internal evaluation (Hill & Betz, 2005), I included both the posttest
question and retrospective pretest questions as part of the same survey, with the posttest
question appearing before the pretest question. The order of the posttest and retrospective
pretest questions was intended to minimize implicit theory of change and effort
justification bias, which can increase through the use of the retrospective pretest

157
(Sprangers & Hoogstraten, 1989; Taylor, Russ-Eft, & Taylor, 2009). However, I
discovered that this order was highly confusing to teens as they completed the post-
program survey. The vast majority of students in my qualitative sample requested that the
two questions appear in chronological order instead, with the retrospective pretest
appearing before the posttest. Teens reported that putting the posttest and retrospective
pretest questions in chronological order would make it easier for teens to answer the
questions, and it would help them understand that these were in fact two different
questions referencing two different time periods.
Schwarz (1999) warned that respondents may under or over-report a construct if
they do not understand the question. Similarly, Krosnick (1999) pointed out, “a great deal
of cognitive work is required to generate an optimal answer to even a single question” (p.
547). If the order of the questions is confusing to teens, they may not put forth the
cognitive effort needed to respond to the questions thoughtfully, making the retrospective
pretest ineffective at detecting accurate program effects. Additionally, De Leeuw (2011)
points out that adolescents may require more time than adults to engage fully in the
cognitive process while completing a survey. Teens provided evidence that indeed they
needed additional time to process some of the questions, but this was especially true for
the retrospective question.
Yet, some studies have shown that the timing of the administration for the posttest
and retrospective pretest questions can elicit or exacerbate response biases such as effort
justification or implicit theory of justification. The general recommendation is to
administer the questions as two separate tests when possible, with the worst option
showing the questions side by side (Terborg & Davis, 1982; Schwarz, 1996; Nimon,

158
Zigarmi, & Allen, 2011). But the added bonus of the retrospective pretest is that it not
only reduces response-shift bias, it also provides a practical alternative for measuring
program effects. This practical alternative is especially helpful when traditional pretests
are not possible because of the burden they put on respondents, the capacity of the
program staff, or available resources. When only one survey administration is possible
with the retrospective pretest/posttest design, what question order is optimal for teens?
Future research on using the retrospective pretest with teens should explicitly examine
the effect of question order on both comprehension of the question and whether it
increases effort justification and implicit theory of change biases.
Evidence of Reprioritization as a Type of Response-shift Bias
Another area for future research is investigating the presence of reprioritization as
a type of response-shift bias with adolescents. Sprangers and Schwarz (1999) described
three types of response-shift bias. The first is recalibration, where the respondents’
internal standards of measurement change. The second is reprioritization, where the
respondents reevaluate the importance of the construct and change their values. The last
type is reconceptualization, which is when participants redefine the target construct.
Sprangers and Schwarz (1999) noted, “while clearly distinguishing the three aspects of
response shift is needed to elucidate the concept, recognizing their interconnectedness is
also necessary to acknowledge the complexity and richness of the phenomenon” (p.
1508).
I found ample evidence of response-shift bias related to recalibration and
reconceptualization, but nothing related to reprioritization. In terms of recalibration,
several teens shared that they did not know enough at the time of the traditional pretest to

159
rate themselves accurately on the skills in question. They had never tried the skills
before, so they did not know what they were capable of doing. Furthermore, teens did not
know the degree to which they could improve. Teens also reported examples of
reconceptualization, sharing examples of how their understanding of skills such as
leading groups or teams, working in groups or teams, and solving problems changed over
the course of the program. Their very definitions of the phrases changed because of what
they learned in the program. But students did not provide examples of reprioritization,
perhaps because my study did not explicitly aim to understand the different types of
response-shift bias. It could also be that the skills in question were ones that were already
of importance to teens, as these skills relate to those discussed by Chicago Public
Schools. Future research could examine how this type of response-shift bias manifests for
teens as a means to better understand how they experience response-shift bias.
Incorporation of Objective Measures
Future studies on response-shift bias and the utilization of the retrospective
pretest/posttest design for teen programs should incorporate objective measures to
determine whether concurrent validity is greater for the traditional pretest or the
retrospective pretest. Several studies found the retrospective pretest to have greater
concurrent validity when compared with objective ratings compared to traditional pretest
scores (Howard, Ralph, Gulanic, Nance, & Gerber, 1979; Bray, Maxwell, & Howard,
1984; Martineau, 2004; Hill & Betz, 2005). ASM does not uniformly collect objective
ratings from instructors on their teens for the 21st century skills included in this study, and
therefore, I could not test whether objective measures were more highly correlated with
the traditional pretest or retrospective pretest. It is important that future research examine

160
this issue to ensure that what has been observed with an adult population is true for
adolescents.
Detecting Acquiescence in Retrospective Pretest/Posttest Design
Finally, additional research is needed to detect acquiescence in adolescents’
survey responses. Schwarz and Oyersman (2001) discussed the issue of response order
effects, or the idea that the order of the responses may influence the choice selection of a
survey respondent. These effects may occur for several reasons. First, respondents may
become fatigued if the survey is too long, the questions are too complex, or the response
choices are too long. Second, the respondent’s retrieval efforts for the current question
may be clouded by the information they had to recall for a previous question. Third,
respondents may be less motivated to answer each question diligently because they feel
they have shared enough information.
Most of the time, respondents are not motivated to engage in the full cognitive
process throughout the survey. They may begin the survey by providing high-quality
answers, but become fatigued by the end of the survey. Respondents may also complete
the survey out of compliance. Krosnick (1999) said, “respondents then face a dilemma:
They are not motivated to work hard, and the cognitive costs of hard work are
burdensome” (p. 548). In these situations, respondents adapt their response strategy in
what Krosnick calls satisficing. In weak satisficing, respondents execute all steps in the
cognitive process, but do so less rigorously, resulting in satisfactory answers rather than
accurate ones. Some respondents skip one or more of any of the following steps:
comprehension, retrieval, judgment, and response selection. In this case, a respondent
arbitrarily selects an answer. Krosnick calls this strong satisficing. Respondents offer the

161
most socially desirable answer or the most neutral answer to avoid expending the
effort to engage in the entire cognitive process. In the worst-case situation, respondents
randomly select a response. It is more common when the question is difficult or
ambiguous, respondents are encouraged to guess, or after respondents have become
fatigued.
Acquiescence is one type of response bias that results when survey respondents
satisfice when completing the survey. My study indicated that acquiescence was present,
though it was difficult to determine the extent based on the data I collected. Nearly a third
of teens responded the same way to all six items in the posttest question, and all six items
in the retrospective pretest question. Five of these students were part of the qualitative
interviews. Three of these teens revealed that they “acquiesced” by not putting forth the
cognitive effort to answer the question because they did not understand something, while
two of the students admitted they entered the program strong in those skills, so they did
not feel they changed. The problem with acquiescence is that it can overestimate program
effects. Since acquiescence is a form of satisficing, it can also underestimate program
effects because survey respondents do not apply the full cognitive process. I was unable
to determine which responses were in fact acquiescence due to survey burnout, lack of
comprehension, lack of interest, etc., and which responses were because teens did not feel
they changed on any of the skills in question. This concerns me because acquiescence
could potentially be inflating or masking the presence of response-shift bias in my
sample, making it more difficult to triangulate findings across my quantitative and
qualitative samples and make a conclusive statement about response-shift bias and how it
plays out for teens in an urban after-school program. Additional research should

162
explicitly attempt to detect acquiescence to determine the extend to which it
contributes to response-shift bias for teens.
Summary
This chapter discussed the conclusions, implications, and limitations of my study.
It also presented several areas for future research. My conclusions included:
• The results in my study were somewhat inconclusive as it relates to response-shift
bias because my results differ from some of the literature.
• Though my quantitative analysis did not indicate response-shift bias was as
prevalent as literature would indicate, my qualitative findings provided ample
evidence that response-shift bias was in fact an issue.
• My study provided evidence that interpersonal skills played a role in the existence
and degree of response-shift bias teens experienced.
• Though literature suggests that the posttest question should precede the
retrospective pretest question, doing so confuses adolescents.
• The literature focuses on the potential of the retrospective pretest/posttest design
to increase social desirability, implicit theory of change, and effort justification
bias, but I found acquiescence to be the biggest potential bias when using the
design with teens.
• Despite the fact that I cannot conclude that response-shift bias happens for all
teens across programs and skills, I can conclude that the retrospective
pretest/posttest design is a practical and useful design for evaluating youth self-
reported change.

163
• While mixed methods as a design for studying response-shift bias led to
dissonance, iterative data analysis, and some inconclusive findings, I would not
have had as deep of an understanding of response-shift bias without it.
There are implications related to these findings for ASM. I will move forward
with the retrospective pretest/posttest design at ASM and focus on making the questions
easier to understand by switching the question order and refining the question stems. I
will also standardize the survey process by providing directions to instructors, and I will
continue to conduct cognitive interviews with teens to pilot instruments before
distributing them widely. The implications for other youth serving programs are similar.
Programs seeking to use the retrospective pretest/posttest design with teens should pilot
the tools, incorporate a traditional pretest to detect response-shift bias, and incorporate
cognitive interviews as part of their pilot. They should also plan ahead to detect other
response biases.
There were both methodological and practical limitations to my study.
Methodological limitations were that I did not explicitly examine the presence and effects
of other response biases, nor did I include an objective measure of the skills to determine
which pretest more highly correlated. My practical limitations were related to not having
a standardized process for survey administration, having a longer retrospective
pretest/posttest compared to the traditional pretest, and dissonance in my quantitative and
qualitative sample based on the teens and programs in each sample. These limitations led
to several recommendations for future research on response-shift bias and using the
retrospective pretest/posttest design for teens: examining the order of the posttest and
retrospective pretest questions and how that effects response biases, detecting evidence of

164
reprioritization as a type of response-shift bias, incorporating objective measures to
determine which pretest administration has higher concurrent validity, and detecting
acquiescence in retrospective pretest/posttest designs.

165
APPENDIX A
AFTER SCHOOL MATTERS LETTER OF COOPERATION

166
After School Matters Letter of Cooperation
To Whom It May Concern: Jill Young has requested permission to collect research data from students at After School Matters for her dissertation study, titled “Retrospective Pretest/Posttest Design and Response-shift Bias in an Urban After-school Program for Teens: A Mixed Methods Study.” Jill currently serves as the director of research and evaluation. I have been informed of the purposes of the study and the nature of the research procedures. I have also been given an opportunity to ask questions about the research. As a representative of After School Matters, I am authorized to grant permission to allow Jill to administer student surveys and recruit research participants from our programs for interviews. She is also permitted to collect other administrative data. We have discussed what consents are needed for each step of data collection. If you have any questions, please contact me at 312- 239-5228. Sincerely, Mary Ellen Caron, PhD Chief Executive Officer

167
APPENDIX B
PILOT STUDY BACKGROUND AND RESULTS

168
Pilot Study Background and Results
Differences Between the Pilot and Full Implementation • The pilot phase took place in the summer 2015 session of ASM programs.
Programs run between July 6 and mid-August. • Students were selected at the program level to participate in both the quantitative
and qualitative strands in the study. The selection criteria were the same as the full implementation.
• All students in the five programs were recruited for the quantitative strand, and two students from each program were recruited for the qualitative strand (one for a cognitive interview and one for a program interview for each program).
• The traditional pretest and posttest surveys were administered via paper rather than the survey or application. The posttest and retrospective pretest questions were administered separately from the regular post-program survey for the pilot, but they were integrated into the post-program survey for the full implementation.
Implementation Challenges
• Downtown programs started before my data collection began. My timeline did not account for early start of these programs. I added another program from the central region since it is the second largest so I could include five programs.
• Programs dropped out of the study after the summer session started, so they had to be replaced. This meant that some programs completed their traditional pretest later than planned.
• The number of teens listed in the participant data base did not match the number in programs, so sample size was lower than anticipated.
• Instructors differed in how they administered the teen survey. • I spent a lot of time chasing down consent/assent forms because I didn’t have a
streamlined process for this. Also, there was no process in place to know which students returned forms, so I could not plan in advance who to select to participate.
• One program misunderstood the process and did not have any teens turn in consent/assent forms.
• I was not able to train my staff in time to have them assist in qualitative data collection in the summer, so I conducted all of them.
• I planned to conduct the program interviews after the program session ended. I was only able to get two of the five teens I needed because teens were difficult to reach. They were no longer engaged with the program and their contact information was incorrect.
• The program experience interview protocol did not work for those interviews. Teens did not understand what I was asking.
• I needed the help of my team members to introduce the project at two of the five sites.

169
Results Reliability for the traditional pretest was 0.76. For the retrospective pretest, it was 0.75, and for the posttest, it was 0.80. The power analysis revealed power to be at 0.80. There were 77 complete cases in the quantitative sample and 12 teens in the qualitative sample. Theme Quantitative Evidence Qualitative Evidence Response shift bias exists. • The average pretest
scores (M=3.97, SD=0.44) and retrospective pretest scores (M=3.82), SD=0.61) were significantly different (t=2.29, p=.025). The effect size was 0.28.
• Eight of 12 teens interviewed demonstrated examples of response shift bias.
• Teen quote: “You realize the stuff you do now that you wouldn’t know then.”
Teens understand and can answer retrospective pretest questions.
• Response rates for items the retrospective pretest questions were high; 78/79 teens answered all items).
• Five of 12 teens interviewed said answering the retrospective pretest question was not difficult.
• Teen quote: “It was easy for me. For me, I feel like I know how much I grew.”
The order of the posttest question and retrospective question confuses some teens.
• 24/77 teens retrospective pretest average was higher than their traditional pretest average.
• Lower internal consistency for the retrospective pretest scores (.748) compared to traditional pretest scores (.762).
• Six of 12 teens reported the order of the posttest question and the retrospective pretest question was confusing.
• Teen quote: “I would just like be confused because you can’t just think about now right now and then think back. It would have been like better if you had started with this question before the other one…start with where you were back then and like how you improved…because if someone like didn’t read the question right, they’d probably like, ‘oh this question again!’ They’ll probably mark the same thing.”

170
APPENDIX C
AFTER SCHOOL MATTERS PRE-SURVEY

171
After School Matters Pre-Survey
After School Matters wants to learn about your experience in your program to improve the quality of programs and the surveys we use to evaluate programs. This survey should take you approximately 20 minutes to complete. You will be asked questions about your program experience and satisfaction, your instructor, the skills you learned, and the resources you received. Please answer each question honestly. There are no right or wrong answers in this survey. Your responses will not affect your participation in After School Matters. Questions marked with an asterisk (*) are mandatory and require an answer to progress through the survey. All other questions are not required. You can skip any item that makes you feel uncomfortable. You can also stop taking the survey at any time. You will have until August 28th to respond to this survey. There are no foreseeable risks involved in participating in this survey beyond those experienced in everyday life. You may or may not benefit from participating in this survey. You may benefit from having the chance to think critically about your program experiences. The results of this research project will expand on currently available research related after-school programming and survey methods. Please note that your responses will be reported with everyone else's responses (for example, reported for all programs or by a content area). Your name, email, and birth date will not be shared with staff outside the After School Matters research and evaluation team, unless there is concern for your safety. These responses will also be used by Jill Young, director of research and evaluation at After School Matters, as part of a research project for Loyola University Chicago. You may be asked to participate in an interview based on your survey responses. If you have concerns or questions about the survey or you run into technical issues, please contact Jill Young, director of research and evaluation at [email protected]. By beginning the survey, you acknowledge that you have read this information and agree to participate in this research, with the knowledge that you are free to withdraw your participation at any time without penalty. Thank you in advance for sharing your feedback. Your opinions matter!

172
1. How much do you agree with the following statements? Please rate these items based on your skill level TODAY.
Strongly disagree Disagree Neutral Agree
Strongly agree
I know how to lead a team or group activity.
I work well with others on team/group projects.
I am good at solving problems.
I am comfortable speaking in front of a group or audience.
I get things done on time.
I am open to receiving feedback about my work.

173
APPENDIX D
AFTER SCHOOL MATTERS POST-SURVEY

174 After School Matters Post-Survey
After School Matters wants to learn about your experience in your program to improve the quality of programs and the surveys we use to evaluate programs. This survey should take you approximately 20 minutes to complete. You will be asked questions about your program experience and satisfaction, your instructor, the skills you learned, and the resources you received. Please answer each question honestly. There are no right or wrong answers in this survey. Your responses will not affect your participation in After School Matters. Questions marked with an asterisk (*) are mandatory and require an answer to progress through the survey. All other questions are not required. You can skip any item that makes you feel uncomfortable. You can also stop taking the survey at any time. You will have until December 31st to respond to this survey. There are no foreseeable risks involved in participating in this survey beyond those experienced in everyday life. You may or may not benefit from participating in this survey. You may benefit from having the chance to think critically about your program experiences. The results of this research project will expand on currently available research related after-school programming and survey methods. Please note that your responses will be reported with everyone else's responses (for example, reported for all programs or by a content area). Your name, email, and birth date will not be shared with staff outside the After School Matters research and evaluation team, unless there is concern for your safety. These responses will also be used by Jill Young, director of research and evaluation at After School Matters for her dissertation under the supervision of Leanne Kallemeyn in the Department of Education at Loyola University of Chicago. You may be asked to participate in an interview based on your survey responses. If you have run into technical issues with the survey or questions about this research, please contact Jill Young, director of research and evaluation at [email protected] or (312) 768-5202. You can also contact the faculty sponsor, Leanne Kallemeyn, for questions about the research at (847) 942-5335. If you have questions about your rights as a research participant, you may contact the Loyola University Office of Research Services at (773) 508-2689. By beginning the survey, you acknowledge that you have read this information and agree to participate in this research, with the knowledge that you are free to withdraw your participation at any time without penalty. Thank you in advance for sharing your feedback. Your opinions matter!

175 1. Please tell us about yourself.
First Name:
Last Name:
Birth Date (MM/DD/YYYY):
CPS ID (if you are a CPS student):
Survey Code:
2. What is the name of your program? Please choose from the list of programs below. Ask your instructor to make sure you are selecting the right program. 3. What is your program's content area?
Arts
Science
Sports
Tech
Communications 4. How much do you agree with the following statements about your program?
Strongly disagree Disagree Neutral Agree
Strongly agree
The work that I did in my program was interesting.
The work that I did in my program was challenging.
The work that I did in my program was important.

176 5. How much do you agree with the following statements about your program?
Strongly disagree Disagree Neutral Agree
Strongly agree
I learned something meaningful that I did not know.
I had the opportunity to help others in the community through my program.
What I learned in my program relates to what I am learning at school.
I got to meet or work with experts in the field related to my program content.
I got the opportunity to interact with teens I probably would not have met otherwise.
6. How much do you agree with the following statements about your program? This program:
Strongly disagree Disagree Neutral Agree Strongly agree
Gave me the opportunity to make career connections.
Helped me get ready for college.
Helped me decide what I want to do after I graduate.
Made me more determined to graduate from high school.
Made me more hopeful about my future.

177 7. How much do you agree with the following statements about your instructors? My instructors:
Strongly disagree Disagree Neutral Agree
Strongly agree
Are well-prepared for the program.
Start the program on time.
Are good at handling problems.
Set clear learning goals.
Are respectful.
Show concern for my well-being.
Are adults I trust.
Hold high expectations for me.
Monitor and provide feedback on my work.
Let me have input into what we do in the program.

178 8. How much do you agree with the statements below about student interaction in your program? Students in my program:
Strongly disagree Disagree Neutral Agree
Strongly agree
Treat each other with respect.
Make me feel like I belonged.
Work well together.
9. How much do you agree with these statements below about your safety?
Strongly disagree Disagree Neutral Agree
Strongly agree
I feel safe in my program. I
I worry about my safety going to and from my program. 10. How much do you agree with the following statements about your participation in After School Matters in general?
Strongly disagree Disagree Neutral Agree
Strongly agree
I would participate in After School Matters again.
I would recommend After School Matters to a friend.

179 11. Compared to when you first entered this program or internship, how would you rate yourself on the skills below?
Much
weaker Weaker No
change Stronger Much
stronger
I know how to dress appropriately for a job interview.
I understand the importance of being on time.
I know the appropriate way to handle a planned or unexcused absence from school, work, and/or my after school program.
I use appropriate language; I don't swear or use slang.

180 12. Compared to when you first entered this program or internship, how would you rate yourself on the following items?
Much
weaker Weaker No
change Stronger Much
stronger
I gained new skills in the area that my program covered (for example: art, painting, cooking, web design, etc.)
I improved my skills in the area that my program covered.
I increased my knowledge in the area that my program covered.
I was better able to demonstrate what I learned because of my participation in the program.

181 13. How much do you agree with the following statements? Please rate these items based on your skill level TODAY.
Strongly disagree Disagree Neutral Agree
Strongly agree
I know how to lead a team or group activity.
I work well with others on team/group projects.
I am good at solving problems.
I am comfortable speaking in front of a group or audience.
I get things done on time.
I am open to receiving feedback about my work.

182 14. Now, think back to when you first started the program you are currently in. How much do you agree with the following statements? Please rate these items based on your skill level on the FIRST DAY of your program.
Strongly disagree Disagree Neutral Agree
Strongly agree
I know how to lead a team or group activity.
I work well with others on team/group projects.
I am good at solving problems.
I am comfortable speaking in front of a group or audience.
I get things done on time.
I am open to receiving feedback about my work.
15. What other skills did you learn in your program?

183 16. Have you been provided or directed to use any of the following materials or activities?
Yes No
Jobs related to your program
Job applications
Interviewing skills
Resume writing
Colleges related to your program
College applications
College fair
Visiting experts
Field trips related to college or career
17. Please share any additional feedback about your After School Matters experience.

184
APPENDIX E
WAIVER OF DOCUMENTATION FOR INFORMED CONSENT

185
Waiver of Documentation for Informed Consent

186
APPENDIX F
BACKGROUND OF TEENS INTERVIEWED

187 Background of Teens Interviewed
# Pseudonym Gender Race / Ethnicity Grade
Content Area Region
Interview Type
Change Level
1 Alexander Male Hispanic 12 Arts Downtown Program Moderate 2 Bobbie Female Black 9 Science South Cognitive n/a 3 Brittany Female Black 9 Science South Program Low 4 Chelsey Female Black 10 Tech South Program High 5 David Male Black 11 Tech South Cognitive n/a 6 Debbie Female Black 11 Sports North Program Low 7 Emily Female Asian 12 Arts Downtown Cognitive Moderate 8 Fatoumata Female Black 9 Science South Cognitive n/a 9 Imani Female Black 11 Tech South Program High
10 Jackie Female Hispanic 11 Arts Downtown Cognitive High 11 Jade Female Black 12 Tech South Cognitive n/a 12 Jazmine Female Hispanic 9 Comm. Central Program Moderate 13 Karissa Female Black 9 Science South Cognitive Moderate 14 Kayla Female Black 11 Tech South Cognitive n/a 15 Kelly Female White 10 Sports North Program Moderate 16 Kyle Male Black 11 Tech South Program Moderate 17 Kylie Female Black 9 Science South Cognitive n/a 18 Lisa Female Hispanic 9 Comm. Central Cognitive Moderate 19 Maria Female Hispanic 12 Arts Downtown Program High 20 Mariah Female Black 12 Tech South Cognitive n/a 21 Marta Female White 11 Sports North Cognitive Low 22 Monique Female Black 11 Tech South Program Low 23 Nicole Female Black 12 Arts Downtown Cognitive High 24 Roman Male Hispanic 11 Arts Downtown Cognitive Low 25 Tanya Female Black 9 Science South Program High 26 Tomasz Male White 10 Sports North Cognitive Moderate 27 Victoria Female Hispanic 9 Comm. Central Program High 28 Willie Male Hispanic 11 Comm. Central Cognitive Moderate 29 Yamika Female Black 12 Arts Downtown Program Moderate 30 Zelina Female Black 9 Science South Program Moderate

188
APPENDIX G
COGNITIVE INTERVIEW PROTOCOL

189 Cognitive Interview Protocol
Researcher Name:________________________________________________________ Student Name:___________________________________________________________ Program:_______________________________________________________________ Date:_______________ Location:___________________________________________
Interview Purpose: The purpose of the interview is to understand students’ thought process in responding to the questions so we can improve the survey. You will sit with the student as he/she completes the survey and ask questions. Directions: Refer to the Interview Checklist to make sure you complete all necessary steps. Then begin by walking through the After School Matters Teen Post-survey. The questions below are potential probes. Use these throughout the cognitive interview, but make sure you spend time on questions 12 and 13 from the survey.
1. Can you repeat this question in your own words? 2. Was this question difficult to answer?
a. Why or why not? 3. What does [word or phrase] mean to you? 4. How do you remember this? 5. How did you arrive at that answer? 6. How sure are you of your answer?

190
APPENDIX H
PROGRAM EXPERIENCE INTERVIEW PROTOCOL

191 Program Experience Interview Protocol
Researcher Name:________________________________________________________ Student Name:___________________________________________________________ Program:_______________________________________________________________ Date:_______________ Location:___________________________________________ Interview Purpose: The purpose of the interview is to improve programming for students and improve the surveys we use to collect information about their experience in programs. You will use the questions below to guide the conversation, as well as the student’s scores from traditional pretest, retrospective pretest, and posttest surveys. Directions: Refer to the Interview Checklist to make sure you complete all necessary steps. Then begin by asking question 1. You do not need to stick to the order of the questions, but all of the questions must be answered by the teen. The lettered items are intended to be probes if needed.
1. Tell me about the program you just completed. a. What did you like about the program? b. What would you change?
2. Tell me about your program’s final project or performance. a. What was your role? b. How did you work with other students? c. How did you work with the instructor?
3. What kinds of skills did you learn in your program? 4. Will you use any of these skills outside of your program?
a. If yes, give me an example of how you might use these skills outside of your program.
b. If not, why? 5. We want to get a sense of what skills students gained from their ASM program,
and we are trying a few different survey questions to help us figure it out. We had students take a pretest as part of their application. [SHOW STUDENT PRETEST QUESTIONS]. Do you remember taking this?
a. Thinking back, how easy or difficult was it to rate yourself on these skills on the before you started your program?
b. How accurate do you think your ratings were? c. Why? d. Were there any words or concepts in the question you did not understand? e. Did your idea of what these words mean change at all over the course of
the program? 6. Do you remember taking another survey at the end of the program that asked you
the same questions as the pre-survey? [SHOW STUDENT POSTTEST AND RETROSPECTIVE PRETEST QUESTIONS]
a. One question asked you to rate yourself on these skills as of today, and the other asked you to think back to the beginning of the program and rate

192 yourself based on where you thought you were at the beginning of the program.
b. How easy or difficult was it to rate your beginning skill level at the end of the program?
c. How accurate do you think your ratings were? d. Why? e. Were there any words or concepts in the question you did not understand? f. Did your idea of what these words mean change at all over the course of
the program? 7. In your opinion, which set of responses you gave were more accurate – when you
rated your beginning skill level before the program started, or at the end of the program?
a. Why? 8. [SHOW STUDENT POSTTEST AND RETROSPECTIVE PRETEST
QUESTIONS]. We also want to know whether how we displayed the questions was clear or confusing. Was it easy to understand or confusing to have the question where you rate yourself today to come before the question asking you to reflect back to the beginning of the program?
a. Why?

193
APPENDIX I
INTERVIEW CHECKLIST

194 Interview Checklist
! Confirm with the instructor that the teen can be excused from the program (if
necessary).
! Ensure that room is suitable for the interview.
! Confirm and take copies of signed Informed Consent/Assent forms.
! Walk through the Informed Consent/Assent forms with the student to answer
questions and explain the process.
! Set up the digital recorder and press record when you are ready to begin the
interview.
! Take copious notes, even if the discussion does not seem relevant to the study.
! Press the stop button when the interview is complete.
! Explain to the student the payment process.
! Thank the student for his or her participation.
! Complete the Reflection Tool sheet.
! Turn in all documents and materials to Jill (the signed Informed Consent/Assent
forms, digital recordings, your typed notes, and your Reflection Tool).

195
APPENDIX J
INTERVIEW REFLECTION SHEET

196 Interview Reflection Sheet
Directions: This sheet is meant to guide you in reflecting about each of your interviews. You do not need to use the probes below for your reflection. You can use as many pages as needed. Probes:
• Describe the interview. • What did you learn? • What was surprising or interesting?
Reflection:

197
APPENDIX K
CONSENT TO PARTICIPATE IN RESEARCH: PARENTS OF PARTICIPANTS
UNDER AGE 18

198 Consent Form A
CONSENT TO PARTICIPATE IN RESEARCH PARENTS OF PARTICIPANTS UNDER AGE 18
Program and Survey Improvement Project Title: Program and Survey Improvement Researcher(s): Jill Young Faculty Sponsor: Leanne Kallemeyn Introduction: Your child is being asked to take part in a research study being conducted by Jill Young for a dissertation under the supervision of Leanne Kallemeyn in the Department of Education at Loyola University of Chicago. Your child is being asked to participate because he or she is a teen in an After School Matters program. Your child has been asked to bring this form home to you so you can discuss whether you would like your child to participate. Please read this form carefully and ask any questions you may have before deciding whether to allow your child to participate in the study. Purpose: The purpose of this study is to learn about your child’s program experiences so we can improve programs and the survey instruments we use to evaluate programs. Procedures: If you agree to allow your child to be in the study, your child will be asked to:
• Participate in an interview that will last no more than one hour. • The interview will take place at the same location as the child’s program or at the
downtown office of After School Matters. • The interview will be digitally recorded.
Risks/Benefits: There are no foreseeable risks involved in participating in this research beyond those experienced in everyday life. There are no direct benefits to your child from participation, but he or she may benefit from having the chance to think critically about his or her program experiences. The results of this research project will expand on currently available research related to after-school programming.

199 Compensation: Your child will receive a $20 check for participation in the interview after the interview is completed. Confidentiality:
• Two other members of the research and evaluation department will have access to your child’s interview information. All information shared outside this department will remain confidential. Pseudonyms will be used in all reports.
• I am a mandated reporter, so I am required by law to report child/elder abuse or neglect.
• Your child’s interview will be digital recorded. All interviews will be transcribed within 90 days of the interview. Recordings will then be erased. The transcriptions will include a pseudonym, not your child’s actual name. The transcriptions will be stored on a password-protected computer, and backups will be stored on the After School Matters One Drive.
Voluntary Participation: Participation in this study is voluntary. If you do not want your child to be in this study, he or she does not have to participate. Your child may still decide not to participate even if you provide your permission. If your child does decide to participate, he or she is free not to answer any question or to withdraw from participation at any time without penalty. Your decision to allow your child to participate will have no effect on his or her participation in After School Matters programs. Contacts and Questions: If you have questions about this research, contact Jill Young at 312-768-5202 or the faculty sponsor, Leanne Kallemeyn, at (847) 942-5335. If you have questions about your child’s rights as a research participant, you may contact the Loyola University Office of Research Services at (773) 508-2689. Statement of Consent: Your signature below indicates that you have read the information provided above, have had an opportunity to ask questions, and agree to participate in this research study. Return your signed copy of this form and your child’s assent form to Jill Young. You can return your forms to Jill by giving them to your child to give to his or her instructor, scanning and emailing your forms to [email protected], and mailing or dropping off your signed forms at the address below: Jill Young After School Matters 66 E. Randolph St. Chicago, IL 60601 You will be given a copy of this form to keep for your records.

200 ____________________________________________ __________________ Child Name (please print) Date ____________________________________________ __________________ Parent Signature Date ____________________________________________ ___________________ Researcher’s Signature Date

201
APPENDIX L
CONSENT TO PARTICIPATE IN RESEARCH: PARTICIPANTS 18+

202 Consent Form B
CONSENT TO PARTICIPATE IN RESEARCH
PARTICIPANTS 18+ Program and Survey Improvement
Project Title: Program and Survey Improvement Researcher(s): Jill Young Faculty Sponsor: Leanne Kallemeyn Introduction: You are being asked to take part in a research study being conducted by Jill Young for a dissertation under the supervision of Leanne Kallemeyn in the Department of Education at Loyola University of Chicago. You are being asked to participate because you are a teen in an After School Matters program. Please read this form carefully and ask any questions you may have before deciding whether to participate in the study. Purpose: The purpose of this study is to learn about your program experiences so we can improve programs and the survey instruments we use to evaluate programs. Procedures: If you agree to be in the study, you will be asked to:
• Participate in an interview that will last no more than one hour. • The interview will take place at the same location as your program or at the
downtown office of After School Matters. • The interview will be digitally recorded.
Risks/Benefits: There are no foreseeable risks involved in participating in this research beyond those experienced in everyday life. There are no direct benefits to you from participation, but you may benefit from having the chance to think critically about your program experiences. The results of this research project will expand on currently available research related to after-school programming. Compensation: You will receive a $20 check for your participation in the interview after the interview is completed.

203 Confidentiality:
• Two other members of the research and evaluation department will have access to your interview information. All information shared outside this department will remain confidential. Pseudonyms will be used in all reports.
• I am a mandated reporter, so I am required by law to report child/elder abuse or neglect.
• Your interview will be digital recorded. All interviews will be transcribed within 90 days of the interview. Recordings will then be erased. The transcriptions will include a pseudonym, not your actual name. The transcriptions will be stored on a password-protected computer, and backups will be stored on the After School Matters One Drive.
Voluntary Participation: Participation in this study is voluntary. If you do not want to be in this study, you do not have to participate. Even if you decide to participate, you are free not to answer any question or to withdraw from participation at any time without penalty. Your decision to participate will have no effect on your participation in After School Matters programs. Contacts and Questions: If you have questions about this research, contact Jill Young at 312-768-5202 or the faculty sponsor, Leanne Kallemeyn, at (847) 942-5335. If you have questions about your rights as a research participant, you may contact the Loyola University Office of Research Services at (773) 508-2689. Statement of Consent: Your signature below indicates that you have read the information provided above, have had an opportunity to ask questions, and agree to participate in this research study. Return your signed copy of this form to Jill Young. You can return your form to Jill by giving it to your instructor, scanning and emailing your form to [email protected], or giving the form to Jill when she visits your program the last week in July. You can also mail your signed form or drop it off at the address below: Jill Young After School Matters 66 E. Randolph St. Chicago, IL 60601 You will be given a copy of this form to keep for your records.

204 ____________________________________________ __________________ Participant Name (please print) Date ____________________________________________ __________________ Participant Signature Date ____________________________________________ ___________________ Researcher’s Signature Date

205
APPENDIX M
ASSENT TO PARTICIPATE IN RESEARCH: PARTICIPANTS UNDER AGE 18

206 Assent Form
ASSENT TO PARTICIPATE IN RESEARCH
PARTICIPANTS UNDER AGE 18 Program and Survey Improvement
Project Title: Program and Survey Improvement Researcher(s): Jill Young Faculty Sponsor: Leanne Kallemeyn Introduction: You are being asked to take part in a research study being conducted by Jill Young for a dissertation under the supervision of Leanne Kallemeyn in the Department of Education at Loyola University of Chicago. You are being asked to participate because you are a teen in an After School Matters program. Please bring this form and the parental consent form home to discuss this research with your parents. Please read this form carefully and ask any questions you may have before deciding whether to participate in the study. Purpose: The purpose of this study is to learn about your program experiences so we can improve programs and the survey instruments we use to evaluate programs. Procedures: If you agree to be in the study, you will be asked to:
• Participate in an interview that will last no more than one hour. • The interview will take place at the same location as your program or at the
downtown office of After School Matters. • The interview will be digitally recorded.
Risks/Benefits: There are no known risks involved in participating in this research beyond those experienced in everyday life. There are no direct benefits to you from participation, but you may benefit from having the chance to think about your program experiences. The results of this research project will expand on currently available research related to after-school programming. Compensation: You will receive a $20 check for your participation in the interview after the interview is completed.

207 Confidentiality:
• Two other members of the research and evaluation department will have access to your interview information. All information shared outside this department will remain confidential. We will not use your real name in any reports.
• I am a mandated reporter, so I am required by law to report child/elder abuse or neglect.
• Your interview will be digital recorded. We will type up notes from the interview within 90 days of the interview. Recordings will then be erased. The typed notes from the interview will not include your actual name. The typed notes will be stored on a password-protected computer, and backups will be stored on the After School Matters One Drive.
Voluntary Participation: Participation in this study is voluntary. If you do not want to be in this study, you do not have to participate. Even if you decide to participate, you are free not to answer any question or to withdraw from participation at any time without penalty. Your decision to participate will have no effect on your participation in After School Matters programs. Contacts and Questions: If you have questions about this research, contact Jill Young at 312-768-5202 or the faculty sponsor, Leanne Kallemeyn, at (847) 942-5335. If you have questions about your rights as a research participant, you may contact the Loyola University Office of Research Services at (773) 508-2689. Statement of Consent: Your signature below indicates that you have read the information provided above, have had an opportunity to ask questions, and agree to participate in this research study. Return your signed copy of this form as well as your parent’s signed consent form to Jill Young. You can return your form to Jill by giving it to your instructor, scanning and emailing your form to [email protected], or giving the form to Jill when she visits your program the last week in July. You can also mail your signed form or drop it off at the address below: Jill Young After School Matters 66 E. Randolph St. Chicago, IL 60601 You will be given a copy of this form to keep for your records.

208 ____________________________________________ __________________ Participant Name (please print) Date ____________________________________________ __________________ Participant Signature Date ____________________________________________ ___________________ Researcher’s Signature Date

209
APPENDIX N
RECRUITMENT SCRIPT

210 Recruitment Script
Program and Survey Improvement
1. My name is ________, and I am the ____________ at After School Matters. 2. We are asking you to take part in a research study because you are a teen in After
School Matters programming. This interview is part of a research study being conducted by Jill Young, the director of research and evaluation at After School Matters and a graduate student at Loyola University Chicago.
3. If you agree to be in this study, you may be asked to participate in an interview to
discuss your program experiences and give us feedback on our teen survey. 4. There are no foreseeable risks involved in participating in this research beyond those
experienced in everyday life. 5. You may or may not benefit from participating in this project. You may benefit from
the opportunity to reflect on your program experiences. 6. Please talk this over with your parents before you decide whether or not to
participate. We will also ask your parents to give their permission for you to take part in this study. But even if your parents say “yes,” you can still decide not to do this.
7. If you do not want to be in this study, you do not have to participate. Remember,
being in this study is up to you and no one will be upset if you do want to participate or even if you change your mind later and want to stop. It will not affect your participation in other After School Matters programs.
8. Your name and information will be confidential. I will digitally record the interview
and transcribe the interview within 90 days of the interview. At that point, I will erase the digital recording. All transcriptions will be saved on password-protected computer and backed up on the After School Matters system. Your name will not show up in any reports or transcriptions.
9. You can ask any questions that you have about the study. If you have questions about
this research, feel free to contact Jill Young at 312-768-5202 or the faculty sponsor, Leanne Kallemeyn, at (847) 942-5335. If you have questions about your rights as a research participant, you may contact the Loyola University Office of Research Services at (773) 508-2689.
10. Signing your name at the bottom means that you agree to be in this study. You and
your parents will be given a copy of this form after you have signed it.

211 ________________________________________ ____________________ Name of Subject Date Signature Age Grade in School

212
APPENDIX O
REGRESSION ANALYSIS RESULTS

213 Regression Analysis Results
Model
Unstandardized Coefficients
Standardized Coefficients
t Sig. B Std.
Error Beta (Constant) 1.562 0.254 6.156 0.000 Student Hours Attended 0.002 0.002 0.022 1.192 0.233 The work that I did in my program was interesting -0.026 0.031 -0.021 -0.813 0.416 The work that I did in my program was challenging 0.003 0.018 0.003 0.145 0.885 The work that I did in my program was important -0.023 0.029 -0.02 -0.786 0.432 I learned something meaningful that I did not know 0.02 0.027 0.017 0.738 0.460 I had the opportunity to help others in the community through my program -0.065 0.021 -0.067 -3.028 0.002 What I learned in my program relates to what I am learning at school -0.025 0.018 -0.029 -1.347 0.178 I got to meet or work with experts in the field related to my program content -0.009 0.022 -0.009 -0.414 0.679 I got the opportunity to interact with teens I probably would not have met otherwise 0.091 0.026 0.078 3.478 0.001 This program gave me the opportunity to make career connections -0.029 0.026 -0.028 -1.128 0.260 This program helped me get ready for college 0.014 0.025 0.015 0.543 0.587 This program helped me decide what I want to do after I graduate -0.025 0.024 -0.028 -1.074 0.283 This program made me more determined to graduate from high school -0.019 0.026 -0.02 -0.731 0.465 This program made me more hopeful about my future 0.001 0.029 0.001 0.022 0.982

214
Model
Unstandardized Coefficients
Standardized Coefficients
t Sig. B Std.
Error Beta My instructors are well prepared for the program 0.033 0.039 0.026 0.852 0.394 My instructors start the program on time 0.011 0.034 0.009 0.319 0.749 My instructors are good at handling problems 0.007 0.038 0.006 0.191 0.849 My instructors set clear learning goals -0.037 0.04 -0.03 -0.941 0.347 My instructors are respectful 0.078 0.041 0.06 1.886 0.059 My instructors show concern for my well being -0.013 0.042 -0.01 -0.296 0.767 My instructors are adults I trust -0.032 0.036 -0.027 -0.870 0.384 My instructors hold high expectations for me 0.024 0.038 0.02 0.632 0.527 My instructors monitor and provide feedback on my work -0.055 0.041 -0.042 -1.334 0.182 My instructors let me have input into what we do in the program -0.091 0.033 -0.077 -2.758 0.006 Students in the program treat each other with respect -0.094 0.032 -0.084 -2.920 0.004 Students in this program make me feel like I belonged -0.052 0.034 -0.046 -1.543 0.123 Students in my program work well together -0.074 0.033 -0.066 -2.242 0.025 I feel safe in my program -0.022 0.034 -0.017 -0.669 0.504 I would participate in ASMagain 0.029 0.035 0.024 0.849 0.396 I would recommend ASM to a friend -0.087 0.038 -0.067 -2.284 0.022

215
Model
Unstandardized Coefficients
Standardized Coefficients
t Sig. B Std.
Error Beta Female 0.024 0.035 0.012 0.689 0.491 Black/African-American -0.059 0.054 -0.031 -1.093 0.275 Hispanic/Latino -0.039 0.058 -0.02 -0.681 0.496 Lower-classmen (9th and 10th graders) 0.018 0.035 0.009 0.513 0.608 Pre-apprenticeship 0.196 0.105 0.035 1.874 0.061 Advanced Apprenticeship 0.125 0.051 0.044 2.433 0.015 Program Count -0.009 0.012 -0.018 -0.739 0.460 Science Program -0.054 0.058 -0.017 -0.935 0.350 Sports Program -0.002 0.049 -0.001 -0.035 0.972 Tech Program 0.024 0.049 0.009 0.483 0.629 Words Program -0.04 0.083 -0.009 -0.484 0.629 Returning Teen 0.026 0.045 0.014 0.589 0.556 Safe Environment Domain Avg 0.019 0.042 0.009 0.445 0.656 Supportive Environment Domain Avg 0.048 0.04 0.028 1.201 0.230 Interaction Domain Avg 0.026 0.026 0.023 0.993 0.321 Engagement Domain Avg -0.025 0.019 -0.029 -1.281 0.200

216
REFERENCE LIST Aiken, L.S. and West, S.G. (1990). Invalidity of true experiments: Self-report pretest
biases. Evaluation Review 14, p. 374-390. doi: 10.1177/0193841X9001400403 Allen, J.M. and Nimon, K. (2007). Retrospective pretest: A Practical technique for
professional development evaluation. Journal of Industrial Teacher Education, 44(3), p. 27-42. Retrieved from http://scholar.lib.vt.edu/ejournals/JITE/
American Youth Policy Forum. (2016). The Intersection of after-school and competency-
based learning: Emerging trends, policy considerations, and questions for the future. Retrieved from http://www.aypf.org/wp-content/uploads/2016/01/AS.CBL-Paper-FINAL-1.6.pdf
Azzam, T. (2010). Evaluator responsiveness to stakeholders. American Journal of
Evaluation, 31(1), p. 45-65. doi: 10.1177/1098214009354917 Azzam, T. (2011). Evaluator characteristics and methodological choice. American
Journal of Evaluation, 32(3), p. 376-391. doi 10.1177/1098214011399416 Bamberger, M., Rugh, J., Church, M., & Fort, L. (2004). Shoestring evaluation:
Designing impact evaluations under budget, time and data constraints. American Journal of Evaluation, 25(1), p. 5-37. doi: 10.1177/109821400402500102
Benzies, K., Clarke, D., Barker, L, and Mychasiuk, R. (2012). UpStart parent survey: A
New psychometrically valid tool for the evaluation of prevention-focused parenting programs. Maternity and Child Health Journal, 17, p. 1452-1458. doi: 10.1007/s10995-012-1152-2
Bhanji, F., Gottesman, R., de Grave, W., Steinert, Y. Winer, L.R. (2012). The
Retrospective pre-post: A Practical method to evaluate learning from an educational program. Academic Emergency Medicine, 19(2), p. 189-194. doi: 10.1111 /j.1553-271 2.2011.01270.
Borgers, N. and Hox, J. (2004). Response effects in surveys on children and adolescents:
The Effect of number of response options, negative wording, and neutral mid-point. Quality & Quantity, 38, p. 17-33.

217 Bray, J.H., Maxwell, S.E., and Howard, G.S. (1984). Methods of analysis with
response shift bias. Educational and Psychological Measurement, 44, p. 781-804. doi: 10.1177/0013164484444002
The Buck Institute for Education. What is Project Based Learning (PBL)? (n.d.).
Retrieved December 29, 2015, from http://bie.org/ The Buck Institute for Education. Why Project Based Learning (PBL)? (n.d.). Retrieved
December 29, 2015, from http://bie.org/ Campbell, D.T. and Stanley, J.C. (1963). Experimental and quasi-experimental designs
for research on teaching. In N.L. Gage (ed.), Handbook of research on teaching. Chicago, IL: Rand McNally.
Cantrell, P. (2003). Traditional vs. retrospective pretests for measuring science teaching
efficacy beliefs in preservice teachers. School Science and Mathematics, 103(4), p. 177-185. Retrieved from http://www.ssma.org/publications
Center for Disease Control. (2008). Data collection methods for program evaluation:
Questionnaires. Evaluation Briefs, 14, p. 1-2. Retrieved from http://www.cdc.gov/healthyyouth/evaluation/pdf/brief14.pdf
Christie, C.A. and Fleischer, D.N. (2010). Insight into evaluation practice: A Content
analysis of designs and methods used in evaluation studies published in North American evaluation-focused journals. American Journal of Evaluation, 31(3), p. 326-346. doi: 10.1177/1098214010369170
Cronbach, L. J., and Furby, L. (1970). How we should measure "change": Or should we?
Psychological Bulletin, 7(4), p. 68-80. Retrieved from http://www.apa.org/pubs/journals/bul/
Clapp, J.D., Holmes, M.R., Reed, M.B, Shillington, A.M., Freisthler, B., and Lange, J.E.
(2007). Measuring college students’ alcohol consumption in natural drinking environments: Field methodologies for bars and parties. Evaluation Review 31, p 469-489. doi: 10.1177/0193841X07303582
Colosi, L. and Dunifon, R. (2006). What’s the difference? “Post then pre” and “pre then
post.” Retrieved from http://www.human.cornell.edu/pam/outreach/parenting/research/upload/What-s-20the-20Difference-20Post-20then-20Pre-20and-20Pre-20then-20Post.pdf.
Corporate Voices for Working Families. (2008). Tomorrow’s workforce: Ready or
not. It’s a choice the business community must make now. Retrieved from http://www.readyby21.org/sites/default/files/2008WorkforceReadiness-ReadyorNot.pdf.

218 D’Eon, M.F. and Trinder, K. (2014). Evidence for the validity of grouped self-
assessments in measuring the outcomes of education programs. Evaluation and the Health Professions, 37(4), p. 457-469. doi: 10.1177/0163278713475868
Deutsch, M. and M. E. Collins (1951) Interracial Housing: A Psychological Evaluation of
a Social Experiment. Minneapolis: Univ. of Minnesota Press. Educational Policy Improvement Center. (n.d.). The Definition: Understanding college
and career readiness. Retrieved from http://www.epiconline.org/Issues/college-career-readiness/definition.dot.
Finney, H.C. (1981). Improving the reliability of retrospective survey measures: Results
of a longitudinal field survey. Evaluation Review 5, p. 207-229. doi: 10.1177/0193841X8100500204
Forum for Youth Investment. (2010). Readiness: The Nation focuses on college and
career preparations. The School Administrator, 6(67). Retrieved from http://www.forumfyi.org/files/School%20Administrator%20Article%206-10.pdf
Furr, R.M. and Bacharach, V.R. (2014). Psychometrics: An Introduction. Thousand
Oaks, CA: Sage Publications. Hatry, H. (1997). Where the rubber meets the road: Performance measurement for state
and local public agencies. New Directions for Evaluation, 75, p. 31–44. doi: 10.1002/ev.1078
Hess, J., Rothgeb, J.M., and Zukerberg, A., LeMinistrel, S., and Moore, K. (1998). Teens
talk: Are adolescents willing and able to answer survey questions? Paper presented at the annual meeting of the American Association of Public Opinion Quarterly in St. Louis. Retrieved from http://www.amstat.org/sections/srms/onlineproceedings
Hill, L.G. and Betz, D.L. (2005). Revisiting the retrospective pretest. American Journal
of Evaluation 26, p. 501-507. doi: 10.1177/1098214005281356 Hoogstraten, J. (1982). The retrospective pre-test in an educational training context.
Journal of Experimental Education, 50(4), p. 200-204. Retrieved from http://www.jstor.org/stable/20151460
Howard, G.S, Ralph, K.M., Gulanick, N.A., Maxwell, S.E., Nance, D.W., and
Gerber, S.K. (1979). Internal validity in pretest-posttest self-report evaluations and a re-evaluation of retrospective pretests. Applied Psychological Measurement 3, p. 1-23. doi: 10.1177/014662167900300101

219 Howard, G.S., Schmeck, R.R, and Bray, J.H. (1979). Internal validity studies
employing self-report instruments: A Suggested remedy. Journal of Educational Measurement 16, p. 129-135. Retrieved from http://www.jstor.org/stable/1434456
Howard, G.S. (1980). Response shift-bias: A Problem in evaluating programs with
pre/post self-reports. Evaluation Review 4, p. 93-106. doi: 10.1177/0193841X8000400105
Howell, D.C. (2010). Statistical methods for psychology. Belmont, CA: Wadsworth,
Cengage Learning. Kanter, J. and Browhawn, K. (2014). Evaluation findings from Frontiers in Urban
Science Exploration (FUSE) National Expansion Program: Year four. The After School Collaboration. Retrieved from http://www.tascorp.org/sites/default/files/frontiers_urban_science_education_evaluation.pdf
Klatt, J. and Taylor-Powell, E. (2005a). Using the retrospective post-then-pre design,
quick tips #27. Program Development and Evaluation. Madison, WI: University of Wisconsin-Extension.
Krosnick, J.A. (1999). Survey research. Annual Review of Psychology, 50(1), p. 537-567.
Retrieved from: http://www.annualreviews.org/journal/psych Krosnick, J.A. and Fabrigar, L.R. (1997). Designing rating scales for effective
measurement in surveys. In Lyberg, L., Biermer, P., Collins, M., de Leeuw, E., Dippo, C., Schwarz, N., and Trewin, D. Survey measurement and process quality (p. 141-164). New York: Wiley.
Lam, T.C.M. and Bengo, P. (2003). A Comparison of three retrospective self-reporting
methods of measuring change in instructional practice. American Journal of Evaluation 24, p. 65-80. doi: 10.1177/109821400302400106
Lamb, T. (2005). The Retrospective pre-test: An Imperfect but useful tool. The
Evaluation Exchange 11(2), p. 18. Retrieved from http://www.hfrp.org/var/hfrp/storage/original/application/d6517d4c8da2c9f1fb3dffe3e8b68ce4.pdf
de Leeuw, E.D. (2011). Improving data quality when surveying children and
adolescents: Cognitive and social development and its role in questionnaire construction and pretesting. Report to the Annual Meeting of the Academy of Finland: Research Programs Public Health Challenges and Welfare of Children and Young People May 10-12 2011 in Finland.

220 de Leeuw, E.D., and Otter, M.E. (1995). The Reliability of children’s responses to
questionnaire items; question effects in children questionnaire data. In J.J. Hox, B.F. van der Meulen, J.M.A.M. Janssens, J.J.F. ter Laak, and L.W.C. Tavecchio. Advances in family research (p. 251-258). Amsterdam: Thesis Publishers.
Mathei, R.J. (2007). The Response-shift bias in a counselor education programme. British
Journal of Guidance and Counseling, 25(2), p. 229-237. doi: 10.1080/03069889708253804
Merriam, Sharan B. (2009). Qualitative Research. (3rd ed.). San Francisco, CA:
Jossey-Bass. Mertens, D.M. (2010). Research and evaluation in education and psychology:
Integrating diversity with quantitative, qualitative, and mixed methods. Thousand Oaks, CA: Sage.
Moore, D. and Tananis, C.A. (2009). Measuring change in a short-term educational
program using a retrospective pretest design. American Evaluation Association 30(2), p. 189-202. doi: 10.1177/1098214009334506
Newcomer, K. (1997). Using performance measurement to improve public and non-profit
programs. New Directions for Evaluation, 75, p. 5–14. doi:10.1002/ev.1076 Nimon, K., Zigarmi, D., and Allen, J. (2011). Measures of program effectiveness based
on retrospective pretest data: Are all created equal? American Journal of Evaluation 32(1), p. 8-28. doi: 10.1177/1098214010378354
Paul, G. L. (1969). Chronic mental patient: current status and future directions.
Psychological Bulletin, 71, p. 81-94. Retrieved from http://www.apa.org/pubs/journals/bul/
Pelfrey, W.V. Sr. and Pelfrey, W.V. Jr. (2009). Curriculum evaluation and revision in a
nascent field: The Utility of the retrospective pretest-posttest model in a homeland security program of study. Evaluation Review 33, p. 54-82. doi: 10.1177/0193841X08327578
Reed, E. and Morariu, J. (2010). State of evaluation: Evaluation practice and capacity in
the nonprofit sector. Retrieved from http://www.innonet.org/client_docs/innonet-state-of-evaluation-2010.pdf
Ross, M. (1989). Relation of implicit theories to the construction of personal histories. Psychological Review, 96(2), p. 341-357. Retrieved from http://www.apa.org/pubs/journals/rev/

221 Schwarz, N. (1999). Self-reports: How the questions shape the answers. American
Psychologist, 54(2), p. 93-105. Retrieved from http://www.apa.org/pubs/journals/amp/
Schwarz, N. (2007). Cognitive aspects of survey methodology. Applied Cognitive
Psychology 21, p. 277-287. Schwarz, N. and Oyserman, D. (2001). Asking questions about behavior: Cognition,
communication, and questionnaire construction. American Journal of Evaluation, 22(2), p. 127-160. doi: 10.1177/109821400102200202
Sears, R. R., Maccoby, E. E., and H. Levin. (1957). Patterns of Child Rearing.
Evanston, IL: Row, Peterson. Shadish, W.R, Cook, T.D, and Campbell, D.T. (2002). Experimental and quasi-
experimental designs for generalized causal inference. Boston, MA: Houghton Mifflin.
Sprangers, M., and Hoogstraten, J. (1989). Pretesting effects in retrospective pretest-
posttest designs. Journal of Applied Psychology, 74(2), 265-272. Retrieved from http://www.apa.org/pubs/journals/apl/
Sprangers, M., and Schwartz, C.E. (1999). Integrating response shift into health-
related quality of life research: A theoretical model. Social Science and Medicine, 48(11), p. 1507–1515. Retrieved from http://www.journals.elsevier.com/social-science-and-medicine/
Taylor, P.J., Russ-Eft, D.F., and Taylor, H. (2009) Gilding the outcome by tarnishing the
past: Inflationary biases in retrospective pretest. American Journal of Evaluation, 30, p. 31-34. doi: 10.1177/1098214008328517
Teddlie, C. & Tashakkori, A. (2009). Foundation of mixed methods research:
Integrating quantitative and qualitative approaches to the social and behavior sciences. Thousand Oaks, CA: Sage.
Terborg, J.R. and Davis, G.A. (1982). Evaluation of a new method for assessing change
to planned job redesign as applied to Hackman and Oldham’s job characteristic model. Organizational Behavior and Human Performance, 29, p. 112-128. Retrieved from http://www.sciencedirect.com/science/journal/00305073
Walk, R. D. (1956). Self-ratings of fear in a fear-invoking situation. Journal of
Abnormal and Social Psychology, 52, p. 171-178. Retrieved from http://www.apa.org/pubs/journals/abn/

222
VITA
Jill Young grew up in Portage, Indiana. Before attending Loyola University
Chicago, she attended Drake University in Des Moines Iowa, where she earned a
Bachelor of Arts in Journalism and Mass Communication and graduated with honors in
2006. She earned her master of arts in research methodology from Loyola University
Chicago in 2013.
From 2006 to 2008, Dr. Young worked as a market research analyst for
Deborah’s Place, the largest provider of supportive housing and services for homeless
women in Chicago. She worked at University of Chicago as an analyst from 2008 to
2010, and then served as the research data manager at Northwestern University for an
evaluation on programs serving children with serious emotional issues and their families
until 2011.
Since 2011, Dr. Young has worked at After School Matters, which offers out-of-
school-time programming to Chicago teens. She currently serves as the senior director of
research and evaluation, and she lives in Chicago, Illinois.