retrieval of sulfur dioxide from a ground-based thermal ... · retrieval of sulfur dioxide from a...
TRANSCRIPT

Atmos. Meas. Tech., 7, 2807–2828, 2014www.atmos-meas-tech.net/7/2807/2014/doi:10.5194/amt-7-2807-2014© Author(s) 2014. CC Attribution 3.0 License.
Retrieval of sulfur dioxide from a ground-based thermalinfrared imaging cameraA. J. Prata and C. Bernardo
Nicarnica Aviation AS, Kjeller, Norway
Correspondence to:A. J. Prata ([email protected])
Received: 16 September 2013 – Published in Atmos. Meas. Tech. Discuss.: 7 February 2014Revised: 26 June 2014 – Accepted: 16 July 2014 – Published: 3 September 2014
Abstract. Recent advances in uncooled detector technologynow offer the possibility of using relatively inexpensive ther-mal (7 to 14 µm) imaging devices as tools for studying andquantifying the behaviour of hazardous gases and particu-lates in atmospheric plumes. An experimental fast-sampling(60 Hz) ground-based uncooled thermal imager (Cyclops),operating with four spectral channels at central wavelengthsof 8.6, 10, 11 and 12 µm and one broadband channel (7–14 µm) has been tested at several volcanoes and at an indus-trial site, where SO2 was a major constituent of the plumes.This paper presents new algorithms, which include atmo-spheric corrections to the data and better calibrations to showthat SO2 slant column density can be reliably detected andquantified. Our results indicate that it is relatively easy toidentify and discriminate SO2 in plumes, but more challeng-ing to quantify the column densities. A full description ofthe retrieval algorithms, illustrative results and a detailed er-ror analysis are provided. The noise-equivalent temperaturedifference (NE1T ) of the spectral channels, a fundamentalmeasure of the quality of the measurements, lies between 0.4and 0.8 K, resulting in slant column density errors of 20 %.Frame averaging and improved NE1T ’s can reduce this er-ror to less than 10 %, making a stand-off, day or night opera-tion of an instrument of this type very practical for both mon-itoring industrial SO2 emissions and for SO2 column den-sities and emission measurements at active volcanoes. Theimaging camera system may also be used to study thermalradiation from meteorological clouds and the atmosphere.
1 Introduction
The thermal infrared (3 to 15 µm) region of the electromag-netic spectrum contains several sub-regions which can beexploited for studying atmospheric gases (e.g.Esler et al.,2000). Notable among these are the window regions between3 and 4 µm, which is often referred to as the mid-infrared(MIR), and 7 and 14 µm, which is referred to as the thermalinfrared (TIR). The MIR is used for identifying “hot spots”,localised regions of anomalously hot pixels in satellite mea-surements (Wright et al., 2004). The MIR can also be usedfrom the ground or on airborne platforms to image the heatfrom forest fires (Lentile et al., 2006) or hot gases risingfrom volcanic vents (Francis et al., 1995) and to map tem-peratures in plumes (Sawyer and Burton, 2006) and on lavafields (Realmuto et al., 1992). The TIR has been used lessfrequently to study volcanic processes. This is largely dueto the fact that sensitivity in this region peaks at terrestrialtemperatures of 300 K, much lower than the temperature of atypical “hot spot” or volcanic heat source, and because, untilrecently, thermal imagers operating in the TIR required ex-pensive active detector-cooling systems (nitrogen Dewars orStirling cycle coolers) to achieve good signal-to-noise perfor-mance (Derniak and Boremann, 1996). TIR instruments onsatellites do use active cooling systems and in these cases theimage data are used to monitor volcanic eruption clouds anddiscriminate them from meteorological clouds for aviationhazard warnings and for gas measurements (Prata, 2009).Pugnaghi et al.(2002) used the Multi-spectral Infrared andVisible Imaging Spectrometer (MIVIS) on board an aircraftto map the SO2 emissions from Etna. Their algorithm wasbased on a split-window formulation using channels centredat 8.74 and 9.56 µm to eliminate the effects of water vapour
Published by Copernicus Publications on behalf of the European Geosciences Union.

2808 A. J. Prata and C. Bernardo: A ground-based thermal camera
and determine SO2 abundance. Realmuto et al. (1994, 1997)showed that SO2 could be determined from the multi-channelTIR imager Advanced Spaceborne Thermal Emission AndReflection Radiometer (ASTER), on board the Earth Observ-ing System (EOS) Terra satellite, by using detailed radiativetransfer calculations to account for water vapour and surfaceemissivity variations.
All of the studies described above have used passive ther-mal sensing, relying on emission or absorption by the gasto provide a signal to measure. Measurements can also bemade in absorption mode by using the Sun as a source orby providing an artificial source of radiation (typically a glo-bar and retroreflector). In these applications single field-of-view (FoV), medium-spectral-resolution (6–0.5 cm−1) inter-ferometers are used to gather quantitative information onmultiple gas species simultaneously. Fourier-transform in-terferometers (FT-IRs) have become a very valuable devicefor volcanic gas studies (Love et al., 1998; Oppenheimeret al., 1998; Burton et al., 2000; Horrocks, 2001), includingmeasurements of gas ratios reported byOppenheimer et al.(2002). Systems using ultraviolet light as a source have re-cently been developed for volcanic SO2 measurements (Mc-Gonigle, 2005; Horton et al., 2006), for volcanic BrO mea-surements (Bobrowski et al., 2003), and also for CO2 slant-path columns (Goff et al., 2001). More recentlyStremmeet al. (2013) andKrueger et al.(2013) presented measure-ments of volcanic emissions using a scanning FT-IR, show-ing two-dimensional visualisations of SO2 based on thermalemission spectroscopy.Kinoshita et al.(2003) used a ground-based CCD imager together with a near-infrared filter tostudy volcanic plumes, but they did not attempt a quantita-tive retrieval of the gases or particulates.Notsu et al.(2003)demonstrated the feasibility of using the 8.6 µm wavebandfor the measurement of volcanic SO2 slant column densityusing a portable spectral infrared radiometer.
This paper presents the first detailed study of the use ofa ground-based, uncooled thermal imaging microbolometerradiometer to detect and quantify SO2 gas from volcanicand industrial sources. The intention for this work was todevelop a multi-filter TIR imaging camera capable of sens-ing gases and particles, principally for applications in vol-canology. The details concerning the methods for detectingvolcanic ash particles have been provided in a separate pa-per (Prata and Bernardo, 2009); here we concentrate on theSO2 gas retrieval methodology. The capability to acquire fre-quent, real-time images from a fixed platform (e.g. located ata volcanological observatory near to an active volcano, orduring a field deployment) day or night offers a practical andsafe tool for understanding some aspects of volcanic activity.
The organisation of the paper is as follows: we brieflydescribe the principal characteristics of uncooled mi-crobolometer thermal imaging devices and then show howsuch cameras can be adapted for use in detecting and quan-tifying SO2 gas emissions. The design of the camera systemis described, and the basic theory presented, for SO2 slant
column density (hereafter referred to as SCD) retrieval andthen illustrated by showing how SO2 emissions from an in-dustrial stack can be derived. This is followed by a detailederror analysis of the retrieval scheme. Measurements madeat two volcanoes, Etna (Sicily, Italy) and Stromboli (Aeo-lian Islands, Italy), are provided to show how estimates ofvolcanic SO2 emission rates can be estimated. We concludewith comments on how this technology might be improvedby integrating it with other remote sensing instruments, forexample ultraviolet (UV) spectrometers, and used for quan-titative studies of volcanic emissions, for detecting hazardsfrom an airborne platform, and for alerting authorities of vol-canic activity during the day and night for hazard warnings.
2 Thermal imagers
In the last 10–15 years great advances have been made inmanufacturing bolometers of high sensitivity (Kruse, 2001).The detectivity of these devices is background-limited, andthey are often referred to as background-limited infrared pho-todetectors (BLIP) devices. The use of silicon semiconduc-tors (silicon nitride substrate with vanadium oxide detect-ing material) for manufacturing arrays of bolometric detec-tors has greatly reduced the cost of the production of ther-mal imaging cameras. These microbolometers, typically con-sisting of 104–106 elements, are sensitive to radiation inthe wavelength range of 7–14 µm and operate at 30–60 Hz(Kruse, 2001). Thermal cameras are commercially availablewith temperature sensitivities of∼ 50 mK (7–14 µm), arraysizes of 320× 240 pixels (or larger), F1.0 optics and 60 Hzoperation. Thus, in principle, a camera of this kind can ac-quire images showing temperature changes of less than 0.1 Kat a rate of tens of frames per second. In practice this is diffi-cult to achieve because of the presence of noise (1/f , back-ground and internal temperature fluctuations and Johnsonnoise), non-uniformity of the array, the need for calibration,and frame integration. Other factors may also limit achiev-ing the ideal image capture rate: for example, extracting theimage frame data rapidly requires fast electronics and a goodmicroprocessor and communications hardware and software.
Shaw et al.(2005) describe an uncooled thermal imagingcamera for use in atmospheric studies. This camera has a sin-gle passband (∼ 8–14 µm) and is used to view the sky over-head for studies of clouds. They report the calibration error ofthis instrument to be 0.5 W m−2 sr−1, or about 2 % of the am-bient radiance, and also show that the microbolometer is sen-sitive at low temperatures (< 240 K) by observing changesin signals for very high thin clouds (cirrus). The camera de-veloped here incorporates wavelength selection (filters), andthis decreases the sensitivity and adds time delays to the im-age capture. The camera needs to be sensitive at temperaturesof 230–300 K, which cover the typical range of atmosphericplume temperatures. In this paper we describe, in generalterms, the thermal imaging camera and its modifications for
Atmos. Meas. Tech., 7, 2807–2828, 2014 www.atmos-meas-tech.net/7/2807/2014/
A. J. Prata and C. Bernardo: A ground-based thermal camera 2809
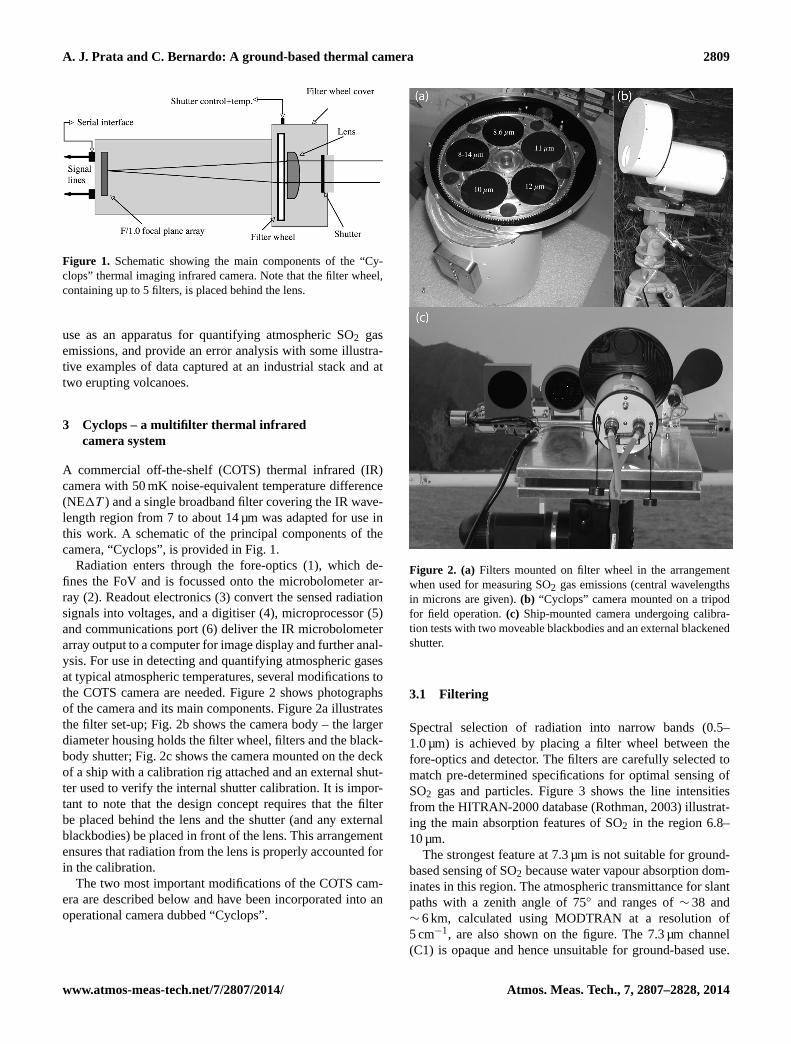
Figure 1. Schematic showing the main components of the “Cy-clops” thermal imaging infrared camera. Note that the filter wheel,containing up to 5 filters, is placed behind the lens.
use as an apparatus for quantifying atmospheric SO2 gasemissions, and provide an error analysis with some illustra-tive examples of data captured at an industrial stack and attwo erupting volcanoes.
3 Cyclops – a multifilter thermal infraredcamera system
A commercial off-the-shelf (COTS) thermal infrared (IR)camera with 50 mK noise-equivalent temperature difference(NE1T ) and a single broadband filter covering the IR wave-length region from 7 to about 14 µm was adapted for use inthis work. A schematic of the principal components of thecamera, “Cyclops”, is provided in Fig.1.
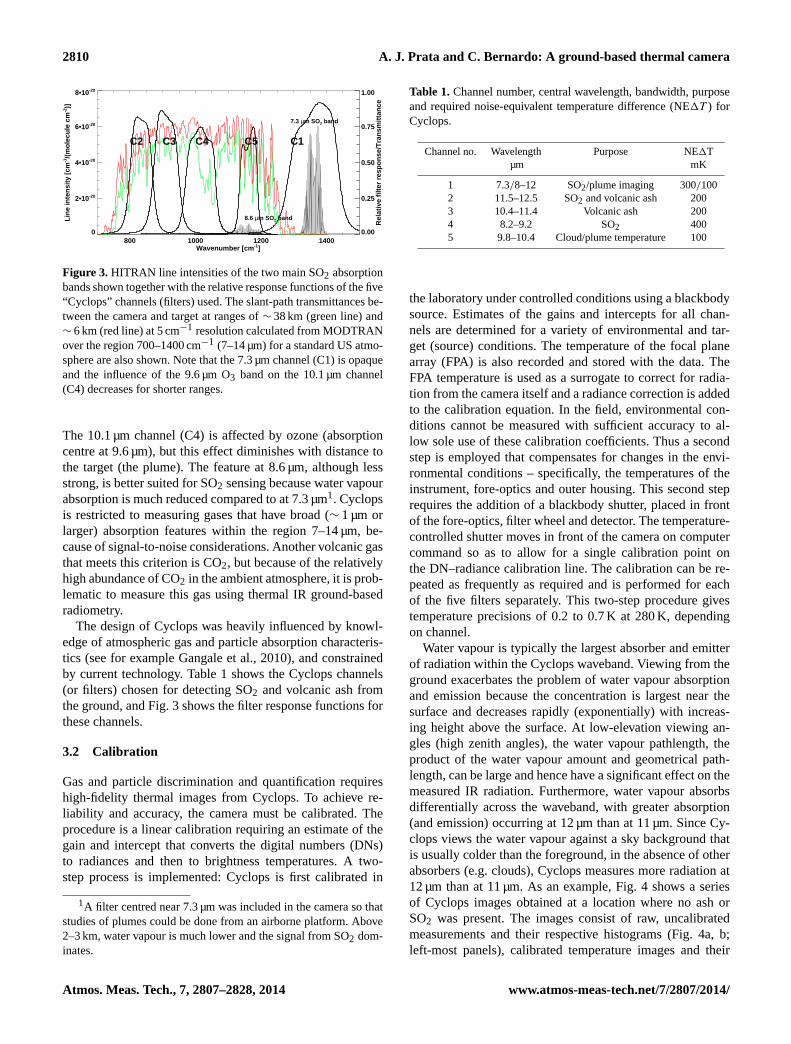
Radiation enters through the fore-optics (1), which de-fines the FoV and is focussed onto the microbolometer ar-ray (2). Readout electronics (3) convert the sensed radiationsignals into voltages, and a digitiser (4), microprocessor (5)and communications port (6) deliver the IR microbolometerarray output to a computer for image display and further anal-ysis. For use in detecting and quantifying atmospheric gasesat typical atmospheric temperatures, several modifications tothe COTS camera are needed. Figure2 shows photographsof the camera and its main components. Figure2a illustratesthe filter set-up; Fig.2b shows the camera body – the largerdiameter housing holds the filter wheel, filters and the black-body shutter; Fig.2c shows the camera mounted on the deckof a ship with a calibration rig attached and an external shut-ter used to verify the internal shutter calibration. It is impor-tant to note that the design concept requires that the filterbe placed behind the lens and the shutter (and any externalblackbodies) be placed in front of the lens. This arrangementensures that radiation from the lens is properly accounted forin the calibration.
The two most important modifications of the COTS cam-era are described below and have been incorporated into anoperational camera dubbed “Cyclops”.
Figure 2. (a) Filters mounted on filter wheel in the arrangementwhen used for measuring SO2 gas emissions (central wavelengthsin microns are given).(b) “Cyclops” camera mounted on a tripodfor field operation.(c) Ship-mounted camera undergoing calibra-tion tests with two moveable blackbodies and an external blackenedshutter.
3.1 Filtering
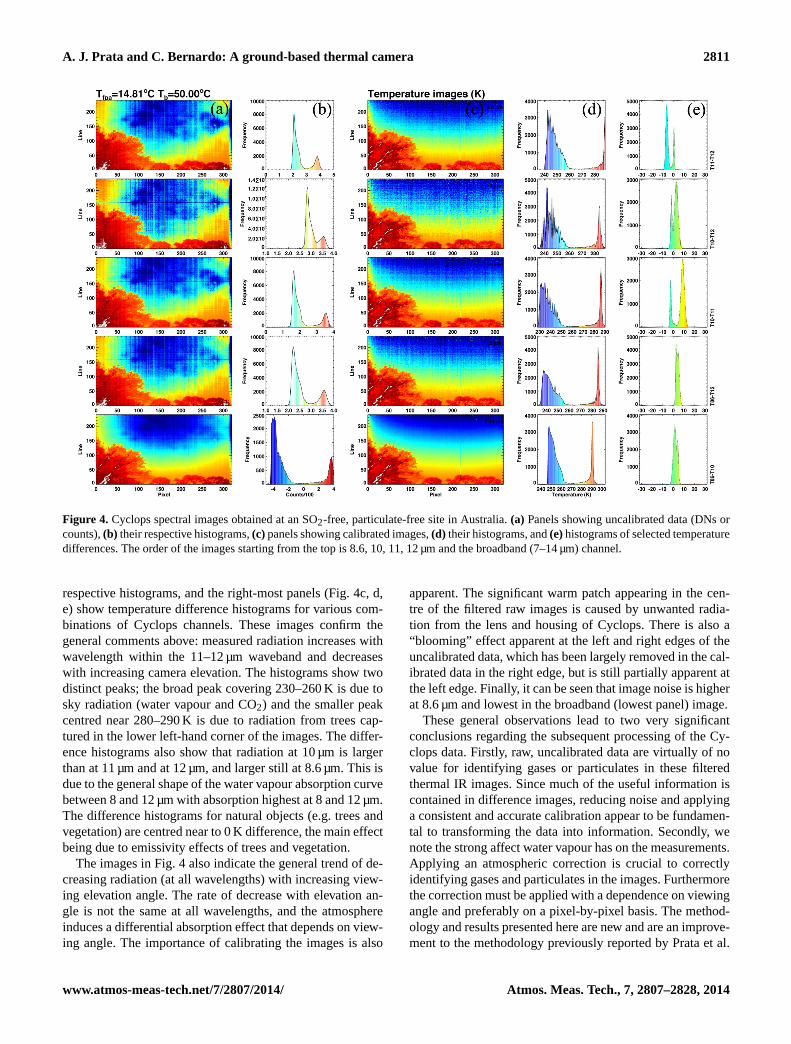
Spectral selection of radiation into narrow bands (0.5–1.0 µm) is achieved by placing a filter wheel between thefore-optics and detector. The filters are carefully selected tomatch pre-determined specifications for optimal sensing ofSO2 gas and particles. Figure3 shows the line intensitiesfrom the HITRAN-2000 database (Rothman, 2003) illustrat-ing the main absorption features of SO2 in the region 6.8–10 µm.
The strongest feature at 7.3 µm is not suitable for ground-based sensing of SO2 because water vapour absorption dom-inates in this region. The atmospheric transmittance for slantpaths with a zenith angle of 75◦ and ranges of∼ 38 and∼ 6 km, calculated using MODTRAN at a resolution of5 cm−1, are also shown on the figure. The 7.3 µm channel(C1) is opaque and hence unsuitable for ground-based use.
www.atmos-meas-tech.net/7/2807/2014/ Atmos. Meas. Tech., 7, 2807–2828, 2014
2810 A. J. Prata and C. Bernardo: A ground-based thermal camera
Discussion
Paper
|D
iscussionPaper
|D
iscussionPaper
|D
iscussionPaper
|
800 1000 1200 1400Wavenumber [cm-1]
0
2•10-20
4•10-20
6•10-20
8•10-20
Lin
e in
ten
sity
[cm
-1/(
mo
lecu
le c
m-2)]
7.3 µm SO2 band
8.6 µm SO2 band
0.00
0.25
0.50
0.75
1.00
Rel
ativ
e fi
lter
res
po
nse
/Tra
nsm
itta
nce
C2 C3 C4 C5 C1
FIGURE 3. HITRAN line intensities of the two main SO2 absorption bands shown together with therelative response functions of the five “Cyclops” channels (filters) used. The slant-path transmittancebetween the camera and target at ranges of ∼38 km (green line) and ∼6 km (red line) at 5 cm−1 resolutioncalculated from MODTRAN over the region 700–1400 cm−1 (7–14 µm) for a standard US atmosphereare also shown. Note that the 7.3 µm channel (C1) is opaque and the influence of the 9.6 µm O3 band onthe 10.1 µm channel (C4) decreases for shorter ranges.
35
Figure 3. HITRAN line intensities of the two main SO2 absorptionbands shown together with the relative response functions of the five“Cyclops” channels (filters) used. The slant-path transmittances be-tween the camera and target at ranges of∼ 38 km (green line) and∼ 6 km (red line) at 5 cm−1 resolution calculated from MODTRANover the region 700–1400 cm−1 (7–14 µm) for a standard US atmo-sphere are also shown. Note that the 7.3 µm channel (C1) is opaqueand the influence of the 9.6 µm O3 band on the 10.1 µm channel(C4) decreases for shorter ranges.
The 10.1 µm channel (C4) is affected by ozone (absorptioncentre at 9.6 µm), but this effect diminishes with distance tothe target (the plume). The feature at 8.6 µm, although lessstrong, is better suited for SO2 sensing because water vapourabsorption is much reduced compared to at 7.3 µm1. Cyclopsis restricted to measuring gases that have broad (∼ 1 µm orlarger) absorption features within the region 7–14 µm, be-cause of signal-to-noise considerations. Another volcanic gasthat meets this criterion is CO2, but because of the relativelyhigh abundance of CO2 in the ambient atmosphere, it is prob-lematic to measure this gas using thermal IR ground-basedradiometry.
The design of Cyclops was heavily influenced by knowl-edge of atmospheric gas and particle absorption characteris-tics (see for exampleGangale et al., 2010), and constrainedby current technology. Table 1 shows the Cyclops channels(or filters) chosen for detecting SO2 and volcanic ash fromthe ground, and Fig.3 shows the filter response functions forthese channels.
3.2 Calibration
Gas and particle discrimination and quantification requireshigh-fidelity thermal images from Cyclops. To achieve re-liability and accuracy, the camera must be calibrated. Theprocedure is a linear calibration requiring an estimate of thegain and intercept that converts the digital numbers (DNs)to radiances and then to brightness temperatures. A two-step process is implemented: Cyclops is first calibrated in
1A filter centred near 7.3 µm was included in the camera so thatstudies of plumes could be done from an airborne platform. Above2–3 km, water vapour is much lower and the signal from SO2 dom-inates.
Table 1. Channel number, central wavelength, bandwidth, purposeand required noise-equivalent temperature difference (NE1T ) forCyclops.
Channel no. Wavelength Purpose NE1Tµm mK
1 7.3/8–12 SO2/plume imaging 300/1002 11.5–12.5 SO2 and volcanic ash 2003 10.4–11.4 Volcanic ash 2004 8.2–9.2 SO2 4005 9.8–10.4 Cloud/plume temperature 100
the laboratory under controlled conditions using a blackbodysource. Estimates of the gains and intercepts for all chan-nels are determined for a variety of environmental and tar-get (source) conditions. The temperature of the focal planearray (FPA) is also recorded and stored with the data. TheFPA temperature is used as a surrogate to correct for radia-tion from the camera itself and a radiance correction is addedto the calibration equation. In the field, environmental con-ditions cannot be measured with sufficient accuracy to al-low sole use of these calibration coefficients. Thus a secondstep is employed that compensates for changes in the envi-ronmental conditions – specifically, the temperatures of theinstrument, fore-optics and outer housing. This second steprequires the addition of a blackbody shutter, placed in frontof the fore-optics, filter wheel and detector. The temperature-controlled shutter moves in front of the camera on computercommand so as to allow for a single calibration point onthe DN–radiance calibration line. The calibration can be re-peated as frequently as required and is performed for eachof the five filters separately. This two-step procedure givestemperature precisions of 0.2 to 0.7 K at 280 K, dependingon channel.
Water vapour is typically the largest absorber and emitterof radiation within the Cyclops waveband. Viewing from theground exacerbates the problem of water vapour absorptionand emission because the concentration is largest near thesurface and decreases rapidly (exponentially) with increas-ing height above the surface. At low-elevation viewing an-gles (high zenith angles), the water vapour pathlength, theproduct of the water vapour amount and geometrical path-length, can be large and hence have a significant effect on themeasured IR radiation. Furthermore, water vapour absorbsdifferentially across the waveband, with greater absorption(and emission) occurring at 12 µm than at 11 µm. Since Cy-clops views the water vapour against a sky background thatis usually colder than the foreground, in the absence of otherabsorbers (e.g. clouds), Cyclops measures more radiation at12 µm than at 11 µm. As an example, Fig.4 shows a seriesof Cyclops images obtained at a location where no ash orSO2 was present. The images consist of raw, uncalibratedmeasurements and their respective histograms (Fig.4a, b;left-most panels), calibrated temperature images and their
Atmos. Meas. Tech., 7, 2807–2828, 2014 www.atmos-meas-tech.net/7/2807/2014/
A. J. Prata and C. Bernardo: A ground-based thermal camera 2811
Figure 4. Cyclops spectral images obtained at an SO2-free, particulate-free site in Australia.(a) Panels showing uncalibrated data (DNs orcounts),(b) their respective histograms,(c) panels showing calibrated images,(d) their histograms, and(e)histograms of selected temperaturedifferences. The order of the images starting from the top is 8.6, 10, 11, 12 µm and the broadband (7–14 µm) channel.
respective histograms, and the right-most panels (Fig.4c, d,e) show temperature difference histograms for various com-binations of Cyclops channels. These images confirm thegeneral comments above: measured radiation increases withwavelength within the 11–12 µm waveband and decreaseswith increasing camera elevation. The histograms show twodistinct peaks; the broad peak covering 230–260 K is due tosky radiation (water vapour and CO2) and the smaller peakcentred near 280–290 K is due to radiation from trees cap-tured in the lower left-hand corner of the images. The differ-ence histograms also show that radiation at 10 µm is largerthan at 11 µm and at 12 µm, and larger still at 8.6 µm. This isdue to the general shape of the water vapour absorption curvebetween 8 and 12 µm with absorption highest at 8 and 12 µm.The difference histograms for natural objects (e.g. trees andvegetation) are centred near to 0 K difference, the main effectbeing due to emissivity effects of trees and vegetation.
The images in Fig.4 also indicate the general trend of de-creasing radiation (at all wavelengths) with increasing view-ing elevation angle. The rate of decrease with elevation an-gle is not the same at all wavelengths, and the atmosphereinduces a differential absorption effect that depends on view-ing angle. The importance of calibrating the images is also
apparent. The significant warm patch appearing in the cen-tre of the filtered raw images is caused by unwanted radia-tion from the lens and housing of Cyclops. There is also a“blooming” effect apparent at the left and right edges of theuncalibrated data, which has been largely removed in the cal-ibrated data in the right edge, but is still partially apparent atthe left edge. Finally, it can be seen that image noise is higherat 8.6 µm and lowest in the broadband (lowest panel) image.
These general observations lead to two very significantconclusions regarding the subsequent processing of the Cy-clops data. Firstly, raw, uncalibrated data are virtually of novalue for identifying gases or particulates in these filteredthermal IR images. Since much of the useful information iscontained in difference images, reducing noise and applyinga consistent and accurate calibration appear to be fundamen-tal to transforming the data into information. Secondly, wenote the strong affect water vapour has on the measurements.Applying an atmospheric correction is crucial to correctlyidentifying gases and particulates in the images. Furthermorethe correction must be applied with a dependence on viewingangle and preferably on a pixel-by-pixel basis. The method-ology and results presented here are new and are an improve-ment to the methodology previously reported byPrata et al.
www.atmos-meas-tech.net/7/2807/2014/ Atmos. Meas. Tech., 7, 2807–2828, 2014

2812 A. J. Prata and C. Bernardo: A ground-based thermal camera
Discussion
Paper
|D
iscussionPaper
|D
iscussionPaper
|D
iscussionPaper
|
1050 1100 1150 1200 1250Wavenumber (cm-1)
0
2.0•10-5
4.0•10-5
6.0•10-5
8.0•10-5
1.0•10-4
1.2•10-4
Ab
sorp
tio
n c
oef
fici
ent
(µm
ol m
ol-1
m-1)
SO2 abs=4.3235E-5 µmol mol-1 m-1
FIGURE 5. Filter response function (smooth line) for the 8.6 µm Cyclops channel and the variation of theSO2 absorption coefficient with wavenumber as measured by NIST. The integrated absorption coefficientover the waveband is 4.3235 x 10⁻⁵ µmol mol−1 m−1.
37
Figure 5. Filter response function (smooth line) for the 8.6 µm Cy-clops channel and the variation of the SO2 absorption coefficientwith wavenumber as measured by NIST. The integrated absorptioncoefficient over the waveband is 4.3235× 10⁻⁵ µmol mol−1 m−1.
(2004). The atmospheric correction and retrieval proceduresare described next.
4 Quantifying SO2
The Cyclops camera system was designed to use up to fivespectral filters, chosen to optimise the detection of specificatmospheric gases. To quantify SO2 SCDs from the ground,a filter with a narrow waveband centred near 8.6 µm wasselected. The filter response function is plotted in Fig.5together with the SO2 absorption coefficient measured byNIST (National Institute of Standards and Technology) (Chuet al., 1999).
The ground-based thermal imager can view a plume from avolcanic source or from an industrial stack at elevation anglesof 10◦ or less (zenith angles> 80◦). The preferred arrange-ment for Cyclops is with a high elevation angle in order toreduce the effects of water vapour absorption along the path.The camera has a FoV of∼ 32◦, and the total azimuthal an-gular variation is similar to the total zenithal variation. In thefollowing analysis each pixel is treated independently of allothers and there is a simple mapping between image columnand line numbers and azimuth angles and image elevation.
The radiation measured at the imager can be described bythree terms,
Ii(θ,φ) = I fi (θ,φ) + I
pi (θ,φ) + Ib
i (θ,φ), (1)
whereθ is elevation angle,φ is azimuth angle,i is channelnumber, and the superscripts refer to foreground radiance (f),background (b), and plume radiance (p). The plume radianceconsists of emitted radiation, as well as radiation from theatmosphere that has been attenuated as it traverses through
the plume. Scattering is ignored. The plume is consideredto be sufficiently opaque that most of the background radi-ation is blocked by the plume, but in the retrieval scheme itis necessary to consider regions outside the plume where thesum of the background and foreground radiation is denotedas Io
i (see Eq. 26 later in the text). The channel radiancesare integrations over the channel filter response functions foreach pixel within the two-dimensional (2-D) image space.Background radiance refers to radiance from the sky, behindthe plume; foreground radiance refers to radiance emanat-ing from the atmosphere between the plume and the imager.In general it is a difficult task to estimate the atmospherictermsI f
i andIbi from observations. The goal of this analy-
sis is to isolate the plume radiance term and then estimatethe product of the gas concentration and plume thickness.The model used assumes no scattering and that variations inthe absorption coefficient of the medium are invariant alongthe absorption path. Furthermore, the plume is assumed tobe plane-parallel and governed by Schwarzschild’s radiativetransfer equation. The next section provides the mathemati-cal details of the analysis. The resulting equation that is usedto retrieve the pathlength concentration amountm∗, the prod-uct of the absorber density with the pathlength, is stated hereand some general remarks are made.
m∗= ρd = −
1
kcosθ cosφ ln[1− εi,j ], (2)
whereεi,j is an effective emissivity of the plume and is givenby
εi,j =(18
pi,j − 18o
i,j ) − 18pi (1− 18p,j /18p,i)
18p,j (1− 18pi /18p,i)
, (3)
andk is the absorption coefficient averaged over the responsefunction of the measurement channel; all other terms arebrightness temperature differences (18) and are defined inthe Appendix. The retrieval procedure uses three of the im-ager’s five channels: the 8.6, 10 and 12 µm channels. Theinformation regarding SO2 in the plume is contained in the8.6 µm channel, while the 12 µm channel is used to correctfor atmospheric effects and the 10 µm channel, which is themost transparent to water vapour absorption, is used to esti-mate the plume temperature. The retrieval scheme uses tem-perature differences. Most important of these are the ther-mal contrast, the temperature difference between the plumeand the background atmosphere, and terms involving differ-ences between the spectral brightness temperature, with andwithout the plume present, and brightness temperature dif-ferences between the 8.6 and 12 µm channels. For highlyopaque plumes, these differences may be small and the re-trieval scheme becomes unstable. For very thin plumes thethermal contrast is low and the retrieval becomes noise-limited.
Atmos. Meas. Tech., 7, 2807–2828, 2014 www.atmos-meas-tech.net/7/2807/2014/
A. J. Prata and C. Bernardo: A ground-based thermal camera 2813
The sub-section on error analysis (Sect. 4.2) provides de-tails on the accuracy of the retrieval scheme and the sectionfollowing that illustrates the results of using the scheme atseveral different sites.
4.1 Retrieval algorithm
We consider a plane-parallel plume (slab) with thicknessd
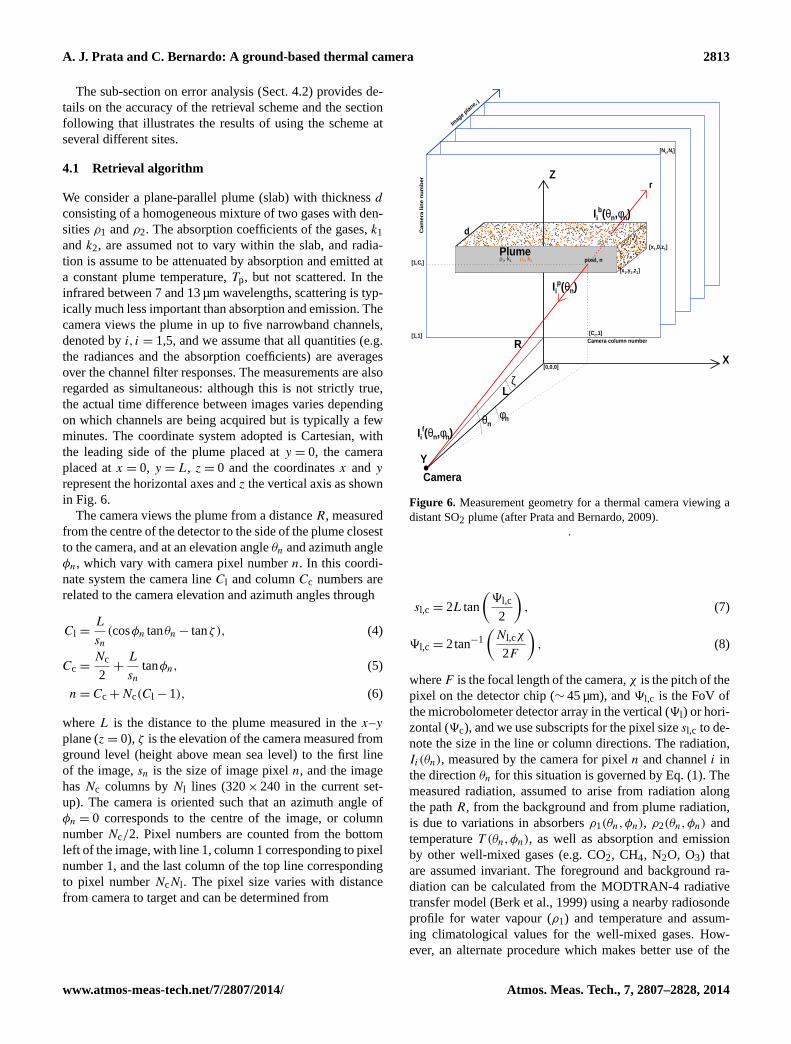
consisting of a homogeneous mixture of two gases with den-sitiesρ1 andρ2. The absorption coefficients of the gases,k1andk2, are assumed not to vary within the slab, and radia-tion is assume to be attenuated by absorption and emitted ata constant plume temperature,Tp, but not scattered. In theinfrared between 7 and 13 µm wavelengths, scattering is typ-ically much less important than absorption and emission. Thecamera views the plume in up to five narrowband channels,denoted byi, i = 1,5, and we assume that all quantities (e.g.the radiances and the absorption coefficients) are averagesover the channel filter responses. The measurements are alsoregarded as simultaneous: although this is not strictly true,the actual time difference between images varies dependingon which channels are being acquired but is typically a fewminutes. The coordinate system adopted is Cartesian, withthe leading side of the plume placed aty = 0, the cameraplaced atx = 0, y = L, z = 0 and the coordinatesx andy
represent the horizontal axes andz the vertical axis as shownin Fig. 6.
The camera views the plume from a distanceR, measuredfrom the centre of the detector to the side of the plume closestto the camera, and at an elevation angleθn and azimuth angleφn, which vary with camera pixel numbern. In this coordi-nate system the camera lineCl and columnCc numbers arerelated to the camera elevation and azimuth angles through
Cl =L
sn(cosφn tanθn − tanζ ), (4)
Cc =Nc
2+
L
sntanφn, (5)
n = Cc + Nc(Cl − 1), (6)
whereL is the distance to the plume measured in thex–y
plane (z = 0), ζ is the elevation of the camera measured fromground level (height above mean sea level) to the first lineof the image,sn is the size of image pixeln, and the imagehasNc columns byNl lines (320× 240 in the current set-up). The camera is oriented such that an azimuth angle ofφn = 0 corresponds to the centre of the image, or columnnumberNc/2. Pixel numbers are counted from the bottomleft of the image, with line 1, column 1 corresponding to pixelnumber 1, and the last column of the top line correspondingto pixel numberNcNl . The pixel size varies with distancefrom camera to target and can be determined from
Discussion
Paper
|D
iscussionPaper
|D
iscussionPaper
|D
iscussionPaper
|
0 20 40 60 80 100 1200
50
100
150
X
Z
Y
d
r
θnφn
L
Camera
Plumeρ1, k1 ρ2, k2
R
pixel, n
[x1,y1,z1]
[x1,0,z1]
[0,0,0]
Iip(θn)
Iif(θn,φn)
Iib(θn,φn)
[1,1]Camera column number
Cam
era
lin
e n
um
ber
[Nc,Nl]
ζ
[Cc,1]
[1,Cl]
Imag
e plan
e, j
FIGURE 6. Measurement geometry for a thermal camera viewing a distant SO2 plume. (After Prata andBernardo (2009)).
38
Figure 6. Measurement geometry for a thermal camera viewing adistant SO2 plume (afterPrata and Bernardo, 2009).
.
sl,c = 2L tan
(9l,c
2
), (7)
9l,c = 2tan−1(
Nl,cχ
2F
), (8)
whereF is the focal length of the camera,χ is the pitch of thepixel on the detector chip (∼ 45 µm), and9l,c is the FoV ofthe microbolometer detector array in the vertical (9l) or hori-zontal (9c), and we use subscripts for the pixel sizesl,c to de-note the size in the line or column directions. The radiation,Ii(θn), measured by the camera for pixeln and channeli inthe directionθn for this situation is governed by Eq. (1). Themeasured radiation, assumed to arise from radiation alongthe pathR, from the background and from plume radiation,is due to variations in absorbersρ1(θn,φn), ρ2(θn,φn) andtemperatureT (θn,φn), as well as absorption and emissionby other well-mixed gases (e.g. CO2, CH4, N2O, O3) thatare assumed invariant. The foreground and background ra-diation can be calculated from the MODTRAN-4 radiativetransfer model (Berk et al., 1999) using a nearby radiosondeprofile for water vapour (ρ1) and temperature and assum-ing climatological values for the well-mixed gases. How-ever, an alternate procedure which makes better use of the
www.atmos-meas-tech.net/7/2807/2014/ Atmos. Meas. Tech., 7, 2807–2828, 2014
2814 A. J. Prata and C. Bernardo: A ground-based thermal camera
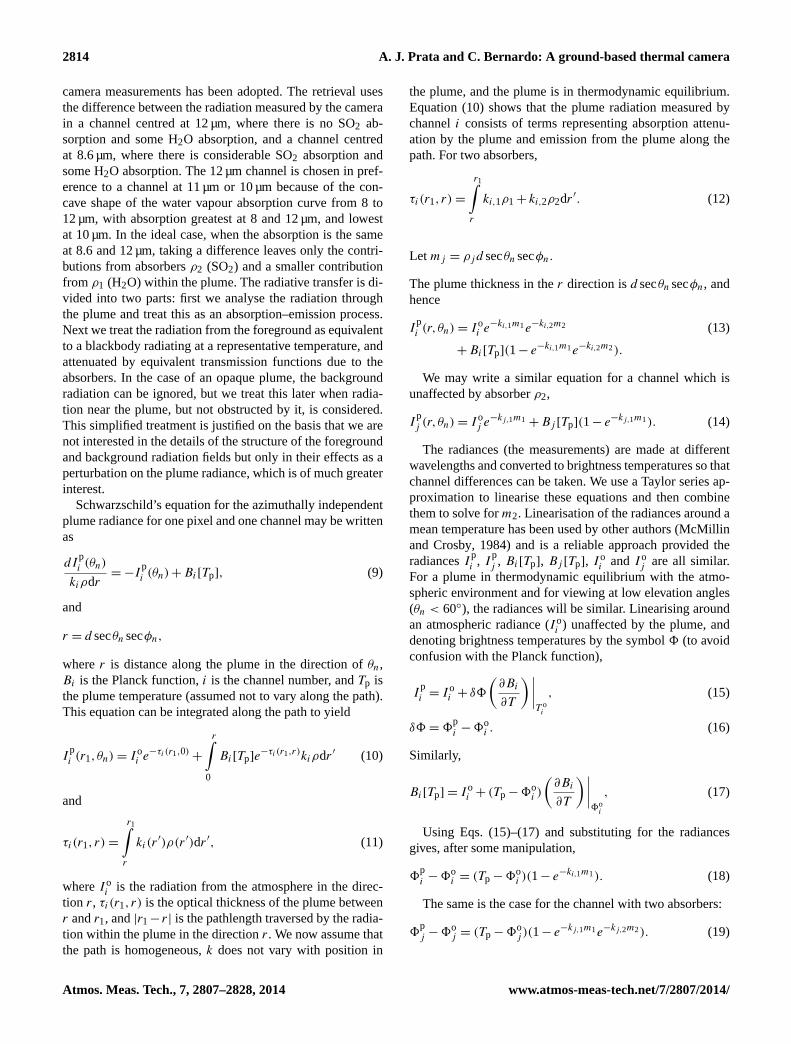
camera measurements has been adopted. The retrieval usesthe difference between the radiation measured by the camerain a channel centred at 12 µm, where there is no SO2 ab-sorption and some H2O absorption, and a channel centredat 8.6 µm, where there is considerable SO2 absorption andsome H2O absorption. The 12 µm channel is chosen in pref-erence to a channel at 11 µm or 10 µm because of the con-cave shape of the water vapour absorption curve from 8 to12 µm, with absorption greatest at 8 and 12 µm, and lowestat 10 µm. In the ideal case, when the absorption is the sameat 8.6 and 12 µm, taking a difference leaves only the contri-butions from absorbersρ2 (SO2) and a smaller contributionfrom ρ1 (H2O) within the plume. The radiative transfer is di-vided into two parts: first we analyse the radiation throughthe plume and treat this as an absorption–emission process.Next we treat the radiation from the foreground as equivalentto a blackbody radiating at a representative temperature, andattenuated by equivalent transmission functions due to theabsorbers. In the case of an opaque plume, the backgroundradiation can be ignored, but we treat this later when radia-tion near the plume, but not obstructed by it, is considered.This simplified treatment is justified on the basis that we arenot interested in the details of the structure of the foregroundand background radiation fields but only in their effects as aperturbation on the plume radiance, which is of much greaterinterest.
Schwarzschild’s equation for the azimuthally independentplume radiance for one pixel and one channel may be writtenas
dIpi (θn)
kiρdr= −I
pi (θn) + Bi[Tp], (9)
and
r = d secθn secφn,
wherer is distance along the plume in the direction ofθn,Bi is the Planck function,i is the channel number, andTp isthe plume temperature (assumed not to vary along the path).This equation can be integrated along the path to yield
Ipi (r1,θn) = Io
i e−τi (r1,0)+
r∫0
Bi[Tp]e−τi (r1,r)kiρdr ′ (10)
and
τi(r1, r) =
r1∫r
ki(r′)ρ(r ′)dr ′, (11)
whereIoi is the radiation from the atmosphere in the direc-
tion r, τi(r1, r) is the optical thickness of the plume betweenr andr1, and|r1− r| is the pathlength traversed by the radia-tion within the plume in the directionr. We now assume thatthe path is homogeneous,k does not vary with position in
the plume, and the plume is in thermodynamic equilibrium.Equation (10) shows that the plume radiation measured bychanneli consists of terms representing absorption attenu-ation by the plume and emission from the plume along thepath. For two absorbers,
τi(r1, r) =
r1∫r
ki,1ρ1 + ki,2ρ2dr ′. (12)
Let mj = ρjd secθn secφn.
The plume thickness in ther direction isd secθn secφn, andhence
Ipi (r,θn) = Io
i e−ki,1m1e−ki,2m2 (13)
+ Bi[Tp](1− e−ki,1m1e−ki,2m2).
We may write a similar equation for a channel which isunaffected by absorberρ2,
Ipj (r,θn) = Io
j e−kj,1m1 + Bj [Tp](1− e−kj,1m1). (14)
The radiances (the measurements) are made at differentwavelengths and converted to brightness temperatures so thatchannel differences can be taken. We use a Taylor series ap-proximation to linearise these equations and then combinethem to solve form2. Linearisation of the radiances around amean temperature has been used by other authors (McMillinand Crosby, 1984) and is a reliable approach provided theradiancesIp
i , Ipj , Bi[Tp], Bj [Tp], Io
i andIoj are all similar.
For a plume in thermodynamic equilibrium with the atmo-spheric environment and for viewing at low elevation angles(θn < 60◦), the radiances will be similar. Linearising aroundan atmospheric radiance (Io
i ) unaffected by the plume, anddenoting brightness temperatures by the symbol8 (to avoidconfusion with the Planck function),
Ipi = Io
i + δ8
(∂Bi
∂T
)∣∣∣∣T o
i
, (15)
δ8 = 8pi − 8o
i . (16)
Similarly,
Bi[Tp] = Ioi + (Tp − 8o
i )
(∂Bi
∂T
)∣∣∣∣8o
i
, (17)
Using Eqs. (15)–(17) and substituting for the radiancesgives, after some manipulation,
8pi − 8o
i = (Tp − 8oi )(1− e−ki,1m1). (18)
The same is the case for the channel with two absorbers:
8pj − 8o
j = (Tp − 8oj )(1− e−kj,1m1e−kj,2m2). (19)
Atmos. Meas. Tech., 7, 2807–2828, 2014 www.atmos-meas-tech.net/7/2807/2014/

A. J. Prata and C. Bernardo: A ground-based thermal camera 2815
Let e−ki,1m1 = e−kj,1m1. This assumption requires that thetransmission by water vapour is equal at the two wavelengthschosen, viz. 8.6 and 12.0 µm. The section on error analysisexamines the efficacy of this approximation. Using this ap-proximation we have
8pj − 8o
j = (Tp − 8oj )(1− e−ki,1m1e−kj,2m2). (20)
Subtracting Eq. (18) from Eq. (20), and after some tediousalgebra, we have
m2 = −1
kj,2ln
[1− εi,j
], (21)
where
εi,j =(18
pi,j − 18o
i,j ) − 18pi (1− 18p,j /18p,i)
18p,j (1− 18pi /18p,i)
, (22)
18pi,j = 8
pi − 8
pj , (23)
18oi,j = 8o
i − 8oj , (24)
and
18pi = 8
pi − 8o
i ,
18pj = 8
pj − 8o
j ,
18p,i = Tp − 8oi ,
18p,j = Tp − 8oj .
Equation (22) shows that the retrieval of the plume emis-sivity depends mainly on the plume temperature differencebetween the two channels but also on the thermal contrastbetween the plume and the atmosphere outside the plume(18
pi ).
The solution to Eq. (21) requires estimates of the variables8
pi , 8o
i , 8pj , 8o
i , Tp andθn, and specification of the absorp-tion coefficientkj,2. The measurements consist of the plumeradiances (Ip
i , Ipj ), the foreground radiances (I f
i , I fj ) and the
background radiances (Ibi , Ib
j ). We now show how the plumeand atmosphere brightness temperatures are related to theplume, foreground and background radiances, and how thebrightness temperatures are determined for use in Eq. (22).
Consider two measurements, one made through the plumeand the other without the plume in the FoV. Assuming thatthe atmosphere does not change appreciably between thesetwo measurements, for the first measurement (dropping ref-erence to angles) we may write
Ii = I fi + I
pi + Ib
i , (25)
and for the second measurement
Ioi = I
f,oi + I
b,oi . (26)
The superscripto refers to atmospheric radiation “outside”the plume. Each of these quantities may be determined bysolving integrals of the form
Iλ =
∫z
Bλ[T (z)]e−∫z′ kλ(z′)ρ(z′)dz′
kλ(z)ρ(z)dz. (27)
In general we do not have information on the path variationof the absorption coefficient, the absorber or the temperature.Let the transmittance of each path be designatedτ f
i,q , τpi,q and
τbi,q for the foreground, plume and background, respectively.
As beforei represents channel andq absorber type (q=1,2).Let the temperatures of the layers beTf , Tp, andTb, respec-tively, and we replace the path integrals with mean radiances,denoted by an overbar. Then,
Ii = (1− τ fi,1)B̄i[Tf] (28)
+ τ fi,1
((1− τ
pi,1τ
pi,2)B̄i[Tp] + τ
pi,1τ
pi,2τ
bi,1B̄i[Tb]
).
Ioi = (1− τ f
i,1)B̄i[Tf] + τ fi,1τ
bi,1B̄i[Tb]. (29)
Note that we have assumed that the foreground and back-ground atmospheres have not changed between the measure-ments and that they contain no SO2 (absorberq = 2). Sub-tracting Eq. (28) from Eq. (29),
Ii − Ioi = I
pi − τ f
i,1τbi,1(1− τ
pi,2)B̄i[Tb]. (30)
A similar equation can be obtained for a second channelj ,which has no absorption due to absorberq = 2,
Ij − Ioj = I
pj − τ f
j,1τbj,1B̄j [Tb]. (31)
Subtracting Eq. (31) from Eq. (30),
1Ioi,j = 1I
pi,j + δIo
i.j , (32)
where
1Ioi,j = (Ii − Io
i ) − (Ij − Ioj ), (33)
1Ipi,j = I
pi − I
pj , (34)
δIoi,j = I
b,oi (1− τ
pi,1τ
pi,2) − I
b,oj (1− τ
pj,1). (35)
The quantities in Eq. (33) are all measurable, and henceEq. (32) can be solved after the correctionδIo
i,j has been ap-plied and the brightness temperature analogues calculated.In this analysis, the reference to the elevation angleθ wasdropped for notational convenience, but this is an importantvariation and must be accounted for. Since the required quan-tities are temperature differences (viz.18o
i,j ), the verticalvariation is removed by processing the differences. We alsoneed to estimate the quantities18
pi,j , 18
pi and18
pj . These
quantities are obtained by processing each image to removethe vertical variation of brightness temperature along eachimage column. A linear least-squares fit is obtained for eachimage column using data several lines above the plume up toseveral lines below the top of the image. The plume is dis-cernible in the image data because it has a different temper-ature to the background sky and the camera viewing orien-tation can be arranged to completely view the plume, whileallowing some clear sky to be imaged. Since each image is
www.atmos-meas-tech.net/7/2807/2014/ Atmos. Meas. Tech., 7, 2807–2828, 2014

2816 A. J. Prata and C. Bernardo: A ground-based thermal camera
Figure 7. (a)Brightness temperature versus height variation for the12 µm filter (812). (b) Brightness temperature versus height vari-ation for the 8.6 µm filter (88.6). (c) Brightness temperature dif-ference versus height variation for the 8.6–12 µm fiters (188.6,12).The straight lines are least-squares linear fits based on profile dataabove the plume, and extrapolated through and below the plume.
240 lines high, the fit typically uses between 100 and 150lines. Variations in the number of lines used in the fit occurbecause the plume is sometimes elevated and because someimages contain noisy data towards the top of the image. Ingeneral the fit is very good (see Fig.7).
The linear fit2 removes zenithal variations and providesestimates of8o
i and8oj . Since each column of the image is
treated differently, account is taken of any azimuthal varia-tions in the atmosphere. Once this procedure has been ap-plied, the plume temperature is estimated from the 10 µmimage (the most transparent channel) after applying a cor-rection for water vapour based on MODTRAN-4 radiativetransfer calculations. Figure 8 illustrates the size of the at-mospheric correction for the 10 µm channel as a function ofthe slant range, for three different plume temperatures: a coldplume withTp = 270 K, a plume close to the background at-mospheric temperature withTp = 280 K, and a warm plumewith Tp = 290 K.
4.2 Error analysis
The SO2 retrieval scheme makes several simplifying assump-tions that can lead to error in the final results. The schemedepends mainly on the temperature measurements and mea-surement differences, but also on a few parameters (e.g. ab-sorption coefficients, viewing angles). The sources of errorare considered to fall into three distinct groups:
– type 1 errors due to measurement noise;
– type 2 errors, arising from assumptions and approxima-tions used in the retrieval scheme;
2It was found that a second-degree polynomial fit was needed inone field trial. See the section on Port Pirie.
Table 2.Theoretical NE1T ’s (mK) for four narrow-band channelsof the thermal infrared imaging camera and for four different scenetemperatures.
Wavelength (µm)
Temperature (K) 8.6 10 11 12
220 275 170 140 120250 140 100 85 80270 100 75 70 60290 75 60 55 55
– type 3 errors due to inaccurate or incomplete specifica-tion of parameters required in the scheme.
Type 1 errors
The theoretical formula for the noise-equivalent tempera-ture difference (NE1T ) that produces a signal-to-noise ra-tio (SNR) of unity for a single microbolometer pixel may bewritten as (Derniak and Boremann, 1996)
NE1T =4
π
[F 2
#
D∗
√1f
Ad
](dI
dT
)−1
, (36)
whereF# is theF number of the camera,1f is the samplingfrequency,I is the radiance,Ad is the area of the detector,and D∗ is the normalised detectivity or figure of merit ofthe detector. There are several sources of noise for thermalimager detectors including, Johnson noise, 1/f noise, andnoise due to temperature fluctuations. The last of these noisesources is usually the limiting factor. For the Cyclops camera,D∗
∼ 2.5× 106 cm Hz1/2 mW−1, Ad = 45 µm,1f = 60 Hz,andF# = 1. Inserting these values into Eq. (36),
NE1T ∼ 0.083
(dI
dT
)−1
.
The NE1T ’s (in mK) for the camera were calculated for agiven set of scene brightness temperatures using the deriva-tive of the Planck function at the central wavelengths of thechannels, and these are shown in Table 2.
It can be seen by comparing the values in Table 1 withthe theoretical noise temperatures of Table 2 that the cam-era meets the requirements for scene temperatures down to250 K but not down to 220 K. In practice we have found thatthe theoretical limits are not met unless some averaging isdone. Frame averaging can reduce the noise by
√Nf , where
Nf is the number of frames. However, there is a limit to thisas the fixed-pattern noise (FPN) is not reduced by addingmore frames. The FPN is reduced by the use of the blackenedshutter. Laboratory and field experiments were conductedto establish performance metrics for the thermal imagingcamera. These trials suggested that 24-frame images were
Atmos. Meas. Tech., 7, 2807–2828, 2014 www.atmos-meas-tech.net/7/2807/2014/

A. J. Prata and C. Bernardo: A ground-based thermal camera 2817
Discussion
Paper
|D
iscussionPaper
|D
iscussionPaper
|D
iscussionPaper
|
0 5 10 15 20Slant range (km)
-3
-2
-1
0
1
2
3
Atm
osp
her
ic c
orr
ecti
on
(K
)
Plume temperature = 270 K
Plume temperature = 280 K
Plume temperature = 290 K
FIGURE 8. Atmospheric correction, Tp–TB10 (in K) as a function of the slant range to a plume at threedifferent (uniform) temperatures (Tp). Calculations were performed using MODTRAN-4 for the 10 µmchannel.
40
Figure 8. Atmospheric correction,Tp–810 (in K), as a functionof the slant range to a plume at three different (uniform) temper-atures (Tp). Calculations were performed using MODTRAN-4 forthe 10 µm channel.
considerably more noisy than the theoretical results suggest3.The measured NE1T ’s ranged from 0.1 K at 290 K for thebroadband channel to 1.8 K at 220 K for the 8.6 µm channel.A least-squares polynomial (third degree) fit to the labora-tory data was performed for each channel so that the NE1T
at any arbitrary scene temperature (Ts) could be obtained.The fit is given by
NE1T =
i=3∑i=0
aiTis . (37)
The coefficients for all channels, including the broadbandchannel, are given in Table 3. At 260 K the NE1T = 0.80 Kfor the 8.6 µm channel, and 0.41 K for the 12 µm channel.The trials also showed that∼ 0.5 % of the pixels were “deadpixels” – that is, these pixels were constantly off and regis-tering no signal. Once these pixels had been identified theywere flagged and not included in any further analyses.
Temperature differences are used in the retrieval scheme.Thus errors due to noisy measurements are increased by√
NE1T 2i + NE1T 2
j , wherei and j are the channel num-
bers. The noise in the measurements represents a large sourceof uncertainty in the retrieval scheme. We evaluate this byperforming a large number of simulations where we specifythe temperatures in Eq. (22) and include a Gaussian distri-bution of noise with the mean given by the NE1T ’s for eachchannel with a spread of 2σ . A perfect measurement is deter-mined as the result when the NE1T ’s are zero. The result ofthese simulations gives an impact of 9–10 % on the retrievedSCD. Reducing the NE1T ’s by a factor 2 reduces the errorto 6–7 %.
3An improved camera made by FLIR Inc. has a lower NE1T .
Calibration data suggest that the absolute errors are be-tween 0.5 and 2 K, depending on the scene temperature, theenvironmental temperature and the channel used. Since theretrieval scheme uses temperature differences, as long as thechannels behave in a similar manner, the actual impact of ab-solute temperature error is not great. The main impact arisesthrough the estimate of the plume temperature made usingthe 10 µm channel. The random error associated with the es-timate of the plume temperature is given as type 2 error, andhere we assume only the component of the calibration errorthat contributes to bias. The bias error is close to zero whenthe environmental, scene and camera housing temperaturesare the same. Thus the bias error is likely to be variable andmay change sign, depending on whether the scene is warmeror colder than the instrument. Temperature offset calibrationsare carried out every 5–6 min using a blackened shutter, at-tempting to minimise the effects of environmental tempera-ture changes. The source of error for these calibrations arisesfrom the non-blackness of the calibration shutter. The perfor-mance of the shutter was measured by comparing it to a labo-ratory blackbody of emissivity∼ 0.99. It was established thatthe shutter emissivity was∼0.98± 0.005, with a slight wave-length dependence. An error of±0.005 in emissivity resultsin a temperature error of< 0.1 K, which is much smaller thanthe NE1T of the filtered camera channels. These considera-tions suggest that an absolute calibration accuracy of± 0.5 Kis reasonable. While this is a bias error, the sign of the biasis likely to be variable and difficult to establish unless mea-surements of the environmental, camera housing and scenetemperatures are available. This calibration error translatesto an error in the SCD of∼±5 %.
Type 2 errors
These errors are due to assumptions made in the derivationof the retrieval scheme. These assumptions include
1. plane-parallel radiative transfer, no scattering, radiativetransfer (RT) model;
2. linearisation of the radiances to brightness tempera-tures;
3. constant plume temperature;
4. no spatial variation of the SO2 absorption coefficient;
5. equivalence of the water vapour absorption coefficientsat 8.6 and 12 µm;
6. invariance of the atmospheric structure with or withoutthe plume present.
Assumption 1 includes commonly made assumptions forsolving radiative transfer problems in the infrared region. Forgeometries where the plume is small in comparison to thecurvature of the Earth, the radiation paths are almost identical
www.atmos-meas-tech.net/7/2807/2014/ Atmos. Meas. Tech., 7, 2807–2828, 2014

2818 A. J. Prata and C. Bernardo: A ground-based thermal camera
Table 3.Polynomial fit coefficients for computing NE1T as a function of scene temperature and channel.
Channel (µm) a0 a1 a2 a3
8.6 51.5922 −0.4982 1.634× 10⁻³−1.803× 10⁻⁶
10 19.9328 −0.1856 5.906× 10⁻⁴−6.333× 10⁻⁷
11 10.9692 −0.1009 3.186× 10⁻⁴−3.380× 10⁻⁷
12 11.9301 −0.1102 3.531× 10⁻⁴−3.833× 10⁻⁷
7–14 4.3983 −0.0421 1.352× 10⁻⁴−1.450× 10⁻⁷
to real paths. The effect of assuming that the plume is plane-parallel is inconsequential since the retrieval determines theSCD, and hence the actual geometry of the plume is irrele-vant. Other aspects of the radiative transfer include use of theMODTRAN-4 code, which has undergone detailed scrutinyand intercomparison (Berk et al., 1998). It is difficult to makea precise estimate of the likely impact of errors in the radia-tive transfer modelling on the retrieval, but RT models sug-gest errors of 0.2–0.5 K are possible (Strow et al., 2003). Wetake ±2 % as an estimate for modelling errors (±0.2 K ina 10 K temperature difference). Assumption 2 has been dis-cussed in byMcMillin and Crosby(1984), who show thata necessary condition for this approximation to be valid isthat the radiances should be similar. This is easily examinedby comparing the radiance calculated directly through thePlanck function with the radiance calculated using a first-order Taylor series approximation, e.g. Eq. (17). Figure9shows the radiance error (in %) dependence on the departureof the temperature from a mean value, and demonstrates thatthe error is less than 2.5 % in radiance for departures fromthe mean temperature of up to±10 K. This radiance errorresults in an SCD error of less than half of that due to themeasurement NE1T or ∼ 5 %.
The impact of assuming that the plume temperature is con-stant (assumption 3) could be significant because the thermalcontrast of the plume contributes significantly to the SO2 sig-nal through Eq. (22). In the early stages of generation, theplume is likely to be very inhomogeneous and in thermaldisequilibrium. When the plume has been generated from alarge explosive eruption, it may remain inhomogeneous fortens of minutes4. An idea of the plume temperature variationcan be obtained from an analysis of the broadband (7–14 µm)channel data. These data are the least noisy and the variationcan be used as a proxy for the variation in the thermody-namic temperature structure. The coefficient of variation forthe stable plumes studied here is∼ 0.01, and the typical tem-perature variability along the axis of the plume is±3 K. Ifit is assumed that these metrics also apply to the thermody-namic temperature and that the magnitude of the variabilitydoes not change with position within the plume, then use of
4We only consider eruptions where the Volcanic Explosivity In-dex, VEI,< 3
Discussion
Paper
|D
iscussionPaper
|D
iscussionPaper
|D
iscussionPaper
|
-10 -5 0 5 10Temperature departure from mean (K)
0.0
0.5
1.0
1.5
2.0
2.5
Rad
ian
ce e
rro
r (%
)
FIGURE 9. Radiance error (in %) versus departure from the mean temperature (K) caused by approxi-mating the radiances using a 1st order Taylor series expansion about a mean temperature.
41
Figure 9. Radiance error (in %) versus departure from the meantemperature (K) caused by approximating the radiances using afirst-order Taylor series expansion around a mean temperature.
Eq. (22) with the plume temperature perturbed by±3 K givesSCD retrieval errors of 12–14 %.
Information about the spatial variation of the SO2 absorp-tion coefficient (assumption 4) is not available. There is asmall pressure and temperature dependence of the absorptioncoefficient, but given that the range of variability of pressureand temperature is small for the observing conditions, thisdependence may be neglected.
Assumption 5 has been examined by use of the watervapour transmission model ofDavis and Viezee(1964). Themodel asserts that the water vapour transmission (τλ) withinthe window region 8–12 µm is governed by
τλ = exp{−kλ(P∗w)aλ}, (38)
whereλ is wavelength,w is the precipitable water amount (incm), P ∗ is the effective pressure,P ∗
= P/Ps, P = pressure(mb), Ps is the surface pressure,kλ are the absorption co-efficients, andaλ are coefficients determined by comparing
Atmos. Meas. Tech., 7, 2807–2828, 2014 www.atmos-meas-tech.net/7/2807/2014/

A. J. Prata and C. Bernardo: A ground-based thermal camera 2819
the model with experimental measurements. The coefficientskλ and aλ are tabulated at 25 cm−1 intervals from 800 to1200 cm−1. The model was used to compute the transmis-sion over the 8.6 µm and 12 µm filter response functions5 as afunction of water vapour amount, up to 5.5 cm of precipitablewater. A measure of the difference between absorption at 8.6and 12 µm is computed as Err= (τ8.6 − τ12)/τ8.6 × 100 %.Largest error (Err) is found for greatest precipitable wateramounts and reaches about 10 % at 5 cm. We put an upperbound on the error due to assumption 5 as 10 %, and theimpact of this error on the retrieved SCD is at most a 3 %positive bias; that is, higher SCDs are recovered under thisassumption.
The assumption that the atmosphere is the same whetheror not the plume is present seems intuitively reasonable asthe atmospheric path under consideration is much larger thanthe path within the plume. Also, the atmospheric radiance iscalculated by a linear or quadratic interpolation of the atmo-spheric radiance above and below the plume. The very linearnature of the fit obtained demonstrates that this is a good ap-proximation. Nevertheless, there is error involved. This is es-timated from the 1-σ uncertainty estimate obtained from theleast-squares fit. The uncertainty is evaluated for the 8.6 and12 µm channels and for the difference. The 1-σ uncertaintyfor the difference was±0.3 K, which translates to an SCDerror of±3 %.
Type 3 errors
Several of the parameters used in the retrieval scheme needto be specified. These includekSO2, geometry (elevation ofthe camera and FoV size of the camera), channel filter re-sponse functions, and the use of radiosonde data in the RTmodel. The absorption coefficient was obtained by integra-tion over the filter response function using NIST values ofthe absorption coefficient measured at 0.125 cm−1 resolu-tion. The likely error incurred is small compared to other er-rors. An error in the absorption coefficient translates directlyinto an error in the retrieved SCD. We take this error as 1 %.
Errors in the geometry arise from incorrect specificationof the FoV of the instrument, and inaccuracies in measuringthe camera elevation. These errors are all small and affectthe retrieval only through cosθ and via the RT calculation,which uses radiosonde data and requires specification of thegeometry of the calculation. The geometry error is less than±0.5 %, which corresponds to an error in measuring the an-gles of±1◦.
Errors in the radiosonde data (temperature and watervapour profile errors) affect the retrieval through inaccuratecalculation of the 10 µm plume temperature. This error hasalready been incorporated as a type 2 error for the estimationof the plume temperature.
5It was found necessary to extrapolate the coefficients by25 cm−1 at both ends of the range in order to ensure the transmis-sion profile was completely covered by the filter functions.
Table 4.Summary of error types and estimated error magnitudes.
Error type Error source Error in m∗ (%)
I NE1T ±9–10I Absolute calibration ±5II RT model ±2II Linearisation ±5II Plume temperature ±12–14II Absorption coefficient spatial variability (<1 ?)II Transmission approximation +3II Atmospheric invariance ±3III Absorption coefficient <1III Geometry < 0.5III Radiosonde −
The errors arising from all sources of error consideredare summarised in Table 4. The final error is the root-mean-squared sum of all of the individual random errors – that is,excluding the absolute calibration and transmission approxi-mation errors. Thus the error on the retrieval is estimated tobe∼20 % with a bias of−5 to+6 %.
5 Field trials, detection and quantification
The retrieval scheme described above is quite complex, andso here we analyse some of the thermal imagery to illustratethe main parts of the scheme. Experiments were conductedat Mt Etna, Sicily (37.755◦ N, 14.995◦ E; 3330 m a.s.l.), andat Stromboli (38.789◦ N, 15.213◦ E; 920 m a.s.l.), Aeolian Is-lands, north of Sicily. Figure10a shows the temperature dif-ference (1812,11) image between the 12 and 11 µm channelsfor data acquired at Mt Etna, with a1812,11 height profileshown for a single image column, indicated by the continu-ous vertical line drawn over the image (profile in Fig.10a).Above the terrain and vegetation, there is a noticeable de-crease in1812,11 which coincides with the plume from Etna.This decrease in1812,11 is likely caused by water vapour inthe plume. By contrast, Fig.10b shows the temperature dif-ference1812,8.6, which is negative everywhere, and there isalso a noticeable anomaly in the vicinity of the Etna plume.This anomaly is due to the presence of both water vapourand SO2. Since the absorption by water vapour is slightlygreater at 12 µm than at 8.6 µm, if no water vapour werepresent in the plume, then1812,8.6 would be less negative.There is also water vapour present along the path from thecamera lens to the leading edge of the plume, and hence inregions of the atmosphere away from the plume,1812,8.6is still negative. If the atmosphere were completely absentof water vapour, then1812,8.6 would depend on the tem-perature profile and the absorption by the uniformly mixedgases, of which CO2 is the most important in this waveband.The1812,8.6 profile in Fig.10b also exhibits a marked de-crease with height in the atmosphere. Since the SO2 signalthat we wish to recover is masked by these other features dueto water vapour and its height variation, it is necessary to try
www.atmos-meas-tech.net/7/2807/2014/ Atmos. Meas. Tech., 7, 2807–2828, 2014

2820 A. J. Prata and C. Bernardo: A ground-based thermal camera
Figure 10. (a) 12–11 µm brightness temperature difference(1812,11) image of the Mt Etna plume. The panel to the rightshows a temperature-difference–height profile for one image col-umn, indicated by the vertical line on the image.(b) As for (a) butfor the temperature difference between the 12 and 8.6 µm channels(1812,8.6). The height profile for the same column as(a) is shownto the right of this image.
to remove them so that a background value (SO2-free atmo-sphere) for1812,8.6 can be found. This is the purpose of thefitting procedure described earlier.
In the discussion so far we have not looked at the influ-ence of meteorological clouds. Correcting for their effectsand attempting to retrieve SO2 in the presence of clouds isextremely difficult using thermal data as it is necessary toknow the microphysics (particle size, shapes and size distri-butions) as well as the thermodynamic phase of the clouds.The approach taken here is to try to detect clouds and otherinterfering substances (e.g. volcanic ash) and flag these im-age pixels as erroneous. Figure11a and b show an exam-ple of cloud detection in Cyclops imagery. Figure11a showsthe 1812,8.6 as before, with a single1812,8.6–height pro-file taken through what appears to be a small meteorologicalcloud. The profile shows that the anomaly due to this fea-ture is less negative than the rest of the profile and the differ-ence approaches 0 K. When the corrections for the verticalvariation of water vapour are taken into account, this featureappears as a positive anomaly and would be retrieved as a
Figure 11. (a) 12–8.6 µm brightness temperature difference(1812,8.6) image of the Mt Etna plume. The panel to the rightshows a temperature-difference–height profile for an image columnthat intersects a small meteorological cloud.(b) As for (a) but theheight profile now intersects a portion of the Etna SO2 plume.
Figure 12. 12–8.6 µm brightness temperature difference image ofthe Stromboli plume acquired during a small explosive eruption.The panel to the right shows a temperature-difference–height profilefor an image column that intersects the ash cloud eruption.
negative SCD and hence is flagged as erroneous. In Fig.11bwe illustrate how an SO2 anomaly in the same image appearsto cause an opposite effect to that of meteorological waterclouds.
Atmos. Meas. Tech., 7, 2807–2828, 2014 www.atmos-meas-tech.net/7/2807/2014/

A. J. Prata and C. Bernardo: A ground-based thermal camera 2821
Figure 13. (a) Brightness temperature versus height variation forthe 12 µm filter (812) (b) As for (a) but for the 8.6 µm filter (88.6).(c) The 8.6–12 µm brightness temperature difference (188.6,12).The curved lines are least-squares second-degree polynomial fitsbased on profile data above the plume, and extrapolated throughand below the plume.
Ash can also interfere with the retrieval scheme, and ashclouds are often encountered with SO2 gas emissions. Fig-ure 12 illustrates the effect of an ash plume eruption on the12–8.6 µm temperature difference. The ash plume eruptionwas identified in consecutive image frames (different spectralchannels) separated by∼ 1 s that captured the rapid evolutionof the cloud when compared to an SO2 gas emission. Theash cloud is also clearly discerned against the backgroundatmosphere and the SO2 gas, through its positive tempera-ture difference anomaly. As with meteorological clouds, anash cloud anomaly is easily identified and removed from theanalyses (see also Fig.17a). Having established that SO2 canbe identified and discriminated from other features, we nowturn to the quantification of SO2 retrieval and begin with asimple case where SO2 is the only emission.
5.1 Port Pirie, South Australia
In order to test the ability of the camera to measure SO2,it was taken to a smelter and pointed towards a tall stackknown to be emitting an SO2 plume. The Port Pirie leadsmelter, in South Australia (33.18◦ S, 138.02◦ E), is the sin-gle largest lead smelter in Australia, with mean SO2 emis-sions of 1 kg s−1 (80–130 t d−1; seehttp://www.epa.sa.gov.au/). The plume is invisible to the eye (low water content) andemanates from a∼ 200 m tall stack. The camera was placed∼ 570 m from the stack and viewed it from the ground, look-ing upwards at an elevation angle of 15◦ with a clear blue skybackground. Measurements were made continuously, whichprovided SO2 estimates at intervals of 4–6 min. The length oftime between samples is determined principally by the speedof data transfer and to a lesser degree by the need for captur-ing images at several wavelengths (different filters) and foracquiring calibration data. A typical sequence consisted offive measurements of the blackbody shutter (one measure-ment for each filter), followed by five measurements of the
Figure 14. Cyclops measurements of the SO2 plume from theindustrial stack at the Port Pirie lead smelter, showing differentbehaviours of the plume.(a) Lofted plume,(b) fumigation and(c) grounding.
www.atmos-meas-tech.net/7/2807/2014/ Atmos. Meas. Tech., 7, 2807–2828, 2014

2822 A. J. Prata and C. Bernardo: A ground-based thermal cameraD
iscussionPaper
|D
iscussionPaper
|D
iscussionPaper
|D
iscussionPaper
|
FIGURE 15. Cyclops viewing a distant (∼17 km) SO2 plume from Mt Etna, Sicily. The frames illustratedifferent emission behaviour of the Etna plume. (a) Continuous gas emissions, trapped within the bound-ary layer, (b) plume rise after the sun has risen,(c) and (d) bifurcation of the plume – it is not possible totell whether the bifurcating plumes are coplanar or whether one plume is moving away from or towardsthe camera, (e) reduced activity with little or no gas plume visible, and (f) vigorous gas pulse with anindication of a column and some horizontal dispersion. Note that the apparent high SO2 SCDs just below5.52 km height and near ∼ -4.9 km are probably artefacts due to difficulties in calibrating the images onone part of the focal plane array.
47
Figure 15.Cyclops viewing a distant (∼ 17 km) SO2 plume from Mt Etna, Sicily. The frames illustrate different emission behaviour of theEtna plume.(a) Continuous gas emissions, trapped within the boundary layer;(b) plume rise after the sun has risen;(c) and(d) bifurcationof the plume – it is not possible to tell whether the bifurcating plumes are coplanar or whether one plume is moving away from or towards thecamera;(e) reduced activity with little or no gas plume visible; and(f) vigorous gas pulse with an indication of a column and some horizontaldispersion. Note that the apparent high SO2 SCDs just below 5.52 km height and near∼−4.9 km are probably artefacts due to difficulties incalibrating the images on one part of the focal plane array.
scene (the SO2 plume), followed by a further five measure-ments of the blackbody shutter. Radiosonde profiles fromAdelaide International Airport (about 30 km distant) wereacquired for use in calculating the water vapour corrections;however the corrections were small and below the noise limit
of the camera and were not applied in the retrieval. TheSO2 signal was very large and clear in the data; however itwas necessary to use a second-degree polynomial fit to thebrightness-temperature–height profiles (Fig.13).
Atmos. Meas. Tech., 7, 2807–2828, 2014 www.atmos-meas-tech.net/7/2807/2014/

A. J. Prata and C. Bernardo: A ground-based thermal camera 2823
Discussion
Paper
|D
iscussionPaper
|D
iscussionPaper
|D
iscussionPaper
|
0 1 2 3 4 5 6 7Time (hours)
0
5.0•1017
1.0•1018
1.5•1018
2.0•1018
2.5•1018
3.0•1018
Mea
n a
bso
rber
am
ou
nt
(mo
l cm
-2)
FIGURE 16. Variation of the mean SCD (molecules cm−2) as a function of time for the Etna plume overa period of 7 hours, starting from midnight until 07:00 LT the following day.
48
Figure 16.Variation of the mean SCD (molecules cm−2) as a func-tion of time for the Etna plume over a period of 7 h, starting frommidnight until 07:00 LT the following day.
The final fits and retrieval were robust. Figure14a–c showa sequence of SO2 retrievals illustrating the behaviour of thegas plume. At the start of the sequence (Fig.14a), the plumerose∼ 50 m above the stack and then became bent over inthe light winds. Later, the plume fumigated (Fig.14b), andeventually, with a change in wind speed and direction, theplume became stronger and was carried away from the view-ing site (Fig.14c). It should be noted that, with one camera,it is not possible to discern the direction of travel of thesegas plumes in the plane aligned with the camera viewing di-rection. For quantitative studies of gas plumes it would bepreferable to use three cameras spaced at 120◦ to each other.The mean SCD for the Port Pirie plume on this day was∼ 3× 10¹⁹ molecules cm−2, with instantaneous maximumSCD near the stack exit exceeding 1020 molecules cm−2. Itis possible to estimate the average SO2 emission rate fromthese data using estimates of the wind speed at stack heightand the effective plume dimensions. An estimate of the SO2emission rate can be found from
F = ρAu, (39)
whereF is the emission rate (in kg s−1), ρ is the concentra-tion (in kg m−3), A is the cross-sectional area of the plume(m2), andu is the wind speed (in m s−1) at plume height.Wind speeds at 200 m were∼ 3–5 m s−1 and the plumewidth (measured at half maximum) was taken as∼ 20 m(see Fig.14). These values give emission rates of∼ 1.5–2.5 kg s−1, slightly higher than the mean emissions reported.In principle it is also possible to estimate the plume speedby tracking features in the plume (e.g.Bluth et al., 2007);however in the current configuration of the camera, the datacapture and calibration cycles require∼ 5 min to completeand thus feature tracking is difficult. The success of this fieldtrial at a site where SO2 could be independently identifiedand measured gave us confidence to test Cyclops at activevolcanoes.
5.2 Etna volcano, Italy
In September 2003 the camera was taken to Mt Etna on theisland of Sicily to conduct SO2 measurements under fieldconditions. Measurements were made from several locations,in most cases more than 10 km from the active vent. Theretrieval of SO2 from Etna is illustrated in Fig.15. At onesite, the camera was mounted on a rooftop in the village ofNicolosi, approximately 17 km from Etna, and viewed theplume almost due north (350◦ azimuth) at an elevation an-gle of about 20◦. At this low angle and distance, the wa-ter vapour path was significant and we regard this viewingconfiguration as being at the limit of the camera’s capabil-ity. The data were acquired at 4–6 min intervals throughoutthe evening and into the following morning with no oper-ator intervention and utilising automatic shutter calibration.The raw images were converted to brightness temperaturesusing pre-computed laboratory calibrations and adjusted us-ing the off-set shutter calibration procedure. During the se-quence of measurements, the plume was blown in a NWdirection and was confined to the boundary layer, remain-ing below∼ 5 km (a.s.l.) most of the time. In the morning,with the break-up of the nocturnal inversion layer, the plumewas observed to rise (Fig.15b). Some variability in the SO2gas emission rate was observed over the period with quies-cent periods (Fig.15e), strong puffing activity (Fig.15f) andplume bifurcation (Fig.15c, d).
Emission rates can be determined, as before, fromEq. (39). Values forA andu are not known accurately, butassuming the plume to be symmetric, the data suggest anaverage plume depth of∼ 500 m. The mean plume speedwas estimated by running a trajectory model – HYSPLIT(Draxler and Rolph, 2003) – starting from the summit el-evation at 23:00 LT on 22 September 2003 and run for-wards for 8 h. The trajectory of the plume found this waywas towards the NW with a mean wind speed (over 8 h) of∼ 2 m s−1. Using these values, we findF =∼ 10–20 kg s−1,and the variation with time over 7 h of continuous measure-ments is shown in Fig.16. There are many (unsystematic)measurements of Etna SO2 emission rates reported in theliterature based on different measurement techniques (e.g.Jaeschke et al., 1982; Teggi et al., 1999; Barrancos et al.,2008; Oppenheimer et al., 2006; Bobrowski et al., 2006).These report in situ, remotely sensed UV and IR, ground,aircraft and satellite platform-based retrievals from differ-ent years and different months. The variability is high, de-pending on the degassing phase of activity with emissionrates varying from 11 kg s−1 (Oppenheimer et al., 2006), to82.2 kg s−1 (Teggi et al., 1999). A proper, statistical evalua-tion and intercomparison of the IR camera retrievals is be-yond the scope of this paper, but new work resulting froma volcanic plume workshop, where several UV cameras andthe IR camera are compared, has been submitted for publica-tion (Kern et al., 2014; Prata et al., 2014; Lopez et al., 2014).
www.atmos-meas-tech.net/7/2807/2014/ Atmos. Meas. Tech., 7, 2807–2828, 2014

2824 A. J. Prata and C. Bernardo: A ground-based thermal cameraD
iscussionPaper
|D
iscussionPaper
|D
iscussionPaper
|D
iscussionPaper
|
FIGURE 17. Stromboli SO2 observed from two different sites, ∼1.7 km and ∼2.3 km from the activecrater. (a) shows an image where there was a small ash eruption obscuring the SO2. The ‘ashy’ parts ofthe cloud can be masked out by using different channels. Local Time (LT)=UTC+2.
49
Figure 17. Stromboli SO2 observed from two different sites,∼ 1.7 and∼2.3 km from the active crater.(a) shows an image where therewas a small ash eruption obscuring the SO2. The “ashy” parts of the cloud can be masked out by using different channels. Local time(LT) = UTC+2.
5.3 Stromboli volcano Italy
Measurements at Stromboli were made on two separate oc-casions in late September 2003. Stromboli is an active strato-volcano which has been erupting and degassing SO2 through-out historical time. The effusive activity is observed fromfour vents near the summit and usually consists of smallexplosions followed by a period of quiescence which lastsfrom 10 min to a few hours (Andronico et al., 2008). Very lit-tle ash was observed during the activity in September 2003.The Cyclops camera was used from two locations: near sealevel from the rooftop of a hotel (site A) and∼ 2.3 kmENE from the active crater, and nearer the volcano at Se-maforo Labronzo (site B), 120 m a.s.l., and∼ 1.7 km northof the crater. At both locations the camera elevation was high(>25◦).
Long sequences of images were captured at both sites.The SO2 plume was often mixed with water vapour(judged by its white appearance) and tended to eruptin puffs and disperse in the light winds (< 5 m s−1).The retrievals indicate that total SO2 SCDs varied from1.1± 0.2× 10¹⁸ to 3.1± 0.6× 10¹⁸ molecules cm−2 at site
B and 1.4± 0.3× 10¹⁸ to 2.3± 0.5× 10¹⁸ molecules cm−2
at site A. Individual plumes had variations from∼ 2× 10¹⁷
to ∼ 3× 10¹⁸ molecules cm−2, but these values are difficultto interpret in terms of concentrations because the plumedepth is variable and unknown. Some examples of the re-trievals at both sites are shown in Fig.17. Measurementsfrom site A were made in the late afternoon, and the gasemissions appeared to be continuous. At site B, measure-ments were made in the evening after the Sun had set, andthe gas emissions occurred frequently as discrete puffs. Ex-plosions were also heard and several were imaged by thecamera. Since the presence of ash can confound the retrievalscheme, it is important that the algorithm be insensitive toash or be able to flag regions of the sky contaminated byash. Figure 17a shows an occasion when an explosion oc-curred during the imaging. In this case the algorithm hasrejected pixels that are ash-contaminated, and this is indi-cated on the image by the grey-coloured region. Within thisregion no SO2 can be retrieved, and consequently the totalSCD for the whole plume will be underestimated.Kern et al.(2014) report measurements from a several UV camera sys-tems during an inter-comparison experiment on Stromboli
Atmos. Meas. Tech., 7, 2807–2828, 2014 www.atmos-meas-tech.net/7/2807/2014/
A. J. Prata and C. Bernardo: A ground-based thermal camera 2825
in June 2013. The UV retrievals (SCDs) ranged from 2 to4× 1018 molecules cm−2.
6 Conclusions
An instrument for measuring atmospheric gases using pas-sive thermal infrared imaging radiometry has been success-fully tested, and a scheme for retrieving the SCD utilisingmultispectral imagery has been derived. The camera systemwas tested at an industrial site and at two volcanic sites whereplumes of SO2 were present. The instrument proved reliableand was able to detect SO2 in the presence of water vapour.Cloud features and ash particles that interfere with the SO2measurements could be detected using the multispectral na-ture of the imagery and removed from the analyses. The re-trieval scheme proposed relies on spectral temperature differ-ence measurements and is sensitive to channel NE1T ’s es-timated to be 0.1–0.8 K after frame averaging. The error onthe retrieval was estimated to be±20 %, due mostly to theNE1T error, but with a significant error to due to inaccuratemeasurement of the plume temperature. The bias error is es-timated to be variable within the range−5 to+6 %, which isslightly poorer than the calibration errors reported byShawet al.(2005) for their broadband camera.
The infrared camera is capable of providing 320×
240 pixel images at frame rates as high as 60 Hz. However,it was found that noise considerations and data capture ratesreduced this sampling frequency to several minutes. The lim-itation in sampling frequency is dominated by the slow datatransfer rates, which can be easily overcome6. Faster sam-pling would allow for measurements of the dynamic evolu-tion of plumes, and feature tracking could then be used as ameans to determine gas emission rates. A more fundamen-tal limitation is the NE1T of the spectrally filtered channels.There are cameras available commercially with NE1T ’s of< 20 mK and 60 Hz frame rates that can provide retrieval er-rors in SCDs below 10 %. Many improvements to the systemcan be envisaged. By viewing a target using three cameras ar-ranged with an angular spacing of 120◦, a three-dimensionalimage could be acquired and quantitative measures of plumedimensions and plume morphology derived. Addition of fil-ters centred at different wavelengths would also permit arange of other gases to be measured. The camera could alsobe used in atmospheric research for studies of the radiativeeffects of clouds on the Earth’s radiation balance (Smith andToumi, 2008) and to image toxic gases from industrial acci-dents or from deliberate gas releases, where personal safetyis a major issue.
6The data transfer rate limitation is simply a feature of this par-ticular thermal camera.
The system described here has been operated from theground, but it is quite feasible to use the system from an air-borne platform. In this case, operation from higher altitudewould permit the use of spectral filters at wavelengths wherewater vapour is a problem in ground-based use. A filter situ-ated near the 7.3 µm band would have 3 to 5 times the sensi-tivity to SO2 as the 8.6 µm filter used here. One applicationfor this technology in airborne use would be to mount the in-strument to view forwards from a high-altitude passenger jetaircraft. In this case it would be necessary to remove the fil-ter wheel and use multiple cameras in order to achieve fastersampling rates. The cameras would offer the potential as anon-board early warning device for hazards ahead of the air-craft (Prata and Barton, 1993). Hazards include volcanic ashand potentially small (∼ 1–20 µm particle radii) ice crystalsand clear-air turbulence that may be detected through imag-ing water vapour anomalies. Enhanced night-time viewingcapability is another feature of this technology that might beuseful for jet aircraft.
Integration of the camera with other instruments is fea-sible. For example, infrasound arrays, ground-based lidars,ultraviolet cameras and spectrometers, and FT-IRs all offercomplementary information which would enhance the abil-ity of a system to detect a suite of gases and measure theirconcentrations and emission rates (e.g.Lopez et al., 2013).Further improvements to the system have been made, includ-ing integration of a webcam, low-light imager, Wi-Fi, andweather proofing. These are described inPrata et al.(2014).Stand-off, 24 h, autonomous operation of the Cyclops cam-era has been demonstrated at two active volcanoes, and plansare in place to deploy the system for long periods to test thedurability of the instrument and the reliability of the detectorcalibration methodology employed.
www.atmos-meas-tech.net/7/2807/2014/ Atmos. Meas. Tech., 7, 2807–2828, 2014

2826 A. J. Prata and C. Bernardo: A ground-based thermal camera
Appendix A: List of symbols used
B[λ,T ] Planck functionCl Camera line numberCc Camera column numberd Plume thicknessF Focal length of cameraIbi Background radiance in channeli
I fi Foreground radiance in channeli
Ipi Plume radiance in channeli
ki,q Absorption coefficient for channeli and absorberqL Path distance from camera to leading side of plumemq Slant column density (SCD) (= ρqd) for absorberqn Pixel numberNl Number of lines in the imageNc Number of columns in the imager Radiation path in the directionθ , φ
r1 Pathlength of plume radiation in the directionθn, φn
sn Size of pixelnTb Background temperatureTf Foreground temperatureTp Plume temperatureTs Scene temperaturex,y,z Cartesian coordinates as defined in Fig. 6δ8 Brightness temperature difference between the plume
and the background for channeli
δ8∗ Background brightness temperature differencebetween cannelj and channeli
18pi,j Plume brightness temperature difference
between channeli and channelj18
pi Brightness temperature difference between plume
temperature and background for channeli
18p,i Temperature difference between the plumeand channeli brightness temperature
εi,j Effective emissivity of plume using channels,i andj
λ Wavelength (µm)8f
i Foreground brightness temperature for channeli
8oi Atmospheric brightness temperature “outside”
the plume for channeli8
pi Plume brightness temperature for channeli
φn Azimuthal angle of pixeln9 Angular field of view of cameraρq Density of absorberqτi Atmospheric transmission for channeli
θn Elevation angle of pixelnζ Elevation of camera measured to the first line of the
imageχ Detector chip pitch (µm)
Atmos. Meas. Tech., 7, 2807–2828, 2014 www.atmos-meas-tech.net/7/2807/2014/

A. J. Prata and C. Bernardo: A ground-based thermal camera 2827
Acknowledgements.We are very grateful to the referees, who haveprovided critical and positive comments on the manuscript. Oneanonymous reviewer is thanked in particular for his/her detailedcomments on the mathematical development and for suggestionsto improve the paper. Many volcanology students and researchershave used the camera in the field and made helpful suggestions forimprovements. We acknowledge those people. David Moriano isthanked for stimulating discussions regarding the calibration andanalysis of the infrared imagery. Finally, the editor of this paper isthanked for guiding us through the stages of publication.
Edited by: D. Feist
References
Andronico, D., Corsaro, R., Cristaldi, A., and Polacci, M.: Charac-terizing high energy explosive eruptions at Stromboli volcano us-ing multidisciplinary data: An example from the 9 January 2005explosion, J. Volcanol. Geothermal Res., 176, 541–550, 2008.
Barrancos, J., Roselló, J. I., Calvo, D., Padrón, E., Melián, G.,Hernández, P. A., Pérez, N. M., Millán, M. M., and Galle, B.:SO2 emission from active volcanoes measured simultaneouslyby COSPEC and mini-DOAS, Pure Appl. Geophys., 165, 115–133, 2008.
Berk, A., Bernstein, L., Anderson, G., Acharya, P., Robertson, D.,Chetwynd, J., and Adler-Golden, S.: MODTRAN cloud and mul-tiple scattering upgrades with application to AVIRIS, RemoteSens. Environ., 65, 367–375, 1998.
Berk, A., Anderson, G. P., Bernstein, L. S., Acharya, P. K., Dothe,H., Matthew, M. W., Adler-Golden, S. M., Chetwynd Jr., J. H.,Richtsmeier, S. C., Pukall, B., et al.: MODTRAN4 radiativetransfer modeling for atmospheric correction, in: SPIE’s Interna-tional Symposium on Optical Science, Engineering, and Instru-mentation, International Society for Optics and Photonics, 348–353, 1999.
Bluth, G., Shannon, J., Watson, I., Prata, A., and Realmuto, V.: De-velopment of an Ultra-violet Digital Camera for Volcanic SO2Imaging, J. Volcanol. Geothermal Res., 161, 47–56, 2007.
Bobrowski, N., Honninger, G., Galle, B., and Platt, U.: Detection ofBromine Monoxide in a Volcanic Plume, Nature, 423, 273–276,2003.
Bobrowski, N., Hönninger, G., Lohberger, F., and Platt, U.: IDOAS:A new monitoring technique to study the 2D distribution of vol-canic gas emissions, J. Volcanol. Geothermal Res., 150, 329–338, 2006.
Burton, M., Oppenheimer, C., Horrocks, L., and Francis, P.: Re-mote Sensing of CO2 and H2O Emission Rates from MasayaVolcano, Nicaragua, Geology, 28, 915–918, doi:10.1130/0091-7613(2000)28<915:RSOCAH>2.0.CO;2, 2000.
Chu, P., Guenther, F., Rhoderick, G., and Lafferty, W.: The NISTQuantitative Infrared Database, J. Res. Natl. Inst. Stand. Tech-nol., 104, 59–81, 1999.
Davis, P. and Viezee, W.: A Model for Computing the InfraredTransmission Through Atmospheric Water Vapour and CarbonDioxide, J. Geophys. Res., 69, 3785–3794, 1964.
Derniak, E. and Boremann, G.: Infrared Detectors and Systems,John Wiley and Sons, Inc., 605 Third Avenue, New York, NY,561 pp., 1996.
Draxler, R. and Rolph, G.: HYSPLIT (HYbrid Single-Particle La-grangian Integrated Trajectory), NOAA Air Resources Labora-tory, Silver Spring, MD, USA, model access via NOAA ARLREADY Website (http://www.arl.noaa.gov/ready/hysplit4.html),2003.
Esler, M. B., Griffith, D. W., Wilson, S. R., and Steele, L. P.: Pre-cision trace gas analysis by FT-IR spectroscopy. 1. Simultaneousanalysis of CO2, CH4, N2O, and CO in air, Anal. Chem., 72,206–215, 2000.
Francis, P., Maciejewski, A., Oppenheimer, C., Chaffin, C., andCaltabiano, T.: SO2? HCl ratios in the plumes from Mt. Etna andVulcano determined by Fourier Transform Spectroscopy, Geo-phys. Res. Lett., 22, 1717–1720, 1995.
Gangale, G., Prata, A. J., and Clarisse, L.: The infrared spectral sig-nature of volcanic ash determined from high-spectral resolutionsatellite measurements, Remote Sens. Environ., 114, 414–425,2010.
Goff, F., Love, S. P., Warren, R., Counce, D., Obenholzner, J., Siebe,C., and Schmidt, S. C.: Passive infrared remote sensing evidencefor large, intermittent CO2 emissions at Popocatepetl Volcano,Mexico, Chemical Geology, 177, 133–156, 2001.
Horrocks, K.: Open-path Fourier Transform Infrared Spectroscopyof SO2: An Empirical Error Budget Analysis, with Implica-tions for Volcano Monitoring, J. Geophys. Res., 106, 7647–2765,2001.
Horton, K., Williams-Jones, G., Garbeil, H., Elias, T., Sutton, A.,Mouginis-Mark, P., Porter, J., and Clegg, S.: Real-time Measure-ment of Volcanic SO2 Emissions: Validation of a New UV Cor-relation Spectrometer (FLYSPEC), Bull. Volcanol., 68, 313–322,doi:10.1007/s00445-005-0026-5, 2006.
Jaeschke, W., Berresheim, H., and Georgii, H.-W.: Sulfur emissionsfrom Mt. Etna, J. Geophys. Res. Ocean., 87, 7253–7261, 1982.
Kern, C., Lübckeb, P., Bobrowski, N., Campion, R., Mori, T.,Smekens, J.-F., Stebel, K., Tamburello, G., Burton, M., Platt, U.,and Prata, A.: Intercomparison of SO2 camera systems for imag-ing volcanic gas plumes, J. Volcanol. Geothermal Res., in review,2014.
Kinoshita, K., Kanagaki, C., Minaka, A., Tsuchida, S., Matsui, T.,Tupper, A., Yakiwara, H., and Iino, N.: Ground and SatelliteMonitoring of Volcanic Aerosols in Visible and Infrared Bands,CERes Int. Symp. On Remote Sensing–sMonitoring of Environ-mental Change in Asia, 16–17, chiba, Japan Dec., 2003.
Krueger, A., Stremme, W., Harig, R., and Grutter, M.: Volcanic SO2and SiF4 visualization using 2-D thermal emission spectroscopy– Part 2: Wind propagation and emission rates, Atmos. Meas.Tech., 6, 47–61, doi:10.5194/amt-6-47-2013, 2013.
Kruse, P.: Uncooled Thermal Imaging: Arrays, Systems, and Ap-plications, SPIE Press (TT51), 90 pp., Bellingham, Washington.,2001.
Lentile, L. B., Holden, Z. A., Smith, A. M., Falkowski, M. J., Hu-dak, A. T., Morgan, P., Lewis, S. A., Gessler, P. E., and Benson,N. C.: Remote sensing techniques to assess active fire charac-teristics and post-fire effects, Int. J. Wildland Fire, 15, 319–345,2006.
Lopez, T., Fee, D., Prata, F., and Dehn, J.: Characterization andinterpretation of volcanic activity at Karymsky Volcano, Kam-chatka, Russia, using observations of infrasound, volcanic emis-sions, and thermal imagery, Geochem. Geophys. Geosys., 14,5106–5127, 2013.
www.atmos-meas-tech.net/7/2807/2014/ Atmos. Meas. Tech., 7, 2807–2828, 2014

2828 A. J. Prata and C. Bernardo: A ground-based thermal camera
Lopez, T., Thomas, H., Prata, A., Amigo, A., and Fee, D.: Vol-canic plume characteristics determined using an infrared imag-ing camera, J. Volcanol. Geothermal Res., 14, 5106–5127,doi:10.1002/2013GC004817, 2014.
Love, S., Goff, F., Counce, D., Siebe, C., and Delgado, H.: Passiveinfrared spectroscopy of the eruption plume at Popocatepetl vol-cano, Mexico, Nature, 396, 563–567, 1998.
McGonigle, A.: Volcano Remote Sensing with Ground-based Spec-troscopy, Phil. Trans. Roy. Soc. A, 363, 2915–2929, 2005.
McMillin, L. and Crosby, D.: Theory and Validation of the MultipleWindow Sea Surface Temperature Technique, J. Geophys. Res.,89, 3655–3661, 1984.
Notsu, K., Mori, T., Igarashi, G., Tohjima, Y., and Wakita, H.: In-frared Spectral Radiometer: A New Tool for Remote Measure-ment of SO2 of Volcanic Gas, Geochem. J., 27, 361–366, 2003.
Oppenheimer, C., Francis, P., Burton, M., Maciejewksi, A. J. H.,and Boardman, L.: Remote Measurement of Volcanic Gases byFourier Transform Infrared Spectroscopy, Appl. Phys. B, 67,505–515, 1998.
Oppenheimer, C., Edmonds, M., Francis, P., and Burton, M.: Vari-ation in HCl/SO2 Gas Ratios Observed by Fourier TransformSpectroscopy At Soufriere Hills, edited by: Druitt, T. H. andKokelaar, P., Geol. Soc. London Mem., 21, 621–639, the erup-tion of Soufriere Hills volcano, Montserrat, from 1995 to 1999,2002.
Oppenheimer, C., Tsanev, V. I., Braban, C. F., Cox, R. A., Adams,J. W., Aiuppa, A., Bobrowski, N., Delmelle, P., Barclay, J., andMcGonigle, A. J.: BrO formation in volcanic plumes, Geochim.Cosmochim. Acta, 70, 2935–2941, 2006.
Prata, A.: Satellite Detection of Hazardous Volcanic Clouds andthe Risk to Global Air Traffic, Nat. Hazards, 51, 303–324,doi:10.1007/s11069-008-9273-z, 2009.
Prata, A. and Barton, I.: Detection System for Use in an Aircraft,Australian Patent No PJ9518, European Patent No 91907594.5,US Patent, No. 5, 602, 1993.
Prata, A. and Bernardo, C.: Retrieval of Volcanic Ash Particle Size,Mass and Optical Depth from a Ground-based Thermal InfraredCamera, J. Volcanol. Geothermal Res., 182, 91–107, 2009.
Prata, A., Bernardo, C., Simmons, M., and Young, W.: Ground-based Detection of Volcanic Ash and Sulphur Dioxide, Proc. ofthe 2nd International Conference on Volcanic Ash and AviationSafety, OFCM (Washington DC), Alexandria, Virginia, USA.,21–24, 2004.
Prata, A., Bernardo, C., Moriano, D., Thomas, H., and Ahonen,P.: Thermal imaging cameras: Technical description and appli-cations in volcanology, Journal of Volcanology and GeothermalResearch, in revision, 2014.
Pugnaghi, S., Teggi, S., Corradini, S., Buongiorno, M., Merucci, L.,and Bogliolo, M.: Estimation of SO2 Abundance in the EruptionPlume of Mt Etna Using Two MIVIS Thermal Infrared Channels:A Case Study from the Sicily-1997 Campaign, Bull. Volcanol.,64, 328–337, doi:10.1007/s00445-002-0211-8, 2002.
Realmuto, V. J., Hon, K., Kahle, A. B., Abbott, E. A., and Pieri,D. C.: Multispectral thermal infrared mapping of the 1 October1988 Kupaianaha flow field, Kilauea volcano, Hawaii, Bull. Vol-canol., 55, 33–44, 1992.
Rothman, L. L., Barbe, S. A., Chris Benner, D., Brown, L. R.,Camy-Peyret, C., Carleer, M. R., Chance, K., Clerbaux, C.,Dana, V., Devi, V. M., Fayt, A., Flaud, J.-M., Gamache, R. R.,Goldman, A., Jacquemart, D., Jucks, K. W., Lafferty, W. J.,Mandin, J.-Y., Massie, S. T., Nemtchinov, V., Newnham, D. A.,Perrin, A., Rinsland, C. P., Schroeder, J., Smith, K. M., Smith, M.A. H., Tang, K., Toth, R. A., Vander Auwera, J., Varanasi, P., andYoshino, K.: The HITRAN Molecular Spectroscopic Database:Edition of 2000 Including Updates of 2001, J. Quant. Spec. Rad.Trans., 82, 1–4, 2003.
Sawyer, G. M. and Burton, M. R.: Effects of a volcanic plumeon thermal imaging data, Geophys. Res. Lett., 33, L14311,doi:10.1029/2005GL0253202006, 2006.
Shaw, J., Nugent, P., Thurairajah, B., and Mizutani, K.: Radiomet-ric Cloud Imaging with an Uncooled Microbolometer ThermalInfrared Camera, Optics Express, 13, 5807–5817, 2005.
Smith, S. and Toumi, R.: Direct observation of cloud forcing byground-based thermal imaging, Geophys. Res. Lett., 35, L07814,doi:10.1029/2008GL033201, 2008.
Stremme, W., Krueger, A., Harig, R., and Grutter, M.: Volcanic SO2and SiF4 visualization using 2-D thermal emission spectroscopy– Part 1: Slant-columns and their ratios, Atmos. Meas. Tech., 5,275–288, doi:10.5194/amt-5-275-2012, 2012.
Strow, L. L., Hannon, S. E., Souza-Machado, D., Motteler, H. E.,Tobin, An overview of the AIRS radiative transfer model, Geo-science and Remote Sensing, IEEE Trans., 41, 303–313, 2003.
Teggi, S., Bogliolo, M., Buongiorno, M., Pugnaghi, S., and Sterni,A.: Evaluation of SO2 emission from Mount Etna using diurnaland nocturnal multispectral IR and visible imaging spectrometerthermal IR remote sensing images and radiative transfer models,J. Geophys. Res. Sol. Earth, 104, 20069–20079, 1999.
Wright, R., Flynn, L. P., Garbeil, H., Harris, A. J., and Pilger, E.:MODVOLC: near-real-time thermal monitoring of global vol-canism, J. Volcanol. Geothermal Res., 135, 29–49, 2004.
Atmos. Meas. Tech., 7, 2807–2828, 2014 www.atmos-meas-tech.net/7/2807/2014/