retirement patterns in europe: evidence from share
DESCRIPTION
Retirement Patterns in Europe: Evidence from SHARE. Agar Brugiavini 22 November 2006. Dipartimento di Scienze Economiche – Università Ca’ Foscari di Venezia. SHARE : Survey of Health, Ageing and Retirement in Europe: „50+ in Europa“. Reddito e ricchezza personale. Politiche sociali. - PowerPoint PPT PresentationTRANSCRIPT

Retirement Patterns in Europe: Evidence from SHARE
Agar Brugiavini22 November 2006

2
Reddito e ricchezza personale
Parenti, vicini, condizioni abitative
Salute fisica e mentale, disabilità, mortalità
Processo dinamico
dati longitudinali
Politiche sociali
Dipartimento di Scienze Economiche – Università Ca’ Foscari di Venezia
SHARE: Survey of Health, Ageing and Retirement in Europe: „50+ in Europa“

3
Dipartimento di Scienze Economiche – Università Ca’ Foscari di Venezia
SHARE è un indagine condotta contemporaneamente in numerosi Paesi europei: 11 nel 2004, 14 nel 2006.
E’ finanziata prevalentemente dall’Unione Europea, ma anche dal National Institute of Aging americano
Raccoglie informazioni su salute, rapporti interpersonali, reddito ed aspettative degli individui sopra i cinquanta anni di età – E SEGUE QUESTI INDIVIDUI NEL TEMPO!
Il coordinatore europeo è Axel Börsch-Supan,

***
Israel
SE
DK
IR
DE
CH
ATFR
SP IT
GR
BENL PL
CZ
UK
USA
Prima fase 2004: 27.000 individui
KoreaJapan

La salute in Europa
• Molti sono in buona salute: uomini 60.5% buona o molto buona;
donne 52.5%Un terzo degli ultra-ottantenni non ha problemi di salute o malattie croniche!
• Abbiamo misurato la salute in tanti modi diversi – anche con test fisici
• Perché queste differenze fra Nord e Sud Europa? Reddito? Servizi sanitari? Stili diversi di risposta?
Men
Women
Cosa abbiamo finoraImparato da SHARE
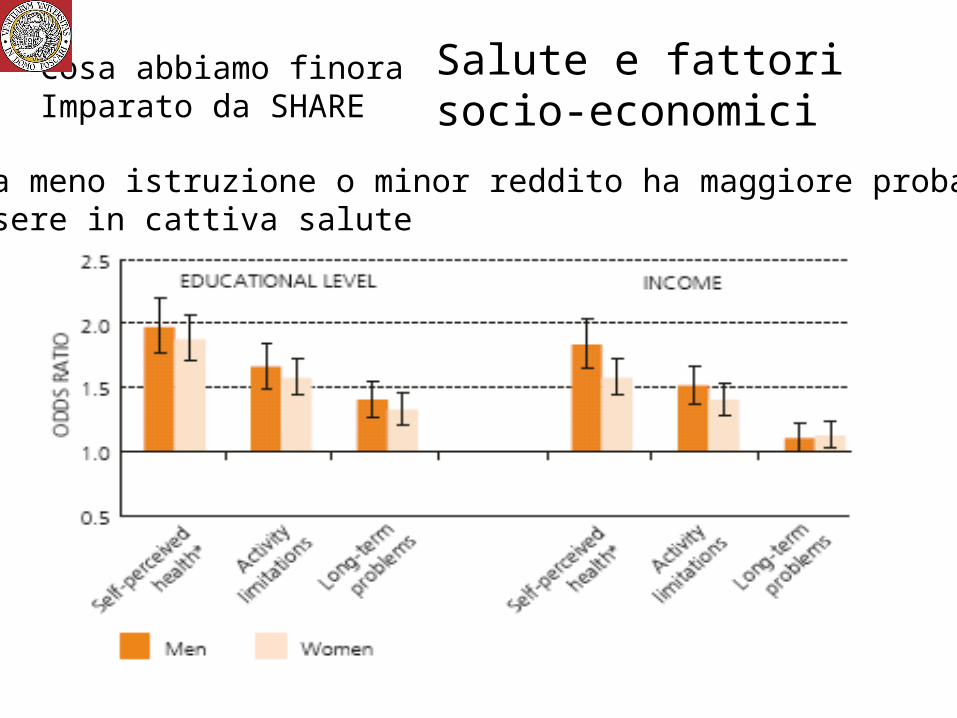
Salute e fattori socio-economici
Cosa abbiamo finoraImparato da SHARE
Chi ha meno istruzione o minor reddito ha maggiore probabilitàdi essere in cattiva salute

7
Dipartimento di Scienze Economiche – Università Ca’ Foscari di Venezia
Il modulo EP (Employment and Pensions) in SHARE
- Posizione nel mercato del lavoro (self-reported), ma poi si chiede se ha lavorato nell’ultimo mese
- Ai lavoratori: tutte le info sul lavoro corrente (inclusi redditi, soddisfazione etc..)
- Ai pensionati o disoccupati: info sui redditi e sul “past job”. Motivi di uscita dal mercato del lavoro
- A tutti: redditi attesi da pensione

Self-reported Economic Activity by Age
0.2
.4.6
.81
50 60 70 80 90age of respondent
employed retired allother
Self-reported Economic Activity by Age

9
Distribution of Economically Active Individuals by Gender and Age-class
0.2
.4.6
.81
SE DK DE NL BE FR CH AT ES IT GR
Women working
50-54 55-59 60-64 65+0
.2.4
.6.8
1SE DK DE NL BE FR CH AT ES IT GR
Men working
50-54 55-59 60-64 65+

10
0.2
.4.6
.81
50 55 60 65 70 75 80age of respondent
se nl dk be
Distribution of Retirees for Northern Countries
0.2
.4.6
.81
50 55 60 65 70 75 80age of respondent
at de fr ch
Distribution of Retirees for Mid-European Countries
0.2
.4.6
.81
50 55 60 65 70 75 80age of respondent
es it gr
Distribution of Retirees for Southern Countries
Distribution of Retirees

11
Average Age Receiving a Pension for the First TimeWOMEN
0
10
20
30
40
50
60
70
SE DK DE NL BE FR CH AT ES IT GR
public and private old age and early retirement pension disability and invalidity/incapacity pension
MEN
0
10
20
30
40
50
60
70
SE DK DE NL BE FR CH AT ES IT GR
public and private old age and early retirement pension disability and invalidity/incapacity pension

12
Economic Activity and Physical Health
0.2
.4.6
SE DK DE NL BE FR CH AT ES IT GR
Economic activity of 'healthy' respondents
worker retired but work retired allother
0.2
.4.6
SE DK DE NL BE FR CH AT ES IT GR
Economic activity of 'functioning' respondents
worker retired but work retired allother
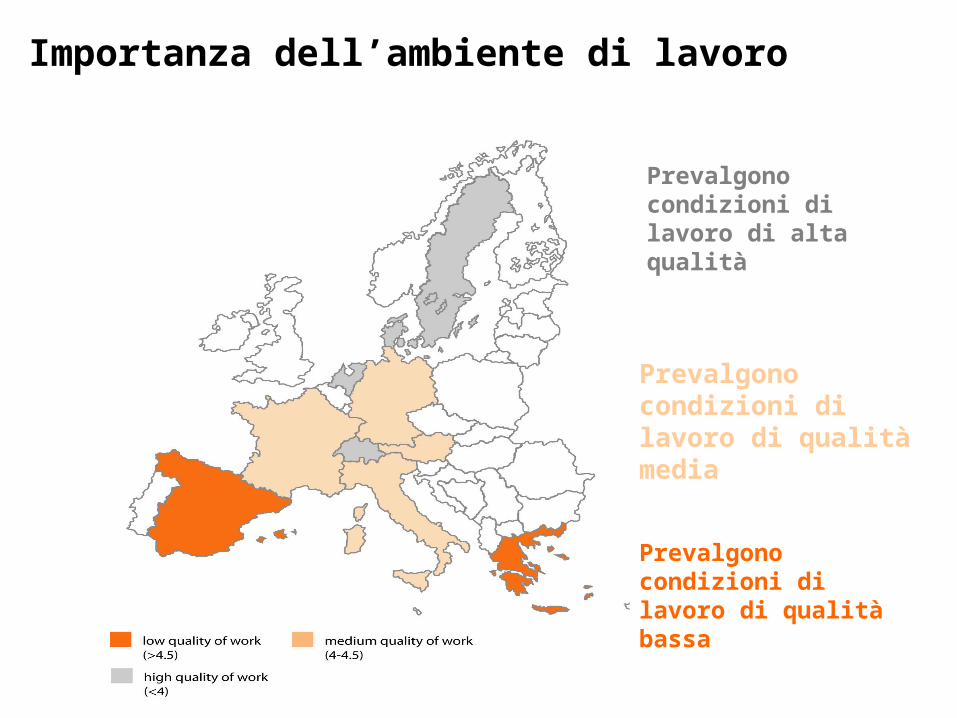
Prevalgono condizioni di lavoro di qualità media
Prevalgono condizioni di lavoro di qualità bassa
Prevalgono condizioni di lavoro di alta qualità
Importanza dell’ambiente di lavoro

14
Retirement: a Relief or a Concern?
p
CH
DK
AT
DE NL
ESIT GR
BEFR
SE
Relief Concern Neither Both

15
Reasons for Retirement - Women
WOMEN 60-64
0
10
20
30
40
50
60
70
80
90
100
SE DK DE NL BE FR CH AT ES IT GR
Eligible Early-preretirement Health-problems Enjoy life Other

16
Reasons for Retirement - Men
MEN AGED 60-64
0
10
20
30
40
50
60
70
80
90
SE DK DE NL BE FR CH AT ES IT GR
Eligible Early-preretirement Health-problems Enjoy life Other

17
Motivation for econometric model
Retirement (and labor force participation) decisions may depend on a number of factors, including health
On top of individual determinants (preferences and socio-economic conditions) take into account the role of institutions

18
Theoretical Framework
Following Grossman (1972a, 1972b, 2000) and Currie and Madrian (2000), assume individuals derive utility from consumption, leisure and also, directly from health. They maximize the following intertemporal utility function.
Implications: Health is valued by individuals both for its own sake
and because being sick is assumed to take time away from market and non-market activities.
The stock of health today depends on past investments in health.
Non-market time is an input into both health production and the production of other valued non-market goods (e.g., leisure activities).

19
Theoretical Framework
Hence individuals maximize utility taking into account the investment in health (optimal path for marginal product of health capital)
This model can be solved to yield a conditional labor supply function in which labor supply depends on the endogenous health variable
From an empirical point of view, the main implication of the model is that health must be treated as an endogenous choice.

20
Econometric Evidence Model probability of being retired derived from FOC
Probability [being Retired] – Dependent variable: – Retired indicator = 1 if (self-reported as) currently retired– 0 otherwise– Sample: Workers and Pensioners - Aged 50-70
IV-probit– First show Probit analysis – then show IV-Probit– Note: country-age and country*age variability does not exhaust
explanatory power of other variables

21
Econometric Evidence Basic regressors common to all models With country dummies (Germany dummy
omitted) Measure of Social Security Wealth (SSW):
SSWREL: SSW/total household income IADL Index for health (cumulative number of
failures in instrumental activities and activities of DL)

22
Econometric Evidence
Instrumental variables– Social Security Wealth (SSW) Instrumented
with occupational indicators– IADL – index In line with the theory
highlighted we make use for IADL of retrospective questions (“ever smoked”, “ever been depressed”, age of parents at death or if parent survived a target age), material inputs for health (vigorous physical activity) plus subjective survival probability.
23
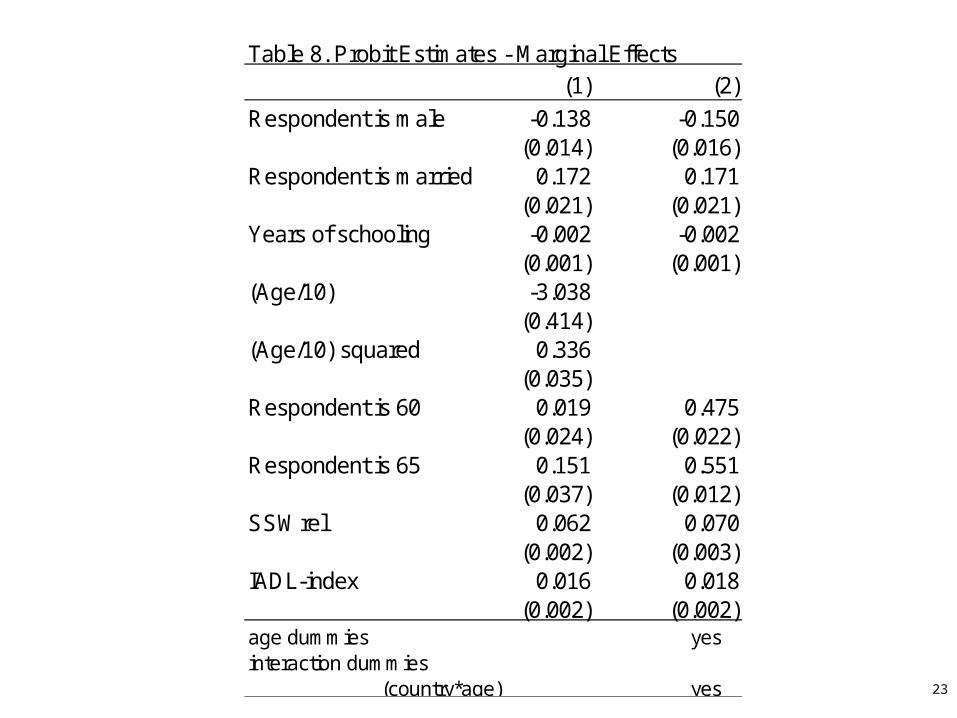
Table 8. Probit Estimates - Marginal Effects (1) (2)
Respondent is male -0.138 -0.150(0.014) (0.016)
Respondent is married 0.172 0.171(0.021) (0.021)
Years of schooling -0.002 -0.002(0.001) (0.001)
(Age/10) -3.038(0.414)
(Age/10) squared 0.336(0.035)
Respondent is 60 0.019 0.475(0.024) (0.022)
Respondent is 65 0.151 0.551(0.037) (0.012)
SSWrel 0.062 0.070(0.002) (0.003)
IADL-index 0.016 0.018(0.002) (0.002)
age dummies yesinteraction dummies
(country*age) yes

24
Table 8. Probit Estimates - Marginal Effects , cont (1) (2)
(0.027) (0.069)DK 0.078 0.231
(0.028) (0.053)NL -0.172 -0.162
(0.030) (0.071)BE 0.086 0.143
(0.034) (0.073)FR 0.102 0.104
(0.024) (0.056)CH -0.169 -0.175
(0.041) (0.103)AT 0.292 0.366
(0.016) (0.036)ES -0.080 0.017
(0.041) (0.089)IT 0.217 0.246
(0.020) (0.051)GR 0.192 0.355
(0.023) (0.040)age dummies yesinteraction dummies
(country*age) yes

25
Table 9. Instrumental Variable Estimates - IV Probit
Coeff. M.E.
Respondent is male -0.256 -0.097(0.087)
Respondent is married 0.761 0.291(0.200)
Years of schooling 0.002 0.001 '(.003)
(Age/10) -11.049 -4.178( 2.137)
(Age/10) squared 1.074 0.406(0.189)
Respondent is 60 0.120 0.045(0.141)
Respondent is 65 0.074 0.028(0.186)
SSWrel 0.254 0.096(0.061)
IADL-index 0.087 0.033(0.026)
26
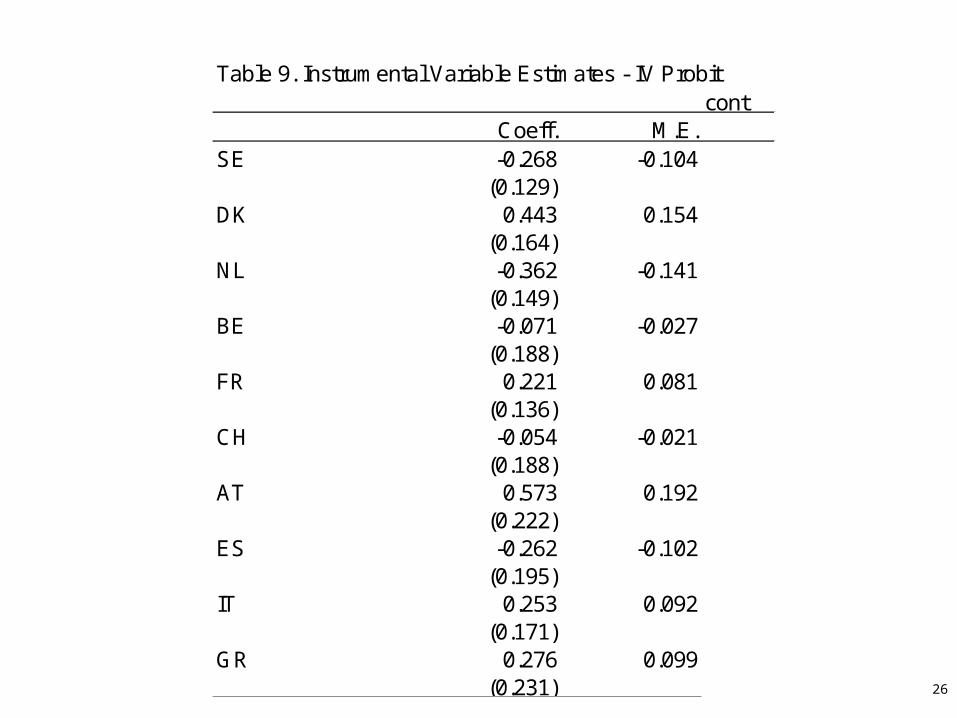
Table 9. Instrumental Variable Estimates - IV Probit cont
Coeff. M.E.SE -0.268 -0.104
(0.129)DK 0.443 0.154
(0.164)NL -0.362 -0.141
(0.149)BE -0.071 -0.027
(0.188)FR 0.221 0.081
(0.136)CH -0.054 -0.021
(0.188)AT 0.573 0.192
(0.222)ES -0.262 -0.102
(0.195)IT 0.253 0.092
(0.171)GR 0.276 0.099
(0.231)

27
Conclusions
Importance of various determinants of retirement Social Security Wealth and health still relevant
after including a whole battery of dummies; still of the expected sign after making use of IV, i.e. importance of institutions, even after controlling for other factors
In the future: model labor supply (hours of work)