rethinking the “interim measure” strategy for lnapl ... · rethinking the “interim measure”...
TRANSCRIPT

Rethinking the “Interim Measure”Strategy for LNAPL Remediation
Projects
Presented by:Conestoga-Rovers & Associates
Matthew RousseauDavid Cushman
Remediation Technologies SymposiumBanff, Alberta
October 16, 2008

Presentation AgendaInterim Measures defined:
What, where, why, and when?
LNAPL Conceptual Site Model (LCSM)Identification, characterization, delineation, mobility/recoverability evaluation, risk assessment
Case StudyExisting biosparge operations
LIF investigation
LNAPL mobility evaluation
Future actions

Interim Measures for LNAPLWhat?
“Temporary” engineering or institutional controls
Where?Typically wherever free product is observed above some in-well thickness threshold (e.g., greater than 0.01’ or a sheen)
Why?To be protective of human health and the environment while a final remedy is developed (i.e., temporarily mitigate risk)
When?Implemented fairly quickly, sometimes immediately

Interim Measures for LNAPL
When interim measure for LNAPLDesigned and implemented properlyImplemented for the right reasonsMonitored adequately throughout the life of the measureDiscontinued when appropriate
Net benefits can be significant!

Interim Measures for LNAPL
Otherwise…Problems
“Perceived risk” due to the presence of LNAPL vs. “actual risk”: in-well LNAPL thickness thresholds for remediation are often not consistent with a risk-based approach to LNAPL management
Interim measures are often viewed as permanent measures over time, despite the fact that the measures were meant to be temporary until further work completed

Interim Measures for LNAPL
“Perceived risk” has often led to…Implementation of interim measure remediation systems based upon mere presence of free product
• Prior to delineation and thorough characterization of soil and LNAPL chemical/physical properties
• Prior to thorough evaluation of risk issues
• Prior to thorough evaluation of appropriate LNAPL management and/or remediation alternatives

Interim Measures for LNAPL
Result of interim measure has often led to…Costly, and often times ineffective, remediation system that only addresses a portion of the LNAPL
LNAPL plume that has not yet been adequately delineated (horizontally or vertically)
LNAPL project with no real progress or end in sight
Unsatisfied client and/or regulator

Interim Measures for LNAPL
So…What Should be Done?Implement interim measures if a known immediate risk exists or if inaction may constitute an imminent threat (e.g., stopping an active release source, cutting off active migration, etc.)
Develop a technically sound LNAPL Conceptual Site Model (LSCM)
Use the LSCM as a basis for appropriate corrective action decision making

LCSM
ASTM Standard E 2531-06, Standard Guide for Development of Conceptual Site Models and Remediation Strategies for Light Nonaqueous-Phase Liquids Released to the SubsurfaceThis Standard supplements the conceptual site model (CSM) developed in the RBCA process, and provides an in-depth description of LCSMsThe LCSM forms the basis for LNAPL corrective action decisionsThree tiers of LCSMs: Tier 1, Tier 2, Tier 3.

LCSM
A thorough LCSM includes evaluating some/all of the following:
Vertical and horizontal delineation
Geology – soil type(s), soil physical properties
Hydrogeology – hydraulic conductivity, hydraulic gradient, LNAPL gradient
LNAPL physical/chemical properties
LNAPL mobility/recoverability
Potential exposures/risk

LCSM
In addition to the scientific-technological information contained in the LCSM, additional consideration must be given to:
Regulatory requirementsOther (business, legal, stakeholder, etc.) requirements
The LCSM and associated considerations are used to identify the true “remedial drivers” for the LNAPL

Case Study – Union Pacific Rail Yard

SettingResidential properties located 200 feet to the south and one-quarter of a mile north of the Site
Three municipal water supply wells located within 2,000 feet of the Site (two wells upgradient, one cross-gradient)
Groundwater table fluctuates between 6.5 and 16 feet bgs
Hydraulic conductivity (fine to medium grained sand) estimated at approximately 48 feet/day
Approximate hydraulic gradient is 0.001

Setting
LNAPL (characterized as a weathered diesel) identified in various on-site monitoring wells at various thicknesses, depending on the water table elevationAquifer is behaving as a classic unconfined granular aquifer, with in-well LNAPL thicknesses increasing as water table elevation decreases, and vice versaDuring high water table elevations, no in-well LNAPL

SettingLP-1
0.0
0.4
0.8
1.2
1.6
2.0
2.4
2.8
Jul-0
3Oct-
03Ja
n-04
Apr-04
Jul-0
4Oct-
04Ja
n-05
Apr-05
Jul-0
5Oct-
05Ja
n-06
Apr-06
Jul-0
6Oct-
06Ja
n-07
Apr-07
Jul-0
7Oct-
07Ja
n-08
Date
Pro
duct
Thi
ckne
ss (f
t)
2790
2795
2800
2805
2810
2815
2820
2825
Cor
rect
ed W
ater
Ele
vatio
n (ft
AM
SL)
Product Thickness Corrected Water Elevation Limits of Well Screen
System Startup: 6/13/06
LP-7
0.0
0.4
0.8
1.2
1.6
2.0
2.4
2.8
Jul-0
3Oct-
03Ja
n-04
Apr-04
Jul-0
4Oct-
04Ja
n-05
Apr-05
Jul-0
5Oct-
05Ja
n-06
Apr-06
Jul-0
6Oct-
06Ja
n-07
Apr-07
Jul-0
7Oct-
07Ja
n-08
Date
Pro
duct
Thi
ckne
ss (f
t)
2790
2795
2800
2805
2810
2815
2820
2825
Cor
rect
ed W
ater
Ele
vatio
n (ft
AM
SL)
Product Thickness Corrected Water Elevation Limits of Well Screen
System Startup: 6/13/06
LP-18
0.0
0.4
0.8
1.2
1.6
2.0
2.4
2.8
Jul-0
3Oct-
03Ja
n-04
Apr-04
Jul-0
4Oct-
04Ja
n-05
Apr-05
Jul-0
5Oct-
05Ja
n-06
Apr-06
Jul-0
6Oct-
06Ja
n-07
Apr-07
Jul-0
7Oct-
07Ja
n-08
Date
Pro
duct
Thi
ckne
ss (f
t)
2790
2795
2800
2805
2810
2815
2820
2825
Cor
rect
ed W
ater
Ele
vatio
n (ft
AM
SL)
Product Thickness Corrected Water Elevation Limits of Well Screen
System Startup: 6/13/06

Site History
Source of LNAPL attributed to group of large above-ground fuel storage tanks (ASTs) formerly located in the Site area and removed in the late 1960sWork plan proposed the use of horizontal biosparge technology to be implemented in a phased approachPhase 1 horizontal biosparge system was implemented in December 2005

Site History
Biosparge systemTwo horizontal sparge wells approximately 35 feet bgs placed approximately 100 feet apart
300’ well screens with uniform perforations
150 cfm design air flow
System startup occurred on June 13, 2006
Biosparge operations initiated despite completion of a thorough LCSM

Site Strategy Change
Site strategy approach changed in 2007Prior to continuing with the evaluation of biosparging activities, and the potential implementation of a full-scale (numerous horizontal wells) biosparging remediation alternative, client authorized additional LNAPL delineation and characterization activities to develop technically sound LCSMComprehensive LNAPL mobility evaluation was also authorized as part of the LCSM
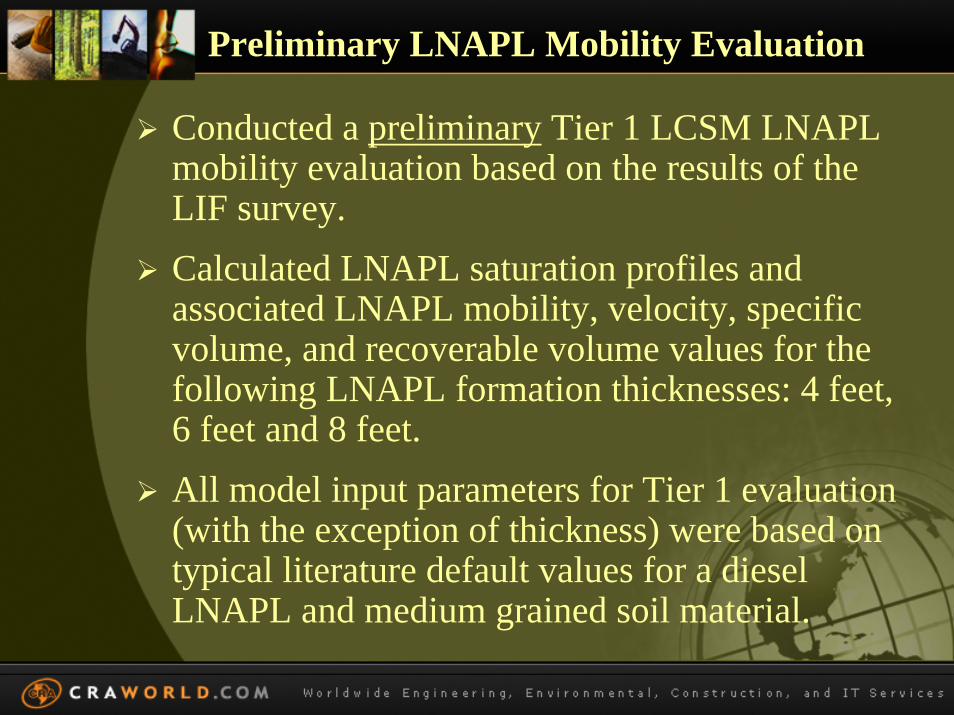
Preliminary LNAPL Mobility Evaluation
Conducted a preliminary Tier 1 LCSM LNAPL mobility evaluation based on the results of the LIF survey.Calculated LNAPL saturation profiles and associated LNAPL mobility, velocity, specific volume, and recoverable volume values for the following LNAPL formation thicknesses: 4 feet, 6 feet and 8 feet.All model input parameters for Tier 1 evaluation (with the exception of thickness) were based on typical literature default values for a diesel LNAPL and medium grained soil material.

Preliminary LNAPL Mobility Evaluation

Preliminary LNAPL Mobility Evaluation
LNAPL Average Average Specific RecoverableThickness Mobility Velocity Volume Volume(ft) (cm/s) (cm/s) (gal/ft2) (gal/ft2)
4 4.07 x 10⁻³ 4.07 x 10⁻⁶ 5.80 4.21
6 4.57 x 10⁻³ 4.57 x 10⁻⁶ 9.71 7.33
8 4.85 x 10⁻³ 4.85 x 10⁻⁶ 13.68 10.52
Note: LNAPL velocities less than 1 x 10⁻⁶ cm/s (approximately equalto 1 foot per year) are considered to be effectively immobile(ASTM 2007).

LIF Investigation
Conducted a laser induced fluorescence (LIF) survey using ultraviolet optical screening tool (UVOST) techniques.Completed thirty-nine (39) LIF test locations across LNAPL-impacted areas, both on-Site and off-Site.Imported the LIF data into a three dimensional visualization program to interpolate LIF reflectance results.

LIF Investigation

LIF Investigation

LIF Investigation

3-D LIF Visualization

3-D LIF Visualization

3-D LIF Visualization

LIF Investigation
Based on the LIF results, it was apparent that the majority of LNAPL impacts are present beneath the water table.The water table is currently located approximately 8 feet below bgs – the majority of LNAPL impacts are located from 9 feet to 15 feet bgs.No product currently in wells.

LIF Investigation
Based on the previous LIF plots, the following issues were considered:
The biosparging operations may have effectively remediated/reduced LNAPL saturations within the vicinity of the two horizontal biosparge wells;
The biosparging operations may have pushed LNAPL to the east and west, away from the biosparge wells; and/or
There may be two separate sources of LNAPL.
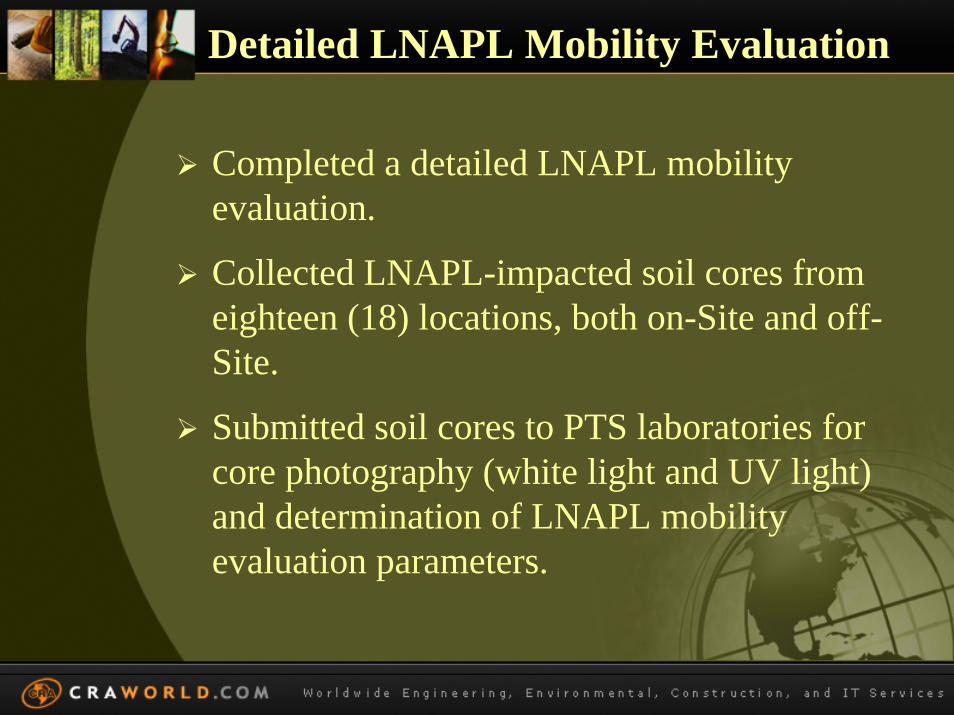
Detailed LNAPL Mobility Evaluation
Completed a detailed LNAPL mobility evaluation.
Collected LNAPL-impacted soil cores from eighteen (18) locations, both on-Site and off-Site.
Submitted soil cores to PTS laboratories for core photography (white light and UV light) and determination of LNAPL mobility evaluation parameters.

Detailed LNAPL Mobility Evaluation

Core Photography
LIF-11(10’-13’ bgs)
LIF-13(9’-13’ bgs)
LIF-5(9’-13’ bgs)

Detailed LNAPL Mobility Evaluation
LNAPL mobility was evaluated using the following two methods:
Comparing initial LNAPL saturations to residual saturations directly from laboratory test resultsUtilizing the laboratory measured ‘maximum’ LNAPL saturations to determine corresponding LNAPL relative permeability, conductivity, mobility and velocity values using API methodology

Detailed LNAPL Mobility Evaluation
METHODS: API RP 40
SAMPLE TOTALSAMPLE DEPTH, ORIENTATION BULK, GRAIN, POROSITY, WATER (Swi) NAPL (Soi) WATER (Srw) NAPL (Sor)
ID. ft. (1) g/cc g/cc %Vb SATURATION SATURATION SATURATION SATURATION
LIF-22 (11-13) 12.1 V 1.77 2.63 32.7 47.1 9.1 64.3 9.1NOTE: No visible LNAPL produced; 12.3 pore volumes of water injected. Produced water clear with faint HC odor.
LIF-15 (11-13) 12.4 V 1.78 2.62 32.2 45.5 8.3 70.2 8.3NOTE: No visible LNAPL produced; 12.6 pore volumes of water injected. Produced water clear with faint HC odor.
LIF-13 (11-13) 12.3 V 1.67 2.62 36.2 48.0 6.3 70.1 6.3NOTE: No visible LNAPL produced; 12.1 pore volumes of water injected. Produced water clear with faint HC odor.
LIF-11 (11-13) 12.8 V 1.79 2.63 32.0 56.8 6.6 72.7 6.6NOTE: No visible LNAPL produced; 12.1 pore volumes of water injected. Produced water clear with faint HC odor.
LIF-37 (9-11) 9.8 V 1.78 2.62 32.2 59.3 6.6 68.3 6.6NOTE: No visible LNAPL produced; 12.6 pore volumes of water injected. Produced water clear with faint HC odor.
LIF-8 (11-13) 12.4 V 1.77 2.62 32.2 46.1 9.1 64.7 9.1NOTE: No visible LNAPL produced; 12.5 pore volumes of water injected. Produced water clear with faint HC odor.
ENDPOINT SATURATION WATER DRIVE TEST: INITIAL AND RESIDUAL SATURATIONS
API RP 40
PTS Laboratories
DENSITY Initial Fluid Saturations After Waterflood Test
ASTM D425M, DEAN-STARKPORE FLUID SATURATIONS, % Pv

Detailed LNAPL Mobility Evaluation
LNAPL MOBILITY AND VELOCITY CALCULATIONS BASED ON MAXIMUM SATURATIONS AND API METHODOLGY
Data Input Values Location, Data Input and Calculations (3)
LIF-001 LIF-002 LIF-008 LIF-009 LIF-011 LIF-013 LIF-015 LIF-022 LIF-024 LIF-026 LIF-037LNAPL Saturation (So) 0.099 0.121 0.091 0.057 0.066 0.063 0.083 0.091 0.037 0.070 0.066Water Saturation (Sw) 0.544 0.547 0.461 0.616 0.568 0.480 0.455 0.471 0.598 0.514 0.593Total Fluid Saturation (St) 0.643 0.668 0.552 0.673 0.634 0.543 0.538 0.562 0.635 0.584 0.659Irreducible Water Saturation (Swr) 0.057 0.057 0.057 0.057 0.057 0.057 0.057 0.057 0.057 0.057 0.057van Genuchten N (N) (1) 3.117 3.117 3.117 3.117 3.117 3.117 3.117 3.117 3.117 3.117 3.117LNAPL Density (ρo) - (g/cm3)(1) 0.850 0.850 0.850 0.850 0.850 0.850 0.850 0.850 0.850 0.850 0.850LNAPL Viscosity (μo) - (cp)(1) 3.500 3.500 3.500 3.500 3.500 3.500 3.500 3.500 3.500 3.500 3.500Total Soil Porosity (Φ) 0.420 0.420 0.420 0.420 0.420 0.420 0.420 0.420 0.420 0.420 0.420Hydraulic Gradient 0.002 0.002 0.002 0.002 0.002 0.002 0.002 0.002 0.002 0.002 0.002Hydraulic Conductivity Water (Kw) - (cm/s) 5.97E-03 5.97E-03 5.97E-03 5.97E-03 5.97E-03 5.97E-03 5.97E-03 5.97E-03 5.97E-03 5.97E-03 5.97E-03
Calculated Parameters
Model Parameter 1 (λ) 1.354 1.354 1.354 1.354 1.354 1.354 1.354 1.354 1.354 1.354 1.354Model Parameter 2 (M) 0.679 0.679 0.679 0.679 0.679 0.679 0.679 0.679 0.679 0.679 0.679
LNAPL Relative Permeability (kro) (2),(4) 1.11E-03 2.10E-03 6.63E-04 2.42E-04 3.35E-04 2.24E-04 4.87E-04 6.85E-04 6.15E-05 3.45E-04 3.58E-04LNAPL Conductivity (Ko) - (cm/s) (4) 1.61E-06 3.05E-06 9.62E-07 3.51E-07 4.86E-07 3.24E-07 7.06E-07 9.94E-07 8.92E-08 5.00E-07 5.19E-07LNAPL Mobility (Mo) - (cm/s) (4) 3.87E-05 6.00E-05 2.52E-05 1.46E-05 1.75E-05 1.23E-05 2.02E-05 2.60E-05 5.74E-06 1.70E-05 1.87E-05LNAPL Velocity (Vo) - (cm/s) (4) 7.73E-08 1.20E-07 5.03E-08 2.93E-08 3.51E-08 2.45E-08 4.05E-08 5.20E-08 1.15E-08 3.40E-08 3.75E-08
Potentially Mobile (Vo>10-6 cm/s)? No No No No No No No No No No No
Notes:(1) - Values taken from American Petroleum Institute (API) Interactive LNAPL Guide (Version 2.0, Release 2.0.2, August 2004) - Assessment Tools - Parameter Tables. Values selected based for diesel fuel.(2) - LNAPL relative permeability calculation based on Burdine Equation 2.26 and Equation 2.27 in American Petroleum Institute (API) Publication Number 4729, Models for Design of Free-Product Recovery Systems for Petroleum Hydrocarbon Liquids , August 2003.
(3) - Blue highlighted data input values were based on Site-specific laboratory test results and/or field measurements.(4) - Calculations based on laboratory generated LNAPL saturation values.

Detailed LNAPL Mobility Evaluation
Site LNAPL exhibits no potential for mobility according to two different evaluation methodologies
Recoverability of LNAPL is expected to be low due to low LNAPL saturations and mobility potential
The lack of comparable pre-remediation data prevents a definitive answer on whether biosparge system was effective in remediating the LNAPL

ConclusionsThe completion of a thorough LCSM enabled a much better understanding of actual LNAPL conditions and “realistic” as opposed to “perceived” risk issuesThe results of LCSM activities suggest that the LNAPL plume is effectively immobile, stable, and non-recoverableAlthough it does not appear that biosparging was adversely pushing the LNAPL away, it is unclear if there was a net benefit resulting from the biosparging (due to the absence of LNAPL mobility data pre-biosparging)

Conclusions
Pending the evaluation of other considerations (regulatory, business, etc.), a LNAPL monitoring program may be the preferred LNAPL management approach at site, as opposed to the implementation of a full-scale biospargingalternativeResults in a potential cost savings in excess of $5 million