rethinking fiscal policy for the arab region · rethinking fiscal policy for the arab region...
TRANSCRIPT
Rethinking Fiscal Policy for the Arab Region
Economic and Social Commission for Western Asia

UNITED NATIONSBeirut
Economic and Social Commission for Western Asia
Rethinking Fiscal Policy for the Arab Region
E/ESCWA/EDID/2017/4

2
© 2018 United NationsAll rights reserved worldwide
Photocopies and reproductions of excerpts are allowed with proper credits.
All queries on rights and licenses, including subsidiary rights, should be addressed to the United Nations Economic and Social Commission for Western Asia (ESCWA), e-mail: [email protected].
The findings, interpretations and conclusions expressed in this publication are those of the authors and do not necessarily reflect the views of the United Nations or its officials or Member States.
The designations employed and the presentation of material in this publication do not imply the expression of any opinion whatsoever on the part of the United Nations concerning the legal status of any country, territory, city or area or of its authorities, or concerning the delimitation of its frontiers or boundaries.
Links contained in this publication are provided for the convenience of the reader and are correct at the time of issue. The United Nations takes no responsibility for the continued accuracy of that information or for the content of any external website.
References have, wherever possible, been verified.
References to dollars ($) are to United States dollars, unless otherwise stated.
Symbols of United Nations documents are composed of capital letters combined with figures. Mention of such a symbol indicates a reference to a United Nations document.
United Nations publication issued by ESCWA, United Nations House, Riad El Solh Square, P.O. Box: 11-8575, Beirut, Lebanon.
Website: www.unescwa.org.

3
Rethinking Fiscal Policy for the Arab Region Acknowledgements
Acknowledgements
The report Rethinking Fiscal Policy for the Arab Region is the result of research by a cross-divisional team from the Economic and Social Commission for Western Asia (ESCWA), led by the Economic Development and Integration Division. We thank the ESCWA Centre for Women, the Statistics Division, the Social Development Division, and the Sustainable Development Policies Division for their collaboration and contributions.
We would like to express our gratitude to Ibrahim Ahmed Elbadawi, Managing Director, Economic Research Forum (ERF), and Terry McKinley, Director, Centre for Development Policy and Research, University of London, for reviewing the draft report. We are also indebted to N. Bhanumurthy, Professor, National Institute of Public Finance and Policy, India, and Hoda Selim, ERF Research Fellow, for their valuable comments.
We thank the representatives of ministries of finance from our member States who participated in the expert group meeting (EGM) in Beirut in July 2017 and shared with us their valuable feedback. Our thanks also go to the experts who participated in the meeting in the National Observatory of Human Development, in Rabat, and in the EGM in Beirut: Ziad Abdul Samad (Arab NGO Network for Development), Carlos Conde (Organisation for Economic Co-operation and Development), Patrick Daru (International Labour Organization), Benno Ferrarini (Asian Development Bank), Nizar Jouini (Doha Institute), Taline Koranchelian (International Monetary Fund (IMF)), Kamiar Mohaddes (University of Cambridge), Simon Neaime (American University of Beirut), Xavier Rame (IMF), Ahmad Shikh Ebid (ESCWA), Abdel Khalek Touhami (University of Rabat),
Jala Youssef (ERF) and Chahir Zaki (American University of Cairo).
We are indebted to ESCWA colleagues for their contributions, review and feedback: Wafa Aboul Hosn, Tarik Alami, Adel Alghaberi, Tarcisio Alvarez-Rivero, Rouba Arja, Mehrinaz Elawady, Haidar Fraihat, Omar Hakouz, Thomas Hegarty, Khaled Hussein, Ahmed Kamaly, Khawla Matar, Gisela Nauk, Adib Nehme, Frederico Neto, Denise Sumpf and Souraya Zein.
Our sincere thanks to Maral Tashjian and Siham El-Sabha for their assistance, and Zeina El-Hajj for her support in management. We also thank Rayan Akill for her diligent research support and Fouad Ghorra for his efforts in statistics and research support.
We gratefully acknowledge the guidance of Khawla Matar, Deputy Executive Secretary of ESCWA.
The work reflects the dedication, coordination and substantive leadership of Niranjan Sarangi, and the contributions of the whole team in bringing this report to fruition.
Moctar Mohamed El-Hacene
DirectorEconomic Development and Integration DivisionESCWA
4
Report Team
Task LeaderMoctar Mohamed El-Hacene
Report CoordinatorNiranjan Sarangi
Authors TeamNiranjan Sarangi (Lead Author)Khalid Abu-IsmailSalim Araji
Background Paper ContributorsKhalid Abu-Ismail (EDID/ESCWA)Salim Araji (EDID/ESCWA)Rouba Arja (ECW/ESCWA)Wafa Aboul Hosn (SD/ESCWA)Thomas Hegarty (SDD/ESCWA)Ahmed Kamaly (EDID/ESCWA)Gisela Nauk (SDD/ESCWA)Niranjan Sarangi (EDID/ESCWA)Souraya Zein (SDPD/ESCWA)
Research and StatisticsRayan AkillLida El-AhmadiehFouad GhorraXinyi HeJohannes von Bonin
Programme Tarcisio Alvarez-RiveroZeina El-HajjMona FattahAlexia PorikiWiebke Uhde
OperationsMaral TashjianSiham El-Sabeh
Senior Advisory GroupIbrahim Ahmed Elbadawi (Economic Research
Forum)Terry McKinley (University of London)
ReviewersN. Bhanumurthy (National Institute of Public
Finance and Policy, India)Hoda Selim (ERF Research Fellow)
Readers GroupTarik AlamiRamla Al-KhalidiTarcisio Alvarez-RiveroCarol Chouchani CherfaneMehrinaz ElawadyHaidar FraihatOmar HakouzWafa Aboul HosnAhmed KamalyRoula MajdalaniKhawla MatarPontus MolinGisela NaukAdib NehmeFrederico NetoJuraj RiecanSouraya Zein
Editor (English)Gretchen Luchsinger
Translation into ArabicMahdi Al Dajani
Presentation, Formatting and DesignConference Services Section (ESCWA)

5
Rethinking Fiscal Policy for the Arab Region Foreword
Foreword
In the new era of the 2030 Agenda for Sustainable Development, there is heightened emphasis on the State playing a more active role in achieving inclusive and sustainable economies and societies. Across the Arab region and around the world, this calls in part for rethinking fiscal policy. It must deliberately aim towards the kinds of smart investments in people that can unlock rapid progress across all 17 of the Agenda’s Sustainable Development Goals, leaving no one behind. One starting point is a discussion around not just how much money is spent, but how it is raised and how wisely it is spent to reach short- and long-term objectives.
This report, Rethinking Fiscal Policy for the Arab Region, in certain ways urges a departure from conventional fiscal policy choices. For several decades, influenced by the Washington Consensus, Arab Governments have predominantly emphasized privatization and liberalization, the retreating role of the State, and the achievement of efficiencies through expenditure cuts. But given the increasingly precarious situation of many countries, solving today’s development challenges requires a reassessment of accepted notions. A new direction is needed, one where economic policy closely aligns with measures to reverse the root causes of socioeconomic crisis and deepening disparities, and to equip people of all backgrounds in realizing their full potential as members of productive societies.
In asking whether or not current fiscal policies are up to the task of the 2030 Agenda and the Sustainable Development Goals, the report finds that many countries are lagging behind. Although explanations for the gaps vary, it is clear that in general, a course correction is
required, connecting economic reforms, social investments and higher quality governance. Countries affected by conflict call for additional considerations, given the devastating losses they have suffered.
Fiscal policy, the report contends, can contribute to this new direction by being more consciously targeted towards restructuring economies to generate sufficient decent work, making systematic investment in high-quality human development, and using equity and sustainability as guiding principles in choices to raise and spend public resources. Managing this process will largely depend on transparent and accountable governance to set and keep rules. These must be fair and technically sound. They should be organized around a commitment to putting development on track both now and into the future.
Transformation in the Arab region will not happen automatically or overnight. But if the region hopes to be both prosperous and peaceful, transformation is an imperative. A high level of ambition and a commitment to the principles of the 2030 Agenda should guide all choices and actions on the path towards inclusion and sustainability. This report by ESCWA aims to support member States in their common quest for this vision of the future.
Mohamed Ali Alhakim
Executive Secretary of ESCWAUnder-Secretary-General of the United Nations


7
Contents
AcknowledgementsReport TeamForeword
1. Introduction and ApproachA. Defining three distinct country clusters B. Research questions and methodsC. A brief outline of the report
2. Fiscal Policy Can Transform EconomiesA. Structural change is imperative in the Arab regionB. Public investment choices have restrained structural transformationC. Moving towards structural transformation and unlocking greater productivityD. Main findings
3. Fiscal Policy Can Advance Inclusive DevelopmentA. Public expenditure is under pressureB. Public social expenditure and inclusive growthC. Constrained investment hinders health and educationD. Main findings
4. Fiscal Policy Can Shape the Right Spending and Revenue ChoicesA. Rising public debt poses concerns B. Fiscal management is currently precarious C. Policy responses without clear rulesD. Expenditure cuts may not be the only answer to debt E. Taxation can harness new revenues based on fair principlesF. Main findings
5. Effective Fiscal Policy Depends on GovernanceA. Governance gaps are hindering development in the Arab region B. Governance effectiveness defines the strength of fiscal policyC. Institutional quality counts D. Main findings
6. Fiscal Issues in a Context of ConflictA. An economic toll B. Policy choices must be carefully calibrated C. Resource mobilization can draw on diverse sources D. Policy options for different country scenarios E. Main findings
P. 3P. 4P. 5
P. 11P. 14P. 17P. 17
P. 19P. 21P. 28P. 31P. 34
P. 37P. 39P. 45P. 51P. 55
P. 57P. 59P. 64P. 69P. 73P. 75P. 78
P. 81P. 83P. 86P. 87P. 94
P. 95P. 97
P. 100P. 102P. 105P. 106
8
7. Making the Most of the Power of Fiscal PolicyA. Design fiscal policies to promote economic transformation and decent workB. Make budget choices to reduce poverty and inequality, and close health, housing and education deficitsC. Expand and sustain fiscal space by raising revenuesD. Harness public expenditure management for inclusive and sustainable development through better quality governanceE. Orient fiscal policy towards peace and development in post-conflict countries
EndnotesBibliography
List of TablesTable 3.1 Direct benefits from energy subsidies accrue more to wealthier groups
List of FiguresFigure 1.1 Oil wealth delineates sharp differences in per capita GDPFigure 2.1 Economic structures differ, but manufacturing growth is sluggish overall Figure 2.2 In three oil-rich countries, higher value added sectors contribute few jobsFigure 2.3 In three oil-poor countries, structural change has been marginal Figure 2.4 Increasing employment in services was associated with declining productivity in Egypt and Morocco Figure 2.5 Average labour productivity has remained almost stagnantFigure 2.6 Total investment in selected Arab countriesFigure 2.7 Capital expenditure has been relatively weakFigure 2.8 The region has the world’s lowest share of expenditure on research and developmentFigure 3.1 Public expenditure in Arab countries from 1990 to 2015Figure 3.2 Public social, health and education expenditureFigure 3.3 Out-of-pocket expenditure is unusually highFigure 3.4 Government spending on subsidies as a share of GDPFigure 3.5 A mixed picture of public social expenditure and GDP growth over timeFigure 3.6 Correlations between cyclical components of real GDP, real expenditure and real social expenditure, 1990-2014Figure 3.7 The redistributive impact of fiscal policy on poverty in JordanFigure 3.8 The redistributive impact of fiscal policy on inequality in Jordan Figure 3.9 Incidence of direct and indirect taxes across market income deciles in Jordan Figure 3.10 Effective average income tax rates in Lebanon Figure 3.11 Education achievements have lagged behindFigure 3.12 Increasing education expenditure could close the gap in schoolingFigure 3.13 Life expectancy is close to the global averageFigure 3.14 Stunting remains high in some countries, and is slightly more common among boysFigure 4.1 Oil-poor Arab countries have comparatively large debt burdensFigure 4.2 In 2016, debt was noticeably high given the level of development in many Arab countriesFigure 4.3 As debt has risen, net interest payments have doubled for oil-poor middle-income countries Figure 4.4 Trends in external debt and debt serviceFigure 4.5 External debt as a percentage of GDP Figure 4.6 Low-income Arab countries score poorly on debt and fiscal policy ratings
P. 109P. 111P. 112
P. 114P. 115
P. 116
P. 119P. 125
P. 45
P. 14P. 23P. 24P. 25P. 26
P. 27P. 29P. 30P. 31
P. 40P. 41P. 42P. 43P. 46P. 47
P. 49P. 49P. 49P. 50P. 52P. 53P. 54P. 54P. 60P. 61P. 61
P. 63P. 63P. 64

9
Figure 4.7 Both fiscal and current account balances show worsening trends in oil-rich and oil-poor countriesFigure 4.8 Total reserves in months of imports are low in most countriesFigure 4.9 Gross public debt and fiscal balances in Arab countriesFigure 4.10 Gross public debt and primary balances in Arab countries Figure 4.11 The fiscal response to gross public debt in middle-income countriesFigure 4.12 Interest rate and growth rate differentialFigure 4.13 Debt-stabilizing primary balance versus actual primary balance Figure 4.14 IMF projections on debt and expenditure for oil-rich countries Figure 4.15 IMF projections on debt expenditure for middle-income countries Figure 4.16 Tax buoyancy in the oil-poor middle- and low-income countriesFigure 4.17 Tax revenue is low as a share of GDP in Arab countriesFigure 4.18 Shares of income and wealth taxes are low in selected oil-poor countriesFigure 5.1 Political stability and voice and accountability indicators have low scoresFigure 5.2 Globally, the correlation between GI and HDI is generally positiveFigure 5.3 Oil-poor middle-income countries fare closer to global averages on governanceFigure 5.4 Most Arab countries lose on HDI scores when the GI is factored inFigure 5.5 Better institutions improve forecasting and crisis responseFigure 5.6 The environmental hazards of water and energy subsidies Figure 6.1 GDP has fallen far short of predictions Figure 6.2 Estimated decline in government revenues due to losses in natural resource revenues Figure 6.3 Estimated decline in government revenues due to losses in tax and natural resource revenuesFigure 6.4 Four countries show varying revenue and spending choices after civil conflicts
List of BoxesBox 2.1 Fiscal policy coordination and the Arab Customs UnionBox 3.1 Subsidy reforms follow increased expenditures Box 3.2 Public expenditure tends to follow economic cyclesBox 4.1 The recent extension of IMF financial support to oil-poor countriesBox 4.2 Morocco: rebalancing public finances and tax policy through taxation reformsBox 5.1 Budgetary weaknesses in BahrainBox 5.2 Chile’s fiscal rules support countercyclical policyBox 5.3 Tunisia has more transparency, but discretionary choices remain
P. 65
P. 67P. 68P. 69P. 70P. 72P. 72P. 73P. 74P. 75P. 76P. 77P. 84P. 85P. 85P. 86P. 91P. 93P. 98P. 99
P. 100
P. 104
P. 34P. 43P. 47P. 67P. 77P. 88P. 89P. 90

Introduction and Approach1.

Fiscal policy is not just a question of cost-cutting and efficiency, but of smart investment in people and the pursuit of inclusive human development.
Fiscal policy is not just a question of cost-cutting and efficiency, but of smart investment in people and the pursuit of inclusive human development.
13
Rethinking Fiscal Policy for the Arab Region Introduction and Approach
Introduction and Approach
Since the 1990s, the Arab countries have undertaken major changes in macroeconomic policies, reorienting towards privatization and liberalization, the retreating role of the State and the achievement of efficiencies through expenditure cuts.1 Such reforms did not reflect positively in terms of transforming economies to become more modern and productive. They also failed to fulfil the aspirations of people for decent work2 or improved standards of living. The region’s overall share in world trade remains insignificant, with trade still highly concentrated in low value added exports in exchange for diversified imports. The lack of development of “real” sectors of the Arab economies, those concerned with producing higher end goods and services, impacted youth the most, since there was little demand for their skills.
High youth unemployment and growing informal employment emerged as major challenges for most governments by the late 2000s. Countries seen as major achievers in implementing neoliberal macroeconomic reforms saw an upsurge in people demanding social justice, which eventually triggered the Arab uprisings in 2011. As a consequence, fiscal challenges mounted, poverty and inequality rose sharply, and the size of the middle-income share of the population contracted.3 In oil-rich countries, the 2014 plunge in oil prices severely affected fiscal balances. Oil wealth is vital for economic development in exporting countries, but is also an important source of the positive spillover of capital to Arab non-oil exporters through intraregional flows of capital, remittances and aid.
Against this backdrop, the time has come to change course by aiming for economies
that are more productive and inclusive, and that close human development gaps that feed the current socioeconomic crises. An understanding of how economic structures and policy choices produce fundamentally different human and economic welfare outcomes informs the analysis and recommendations in this report, Rethinking Fiscal Policy in the Arab Region. The report emphasizes structural transformation and redistributive fiscal policy as a basis for a new economic policy vision in the region, rather than growth in per capita gross domestic product (GDP).
The report takes a focused look at the challenges of economic policy reforms across different types of Arab countries, with a particular emphasis on fiscal policy as a key driver of a virtuous cycle of inclusive growth, decent work and poverty reduction, in line with the global 2030 Agenda for Sustainable Development and its 17 Sustainable Development Goals (SDGs). Fiscal policies must be understood as well in relation to an array of other social, environmental, governance and political challenges. The report thus strongly advocates for good governance to cement the links between fiscal and development policy objectives. Further, the alignment of fiscal, monetary and exchange rate policies is critical to building dynamic and competitive economies that can thrive amid ever-shifting global trends.
Overall, the report argues for a rule-based fiscal policy that creates or restores the fiscal space to enlarge development expenditure and achieve structural transformation. This is not just a question of cost-cutting and efficiency, but of smart investment in people and the pursuit of inclusive human development as envisioned in
1.

14
the 2030 Agenda. The alternative is a stark one: Many countries will not attain the SDGs.
A. Defining three distinct country clusters
While countries across the region share some common concerns and achievements, significant disparities exist across them, including in terms of fiscal space and development challenges. Gaps in per capita GDP among oil-rich countries (which include high- and middle-income countries), oil-poor middle-income countries and low-income countries are shown in figure 1.1.4 The three country clusters vary in the nature and severity of their development challenges as well as their potential sources of revenue mobilization. Each cluster includes conflict-affected countries, which face additional concerns.
1. Varying fiscal space and development challenges
The first cluster of countries, the oil-rich high- and middle-income countries, referred as oil-rich countries in short, draw their major source of revenue from oil and gas, although
there are wide variations in fiscal space within this group. These countries include: Algeria, Bahrain, Iraq, Kuwait, Libya, Oman, Qatar, Saudi Arabia and the United Arab Emirates. Bahrain and Oman have much larger fiscal constraints than Qatar or the United Arab Emirates. The cluster has one common element from a fiscal perspective, however, which is reliance on revenues from oil and gas. Although many of the oil-rich countries have relatively larger fiscal space for meeting development needs, their revenues are susceptible to oil price fluctuations, as witnessed during the recent plunge in prices. Their major priority is to rethink macrofiscal frameworks so that fiscal incentives can be established to develop higher-end non-oil sectors, promote decent work for youth, ensure social protection, and diversify revenue sources, including through taxation, as key for fiscal sustainability. Iraq and Libya have additional concerns as conflict-affected countries.
The second cluster of countries, the oil-poor middle-income countries,5 referred as oil-poor countries in short, includes Egypt, Jordan, Lebanon, Morocco, the State of Palestine, the Syrian Arab Republic and
Figure 1.1 Oil wealth delineates sharp differences in per capita GDP (United States dollars, constant 2010 prices)
16,00014,00012,00010,000
8,0006,0004,0002,000
0
1990
1991
1992
1993
1994
1995
1996
1997
1998
1999
2000
2001
2002
2003
2004
2005
2006
2007
2008
2009
2010
2011
2012
2013
2014
2015
US do
llar
Oil-rich countries Oil-poor middle-income countries Low-income countries
Source: Authors’ calculation based on data from the United Nations, Statistics Division (UNSTATS), 2017.
15
Rethinking Fiscal Policy for the Arab Region Introduction and Approach
Tunisia. They rely on a mixture of revenue sources, but mainly from taxation, and face more constraints on fiscal space than the oil-rich countries as well as growing public debt burdens in some cases. They host the region’s largest share of middle-income people, so meeting their aspirations, including through opportunities for decent work, is a key concern. Other development challenges in recent years comprise high unemployment, increasing poverty and lack of adequate social protection. Well-strategized macrofiscal frameworks can promote transformative growth by backing higher-end productive activities in industry and service sectors. This in turn could generate enough decent work for the rapidly rising labour force, and open fiscal space for meeting development needs, such as through social protection, pensions and so on. Rebalancing public expenditure and revenues, including through a closer look at issues related to subsidies and taxation, has potential for improving fiscal space. The Syrian Arab Republic and the State of Palestine have additional concerns as conflict-affected countries.
The third cluster of countries, the low-income countries, comprises the Comoros, Djibouti, Mauritania, Somalia, the Sudan and Yemen.6 They have high levels of poverty and significant development challenges as well as severely constrained fiscal space. As least developed countries, they depend on grants, particularly official development assistance (ODA), and external debt as their major sources of finance. They require significant support to develop institutional capacity, including to implement the SDGs. Mobilizing resources requires greater international cooperation, such as by implementing the Istanbul Plan of Action (2011-2020) and the Addis Ababa Action Agenda. Macrofiscal frameworks need to be considered in terms of moving away from primary exports such as agricultural commodities, building
productive capacities, boosting domestic demand, and strengthening public expenditure in health, education, pensions and social protection. Somalia, the Sudan and Yemen are conflict-affected and face additional concerns.
2. Issues in aligning fiscal policy to transformative growth and human development
While the three clusters of countries can be distinguished in terms of some broad commonalities, they all include conflict-affected countries. Any standard macrofiscal analysis for each of the three clusters will not be relevant to these countries, given their unique development and fiscal challenges; this report thus treats them as a separate category. For the rest of the countries in each cluster, several issues need to be considered in aligning fiscal policy behind transformative growth and human development.
A first point is to assess links between fiscal policy choices and their impacts on transformative growth. Economic policies in general, and fiscal policy in particular, have largely been unsuccessful in accelerating economic and trade diversification. For the region as a whole, the share of manufacturing in GDP has remained low. While economic growth is important, the growth process needs to result in the expansion of high value added sectors that generate decent work, thus strengthening ties between the economy and inclusive human development. Public expenditure is a critical driver of growth in general, but the types of expenditure – such as current or capital expenditures, and fiscal incentives to strategic sectors – will influence the size of the fiscal multiplier for growth and economic diversification.7
Second, the strategy for transformative growth will differ across the three country groups, keeping in view their available and

16
potential fiscal space, demand structure, demography and national priorities. The region as a whole is largely dependent on imports for non-oil products; further, extraregional trade dominates the trade structure for such products. Particularly for oil-rich countries and oil-poor middle-income countries, a rebalancing of fiscal incentives and institutions in favour of non-oil export diversification could significantly boost growth and promote intraregional trade.8 Increasing domestic demand through bridging development deficits, and improving productive capacities and export competitiveness are important considerations for the oil-poor countries and the low-income countries, as are increasing public expenditure on health and education, investing in research and innovation, and developing infrastructure, within a framework of fiscal sustainability.
Third, fiscal policy is an important tool for reducing poverty and inequality, and promoting human development, in addition to advancing economic growth. The region’s progress on several health and education indicators is considerably below global averages. Increasing expenditure in health and education will boost human development and build quality human capital, which supports more inclusive societies and enhances growth over the long term.9 In looking at social insurance and social assistance provisions, in recent years, countries in the region have been shifting their focus from universal subsidies to more targeted social assistance. Given this context, it is important that savings from subsidy reforms are preserved within the social protection realm. Building capacity in assessing the relative importance of expenditure, and monitoring development in the levels and composition of public social expenditure over time are important aspects of fiscal policy in meeting social policy needs. Improving tax fairness and introducing tax reforms are other
essential considerations for addressing poverty and inequality.
Fourth, given highly volatile growth in Arab countries, it would be important to assess how governance in general and economic governance in particular can strengthen macroeconomic stability, and promote structural transformation towards more sustainable and inclusive growth. Public expenditure trends are mainly procyclical, in large part due to commodity price changes.10 The lack of fiscal rules in several Arab countries is a major hindrance to macroeconomic stability and effective investment in development; improvement in adopting fiscal rules requires stronger systems of political checks and balances.11
Exploration of the relationship between fiscal performance and governance measures has critical implications for fiscal sustainability, human capital development and social protection, which in turn are necessary and critical areas for economic development. Some studies have observed that better governance, stronger democratic institutions and transparent budgets improve fiscal performance, which leads to higher growth rates.
So far, governments in the region have taken the relatively easy road of expenditure cuts to improve macroeconomic balances. They now need to consider how to apply the principles of equity and fairness both to spending and raising revenues, including through taxation. Gender-responsive budgeting is one tool that already allows assessment of all dimensions of fiscal policy through the lens of achieving gender equality.
Last, the recent violence in Libya, Iraq, the Syrian Arab Republic and Yemen has crippled all sources of government revenues. Robust fiscal spending schemes that promote sustainable and inclusive economic growth, while taking into consideration urgent humanitarian needs, are required.
17
Rethinking Fiscal Policy for the Arab Region Introduction and Approach
B. Research questions and methods
The report mainly relies on standard econometric tools for assessing policy actions. In cases of data unavailability, selected countries were used for quantitative modelling. In addition, qualitative analysis, case studies and examples, and mapping exercises substantiated arguments.
The report explores several questions important for informing the formulation of macrofiscal frameworks with a medium- to long-term perspective.
How effective is fiscal policy in promoting the structural transformation of the economy and broad access to decent work? The lack of structural transformation is a major block to greater growth, higher productivity and decent work in the Arab region. Analysis of a seven-sector dataset over the past three decades found that fiscal policy can play a key role in supporting economic diversification and enhanced productivity. This depends on increased public investment in strategic sectors that are labour intensive and high in value added, infrastructure, research and innovation, and education and health.
What are the possible impacts of fiscal policy on growth, poverty, inequality and human development? For estimating the impact of fiscal policy variables on growth, a structural vector autoregressive (SVAR) model was applied, as is popular in the literature.12 It captured the dynamic impacts of changes in government spending on output after introducing some restrictions (mostly recursive). A dynamic panel estimation was modelled separately for the health and education impact coefficients of public expenditure, using least square dummy variable bias corrected (LSDVC) fixed effects, and a two-step generalized method of moments (2S-GMM).
The redistributive impact of fiscal policy instruments, particularly in reducing poverty and inequality in selected Arab countries, were assessed by combining macrofiscal data on social expenditure with household survey income and expenditure data, using the method developed by Lustig and Higins (2013).13
What is the fiscal policy response to rising public debt and fiscal sustainability? There are several approaches to analysing public debt sustainability, including the most popular, the debt sustainability analysis and fan chart analysis by the International Monetary Fund (IMF), as well as time series stationarity and cointegration tests between revenues and expenditures, fiscal reaction functions and debt-stabilizing primary balance calculations. Using the framework of Bohn (1998), the report examines the fiscal policy responses to public debt by the fiscal reaction functions and fiscal sustainability gap analysis with a medium- to long-term perspective.14 In addition, the report analyses the importance of harnessing potential sources of revenues, particularly through taxation reforms.
How are governance and fiscal policy challenges related in Arab countries? The report restates the strong association between governance and human development. Fiscal policy is both an influencing factor and a manifestation of governance dynamics. Poor governance, which manifests in weak institutions and lack of fiscal rules, adversely affects the equity and efficiency of both the allocation of government expenditure and mobilization of revenues. The report analyses these issues by looking at the impact of governance quality on human development, fiscal policy choices and gender equality.
C. A brief outline of the report
The chapters of the report are briefly summarized as follows.

18
Chapter 2 looks at the role of fiscal policy in economic growth, and its link to structural transformation and employment creation. The chapter aims to chart pathways of growth and economic diversification through the intervention of appropriate fiscal policy tools. Incentives for high-end productive activities in relatively high labour-intensive sectors, and investing in research and innovation along with infrastructure and human capital investments are crucial to promote structural transformation.
Chapter 3 examines how fiscal policy can have a redistributive aspect by reducing poverty and correcting imbalances in society. The choice and prioritization of expenditure determine social and human development impacts. The chapter assesses trends and patterns in public expenditure in general, and their relationship with economic growth. It examines the impact of public social expenditure on health and education achievements in particular. For selected countries, the chapter considers the growth impact of redistributive fiscal policy, and presents findings from fiscal incidence analysis on the impact of public transfers and taxes on changes in poverty and inequality.
Fiscal sustainability challenges vary significantly across the three clusters of countries. Chapter 4 focuses on debt and fiscal balances in low- and middle-income countries, and examines the response of fiscal policy
to debt build-up and fiscal sustainability. The chapter suggests tools that can help to set targets for debt and fiscal sustainability from a medium- to long-term perspective.
Evidence from the region shows that fiscal rules are almost absent in most Arab countries. This poses a challenge to macroeconomic stability in cases of volatility in oil prices or the regional and/or global economic situation. Chapter 5 analyses some key concerns with regard to fiscal discipline and outlines national economic governance conditions required for macrofiscal frameworks that are sustainable and aligned with the principle of inclusion.
The fiscal and development challenges in conflict-affected countries are unique for each country. While the loss of capital and human lives is common to all, the severity of impacts depends on the intensity and duration of conflict. Chapter 6 analyses some of the costs of conflict along with macrofiscal frameworks that would support reconstruction and development, given significant structural and institutional challenges.
Finally, chapter 7 summarizes report findings and conclusions. In doing so, it articulates the broad tenets of macrofiscal frameworks across the three country clusters, and in post-conflict contexts. The recommendations aim at informing policymaking and designing country specific macrofiscal frameworks.

Fiscal Policy Can Transform Economies
2.

The right orientation of fiscal policy can play a key role in investing in strategic and more modern sectors, and in infrastructure, knowledge assets and innovation.
The right orientation of fiscal policy can play a key role in investing in strategic and more modern sectors, and in infrastructure, knowledge assets and innovation.
21
Rethinking Fiscal Policy for the Arab Region Fiscal Policy Can Transform Economies
Fiscal Policy Can Transform Economies
Governments play a critical role in the structural transformation of economies, generally conceived as the move from agrarian low value added sectors to high value added industry and services sectors. Appropriate government interventions, guided by clear and transparent rules, can increase potential benefits from transformation.1 Historical evidence shows that industrialized countries, including in Western Europe and North America, and now in East Asia, have successfully transformed mainly with the help of proactive governments.2 Investing in research and development (R&D) and modern infrastructure, incentivizing private businesses and academic institutions, establishing patent systems and making large public procurements are examples of various supportive measures that industrialized countries continue to adopt to advance industrial upgrading and diversification.
A majority of these policy supports relate to fiscal policy interventions, particularly at the early stage of industrial development, to build up industrial capital, to invest in strategic sectors based on a country’s comparative advantages, or to develop new technologies and innovations. Fiscal incentives such as export subsidies, tax incentives and access to finance, in addition to trade and industrial policy incentives, can all stimulate private sector investment. Public-private coordination is an important government role as well. France, for example, has always favoured government-sponsored economic programmes, in which the public and private sectors coordinate their efforts to develop new technologies and industries. In 2009, the new industrial policy of the Government of the United Kingdom advocated itself as a
“market shaper” in supporting enterprise and entrepreneurial activity through investing in low-carbon infrastructure, supporting access to finance to startup and growing firms, fostering knowledge creation and its application, and developing skills and capabilities, among other interventions.3
This chapter examines the concepts and measures of structural transformation and its importance for the Arab region in terms of sustaining growth and generating decent work, as presented in section A. Section B discusses links between fiscal policy choices and structural change. Section C elaborates pathways for fiscal policy interventions and how these can promote productivity-enhancing structural change, while acknowledging that fiscal policy interventions need to be coordinated with monetary, trade and industrial policies. The final section provides a conclusion.
A. Structural change is imperative in the Arab region
The “structural transformation” of an economy corrects inefficiencies in the allocation of factors of production, leading to higher growth. GDP per capita and some measure of productivity, such as GDP per worker or GDP per working hour, are the two most common measures of aggregate economic performance.4 At the sectoral level, employment shares, value added shares and final consumption expenditure shares are the most common measures of economic activity. Measuring structural transformation requires examining changes in the relative contributions of different economic sectors over time.
2.
22
A typical structural transformation scenario involves a decline in the share of agriculture (at the lower end of value added sectors) and increases in the shares of industry, services and manufacturing (at the higher end of value added sectors). The combination of these changes contributes to increased productivity and GDP per capita over time. Subsectors within industries or services can also be disaggregated into low or high value added activities for analysis.
What matters for successful transformation is not whether structural transformation occurs, but whether it is of the right kind and how fast it takes place. The role of sectoral labour productivity and the pace of aggregate productivity are therefore important considerations. There are systematic and sizeable differences in sectoral labour productivity across countries; productivity gaps between rich and poor countries are larger in services and agriculture, as compared with manufacturing. Furthermore, developing countries have larger productivity gaps both within and between sectors, compared with advanced economies.5
Importantly, countries that shift resources from less productive traditional sectors to more productive modern sectors experience aggregate gains in productivity and economic growth. These gains alone can be seen as a narrow economic outcome of structural transformation. A broader outcome is more inclusive and sustainable development. The 2008 report by the Commission on Growth and Development found that all countries that have experienced high growth rates over several decades have exhibited structural transformation, while all countries that have remained poor have failed to undergo structural change.6
More recently, in 2015, the 2030 Agenda for Sustainable Development recognized diversification, technological upgrading and innovation as a means of improving economic productivity and generating decent
work.7 The 2016 Arab Human Development Report emphasized that sustaining economic growth requires the ability of an economy to “constantly generate new fast growing activities characterized by higher value added and productivity”.8 The Arab Development Outlook: Vision 2030 report suggested that structural transformation is key to reducing volatility in growth, and to promoting inclusive and sustainable economic growth, full and productive employment, and decent work for all, as envisaged in the eighth of the SDGs.9
The structural transformation needed for the region can be analysed by better understanding the challenges in current economic structures (sectors and subsectors) and respective labour productivity in the Arab economies. Previous studies have mainly focused on broad sectors such as oil and non-oil, or agriculture, mining, manufacturing and services.10 The services sector now absorbs the major share of the workforce in most countries; recent trends in employment indicate significant shifts of labour from agriculture to services in some countries, such as in Egypt and Morocco.11 Labour productivity growth in the region is the slowest among all regions, however, remaining at less than one from 1991 to 2010, and turning negative during 2011 to 2016.12 This raises concerns about the type of structural change that is occurring. More light can be shed by examining services subsectors in terms of output and employment.
An ideal way of dividing the services sector would be by considering the ladder of low to high value added activities in terms of technology levels. The same can be done for manufacturing subsectors. Time series employment data on subsectors of services and manufacturing, drawn from the International Labour Organization (ILO),13 are limited to a few countries in the region, however. There are comparability concerns over time while disaggregating the data by applying the latest industrial classification (ISIC 4). After rigorous scrutiny of comparable

23
Rethinking Fiscal Policy for the Arab Region Fiscal Policy Can Transform Economies
employment data on services subsectors, a seven-sector database was prepared – agriculture, oil and gas, manufacturing, construction, trade and hotels, transport and communication, and other services.14 Value added data were taken from the National Accounts database of the United Nations Statistics Division.15
Given the classification of subsectors, it would be inappropriate to identify an entire sector or subsector as high or low value added, but intuitively, and based on supporting evidence from the Arab region, most of agriculture and most activities in the other services category tend to be low in value added. Most activities in the rest of the five sectors or subsectors fall between high and low value added. Several measures of structural change are examined based on these data.
1. Changes in value added shares across sectors and subsectors
Figure 2.1 shows the economic structures of oil-rich and oil-poor countries. While
the region’s overall economy is reliant on extractive industries, oil-rich and oil-poor countries have markedly different structures. Oil, gas and mining dominate in oil-rich countries, contrasted with more diversified structures in oil-poor countries. While the share of this sector has fallen in both groups of countries over time, manufacturing growth has remained sluggish. Since the 1990s, the share of the services sector has increased in both groups of countries, but within this sector, the share of other services, which as noted earlier tend to be largely low value added and informal activities, constitutes a large share of activities and has increased over time. This pattern resonates with the growth of informal activities in the region, which are typically at the low end of value added activities.16 Overall, the economic structure of the region indicates stagnating shares of GDP from the agriculture and manufacturing sectors, an expanding services sector with a high concentration of low value added activities, and a still dominant oil sector in the oil-rich countries.
Figure 2.1 Economic structures differ, but manufacturing growth is sluggish overall
Other services Transport services Wholesale, retail trade, restaurants and hotels Construction services ManufacturingOil, gas and mining Agriculture
A. Oil-rich countries100%
90%80%70%60%50%40%30%20%10%
0%1990 2014
21.14.26.44.67.1
53.4
3.3
25.9
8.210.38.28.9
36.0
2.5
B. Oil-poor countries100%
90%80%70%60%50%40%30%20%10%
0%1990 2014
27.2
8.615.04.812.9
14.2
17.3
29.5
12.5
14.35.814.18.7
15.1
Source: Authors’ calculation based on data from UNSTATS, 2016.Note: Other services includes all service activities under ISIC.3 classification J-P, such as financial intermediation; real estate, renting and business activities; public administration and defense; compulsory social security; education; health and social work; other community, social and personal service activities; private households with employed persons; and extraterritorial organizations and bodies.

24
2. Structural change in oil-rich countries
In oil-rich countries like Oman, Qatar and Saudi Arabia, the value added share of mining and utilities is high, but they account for a very small proportion of employment. The value added share of mining actually increased in Saudi Arabia between 2000 and 2013, while it slightly declined in Oman and Qatar (figure 2.2).
There has been greater diversification in employment shares in non-oil sectors, yet the change in value added of non-oil sectors was marginal during the same period. Essentially,
diversification in oil-rich countries has largely tended towards construction, hotels and restaurants, financial services and other services. These sectors mainly involve low value added activities and are dependent upon imported low-skilled and cheap labour from Asia.17 The share of employment in other services in Oman and Saudi Arabia was much larger compared with the share of value added from this sector in 2010 and 2013, respectively. In Qatar, much of the employment share from other services has seemed to shift to construction. The employment share in construction and other services together
Figure 2.2 In three oil-rich countries, higher value added sectors contribute few jobs
Oman100%
90%80%70%60%50%40%30%20%10%
0%
Qatar100%
90%80%70%60%50%40%30%20%10%
0%2.1 1.4 6.4 5.2
50.8 46.7
3.4 5.7
5.7 10.4
4.9 5.6
2.1 5.7
2.8
25.5
8.1 8.0
6.8
13.6
4.8 5.2
7.2
0.8
26.6 22.7
68.5
43.6
2000 2010 2000 2010Value added share (%) Employment share (%)
Saudi Arabia100%
90%80%70%60%50%40%30%20%10%
0% 4.9 1.8 6.1 4.4
38.1 45.2
3.1 2.5
9.6 10.0
7.7 7.1
5.9 4.8
9.0 14.2
6.78.6
18.6 18.1
4.14.8
4.2 4.5
30.6 24.651.1 49.1
2000 2013 2000 2013Value added share (%) Employment share (%)
2001 2013 2001 2013Value added share (%) Employment share (%)
0.4 0.1 2.3 1.4
57.0 53.8
5.8 6.9
6.0 9.7
13.2 7.8
4.5 4.7
19.1 37.0
6.0 6.0
13.7
15.2
3.4 3.2
3.2
3.7
22.7 22.442.6
27.9
Other services
Transport, storage and communication
Wholesale, retail trade, restaurants and hotels
Construction
Manufacturing
Mining and utilities
Agriculture, hunting, forestry, fishing
Source: Authors’ calculation based on data from UNSTATS, 2016.

25
Rethinking Fiscal Policy for the Arab Region Fiscal Policy Can Transform Economies
accounted for 65 per cent of the total employment share in 2013, as against a 27 per cent share in value added.
Labour productivity growth, measured by growth in output per worker,18 in the construction sector was negative and high in all three countries from 2001 to 2013. Labour productivity growth in other services was also negative over the same period for Oman and Saudi Arabia. Overall, average labour productivity growth remained as low as 0.3 in Saudi Arabia, and negative in Oman and Qatar between 2000 and 2013. This pattern of sluggish average labour
productivity growth across the oil-rich countries is a stark contrast to the pattern observed by emerging market economies elsewhere in the world during the 2000s.
3. Structural changes in oil-poor countries
An examination of employment shares and value added shares in selected countries in the Arab region (figure 2.3) shows different trends for oil-poor and oil-rich countries. Egypt and Morocco, both oil-poor countries, show similar patterns of employment shares across sectors. Agriculture and other services account for the
Figure 2.3 In three oil-poor countries, structural change has been marginal
Egypt
100%90%80%70%60%50%40%30%20%10%
0%
Jordan
100%90%80%70%60%50%40%30%20%10%
0%2000 2013 2000 2013
Value added share (%) Employment share (%)
Morocco
100%90%80%70%60%50%40%30%20%10%
0%2002 2012 2002 2012
Value added share (%) Employment share (%)
2000 2013 2000 2013Value added share (%) Employment share (%)
13.8 14.5 29.6 28.0 10.6
19.0 1.5 2.0 18.0
15.7 11.9 10.7 4.7
4.6 7.9 11.4 17.2
14.1 13.2 13.4 8.5 8.6
6.6 7.9
27.2 23.6 29.3 26.6
2.3 3.2 4.2 3.2 5.8 4.9 3.2 2.2 14.8 18.4 17.2 17.9 3.9 4.8 3.2 3.5 11.8 10.3
25.7 25.7 15.6 13.0
4.2 3.6
46.0 45.4 42.3 44.0
14.8 13.4
44.4 39.2 4.3 5.9
0.9 1.0
18.8 16.5
12.4 10.5
5.1 6.2
6.8 9.9
14.0 12.2
16.3 17.7
8.3 7.1
3.5 4.5 34.8 38.6 15.7 17.2 Other services
Transport, storage and communication
Wholesale, retail trade, restaurants and hotels
Construction
Manufacturing
Mining and utilities
Agriculture, hunting, forestry, fishing
Source: Authors’ calculation based on data from UNSTATS, 2016 and ILO, 2016.
26
majority share from 2000 and 2013. Their total employment share is higher than their total value added share. During the same period, the share of manufacturing employment and value added decreased in both countries. There was an increase in the share of employment in construction, trade and transport sectors over the same period.
Jordan is historically a relatively more diversified economy, but it does not show any significant trend in terms of structural change from 2000 and 2013. The construction sector saw a relatively high and increasing share of employment, much higher than its share in value added. The share of agricultural employment was low. Over 40 per cent of employment was in other services from 2000 to 2013, which largely corresponded to its value added shares over the same years. Manufacturing employment and value added shares showed marginal increases during the same period.
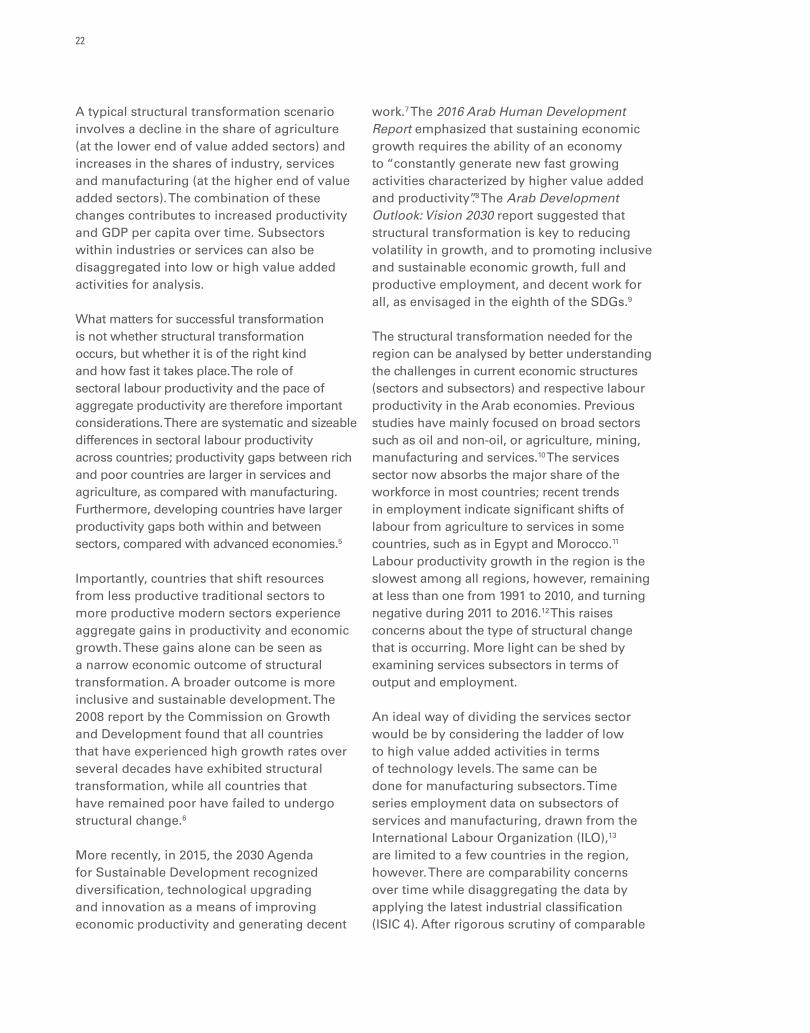
An important indicator for examining structural change is to track the pattern of change in labour productivity with the change in employment shares. Figure 2.4 displays
employment and productivity shares across sectors, using time series information from 1990 to 2013 for Egypt and 2002 to 2012 for Morocco. In Egypt, agriculture lost the largest share of employment, but the employment share declined in manufacturing as well. Labour moved into other sectors, such as trade and hotels, construction, transport and communications, mining and utilities, and other services. During the same period, productivity changes were negative in six out of the seven sectors, except for trade and hotels. A more disaggregated analysis would provide a clearer picture of negative productivity growth. More than three quarters of manufacturing value added output, for example, comes from low- and medium-to-low technology subsectors, such as food processing, basic metals and other primary products.19 Negative productivity growth in transport and communications as a whole could be due to a higher concentration of transport activities, which typically involve lower value added services than high-tech communications activities.
Similarly, in Morocco, agriculture and manufacturing lost employment shares during
Figure 2.4 Increasing employment in services was associated with declining productivity in Egypt and Morocco
Agriculture
Mining and utilities
Manufacturing
Construction
Trade and hotels
Trade and hotelsTransport andcommunication
Other services
-0.06
-0.05
-0.04
-0.03
-0.02
-0.010.000.01
-12 -10 -8 -6 -4 -2 20 4 6
Log of
sector
al prod
uctivit
y / Tot
al prod
uctivit
y
Change in employment share
Egypt(1990-2013)
Morocco(2002-2012)
Agriculture
Mining and utilities
Manufacturing Construction
Transport andcommunication
Other services
0.04
-0.04-0.05-0.06
0.03
-0.03
0.02
-0.02-0.01
0.01-0.00-6 -5 -4 -3 -2 -1 10 2 3 4
2 4 6
Log of
sector
al prod
uctivit
y / Tot
al prod
uctivit
y
Change in employment share
Source: Sarangi, Abu-Ismail and Gantner, 2017, based on data from UNSTATS, 2016 and ILO, 2016. Note: The period of analysis for each country depended upon continuous years of data availability. The values are coefficients (b) for each regression equation Log (sectoral productivity / total productivity) = a+b (change in employment share).

27
Rethinking Fiscal Policy for the Arab Region Fiscal Policy Can Transform Economies
2002 to 2012. Labour moved to construction, trade and hotels, transport and communication, and other services, but in all these sectors, productivity declined. Mining and utilities did not lose or gain in its employment share and was the only sector seeing a positive change in productivity. The negative productivity growth in trade and the hotels sector could be due to the fact that this sector in Morocco comprises a larger share of hotels, with relatively lower value added services than trade.
Patterns of labour movement and productivity change in both countries, in short, fail
to demonstrate any degree of structural transformation, despite the labour movement out of agriculture. The decline in the share of employment in manufacturing is rather worrisome, indicating a concentration of largely low and medium-to-low technology industries.
Across the oil-poor countries, average labour productivity has remained almost stagnant (figure 2.5). Variations in labour productivity across the seven sectors in Morocco and Jordan do not clearly show any significant pattern, but in Egypt, a higher variation was led by the mining and utilities sector.
Figure 2.5 Average labour productivity has remained almost stagnant
Jordan
Log labour productivity (LP) (all sectors)
Coefficient of variation (CV) (log LP across sectors)
12.011.010.0
9.08.07.06.05.04.03.02.0
12.011.010.0
9.08.07.06.05.04.03.02.0
Log LP
(all se
ctors)
CV (lo
g LP a
cross
sector
s)
2000
2001
2002
2003
2004
2005
2006
2007
2008
2009
2010
2011
2012
2013
Egypt
Morocco
12.011.010.0
9.08.07.06.05.04.03.02.0
12.011.010.0
9.08.07.06.05.04.03.02.0
Log LP
(all se
ctors)
CV (lo
g LP a
cross
sector
s)
1990
1992
1994
1996
1998
2000
2002
2004
2006
2008
2010
2012
12.011.010.0
9.08.07.06.05.04.03.02.0
12.011.010.0
9.08.07.06.05.04.03.02.0
Log LP
(all se
ctors)
CV (lo
g LP a
cross
sector
s)
2002
2003
2004
2005
2006
2007
2008
2009
2010
2011
2012
Source: Sarangi, Abu-Ismail and Gantner, 2017, based on data from UNSTATS, 2016 and ILO, 2016.Note: The period of analysis for each country depended upon continuous years of data availability.

28
Theoretically, the growth of labour productivity can happen in two ways.20 The first is due to productivity growth within a sector through capital accumulation, technological change or reduction of misallocation across plants. The second can be due to a move of labour from low-productivity to high-productivity sectors, which is referred to as a structural effect. Evidence from Jordan and Morocco during 2001 to 2013 suggests that labour productivity growth was positive due to improvement within the sectors, while reallocation of labour across sectors or the structural component has a negative effect, which pulls down overall labour productivity growth.21 Similar results were noted for Egypt.22
The pattern of structural change in oil-rich and oil-poor countries, where shifts in employment towards non-oil sectors are often associated with declining productivity growth, cannot support the transformation of economies. It appears that these countries are locked in a “low productivity trap” that negatively affects the creation of decent work and real wage growth. Existing industries, mainly in the services sector, generate a high demand for low-skilled workers, and therefore it is no surprise that unemployment in Arab countries is especially high among the most educated members of the workforce.23
B. Public investment choices have restrained structural transformation
In the Arab region, the lack of productivity-enhancing structural change may be due to several issues, including the political economy, a segmented labour market, low absorptive capacity and an overvalued exchange rate.24 Other issues comprise infrastructure bottlenecks and lack of adequate access to finance.
Fiscal policy can play a key role in supporting industrial and trade diversification, as shown in China and the Republic of Korea. Yet fiscal
reforms in government spending in the Arab region, particularly in the oil-poor countries, have often relied on cutting expenditures for productive activities, rather than spending for populist consumption or military purposes. Even countries that invested in productive infrastructure, such as the oil-rich countries, failed to capitalize on this due to limited absorptive capacity, lack of advancement in education, or lack of proper coordination between fiscal, macroeconomic and industrial policies, which undercut the utility of these investments. The lack of diversification to productive sectors has been compounded by the fact that private investment and foreign direct investment didn’t “crowd in” further investment as was expected or as registered in other emerging countries in the 1990s and 2000s.
This section assesses fiscal policy in terms of public investment patterns in oil-rich and oil-poor countries, and considers what went wrong in advancing structural change in the region.
1. Quantity versus quality of investment
From 2000 to 2014, the public investment rate in Arab countries was similar, on average, to that in other developing countries, standing at about 7.5 per cent of GDP.25 However, this figure masks large disparities between oil-rich and oil-poor countries, the latter being constrained by fiscal space and showing low levels of public investment (figure 2.6). While public investment was slowing down during the 2000s, private investment was picking up in several oil-poor countries due to favourable economic conditions and the spillover of high growth in oil-rich countries led by the increase in the price of oil.
Since 2010, both public and private investment rates have been decreasing, leading to a decline in total real investment rates in most Arab countries. In the period 2000-2014, total investment rate in the Arab region was about 23 per cent of GDP, only two percentage points less than the average rate of developing countries.26

29
Rethinking Fiscal Policy for the Arab Region Fiscal Policy Can Transform Economies
Despite that, the region suffers from the lowest productivity growth of all regions in the world,27 combined with lack of economic and trade diversification. Studies indicate that it is not the overall level of investment but its quality and efficiency, including careful choice of the optimal investment level and allocation across sectors that are essential for boosting economic growth.28 Fiscal policy choices have a critical role in this sense.
Choices can be further examined by looking at current and capital expenditure across oil-rich and oil-poor countries. On average, the share of capital expenditure for the oil-rich countries increased from 12.5 per cent to 27 per cent during 2000 and 2010, which can be attributed to the influence of increased oil revenues during the period. The share witnessed a decline in 2013 and 2015, however (figure 2.7). This pattern indicates that when oil revenues are under pressure, cutting capital expenditure is the easiest way to reduce spending. Furthermore, investments in the oil-rich countries were not targeted to developing productive non-oil sectors; most economic diversification was towards construction
and hotels. These sectors relied mainly on foreign low-skilled labour, due to a scarcity of appropriately skilled labour in the oil-rich countries. Despite infrastructure creation, effects in terms of innovation and the creation of higher productivity non-oil sectors remained minimal.
The capital expenditure share in the oil-poor countries has been relatively weak, particularly after reductionary public expenditure policies adopted by these countries since the 1990s. The share continued to fall during the 2000s and 2010s, and stood at only around 11 per cent on average in 2015 (figure 2.7). Public expenditure has weighed on the side of subsidies and consumption, public sector salaries, interest payments, military expenditure and so on. Low investment in infrastructure has hampered diversification to manufacturing activities although human capital improved to some extent through historic investment in education. This, however, was not sufficient to raise productivity, which requires advancing education levels and quality as well as research and innovation, and ensuring the ready absorption of skilled people into labour markets.
Figure 2.6 Total investment in selected Arab countries (Gross fixed capital formation as a percentage of GDP, public and private)
Public (% GDP) Private (% GDP)
9.9 8.7 5.8 4.8 4.4 3.9 4.4 1.7 1.7
21.3
2.6 3.9 1.0 4.0 3.2 9.4 9.6 11.1
5.8 4.7 0.8
9.1 10.5
7.8 16.3 18.6
23.4 16.6 23.2
19.6
9.3
16.0 16.2
14.6
21.1 21.0 11.5 14.9 12.3
13.1
7.0
1.0
2000 2010 2015 2000 2010 2014 2000 2010 2015 2015 2000 2010 2015 2000 2009 2001 2010 2015 2000 2010 2015Egypt Jordan Lebanon Iraq Sudan Tunisia United Arab
Emirates Yemen
Perce
ntage
of GDP
35.0
30.0
25.0
20.0
15.0
10.0
5.0
0.0
Source: Authors’ calculation based on data from World Bank, 2017b.

30
2. A poor record on crowding in private investment
One of the critical factors driving economic diversification is private investment. A conducive fiscal policy guiding public investment in the right direction helps to crowd in private investment, depending in part on the quality of institutions. While weak institutions tend to diminish the positive effects of public investment, better institutions tend to support significantly higher marginal productivity from public investment and the crowding-in effect of private investment. Countries with better institutions are more open to international trade and financial flows.29
The experience of the Arab region is unfortunately poor in this regard. Historically, the ratio of private to public investment was close to two from 1974 to 2000, meaning that private investment was twice as large as public investment. The ratio remained well below the levels of the Organisation for Economic Co-operation and Development (OECD) economies (with ratios close to six) or of the rapidly growing East Asian economies (with ratios close to five).30
Foreign direct investment inflows to Arab countries, as a share of GDP, were considerably lower than average inflows to other developing countries in 2015, largely due to the compounded effects of the global financial crisis and the Arab uprisings. Between 2011 and 2015, average annual inflows of foreign direct investment, portfolio investments and other official flows amounted to $42.6 billion, compared with outflows of those of about $69.2 billion.31
3. Expenditure on R&D is not significant enough to spur innovation
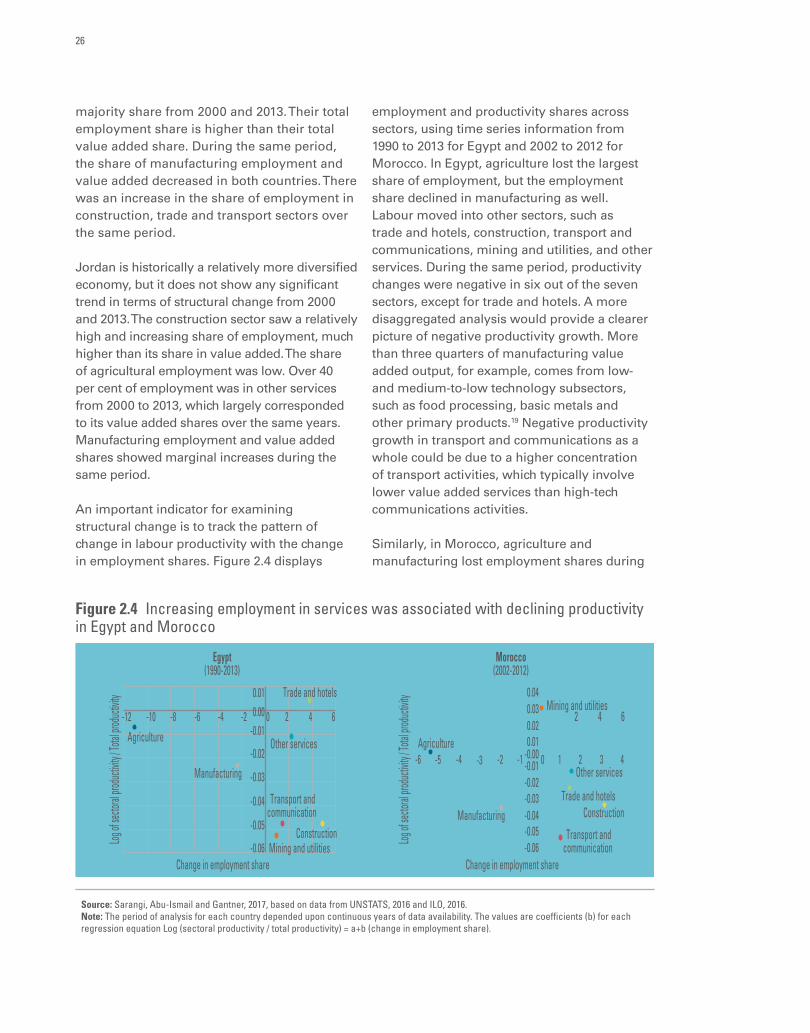
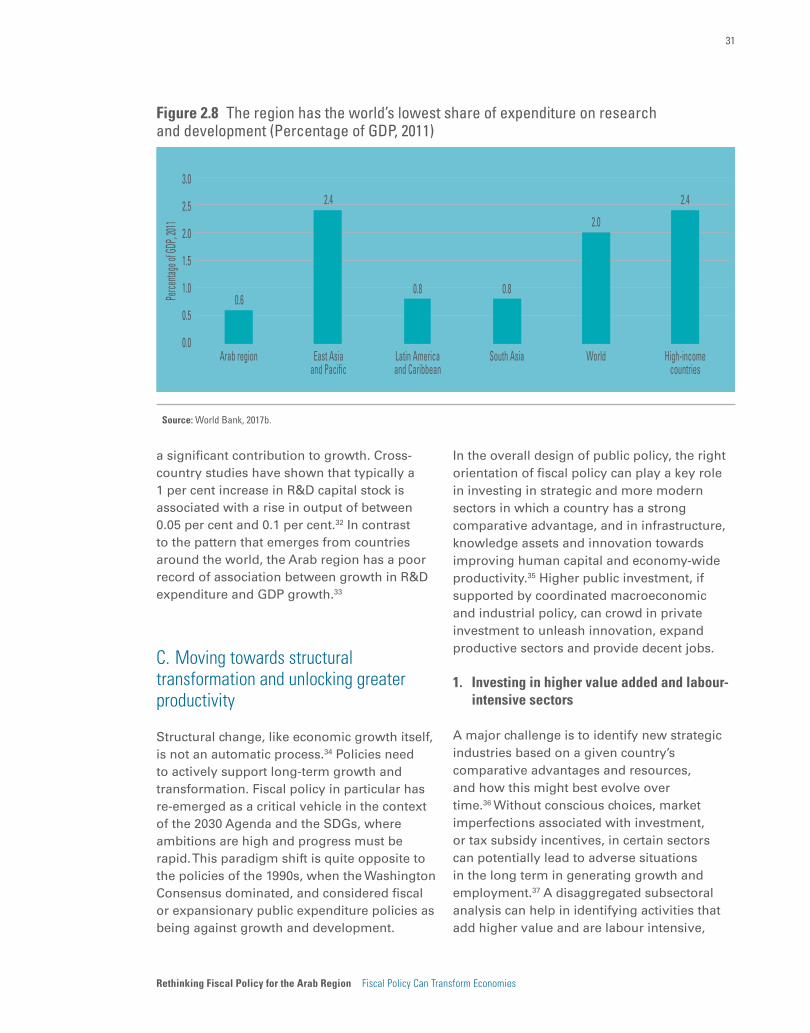
For the Arab region, expenditure on research and development, as a share of GDP, was only 0.6 per cent in 2011, the lowest share among all developing regions (figure 2.8). The East Asia and Pacific region, which led industrial growth in the last decade, has witnessed research and investment that on average has been four times higher than that of the Arab region.
Low investment fails to encourage the kinds of innovations usually associated with an increase in industrialization and economic growth. Research and innovation can make
Figure 2.7 Capital expenditure has been relatively weak (Percentage of total expenditure)
100908070605040302010
02000 2005 2010 2013 2015 2000 2005 2010 2013 2015
Oil-rich high- and middle-income countries Oil-poor middle-income countries
Current expenditure (% of total expenditure) Capital expenditure (% of total expenditure)
87.5 78.7 73.0 76.6 76.2 81.1 85.4 84.5 89.7 89.4
12.5 21.3 27.0 23.4 23.8 18.9 14.6 15.5 10.3 10.6
Source: Sarangi, Abu-Ismail and Gantner, 2017, based on reports of ministries of finance for Kuwait, Morocco, Oman, Qatar, Saudi Arabia and Tunisia, and IMF government finance statistics for Egypt, Jordan and Lebanon.Note: Definitions of capital expenditure were made consistent over time using IMF, 2001.
31
Rethinking Fiscal Policy for the Arab Region Fiscal Policy Can Transform Economies
a significant contribution to growth. Cross-country studies have shown that typically a 1 per cent increase in R&D capital stock is associated with a rise in output of between 0.05 per cent and 0.1 per cent.32 In contrast to the pattern that emerges from countries around the world, the Arab region has a poor record of association between growth in R&D expenditure and GDP growth.33
C. Moving towards structural transformation and unlocking greater productivity
Structural change, like economic growth itself, is not an automatic process.34 Policies need to actively support long-term growth and transformation. Fiscal policy in particular has re-emerged as a critical vehicle in the context of the 2030 Agenda and the SDGs, where ambitions are high and progress must be rapid. This paradigm shift is quite opposite to the policies of the 1990s, when the Washington Consensus dominated, and considered fiscal or expansionary public expenditure policies as being against growth and development.
In the overall design of public policy, the right orientation of fiscal policy can play a key role in investing in strategic and more modern sectors in which a country has a strong comparative advantage, and in infrastructure, knowledge assets and innovation towards improving human capital and economy-wide productivity.35 Higher public investment, if supported by coordinated macroeconomic and industrial policy, can crowd in private investment to unleash innovation, expand productive sectors and provide decent jobs.
1. Investing in higher value added and labour-intensive sectors
A major challenge is to identify new strategic industries based on a given country’s comparative advantages and resources, and how this might best evolve over time.36 Without conscious choices, market imperfections associated with investment, or tax subsidy incentives, in certain sectors can potentially lead to adverse situations in the long term in generating growth and employment.37 A disaggregated subsectoral analysis can help in identifying activities that add higher value and are labour intensive,
Figure 2.8 The region has the world’s lowest share of expenditure on research and development (Percentage of GDP, 2011)
0.6
2.4
0.8 0.8
2.0
2.4
Perce
ntage
of GDP
, 2011
Arab region East Asiaand Pacific
Latin Americaand Caribbean
South Asia World High-incomecountries
3.0
2.5
2.0
1.5
1.0
0.5
0.0
Source: World Bank, 2017b.

32
for expansion through appropriate policy incentives. Sub-sectoral information over time on output, investment, employment and wages, in addition to taxes and subsidies on labour and capital, is therefore important for examining the relative advantages of particular sectors in a given country.
Industries can be positioned at the right stage of global value chains so they can benefit from increases in international trade in intermediate and semi-finished products. Commodity-based industrialization can capitalize on natural resources, and a focus on upstream linkages can help to replace raw materials as exports with higher-value processed goods. Product space analysis in oil-rich and oil-poor countries provides interesting insights about competitive advantage. For instance, Egypt could reap higher benefits from moving away from a resource-based export basket into more complex and interconnected sectors such as chemicals and machinery.38 For Kuwait and other oil-rich countries, chemicals, petrochemicals, machinery and some products in the foodstuff sector could be the anchor for higher value added industrial diversification.39 Specific policies may be needed to promote promising industries across the region, like the agro-industry and rural non-farm activities. Much depends, however, on aligning appropriate industrial policies with fiscal interventions.
Many countries in the Arab region have adopted industrial policies in an effort to encourage private sector growth and structural transformation, but without achieving the desired results, as noted above.40 Egypt’s approach to industrial policy post-independence was primarily through State investment in heavy industry and the use of regulatory powers to direct private sector investment in favoured sectors. Furthermore, the 1990s onwards saw a greater role for private investment in structural transformation through the privatization of State-owned
enterprises, simplification of customs procedures and business start-up regulations, as well as continued liberalization of the financial sector. In Morocco, industrial policy has alternated between selective targeting of benefits to certain sectors and broad-based targeting to all exporters through tariffs and licenses. The Syrian Arab Republic’s approach comprised building industrial cities and export promotion agencies. Jordan created a variety of programmes, such as tax incentives and development zones, to support industry.
Arab countries are faced with few options today. Even under the most optimistic scenarios, a leap in low value added non-oil exports would not be sufficient to sustain the capital goods import requirements for a fast-growing industrial programme. Countries therefore need to follow a different path of productivity enhancement that can lead to cumulative growth and different patterns of specialization. Industrial policy can guide these changes.
2. Investing in infrastructure, research and innovation, and human assets
Exploiting industrial competitive advantages is neither possible, nor optimal, without high-quality infrastructure, knowledge and innovation, and a skilled labour force. Investing in infrastructure, including putting emphasis on renewable energy, water and transport, supports industrialization and structural transformation. Towards that end, Arab countries need to spend an estimated $110 billion to $150 billion a year in the coming five years on non-energy infrastructure alone.41 In the energy sector, the International Energy Agency estimates that $105 billion will be needed from 2014 to 2020.42 The requirements are much more if losses in conflict-affected countries are taken into account.
Knowledge and innovation have spillover effects to the entire economy, and they can ensure that new strategic sectors can be explored. The Arab region lags when it comes
33
Rethinking Fiscal Policy for the Arab Region Fiscal Policy Can Transform Economies
to research and development, however, investing half as much as Singapore does, and a quarter as much as Israel does. To overcome limited knowledge assets and research capacity, Arab countries need to consider a significant boost to R&D expenditure.
Any national development strategy should include a plan to boost innovation potential, in particular the capacity to patent innovations, company spending on R&D and university-industry collaborations. One way in which research and development can be fostered is to create centres of excellence that coordinate research programmes to inform critical public policy choices.43
Creating an optimally skilled workforce is central to structural transformation. By enhancing education and research opportunities, Arab countries can ensure high-quality human capital for sectors where they have latent competitive advantages, and high-tech industries and services. Education policy needs to focus on reducing domestic reliance on the rest of the world for technological expertise.
Investing in technological advances is key to diversifying, and raising productivity and growth. The region needs to leverage the transfer of technology in global value chains, in cross-border concerns such as climate change, and in essential health services.
Building fiscal space for investment spending is essential. Arab States spend, on average, 5 per cent of GDP on military expenditure, twice the world’s average. Spending is significantly higher than on health and education. Expenditure switching, by reallocating a part of military expenditure, is not only key to strengthening fiscal space for infrastructure and human assets, but also central to transforming economies.44 Other areas of expenditure reforms include subsidies and establishing medium- and long-term rules in fiscal spending. Encouraging higher national savings and taxation reforms, discussed in
chapter 4 in greater detail, can also generate room for public investment.
3. Fiscal policy in the context of overall national economic policy and the Arab Customs Union
Successful structural transformation and inclusive development rely not just on public investment but also on fiscal policy coherence with monetary and exchange rate policies as well as industrial policies. Ensuring that national institutions are equipped for effective policy coordination is therefore key. Currently, a combined effect of oil revenue volatility and imperfect institutions, particularly in fiscal management, pose major hindrances. A recent study argued that well-strategized, forward-looking institutions and better fiscal policy can offset some of the negative effects of oil revenue volatility, and help in sustaining the growth and diversification of economies.45
The region has much to learn from the Republic of Korea, as its policies are in some respects similar to those in the Arab region, yet yielding much more success,46 for reasons that might include far-reaching public sector reforms that limited the extent to which leaders could abuse their power. Industrial policy was accompanied by infrastructure construction aimed at a more productive economy, along with support for human capital development.
By contrast, Arab countries have not properly defined market failures and thus could not develop policies to correct them. In the Republic of Korea, for example, subsidies were tightly linked to more competitive export markets and used to ensure compliance with targets guiding steady progress. In the Arab region, Egypt has seen a high share of foreign direct investment into real estate, mainly from Gulf Cooperation Council (GCC) countries. But this has limited scope for technological spillovers, productivity enhancement or the generation of decent work.

34
Regional integration policies that align incentives and business environments offer enormous growth potential for the Arab region. The establishment of the Arab Customs Union could provide ground for greater fiscal policy coordination among Arab States, fostering structural transformation.47 Selection of an appropriate common external tariff that takes into account obligations and agreements among member countries, and World Trade Organization (WTO) rules and regulations, is a critical challenge to overcome (box 2.1).
D. Main findingsDespite relatively high public sector investments on average compared with the rest of the world, the Arab region has been far from experiencing any structural change in the last three decades. The stagnating shares of agriculture and manufacturing, an expanding services sector with a high concentration of low value added activities, and a still dominant oil sector are general features of the region. The oil, gas and mining sectors dominate in oil-rich-countries, compared with more
Box 2.1 Fiscal policy coordination and the Arab Customs Union
In setting up the Arab Customs Union, Arab countries face several challenges related to the selection of an appropriate common external tariff, mechanisms for the collection and distribution of customs revenues, and measures to compensate for losses in the revenues of some member countries. The net effect of the union varies between countries, and is largely related to the choice of a common external tariff, the contribution of trade taxes to government revenues and the diversification of indirect tax instruments. A thorough analysis is needed to assess likely costs and identify appropriate compensation mechanisms.
The impact on public finances is largely related to the extent to which each country relies on customs revenues for total government revenue as well as on indirect taxes on imports. Countries are divided in two groups accordingly: those where commercial taxes account for a large proportion of total government revenue; and those where commercial taxes do not contribute significantly to total government revenue.
The high dependence on commercial taxes exposes countries to the possibility of declining revenues as a result of joining the union, depending on the common external tariff. Nevertheless, adopting a lower tariff can increase trade and customs revenues. Countries facing a negative impact on customs revenues could adopt alternative income-generating schemes. For example, Lebanon applies a value added tax on all purchases and a tax on corporations. Taxes imposed on international trade are not limited to tariffs, but also include a consumption tax on cars, tobacco, oil and gasoline, and alcoholic and non-alcoholic beverages, all of which account for 65 per cent of total taxes on international trade.
Negative effects in countries that marginally rely on commercial taxes are much lower. While non-tax sources constitute the largest proportion of government revenue in this group of countries, trade taxes remain an important source of revenue.
During the negotiations to create the union, two main issues will be the collection of customs duties and the distribution of such fees. If a common external tariff or changing trade patterns cause a decline in customs revenues, an important question will be whether customs revenue is considered a common property or property of each member country. If joint ownership is considered, customs revenue collection requires the establishment of a regional institution and a level of trust among member countries.
Source: ESCWA, 2015b.

35
Rethinking Fiscal Policy for the Arab Region Fiscal Policy Can Transform Economies
diversified structures in oil-poor countries. Since the 1990s, the share of oil and gas output has fallen in both groups of countries, but manufacturing sector growth has not picked up the slack, while service sector output has risen in large part through informal activities.
The oil-rich countries, particularly the GCC countries, have invested a relatively high share of their total expenditure into capital expenditure, such as in creating improved infrastructure. But that has not contributed to developing more productive non-oil modern sectors. So far, economic diversification has happened in terms of construction, hotels and restaurants, and other services, all low value added activities that flourished by importing cheap labour. This undermined growth of manufacturing and modern high-tech sectors, and hardly contributed to improving absorptive capacity and quality education, which are essential for greater productivity and innovation.
The oil-poor countries suffer from severe infrastructure deficiencies, spurred by low levels of public spending and choices to favour subsidies and consumption, public sector salaries, interest payments, military expenditures and so on. In some countries,
such as Egypt, Jordan and Morocco, aggregate productivity has been almost stagnant since 1990. The association between changes in labour productivity and changes in labour share across sectors indicates a labour movement out of agriculture, but not structural transformation that leads to higher productivity growth. The end result is a large share of informal, non-agricultural employment that is low in productivity and wages.
Investment in quality education and human capital remain a major challenge. The Arab region has a poor record of association between research and development expenditure and GDP growth, compared with the rest of the world. While addressing these challenges requires the right fiscal policy choices, complimentary reforms must also be enacted in related areas such as industrial, trade and employment policy.
If the region aims for a new era of sustained and inclusive development, progress in economic diversification and productivity-enhancing structural transformation is an imperative. It must be part of a new and virtuous cycle of growth, decent work and poverty reduction, an essential element of the vision of the 2030 Agenda.


Fiscal Policy Can Advance Inclusive Development
3.

Fiscal frameworks should consider setting fiscal rules to guide and sustain adequate social expenditure, taking into account global and regional risks.
Fiscal frameworks should consider setting fiscal rules to guide and sustain adequate social expenditure, taking into account global and regional risks.

39
Rethinking Fiscal Policy for the Arab Region Fiscal Policy Can Advance Inclusive Development
Fiscal Policy Can Advance Inclusive Development
Strategic public investments, guided by fiscal policy, can ignite economies so that they become diversified and productive, and aligned with the principles of inclusion and sustainability. Social expenditures are equally important, ideally aiming for the highest levels of human well-being and capital through high-quality, universally available education, health care, housing and social protection.
The links between human development and economic growth1 can move in virtuous or vicious cycles. Fiscal policy is key to determining what the direction will be. If it backs growth that is inclusive and equitable, more benefits reach poor households than non-poor ones, ensuring that the former can catch up to the latter.2 The role of fiscal policy here is more than just redistributive. It actively marshals public investment to support growth and structural transformation, provides fiscal space for countercyclical fiscal policies to protect the poor against shocks, and delivers public goods, primarily health care and education, to increase human capabilities and opportunities for well-being, permanently enhancing individual contributions to economies and societies.3
Social expenditure falls in two broad areas. The first is social protection, which comprises social insurance, general subsidies and social assistance, including targeted support programmes. The second entails essential public services such as health care and education.4 The OECD constructs social expenditure by taking into account different dimensions of broad social policy, such as old age; survivors; incapacity-related benefits; health; family; active labour market policies, including employment-related
trainings, services and direct job creation; unemployment; housing and other social policy areas.5
Available time series data on each element of social expenditure in the Arab region are limited, however, and not consistent over time in most cases. More comprehensive data can be drawn from the IMF functional classification of Government Finance Statistics, which provides social expenditure data on health, education, housing and social protection. The analysis in this chapter relies heavily on the IMF data series, but also on national government finance statistics where relevant.
The chapter examines patterns of public social expenditure in the Arab region. Section A provides an overview of trends for the last two decades, including on social expenditure, education and health. Section B looks at the link between public expenditure and inclusive growth, taking into account the redistributive impact of fiscal policy. Section C analyses the impact of public social expenditure on health and education achievements. Finally, section D presents the main findings for this chapter.
A. Public expenditure is under pressure
1. Total public expenditure: declining and more unpredictable
Arab States have experienced repeated adjustments in public social expenditure since the 1980s, when public expenditure in the region peaked at approximately 50 per cent of GDP. Reductionary public expenditure policies were introduced with
3.

40
the liberalization and privatization policies of the Washington Consensus in the 1990s.6 As a result, from the 1990s until the mid-2000s, public expenditure as a share of GDP witnessed a downward trend in most countries, both oil-poor and oil-rich. The share of public sector employment did not follow the same downward trend, however; it consumed a major part of government expenditure. In oil-rich countries and Egypt, public sector employment increased in the 1990s,7 indicating that cost-cutting mainly affected capital expenditure, including to build productive capacities, as noted in the previous chapter.
Starting in 2005, the oil-rich countries increased public expenditure as a share of GDP, given rising oil prices. On average, the public expenditure ratio rose from 28 per cent in 2005 to 50 per cent in 2014 (figure 3.1). The upsurge from 2011 to 2012 can be attributed to an increase in public salaries and benefits in reaction to the Arab uprisings.8 By 2014, plunging oil prices put stress on high government expenditure in oil-rich countries, however, and by 2015, they found it difficult to maintain these.
In oil-poor countries, policy uncertainties relating to public expenditure have been apparent since the mid-2000s. These countries have witnessed a slight increase in the ratio of public expenditure to GDP, on average, from 27 per cent in 2005 to 30 per cent in 2014, but the share then dropped to 28 per cent in 2015 (figure 3.1). The earlier increase was partly due to the rise in oil subsidies linked to rising oil prices during this period,9 and partly due to discretionary spending to halt the spread of the Arab uprisings, even though these economies were losing economic growth. As a consequence, fiscal deficits jumped significantly. In 2014 and 2015, most of these countries had to adopt fiscal adjustment programmes, particularly by cutting expenditure. The recent period underlines a tendency towards ad hoc policy responses that lack guidance by clear fiscal rules.
2. Total social expenditure: inadequate and poorly targeted
Average public social expenditure, as a share of GDP, has witnessed ups and downs from 1990 to 2014 in both oil-rich and oil-poor countries. The average was around 12 per cent
Figure 3.1 Public expenditure in Arab countries from 1990 to 2015
A. Oil-rich countries
60.055.050.045.040.035.030.025.020.015.010.0
Perce
ntage
of GDP
Bahrain OmanKuwaitSaudi Arabia Average
EgyptTunisia
Jordan LebanonMorocco Average
B. Oil-poor countries
60.055.050.045.040.035.030.025.020.015.010.0
Perce
ntage
of GDP
1990
1992
1994
1996
1998
2000
2002
2004
2006
2008
2010
2012
2014
2015
1990
1992
1994
1996
1998
2000
2002
2004
2006
2008
2010
2012
2014
2015
Source: Sarangi and Bonin, 2017, based on data from ministries of finance for Morocco and Saudi Arabia, IMF government finance statistics for the remaining countries, and World Bank, 2017b for GDP data.

41
Rethinking Fiscal Policy for the Arab Region Fiscal Policy Can Advance Inclusive Development
for the oil-rich countries and around 11 per cent for the oil-poor countries in 2014, significantly below the average of OECD countries, at 21 per cent.10
In the oil-rich countries, the share of social expenditure was at almost the same level in 1990 and 2014. The slight increase in the average since 2005 could be attributed to larger fiscal space from growing oil revenues. In oil-poor countries, the trend grew significantly from the mid-2000s until 2014, mostly attributed to the increase in oil import bills since 2005 as energy subsidies constitute part of social assistance measures in some countries. Data on social assistance is rather scanty in the region but the strong association between higher fuel subsidies and an increase in the social protection component of social expenditure is apparent in Egypt and Tunisia.11
A look at different components of social expenditure, particularly on education and health care, can be revealing (figure 3.2). In oil-rich countries, expenditure on education as a share of GDP has remained almost at the same level in 2013 (4.7 per cent) as that in 1990
(4.9 per cent). There were several episodes of downward swings in the 1990s and 2000s, while a slight increase occurred from 2011 to 2013. Average expenditure on health care, as a share of GDP, was stagnant from 1990 to 2008, after which it marginally increased from 2 per cent in 2011 to 2.8 in 2013.
In oil-poor countries, average spending on education, as a share of GDP, remained around 5 per cent from 1990 to 2014. But a noticeable decline took place after 2008, to 3.3 per cent on average in 2014. Average health-care expenditure stagnated between 2000 and 2014 at around 2 per cent. In OECD countries, health and education expenditure shares accounted for 6 per cent of GDP and 5.2 per cent of GDP, respectively, in 2013.12
The region has unusually high out-of-pocket expenditure on health care (figure 3.3). Out-of-pocket spending on both health and education consumes up to 8 per cent of the disposable income of the poor and 11 per cent of that of the middle class.13 This may not be a surprise because the share of students enrolled in private educational institutions is noticeably
Figure 3.2 Public social, health and education expenditure (Percentage of GDP)
A. Oil-rich countries14.0
12.0
10.0
8.0
6.0
4.0
2.0
0.0
1990
1992
1994
1996
1998
2000
2002
2004
2006
2008
2010
2012
2014
2015
1990
1992
1994
1996
1998
2000
2002
2004
2006
2008
2010
2012
2014
2015
Health Social protectionEducation Housing Social expenditure (total)
B. Oil-poor countries14.0
12.0
10.0
8.0
6.0
4.0
2.0
0.0
Perce
ntage
of GDP
Perce
ntage
of GDP
Source: Sarangi and Bonin, 2017, based on data from ministries of finance for Morocco and Saudi Arabia, IMF government finance statistics for the remaining countries, and World Bank, 2017b for GDP data.Note: Data on each element were made consistent over time using IMF, 2001.

42
higher in several countries, such as Jordan at 34.5 per cent and Lebanon at 73.9 per cent in 2014,14 compared with the world average of 13.4 per cent. The neglect of public social expenditure on education and health does imply that financial burdens on poor and lower middle-income households may be high.
Egypt is showing greater commitment to increased health and education expenditure, as mandated by its new Constitution. It aims to boost health expenditure from its 2015-2016 level of 1.9 per cent of GDP to 3 per cent in 2016-2017, and education expenditure from 4 per cent of GDP in 2015-2016 to 6 per cent in 2016-2017.15 Whether this commitment is fulfilled has yet to be examined, awaiting recent data for 2016 and 2017.
Other aspects of social expenditure are housing and social protection. The average expenditure on housing, as a share of GDP, for oil-rich countries was relatively stagnant at around 2 per cent from 1990 to 2014. During the same period, the share in oil-poor countries declined from 1.3 per cent to 0.6 per cent. These trends are a concern given rapid urbanization in the region. In 2010, the Arab population was estimated at 357 million people, with 56 per cent living in cities. By
2030, the population is expected to increase to 487 million, with 63 per cent living in cities and their margins.16
The Arab Multi-Dimensional Poverty Report shows that deprivation in living conditions is a major driver of poverty across countries, including child poverty.17 A stagnant share of expenditure on housing therefore poses a question on achieving the SDG commitment to sustainable urban development, given increasing concerns around urban poverty, and pressures on water, land and other resources.
Average expenditure on social protection, as a share of GDP, was noted to be fluctuating significantly, but it rose slightly from 2 per cent in 2005 to 3 per cent in 2014 in the oil-rich countries. Oil-poor countries, however, saw a significant increase from 3 per cent in 2003 to 5 per cent in 2014, with large fluctuations amid social turbulence. Social protection programmes in general suffer from poor targeting, expenditure on subsidies that do not consistently benefit those most in need, and fragmented social assistance expenditures. About 70 per cent of people in the poorest quintiles of the population do not receive public transfers; around two-thirds of people in the labour force are not covered by pension schemes.18
Figure 3.3 Out-of-pocket expenditure is unusually high (1995-2014)
60.0
50.0
40.0
30.0
20.0
10.0
0.0
Out-o
f-pock
et heal
th expe
nditur
e(%
of tot
al expe
nditur
e on h
ealth)
200620052004200320022001200019991998199719961995 2007 2008 2009 2010 2011 2012 2013 2014
Arab region World Low income Upper middle income High income Middle income
Source: World Bank, 2017b.

43
Rethinking Fiscal Policy for the Arab Region Fiscal Policy Can Advance Inclusive Development
Subsidies constitute a significant part of social expenditure, and while several countries are currently undergoing reforms in this area, the extent to which savings are utilized in social protection programmes remains to be seen. Making this investment is particularly critical given demographic dynamics, where social protection expenditures may need to increase in response to ageing populations, and the challenges magnified by crises in many parts of the region.
3. Subsidies often do not reach the poor
Historically, subsidies have been at the core of social protection systems in the Arab region. Precise estimates of subsidies are
not easily available across countries, as they are often combined with transfers or other social benefit expenditures. Nevertheless, in several countries, such as Egypt, Jordan, Kuwait and Oman, figures show that over a quarter of government current expenditure went to subsidies in 2011, mostly to energy subsidies.19 As a share of GDP, food and fuel subsidies rose to 10 per cent in some countries, such as Egypt (figure 3.4). More than three quarters of this expenditure was on fuel. In Jordan, food and fuel subsidies were about 4 per cent of GDP in 2012; 76 per cent of subsidies went to fuel. Changes in oil prices, political pressure and reforms have all affected spending on subsidies after the Arab uprisings, however (box 3.1).
Figure 3.4 Government spending on subsidies as a share of GDP
109876543210
2014 201520132012
Perce
ntage
of GDP
Egypt Jordan Lebanon Morocco Tunisia
Source: Authors’ calculation based on data from respective IMF country reports.Note: Data on subsidies may not be precise and comparable across countries. Data for Lebanon and Tunisia include subsidies and transfers; data for Egypt and Jordan include food and fuel subsidies.
Box 3.1 Subsidy reforms follow increased expenditures
Following the Arab uprisings in 2011, several countries increased subsidy expenditures. Jordan announced food subsidies, a freeze in fuel prices and a reverse in an earlier reform to adjust petrol prices. Morocco almost doubled its subsidies budget, which by the end of 2012 grew to almost the size of the overall fiscal deficit, as much as spending on investment, and more than spending on health and education combined.
Decisions to increase subsidies coincided with rising oil prices. In the oil-poor countries, this was not matched by higher revenues, however, which then pushed many of these countries to initiate subsidy

44
There are different approaches to estimating the cost of energy subsidies. One is to calculate the direct effect of subsidies, emanating from a price charged to consumers that is less than the cost of supplying fuel.20 By this estimate, the cost of fuel subsidies as a share of GDP in several countries was substantial in 2013: over a tenth of GDP in Egypt and Libya, and around 5 per cent in many other countries, significantly above the global average of 2 per cent. The cost of subsidies significantly declined between 2013 and 2015 in almost all countries, however, partly due to a drop in oil prices and some energy subsidy reforms. Nevertheless, energy subsidies remained above the global average in 2015, and represented a large share of global energy subsidies, approximately
27 per cent.21 Given this large sum, it is important to understand how benefits are distributed across income levels and to the poor, specifically. A recent survey indicated that the main beneficiaries of energy subsidies tend to be middle- and high-income populations, since their consumption is significantly larger than that of the poor (table 3.1).22
In Egypt, for instance, between 2003 and 2009, the poorest 40 per cent of the population benefited from only 3 per cent of the subsidies for gasoline, 10 per cent for diesel and 33 per cent for liquefied petroleum gas. In Jordan, the distribution is slightly more equitable, but still not targeted. The poorest 40 per cent captured 20 per cent of the subsidies for gasoline, 14 per cent for
cuts. Initial reforms of energy prices in Morocco in 2013 reduced subsidy costs by almost 50 per cent, to 10 per cent of government spending. Total subsidies – including for food and fuel – peaked in 2012 at 6.5 per cent of GDP before falling to 4.6 per cent in 2013. In 2012, Jordan decided to eliminate fuel subsidies and gradually lift electricity and water subsidies. Egypt and Tunisia, among others, also introduced several measures to cut subsidies into electricity and petroleum products during 2013-2015, as shown by the declining expenditure on subsidies as a share of GDP (figure 3.4).
Among the oil-rich countries, the 2014 drop in oil prices led to revenue declines and a search for savings. Fuel subsidies were cut from $190 billion in 2014 to an estimated $86 billion in 2016. The United Arab Emirates, for example, deregulated fuel prices, and increased tariffs for water and electricity. In Oman, the industrial price for natural gas doubled.
Recent public expenditure reforms to contain high and increasing debt in several oil-poor countries have focused on fuel and electricity prices, while food subsidies have remained largely untouched. Determining how savings from reforming subsidies have been used – including for human capital investments and pro-poor benefits – is difficult, however, for reasons including a lack of data.
In 2012, bold subsidy reforms in Jordan were accompanied by the introduction of a cash transfer of $99 to about 70 per cent of the population as a measure to provide some relief for poor households. From 2012 to 2016, around 11 per cent of spending overall was reprioritized away from subsidies; about 1 percentage point of this was channelled into social assistance and pensions.
In Egypt, only around a fifth of spending deprioritized from subsidies in 2013-2014 has made its way into social benefits by 2015-2016. Some of the decrease in subsidy spending resulted from a declining need due to the sharp fall in oil prices in 2014.
Sources: IMF, 2016d; Hegarthy, 2017; El-Katiri and Fattouh, 2017.

45
Rethinking Fiscal Policy for the Arab Region Fiscal Policy Can Advance Inclusive Development
diesel and 40 per cent for kerosene. Electricity subsidies were more evenly distributed. In Mauritania, the richest 40 per cent of the population captured three fourths of subsidies for electricity while about three fourths of the population lacked access to electricity as of 2012. Subsidies that are poorly targeted and costly do not fulfil the purpose of social policy with regard to reaching the poor and vulnerable, and fall short of the 2030 Agenda principle of leaving no one behind.
B. Public social expenditure and inclusive growth1. Association between social expenditure
growth and economic growth
Inclusive growth has been defined in varying ways. The IMF suggests that it generally refers to “broad sharing” of the benefits of and opportunities for economic growth.23 While this definition sounds neutral, it goes
Table 3.1 Direct benefits from energy subsidies accrue more to wealthier groups (Percentage distribution across income quintiles, 2003-2009)
Lowest quintile Second quintile Third quintile Fourth quintile Top quintile
Gasoline
Egypt 1% 2% 4% 7% 86%
Jordan 8% 12% 13% 17% 50%
Lebanon 5% 11% 20% 26% 38%
Diesel
Egypt 1% 9% 5% 14% 71%
Jordan 4% 10% 16% 24% 46%
Mauritania 1% 2% 6% 14% 77%
Morocco 7% 11% 16% 24% 42%
Yemen 2% 8% 9% 25% 56%
Liquefied Petroleum Gas
Egypt 15% 18% 20% 22% 25%
Jordan 18% 19% 20% 20% 23%
Morocco 13% 16% 19% 22% 30%
Yemen 12% 16% 20% 23% 29%
Kerosene
Jordan 19% 21% 22% 23% 15%
Yemen 27% 22% 18% 19% 14%
Electricity
Jordan 17% 18% 19% 20% 26%
Lebanon 10% 15% 19% 23% 33%
Mauritania 2% 8% 12% 25% 53%
Source: Sdralevich and others, 2014.Note: Based on household surveys conducted between 2003 and 2009.

46
against the idea of pro-poor or equitable growth, whereby growth reaches and benefits poor households to a greater extent than non-poor ones.24 From this perspective, social expenditure policy can be inferred as pro-poor when for each 1 per cent of GDP growth, a higher than 1 per cent growth in public social spending occurs.
Correlations between economic growth and public social expenditure growth in the 1990s are shown in figure 3.5A. The early 1990s were marked by liberalization and privatization as many Arab countries focused on improving their macroeconomic balances and growth rates, while trying
to consolidate government expenditure. During this period, high GDP growth was associated with relatively slow growth in public social expenditure. For some countries, total government expenditure decreased towards the end of the 1990s,25 including a negative growth in public social expenditure. On average, a fitted line shows an unconvincing trend between growth in social expenditure and growth in GDP across countries. But for the majority, public social expenditure growth was lower than economic growth. Only in Saudi Arabia was the rate of growth of public social spending significantly higher than that of economic growth.
Figure 3.5 A mixed picture of public social expenditure and GDP growth over time
A. 1990-2000
C. 2008-2015
B. 2000-200845.040.035.030.025.020.015.010.05.00.0
-5.0-10.0-15.0
Socia
l spend
ing gr
owth (
%), av
erage
Bahrain
Jordan
Kuwait
Oman Saudi Arabia
Yemen
R2= 0.230
3.0 3.5 4.0 4.5 5.0 5.5 6.0 6.5 7.0
GDP growth (%), average
25.020.015.010.05.00.0
-5.0-10.0-15.0-20.0
Socia
l spend
ing gr
owth (
%), av
erage
GDP growth (%), average
Lebanon
Saudi Arabia
Yemen
3.0 4.0 5.0 6.0 7.0 8.0 9.0
R2=-0.027
25.020.015.010.05.00.0
-5.0-10.0-15.0-20.0
Socia
l spend
ing gr
owth (
%), av
erage
GDP growth (%), average
Bahrain
Kuwait
Lebanon
Saudi Arabia
Tunisia
Yemen
R2=-0.639
5.00.0
5.0
10.0
15.0
20.0
25.0
30.035.0
3.0 -2.0 -1.0 0.0 1.0 2.0 3.0 4.0 5.0 6.0
Source: Authors’ calculation based on data from reports of ministries of finance for Morocco and Saudi Arabia, government finance statistics data from the IMF on social spending, and World Bank, 2017b.

47
Rethinking Fiscal Policy for the Arab Region Fiscal Policy Can Advance Inclusive Development
From 2000 to 2008, public social expenditure growth showed a strong correlation with GDP growth for most countries (figure 3.5B). During this period, GDP growth increased and remained moderate for most countries, varying between 4 per cent to 7 per cent. Growth of public social expenditure was higher than economic growth, with the exception of Lebanon, Oman and Yemen. While Lebanon and Oman showed positive growth in public social spending, growth was negative for Yemen.
Most recently, from 2008 to 2015, the association between the two growth rates has shown an inconclusive relationship across countries (figure 3.5C). Growth of public expenditure remained higher than economic growth for five countries, while for the remaining five countries, the reverse was the case. In Kuwait, Saudi Arabia and Yemen, the growth rate of social expenditure remained much higher than economic growth rates. Economic growth rates for all
Box 3.2 Public expenditure tends to follow economic cycles
An analysis of real output and real expenditure in Arab countries demonstrates procyclical expenditure and the lack of adherence to fiscal rules. There is a significant correlation between cyclical components of real output and real expenditure in 7 out of 10 countries, implying that public expenditure tends to associate with the cyclical trends of output.a The lack of countercyclical fiscal policy is mainly attributed to the rentier nature of Arab economies.b
The association between real output and real social expenditure is also positive for most of the countries in the study, yet the correlation is not as strong as between real output and real total expenditure. This finding reflects changing patterns between public social spending and economic growth in the last 25 years. In the 1990s and 2000s, public expenditure and economic growth tended to associate with a procyclical pattern, but following 2008, the pattern of expenditure became less procyclical. Yet increased social spending has contributed little to growth and human development, because the increase in spending was directed more towards salaries and subsidies, while health care, education and infrastructure remained neglected.
Figure 3.6 Correlations between cyclical components of real GDP, real expenditure and real social expenditure, 1990-2014
1.0
0.8
0.6
0.4
0.2
0.0
-0.2
-0.4
Real social expenditure Real total expenditure
Bahrain Kuwait Oman Saudi Arabia Egypt Jordan Lebanon Morocco Tunisia Yemen
Source: Sarangi and Bonin, 2017.Note: The cyclical component of each data series is arrived at using the HP-filter on annual data. a Abdih and others, 2010.b Elbadewi and Soto, 2011; Alesina, Tabellini and Campante, 2008.
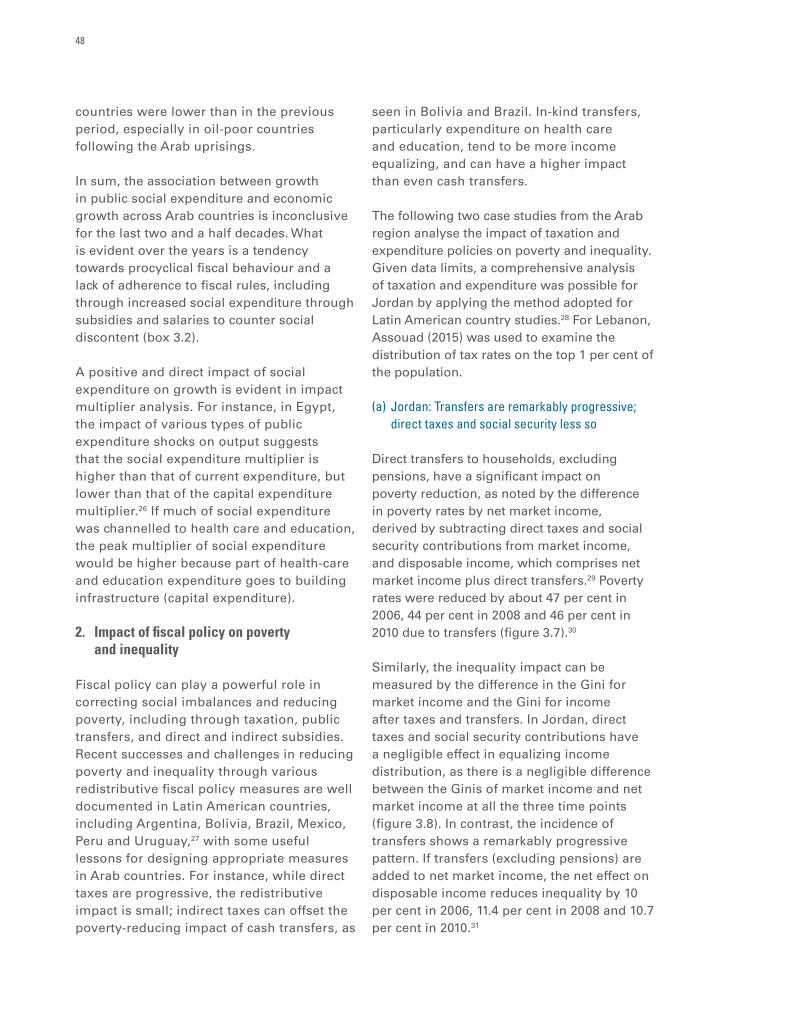
48
countries were lower than in the previous period, especially in oil-poor countries following the Arab uprisings.
In sum, the association between growth in public social expenditure and economic growth across Arab countries is inconclusive for the last two and a half decades. What is evident over the years is a tendency towards procyclical fiscal behaviour and a lack of adherence to fiscal rules, including through increased social expenditure through subsidies and salaries to counter social discontent (box 3.2).
A positive and direct impact of social expenditure on growth is evident in impact multiplier analysis. For instance, in Egypt, the impact of various types of public expenditure shocks on output suggests that the social expenditure multiplier is higher than that of current expenditure, but lower than that of the capital expenditure multiplier.26 If much of social expenditure was channelled to health care and education, the peak multiplier of social expenditure would be higher because part of health-care and education expenditure goes to building infrastructure (capital expenditure).
2. Impact of fiscal policy on poverty and inequality
Fiscal policy can play a powerful role in correcting social imbalances and reducing poverty, including through taxation, public transfers, and direct and indirect subsidies. Recent successes and challenges in reducing poverty and inequality through various redistributive fiscal policy measures are well documented in Latin American countries, including Argentina, Bolivia, Brazil, Mexico, Peru and Uruguay,27 with some useful lessons for designing appropriate measures in Arab countries. For instance, while direct taxes are progressive, the redistributive impact is small; indirect taxes can offset the poverty-reducing impact of cash transfers, as
seen in Bolivia and Brazil. In-kind transfers, particularly expenditure on health care and education, tend to be more income equalizing, and can have a higher impact than even cash transfers.
The following two case studies from the Arab region analyse the impact of taxation and expenditure policies on poverty and inequality. Given data limits, a comprehensive analysis of taxation and expenditure was possible for Jordan by applying the method adopted for Latin American country studies.28 For Lebanon, Assouad (2015) was used to examine the distribution of tax rates on the top 1 per cent of the population.
(a) Jordan: Transfers are remarkably progressive; direct taxes and social security less so
Direct transfers to households, excluding pensions, have a significant impact on poverty reduction, as noted by the difference in poverty rates by net market income, derived by subtracting direct taxes and social security contributions from market income, and disposable income, which comprises net market income plus direct transfers.29 Poverty rates were reduced by about 47 per cent in 2006, 44 per cent in 2008 and 46 per cent in 2010 due to transfers (figure 3.7).30
Similarly, the inequality impact can be measured by the difference in the Gini for market income and the Gini for income after taxes and transfers. In Jordan, direct taxes and social security contributions have a negligible effect in equalizing income distribution, as there is a negligible difference between the Ginis of market income and net market income at all the three time points (figure 3.8). In contrast, the incidence of transfers shows a remarkably progressive pattern. If transfers (excluding pensions) are added to net market income, the net effect on disposable income reduces inequality by 10 per cent in 2006, 11.4 per cent in 2008 and 10.7 per cent in 2010.31

49
Rethinking Fiscal Policy for the Arab Region Fiscal Policy Can Advance Inclusive Development
Transfers have proved important to reducing poverty and inequality in Jordan, even more
so when pensions are considered. Evidence suggests that social assistance programmes
Figure 3.7 The redistributive impact of fiscal policy on poverty in Jordan
30.00
25.00
20.00
15.00
10.00
5.00
0.00
-47.50-47.00-46.50-46.00-45.50-45.00-44.50-44.00-43.50-43.00
2006
-46.86
-44.43
-46.24
2008 2010
Change in poverty rate(market to disposable income)
Poverty by market income Poverty by net market income Poverty by disposable income
Povert
y rate (
%) by
incom
e cate
gory
Change
in pov
erty ra
te (ma
rket to
dispos
able in
come)
Source: Sarangi, Bhanumurthy and Abu-Ismail, 2015.Note: Income categories are computed using the methodology of Lustig and Higgins (2013) applied to harmonized household income and expenditure survey (HHIES) data from the Open Access Micro Data Initiative (2014). Market income refers to all income before taxes and social security contributions and direct transfers. Net market income is equal to market income minus direct taxes and social security contributions. Disposable income is equal to net market income plus direct transfers.
Figure 3.8 The redistributive impact of fiscal policy on inequality in Jordan
0.48
0.46
0.44
0.42
0.40
0.38
0.36
-12.00
-11.50
-11.00
-10.50
-10.00
-9.50
-9.002006
-11.42
-10.78
2008 2010
-10.02
Change in Gini (marketto disposable income)
Gini by market income Gini by net market incomeGini by disposable income
Gini by
incom
e cate
gory
Change
in Gin
i (mark
et to d
isposa
ble inc
ome)
Source: Sarangi, Bhanumurthy and Abu-Ismail, 2015. Note: Based on the methodology of Lustig and Higgins (2013) applied to harmonized household income and expenditure survey (HHIES) data from the Open Access Micro Data Initiative (2014).
Figure 3.9 Incidence of direct and indirect taxes across market income deciles in Jordan
A. Incidence of direct tax across deciles
6
4
2
0
-2
-4
-6
B. Incidence of indirect tax across deciles
35
30
25
20
15
10
5
0
1 2 3 4 5 6 7 8 9 10
1 2 3 4 5 6 7 8 9 10
Direct taxes and contributions 2010 Direct taxes and contributions 2008Direct taxes and contributions 2006
Indirect taxes 2010 Indirect taxes 2008Indirect taxes 2006
Source: Sarangi, Bhanumurthy and Abu-Ismail, 2015.Note: Based on the methodology of Lustig and Higgins (2013) applied to harmonized household income and expenditure survey (HHIES) data from the Open Access Micro Data Initiative (2014).

50
are relatively better targeted there; 43 per cent of people in the poorest quintile benefit against 6 per cent of people in the richest quintile. The benefit incidence among the poorest quintile is in fact larger than for any other Arab country and even the world average of 33 per cent.32 In contrast, indirect transfers such as subsidies on fuel and food are not so well targeted to the poor.
Figure 3.9 shows the incidence of direct and indirect taxes across deciles with respect to market income in Jordan. Direct taxes show mild progressivity in all years, especially in 2006, reflecting the exemption of low-income workers and the negative income tax.33 In effect, the higher deciles contribute more to taxes. In the highest decile, however, there is a reverse trend showing that the richest tend to pay less tax than those within the middle-income deciles. Indirect taxes are more regressive. The lower 40 per cent of the population contributes to a larger share of indirect taxes compared with higher decile groups. There has been little improvement in direct tax contributions since the 1990s; by contrast, major increases in tax revenue have come from indirect taxes on goods and services.
(b) Lebanon: A regressive tax system rewards the wealthiest
Income inequality in Lebanon is very high. From 2005 to 2012, the richest 1 per cent of individuals owned at least 12 per cent to 20 per cent of total personal income. An average of 3 per cent of total personal income accrued to the top 0.01 per cent alone. Between 45 to 70 per cent of total personal wealth is concentrated between the top 10 per cent and 1 per cent of the Lebanese adult population.34 Not surprisingly, wealth inequality in Lebanon is considerably higher than in China and France, and slightly higher than in Russia and the United States.
Income inequality after taxation is almost as high as before taxation, raising questions about the effectiveness of the tax system in terms of redistribution.35 This situation can be attributed to the design of income tax, significant amounts of deductions and exonerations, and regressive average effective tax rates. The share of income considered non-taxable increases with income. That is, within the top 1 per cent to 0.5 per cent income group, less than 20 per cent of income is treated as taxable, and within the 0.01
Figure 3.10 Effective average income tax rates in Lebanon
A. 2005 B. 2012Average tax rate on labour Average tax rate on profits Average effective tax rate
Average tax rate on labour Average tax rate on profits Average effective tax rate
20
15
10
5
0P95-99 P99-99.5 P99.5-99.9 P99.9-99.95 P99.95-99.99 P99.99
20
15
10
5
0P95-99 P99-99.5 P99.5-99.9 P99.9-99.95 P99.95-99.99 P99.99
(%)
(%)
Source: Adapted from Assouad, 2015.
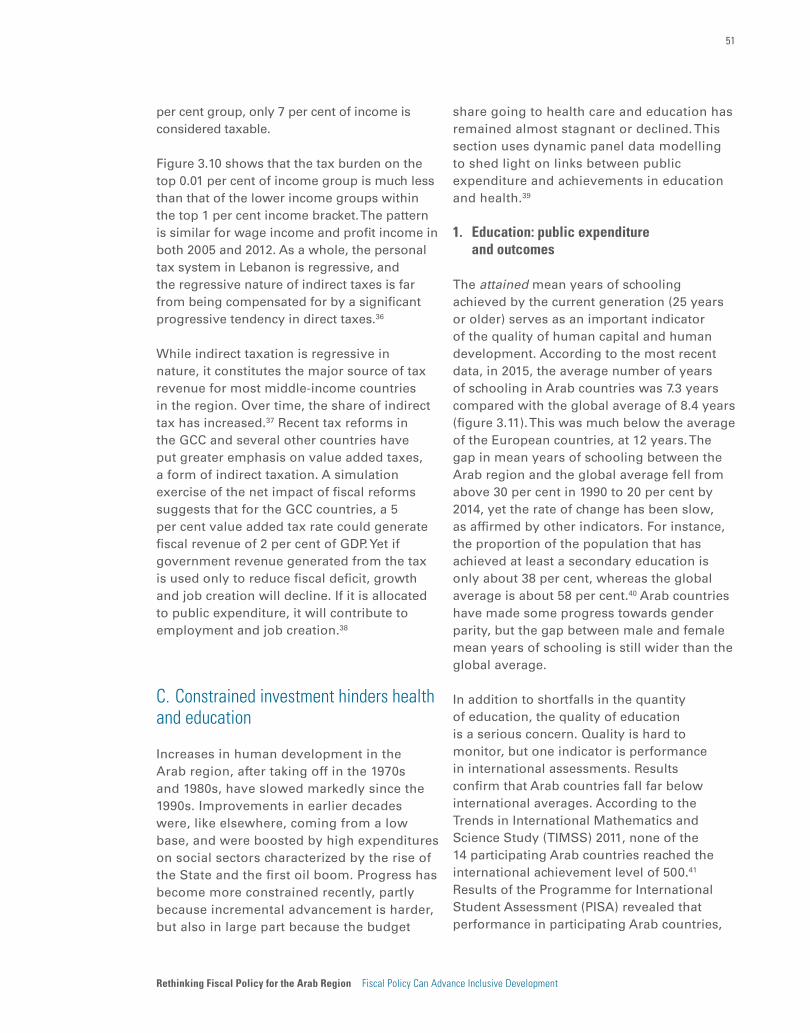
51
Rethinking Fiscal Policy for the Arab Region Fiscal Policy Can Advance Inclusive Development
per cent group, only 7 per cent of income is considered taxable.
Figure 3.10 shows that the tax burden on the top 0.01 per cent of income group is much less than that of the lower income groups within the top 1 per cent income bracket. The pattern is similar for wage income and profit income in both 2005 and 2012. As a whole, the personal tax system in Lebanon is regressive, and the regressive nature of indirect taxes is far from being compensated for by a significant progressive tendency in direct taxes.36
While indirect taxation is regressive in nature, it constitutes the major source of tax revenue for most middle-income countries in the region. Over time, the share of indirect tax has increased.37 Recent tax reforms in the GCC and several other countries have put greater emphasis on value added taxes, a form of indirect taxation. A simulation exercise of the net impact of fiscal reforms suggests that for the GCC countries, a 5 per cent value added tax rate could generate fiscal revenue of 2 per cent of GDP. Yet if government revenue generated from the tax is used only to reduce fiscal deficit, growth and job creation will decline. If it is allocated to public expenditure, it will contribute to employment and job creation.38
C. Constrained investment hinders health and education
Increases in human development in the Arab region, after taking off in the 1970s and 1980s, have slowed markedly since the 1990s. Improvements in earlier decades were, like elsewhere, coming from a low base, and were boosted by high expenditures on social sectors characterized by the rise of the State and the first oil boom. Progress has become more constrained recently, partly because incremental advancement is harder, but also in large part because the budget
share going to health care and education has remained almost stagnant or declined. This section uses dynamic panel data modelling to shed light on links between public expenditure and achievements in education and health.39
1. Education: public expenditure and outcomes
The attained mean years of schooling achieved by the current generation (25 years or older) serves as an important indicator of the quality of human capital and human development. According to the most recent data, in 2015, the average number of years of schooling in Arab countries was 7.3 years compared with the global average of 8.4 years (figure 3.11). This was much below the average of the European countries, at 12 years. The gap in mean years of schooling between the Arab region and the global average fell from above 30 per cent in 1990 to 20 per cent by 2014, yet the rate of change has been slow, as affirmed by other indicators. For instance, the proportion of the population that has achieved at least a secondary education is only about 38 per cent, whereas the global average is about 58 per cent.40 Arab countries have made some progress towards gender parity, but the gap between male and female mean years of schooling is still wider than the global average.
In addition to shortfalls in the quantity of education, the quality of education is a serious concern. Quality is hard to monitor, but one indicator is performance in international assessments. Results confirm that Arab countries fall far below international averages. According to the Trends in International Mathematics and Science Study (TIMSS) 2011, none of the 14 participating Arab countries reached the international achievement level of 500.41 Results of the Programme for International Student Assessment (PISA) revealed that performance in participating Arab countries,

52
namely Jordan, Qatar and Tunisia, was generally poor. These indicators are not available continuously over time, however, meaning they cannot be included in the estimated model for linking fiscal expenditure with education achievements. The estimation is based on mean years of schooling, with a higher mean partly explaining the quality of education as more years of schooling indicates the higher retention of students.
The results of applying the dynamic panel model to assess links between education expenditure and education outcomes indicate several important findings.42 First, the lagged mean years of schooling shows a positive and significant impact on current mean years of schooling, thus confirming the link between education achievements in societies in the report’s sample of Arab countries. Second, the pattern of association between public expenditure and increased mean years of schooling suggests that the positive influence of public expenditure is not direct and instead develops over time. The impact of public education spending is found to be greater in resource-poor countries than in resource-rich countries. This underlines the critical role of the State in extending education facilities in resource-poor countries where people
may not be able to afford the rising costs of education. This might be less of a challenge in resource-rich countries, given their high per capita income.
Third, there is a strong positive association between mean years of schooling and level of per capita income. Education in the region has been largely privatized, leading to high inequalities in education opportunities for rich and poor students across a number of countries.43 From a human development perspective, public expenditure on education thus has the biggest need and potential for improvement.
Fourth, government effectiveness, a proxy measure to capture the efficiency of public expenditure,44 shows a positive and significant impact on mean years of schooling. This highlights the crucial role of an effective and appropriate allocation of resources to the proposed targets. Finally, total public social spending does not show any significant impact on improving mean years of schooling in any of the models. As noted before, much of the increase in public social spending since 2010 has been discretionary, and mainly directed into subsidies and public sector salaries. Instead, public expenditure on education alone
Figure 3.11 Education achievements have lagged behind
10.09.08.07.06.05.04.03.02.0
1990 1995 2000 2005 2010 2011 2012 2013 2014 2015
World, total Arab region, total World, male World, femaleArab region, male Arab region, female
Mean
years o
f schoo
ling
Source: UNDP, 2016.

53
Rethinking Fiscal Policy for the Arab Region Fiscal Policy Can Advance Inclusive Development
is important for improving mean years of schooling, and is more important in countries with a larger share of poor people than in richer countries.
A simulation of increased public expenditure on education by 0.5 per cent and 1 per cent of GDP provides significant results (figure 3.12). An increase of 0.5 per cent could raise the mean years of schooling of the Arab region to the world’s average by 2026. A 1 per cent increase could achieve the same result in six years, by 2020, considering that it starts from 2015; by 2030, the mean would nearly converge with the OECD average.
2. Health: public expenditure and outcomes
The Arab region does not appear to have below-average achievements on the health indicator of life expectancy. Average life expectancy is 70.6 years, while the global average stands at 71.5 years (figure 3.13). The gender gap in life expectancy has increased since the 1960s, with corresponding averages for males and females at 68.7 and 72.5 years, respectively. It would be difficult to improve life expectancy as a general register of progress on health, however. There are diminishing marginal returns inherent in a life
expectancy indicator since there will be slower overall progress in the increase in the number of years at the upper end of the age scale.45
Other indicators of health show less progress. Child mortality and infant mortality rates improved significantly between 1990 and 2013. By 2011, five Arab countries joined the group of “low-mortality countries” after having achieved an under-five mortality rate ranging between 10 and 20 deaths per 1,000 live births. Nevertheless, achievements in child and infant mortality still fall short of the Millennium Development Goal targets. Progress across the subregions has been slow and uneven, particularly in the least developed countries.46 Persistent health inequities are prevalent, with adverse health outcomes higher among the poorest income quintiles. Several countries are facing increasing infant, child and overall mortality rates due to armed conflict.
Stunting, another measure of health, results from long-term nutritional deprivation, and may lead to delayed mental development and reduced intellectual capacity, with implications for well-being and productivity across the life span. In the region, Yemen has the highest rates of stunting, followed by Djibouti, Somalia, Mauritania and the Comoros (figure
Figure 3.12 Increasing education expenditure could close the gap in schooling
13.0
12.0
11.0
10.0
9.0
8.0
7.0
6.02015 2016 2017 2018 2019 2020 2021 2022 2023 2024 2025 2026
OECD average1% increase 0.5% increase World average
Mean
years o
f schoo
ling
Source: Sarangi and Bonin, 2017.

54
3.14). Unlike in the other countries, stunting in Egypt is more common among girls than boys.
Dynamic panel model results for links between health expenditure and health outcomes show important findings.47 First, lagged life expectancy and mortality rates, which imply accumulated human capital, show a positive
and highly significant impact on achievements in health outcomes in all models. Second, public spending on health, as a share of GDP, does not seem to be a significant factor in increasing life expectancy. Instead, private health expenditure, which is significantly high in the Arab region, has a positive and significant impact on life expectancy.
Figure 3.13 Life expectancy is close to the global average
75
70
65
60
55
50
451960 1965 1970 1975 1980 1985 1990 1995 2000 2005 2010 2015
Life ex
pectan
cy (ye
ars)
World, totalArab countries, male Arab countries, totalArab countries, female
Source: World Bank, 2017b.
Figure 3.14 Stunting remains high in some countries, and is slightly more common among boys (Percentage of children under five)
MaleFemale
60
50
40
30
20
10
0
Algeri
a
Como
ros
Djibou
ti
Egypt Iraq
Jordan
Kuwa
it
Libya
Mauri
tania
Moroc
co
Oman
State
of Pale
stine
Soma
lia
Syrian
Arab
Repub
lic
Tunisia
Yemen
World
Source: World Bank, 2017b.Note: Data for Algeria, the Comoros, Djibouti, Jordan, Mauritania and Tunisia are from 2012; for Iraq and Morocco, from 2011; for Kuwait, from 2014; for Libya, from 2007; for Oman, Somalia and the Syrian Arab Republic, from 2009; for the State of Palestine, from 2010; for Yemen, from 2013; and for Egypt, from 2008 for females and 2014 for males.

55
Rethinking Fiscal Policy for the Arab Region Fiscal Policy Can Advance Inclusive Development
Third, government effectiveness has a stronger impact on life expectancy than private health expenditure. Governments can be more efficient and productive when it comes to the implementation of universal health programmes. Fourth, per capita income positively correlates with health outcomes in the sample of resource-poor countries. Nevertheless, increasing per capita income has diminishing returns to achievements in health, which is expected.
The findings reinforce the need for public policy action to increase health expenditure in order to provide quality public health services. This is especially important for poor and middle-income households, given the high reliance on out-of-pocket expenditure for health services, at a time of rising poverty, high stunting among children and slowing human development.
D. Main findings
This chapter suggests several key findings. First, there has been a trend of downsizing of government, measured by public expenditure as a share of GDP, since liberalization and privatization policies were adopted in the 1990s. Since 2008, multiple events have increased uncertainties in public expenditure as well as the amount of social expenditure, leading to major swings in social expenditure trends. Uncertainties are likely to persist given crises in several parts of the region, low oil prices, debt challenges and the slowdown in global growth. Fiscal frameworks need to consider setting medium- and long-term fiscal rules to guide and sustain adequate and appropriate social expenditure, taking into account expected global and regional risks, and the need to accelerate progress on the SDGs.
Second, public expenditure on education and health, as a share of GDP, across the region remains largely neglected. In oil-poor
countries, the share spent on education has declined since 2008. In oil-rich countries, starting in 2005, higher revenues from increasing oil prices influenced a slight increase in average social spending, including in education and health. This pattern might have changed after the plunge in oil prices, but supporting data could not be found for the latest years.
Adequate investment in both health and education is essential to achieving higher levels of human development, fostering innovation and building knowledge assets that encourage structural transformation, which in turn supports steady advances in human development. The costs are not impossible to imagine. Arab countries could catch up with the world average of mean years of schooling in six years by increasing public education spending by 1 per cent of GDP. A 1 percentage point increase seems affordable, considering the huge potential savings that can be generated by switching expenditure from fuel subsidies.
Stagnating and declining trends on housing expenditure, as a share of GDP, are a concern given rapid urbanization and its potential consequences for sustainable development, including links to urban poverty and pressure on water, land and other resources. For oil-rich countries, average expenditure on housing, as a share of GDP, has been relatively stagnant at around 2 per cent from 1990 to 2014. During the same period, the share in oil-poor countries declined from 1.3 per cent to 0.6 per cent. Since deprivation in living conditions contributes significantly to poverty, promoting sustainable urban development and poverty reduction requires investments in better housing and quality infrastructure for better public provisioning of services, including access to water and sanitation.
Although average expenditure on social protection, as a share of GDP, has slightly increased from 2 per cent to 3 per cent in

56
oil-rich countries, and from 3 per cent to 5 per cent in oil-poor countries between 2005 and 2014, social protection programmes in the region still suffer from poor targeting, expenditure on fuel subsidies and fragmented social assistance expenditures. Increased spending in the oil-poor countries during the period was due to rising fuel subsidy bills as part of social assistance, although a small share of benefits accrues to the poor. Improving the coverage and targeting of social protection is especially important given the high unemployment rate, expected increase in expenditure through population ageing, and the challenges magnified by crises in many parts of the region.
Third, redistributive fiscal policy can help to reduce inequality and poverty, and increase social welfare, as shown through public transfers in Jordan. Subsidies on fuel, however, do not have similar impacts. The majority of the benefits are accruing to high-income groups while they share a lower tax burden than the middle class. The poor and middle class face additional burdens from the high reliance on out-of-pocket expenditure for health services. Both
findings call for urgent rethinking of fiscal policy. Reforms to smooth discretionary public expenditure patterns and better target social spending are essential to ensuring that people and countries can thrive through a virtuous cycle of inclusive and stable growth and human development.
Finally, the lack of time series data on disaggregated government expenditure in Arab countries is a major challenge, preventing an accurate estimate of social spending in many instances. This limitation restricted the report to examining only expenditure on health, education, housing and social protection, for selected countries. Consideration of fuel subsidies in social expenditure, particularly in the social protection component in certain countries, distorts data on actual social spending, given that not all fuel subsidies are targeted to households. Data on pensions, social security measures and other forms of assistance driven by social policies are absent in this estimation. A crucial step would be for governments to take account of social expenditure more systematically, including in monitoring how effectively it reaches the poorest and most vulnerable population groups.

Fiscal Policy Can Shape the Right Spending and Revenue Choices
4.

Arab countries are below their potential for raising taxes, while the predominance of indirect over direct taxes points to the regressive nature of taxation in the region.
Arab countries are below their potential for raising taxes, while the predominance of indirect over direct taxes points to the regressive nature of taxation in the region.

59
Rethinking Fiscal Policy for the Arab Region Fiscal Policy Can Shape the Right Spending and Revenue Choices
Fiscal Policy Can Shape the Right Spending and Revenue Choices
An increasingly urgent need to invest in structural transformation and human development in Arab countries, including in line with the 2030 Agenda and the SDGs, coincides with growing pressure from fiscal space and sustainability challenges.1 Public debt has risen sharply in countries around the world since the 2008 economic recession,2 but the impact varies depending on fiscal space and degree of development. In some Arab countries, oil-poor nations in particular, the build-up is alarming, propelled by multiple socioeconomic and political shocks since 2011, including the Syrian crisis. Oil-rich countries used to generate surpluses in their current accounts due to oil export revenues, but have suffered big declines since the drop in oil prices in 2014. Room to finance planned expenditures that were already high in the oil-boom period is now shrinking.
Beyond the total volume of debt, its composition is becoming a major concern for some countries. A high share of external debt, particularly dollar-denominated debt, makes debt servicing more expensive. A relatively strong dollar puts pressure on borrowers to service foreign currency obligations, including at the expense of essential development priorities.3
One response to pressure on fiscal space has been to cut expenditures. But this poses risks in terms of development objectives, such as the generation of adequate employment, the provision of essential services and the expansion of human capital. It may amplify development deficits4 and impose new obstacles to structural transformation and reaching the SDGs. Another response could be to bolster revenues through fair and progressive taxation across a broader tax base.
This chapter considers these issues, urging a comprehensive vantage point that aims at balancing macroeconomic stability and debt repayment priorities with imperative investments in inclusive human development. Section A looks at gross public debt and external debt, and section B at fiscal balance ratios. Section C considers the fiscal policy response to public debt through fiscal reaction function analysis and debt-stabilizing primary balance analysis. Section D presents IMF projections on the fiscal response to public debt. Section E discusses harnessing new revenues through fair taxation, underscoring the importance of going beyond expenditure cuts alone. Section F provides summary findings.
A. Rising public debt poses concerns
There are sharp contrasts across Arab countries in terms of revenue mobilization. For oil-rich countries, the major source is oil and gas. They have larger fiscal buffers for meeting development needs, but their revenues are susceptible to oil-price fluctuations. The oil-poor middle-income countries rely on a mixture of sources of revenue, but mainly taxation. For a variety of reasons, the ratio of taxes to GDP is low in most of these countries, however, even as they confront severe constraints in financing essential development needs. Low-income countries have high levels of poverty and significant development challenges as well as severely constrained fiscal space due to low and volatile revenues bases.
1. Gross public debt
Since the global economic downturn in 2008, public debt has risen in major economies
4.

60
around the world.5 The high-income group of countries had the highest debt-to-GDP ratio at 60 per cent in 2016 (figure 4.1), but this may not necessarily be a concern given their high level of per capita income and the composition of the debt, which is mainly raised from domestic markets. This level of comfort doesn’t exist for middle-income and low-income countries, however, where the average debt-to-GDP ratio reached 50 per cent in 2016 and is expected to continue rising. In the Arab region, the average ratio increased from nearly 33 per cent in 2008 to 46 per cent in 2016. The high GDP of oil-rich countries and their corresponding low debt ratio pulls the regional average down, however. In reality, oil-poor countries have much higher debt burdens than the average for middle-income countries globally.
The debt-to-GDP ratio is rising sharply for oil-poor middle-income countries in particular, climbing to 93 per cent in 2016 from an average of about 66 per cent in 2008. This marks a sharp reversal from downward trends in the decade and a half prior to 2008, and the ratio is noticeably high compared
with the level of development (figure 4.2). As a comparison, debt to GDP for the United Kingdom in 2016 was around 90 per cent, with a per capita income of above $40,000. In Egypt, it was 97 per cent, with a per capita income of less than one tenth of that of the United Kingdom. Lebanon stands out for having the highest debt-to-GDP ratio in the region, at 143 per cent, not far from debt-strapped Greece at 181 per cent. Net interest payments doubled from about 3 per cent of GDP in 2008 to 6 per cent in 2016 for the oil-poor middle-income countries (figure 4.3).
The low-income countries reported significantly high government gross debt to GDP in 2016, at 70 per cent on average, as against the global average of 50 per cent for all low-income countries (figure 4.1). This average is historically high and rising, with a slight drop after 2012 due to the external debt relief granted to the Comoros under the Heavily Indebted Poor Countries Initiative. Particularly during 2015 to 2016, the ratio surged in most of these countries except the Sudan, where access to external financing was restricted due to unresolved arrears
Figure 4.1 Oil-poor Arab countries have comparatively large debt burdens
100.090.080.070.060.050.040.030.020.010.0
0.0Oil-rich
Arab countriesOil-poor
middle-incomeArab countries
Lower middle-income countries
Upper middle-income countries
Low-incomeArab countries
Arab region Low-incomecountries
High-incomecountries
201620122008
Gener
al gove
rnment
gross
debt (
% GDP
)
Source: Sarangi and El-Ahmadieh, 2017, based on data from IMF, 2017f.Note: The first four sets of bars represent samples of Arab countries only. The last four sets represent global samples. Countries in the middle-income category are classed according to the World Bank classification (see World Bank, 2017b).

61
Rethinking Fiscal Policy for the Arab Region Fiscal Policy Can Shape the Right Spending and Revenue Choices
with creditors and sanctions imposed by the United States since 1997.
The oil-rich countries used to have low debt on average. But they too reported a significant jump recently, from nearly 10 per cent of GDP
in 2014 to 21 per cent in 2016,6 due to lower oil prices. All oil-rich countries have reported increasing debt during 2015 to 2016, and most have started adopting fiscal adjustment measures, mainly by cutting expenditure and introducing value added taxes. Medium-term
Figure 4.2 In 2016, debt was noticeably high given the level of development in many Arab countries
200.0180.0160.0140.0120.0100.0
80.060.040.020.0
0.0
Gener
al gove
rnment
gross
debt (
% GDP
)
70,00060,00050,00040,00030,00020,00010,0000GDP per capita, current US dollars
Mauritania, 99.61
Djibouti, 31.27
Morocco, 64.69Tunisia, 60.64
Algeria, 20.36
Iraq, 63.69
Jordan, 94.99
Lebanon, 143.42
Oman, 34.34
Greece, 181.33
Saudi Arabia, 12.36
Bahrain, 82.12
Kuwait, 18.59
Italy, 132.60
United ArabEmirates, 19.30
Singapore, 112.03
United Statesof America, 107.35
Qatar, 47.60
Egypt, 97.07Yemen, 85.358
Source: Based on data from IMF, 2017f.Note: Countries are ordered in terms of their per capita income in current dollars.
Figure 4.3 As debt has risen, net interest payments have doubled for oil-poor middle-income countries
A. General government gross debt (% GDP)100.0
80.0
60.0
40.0
20.0
-
Oil-rich countriesLow-income countries Oil-poor middle-income countries Oil-poor middle-income and low-income countries
Arab regionB. Net interest payment (% GDP)
8.07.06.05.04.03.02.01.00.0
2005
2006
2007
2008
2009
2010
2011
2012
2013
2014
2015
2016
2005
2006
2007
2008
2009
2010
2011
2012
2013
2014
2015
2016
Source: Sarangi and El-Ahmadieh, 2017, based on data from World Bank, 2017a and IMF, 2017f.
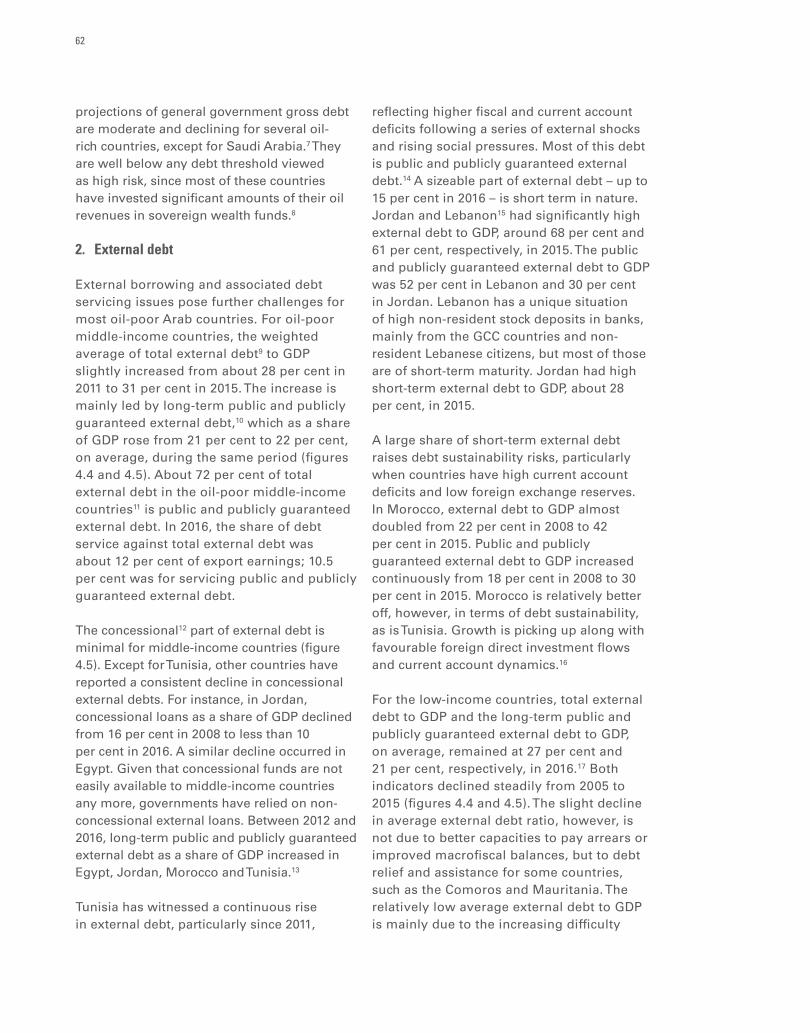
62
projections of general government gross debt are moderate and declining for several oil-rich countries, except for Saudi Arabia.7 They are well below any debt threshold viewed as high risk, since most of these countries have invested significant amounts of their oil revenues in sovereign wealth funds.8
2. External debt
External borrowing and associated debt servicing issues pose further challenges for most oil-poor Arab countries. For oil-poor middle-income countries, the weighted average of total external debt9 to GDP slightly increased from about 28 per cent in 2011 to 31 per cent in 2015. The increase is mainly led by long-term public and publicly guaranteed external debt,10 which as a share of GDP rose from 21 per cent to 22 per cent, on average, during the same period (figures 4.4 and 4.5). About 72 per cent of total external debt in the oil-poor middle-income countries11 is public and publicly guaranteed external debt. In 2016, the share of debt service against total external debt was about 12 per cent of export earnings; 10.5 per cent was for servicing public and publicly guaranteed external debt.
The concessional12 part of external debt is minimal for middle-income countries (figure 4.5). Except for Tunisia, other countries have reported a consistent decline in concessional external debts. For instance, in Jordan, concessional loans as a share of GDP declined from 16 per cent in 2008 to less than 10 per cent in 2016. A similar decline occurred in Egypt. Given that concessional funds are not easily available to middle-income countries any more, governments have relied on non-concessional external loans. Between 2012 and 2016, long-term public and publicly guaranteed external debt as a share of GDP increased in Egypt, Jordan, Morocco and Tunisia.13
Tunisia has witnessed a continuous rise in external debt, particularly since 2011,
reflecting higher fiscal and current account deficits following a series of external shocks and rising social pressures. Most of this debt is public and publicly guaranteed external debt.14 A sizeable part of external debt – up to 15 per cent in 2016 – is short term in nature. Jordan and Lebanon15 had significantly high external debt to GDP, around 68 per cent and 61 per cent, respectively, in 2015. The public and publicly guaranteed external debt to GDP was 52 per cent in Lebanon and 30 per cent in Jordan. Lebanon has a unique situation of high non-resident stock deposits in banks, mainly from the GCC countries and non-resident Lebanese citizens, but most of those are of short-term maturity. Jordan had high short-term external debt to GDP, about 28 per cent, in 2015.
A large share of short-term external debt raises debt sustainability risks, particularly when countries have high current account deficits and low foreign exchange reserves. In Morocco, external debt to GDP almost doubled from 22 per cent in 2008 to 42 per cent in 2015. Public and publicly guaranteed external debt to GDP increased continuously from 18 per cent in 2008 to 30 per cent in 2015. Morocco is relatively better off, however, in terms of debt sustainability, as is Tunisia. Growth is picking up along with favourable foreign direct investment flows and current account dynamics.16
For the low-income countries, total external debt to GDP and the long-term public and publicly guaranteed external debt to GDP, on average, remained at 27 per cent and 21 per cent, respectively, in 2016.17 Both indicators declined steadily from 2005 to 2015 (figures 4.4 and 4.5). The slight decline in average external debt ratio, however, is not due to better capacities to pay arrears or improved macrofiscal balances, but to debt relief and assistance for some countries, such as the Comoros and Mauritania. The relatively low average external debt to GDP is mainly due to the increasing difficulty

63
Rethinking Fiscal Policy for the Arab Region Fiscal Policy Can Shape the Right Spending and Revenue Choices
that low-income countries face in accessing external finance, for reasons including the non-clearance of arrears, as in the Sudan, or reductions in grants and concessional loans linked to poor ratings18 on fiscal and debt policy by the International Development Association (figure 4.6).
Some low-income countries are facing a high risk of external debt distress, such as Djibouti and the Sudan. For Djibouti, the debt risk was particularly aggravated through $860 million in non-concessional loans secured in 2013 to finance its investment programme. While the Sudan
Figure 4.4 Trends in external debt and debt service
A. External debt stock, PPGa (% GDP)45.040.035.030.025.020.015.010.0
5.00.0
Low-income countries Oil-poor middle-income countries Oil-poor middle-income and low-income countries
B. External debt service, PPGa (% exports)14.0
12.0
10.0
8.0
6.0
4.0
2.0
0.0
2005
2006
2007
2008
2009
2010
2011
2012
2013
2014
2015
2005
2006
2007
2008
2009
2010
2011
2012
2013
2014
2015
a PPG, public and publicly guaranteed.
Source: Sarangi and El-Ahmadieh, 2017, based on data from World Bank, 2017a and IMF, 2017f.
Figure 4.5 External debt as a percentage of GDP
100.0090.0080.0070.0060.0050.0040.0030.0020.0010.000.00
2008
2012
2015
2008
2012
2015
2008
2012
2015
2008
2012
2015
2008
2012
2015
2008
2012
2015
2008
2012
2015
2008
2012
2015
2008
2012
2015
2008
2012
2015
External debt stocks, total External debt, short term External debt, PPGa External debt, concessional
Egypt Jordan Lebanon Morocco Tunisia Comoros Djibouti Mauritania Sudan Yemen
Perce
ntage
of GDP
a PPG, public and publicly guaranteed.
Source: World Bank, 2017a.

64
is eligible for debt relief under the Heavily Indebted Poor Countries Initiative, it must come to an amicable understanding with its main creditors in partnership with South Sudan.19
Another issue for low-income countries is that about 80 per cent of total external debt stock was in the form of public and publicly guaranteed debt in 2015. In Mauritania, it was around 90 per cent. As a share of GDP, it was about 70 per cent in Djibouti and 67 per cent in Mauritania (figure 4.5). Such figures are not necessarily a concern if funds are allocated to enhance human development, productive capacity and job creation, among other priorities linked to inclusive development and the SDGs. But instead, public external debt has been closely associated with financing current liabilities and implicit subsidies incurred by a large public sector and State trading enterprises.20 The high share of public and publicly guaranteed debt also indicates that the private sector has limited capacity to leverage external financing.
B. Fiscal management is currently precarious Fiscal management is key to influencing trends in fiscal balances and public debt. Four indicators can shed light on currently precarious fiscal management in the Arab region and the evolution of domestic and external debt: the overall fiscal balance (which shows the overall deficit or surplus in the economy), the primary balance (which provides an assessment of revenue and expenditure management, excluding interest payments from expenditure), the current account deficit (which shows the balance of payment situation), and reserves in months of imports21 for the low and middle-income oil-importing countries (which indicates strength or vulnerability to finance imports). The first three indicators are measured as a percentage of GDP.
Links between fiscal deficits, the current account deficit and public debt are well studied.22 While there are debates about connections between fiscal deficit and
Figure 4.6 Low-income Arab countries score poorly on debt and fiscal policy ratings
4.03.53.02.52.01.51.00.5
0Fiscal policy Debt policy Fiscal policy Debt policy Fiscal policy Debt policy Fiscal policy Debt policy Fiscal policy Debt policy
201620122008
Comoros Djibouti Sudan Yemen Low-income countries (all)
Source: World Bank, 2017b.Note: Debt policy ratings assess whether the debt management strategy is conducive to minimizing budgetary risks and ensuring long-term debt sustainability. Fiscal policy ratings assess the short- and medium-term sustainability of fiscal policy (taking into account monetary and exchange rate policy, and the sustainability of the public debt) and its impact on growth.
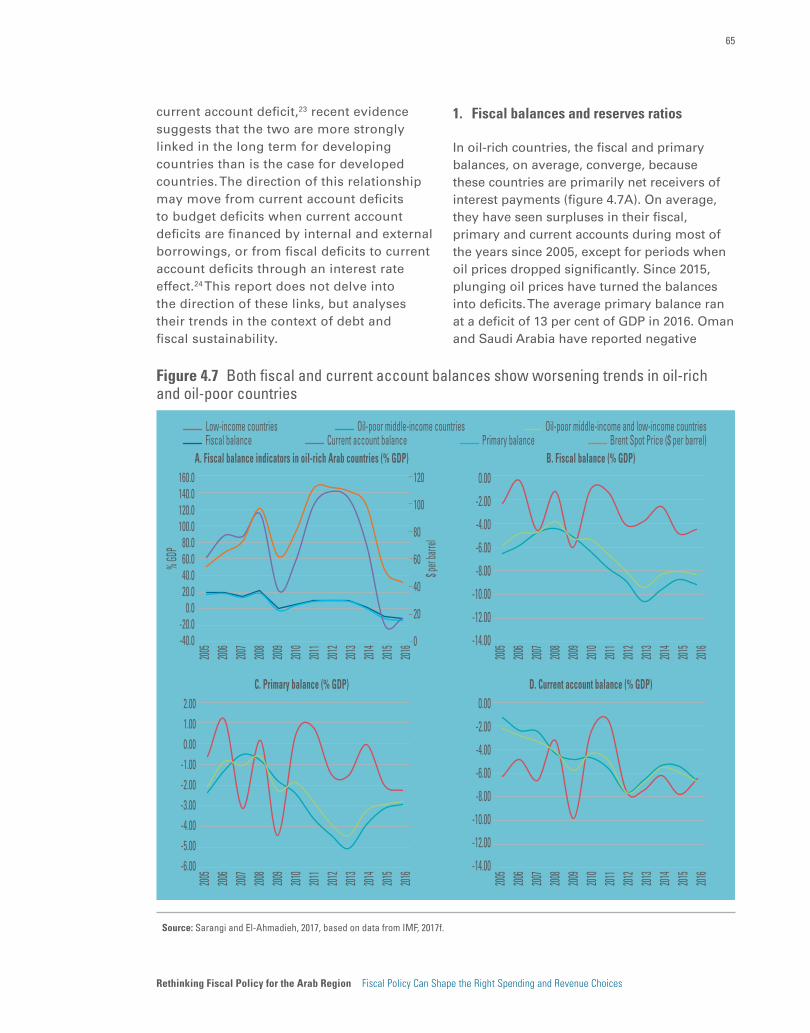
65
Rethinking Fiscal Policy for the Arab Region Fiscal Policy Can Shape the Right Spending and Revenue Choices
current account deficit,23 recent evidence suggests that the two are more strongly linked in the long term for developing countries than is the case for developed countries. The direction of this relationship may move from current account deficits to budget deficits when current account deficits are financed by internal and external borrowings, or from fiscal deficits to current account deficits through an interest rate effect.24 This report does not delve into the direction of these links, but analyses their trends in the context of debt and fiscal sustainability.
1. Fiscal balances and reserves ratios
In oil-rich countries, the fiscal and primary balances, on average, converge, because these countries are primarily net receivers of interest payments (figure 4.7A). On average, they have seen surpluses in their fiscal, primary and current accounts during most of the years since 2005, except for periods when oil prices dropped significantly. Since 2015, plunging oil prices have turned the balances into deficits. The average primary balance ran at a deficit of 13 per cent of GDP in 2016. Oman and Saudi Arabia have reported negative
Figure 4.7 Both fiscal and current account balances show worsening trends in oil-rich and oil-poor countries
A. Fiscal balance indicators in oil-rich Arab countries (% GDP)
Low-income countries Oil-poor middle-income countriesFiscal balance Current account balance Primary balance Brent Spot Price ($ per barrel)
Oil-poor middle-income and low-income countries
C. Primary balance (% GDP) D. Current account balance (% GDP)
B. Fiscal balance (% GDP)0.00
-2.00
-4.00
-6.00
-8.00
-10.00
-12.00
-14.00
2005
2006
2007
2008
2009
2010
2011
2012
2013
2014
2015
2016
160.0140.0120.0100.0
80.060.040.020.0
0.0-20.0-40.0
120
100
80
60
40
20
0
2005
2006
2007
2008
2009
2010
2011
2012
2013
2014
2015
2016
$ per
barrel
% GDP
2.001.000.00
-1.00-2.00-3.00-4.00-5.00-6.00
2005
2006
2007
2008
2009
2010
2011
2012
2013
2014
2015
2016
0.00
-2.00
-4.00
-6.00
-8.00
-10.00
-12.00
-14.00
2005
2006
2007
2008
2009
2010
2011
2012
2013
2014
2015
2016
Source: Sarangi and El-Ahmadieh, 2017, based on data from IMF, 2017f.

66
primary balances since 2014, and Kuwait and the United Arab Emirates since 2015. Qatar is the exception with a primary balance surplus. These countries are increasingly considering issuing sovereign bonds in international capital markets to meet expenditure needs, in addition to new policy measures such as the introduction of value added taxes and reduction of subsidies.
The fiscal balances of oil-poor middle- and low-income countries have mostly been in deficit. Average fiscal and primary balances worsened between 2008 and 2013 (figures 4.7B and 4.7C), a period that affected growth and spending negatively due to the global economic recession and the Arab uprisings. Middle-income countries in particular witnessed a continuous increase in fiscal and primary deficits, which reached around -11 per cent and -5 per cent of GDP, respectively, in 2013. The average fiscal and primary balances in low-income countries remained in deficit but moved up and down from 2008 to 2016.
Fiscal balances in the oil-poor middle-income countries started improving slowly in 2014, partly because low oil prices benefitted oil-importing countries, and some middle-income countries adopted fiscal adjustment policies. In Jordan, for example, subsidies decreased from 11 per cent to 4 per cent of GDP between 2013 and 2015. Morocco and Tunisia also introduced subsidy reforms. Average fiscal balances are still negative, however, with an average primary deficit at -3 per cent of GDP and fiscal deficit at -8 per cent of GDP in 2016.
The average current account deficits for oil-poor middle- and low-income countries worsened from -4 per cent to -8 per cent between 2008 and 2012, during the peak of the Arab uprisings. The deficit was slightly reduced during 2013 to 2014, but then dropped again to -7 per cent in 2016 (figure 4.7D). Even though these countries saved
considerably on oil imports in recent years, the average net interest payment increased continuously, from 3 per cent of GDP in 2008 to 5.5 per cent in 2016. The high current account deficit is a major constraint for oil-poor countries. They are heavily reliant on imports for local consumption while their exports are limited largely to primary, low value added products due to a lack of structural transformation. For instance, between 2010 and 2016, imports in Jordan and Lebanon peaked at 74 per cent and 75 per cent of GDP, respectively, compared with their peak exports of 48 per cent and 55 per cent of GDP, respectively, in the same period. Morocco and Tunisia too have huge gaps. The persistence of the current account gap is closely linked to recurrent budget deficits and debt surge.
Average reserves in months of imports is another indicator to assess the fiscal strength or vulnerability of oil-poor countries (figure 4.8). Between 2008 and 2012, reserves declined in most middle-income countries, except Lebanon, which received significant remittances from Lebanese working abroad (averaging about $6 billion per year between 2005 and 2015). Its banking system attracted significant deposits from the GCC countries and Arab capital seeking investment in Lebanon’s Treasury Bills.25 In Egypt, reserves to finance imports were reduced to only about two months, while in Jordan and Tunisia, they were nearly four months. The situation in Jordan and Morocco has slowly improved particularly after the fall of oil prices. Tunisia’s reserves are low but it has maintained almost the same level from 2008 to 2015. Egypt, Jordan, Morocco and Tunisia have resorted to IMF borrowing to finance rising primary deficits as well as rising debt servicing needs, in addition to adopting significant reforms, including exchange rate and expenditure reforms (box 4.1).
Egypt is in a situation of distress. Its devaluation of its exchange rate in November 2016

67
Rethinking Fiscal Policy for the Arab Region Fiscal Policy Can Shape the Right Spending and Revenue Choices
significantly increased the cost of borrowing and debt servicing. If this is not followed by a positive flow of capital into the country, it may face a situation of fiscal unsustainability. Egypt has prepared a vision plan on economic reforms and fiscal adjustment policies to improve the balances and access IMF funds, implemented a value added tax in late 2017 and reduced energy subsidies.26
Foreign reserves in the low-income countries are also limited; several countries face fiscal instability due to their narrow production base and structural weaknesses (figure 4.8). Low iron ore prices have reduced economic growth, export receipts and net international reserves for Mauritania, for example, which consequently widened the fiscal deficit and increased risks to financial stability.
Figure 4.8 Total reserves in months of imports are low in most countries
20.0018.0016.0014.0012.0010.00
8.006.004.000.002.00
2008
2012
2015
2008
2012
2015
2008
2012
2015
2008
2012
2015
2008
2012
2015
2008
2012
2015
2008
2012
2015
2008
2012
2015
2008
2012
2015
2008
2012
2015
Egypt Jordan Lebanon Morocco Tunisia Comoros Djibouti Mauritania Sudan Yemen
Month
s of im
ports
Source: IMF, 2017f.
Box 4.1 The recent extension of IMF financial support to oil-poor countries
Jordan: On 24 August 2016, the Executive Board of the IMF approved a three-year extended arrangement under the Extended Fund Facility for Jordan for an amount equivalent to special drawing rights (SDR) 514.65 million (about $723 million, or 150 per cent of Jordan’s quota) to support the country’s economic and financial reform programme. It was approved after the expiry of the three-year Stand-by Arrangement in the amount of about $2 billion in August 2015. The objective is to put public debt on a downward path through gradual fiscal consolidation over the medium term while preserving essential social spending. To this end, it is critical to reduce the general sales tax and customs duty exemptions and to amend the income tax law. The electricity company NEPCO needs to reach operational cost recovery and the Water Authority of Jordan’s finances should be consolidated. Public financial management should be strengthened to enhance fiscal transparency and reduce fiscal risks.
Egypt: On 11 November 2016, the Executive Board of the IMF approved a three-year extended arrangement under the Extended Fund Facility for Egypt for an amount equivalent to SDR 8.597 billion (about $12 billion, or 422 per cent of Egypt’s quota) to support the authorities’ economic reform programme. Reducing fiscal deficits considerably and thereby placing public debt on a clearly declining path is an important objective. To this end, the key policy measures are the introduction of a value added tax, a reduction of energy subsidies and the

68
2. Fiscal balances and public debt ratios
Another perspective on the fiscal positions of Arab countries involves examining
the relationship between fiscal policy and public debt ratios provided by fiscal balances, particularly the behaviour of primary balances. The relationship between
optimization of the public sector wage bill. To mitigate the impact of the reforms on the poor, the authorities intend to use part of the fiscal savings to strengthen social safety nets. The planned fiscal consolidation is projected to reduce public debt by almost 10 percentage points of GDP by the end of the programme.
Morocco: In August 2016, the IMF approved a two-year, $3.47 billion liquidity line for Morocco to support the country to continue its economic reforms and further strengthen its growth prospects. The arrangement is under the IMF Precautionary and Liquidity Line, which provides insurance against external shocks in the light of heightened uncertainty worldwide. Under the two previous precautionary and liquidity arrangements – approved in 2012 and 2014 – Morocco has implemented challenging reforms such as modernizing the budget framework, enacting energy subsidy reforms, strengthening the domestic financial sector and most recently reforming the civil service pension system. These efforts, as well as a more favourable external environment in recent years, have contributed to the substantial decline in domestic and external imbalances. The fiscal deficit declined from about 7 per cent of GDP in 2012 to about 3.5 per cent in 2016. The current account deficit dropped from 9 per cent of GDP in 2012 to 1 per cent in 2016.
Tunisia: In May 2016, the IMF approved a four-year, $2.9 billion loan to support an economic agenda aimed at promoting more inclusive growth and job creation, while protecting the most vulnerable households. Tunisia’s reform programme is supported by the Extended Fund Facility and is geared towards reducing the fiscal deficit to stabilize public debt below 70 per cent of GDP by 2020 while raising investment and social spending. The first programme, the Stand-By Arrangement, helped Tunisia in preserving macroeconomic stability during a very difficult time.
Source: IMF press releases and IMF, 2017e for Tunisia.
Figure 4.9 Gross public debt and fiscal balances in Arab countries
A. 2008-2010 (average) B. 2014-2016 (average)10.0
5.0
0.0
-5.0
-10.0
-15.0
-20.0
Fiscal
balan
ce (%
GDP)
Gross public debt (% GDP)
30.0
20.0
10.0
0.0
-10.0
-20.0
Fiscal
balan
ce (%
GDP)
Gross public debt (% GDP)
10.00.0 30.0 50.0 70.0 90.0 110.0 130.0 150.0
0.0 20.0 40.0 60.0 80.0 100.0 120.0 140.0 160.0
Source: Sarangi and El-Ahmadieh, 2017, based on data from IMF, 2017f.

69
Rethinking Fiscal Policy for the Arab Region Fiscal Policy Can Shape the Right Spending and Revenue Choices
fiscal balance and public debt ratios can be negative or positive. It would be negative if countries with high gross public debt ratios run low fiscal deficits. Conversely, if countries with high public debt ratios run larger fiscal deficits, the relationship would be positive. From 2008 to 2010, there seemed to be a negative relationship between overall fiscal balance and gross public debt ratios (figure 4.9A). From 2014 to 2016, there was no significant pattern of association between the two indicators (figure 4.9B), indicating lax fiscal policy in addressing potential stresses on fiscal sustainability.
A better way of looking at debt dynamics is to examine the nexus between gross public debt to GDP and the behaviour of the ratio between primary balance and GDP.27 Figure 4.10A shows a slightly negative association between the two variables from 2008 to 2010, but figure 4.10B shows a relatively strong positive association from 2014 to 2016. The latter suggests that countries with higher public debt ratios are generating somewhat larger primary balances or are reducing primary deficits, but most of the oil-poor countries still have a negative primary balance. This is possible since several countries recently adopted some
form of fiscal adjustment policy, mainly geared towards cutting expenditure to reduce primary deficits, in addition to the benefit of lower oil import bills since 2014.
C. Policy responses without clear rules
The fiscal policy response to public debt can be more systematically explored by fiscal reaction function analysis and debt-stabilizing primary balance analysis, which are among several approaches to analysing public debt sustainability. Others include the debt sustainability analysis and fan chart analysis by the IMF, and time series stationarity tests and cointegration tests between revenues and expenditures.28
Debt sustainability analysis provides comprehensive information about the dynamics and sustainability of public sector and external debt in market-access countries, and forecasts future debt under certain assumptions about growth, inflation, and interest and exchange rates, in addition to considering domestic and external debt ratios and primary balances.
Figure 4.10 Gross public debt and primary balances in Arab countries
A. 2008-2010 (average) B. 2014-2016 (average)10.0
5.0
0.0
-5.0
-10.0
-15.0
-20.0
Prima
ry bala
nce (%
GDP)
Gross public debt (% GDP)
20.0
15.0
10.0
5.0
0.0
-5.0
-10.0
Prima
ry bala
nce (%
GDP)
Gross public debt (% GDP)
-10.0 0.0 10.0 30.0 50.0 90.0 110.0 130.0 150.070.0
0.0 20.0 40.0 60.0 80.0 100.0 120.0 140.0 160.0
Source: Sarangi and El-Ahmadieh, 2017, based on data from IMF, 2017f.

70
While the approach is more comprehensive than any other test, the forecasting of debt ratios has often come under criticism due to an exclusive reliance on past data and judgements about future debt sustainability challenges, and has a generally poor track record. Evaluations suggest that debt sustainability analysis findings should be interpreted only “within the bounds of the underlying guesses”.29 Analysis for selected countries in the Arab region is summarized in section D.
Time series tests have limited application in debt sustainability literature, and stationarity and cointegration tests give little guidance about the kind of fiscal reaction needed to assure that debt will be sustainable.30 The fiscal reaction function analysis and the debt-stabilizing primary balance calculations rely on actual data and minimize guess work. They are more useful as budgeting tools for assessing fiscal sustainability in a medium to long-term framework. Unless predicted in the short term, contingent liabilities, emergency expenditure or a shortfall in revenues can severely affect short-term debt sustainability, which may not
be factored into the analysis in an ex ante exercise. The vulnerabilities in the short term, however, can be avoided if fiscal rules are set and implemented within a medium- to long-term outlook. Applying a medium- to long-term perspective, the report examined fiscal reaction functions and estimated debt-stabilizing primary balances on an average for the latest three years.
1. Fiscal reaction functions
Following Bohn (1998), several studies have estimated fiscal reaction functions31 to identify the behavioural patterns underlying the decision-making process for primary fiscal expenditure and revenue in the context of debt sustainability, along with cyclical developments and institutions affecting a government’s incentives.32 The report undertook a similar exercise for the oil-poor countries in the Arab region.
An important aspect of fiscal policy for debt sustainability is that the primary balance ratio should respond positively to an increasing lagged debt ratio (0<ρ<1),
Figure 4.11 The fiscal response to gross public debt in middle-income countries
4
2
0
-2
-4
-650 100 150 200
Fitted line: mean Fitted line: median
Lagged debt to GDP
Median primary balanceMean primary balance
Prima
ry bala
nce to
GDP
Source: Sarangi and El-Ahmadieh, 2017, based on data from IMF, 2017f.Note: The fitted line is derived from the cubic function of the middle-income countries sample, which includes Egypt, Jordan, Lebanon, Morocco and Tunisia. A detailed methodology and estimation coefficients are in Sarangi and El-Ahmadieh, 2017.

71
Rethinking Fiscal Policy for the Arab Region Fiscal Policy Can Shape the Right Spending and Revenue Choices
which measures the response of the primary balance ratio to changes in the debt ratio. In the report’s sample of middle-income countries, the coefficient of lagged debt ratio is negatively and significantly correlated with the primary balance. One would infer that the primary balance ratio deteriorates with an increase in the lagged debt ratio by one period.33 In this case, the ρ turns positive (and significantly) by a third period lag only. This behaviour needs to be interpreted carefully, as there may be other factors that influence or force the primary balance to respond positively, rather than the systematic mechanisms of fiscal policy.
Temporary increases in government expenditures, captured by the government expenditure gap, have significant negative effects on the primary balance. This is expected, and the results are broadly in line with other studies. It implies that an increase of real expenditure above its trend can lower the contemporaneous primary balance by an average factor of 0.16.
The results of this analysis indicate that the low- and middle-income countries of the Arab region follow a “U-shaped” fiscal reaction function, if Lebanon is removed from the sample (figure 4.11). Unlike the standard “flattened U-shaped” response of fiscal policy to debt ratio in other studies, the results show a “steep U-shaped” curve, and the primary balance ratio looks perpetually negative. That raises concern about the existence and effectiveness of fiscal rules in handling debt sustainability in the long term.
2. Fiscal sustainability gap: debt-stabilizing primary balance
The report examined the fiscal sustainability gap by computing the difference between the actual primary balance and the debt-stabilizing primary balance. In this context, the interest rate and growth differential (IRGD) play key roles. In a situation where a
government is financing deficits by issuing bonds, the interest payment on the last period’s bonds, less the government’s current primary surplus, must be covered by issuing new bonds. If the primary surplus is zero, then debt will grow by the nominal rate of interest.34 In terms of the debt-to-GDP ratio, a sustainability condition or “no-Ponzi game condition” is that the terminal nominal rate of interest should be no larger than the rate of growth of nominal GDP. If the interest paid on this debt is lower than the growth rate of the economy (IRGD < 0) then, all else being equal, the debt will stabilize below the current level. The opposite conclusion holds for the situation in which interest paid on the debt is greater that the growth rate of the economy (IRGD > 0).35
In the report’s sample of Arab countries, all five had historically negative and large IRGDs during the mid-2000s to 2013 to 2014. But in recent years, the IRGD in most countries dropped below historical levels and was even positive for Lebanon and Jordan in 2015 and 2016, respectively (figure 4.12).36 In Tunisia, the average primary deficit fell below -5.5 in 2013 from its historical average of -1.3, but the debt-stabilizing primary balance considerably improved in 2014 due to a favourable and large IRGD. In Egypt, despite a high and negative IRGD, the debt-stabilizing primary balance continued to fall during 2014 to 2015.
The comparison between the 2014 to 2016 average actual and debt-stabilizing primary balances provides useful insights to visualize the fiscal sustainability gaps in the selected countries (figure 4.13). The 45-degree line indicates equalizing the actual and debt-stabilizing primary balance ratios, implying stability in the debt ratio. The area above the 45-degree line shows that the debt-stabilizing primary balance ratio is higher than the actual primary balance ratio; the debt ratio tends to increase. The area below the 45-degree line shows its opposite.

72
The average debt-stabilizing primary balance ratio in the last three years in all five countries is higher than the average actual primary balance ratio, indicating rising debt to GDP. In several countries, the debt-stabilizing primary balance is negative, suggesting that interest rates are below
economic growth rates.37 In such cases, debt ratios can be stabilized even when primary balances are in deficit, as the case of Egypt, Jordan and Tunisia. This condition may not hold indefinitely, however. For instance, the interest rate in Egypt has gone up significantly between 2016 and 2017, as the Government is trying to stabilize inflation. Jordan is also facing significant upward pressure on interest rates. Given this situation, the debt ratios will tend to further deteriorate. Robust debt-stabilizing fiscal policy conditions, therefore, refer to a situation where the debt ratio can be stabilized in circumstances when the interest rate is even higher than the growth rate.38
Among all countries in the sample, Morocco and Tunisia are slightly better off. Egypt and Lebanon need significant mobilization of revenues for stabilizing the debt ratio at its current level. As a budgeting tool, possible variations in the debt-stabilizing primary balance can be worked out by applying different combinations of growth rate and interest rate differentials, given macroeconomic scenarios over the short to medium term.
Figure 4.12 Interest rate and growth rate differential (Percentage points)
6.0
4.0
2.0
0.0
-2.0
-4.0
-6.0
2003-2
014 2015
2016
2006-2
014 2015
2016
2005-2
013 2014
2015
2005-2
013 2014
2015
2006-2
014 2015
2016
Egypt Jordan Lebanon Morocco Tunisia
Perce
ntage
points
Source: Sarangi and El-Ahmadieh, 2017, based on data from reports of IMF Article IV Consultations.
Figure 4.13 Debt-stabilizing primary balance versus actual primary balance (2014-2016 average)
-5.00 -4.00 -3.00 -2.00 -1.00 0.00 1.00 2.00 3.00 4.00 5.00
Egypt
Jordan
Lebanon
Morocco
Tunisia
5.00
3.00
1.00
-1.00
-3.00
-5.00
Debt s
tabiliz
ing ba
lance/
GDP
Actual primary balance/GDP
Source: Sarangi and El-Ahmadieh, 2017, based on data from reports of IMF Article IV Consultations and IMF, 2017f.

73
Rethinking Fiscal Policy for the Arab Region Fiscal Policy Can Shape the Right Spending and Revenue Choices
D. Expenditure cuts may not be the only answer to debt
The IMF undertakes a fiscal and macroeconomic review of every member country and produces a country report (Article IV Consultation) that is countersigned by the respective governments. This section briefly draws upon these country reports to discuss the projections and recommendations by the IMF on debt sustainability in the Arab countries.
Among the oil-rich countries, some have been more adversely affected by low oil prices than
others, depending on their fiscal buffers. Bahrain and Oman have very limited buffers compared with Qatar, Saudi Arabia and the United Arab Emirates. Governments have already resorted to spending cuts for wages and benefits, subsidies, defense and capital investments by civil ministries. The IMF suggests that given the weakening of the fiscal buffers in Bahrain and Oman, and low growth prospects in the near future, they must undertake further strong fiscal adjustment measures to maintain fiscal sustainability, and support the exchange rate peg over the medium to long term. Rising debt levels could be a concern for Saudi Arabia soon, given the jump in debt to GDP since 2015 (figure 4.14).
Figure 4.14 IMF projections on debt and expenditure for oil-rich countries
Revenue/GDP (%)
Expenditure/GDP (%)
Debt/GDP (%)
Saudi Arabia
40
35
30
25
20
15
102016 2017 2018 2019 2020 2021
Qatar
40
35
30
25
20
15
102016 2017 2018 2019 2020
United Arab Emirates
40
35
30
25
20
15
102016 2017 2018 2019 2020 2021
Source: Reports of IMF Article IV Consultations, latest years for respective countries.

74
IMF projections on debt sustainability analysis for Qatar, Saudi Arabia and the United Arab Emirates suggest significant cuts in expenditure to GDP. Revenue-to-GDP ratio projections are almost constant for the United Arab Emirates and declining for Qatar, while this may improve for Saudi Arabia.
The oil-poor middle-income countries have been navigating multiple external shocks for almost a decade, following the global economic crises in 2008. Most economies are lagging behind on productivity and per capita income growth.39 The Syrian crisis dominates Lebanon’s economic outlook, since refugees now make up
a quarter of the population. Higher interest rates and subdued nominal growth could push public debt to 160 per cent of GDP by 2021 – almost 20 percentage points higher than today. Egypt and Jordan remain highly debt stressed, while the economies of Morocco and Tunisia remain more resilient than others.
The IMF projections and recommendations for the countries discussed above suggest that reducing expenditure to GDP in the next five years is the main channel for improving fiscal balances. This has been in line with IMF advice around the world, with expenditure cuts proposed in 48 out of 50 low- and middle-income countries.40 The
Figure 4.15 IMF projections on debt expenditure for middle-income countries
Revenue/GDP (%) Expenditure/GDP (%) Debt/GDP (%)
Jordan
Tunisia
90
80
70
60
50
40
30
202016 2017 2018 2019 2020
Egypt
Morocco
100908070605040302010
2017 2018 2019 2020 2021
70
60
50
40
30
20
102016 2017 2018 2019 2020 2021
80
70
60
50
40
30
20
102017 2018 2019 2020 2021 2022
Source: Reports for IMF Article IV Consultations, latest years for respective countries.

75
Rethinking Fiscal Policy for the Arab Region Fiscal Policy Can Shape the Right Spending and Revenue Choices
reduction of the State in developing economies, however, where the private sector is not developed, often leads to economic contraction and low growth in employment, which can deepen development deficits and erode prospects for the SDGs, including as some groups of people, often already the most deprived, are left even further behind.
Nevertheless, governments often have been forced to cut expenditure, particularly for investment, to quickly respond to fiscal challenges. Projections of revenue to GDP for several countries do not show any sign of increase in the next five years. An example of countries operating at lower than their potential, cutting expenditure primarily for the sake of improving macro balances, is Jordan. Adverse effects from expenditure cuts have included reduced output and employment growth from 2014 to 2015.
E. Taxation can harness new revenues based on fair principles
A fair and progressive taxation system supports the principles of inclusion and equity
through collection practices oriented around the ability to pay, and through raising revenues for financing development priorities, including pro-poor initiatives. Yet Arab countries have systematically low tax collection rates compared with the size of their economies.
A simple tax buoyancy calculation41 for selected Arab oil-poor countries, who rely on taxes as their major sources of revenue, indicates that most score at less than one (figure 4.16). This essentially implies that growth in GDP will not produce a corresponding growth in revenues. Only Lebanon, Morocco and Tunisia are relatively better off.
A low tax-to-GDP ratio is a persistent feature of most Arab countries owing to the “rentier” nature of their economies and their poorer quality governance. GCC countries, for example, don’t impose a personal income tax on their citizens. The volume of direct tax collection is mainly from corporate taxes, but that is negligible in most countries, except in the United Arab Emirates. The tax component of total revenue as a percentage of GDP is therefore too low, varying from as little as 1 per cent in Kuwait to 5 per cent in Qatar in 2013 (figure 4.17A).
Figure 4.16 Tax buoyancy in the oil-poor middle- and low-income countries
1.20
1.00
0.80
0.60
0.40
0.20
0.00
Ln tax
es/Ln
GDP
Morocco Lebanon Tunisia Jordan Comoros Yemen Egypt Sudan Djibouti
Source: Authors’ calculation based on government finance statistics IMF reports.

76
The United Arab Emirates is an exception with taxes at 20 per cent of GDP in 2014, mainly drawn from real estate and a high corporate income tax rate of 55 per cent on companies and financial institutions that operate in the banking and oil and gas sectors.42 Among the non-GCC oil-rich countries, Algeria had a higher share of taxes to GDP at 32 per cent in 2014, owing to diversified sources of taxation, including a value added tax and a considerably high corporate income tax. Even then, the non-hydrocarbon tax-to-GDP ratio is only around 13 per cent.43
Since a major source of revenue is oil and gas exports in the oil-rich countries, low prices and economic downturn can hit their fiscal balances hard. Following the 2014 collapse of oil prices, the sharpest decline in the share of oil revenue to GDP was reported for Saudi Arabia, from 42 per cent in 2012 to 18.8 per cent in 2015.44
Taxes constitute a major source of revenue in the oil-poor countries, but their share to GDP is much lower than the 20 per cent in most middle-income countries in other regions. The share varies between 10 per cent to 20
per cent in most oil-poor Arab countries, except for Morocco and Tunisia at around 23 per cent in 2014 (figure 4.17B). In the Sudan and Yemen, the share is significantly lower, at 6 per cent and 7 per cent, respectively. Trends have been largely stagnant in most countries over the past 10 years or so, except for slight improvements in Mauritania, Morocco and Tunisia. Morocco and Tunisia reported over 85 per cent of total revenues as taxes in 2015. But the portion is much lower in other countries, which partly rely on other revenues, including remittances and aid.
Disaggregation of total taxation into its components indicates that indirect taxes, like those on goods and services, constituted the major share of taxes in all the tax systems of oil-poor countries. This share has increased in some countries over time,45 indicating a regressive pattern, since the middle class and the poor pay a higher burden of tax than the rich. In some cases, such as in Jordan, indirect taxes represented around 71 per cent of total tax revenue in 2014 (figure 4.18). Jordan and Morocco showed an increasing share of indirect taxes in total tax revenue from 2005 to 2014. Current tax reforms in several countries,
Figure 4.17 Tax revenue is low as a share of GDP in Arab countries
A. Tax revenue in oil-rich countries (% GDP)504540353025201510
50
2005
2006
2007
2008
2009
2010
2011
2012
2013
2014
2005
2006
2007
2008
2009
2010
2011
2012
2013
2014
Algeria Bahrain IraqLibya Oman
KuwaitSaudi Arabia
United Arab Emirates Arab oil-rich countriesQatar
LebanonSyrian Arab RepublicMauritania Morocco Sudan
Comoros Djibouti Egypt Jordan
Tunisia Yemen Arab oil-poor countriesB. Tax revenue in oil-poor countries (% GDP)
30
25
20
15
10
5
0
Source: Sarangi, 2016, based on data from IMF, 2016e.

77
Rethinking Fiscal Policy for the Arab Region Fiscal Policy Can Shape the Right Spending and Revenue Choices
such as Egypt, Lebanon and in the GCC, have put greater emphasis on value added taxes to raise resources.
By contrast, the share of income tax in total tax revenue in Egypt, Jordan and Morocco remained either stagnant or declined between 2005 and 2014. In Tunisia, the share showed some improvement during the same period. Recently, Morocco and Tunisia have undertaken some progressive reforms in income tax (see box 4.2 on Morocco).
In addition to low levels of income tax, wealth taxes constitute a negligible share of total
tax revenue in most countries in the region. Among the four countries in figure 4.18, Morocco has a relatively higher share of earnings from property taxes, which increased from 3.5 per cent of tax revenue in 2005 to 7.4 per cent in 2014. In Egypt, the contribution of wealth taxes in total tax revenue increased meagerly from 1 per cent in 2005 to 1.6 per cent in 2014. The share of property taxes is negligible in Egypt, despite the fact that such taxes can have an equalizing influence, and Egypt shows evidence of increasing inequality.46 Globally, taxes on property form around 7 per cent of total tax revenue, a much higher share than in Arab countries.
Figure 4.18 Shares of income and wealth taxes are low in selected oil-poor countries (Percentage)
100908070605040302010
02005 2014 2005 2014 2005 2014 2005 2014
Goods and services Property Individual income Corporate incomeTrade
31.0 35.9
9.8 14.8 17.2 19.4 16.7 18.5
13.012.6
4.3 3.720.3 16.1 18.7 20.5
1.0 1.6
2.2 2.5
3.5 7.4 0.1 0.310.8 7.1
17.4 7.9
12.2 3.8 9.0 8.6
44.2 42.866.3 71.1
46.8 53.3 55.4 52.1
Egypt Jordan Morocco Tunisia
Perce
ntage
Source: Sarangi, 2016, based on data from IMF, 2016e.Note: Property tax in Morocco is for the closest year to 2014.
Box 4.2 Morocco: rebalancing public finances and tax policy through taxation reforms
There is large variation in the contribution of different taxes to government revenues. Yet experience across countries shows that multiple value added tax rates can introduce economic distortions, complicate administration and cause revenue loss. In the absence of a comprehensive tax strategy, the risk is that isolated reforms of specific taxes may either introduce inconsistencies or distortions, or be perceived as unfair. In the end, they will be counterproductive from the perspective of improving the quality, efficiency and acceptance of the tax system.

78
Dudine and Jalles (2017) argue that a permanent increase in the ratio of spending to GDP should be accompanied by reforms aimed at mobilizing revenues in order to avoid a permanent deterioration in the fiscal balance. A sustained increase in mobilizing revenues would require addressing tax administration challenges related to tax avoidance, tax evasion and illicit financial flows, and ensuring that taxation not only generates revenue but also promotes tax fairness.47 Case studies on Jordan and Lebanon, discussed in the previous chapter,
indicate that the middle class faces a more onerous tax burden than the rich.48
F. Main findings
Fiscal sustainability challenges vary significantly across the Arab region, but on the whole suggest some worrisome directions. While the oil-rich countries are relatively better off, the oil-poor countries face major concerns related to their level of debt, the share that is
Taxation matters for revenue generation, distribution of after-tax income and overall economic activity. Reforming the tax system has been one of the major measures undertaken by the Moroccan Government in its attempt to rebalance public finances while introducing fairer and more equitable tax policy. Tax reforms could yield an additional 1.5 per cent to 2 per cent to public revenues. Key priorities have included broadening the tax base, targeting fiscal fraud and reforming the value added tax system.
Measures taken since 2013 have encompassed the introduction of corporate tax brackets, value added tax deductions and improvement in the value added tax refund system. The main aim of the value added tax reforms has been to reduce distortions and introduce a more simplified and modernized system, while considering fairness and equity, along with the impact on the competitiveness of the national economy. In particular, the Finance Law 2014 introduced a generalization of reimbursements and the removal of the offset rule in an attempt to alleviate corporate cash flow. The basis of the value added tax system remains unchanged, with a regular rate of 20 per cent, and several reduced rates.
Further measures have also been adopted to improve tax payments by the self-employed and a wide variety of so-called “liberal” professions. Additionally, reforms have targeted the simplification of administrative procedures for compliance and settlement of tax disputes. The exemption of certain basic products (bread, flour, couscous and semolina), categories of medicines, and certain services and activities was maintained. Yet under Finance Law 2015, a 10 per cent reduced rate was introduced to credit operations relating to social housing (previously exempted), solar water heaters (previously 14 per cent), works of art (previously 20 per cent), and fishing gear and nets (previously 20 per cent), among others.
Reforms have also extended the period of exemption from value added taxes from 24 months to 36 months for the acquisition of capital goods, both for internal transactions and importation. The threshold for exemption from value added taxes on imports for newly created enterprises was halved from 200 million dirhams to 100 million dirhams.
While Morocco has made noticeable strides in its tax reforms, there is still room for greater clarity and communication of the overall reform strategy. Faster implementation of the consensus reached in the National Conference on Taxation in 2013 is required, as well as a more strategic approach that considers the coordination, sequencing and time frame of reforms. Source: Morocco, Ministry of Economy and Finance, 2016; IMF, 2017d.

79
Rethinking Fiscal Policy for the Arab Region Fiscal Policy Can Shape the Right Spending and Revenue Choices
externally provided, and the amount of interest they are paying to service it. These tendencies pose particular risks given a context of low growth, high current account deficits, a lack of structural transformation and diminished investments in human development.
After more than a decade of a declining trend in gross public debt as a share of GDP, a reversal occurred in 2008 in the oil-poor middle-income countries. By 2016, a high ratio had become a major fiscal sustainability concern, particularly for Lebanon at 143 per cent, Jordan at 95 per cent and Egypt at 97 per cent. External debt and average public and publicly guaranteed external debt ratios have been increasing steadily, as have the shares of non-concessional borrowing and short-term external liabilities. Low-income countries still rely mostly on external financial aid and concessional financing, which is increasingly difficult to access. Expanding external debt service obligations compared with earnings from exports is another major concern.
From 2008 onwards, oil-poor middle-income countries have seen a significant trend reversal in fiscal and primary balances. There has been some improvement since 2013, particularly due to fiscal adjustments and the 2014 drop in oil prices. But fiscal and primary deficit ratios of these countries, on average, remained at 8 per cent and 3 per cent, respectively, in 2016. The average current account deficit to GDP deteriorated from 4 per cent in 2008 to about 7 per cent in 2016. Total reserves in terms of months of imports declined in most oil-poor middle-income countries from 2008 to 2016. The association between average fiscal balance and debt ratios remained either negative or non-deterministic during 2008 to 2010 and 2014 to 2016, indicating lax fiscal policy in addressing debt challenges and raising concerns about managing debt over the long term.
While IMF recommendations for improving fiscal sustainability focus mainly on cutting public expenditure, in developing economies, where private sector investment is not easy to crowd in, this may lead to economic contraction and low growth in employment, aggravating development deficits. Another approach, to which little attention has been paid in the region, focuses on mobilizing more revenues and diversifying their sources.
A well-strategized taxation system, based on the principles of fairness and inclusion, is one obvious way forward. This could raise new revenues and help to address widening disparities between rich and poor, including through pro-poor initiatives and much-needed investments in human development and structural transformation. On average, Arab countries are below their potential for raising taxes, while the predominance of indirect over direct taxes points to the generally regressive nature of taxation in the region. Several countries are considering new or increased value added taxes without proper analysis of impacts on the poor and the middle class. Some countries are already facing challenges from civil society against such an increase, particularly due to widespread tax avoidance by the rich.
In oil-rich countries, diversifying tax revenues is important given their heavy reliance on oil revenues. In times of low oil prices, adequate taxation can improve their fiscal stance and sustain macroeconomic stability. Reforming tax systems can also provide opportunities to diversify economic activities, aiming for greater productivity and more inclusive development, as well as expanding potential sources of revenue.


Effective Fiscal Policy Depends on Governance
5.

Fiscal policy both influences and manifests governance dynamics that can either reduce or exacerbate deficits in human development, and strengthen or weaken the social contract.
Fiscal policy both influences and manifests governance dynamics that can either reduce or exacerbate deficits in human development, and strengthen or weaken the social contract.

83
Rethinking Fiscal Policy for the Arab Region Effective Fiscal Policy Depends on Governance
Effective Fiscal Policy Depends on Governance
Sound governance is both an end in itself and a means to development.1 For its part, fiscal policy both influences and manifests governance and development dynamics. Effective, responsive and accountable fiscal institutions, and just and efficient State performance produce a range of positive results, among them an inclusive and growing economy, justice, equality and the sustainable use of natural and other resources. This process is integral to establishing a social contract where citizens know that governments deliver quality services and economic management that results in inclusion and opportunity. They in turn are willing to contribute, including through fair taxation.
Despite these potential benefits, rules to guide fiscal policy choices and institutions are weak in most countries in the Arab region.2 This is particularly worrisome at a time when there has been increased global interest in fiscal policy rules and their ability to limit fiscal deficits, contain government debt, raise domestic resources and promote equitable development.
This chapter will look at how governance affects human development, examining the association between the quality of institutions and public expenditure policies. The influence of the quality of institutions on efficiency and equity in the allocation of expenditure and revenue mobilization is also explored. Section A highlights governance trends in the Arab region and assesses the relationship between governance and human development. Section B briefly discusses why governance matters for fiscal policy and its impact on fiscal outcomes, while section C looks at gender-responsive budgeting. Section D puts forth some policy recommendations.
A. Governance gaps are hindering development in the Arab region
1. Measures of governance
There is no universally accepted measure for governance. Several measures exist, with each varying in their geographical and/or time coverage, or in their basic premise. The most well-known indicators capturing different facets of governance are, arguably, the World Bank’s World Governance Indicators. Governance is defined in them as the set of “traditions and institutions by which authority in a country is exercised. This includes the process by which governments are selected, monitored and replaced; the capacity of the government to effectively formulate and implement sound policies; and the respect of citizens and the State for the institutions that govern economic and social interactions among them”.3
The World Governance Indicators measure governance across six dimensions: voice and accountability, political stability, government effectiveness, regulatory quality, the rule of law and control of corruption. These are not perfect measures of governance, with well-documented criticisms including their lack of a reflection of economic governance. Yet the indicators have been used extensively to study the association of performance in governance with socioeconomic and political performance.4 Based on them, and with recognition of their limitations, figure 5.1 presents some general governance trends in the Arab region. On average, the quality of institutions ranks in the medium range. Arab countries fare relatively well on some institutional variables and development indicators but very poorly in others.
5.
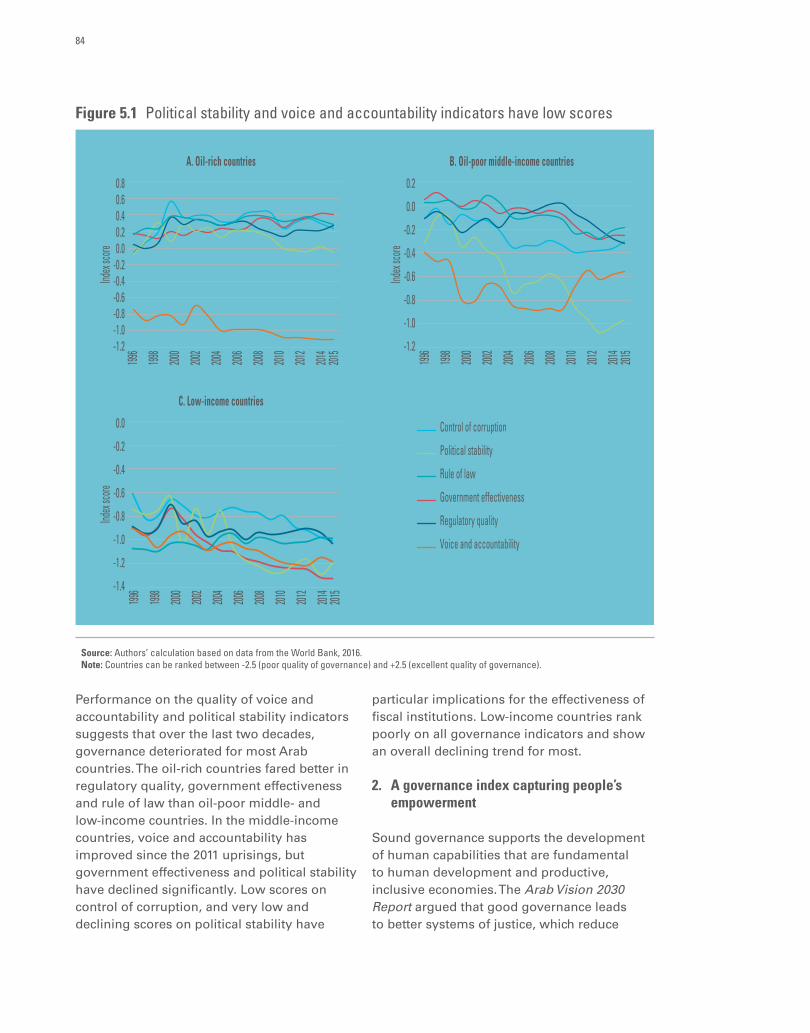
84
Performance on the quality of voice and accountability and political stability indicators suggests that over the last two decades, governance deteriorated for most Arab countries. The oil-rich countries fared better in regulatory quality, government effectiveness and rule of law than oil-poor middle- and low-income countries. In the middle-income countries, voice and accountability has improved since the 2011 uprisings, but government effectiveness and political stability have declined significantly. Low scores on control of corruption, and very low and declining scores on political stability have
particular implications for the effectiveness of fiscal institutions. Low-income countries rank poorly on all governance indicators and show an overall declining trend for most.
2. A governance index capturing people’s empowerment
Sound governance supports the development of human capabilities that are fundamental to human development and productive, inclusive economies. The Arab Vision 2030 Report argued that good governance leads to better systems of justice, which reduce
Figure 5.1 Political stability and voice and accountability indicators have low scores
A. Oil-rich countries
Control of corruption
Political stability
Government effectiveness
Rule of law
Voice and accountability
Regulatory quality
B. Oil-poor middle-income countries
0.80.60.40.20.0
-0.2-0.4-0.6-0.8-1.0-1.2
Index
score
0.2
0.0
-0.2
-0.4
-0.6
-0.8
-1.0
-1.2
Index
score
1996
1998
2000
2002
2004
2006
2008
2010
2012
2014
2015
C. Low-income countries
0.0
-0.2
-0.4
-0.6
-0.8
-1.0
-1.2
-1.4
Index
score
1996
1998
2000
2002
2004
2006
2008
2010
2012
2014
2015
1996
1998
2000
2002
2004
2006
2008
2010
2012
2014
2015
Source: Authors’ calculation based on data from the World Bank, 2016.Note: Countries can be ranked between -2.5 (poor quality of governance) and +2.5 (excellent quality of governance).
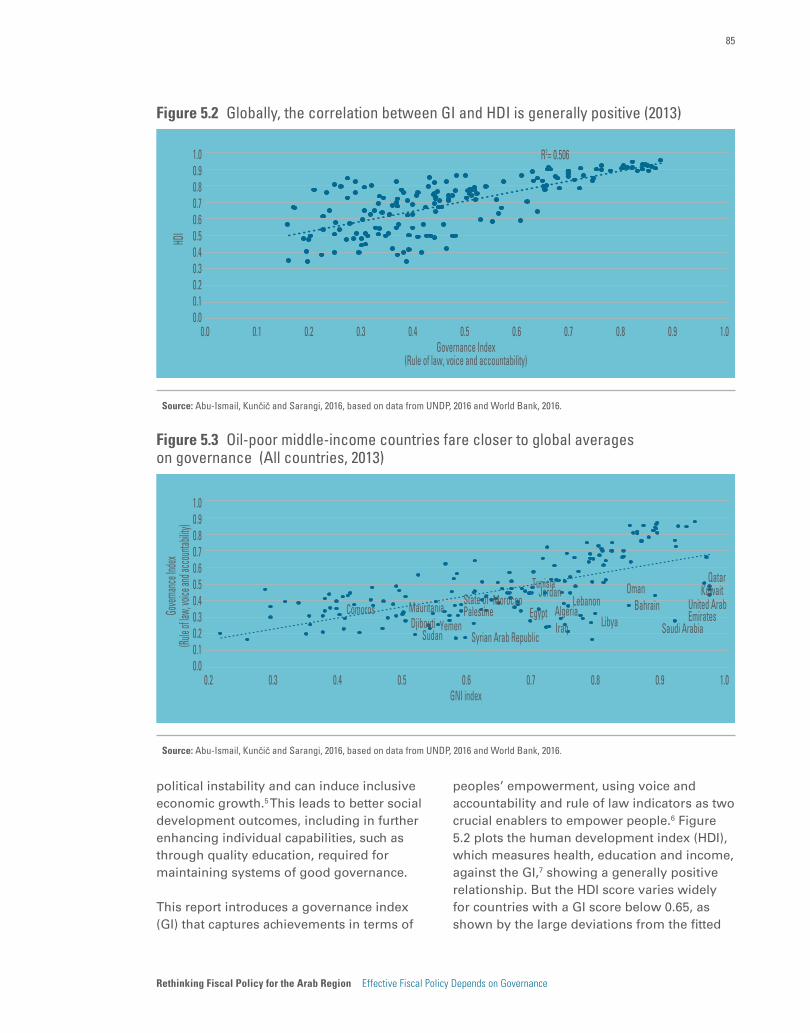
85
Rethinking Fiscal Policy for the Arab Region Effective Fiscal Policy Depends on Governance
political instability and can induce inclusive economic growth.5 This leads to better social development outcomes, including in further enhancing individual capabilities, such as through quality education, required for maintaining systems of good governance.
This report introduces a governance index (GI) that captures achievements in terms of
peoples’ empowerment, using voice and accountability and rule of law indicators as two crucial enablers to empower people.6 Figure 5.2 plots the human development index (HDI), which measures health, education and income, against the GI,7 showing a generally positive relationship. But the HDI score varies widely for countries with a GI score below 0.65, as shown by the large deviations from the fitted
Figure 5.2 Globally, the correlation between GI and HDI is generally positive (2013)
1.00.90.80.70.60.50.40.30.20.10.0
HDI
1.00.90.80.70.60.50.40.30.20.10.0Governance Index
(Rule of law, voice and accountability)
R2= 0.506
Source: Abu-Ismail, Kunčič and Sarangi, 2016, based on data from UNDP, 2016 and World Bank, 2016.
Figure 5.3 Oil-poor middle-income countries fare closer to global averages on governance (All countries, 2013)
1.00.90.80.70.60.50.40.30.20.10.0
1.00.90.80.70.60.50.40.30.2GNI index
Algeria BahrainComorosDjibouti
EgyptIraq
Jordan KuwaitLebanon
LibyaMauritania Morocco
OmanQatar
Saudi ArabiaSudan Syrian Arab Republic
Tunisia
United ArabEmirates
State ofPalestine
Yemen
Gover
nance
Index
(Rule o
f law,
voice
and ac
counta
bility)
Source: Abu-Ismail, Kunčič and Sarangi, 2016, based on data from UNDP, 2016 and World Bank, 2016.

86
line. The clustering of countries at the top end of the line suggests that synergies between good governance and human development are maximized, thus yielding a more straightforward relation between the two.
Figure 5.3 plots the values of gross national income (GNI) and the GI. While some countries stand at a distance from the fitted line, particularly the oil-rich countries in the far lower right, governance performance for the oil-poor middle-income countries, such as Jordan, Morocco and Tunisia, is closer to the expected global average at their given level of income.
The average GI score for the Arab States is below 0.400, implying that governance quality is low irrespective of income levels. The popular notion that as countries get richer, their governance improves does not seem to hold for the region. Including GI as a human development dimension results in losses in the
HDI score of all Arab countries. Some countries such as Iraq, Saudi Arabia, the Sudan and the Syrian Arab Republic suffer significant losses of more than one fifth (figure 5.4). Egypt, Lebanon and Yemen suffer more than a 15 per cent loss.
B. Governance effectiveness defines the strength of fiscal policy
Variances in the effectiveness of spending, including corruption and “patronage”, often account for the insignificant relationship between public spending and its outcomes across countries.8 Looking at various dimensions of the quality of governance, such as those captured by the Worldwide Governance Indicators, is therefore important for the analysis of fiscal policy choices.
1. Public expenditure allocations
Public spending has a stronger impact in countries with better quality governance.9 Yet corruption and political challenges, including those that arise from abundant resources, can hinder policymaking, and lead governments to deliver low-quality public goods and services,10 while achieving only meagre economic performance.11 Weak institutions are among the main obstacles that prevent Arab countries at large from implementing countercyclical fiscal policies, in addition to limited access to international capital markets and the lack of democratic political regimes.12
In some sense, the resource curse in the Arab region is mainly an institutional curse,13 where the discovery of resources consolidated an existing weak institutional set up, with implications that include the poor application of fiscal policy in response to the volatility of oil prices.14
Some elements of the link between governance and fiscal policy can be inferred by studying the impact of governance on government
Figure 5.4 Most Arab countries lose on HDI scores when the GI is factored in
Syrian Arab RepublicSaudi ArabiaIraqSudanBahrainAlgeriaEgyptLebanonYemenUnited Arab EmiratesState of PalestineOmanQatarKuwaitDjiboutiJordanMauritaniaMoroccoTunisiaComoros
Percentage loss, 2013
-30.0 -25.0 -20.0 -15.0 -10.0 -0.5 0.0
Source: Authors’ calculation based on Abu-Ismail, Kunčič and Sarangi, 2016.

87
Rethinking Fiscal Policy for the Arab Region Effective Fiscal Policy Depends on Governance
expenditure.15 The high oil prices of the last decade benefited oil-rich Arab countries by facilitating large fiscal surpluses and high growth rates, while enabling them to deliver noticeable social and economic outcomes through increased spending on health, education and infrastructure. Social spending, measured by expenditure on health, housing, education and social protection, as a share of total expenditure, does not strictly follow the World Bank governance indicators, however. Higher voice and accountability implied higher social spending among oil-rich countries during the boom years, a positive link evident across all governance indicators from 2000 to 2004. Political stability showed a less positive relationship, explained by the fact that a majority of the oil-rich countries are monarchies, suggesting that political stability is implied regardless of their spending patterns. During 2005 to 2009, the relationships between most indicators of governance and social expenditure were reversed or flattened, which may be attributable to pressures on public budgets in the aftermath of the global economic crises in 2008. Only higher scores on voice and accountability were associated with more social spending.16
The political instability and social unrest that came out of the uprisings in 2011 negatively affected fiscal policy choices, causing both oil-poor and oil-rich countries to expand public expenditure, particularly the share of subsidies in total expenditure, as a means to contain the spread of unrest. The relationship between changes in governance indicators and changes in public expenditure policies in the region remained uncertain from 2011 to 2015, given political upheavals in several countries, the oil price plunge and discretionary changes in public expenditure policy.
2. Revenue management
Institutions and their underlying structure can explain extreme spending patterns in government revenues17 as well as patterns of lower revenue collection. In the Arab
States, the latter is partly due to corruption,18 particularly for taxes that require repeated interaction between tax authorities and individuals. In terms of taxation, a link has also been found between higher levels of direct democracy, and more willingness to pay taxes in advanced and emerging countries.19
Several trends can be inferred in examining the impact of governance on revenue management in the Arab region. The boom years of the early 2000s had a positive effect on oil-poor countries as they witnessed higher economic growth, translating into increased government revenues. Between 2000 and 2004, countries that had higher voice and accountability were found to have higher taxes as a share of revenues. This was particularly noticeable in Lebanon and Morocco. Countries ranking higher on government effectiveness, control of corruption and regulatory quality also had a higher share of taxes as a share of total revenues. Countries with higher rankings on political stability or even rule of law indicators did not necessarily record higher taxes as a share of total revenue.
Governance indicators as a whole deteriorated following the uprisings in 2011. Falling levels of government effectiveness, control of corruption, rule of law as well as regulatory quality were no longer associated with increases in taxes as a share of total revenues.20 While fiscal stimulus packages continued to curb social unrest after 2011, lower oil prices offered temporary relief in the public finances of oil-poor countries and provided some room for supporting their expansionary fiscal policies.
C. Institutional quality counts
1. Governance, fiscal rules and principles
Constitutional rules and budgetary institutions are significant determinants of fiscal policy.21

88
As such, improved institutional quality can set the path for countercyclical fiscal policy.22 In the wake of the global recession that began in 2008, there has been renewed interest in the use of fiscal policy as a countercyclical instrument, along with the consolidation of fiscal institutions, particularly through fiscal rules.
To better understand the link between fiscal rules and the cyclicality of fiscal policy, the IMF studied 57 developing and advanced countries,23 finding that while fiscal rules are generally associated with a weak reduction in procyclical fiscal policy, the flexibility of their design determines their impact. Among the standard rules, budget balance rules and expenditure rules are associated with countercyclical
changes in overall spending. The effects are mixed for investment spending. While budget balance rules are associated with countercyclical changes in investment spending, expenditure rules are associated with procyclical changes in investment spending. Debt rules have been found to have no effect on the cyclicality of public spending. Country differences such as past debt-to-GDP ratio, the volatility of terms of trade, natural resource endowments and government stability also influence the extent to which rules limit procyclical tendencies, as do legal and enforcement arrangements.
In some Arab States, the lack of democracy and weak political checks and balances appear to have outweighed the positive impacts of
Box 5.1 Budgetary weaknesses in Bahrain
The argument that oil revenues provide oil-rich countries with the opportunity to buy-off political dissenta can help to explain why social spending has been higher in oil-rich countries, despite lower scores on voice and accountability and regulatory quality indicators.
Evidence from Bahrain confirms a rise in public expenditure (specifically through public employment and/or transfers or subsidies) following major political events in 1994 and 2011. For instance, following the events of 1994, the government increased wages from 48 per cent of total spending to 54 per cent in 1995 and 1996. Similarly, in 2011, following the spread of discontent from the uprisings, additional spending of BD 388.5 million was approved to finance a number of social measures. This pattern suggests that spending often has a political motive rather than following fiscal rules.
In Bahrain, budgetary weakness stems from the lack of government accountability to Parliament. In effect, weak political institutions rather than natural resource wealth are the main drivers behind fiscal spending patterns.
Since the oil price decline in 2014, budgets in Bahrain have been under tremendous pressure. The depletion of resources stresses the need to find alternate sources of revenues in addition to managing expenditure in a more sustainable manner.
Transparency will be key to instituting and preserving credibility in the collection and spending of oil revenues. Political reforms that encompass a strong system of checks and balances will have to be adopted, and efforts made to transform the structure of the economy to achieve a broad-based domestic capital base. The adoption of a simple set of fiscal rules and a medium-term fiscal framework with binding budgetary targets could guide multi-year budget decisions, and, most importantly, substantially contribute to fiscal discipline.
Source: El-Enbaby and Selim, 2015.a Beblawi and Luciani, 1987.

89
Rethinking Fiscal Policy for the Arab Region Effective Fiscal Policy Depends on Governance
oil resources, so that fiscal instability persists despite ample revenues.24 Even as these countries are highly vulnerable to oil price shocks,25 their failure to use countercyclical policy responses in relation to the oil cycle contributes to macroeconomic challenges.
In Bahrain, gaps in the budgetary process and expenditure patterns are associated with weak institutions (box 5.1). Chile provides a good example of how fiscal rules contribute to countercyclical policies (box 5.2).
2. Budget institutions
While various factors impact public finances, budget institutions and the strength of
institutions are important determinants of fiscal outcomes.26 A study of Group of 20 countries indicated that those with stronger budget institutions plan and deliver better on fiscal adjustments.27 They rank high in each of the three key phases of the adjustment cycle: understanding the fiscal challenge; developing a credible fiscal plan; and implementing the fiscal plan through the budget process. In having a clearer understanding of fiscal positions at the beginning of a crisis, stronger fiscal institutions have been better able to produce accurate macroeconomic forecasts (figure 5.5)28 and stay on track with adjustment plans.
While countries with stronger institutions responded with actions designed to counteract
Box 5.2 Chile’s fiscal rules support countercyclical policy
Chile has achieved what few resource-rich developing countries have previously accomplished: it has succeeded in implementing countercyclical fiscal policy. Since 2001, Chile’s fiscal policy has been governed by a structural budget rule, with two independent bodies made up of experts providing key inputs.
Under this framework, government expenditure was budgeted beforehand based on structural revenues, that is, the revenues that would be achieved if the economy were operating at full potential and the prices of copper and molybdenum were at their long-term levels. From 2000 to 2007, the budget target was set at a surplus of 1 per cent of GDP, with the aim of recapitalizing the central bank, funding pension-related and other liabilities, and servicing the net external dollar debt. The target was subsequently lowered to 0.5 per cent of GDP in 2007, and again to 0 in 2009 when the rule was overruled due to insufficient countercyclicality; countercyclical measures were realized through an escape clause.
In 2011, a second-generation structural balance rule was published so that from the 2015 budget, the Government no longer adjusted revenues based on long-term prices of molybdenum. A fiscal council started operating in June 2013 to oversee the two existing independent committees and to advise the Minister of Finance on issues regarding the structural balance rule, including methodological changes. In an effort to enhance transparency, the council’s views are made public, although they are not binding.
There are still technical and institutional improvements to be made. Chile’s fiscal rules have led to an increase in savings from 2.5 per cent of GDP to 7.9 per cent between 2000 and 2005. Consequently, national savings rose by 3 percentage points, from 20.6 per cent to 23.6 per cent, over the same period. Central government debt fell sharply as a share of GDP, and by December 2006, Chile had achieved a sovereign debt rating of A; it climbed to A+ in 2010. Public expenditure fluctuated less over the decade after the adoption of the structural balance rule, helping to stabilize the business cycle. Estimates suggest that between 2001 and 2005, the structural balance policy reduced GDP volatility by one third.
Source: Lledó and others, 2017; Schmidt-Hebbel, 2014; Frankel, 2011.
90
adverse shocks, even as they maintained their original fiscal plans, countries with weaker institutions did not attempt to counteract these adverse shocks through additional fiscal effort. They tended to overspend against their approved budgets. This experience underscores the need for budget institutions to strike a balance between multi-year discipline and near-term flexibility in the face of temporary shocks.
A clear understanding of the present fiscal position and a realistic view of the medium-
term fiscal outlook are essential for a credible fiscal strategy.29 This is especially relevant in the context of an uncertain macroeconomic and fiscal outlook. As such, fiscal reporting, macroeconomic and fiscal forecasting, disclosure and management of fiscal risk and independent fiscal agencies are important elements. A country’s fiscal strategy is more reliable in the context of strong institutional arrangements where fiscal objectives connect across different levels of government, it is based on a medium-term perspective, and funds are distributed based on outcomes and
Box 5.3 Tunisia has more transparency, but discretionary choices remain
Since the uprisings in 2011, Tunisia’s political institutions have undergone profound transformation. This includes the initiation of reforms to improve fiscal transparency and modernize public financial management. Based on the Fiscal Transparency Code of the IMF, the majority of fiscal and budget forecasting practices are considered basic or satisfactory; few are considered advanced. Noteworthy deficiencies relating to the coverage and time horizon of fiscal and budget forecasting remain to be addressed.
Two things stand out in relation to practices in Tunisia. First, gaps in fiscal statistics mean that reporting didn’t adequately cover all records. This implies a lack of comprehensive fiscal statistics for the public sector and its subsectors. Specifically, extrabudgetary entities are not considered in fiscal reports despite subsidies to those entities representing 5 per cent of general budget expenditures in 2013. Underreported expenditures by extrabudgetary entities represent 2.1 per cent of GDP and extend to 161 entities, that is, more than 5 per cent of total public sector entities. In addition, including financial and non-financial public corporations raises the deficit from -4.1 per cent to -6.2 per cent of GDP for the whole public sector. Unreported expenditures essentially concern nonfinancial public corporations, which account for 90 per cent of the unreported total.
Second, Tunisia’s medium-term budget framework is scored as basic. Such frameworks exist but they are not regularly updated or published. A comprehensive medium-term expenditure framework is not regularly presented to Parliament nor approved by the Council of Ministers. In the medium term, no numerical fiscal policy objective has been explicitly or formally established.
A clear understanding of the current fiscal position and a realistic view of the medium-term fiscal outlook are essential for a credible fiscal strategy. Tunisia also faces a need to improve the link between comprehensive and sectoral frameworks.
Generally, countries with stronger institutions tend to score better on medium-term budget frameworks. The basic nature of Tunisia’s framework contributes to increased discretionary fiscal policy and partly explains why fiscal policy objectives are not being met. This has wider implications for macroeconomic management. Various reforms including medium-term planning and awareness about the fiscal position need to be undertaken. Source: IMF, 2016c.

91
Rethinking Fiscal Policy for the Arab Region Effective Fiscal Policy Depends on Governance
outputs, in line with the principles of inclusive human development.
The IMF (2014c) finds that in countries where planning institutions are stronger, the process of designing and adopting wide-ranging fiscal adjustment strategies has been quicker. Figure 5.5 shows that in countries with strong institutions, comprehensive consolidation plans were designed and published within 15 months after January 2009, in the wake of the 2008 global financial crises. Countries with weak planning institutions on the other hand, presented their plans within an average of 27 months, taking almost double the time. During the fiscal consolidation process, stronger fiscal institutions fare better than weak ones in securing public investment spending.
3. Fiscal policy to address gender inequalities
Gender-responsive budgeting is a practice that builds on a growing understanding that macroeconomic policy can contribute to either narrowing or widening gender gaps.30 The focus on the budget stems from the idea that budgets directly affect the successful implementation of other policies.
The concept of gender-responsive budgeting does not imply a need for separate budgets for women; it is rather about ensuring that gender responsiveness is present in various policies and budgets across all government institutions, given that budgets are the expression of core social and economic priorities.31 Generally, budgets are perceived as gender neutral, affecting men and women in the same ways. In reality, they tend to be gender-blind. This often results in women’s specific needs – which may be distinct from those of men – being overlooked. Thus, gender-responsive budgeting requires looking at government finances to understand how fiscal policy can respond to gender differences and actively reduce gender disparities.32
For example, a substantial part of women’s work is not accounted for in national economic statistics because it is not market oriented, comprising subsistence production, unpaid care work and voluntary community work.33 The burden of this “invisible” unpaid work may be due in part to the lack of essential public services, such as for health or childcare, which might not be captured where budgets operate under the
Figure 5.5 Better institutions improve forecasting and crisis response
A. Average absolute year-ahead GDP forecast error(2004-2012, percentage)
Institutional scores: understanding
Strong institutions Medium institutions Weak institutions Strong institutions Medium institutions Weak institutions
3.0%
2.5%
2.0%
1.5%
1.0%
0.5%
0.0%
30
25
20
15
10
5
0
B. Timeliness of consolidation plansa
(Months b/w crisis and plan announcement)Institutional scores: planning
a Months since January 2009.
Source: Adapted from IMF, 2014c.

92
assumption that all citizens have the same needs. With a compromised ability to engage in income-earning activities, women in turn may at some point become reliant on other government services, such as anti-poverty programmes,34 even as the economy loses out in making the best use of their skills. Budget cuts to health care can make a particularly strong contribution to unpaid care work, as women end up caring for sick children or the elderly, or cannot secure reproductive health care. This is an issue especially relevant to Arab middle-income countries given stagnant spending patterns on health.35 In its more comprehensive forms, gender-responsive budgeting encourages women to participate in budget processes, which can become a point for broader engagement in communities or in running for office.
Gender disparities exist across the globe but are particularly pronounced in parts of the developing world. In the Arab region, women’s participation in the labour force falls short, for example, as progress in education parity has not translated into job parity.36 In 2013, unemployment rates were higher for educated young women than educated young men in the region, 23 per cent compared with 46 per cent, respectively. Violence against women remains a major problem. Though information is scarce, a global survey in 2011 showed that 33.2 per cent of women in Egypt and 20.6 per cent of women in Jordan had reported experiencing violence.37 Demographic health surveys in Djibouti, Egypt and the Sudan reveal that female genital mutilation affects more than 90 per cent of women.
There is increasing evidence that the elimination of gender disparities and obstacles to women’s development is advantageous to societies and economies. Yet the share of public expenditure devoted to gender equality goals is limited globally. Furthermore, disaggregating public spending by gender is limited and has no set approach across different data systems.38
Among the Arab States, gender-responsive budgeting has faced difficulty in taking hold. Morocco has been a leader in this respect, though the final outcome is still unclear. It has sought to develop policies, including fiscal policy, that ensure women’s equal access to education and health care, while expanding their labour market opportunities. Changes to the organic budget law in 2014 required gender equality to be considered when defining performance objectives, results and indicators in all parts of the budget. A gender report is to be included in the yearly Financial Bill.39
Generally, the lack of gender-disaggregated data hinders gender-responsive budgeting. Thus, one early step is for countries to strengthen the capabilities of statistics offices. For example, among other initiatives, the National Council for Women in Egypt together with the Ministry of Finance established the Equal Opportunity Unit in 2005.40 The unit is tasked with promoting gender equality in the national budget process. Accordingly, gender-responsive budgeting was institutionalized in the 2008-2009 fiscal year when the draft budget circular required that budgets reflect the needs of all members of the Egyptian family to ensure social equity among them. In the following fiscal year, government bodies were required to prepare performance-based budgets and data analysis disaggregated by gender.41 In 2010-2011, Egypt finally implemented its first gender-responsive and performance-based budget.
The Ministry of Finance of Bahrain encouraged ministries and agencies to conduct gender analysis of expenditure when it introduced gender-responsive budgeting in its budget circular in the 2011-2012 fiscal year.42 Efforts in Jordan began in 2010 with support from the United Nations Entity for Gender Equality and the Empowerment of Women (UN Women) and the Jordanian Commission for Women,43 and have included a pilot project to categorize expenditure on women-specific programmes and to determine ways to institutionalize gender-responsive budgeting.

93
Rethinking Fiscal Policy for the Arab Region Effective Fiscal Policy Depends on Governance
While much of the emphasis in gender-responsive budgeting has been on expenditure, the revenue side of fiscal policy can have equally important implications for gender equality.44 Varying forms of taxation include explicit or implicit gender biases. Increased emphasis on tax simplification, such as through value added taxes, has led to policies limiting deductions and exemptions without considering the primary consumption needs of women. Taxes should be reformed to be more progressive, in the light of the large share of women in poverty and lower income brackets, but also more active in tackling potential gender biases. Analysing tax systems through a gender lens can serve as a stimulus for tax reforms that consider both equity and the ability to pay.
4. Energy subsidies and environmental sustainability
Fiscal policy decisions affect consumption and production patterns that can have a direct impact on the environment. Subsidies to water and energy may contribute to the misallocation of these resources through wasteful consumption, for example, particularly when these subsidies are not channelled to targeted beneficiaries. In addition, they act as a counterincentive to rationalizing natural resource use and investing in efficient management. This has various implications both for environmental sustainability and the structural transformation of the economy.
Subsidies for water and energy resources are not the most effective tools to help the poor and most vulnerable people to attain a higher standard of living (figure 5.6). First, due to a lack of targeting, over 90 per cent of the benefits of general subsidies go to those in higher income categories. Second, subsidies on energy impose significant costs on the environment through increased carbon dioxide emissions from the consumption of fossil fuels. Per capita emissions in the Arab region have been growing at 1.36 per cent per year since 1980, in sharp contrast to the world average of 0.20
per cent per year. Third, low tariffs crowd out investments in green energy and discourage the restructuring of the power sector, with substantial impacts on performance, competitiveness and eventually growth.
There is a growing need to rationalize subsidies without adversely affecting the poor. This could take the form of adopting progressive tariff schemes that improve equity and protect the poor by securing access to basic services as a matter of human rights. As some countries in the region have begun to do as part of subsidy reforms, taking advantage of current low energy prices, energy subsidies could be phased out on most products except those largely consumed by low-income groups or that emit fewer greenhouse gases. Determining the optimal percentage increase in water and energy prices is a challenging task, but developing renewable energy and providing services at competitive prices are important measures to ensure the eventual phase out of energy subsidies.
Figure 5.6 The environmental hazards of water and energy subsidies
Subsidies
Low tariffs
Energy-intensive
industries
Increaseddemand
• Low tariffs• Increased demand• Over-consumption and over-production• Environmental implications• Social implications (health implications)• Specialization in energy-intensive industries• Increased demand• Over-consumption and over-production• Environmental implications• Low contribution in employment generation• Increased burden on public finances• Deterioration of fiscal balance (increased debt or smaller fiscal space)• Crowding-out of public spending on other sectors (health & education)• Inefficient support to the poor and most vulnerable
• Specialization in energy-intensive industries• Crowding-out of investments in green technologies• Disincentive of economic diverisification• Environmental implications
Source: Zein, 2017.

94
Water and energy subsidy reforms should not be stand-alone policies, but rather part of a comprehensive plan. Governments need to prioritize improving the efficiency of the water and electricity sectors, increase coverage, improve the quality of services, enhance irrigation efficiency, revisit crop selection, and promote the use and development of renewable sources of energy. By rationalizing subsidies, some financial resources could be freed for investment in renewable energy and energy efficiency, speeding up the shift to green technologies.
D. Main findings
Fiscal policy both influences and manifests governance dynamics that can either reduce or exacerbate deficits in human development, and strengthen or weaken the social contract. Poor governance, seen in weak institutions and lack of adherence to fiscal rules, adversely affects equity and efficiency in the allocation of government expenditure and mobilization of revenues. Among oil-poor countries, those with better rankings on the control of corruption, government effectiveness and political stability have had higher social expenditure and a higher share of taxes to
total revenues. In oil-rich countries, the link between social spending as a share of total expenditure with governance indicators is less straightforward.
Countries with strong budgeting and planning institutions have been more successful in delivering on fiscal adjustments and better able to come up with credible fiscal plans. By contrast, the absence of a medium-term budget framework and lack of adequate transparency in the budgeting process implies that budget decisions do not tend to follow appropriate fiscal rules. The weakness of checks and balances in the region in addition to the weakness of budget and planning institutions fail to limit discretionary, procyclical fiscal policy.
Fiscal rules that are adopted and upheld within a medium-term fiscal framework can guide more effective budget decisions, in line with the principles of the 2030 Agenda and geared towards the achievement of the SDGs. In the process, tools such as gender-responsive budgeting can contribute to greater inclusion and equality. The examination of subsidies should take place in the light of the increasing urgency surrounding environmental sustainability as well as the imperative to reach the most vulnerable citizens.

Fiscal Issues in a Context of Conflict6.

Fiscal policy should be guided by the principles of inclusion and equity in reconstruction and the transition to development, and grounded in a solid plan of action with the right sequencing of priorities.
Fiscal policy should be guided by the principles of inclusion and equity in reconstruction and the transition to development, and grounded in a solid plan of action with the right sequencing of priorities.

97
Rethinking Fiscal Policy for the Arab Region Fiscal Issues in a Context of Conflict
Fiscal Issues in a Context of Conflict
Since 2010, conditions in Iraq, Libya, the Syrian Arab Republic and Yemen have deteriorated significantly. Severe health problems, years of lost education, the loss of income and livelihoods, and marginal living standards have been among the consequences for millions of people. Fiscal and development issues are unique for each of these countries. Iraq and Libya have potentially greater fiscal capacity than the Syrian Arab Republic, while Yemen confronts severe and longstanding development challenges. Yet in all four, appropriate macrofiscal frameworks could play a role in supporting reconstruction and development.
This chapter examines opportunities and hindrances during the reconstruction process, and explores how fiscal policy can support a stable reconstruction process, including by considering constraints related to absorptive capacity, the nature of each country’s economy, and governance prior to and during the war.
Section A provides a theoretical overview of the negative impact of capital loss on growth, and an estimate of foregone GDP and government revenues for all four conflict-affected States between 2010 and 2015. Section B highlights macroeconomic and governance challenges as well as issues related to reconstruction priorities. Section C suggests different potential sources of funding to accompany the reconstruction period. Section D presents different sustainable fiscal spending scenarios based on economic structure, while section E offers some concluding remarks.
A. An economic toll
Conflict in Iraq, Libya, the Syrian Arab Republic and Yemen has had devastating
economic, demographic and social impacts, and has jeopardized neighbouring countries. The following analysis focuses primarily on economic losses and financing issues, bearing in mind how these can compound a variety of other losses related to human development and well-being.
1. Economic loss estimation
A precise assessment of physical and human capital loss is impossible due to the intensity of conflict in all four countries. Most estimates of capital damage have been done through satellite images or geographic information system (GIS) assessments, which provide a partial snapshot, especially for Libya, the Syrian Arab Republic and Yemen.1 The following estimates on overall loss of economic activity draw on the 2010-2015 predictions of the IMF on income forecasts,2 and ESCWA estimates of realized incomes for the same period for all four countries.3 The total gap between the predicted and realized GDP was $428.14 billion between 2010 and 2015. In addition to war accumulated losses, Libya and the Syrian Arab Republic are still suffering from economic sanctions in multiple sectors, which further worsen the socioeconomic condition.
While the difference between predicted and realized GDP was minimal for Iraq, likely because the impact of war, which had been ongoing since the invasion of the United States in 2003, was already taken into account, the difference was large for Libya and the Syrian Arab Republic. Yemen, on the other hand, had experienced only one year of severe conflict in 2015, and therefore its GDP loss was relatively small based on estimations up to 2015.
6.
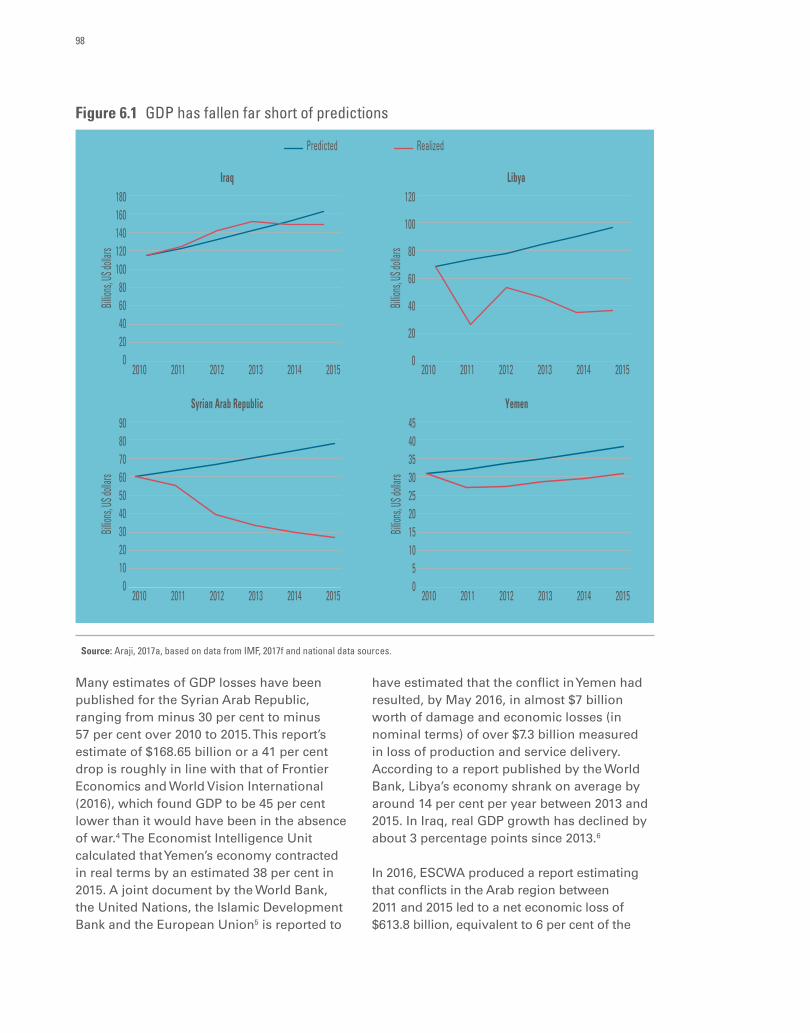
98
Many estimates of GDP losses have been published for the Syrian Arab Republic, ranging from minus 30 per cent to minus 57 per cent over 2010 to 2015. This report’s estimate of $168.65 billion or a 41 per cent drop is roughly in line with that of Frontier Economics and World Vision International (2016), which found GDP to be 45 per cent lower than it would have been in the absence of war.4 The Economist Intelligence Unit calculated that Yemen’s economy contracted in real terms by an estimated 38 per cent in 2015. A joint document by the World Bank, the United Nations, the Islamic Development Bank and the European Union5 is reported to
have estimated that the conflict in Yemen had resulted, by May 2016, in almost $7 billion worth of damage and economic losses (in nominal terms) of over $7.3 billion measured in loss of production and service delivery. According to a report published by the World Bank, Libya’s economy shrank on average by around 14 per cent per year between 2013 and 2015. In Iraq, real GDP growth has declined by about 3 percentage points since 2013.6
In 2016, ESCWA produced a report estimating that conflicts in the Arab region between 2011 and 2015 led to a net economic loss of $613.8 billion, equivalent to 6 per cent of the
Figure 6.1 GDP has fallen far short of predictions
Iraq180160140120100
80604020
0
Billion
s, US d
ollars
2010 2011 2012 2013 2014 2015
Predicted Realized
Libya120
100
80
60
40
20
0
Billion
s, US d
ollars
2010 2011 2012 2013 2014 2015
Syrian Arab Republic908070605040302010
0
Billion
s, US d
ollars
2010 2011 2012 2013 2014 2015
Yemen4540353025201510
50
Billion
s, US d
ollars
2010 2011 2012 2013 2014 2015
Source: Araji, 2017a, based on data from IMF, 2017f and national data sources.
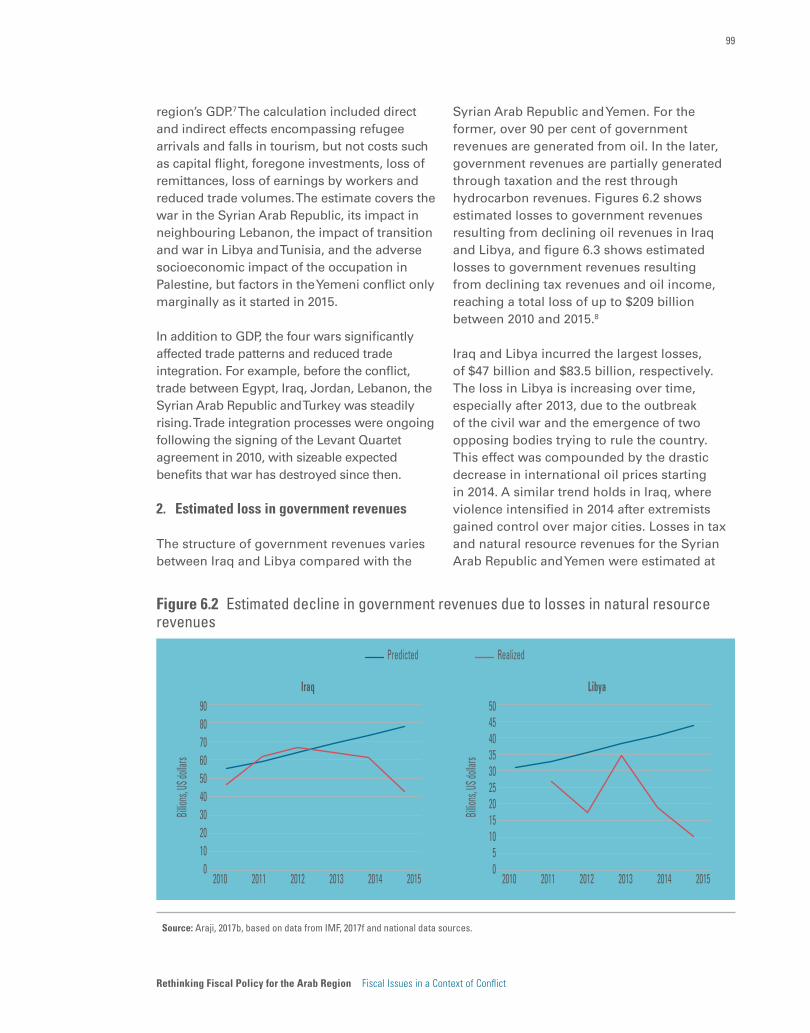
99
Rethinking Fiscal Policy for the Arab Region Fiscal Issues in a Context of Conflict
region’s GDP.7 The calculation included direct and indirect effects encompassing refugee arrivals and falls in tourism, but not costs such as capital flight, foregone investments, loss of remittances, loss of earnings by workers and reduced trade volumes. The estimate covers the war in the Syrian Arab Republic, its impact in neighbouring Lebanon, the impact of transition and war in Libya and Tunisia, and the adverse socioeconomic impact of the occupation in Palestine, but factors in the Yemeni conflict only marginally as it started in 2015.
In addition to GDP, the four wars significantly affected trade patterns and reduced trade integration. For example, before the conflict, trade between Egypt, Iraq, Jordan, Lebanon, the Syrian Arab Republic and Turkey was steadily rising. Trade integration processes were ongoing following the signing of the Levant Quartet agreement in 2010, with sizeable expected benefits that war has destroyed since then.
2. Estimated loss in government revenues
The structure of government revenues varies between Iraq and Libya compared with the
Syrian Arab Republic and Yemen. For the former, over 90 per cent of government revenues are generated from oil. In the later, government revenues are partially generated through taxation and the rest through hydrocarbon revenues. Figures 6.2 shows estimated losses to government revenues resulting from declining oil revenues in Iraq and Libya, and figure 6.3 shows estimated losses to government revenues resulting from declining tax revenues and oil income, reaching a total loss of up to $209 billion between 2010 and 2015.8
Iraq and Libya incurred the largest losses, of $47 billion and $83.5 billion, respectively. The loss in Libya is increasing over time, especially after 2013, due to the outbreak of the civil war and the emergence of two opposing bodies trying to rule the country. This effect was compounded by the drastic decrease in international oil prices starting in 2014. A similar trend holds in Iraq, where violence intensified in 2014 after extremists gained control over major cities. Losses in tax and natural resource revenues for the Syrian Arab Republic and Yemen were estimated at
Figure 6.2 Estimated decline in government revenues due to losses in natural resource revenues
Iraq908070605040302010
0
Billion
s, US d
ollars
2010 2011 2012 2013 2014 2015
Predicted Realized
Libya504540353025201510
50
Billion
s, US d
ollars
2010 2011 2012 2013 2014 2015
Source: Araji, 2017b, based on data from IMF, 2017f and national data sources.
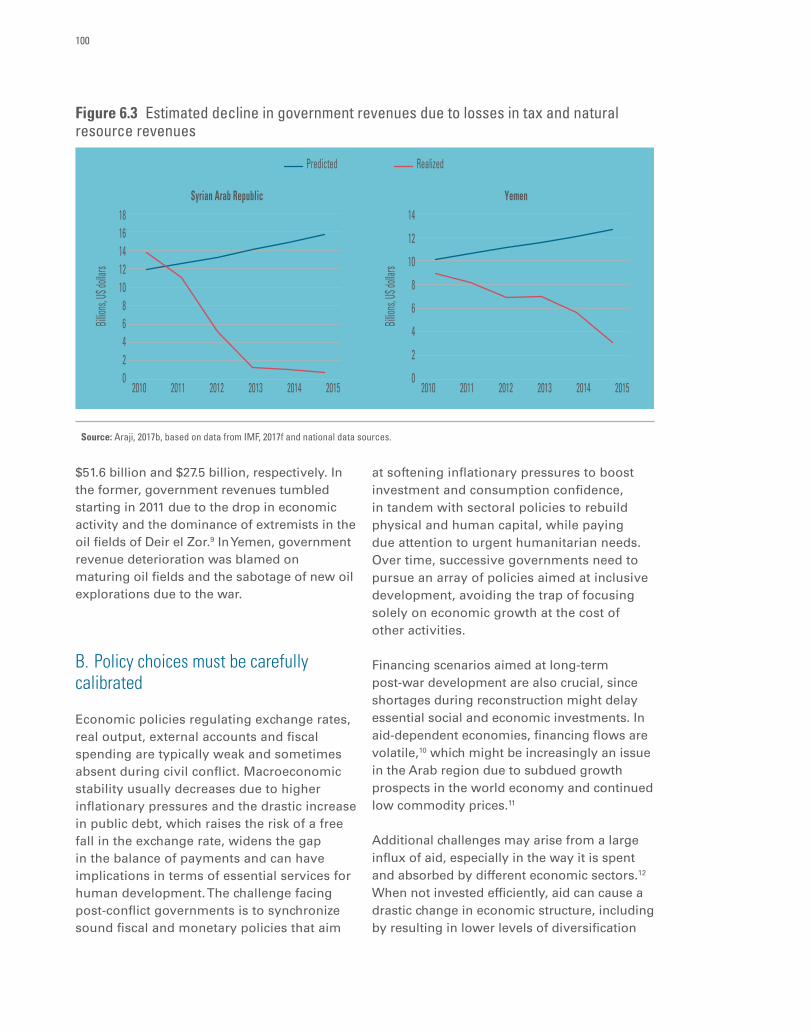
100
$51.6 billion and $27.5 billion, respectively. In the former, government revenues tumbled starting in 2011 due to the drop in economic activity and the dominance of extremists in the oil fields of Deir el Zor.9 In Yemen, government revenue deterioration was blamed on maturing oil fields and the sabotage of new oil explorations due to the war.
B. Policy choices must be carefully calibrated
Economic policies regulating exchange rates, real output, external accounts and fiscal spending are typically weak and sometimes absent during civil conflict. Macroeconomic stability usually decreases due to higher inflationary pressures and the drastic increase in public debt, which raises the risk of a free fall in the exchange rate, widens the gap in the balance of payments and can have implications in terms of essential services for human development. The challenge facing post-conflict governments is to synchronize sound fiscal and monetary policies that aim
at softening inflationary pressures to boost investment and consumption confidence, in tandem with sectoral policies to rebuild physical and human capital, while paying due attention to urgent humanitarian needs. Over time, successive governments need to pursue an array of policies aimed at inclusive development, avoiding the trap of focusing solely on economic growth at the cost of other activities.
Financing scenarios aimed at long-term post-war development are also crucial, since shortages during reconstruction might delay essential social and economic investments. In aid-dependent economies, financing flows are volatile,10 which might be increasingly an issue in the Arab region due to subdued growth prospects in the world economy and continued low commodity prices.11
Additional challenges may arise from a large influx of aid, especially in the way it is spent and absorbed by different economic sectors.12 When not invested efficiently, aid can cause a drastic change in economic structure, including by resulting in lower levels of diversification
Figure 6.3 Estimated decline in government revenues due to losses in tax and natural resource revenues
Syrian Arab Republic1816141210
86420
Billion
s, US d
ollars
2010 2011 2012 2013 2014 2015
Predicted Realized
Yemen14
12
10
8
6
4
2
0Bil
lions, U
S dolla
rs2010 2011 2012 2013 2014 2015
Source: Araji, 2017b, based on data from IMF, 2017f and national data sources.

101
Rethinking Fiscal Policy for the Arab Region Fiscal Issues in a Context of Conflict
that hinder productivity and inclusive growth. Another concern is Dutch disease, where the real exchange rate appreciates through the increase in the relative prices of non-tradable goods to tradable goods, a typical situation associated with most natural resource rich countries.13
1. Prioritization can support better reconstruction
In the process of reconstruction, governments have to manage short-term humanitarian spending, security issues and long-term development programmes, which underscores the importance of setting and implementing fiscal rules within short-, medium- and long-term perspectives. The lack of strategic guidance and failure to identify short- and long-term bottlenecks14 can pose major hurdles.
Usually, short- and medium-term welfare can be improved in the wake of conflict through government spending on consumption and investment goods. Consumption goods entail spending on humanitarian aid, emergency needs, wages and other utilities with a short-term economic impact. Consumption spending has a positive short-term impact, but can have a long-term negative return on growth, especially if governments run prolonged primary budget deficits to finance recurrent activities at the cost of productive activities. Investment goods have a long-term positive impact, comprising spending on infrastructure, health, education and productive sectors to expand value added economic activities.
Humanitarian and recurrent spending may frontload consumption at the cost of investment activities, but over time, this can result in or exacerbate bottlenecks in absorptive capacity. On the other hand, imbalanced spending in favour of investments can shortchange urgent consumption needs, which might exacerbate deprivation and poverty. In each case, policymakers face questions around how to fulfil urgent
consumption needs without compromising long-term, sustainable development.
If the reconstruction process is carefully calibrated with economic reforms, well-implemented reforms can lead to better reconstruction.
2. Governance deficits can entrench macrofiscal instability
The governance challenges arising from armed conflict and political instability are major hindrances to building sustainable societies and economies. In the Syrian Arab Republic, civil unrest started in 2010 and intensified after 2012. The Government’s failure to maintain economic stability manifested when the central bank couldn’t stop the escalation of exchange rates in early 2012. Further, reduced economic activities, low tax collection and higher military spending resulted in a budget deficit of more than 30 per cent of GDP in 2013. According to the Syrian Center for Policy Research, public debt climbed to 126 per cent of GDP in 2013, with a significant increase in foreign debt.
Yemen’s fiscal performance is equally devastating, with gross government debt at over 67 per cent of GDP. This is considered low, yet unsustainable due to low annual economic growth, which is expected to deteriorate even further. The fiscal deficit has surged significantly due to the drop in hydrocarbon receipts.15
In Libya, the presence of two governments has reduced the chances of having an integrated fiscal policy to promote economic development. Iraq confronts higher government spending on security and other recurrent activities, leading to a consecutive budget deficit since 2014. Additional spending was justified with the hike in military expenses to fight extremist groups. For Iraq and Libya, low economic growth and low oil prices would put macroeconomic stability at risk even without the effects of conflict.

102
C. Resource mobilization can draw on diverse sources Lengthy civil conflicts require Iraq, Libya, the Syrian Arab Republic and Yemen to redefine their social contracts. This must be based in part on the State playing a legitimate role, within a clear constitutional framework, in spending as well as mobilizing resources. Ideally, in line with the principles of the 2030 Agenda, this should be done in a manner that underpins inclusion and equity in reconstruction and development.
Some lessons can be learned from experiences elsewhere in the world. After the war ended in the Republic of Congo, tax authorities generated royalties from oil companies based on pre-war arrangements while gradually strengthening their taxes and customs administration. The Government also received almost $6 billion of official development assistance (ODA) between 2001 and 2003.16 After its devastating war with Eritrea, Ethiopia financed urgent spending through imposing 10 per cent taxes on imports.17
1. Mobilizing national resources
Mobilizing resources nationally can be challenging, especially if internal sources of financing such as taxation are restricted, and fiscal institutions suffer significant losses in capacity. One study found that reducing the intensity of civil war can help to mobilize additional revenues, with an increase of 20 per cent if intensity falls from high to medium.18 An additional 15 per cent increase is gained if intensity drops from medium to low.
To reactivate fiscal authority, the State should uphold all required laws and regulations, which depends on the ability to restore order.19 Along with needed reforms to increase tax collection and reduce tax evasion, a steady generation of tax revenues from economic activities could further entrench stability and support urgent national
needs, including those related to restoring broad-based development.
The speed of tax revenue restoration depends on the existing tax system. In the short term, indirect taxation and taxes on selected goods and services might quickly help to mobilize revenues. Unlike other types of taxes, indirect taxation can be easily monitored and collected, but needs to include criteria to negate the impact on vulnerable and poor groups. On the other hand, there is much room for widening the tax base and improving progressivity in direct tax collection. A tax regime of this kind, however, requires major restoration of physical and human capital.
In countries where revenues are highly dependent on oil, the restoration of production at early stages is essential, and could be done through government control and by maintaining a certain level of security. Since natural resource revenues are not sustainable in the long term, however, it is also important to diversify government revenue sources through a new tax regime and to support economic diversification to broaden the tax base over time.
A common denominator for all revenue-generating activities is improvement in governance quality to curtail practices such as embezzlement and tax favouritism, which can deter reconstruction, and compromise security and stability.
2. Government borrowing
To finance reconstruction, governments can borrow domestically from the private sector either by issuing debt securities or through short- and long-term loans. International borrowing from sources such as the World Bank, the IMF and other international development banks is also a possible option. Borrowing comes with multiple risks, however. Debt securities might not be attractive to investors, especially at early stages of

103
Rethinking Fiscal Policy for the Arab Region Fiscal Issues in a Context of Conflict
reconstruction, which can push governments to increase bond interest rates to significantly higher levels. This was evident in Lebanon in 1997 and 1998 when interest rates reached almost 40 per cent. Borrowing in foreign currencies from international organizations might pose exchange rate risks.
Government borrowing will determine public debt dynamics and have positive or negative impacts on development, depending on how efficiently resources are spent in the economy. Usually, government borrowing should be oriented towards higher future economic growth as well as human development outcomes, and higher future government revenues. If there is a pattern of altering investment expenditure with consumption expenditures, however, debt may increase and limit economic growth by crowding out investments.20
Figure 6.4 plots the debt and fiscal performance for 10 years following the end of civil conflicts in four countries that experienced different patterns in post-war spending. Angola started with a high level of debt that was significantly reduced after its war. It managed to close its spending gap and ran a budget surplus within two years, supported by higher revenues from rising oil prices during the later half of the 2000s. Angola is the second largest oil producer in sub-Saharan Africa, which suggests that a fiscal surplus is a result of higher hydrocarbon production and might not be sustainable over the longer term.21 Income inequality and poverty remained high even a decade after the civil war,22 and the country failed to improve its business climate, enhance economic development and increase economic diversification.
Lebanon had a low level of government debt but kept running successive deficits for 10 years of its war, pushing debt to 143 per cent of GDP by 2016. Although total revenues have been improving and rely on a
considerable, healthy tax base, government expenditures have risen at a rate nearly 1.5 times higher than revenues. As a result, the Lebanese debt position is exceptionally high, one of the highest debt ratios in the world. The Government has taken various efforts to reduce its deficit and debt in general, but emergencies, including instability and crisis management activities, have led to additional unplanned spending.
Investigating the change in debt for the post-conflict years shows that it increased by 350 per cent between 1992 and 2000 (from $6.2 billion to $27 billion). On the other hand, GDP per capita increased from $1,965 in 1992 to $5,334 in 2000 (growing by 170 per cent). While countries usually borrow domestically or internationally for targeted spending in productive sectors, debt in Lebanon was used to finance recurrent spending and other non-income generating activities.23 Capital investments reached a peak of 24 per cent of total government spending in 1994 as part of the reconstruction plan, but dropped significantly to less than 5 per cent after 2001. This decline accompanied higher current fiscal spending, reaching an average of 48 per cent between 1992 and 2000. Military expenditures as a percentage of GDP decreased from 7.5 per cent of GDP in 1990 to 5.3 per cent in 2000, but could not be gauged accurately due to major in-kind military donations from European countries and the United States.
In Cambodia and Rwanda, Governments had a deficit increase, but maintained an almost horizontal trend of debt to GDP due to their growth in income and additional generation of tax revenues. Cambodia increased its tax base significantly; tax revenues as a percentage of GDP climbed from 8 per cent in 2002 to 14.5 per cent in 2014.
Given low oil prices, regional economic conditions and unfavourable international economic growth, especially in emerging markets and Europe, domestic financial
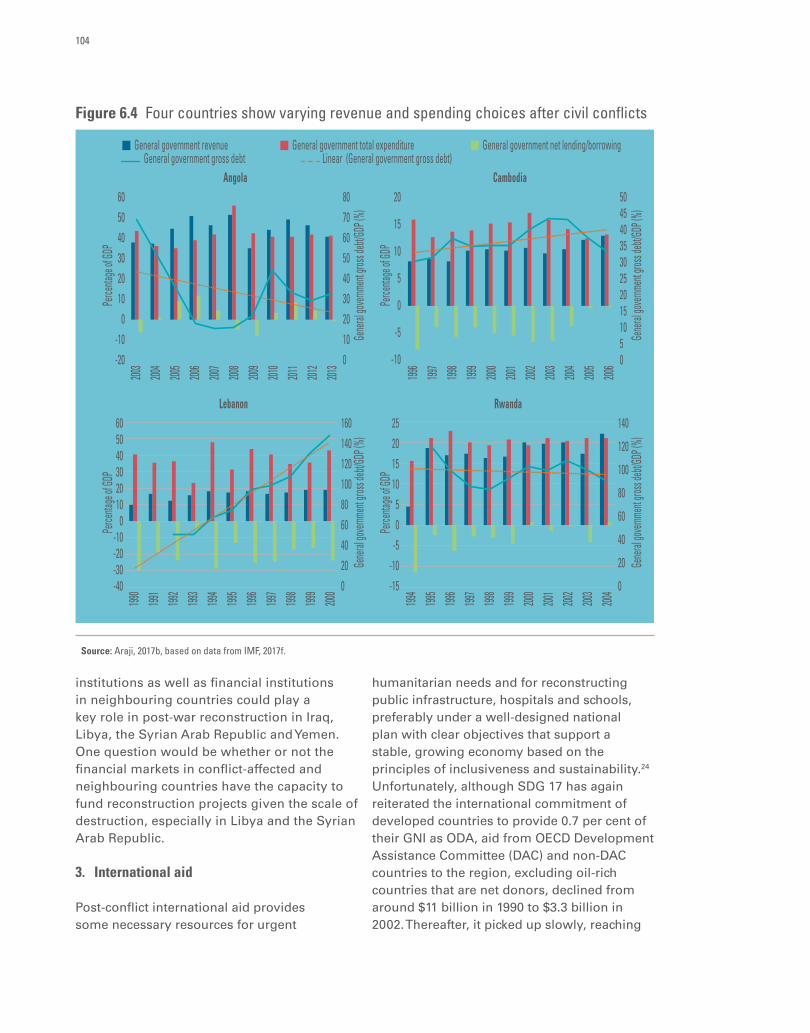
104
institutions as well as financial institutions in neighbouring countries could play a key role in post-war reconstruction in Iraq, Libya, the Syrian Arab Republic and Yemen. One question would be whether or not the financial markets in conflict-affected and neighbouring countries have the capacity to fund reconstruction projects given the scale of destruction, especially in Libya and the Syrian Arab Republic.
3. International aid
Post-conflict international aid provides some necessary resources for urgent
humanitarian needs and for reconstructing public infrastructure, hospitals and schools, preferably under a well-designed national plan with clear objectives that support a stable, growing economy based on the principles of inclusiveness and sustainability.24 Unfortunately, although SDG 17 has again reiterated the international commitment of developed countries to provide 0.7 per cent of their GNI as ODA, aid from OECD Development Assistance Committee (DAC) and non-DAC countries to the region, excluding oil-rich countries that are net donors, declined from around $11 billion in 1990 to $3.3 billion in 2002. Thereafter, it picked up slowly, reaching
Figure 6.4 Four countries show varying revenue and spending choices after civil conflicts
General government total expenditure General government net lending/borrowingGeneral government revenue
Angola605040302010
0-10-20
80706050403020100
2003
2004
2005
2006
2007
2008
2009
2010
2011
2012
2013
Linear (General government gross debt)General government gross debt
Lebanon
1990
1991
1992
1993
1994
1995
1996
1997
1998
1999
2000
605040302010
0-10-20-30-40
160140120100806040200
Rwanda199
4199
5199
6199
7199
8199
9200
0200
1200
2200
3200
4
140
120
100
80
60
40
20
0
25201510
50
-5-10-15
Cambodia
1996
1997
1998
1999
2000
2001
2002
2003
2004
2005
2006
50454035302520151050
20
15
10
5
0
-5
-10
Perce
ntage
of GDP
Gener
al gove
rnment
gross
debt/
GDP (
%)
Perce
ntage
of GDP
Gener
al gove
rnment
gross
debt/
GDP (
%)
Perce
ntage
of GDP
Gener
al gove
rnment
gross
debt/
GDP (
%)
Perce
ntage
of GDP
Gener
al gove
rnment
gross
debt/
GDP (
%)Source: Araji, 2017b, based on data from IMF, 2017f.

105
Rethinking Fiscal Policy for the Arab Region Fiscal Issues in a Context of Conflict
around $9 billion in 2012. In 2013, ODA increased to $16 billion, mainly due to an increase in aid to conflict-affected countries, such as the State of Palestine and the Syrian Arab Republic, and in the light of the increasing number of refugees in neighbouring countries, such as in Jordan and Lebanon. In some Arab countries, ODA represents a sizeable share of foreign capital inflows, but it is unlikely to be sufficient to meet the challenges that these countries face, given recent trends including economic slowdown in advanced countries.25
Aid fluctuations have a detrimental impact on economies. Usually, foreign aid increases significantly right after the end of a war. In Rwanda, ODA reached almost 100 per cent of GDP right after the end of the civil war in 1993 to 1994, and then decreased to less than 10 per cent in five years. The same pattern at a lower extent occurred in Angola, Cambodia and Lebanon.
Three major lessons could be learned. First, the shock of development aid can retard diverse economic activities, especially if aid as a percentage of GDP is significantly high, supply side bottlenecks are present and aid is prolonged for more than two years in the absence of strategic fiscal planning. Second, aid volatility can hold back economic growth.26 Third, in the presence of relatively low institutional quality, development aid could end up wasted on “white elephant” projects and clientelism. In this case, aid would be viewed by policymakers as a substitute for tax revenues.
D. Policy options for different country scenarios
In the wake of a conflict, fiscal policy needs to be carefully calibrated. A policy that is too restrictive can hinder investment and growth, and might even spark additional episodes of
conflict. An overly accommodating policy, on the other hand, might fuel inflationary pressure that crowds out investment and limits structural transformation. Overall, fiscal policy needs to be guided by the principles of inclusion and equity in reconstruction and the transition to development, and grounded in a solid plan of action with the right sequencing of priorities.
1. Fiscal policy in Iraq and Libya
In countries rich in natural resources, such as Iraq and Libya, the focus of fiscal policy in the post-conflict era should encompass macrofiscal stability and sustainability as well as economic structural transformation and reconstruction. Some key ingredients include reactivating and reforming the institutional and legal setting of the fiscal authority, clarity in revenue collection and spending, access to fiscal policy information, detailed public sector checks and balances, and most importantly, fiscal rules defined and protected by law.
Fiscal rules that state the limits and nature of government spending should be implemented to avoid ad hoc policy choices that may not be guided by core reconstruction or development priorities. An example of a viable expenditure rule in a resource-rich country is Botswana’s Sustainable Budget Index, which assesses recurrent expenditures against recurrent revenues to ensure that only a small portion of non-resource revenues are consumed rather than invested in health, education and infrastructure.
Following a strict fiscal rule in conflict-affected countries with hydrocarbon income can be challenging, since such countries need and can to some extent afford immediate humanitarian and consumption spending. To avoid inflationary pressures and other repercussions, urgent humanitarian and consumption needs could be balanced between expenditure in cash and in kind.

106
Furthermore, absorptive capacity constraints in the medium and long term should be taken seriously so that the economy can channel invested funds in the most effective and sustainable ways.
Sovereign wealth funds can provide an option to mitigate volatility and excessive spending if natural resource revenue shocks are high, the economy is resource dependent and absorptive capacity is low. Resource rents could be placed in funds, usually in more efficient financial markets, and only the interest income consumed. As capacity constraints ease, internationally invested funds can gradually move into domestic markets to have a positive impact on the economy and domestic investments.27 Sovereign wealth funds should clearly state the capital inflow-outflow of resource revenues, and the level of public borrowing against the fund. Additional roles are to enhance transparency and accountability, enhance fiscal performance across economic cycles and offer an investment/saving tool for future generations.
Historical fiscal performance for both Iraq and Libya suggests the need for urgent fiscal reforms. For example, the fiscal cost of fuel and electricity subsidies was twice as much as spending on health and education combined in Libya in 2012.28 Looking at the fiscal composition of the Libyan budget, administrative expenses for subsidies account for almost 80 per cent of total government spending; expenditure on capital investments is minimal. Government resources are primarily spent on recurrent expenditures that are non-productive, mainly excessive spending on salaries and wages, to compensate for low private sector employment in a poorly diversified economy.
2. Fiscal policy in the Syrian Arab Republic and Yemen
The key roles of a realistically designed fiscal policy in the Syrian Arab Republic and
Yemen could be reconstructing infrastructure, reactivating pre-war productive sectors and regenerating trade. Spending on such activities could reduce the social and humanitarian consequences of the war, enhance production, boost employment, attract investors and eventually boost economic growth. Fiscal policies should promote structural transformation towards high value added activities that generate additional tax revenues in the long term. Eventually, a well-strategized taxation system can reduce dependence on revenues from natural resources.
In defining socially productive investments,29 fiscal policy could be geared towards those making the greatest contributions to productivity, employment, poverty reduction and gender equality, among other priorities. The process should consider urgent consumption and humanitarian needs as well as longer-term investments in infrastructure, health and education.
E. Main findings
Conflict devastates physical and human capital infrastructure, requiring short- and long-term responses. Short-term aspects include resettling displaced and refugee populations, disarming military groups and working on their reintegration, reducing overall violence, and increasing food security and decent work opportunities. Short-term economic policies should focus on a stable exchange rate and low to moderate inflation to generate a steady flow of government revenues (through taxing business activities), raise government credibility and reduce uncertainty facing donors and investors. For countries rich in natural resources, an additional priority is gaining control of oil production and reducing growth volatility.
Over the long term, the focus should be towards rebuilding and equitably distributing

107
Rethinking Fiscal Policy for the Arab Region Fiscal Issues in a Context of Conflict
physical and human capital, and improving the business environment to crowd in the private sector. Both short-and long-term measures should be aimed at establishing a flow of domestic revenues through taxation, natural resources and/or domestic borrowing to finance reconstruction, and move towards inclusive and sustainable development.
Policy reforms may be required to enhance government effectiveness. In the Syrian Arab Republic and Yemen, fiscal policy reforms should be accompanied with legislative and institutional reforms to widen the existing tax base, reshuffle the tax structure, and increase transparency in tax collection and government spending. This could help to minimize resource leaks, embezzlement and tax evasion. Such reforms are required in both countries but are more pertinent in Yemen due to the fast depletion of natural resources and lower diversity in economic activities, which reduces revenue generation options.
In natural resource-rich countries, reforms should be directed towards more transparency and accountability, and less dependence on resource windfalls. While putting exceptional
efforts into expanding their non-oil sectors, Iraq and Libya should start implementing efficient tax systems. Based on existing institutions and human capital, Iraq has more capacity than Libya to transform to a more diversified economy over time.
Post-war reconstruction is not just a mechanical set of technical decisions. Financing reconstruction, resource distributions and overall economic outcomes depend on settlements to terminate the war and institutions governing the political and the economic apparatus. Relying heavily on international and regional aid is not optimum, because such aid is volatile and not guaranteed for the entire reconstruction period. It is important for urgent humanitarian and reconstruction needs, however, as well as for critical seed money, to propel longer-term development projects. Aid should be steady and follow donor commitments to the SDG 17 target. In addition, countries need to leverage multiple sources of external finance, from the region and beyond, to support long-term development and progress toward the SDGs as a whole.

Making the Most of the Power of Fiscal Policy
7.

Economic models need to be reoriented to deliver not just greater efficiencies, but human development that leaves no one behind.
Economic models need to be reoriented to deliver not just greater efficiencies, but human development that leaves no one behind.

111
Rethinking Fiscal Policy for the Arab Region Making the Most of the Power of Fiscal Policy
Making the Most of the Power of Fiscal Policy
Across the Arab region, fiscal policy reforms can be key drivers of a virtuous cycle of inclusive growth, decent work and poverty reduction. They can guide the smart investments in economic transformation and social capital that many countries must make to attain the SDGs.
The Arab countries share some common fiscal policy concerns. Significant disparities exist as well, and should be factored into any consideration of how to move forward. Broadly, the oil-poor middle-income countries and low-income countries struggle with fiscal sustainability. The oil-rich countries are relatively better off, but face constraints from heavy dependence on oil revenues. Policy considerations are discussed in general for each of these country types, bearing in mind that they must be tailored to specific country contexts.
Fiscal policies have a broad reach across matters related to poverty, economic growth, employment, and a wide array of social and environmental issues. Making best use of the potential power of fiscal choices depends largely on good governance to cement these links, with consideration as well for how fiscal policy can successfully interact with macroeconomic and industrial policy in building dynamic, competitive and inclusive economies.
A. Design fiscal policies to promote economic transformation and decent work
The region needs to overcome the “low productivity trap” to promote inclusive and sustainable economic growth, full and productive employment, and decent work
for all, as envisaged in the SDGs. Appropriate fiscal policy choices can support a structural transformation in economies towards greater productivity and diversification, moving towards non-oil modern sectors or higher-end industry and services. The commitment to achieve the SDGs provides an opportunity for governments to revisit policy choices and take a more proactive stance on diversification and job creation. This is extremely important given the “new normal” in the global economy, brought on by the stagnation of advanced economies.
Two interventions are particularly critical. The first is to boost public investment in strategic sectors that are relatively high in labour intensity, with greater potential for higher value added growth. The second is to invest in infrastructure, human capital, research and development, and innovations that can galvanize economy-wide productivity.
Appropriate fiscal incentives need to aim at diversification to modern sectors, the advancement of higher education and competitiveness in the labour market. For the oil-rich countries, which have more fiscal space, including through sovereign wealth funds, well-designed fiscal policy can diversify investment to modern economic sectors and manage the loss of revenues from commodity price volatility. So far, economic diversification in the GCC has happened mainly in construction, hotels and restaurants, and “other services” that tend to be largely low value added activities flourishing on the back of importing low-skilled labour. This has undermined the growth of manufacturing and modern high-tech sectors, and has hardly contributed to improving absorptive capacity and quality education, both essential for greater productivity and innovation.
7.

112
For the oil-poor countries, governments need to reconsider fiscal policy decisions and coordination with industrial policy in investing in higher productivity sectors, advancing education, and increasing research and innovation. Creating a healthy fiscal space is a bigger challenge for these countries, underscoring the importance of fiscal rules in expenditure and greater emphasis on fair and effective taxation systems. Infrastructure development and investing in human development to overcome limits on absorptive capacity are other areas where governments need to take a leading role.
Identifying new strategic industries is crucial in unblocking latent comparative advantages and generating new employment opportunities. Disaggregated sub-sectoral analysis can help in identifying higher value added and labour-intensive activities for expansion through appropriate policy incentives. Sub-sectoral level information on output, investment and employment, in addition to taxes and subsidies on labour and capital, needs to be developed, as it is not available for most countries in the region. Product space analysis can indicate the potential niche product space of a country’s manufacturing industries, for which firm level data need to be developed.
Fiscal incentives and economic governance reforms are crucial to encourage innovation, competitiveness and export diversification. Many Arab countries have adopted industrial policies in the past, but without achieving structural transformation. Such policies need to be accompanied by investments in infrastructure, human capital and other fiscal incentives, such as taxation on corporate income in non-oil sectors or subsidies provisions within the WTO space. Appropriate checks and balances would encourage genuine innovators and investors, and in general would help to crowd in private investment. These policies should identify and address potential market failures, and award innovation and competitiveness.
The coordination of fiscal policy with monetary and exchange rate policies is particularly important. Overvalued currencies are major impediments to export competitiveness, which the Arab countries need to take into consideration to promote diversification of exports. Fiscal policy coordination among Arab countries, including in customs and corporate tax rates, can also provide a competitive advantage to the countries at the regional level for promoting industrial and trade diversification.
Governments also need to build innovative partnerships with the private sector for job creation. Given the fiscal challenges of the oil-poor countries, it will be difficult for any government to provide employment in the public sector. Greater partnership with the private sector, as well as intraregional cooperation on investment, trade and financing, are crucial issues. Low-income countries require greater assistance in market access, trade, technology and finance for driving structural transformation, as envisaged in the framework of the SDGs and the Istanbul Plan of Action.
So far, some Arab countries have started taking some of these steps. Examples include Saudi Arabia’s Vision 2030 and Egypt’s new programme acknowledging structural reforms and diversification as critical for sustainable long-term development.1
B. Make budget choices to reduce poverty and inequality, and close health, housing and education deficits
Public expenditure on education, health and housing needs to improve considering human development deficits. Spending on health and housing across the region remains largely neglected. While spending on education has been better, leading to progress on the MDG indicators, it has not been enough for mean

113
Rethinking Fiscal Policy for the Arab Region Making the Most of the Power of Fiscal Policy
years of schooling to catch up with the world average. Quality education and higher average years of schooling are important for developing human capital, a knowledge economy and innovation, where the Arab region falls short of other fast-growing regions. Recently, in the oil-poor countries, declining trends in education expenditure, as a share of GDP on average, have posed a concern for advancing education at the level required for transforming economies and societies so that they become more inclusive and prosperous. The region could catch up with the world average of mean years of schooling in six years by increasing public education spending by 1 per cent of GDP, which seems affordable, considering the huge potential for savings from switching expenditure from fuel subsidies and militaries.
Improved expenditure on health is also vital, considering that child and infant mortality rates fell short of the MDG targets in most countries. Several countries face rising infant, child and overall mortality rates due to armed conflict. Stunting, an indication of malnutrition, is prevalent across the region, with the highest rates found in conflict-affected and low-income countries. The region’s unusually high reliance on out-of-pocket expenditure on health poses a financial burden on poor and middle-income households. As a priority, health-care investments should aim at improving the coverage and quality of public services.
Increased expenditure on housing and basic amenities is particularly important considering that deprivation in living conditions is a major contributor to poverty in the region. Further, the projected increase in the number of people living in cities poses problems associated with rapid urbanization, including shortages of decent work, inadequate infrastructure, lack of affordable housing, pollution, slum creation and poverty, among others. So far, expenditure on housing has been stagnant in oil-rich countries at 2 per cent from 1990 to 2014, and declining from 1.3 per cent to 0.6 per cent in oil-poor countries over the same period.
Addressing social policy deficits in existing fiscal policies is important for better targeting and coverage of social protection. Public transfers need to be scaled up considering needs today and in the light of ageing populations in the future. For the region as a whole, high levels of unemployment and informal employment mean that, on average, 67 per cent of the labour force does not contribute to social security. This implies that they may not have access to health insurance and/or a pension system that could provide them with some form of income security in the future. In Jordan, direct public transfers in cash or kind have contributed significantly to reducing poverty and inequality.
Subsidies should not replace public transfers. Subsidies per se are not bad, but they need to be well targeted and avoid replacing public transfers. For instance, social protection expenditure in some countries is influenced by the increase in social assistance in the form of oil subsidies, due to a significant rise in oil prices from 2005 to 2014. Most benefits from oil subsidies accrue to high-income groups, however, while the poor and middle class shoulder a greater tax burden. Several countries have undertaken subsidy reforms recently. Savings now need to be channelled to advancing education, quality housing and health services.
An ambitious response to developmental challenges will demand a new social contract and good governance rooted in equity and justice. The need for a new social contract has been compounded by increasingly constrained fiscal space, and the broad economic and political repercussions of the Arab uprisings. Arab States are increasingly less able to sustain their role as primary providers of employment. At the same time, rising unemployment, projected demands for future jobs and the fact that the private sector is not well developed put heightened pressure on governments to generate decent work. Substantial inequality in education in particular

114
undermines the Arab social contract, and requires the State at a minimum to furnish a level playing field. This is especially important considering that education is one of the main paths to social and economic mobility. Furthermore, increased expenditure on health, housing and basic amenities are heightened concerns of the poor and middle classes in the region, which should draw focused attention from policymakers.
C. Expand and sustain fiscal space by raising revenues
Increase focus on mobilizing revenues rather than cutting productive expenditure. Governments in middle-income countries have mainly relied on borrowing from the IMF to solve debt service challenges. For the next five years, the IMF is encouraging a focus on significant reduction of public expenditure. But in developing economies, where private sector investment is not easy to crowd in, this often leads to economic contraction and low growth in employment that further aggravates development deficits. Governments and the IMF admit the risk of increasing poverty in the short term, but argue that these measures are necessary to move towards medium-term prosperity. Yet some Arab countries have already experienced how these measures can produce a long-term trend of stagnating poverty and social exclusion that has been ongoing since the early 2000s.
Another approach is to award much more attention to mobilizing revenues to build a robust fiscal space. Very little attention has been paid to this in most Arab countries, and if at all, it has been to increase revenues through indirect taxes, such as a goods and services tax or a general value added tax, that are regressive. The potential to harness revenues from a well-strategized taxation system could be significant, given that the tax-to-GDP ratio is lower in most countries than in countries at
similar development levels in other regions. Permanent increases in the ratio of spending-to-GDP will be critical to boosting human capital and bringing about structural transformation.
Make tax systems more fair and progressive, and simplify administrative procedures for better tax compliance in oil-poor countries. Governments need to consider improving tax fairness by establishing more equitable, progressive and transparent systems that clearly rationalize exemptions. Given growing inequality and the relatively low tax burden on the top income decile, much less the richest 1 per cent of people in several countries, there is clear room for improvement. Experience from other countries shows that this is possible if there is political will.
Even among lower-income countries, direct tax collection could increase by 2 per cent to 4 per cent of GDP. Estimates for the oil-rich countries indicate that a 5 per cent value added tax rate could generate fiscal revenue of 2 per cent of GDP.2 Optimal tax rates may vary from country to country, but evidence suggests that fiscal policy that promotes progressive taxation and social benefits is consistently associated with lower inequality in terms of disposable income.3
Property tax can be an effective tool to increase revenue and improve equity.4 Currently, these taxes are low and largely evaded. One of the important benefits of a well-designed property tax or wealth tax would be to dampen rent-seeking and speculative activities, and channel funds to more productive investments.
Poor tax records and complex tax procedures complicate tax compliance and tax fairness analysis.5 Improving tax and customs administration, simplifying coding and regulation, and investing in technology to improve transparency can enhance compliance and increase the potential tax base. This would require upfront investment in administrative infrastructure, but over a period, better tax

115
Rethinking Fiscal Policy for the Arab Region Making the Most of the Power of Fiscal Policy
administration would back a broader culture of tax compliance in addition to greater revenues. One way to improve transparency and accountability is the filing of income tax by every citizen, even if not everyone would actually pay tax – an approach encouraged recently in India.6
Take steps to control tax evasion, tax avoidance and illicit financial flows. Illicit outflows from the Arab region outstripped the combined inflows of foreign direct investment and ODA in 2014 and 2015.7 Trade misinvoicing constituted a significant leakage, amounting to about 68 per cent of cumulative illicit flows between 2011 and 2015. In addition to national tax reforms, a global standard for information exchange needs to be adopted to tackle illicit financial flows as well as cross-border tax evasion and tax avoidance.
In oil-rich countries, diversify revenue sources to manage volatility and sustain growth. This can improve fiscal room and strengthen macroeconomic stability. Tax and non-tax incentives can support economic diversification and increase revenues for social development.
D. Harness public expenditure management for inclusive and sustainable development through better quality governance
The quality of governance matters for the effectiveness of public expenditure and fiscal management. Poor governance, which manifests itself in weak institutions and lack of adherence to fiscal rules, adversely affects the equity and efficiency of both the allocation of government expenditure and the mobilization of revenues. Budgeting and planning institutions matter for rule-based fiscal policy. In general, countries with strong institutions have been more successful in delivering on
fiscal adjustments and better able to come up with credible fiscal plans. Where institutions and checks and balances are weak, they may fail to limit the discretionary and procyclical nature of fiscal policy.
The quality of governance matters for human development. There is a strong association between governance, fiscal rules and human development. Public expenditure on health contributes more effectively to child survival in countries with good governance, for instance, and has a stronger impact on life expectancy than private health expenditure. This underlines the crucial role of effective and appropriate allocations of resources to intended targets, towards the goal of human development and under the framework of social inclusion principles. Increasing public expenditure on health and education without necessary governance reforms is otherwise unlikely to lead to improved outcomes.
Set and implement rules for public expenditure with clarity on medium- and long-term objectives. Since 2008, multiple events have prompted increased uncertainties in spending in most Arab countries, resulting in major swings in expenditure trends and mounting debt. The uncertainties are likely to persist in a business-as-usual scenario, given multiple challenges, including crises, low oil prices, debt sustainability and the slowdown in global growth. Towards promoting inclusive and sustainable development, countries should establish medium-term fiscal frameworks, and set and implement public expenditure rules to guide budget decisions, contribute to fiscal discipline, and support countercyclical policies, such as in Chile.
In addition, countries need to coordinate fiscal and monetary rules for arriving at a debt-stabilizing primary balance so that debt as a share of GDP does not increase beyond a sustainable limit. Estimates show that the debt-stabilizing primary balance ratio needs to be higher than the actual primary balance ratio

116
in all low- and middle-income countries of the region that are at high debt levels. Furthermore, any positive shock to interest rates and growth rates would deteriorate debt ratios.
Better economic institutions are needed to manage tax policy, provide better data and monitoring, and improve transparency. Major shortfalls persist in time series data on disaggregated government expenditure in Arab countries. Available data do not allow a comprehensive estimate of social spending, confining this report, for example, to considering only health, education, housing and social protection expenditures, for selected countries. The fact that oil subsidies are considered within the social protection component of social expenditure in certain countries further distorts the data on social spending, given that not all fuel subsidies are targeted to households. Data on pensions, social security measures and other forms of assistance that are driven by social policies are mostly absent. A crucial step for governments would be to take account of social expenditure more systematically.
E. Orient fiscal policy towards peace and development in post-conflict countries
ODA commitments should be honoured, and aid flows kept steady during the reconstruction and development phase. The commitment to a minimum provision of ODA was reiterated in the 2030 Agenda. Given past shortfalls and volatility in aid, however, relying heavily on it may not be optimum or sufficient, given the scale of funds needed for reconstruction. Alternative sources of financing could come from a secure flow of domestic revenues through taxation reforms, natural resources and/or domestic borrowing, while paying due attention to medium- and long-term debt sustainability.
Create fiscal policy frameworks that support reconstruction and diversification in natural
resource rich countries. In countries rich in natural resources, such as Iraq and Libya, natural resource revenues make up over 90 per cent of government revenues. Given this, any fiscal regime for the post-conflict era should include objectives such as macrofiscal stability, fiscal sustainability and pro-economic diversification expenditures, along with spending on reconstruction. Fiscal rules should guide expenditures and resource prices to fully cope with reconstruction and development plans as well as price fluctuations. In case of revenue shocks, excess resources could be allocated to sovereign wealth funds and gradually invested domestically in tandem with expanding macroeconomic absorptive capacity.
Focus on reconstructing infrastructure, reactivating pre-war productive sectors and furthering diversification in the Syrian Arab Republic and Yemen. Restarting economic growth engines could help to generate additional government revenues especially in the Syrian Arab Republic and Yemen, which have tax regimes mainly dependent on corporate and income taxation, with minimum contributions through indirect taxation. Governments in such countries can prioritize sectors based on productivity, employment, poverty reduction and contribution to gender equality, among other considerations, in line with appropriate fiscal rules. Prioritization should consider urgent consumption and humanitarian needs in the short term, as well as longer-term investments in infrastructure and human capital.
The common denominator for all revenue-generating activities is improved governance quality and major reforms in public financial management. Peace is the bedrock of development. Reactivating fiscal institutions, and reforming the institutional and legal settings of existing fiscal administration can enhance government effectiveness in conflict-affected countries. The Syrian Arab Republic and Yemen require major legislative and
117
Rethinking Fiscal Policy for the Arab Region Making the Most of the Power of Fiscal Policy
institutional reforms to widen their existing tax bases, reshuffle their tax structure and increase transparency in tax collection and government spending. This will increase tax collection and reduce embezzlement, tax evasion, tax avoidance and tax favouritism, which otherwise might deter reconstruction, and compromise security and stability.
Historical fiscal performance in both Iraq and Libya also dictates urgent reforms to reach more resilient and economically sustainable growth. A progressive fiscal regime requires reactivating and reforming oil and gas revenue management, and achieving additional transparency in licensing, national budgeting and the management of sovereign wealth funds. Checks and balances should manage revenue collection and spending, and most importantly, fiscal rules should be defined and protected by law.
Regaining the path to sustainable development. The new era of the 2030 Agenda and the SDGs ushered in a renewed emphasis on the role of the State in steering economic and social transformation that is fully inclusive and sustainable. Agreed in the wake of the 2008 economic crisis, with its effects still rippling across the Arab region today, the Agenda was in part a call for countries around the world to rethink fiscal policy.
The Arab region has followed past models of pro-market economic policymaking, adopted from the Washington Consensus. At the same time, it has attempted to maintain a social contract premised on providing essential services to its peoples. This often contradictory combination has now reached a breaking point. Economic models need to be reoriented to deliver not just greater efficiencies, but human development that leaves no one behind. Only vibrant and productive economies can underpin a new social contract that provides everyone with the full range of capabilities and opportunities needed to thrive.
The region can learn from its own past experience and from those elsewhere in using fiscal policy to address key concerns, such as investing in industrial development; advancing education, research and innovation; providing social protection; and mobilizing revenues, taking into account equity and justice in taxation systems.
Transformation in the Arab region will not happen automatically or overnight. But if the vision is to achieve the 2030 Agenda and the SDGs, and a region that is both prosperous and peaceful, transformation is no longer an option. It is an imperative, one that should guide all choices and actions to regain the path to sustainable development.


119
Chapter 11. Ali, 2014.2. This report uses “decent work” to be
consistent with the terminology of the Sustainable Development Goals (SDGs). Decent work sums up the aspirations of people in their working lives. It involves opportunities for work that is productive and delivers a fair income, security in the workplace and social protection for families, better prospects for personal development and social integration, freedom for people to express their concerns, organize and participate in the decisions that affect their lives and equality of opportunity and treatment for all women and men. See http://www.ilo.org/global/topics/decent-work/lang--en/index.htm.
3. United Nations Economic and Social Commission for Western Asia (ESCWA), 2016a.
4. The terms “oil-rich” and “oil-poor” are used only to distinguish countries within the Arab region on the basis of their share of revenues from oil resources. The terminology may not be applicable globally. A country may have high oil resource revenues, but if the share is lower than non-oil revenues, the country would be categorized as oil-poor by the report’s definition. Such a country is not typical in the Arab region.
5. The Syrian Arab Republic has a relatively large oil sector, but its contribution to gross domestic product (GDP) is not large enough to qualify the country as oil-rich. Further, its oil revenues are not sustainable in the long term. Lebanon’s findings of oil mines can make it potentially oil-rich in the near future, but at present the country does not report any revenue from oil and gas.
6. The major source of revenue of Yemen is currently the oil sector. However, the country faces severe development challenges, which supersede the available fiscal space that can be derived from oil. Oil reserves also may be exhausted in the short or near medium term.
7. A large number of studies support the result that the fiscal multiplier for capital expenditure has stronger long-term impacts than the fiscal multiplier for current expenditure. See Abdih and others, 2010;
Ilzetzki, Mendoza and Vegh, 2013; Bose and Bhanumurthy, 2015; Sarangi, Bhanumurthy and Abu-Ismail, 2015.
8. ESCWA, 2016a.9. Beherman, 1993, 1996; Ranis and Stewart,
2005.10. The response to the recent global economic
crisis has differed from the past in that about half of the countries responded countercyclically in 2009 (Abdih and others, 2010).
11. Elbadawi and Soto, 2011.12. Blanchard and Perotti, 2002.13. Sarangi, Bhanumurthy and Abu-Ismail, 2015. 14. Sarangi and El Ahmadieh, 2017.
Chapter 21. Hausmann and Rodrik, 2003. Interventions
tend to create distortions in the market. By imposition of policy disciplines, such as encouraging investment in modern sectors ex ante, and also by rationalizing production ex post, government policies can counteract possible market distortions.
2. Lin and Monga, 2010.3. See a discussion in Lin, 2012.4. Herrendorf, Rogerson and Valentinyi, 2013.5. Ibid.; Duarte and Restuccia, 2010.6. Commission on Growth and Development,
2008. 7. United Nations, 2015. Also see https://
sustainabledevelopment.un.org/sdg8.8. United Nations Development Programme
(UNDP), 2016.9. ESCWA, 2016a.10. Von Arnim and others, 2011.11. Sarangi, 2015.12. ESCWA, 2013. 13. International Labour Organization (ILO),
2016.14. See the challenges of preparing time
series employment data at subsector level in Sarangi, 2015; Sarangi, Abu-Ismail and Gantner, 2017.
15. United Nations, Statistics Division, 2016.16. ILO and UNDP, 2013.17. ESCWA, 2012.18. The growth rates here are compound
annual growth rates at two points of time, due to the lack of time series information on employment across sectors. See Sarangi, Abu-Ismail and Gantner, 2017.
19. Sarangi, Abu-Ismail and Gantner, 2017,
based on data from United Nations, Economic and Social Commission for Western Asia and Arab Industrial Development and Mining Organization, 2017.
20. McMillan and Rodrik, 2011.21. Sarangi, Abu-Ismail and Gantner, 2017.22. Morsy, Levy and Sanchez, 2015.23. ESCWA, 2013.24. Malik, 2016; Selim and Zaki, 2014; Elbadawi
and Soto, 2011; McMillan and Rodrik, 2011; Nabli, Keller and Veganzones, n.d.
25. See the scoping note prepared by IMF staff on investment and growth in the Arab world for the Annual Meeting of Arab Finance Ministers, April 2016 (available from https://www.imf.org/external/np/pp/eng/2016/050216.pdf).
26. Ibid.27. ESCWA, 2013.28. Devarajan, Swaroop and Zou, 1996; Sala-i-
Martin and Artadi, 2003.29. Cavallo and Daude, 2011. 30. Sala-i-Martin and Artadi, 2003.31. ESCWA, 2017a.32. Mohnen and Hall, 2013; Cameron, 1998.33. Sarangi, Abu-Ismail and Gantner, 2017. 34. McMillan and Rodrik, 2011.35. The section is influenced by the work of
Lin, 2012. 36. Tools like value chain analysis or product
space analysis (see Bustos and Yildirim, 2017a, for Egypt), and the growth diagnostic framework suggested by Hausmann, Rodrik and Velasco, 2005 may be used.
37. See the comments by Stigliz on chapter 1 in Lin, 2012; and Ahluwalia, 1973.
38. Bustos and Yildirim, 2017a.39. Bustos and Yildirim, 2017b.40. Schiffbauer and others, 2015.41. ESCWA, 2015a.42. Ibid.43. Ibid.44. ESCWA, 2013.45. El-Anshasy, Mohaddes and Nugent, 2017.46. Rodrik, 2004.47. ESCWA, 2016a.
Chapter 31. Ranis and Stewart, 2005.2. Kakwani, Khandker and Son, 2004; Son
and Kakwani, 2008. Also see alternative arguments by Dollar and Kraay, 2002; Dagdeviran, Van der Hoeven and Weeks,
Endnotes

120
2001; International Monetary Fund (IMF), 2017b.
3. Roy, 2014.4. ESCWA, 2014b. 5. Organisation for Economic Co-operation
and Development (OECD), 2016.6. Diwan and Akin, 2015. 7. World Bank, 2004. 8. Sarangi and Bonin, 2017; Selim and Zaki, 2014.9. Zein, 2017.10. OECD, 2016.11. Sarangi and Bonin, 2017.12. OECD, 2016, 2017.13. ESCWA, 2014a.14. Sarangi and Bonin, 2017.15. Egypt, Economic Ministerial Committee,
2015.16. League of Arab States, 2017.17. ESCWA and others, 2017. The living
conditions measure includes floor and roof material, water, sanitation, overcrowding, cooking material and connection to electricity.
18. ESCWA, 2014b. 19. Hegarthy, 2017.20. According to the IMF, the direct effect of
subsidies is called pre-tax subsidies. It does not include the indirect effects, such as the externalities associated with the overconsumption of products induced by low prices. Such additional costs include the additional pollution, global warming, congestion, road damage, road accidents and foregone tax revenue associated with overconsumption, compared with the amount that would be consumed if products were supplied at cost (see Hegarthy, 2017).
21. See the discussion on the review of energy subsidies in Zein, 2017.
22. Gelil and Saab, 2015.23. International Monetary Fund (IMF), 2017b.24. Kakwani, Khandker and Son, 2004.25. Diwan and Akin, 2015.26. Sarangi and Bonin, 2017.27. Lustig, Pessino and Scott, 2013.28. Lustig and Higgins, 2013. See the details for
the Jordan study in Sarangi, Bhanumurthy and Abu-Ismail, 2015.
29. The income concepts are computed according to the methodology of Lustig and Higgins, 2013. Post-fiscal income is normally derived by adding indirect subsidies and deducting indirect taxes to disposable income. Data on indirect subsidies received by households were not available for Jordan, however. Therefore, the post-fiscal income here is calculated by deducting indirect taxes from disposable income.
30. Sarangi, Bhanumurthy and Abu-Ismail, 2015. Poverty rates in the Arab countries vary very much depending upon the choice of poverty line. The estimations for Jordan
are based on poverty rates according to the national poverty line.
31. Sarangi, Bhanumurthy and Abu-Ismail, 2015.32. Ibid.33. Ibid.34. Assouad, 2017.35. Assouad, 2015.36. Ibid.37. Sarangi, 2016.38. ESCWA, 2017d. 39. See detailed methodology in Sarangi and
Bonin, 2017.40. United Nations and League of Arab States,
2013.41. Ibid.42. Sarangi and Bonin, 2017.43. United Nations and League of Arab States,
2013.44. The government effectiveness index of the
Worldwide Governance Indicators captures perceptions of the quality of public services, the quality of the civil service and the degree of its independence from political pressures, the quality of policy formulation and implementation, and the credibility of the government’s commitment to such policies (World Bank, 2016).
45. The quality of life at an older age tends to decline. Irrespective of assessing the quality of life, living longer is rational to human beings, and a good health system can support people to live longer and in good health (Nussbaum and Sen, 1993).
46. United Nations and League of Arab States, 2013.
47. Sarangi and Bonin, 2017.
Chapter 41. There is no unique definition of fiscal
space. The World Bank and International Monetary Fund Development Committee (2006) illustrated fiscal space as a diamond that has four crucial dimensions: revenues, borrowing, aid and expenditure efficiency. The discussions of financing the SDGs have broadened the discussion on fiscal space in terms of its scope (such as harnessing private finance) and enablers (such as trade, technology, capacity building and systemic issues, among others). See Development Committee, 2006.
2. Chudik and others, 2017; IMF, 2015; Reinhart and Rogoff, 2010.
3. The raise of interest rates (three times in 2017) by the United States Federal Reserve and a stronger US dollar versus domestic currencies increased the cost of foreign currency denominated external debt (Moyo, 2017).
4. Seigniorage is another instrument in the hands of governments to finance deficits, but without a proper strategy, it can cause
inflation to skyrocket. The Government of Lebanon resorted to seigniorage from 1989 to 1991 and consequently the inflation rate, which was already high at 100 per cent in 1989, jumped to 490 per cent in 1991. This ultimately led to exchange rate depreciation and a currency crisis in 1991 (Neaime, 2015).
5. General government gross debt, as defined by the IMF, consists of all liabilities that require payment or payments of interest and/or principal by the debtor to the creditor at a date or dates in the future. It includes debt liabilities in the form of special drawing rights, currency and deposits, debt securities, loans, insurance, pensions and standardized guarantee schemes, and other accounts payable.
6. The estimated average for the oil-rich countries includes Iraq and Libya, which reported significantly higher debt in recent years than countries of the Gulf Cooperation Council (GCC).
7. IMF, 2016a.8. See https://www.swfinstitute.org/sovereign-
wealth-fund-rankings.9. External debt total refers to debt owed to
non-residents repayable in currency, goods or services. Total external debt is the sum of public, publicly guaranteed and private non-guaranteed long-term debt, use of IMF credit and short-term debt.
10. External debt stock, public and publicly guaranteed debt, refers to the long-term external obligations of public debtors, including the national government, political subdivisions (or an agency of either) and autonomous public bodies, and external obligations of private debtors guaranteed for repayment by a public entity.
11. They include Egypt, Jordan, Lebanon, Morocco and Tunisia.
12. Concessional debt is defined as loans with an original grant element of 25 per cent or more. Concessional external debt conveys information about the borrower’s receipt of aid from official lenders at concessional terms as defined by the Development Assistance Committee (DAC) of the OECD (World Bank, 2017a).
13. Long-term external debt is defined as debt that has an original or extended maturity of more than one year and that is owed to non-residents and repayable in currency, goods or services.
14. Most of the new debt commitments in Tunisia are either with official creditors or backed by a third-party guarantee, except for a $1 billion Eurobond issued in January 2015 and a €850 million Eurobond in February 2017.
15. Lebanon’s total external debt to GDP is estimated at 175 per cent in 2015 if the non-

resident deposits in the banking sector are taken into account (IMF, 2017c).
16. IMF, 2016c, 2017d, 2017e.17. The averages of external debt indicators are
based on the International Debt Statistics (IDS). For the Sudan, the IDS external debt reports are consistently lower in value than those reported by IMF Article IV assessments. For example, according to the IDS, the Sudan’s external debt stock was about $21.5 billion in 2015 (26 per cent of GDP), as against $50 billion (61 per cent of GDP) reported by IMF Article IV 2016. This data discrepancy has not been resolved. This report used the IDS data source for all countries for the purpose of consistency. It may be noted that in applying the 61 per cent debt-to-GDP ratio for the Sudan, the average ratio for the low-income countries would be 49 per cent in 2015.
18. The World Bank’s International Development Association Resource Allocation Index is based on the results of the annual country policy and institutional assessment exercise, which covers the International Development Association-eligible countries. Country performance is assessed against a set of 16 criteria grouped into four clusters: economic management, structural policies, policies for social inclusion and equity, and public-sector management and institutions.
19. See the World Bank in Sudan (http://www.worldbank.org/en/country/sudan/overview).
20. Abed and Davoodi, 2003. 21. Total reserves comprise holdings of
monetary gold, special drawing rights, reserves of IMF members held by the IMF and holdings of foreign exchange under the control of monetary authorities.
22. The exchange rate also influences external debt sustainability. According to some studies, a flexible exchange rate may adjust to external shocks and, therefore, can reduce the likelihood of an external debt crisis. When the exchange rate is fixed, monetary policy will be subordinated to defend the exchange rate peg, and it is unlikely to absorb external shocks, which increases the likelihood of a crisis. Reinhart (2002) analysed debt and exchange rate crises in 59 countries over the period 1970 to 1999. She observed that 84 per cent of all default episodes followed within 24 months of currency crises, while 66 per cent of all currency crises in the developing country subgroup sample followed within 24 months of debt defaults. There can be ways for optimizing a government’s choice to alter an exchange rate peg along with other fiscal instruments in a given context
(Obstfeld, 1996). These are lessons to learn particularly for Egypt since it went through a significant adjustment in its exchange rate in November 2016. Other countries in the region have pegged their currencies either to the dollar or to a basket of currencies, rendering monetary policy essentially ineffective.
23. The Keynesian view suggests that fiscal deficits would significantly influence deficits in the current account through upward pressure on interest rates and consequently exchange rate appreciation (Mundell, 1963; Haug, 1991). The Ricardian Equivalence Hypothesis suggests that budget deficits do not result in current account deficits (Barro, 1989). In other words, changes in government revenues or expenditures have no real effects on the real interest rate, investment or the current account balance.
24. Khalid and Guan, 1999; Neaime, 2015.25. The capital account surpluses in Lebanon
can turned into deficits quickly if for some reason there is a capital flow reversal. See discussion in Neaime, 2015.
26. IMF, 2017a.27. See methodological note in Sarangi and
El-Ahmedieh, 2017.28. A great deal of analysis of this literature is
in Adams, Ferrari and Park, 2010; and Jha, 2012.
29. IMF, 2003; Wyplosz, 2007.30. Bohn (2007) strongly argued that “time
series tests are incapable of rejecting sustainability. The intertemporal budget constraint proves to be satisfied if either the debt series or the revenue and with-interest spending series are integrated of arbitrarily high order, i.e., stationary after differencing arbitrarily often. Revenues and spending do not have to be cointegrated. Rejections of low-order difference-stationarity and of cointegration are thus consistent with the intertemporal budget constraint” (p. 1837).
31. Gali and Perotti, 2003; Celasun, Debrun and Ostry, 2007; Ferrarini, Jha and Ramayandi, 2012; Ghosh and others, 2013 (among others).
32. In the context of fiscal policy in the United States, Bohn (1998) raised some straight questions to understand the behavior of government’s response to rising debt levels, such as “How do governments react to the accumulation of debt? Do they take corrective measures when the debt to GDP ratio starts rising or do they let it grow?”. He observed that “one can find direct evidence of corrective actions by examining the response of the primary (noninterest) budget surplus to changes in debt-income ratio” (p. 949). This seminal piece of work
became popular in the form of estimating “fiscal reaction functions” to assess fiscal prudence.
33. Ghosh and others, 2013 found similar results for a sample of 23 advanced countries during the period 1970 to 2007. In other middle countries, such as in Asia, the coefficient ρ is found to be positive and significant (Adams, Ferrari and Park, 2010; Ferrarini and Ramayandi, 2012).
34. A general framework of sustainability or a “no-ponzi game condition” takes the following identity: , where r is the discount factor between periods , which is defined as , and is terminal or very long-term debt. The initial notion is that debt is sustainable if , discounted at a positive rate, approaches zero as T becomes arbitrarily large. Dynamic sustainability therefore requires that the present value of all primary surpluses matches the value of the current debt stock (Adams, Ferrari and Park, 2010).
35. The “modified golden rule” efficiency condition is that the interest rate and growth differential (IRGD) should turn out to be positive eventually for any economy close to a steady state. As long as the IRGD is negative and the debt-to-GDP ratio is falling, rational agents will have the incentive to borrow at low interest rates and finance higher consumption and rollover debt (Blanchard and Fischer, 1989). See also Escolano, 2010.
36. The interest rate refers to the effective rate of interest, based on interest paid on debt stock (IMF Article IV Consultation).
37. The negative debt-stabilizing primary balance may also mean that the interest rate doesn’t represent the true cost of capital, as argued by Escolano, Shabunina and Woo, 2011.
38. See the modified golden rule efficiency condition of Blanchard and Fischer, 1989.
39. The economies of Morocco and Tunisia remain more resilient than those of other middle-income countries among the oil-poor countries.
40. Islam and others, 2012.41. Tax buoyancy is calculated by regressing
the log of tax revenues on the log of the GDP (tax base), deflated by the consumer price indices of each country, for the period 1990 to 2014.
42. The corporate income tax rate in the United Arab Emirates goes up to 55 per cent, the highest in the world. Although the corporate tax rate is to be levied on all companies, in practice, tax is only enforced on foreign oil companies engaged in upstream petroleum activities and branches of foreign banks (PwC, 2015).
121
122
43. IMF, 2014a.44. Saudi Arabian Monetary Agency, 2016.45. Sarangi, 2016.46. Van der Weide, Lakner and Ianchovichina,
2016.47. Sarangi, 2016.48. Sarangi, Bhanumurthy and Abu-Ismail, 2015;
Assouad, 2016.
Chapter 51. Desai, 1991.2. Elbadewi and Soto, 2011.3. See http://info.worldbank.org/governance/
wgi/#home.4. See for example Baldacci and others, 2004;
Mauro, 1998; Gupta, de Mello and Sharan, 2001; Abed and Gupta, 2002.
5. ESCWA, 2016a.6. The voice and accountability index captures
perceptions of the extent to which a country’s citizens are able to participate in selecting their government, as well as freedom of expression, freedom of association, and a free media. The rule of law index captures perceptions of the extent to which agents have confidence in and abide by the rules of society, and in particular the quality of contract enforcement, property rights, the police, and the courts, as well as the likelihood of crime and violence.
7. The Governance Index (GI) is constructed by using the Human Development Index (HDI) methodology, taking into account voice and accountability and the rule of law. See Abu-Ismail, Kunčič and Sarangi, 2016.
8. Pritchett, 1996.9. Rajkumar and Swaroop, 2008.10. Neumayer, 2004; Cavalcanti, Mohaddes and
Raissi, 2011.11. Kolstad and Søreide, 2009.12. Slimane and Tahar, 2010.13. Selim and Zaki, 2014.14. El-Anshasy, Mohaddes and Nugent, 2017.15. Kamaly and El-Said, 2017.16. Ibid.17. Tornell and Lane, 1999; Fatas and Mihov,
2001; Lane, 2003.18. Imam and Jacobs, 2007.19. Torgler, 2005; Alm and Torgler, 2006; Bird and
Martinez-Bazquez, 2008.20. Kamaly and El-Said, 2017.21. Alesina and Perotti, 1999; Person and
Tabellini, 2004.22. Frankel, Vegh and Vuletin, 2011; Elbadawi,
Schmidt-Hebbel and Soto, 2015.23. Cordes and others, 2015.24. Elbadawi and Soto, 2011.25. Ibid.26. Gupta and Ylaoutinen, 2014; IMF, 2014c.27. IMF, 2014c.28. Ibid.29. Gupta and Ylaoutinen, 2014.
30. Budlender and Hewitt, 2002.31. United Nations Population Fund and United
Nations Development Fund for Women, 2006.32. Ibid.33. Elson, 2002.34. United Nations Population Fund and United
Nations Development Fund for Women, 2006.
35. See chapter 3, figure 3.2 of the present report.
36. ESCWA, 2016b.37. Ibid.38. Stotsky, 2016.39. Ibid.40. IMF, 2017a.41. Ibid.42. Esim, 2011.43. See http://jordan.unwomen.org/en/
what-we-do/increasing-accountability-in-financing-gender-equality/initiative1/success-stories/advancing-gender-responsive-budgeting-in-jordan.
44. Grown, 2006.
Chapter 61. Provided satellite images for conflict-
affected countries show mainly property destruction, without providing more information on types of property that might be associated with different costs.
2. IMF predictions prior to the outbreak of the civil war in Libya, the Syrian Arab Republic and Yemen, and the rise of extremist groups.
3. ESCWA, 2016b. 4. The Syrian Center for Policy Research
(2015) estimated the Syrian Arab Republic’s total economic loss since the start of the conflict at $202 billion by the end of 2014, equivalent to 383 per cent of the 2010 GDP in constant prices. Ianchovichina and Ivanic (2016) found GDP had declined by 30 per cent due to the war. Gobat and Kostial (2016) found that GDP contracted in real terms by 57 per cent between 2010 and 2015.
5. Confidential report largely reported on in the press (see for example Bayoumy, 2016).
6. Ianchovichina and Ivanic, 2016.7. ESCWA, 2016b.8. The loss in government revenues was
estimated in two steps. First, the level of government revenues that could have been generated if these countries did not experience a war after 2010 was estimated by using the IMF 2010-2015 projections of tax revenues as a percentage of GDP and natural resource rents as a percentage of GDP. Second, realized GDP between 2010 and 2015 was used to calculate tax revenues as a percentage of GDP and natural resource rents as a percentage of GDP. The difference between the predicted and actual revenues gives the total loss
during 2010 to 2015.9. Oil and gas represent one fourth of
government revenues in the Syrian Arab Republic. Losses in government revenues are based on estimates by the National Agenda for the Future of Syria Programme.
10. Bulíř and Hamann, 2007. 11. IMF, 2017g.12. Aiyar, Berg and Hussain, 200513. The term originally describes the impact
of natural resource revenues on the Dutch manufacturing sector but has come to be used as a general term to describe the situation of most natural resource-rich countries. In the presence of foreign aid, the diagnoses are valid with or without hydrocarbon income, especially in aid-dependent States. This is relevant in Afghanistan, Burundi, Liberia, Malawi and the State of Palestine.
14. Associated with intersectoral policy priorities.
15. See https://www.imf.org/external/np/country/notes/yemen.htm.
16. Addison and Mansoob Murshed, 2001.17. Ibid.18. Ibid. The data set used in the analysis
included all violent incidents in oil-rich and oil-poor countries at different development stages around the world, categorized by the type of incident, the year of activity, involved States, government involvement in case of civil conflict, etc.
19. Gupta and others, 2003.20. This was evident in Lebanon.21. Natural resource revenues in Angola
accumulated to up to 60 per cent of GDP in 2005.
22. According to the IMF Article IV report in 2014 (IMF, 2014b), Angola is one the most unequal nations in Africa, where the top 10 per cent of income earners control almost one third of the national income, the poverty headcount ratio is above 37 per cent. The poverty headcount increases significantly in rural areas. One would assume that the post-conflict era would witness a drastic change in HDI, but the shift was marginal in Angola. The HDI started at 0.415 in 2003 and increased by only 27 per cent in 10 years to reach 0.52 in 2013.
23. Araji and others, 2017.24. Post-war international aid is also used to
build the post-war institutional framework. According to Gupta and others (2003), governments could use aid to rebuild damaged institutions that foster the resumption of economic activities and the effective absorption of additional aid inflows.
25. ESCWA, 2016a. 26. One could measure the relation between
the volatility of economic growth and aid by

123
looking at the correlation between standard deviations of GDP growth and the change of official development assistance.
27. Araji, 2017b.28. IMF, 2013.29. Addison and Ndikumana, 2001.
Chapter 71. IMF, 2017a; also see http://vision2030.gov.sa/en.2. ESCWA, 2017d.3. Woo and others, 2013. 4. Alvaredo and Picketty, 2014.5. Ibid.
6. See https://www.ft.com/content/745c2eb8-7c29-11e7-9108-edda0bcbc928.
7. ESCWA, 2017a.


125
Abdih, Y., and others (2010). The cyclicality of fiscal policy in the Middle East and Central Asia: is the current crisis different? Working Paper, WP/10/68. Washington, D.C.: International Monetary Fund (IMF).
Abed, G. T., and H. R. Davoodi (2003). Challenges of Growth and Globalization in the Middle East and North Africa. Available from https://www.imf.org/external/pubs/ft/med/2003/eng/abed.htm.
Abed, G. T., and S. Gupta, eds. (2002). Governance, Corruption & Economic Performance. Washington, D.C.: IMF.
Abdel Gelil, I., and N. Saab, eds. (2015). Arab Environment 8: Sustainable Consumption for Better Resource Management. Beirut: Arab Forum for Environment and Development.
Abu-Ismail, K., A. Kunčič, and N. Sarangi (2016). Governance-adjusted Human Development Index: the case for a broader index and its implications for Arab States. Working Paper, E/ESCWA/EDID/2016/WP3. Beirut: Economic and Social Commission for Western Asia (ESCWA).
Abu-Ismail, K., A. Mustafa, and M. Vernengo (2004). Trade and industrial strategies for poverty reduction in Syria. Mimeo.
Acemoglu, D., and J. Robinson (2012). Why Nations Fail: The Origins of Power, Prosperity, and Poverty. New York: Crown Publishers.
Acemoglu, D., S. Johnson, and J. Robinson (2001). The colonial origins of comparative development: an empirical investigation. American Economic Review, vol. 91, No. 5 (December), pp. 1369-1401.
Adams, C., B. Ferrari, and D. Park (2010). Fiscal sustainability in developing Asia. Economics Working Paper Series, No. 205. Manila: Asian Development Bank (ADB).
Addison, T., and L. Ndikumana (2001). Overcoming the fiscal crisis of the African State. Discussion Paper, No. 2001/12. Helsinki: World Institute for Development Economics Research (WIDER).
Addison, T., and S. Mansoob Murshed (2001). The fiscal dimensions of conflict and reconstruction. Discussion Paper, No. 2001/49. Helsinki: WIDER.
Ahluwalia, M. (1973). Tax, subsidies, and employment. The Quarterly Journal of Economics, vol. 87. No. 3 (August), pp. 393-409.
Aiyar, S., A. Berg, and M. Hussain (2005). The macroeconomic challenge of more aid. Finance and Development, vol. 42, No. 3, pp. 28-31.
Alesina, A., and R. Perotti (1999). Budget deficits
and budget institutions. In Fiscal Institutions and Fiscal Performance, J., Poterba and J. Hagen, eds. Chicago: Chicago University Press.
Alesina, A., G. Tabellini, and F. Campante (2008). Why is fiscal policy often procyclical? Journal of the European Economic Association, vol. 6, No. 5, pp. 1006–1036.
Ali, A. (2014). On social justice and public spending policies in the ‘Arab Revolution States’. Arab Center for Research and Policy Studies, Research Paper. Available from https://www.dohainstitute.org/en/ResearchAndStudies/Pages/On_Social_Justice_and_Public_Spending_Policies_in_the_%E2%80%98Arab_Revolution_States.aspx.
Alm, J., and B. Torgler (2006). Culture differences and tax morale in the United States and in Europe. Journal of Economic Psychology, vol. 27, pp. 224-246.
Alvaredo, F., and T. Picketty (2014). Measuring top incomes and inequality in the Middle East: data limitations and illustration with the case of Egypt. Working Paper, No. 832. Giza: Economic Research Forum.
Arab NGO Network for Development (2017). Repercussions of tax policies in the Arab region. Policy Brief. Beirut.
Araji, S. (2017a). Fiscal policy considerations for post war reconstruction in Iraq, Syria, Yemen and Libya. Technical Paper, E/ESCWA/EDID/2017/Technical Paper.14. Beirut: ESCWA.
__________ (2017b). Natural resource revenues: effect on the pattern of domestic investments relative to international assets investments. International Economics and Economic Policy, pp. 1-22. Available from https://doi.org/10.1007/s10368-017-0379-1.
Araji, S., and others (2017). Targeting debt in Lebanon: a structural macro-econometric model. Working Paper, No. 1132. Giza: Economic Research Forum.
Aschauer, D. (1989). Is public expenditure productive? Journal of Monetary Economics, vol. 23, No. 2, pp. 177–200.
Assouad, L. (2015). Top incomes and personal taxation in Lebanon, an exploration of individual tax records 2005-2012. Master’s thesis, Paris School of Economics.
__________ (2017). Rethinking the Lebanese economic miracle: the extreme concentration of income and wealth in Lebanon 2005-2014. World Wealth and Income Database Working Paper Series, No. 2017/13.
Baldacci, E., and others (2004). Social spending, human capital, and growth in developing countries: implications for achieving the MDGs. Working Paper, WP/04/217. Washington, D.C.: IMF.
Baldacci, E., M.T. Guin-Siu, and L. de Mello (2002). More on the effectiveness of public spending on health care and education: a covariance structure model. Working Paper, WP/02/90. Washington, D.C.: IMF.
Barro, R. (1989). A cross-country study of growth, saving and government. Working Paper, No. 2855. Cambridge, MA: National Bureau of Economic Research (NBER).
__________ (1990). Government spending in a simple model of endogenous growth. Journal of Political Economy, vol. 98, No. 5, pp. 103–125.
__________ (1991). Economic growth in a cross section of countries. The Quarterly Journal of Economics, vol. 106, No. 2 (May), pp. 407–443.
Bastagli, F., D. Coady, and S. Gupta (2012). Income inequality and fiscal policy. Staff Discussion Note, No. 2012/08. Washington, D.C.: IMF.
Bayoumi, T., and B. Eichengreen (1995). Restraining yourself: the implications of fiscal rules for economic stabilization. IMF Staff Papers, vol. 42, No. 1 (March).
Bayoumy, Y. (2016). Exclusive: civil war costs Yemen $14 billion in damage and economic losses, 16 August. Available from http://www.reuters.com/article/us-yemen-security-damages-idUSKCN10R2B7.
Beblawi, H., and G. Luciani, eds. (1987). The Rentier State. London and New York: Croom Helm and Methuen.
Behrman, J. R. (1993). The economic rationale for investing in nutrition in developing countries. World Development, vol. 21, No. 11 (November), pp. 1749-1771.
__________ (1996). The impact of health and nutrition on education. The World Bank Research Observer, vol. 11, No. 1 (February), pp. 23-37.
Bird, R., and J. Martinez-Bazquez (2008). Tax effort in developing countries and high income countries: the impact of corruption, voice and accountability. Economic Analysis and Policy, vol. 38, No. 1, pp. 55-71.
Blanchard, O., and R. Perotti, (2002). An empirical characterization of the dynamic effects of changes in government spending and taxes on output. The Quarterly Journal
Bibliography

126
of Economics, vol. 117, No. 4 (November), pp. 1329-1368.
Blanchard, O., and S. Fischer (1989). Lectures on Macroeconomics. Cambridge, MA: Massachusetts Institute of Technology (MIT) Press.
Bohn, H. (1998). The behavior of U.S. public debts and deficits. The Quarterly Journal of Economics, vol. 113, No. 3 (August), pp. 949-963.
__________ (2007). Are stationary and cointegration restrictions really necessary for the intertemporal budget constraint. Journal of Monetary Economics, vol. 54, pp. 1837-1847.
Bose, S., and N. R. Bhanumurthy (2015). Fiscal multipliers for India. The Journal of Applied Economic Research, vol. 9, No. 4, pp. 379-401.
Budlender, D., and G. Hewitt (2002). Gender Budgets Make More Cents: Country Studies and Good Practice. London: Commonwealth Secretariat.
Bulíř, A., and A. J. Hamann (2007). Volatility of development aid: an update. IMF staff Papers, vol. 54, No. 4, pp. 727-739.
Bustos, S., and M. A. Yildirim (2017a). Egypt’s manufacturing sector: seizing on an advantageous product space position. Policy Paper. Beirut: The Lebanese Center for Policy Studies (LCPS).
__________ (2017b). Kuwait’s manufacturing sector: targeting new industries. Policy Paper. Beirut: LCPS.
Cameron, G. (1998). Innovation and growth: a survey of the empirical evidence. Oxford: Nuffield College. Available from https://pdfs.semanticscholar.org/ba6b/d52fb55d3e6d6f4566c974895220526ac6f0.pdf.
Cammett, M., and others (2015). A Political Economy of the Middle East, 4th ed. Boulder, Colorado: Westview Press.
Cavalcanti, Tiago V. de V., K. Mohaddes, and M. Raissi (2011). Growth, development and natural resources: new evidence using a heterogeneous panel analysis. The Quarterly Review of Economics and Finance. vol. 51, No. 4, pp. 305–318.
Cavallo, E., and C. Daude (2011). Public investment in developing countries: a blessing or a curse? Journal of Comparative Economics, vol. 39, pp. 65-81.
Celasun, O., X. Debrun, and J. Ostry (2007). Primary surplus behavior and risks to fiscal sustainability in emerging market countries: a “fan-chart” approach. IMF Staff Papers, vol. 53, No. 3.
Chudik, A., and others (2017). Is there a debt-threshold effect on output growth? Review of Economics and Statistics, vol. 99, No. 1 (March), pp. 135-150.
Commission on Growth and Development (2008). The Growth Report: Strategies for Sustained Growth and Inclusive Development. Washington, D.C.: World Bank.
Cordes, T., and others (2015). Expenditure rules: effective tools for sound fiscal policy? Working Paper, WP/15/29. Washington, D.C.: IMF.
Dabla-Norris, E., and others (2013). Benchmarking structural transformation across the world. Working Paper, WP/13/176. Washington, D.C.: IMF.
Dagdeviran, H., R. Van der Hoeven, and J. Weeks (2001). Redistribution and growth for poverty reduction. School of Oriental and African Studies (SOAS) Working Paper Series, No. 118. London: University of London.
De la Croix, D., and C. Delavallade (2009). Growth, public investment and corruption with failing institutions. Economics of Governance, vol. 10, No. 3 (July).
Desai, M. (1991). Human development: concepts and measurement. European Economic Review, vol. 35, No. 2-3, pp. 350-357.
Devarajan, S., V. Swaroop, and H. Zou (1996). The composition of public expenditure and economic growth. Journal of Monetary Economics, vol. 37, No. 2, pp. 313-344.
Development Committee (2006). Fiscal policy for growth and development: an interim report. DC2006-0003.
Dibeh, G. (2007). The business cycle in post-war Lebanon. Journal of International Development, vol. 20, No. 2, pp. 145-160.
Diop, N., D. Marotta, and J. Melo, eds. (2016). Natural Resource Abundance, Growth and Diversification in the Middle East and North Africa: The Effects of Natural Resources and the Role of Policies. Washington, D.C.: World Bank.
Diwan, I., and T. Akin (2015). Fifty years of fiscal policy in the Arab region. Working Paper, No. 914. Giza: Economic Research Forum.
Dollar, D., and A. Kraay (2002). Growth is good for the poor. Journal of Economic Growth, vol. 7, No. 3, pp. 195-225.
Duarte, M., and D. Restuccia (2010). The role of the structural transformation in aggregate productivity. The Quarterly Journal of Economics, vol. 125, No. 1, pp. 129-173.
Dudine, J., and J. T. Jalles (2017). How buoyant is the tax system? New evidence from a large heterogeneous panel. Working Paper, WP/17/4. Washington, D.C.: IMF.
Easterly, W., and R. Levine (2003). Tropics, germs, and crops: how endowments influence economic development. Journal of Monetary Economics, vol. 50, No. 1 (January), pp. 3-39.
Easterly, W., and S. Rebelo (1993). Fiscal policy and economic growth: an empirical investigation. Journal of Monetary Economics, vol. 32, No. 3 (December), pp. 417–458.
Economist Intelligence Unit (2016). Country report: Yemen. London. Available from http://www.eiu.com/FileHandler.ashx?issue_id=794048063&mode=pdf.
Egypt, Economic Ministerial Committee
(2015). Egypt’s Five Year Macroeconomic Framework and Strategy: FY 14/15-FY 18/19. Egypt Economic Development Conference. Available from http://www.mof.gov.eg/MOFGallerySource/English/Strategy.pdf.
El-Anshasy, A., and M. S. Katsaiti (2013). Natural resources and fiscal performance: does good governance matter? Journal of Macroeconomics, vol. 37, pp. 285-298.
El-Anshasy, A., K. Mohaddes, and J. B. Nugent (2017). Oil volatility and institutions: cross-country evidence from major oil producers. Globalization and Monetary Policy Institute Working Paper, No. 310. Dallas: Federal Reserve Bank of Dallas.
El-Enbaby, H., and H. Selim (2015). Fiscal outcomes in Bahrain: resource volatility, fiscal institutions or politics? Available from http://erf.org.eg/wp-content/uploads/2016/03/ERF_22nd-AC_Institutional_Selim-Enbaby1.pdf.
Elbadawi, I., K. Schmidt-Hebbel, and R. Soto (2015). Why do countries have fiscal rules? Economia Chilena, vol. 18, No. 3 (December), pp. 28-61.
Elbadawi, I., and R. Soto (2011). Fiscal regimes in and outside the MENA region. Working Paper, No. 654. Giza: Economic Research Forum.
El-Katiri, L., and B. Fattouh (2017). A brief political economy of energy subsidies in the Middle East and North Africa. International Development Policy, vol. 7.
Elson, D. (2002). Macroeconomics and macroeconomic policy from a gender perspective. Paper presented at the Public Hearing of Study Commission ‘Globalisation of the World Economy-Challenges and Responses’. Bonn, February.
Erbil, N. (2011). Is fiscal policy procyclical in developing oil-producing countries? Working Paper, WP/11/171. Washington, D.C.: IMF.
Escolano, J. (2010). A practical guide to public debt dynamics, fiscal sustainability, and cyclical adjustments of budgetary aggregates. Technical Notes and Manuals, No. 2010/02. Washington, D.C.: IMF.
Escolano, J., A. Shabunina, and J. Woo (2011). The puzzle of persistently negative interest rate-growth differentials: financial repression or income catch-up? Working Paper, WP/11/260. Washington, D.C.: IMF.
Esim, S. (2011). Gender responsive budgeting for gender equality in the Arab region. Presentation made at the Workshop on Gender Responsive Budgeting in the UAE. Dubai, December.
Essama-Nssah, B., and P. J. Lambert (2009). Measuring pro-poorness: a unifying approach with new results. Review of Income and Wealth, vol. 55, No. 3, pp. 752–778.
Fatas, A., and I. Mihov (2001). The effects of fiscal policy on consumption and employment: theory and evidence. Available
127
from https://faculty.insead.edu/fatas/fiscal.pdf.Ferrarini, B., and A. Ramayandi (2012).
Public debt sustainability assessments for developing Asia. In Public Debt Sustainability in Developing Asia, B. Ferrarini, R. Jha and A. Ramayandi, eds. London and New York: Asian Development Bank (ADB) and Routledge.
Ferrarini, B, R. Jha and A. Ramayandi, eds. (2012). Public Debt Sustainability in Developing Asia. London and New York: ADB and Routledge.
Foster Mc-Gregor, N., and B. Verspagen (2016). The role of structural transformation in the potential of Asian economic growth. Economics Working Paper, No.479. Manila: ADB.
Frankel, J. (2011). A solution to fiscal procyclicality: the structural budget institutions pioneered by Chile. Working Paper, No. 16945. Cambridge, MA: NBER.
Frankel, J., C. Vegh, and G. Vuletin (2011). Fiscal policy in developing countries: escape from procyclicality, 23 June. Available from http://voxeu.org/article/how-developing-nations-escaped-procyclical-fiscal-policy.
Frontier Economics, and World Vision International (2016). The Cost of Conflict for Children: Five Years of the Syria Crisis. Available from http://www.frontier-economics.com/documents/2016/03/27064.pdf.
Gali, J., and R. Perotti (2003). Fiscal policy and monetary integration in Europe. Working Paper, No. 9773. Cambridge, MA: NBER.
Ghosh, A. R., and others (2013). Fiscal fatigue, fiscal space and debt sustainability in advanced economies. The Economic Journal, vol. 123 (February).
Gobat, J., and K. Kostial (2016). Syria’s conflict economy. Working Paper, WP/16/213. Washington, D.C.: IMF.
Grown, C. (2006). What gender equality advocates should know about taxation. AWID Spotlight No. 7 (March).
Gupta, S., L. de Mello, and R. Sharan (2001). Corruption and military spending. European Journal of Political Economy, vol. 17, pp. 749–777.
Gupta, S., and others (2003). Foreign aid and revenue response: does the composition of aid matter? Working Paper, WP/03/176. Washington, D.C.: IMF.
Gupta, S., and S. Ylaoutinen (2014). Budget institutions in low-income countries: lessons from G-20. Working Paper, WP/14/164. Washington, D.C.: IMF.
Hall, R., and C. Jones (1999). Why do some countries produce so much more output per worker than others? The Quarterly Journal of Economics, vol. 114, No. 1 (February), pp. 83-116.
Haug, A. (1991). Cointegration and government borrowing constraints: evidence for the United
States. Journal of Business and Economic Statistics, vol. 9, No. 1, pp. 97-101.
Hausman, R., and D. Rodrik (2003). Economic development as self-discovery. Journal of Development Economics, vol. 72, pp. 603-633.
Hausmann, R., D. Rodrik, and A. Velasco (2005). Growth diagnostics. Available from http://citeseerx.ist.psu.edu/viewdoc/download?doi=10.1.1.446.2212&rep=rep1&type=pdf.
Hegarthy, T. (2017). Changes in public expenditure on social protection in Arab countries. E/ESCWA/SDD/2017/Technical Paper.14. Beirut: ESCWA.
Herrendorf, B., R. Rogerson, and A. Valentinyi (2013). Growth and structural transformation. Working Paper, No. 18996. Cambridge, MA: NBER.
Hicks, J. R. (1939). The foundations of welfare economics. The Economic Journal, vol. 49, No. 196 (December), pp. 696-712.
Huidrom, R., M. A. Kose, and F. L. Ohnsorge (2016). Challenges of fiscal policy in emerging and developing economies. Policy Research Working Paper, No. 7725. Washington, D.C.: World Bank.
Ianchovichina, E., and M. Ivanic (2016). Economic effects of the Syrian war and the spread of the Islamic State on the Levant. The World Economy, vol. 39, No. 10 (October), pp. 1584-1627.
Ilzetzki, E., E. G. Mendoza, and C. A. Vegh (2013). How big (small?) are fiscal multipliers? Journal of Monetary Economic, vol. 60, pp. 239-254.
Imam, P. A., and D. F. Jacobs (2007). Effect of corruption on tax revenues in the Middle East. Working Paper, WP/07/270. Washington, D.C.: IMF.
International Labour Organization (2016). Key Indicators of the Labour Market Database. Available from http://www.ilo.org/ilostat/faces/ilostat-home/home?_adf.ctrl-state=zg56ufpih_4&_afrLoop=1112557162823413#! Accessed July 2017.
International Labour Organization, and United Nations Development Programme (2013). Rethinking Economic Growth: Towards Productive and Inclusive Arab Societies. Beirut: International Labour Organization (ILO).
International Monetary Fund (2001). Government Finance Statistics Manual 2001. Washington, D.C. Available from https://www.imf.org/external/pubs/ft/gfs/manual/pdf/all.pdf.
__________ (2013). Libya: selected issues. IMF Country Report No. 13/151. Washington, D.C.
__________ (2014a). Algeria: selected issues. IMF Country Report No. 14/342. Washington, D.C.
__________ (2014b). Angola: 2014 Article IV Consultation. IMF Country Report No. 14/274. Washington, D.C.
__________ (2014c). Budget institutions in G-20 countries: an update. IMF Policy Paper, April.
Washington, D.C. Available from http://www.imf.org/external/np/pp/eng/2014/040714c.pdf.
__________ (2015). Fiscal policy and long-term growth. IMF Policy Paper, June. Washington, D.C. Available from https://www.imf.org/external/np/pp/eng/2015/042015.pdf.
__________ (2016a). Saudi Arabia: 2016 Article IV Consultation. IMF Country Report No. 16/326. Washington, D.C.
__________ (2016b). Sudan: 2016 Article IV Consultation. IMF Country Report No. 16/324. Washington, D.C.
__________ (2016c). Tunisia: fiscal transparency evaluation. IMF Country Report No. 16/339. Washington, D.C.
__________ (2016d). World Economic and Financial Surveys. Regional Economic Outlook: Middle East and Central Asia. Washington, D.C.
__________ (2016e). World Revenue Longitudinal Data. Available from http://data.imf.org/revenues. Accessed July 2017.
__________ (2017a). Egypt: request for extended arrangement under the extended Fund Facility. IMF Country Report No. 17/17. Washington, D.C.
__________ (2017b). Fostering inclusive growth. Background note presented by IMF staff at the G-20 Leaders’ Summit. Hamburg, July.
__________ (2017c). Lebanon: 2016 Article IV Consultation. IMF Country Report No. 17/19. Washington, D.C.
__________ (2017d). Morocco: 2016 Article IV Consultation. IMF Country Report No. 17/36. Washington, D.C.
__________ (2017e). Tunisia: first review under the Extended Fund Facility, request for waivers of nonobservance of performance criteria and rephasing of access. IMF Country Report No. 17/203. Washington, D.C.
__________ (2017f). World Economic Outlook Database. Available from http://www.imf.org/external/pubs/ft/weo/2017/01/weodata/index.aspx. Accessed July 2017.
__________ (2017g). World Economic Outlook - Seeking Sustainable Growth: Short-term Recovery, Long-term Challenges. Washington, D.C.
Islam, I., and others (2012). Macroeconomic policy advice and the Article IV consultations: a development perspective. Research Paper, No 2. Geneva: ILO.
Islam, N. (1995). Growth empirics: a panel data approach. The Quarterly Journal of Economics, vol. 110, No. 4 (November), pp. 1127-1170.
Jha, R. (2012). Analytical approaches to assessing public debt sustainability. In Public Debt Sustainability in Developing Asia, B. Ferrarini, R. Jha and A. Ramayandi, eds. London and New York: ADB and Routledge.
Kakwani, N., S. Khandker, and H. Son (2004). Pro-poor growth: concepts and measurements with country case studies. International Poverty Center Working Paper, No. 1. Brasilia: United

128
Nations Development Programme (UNDP).Kaldor, N. (1939). Welfare propositions of
economics and interpersonal comparisons of utility. The Economic Journal, vol. 49, No. 195 (September), pp. 549-552.
Kamaly, A., and A. El-Said (2017). The effect of governance on the allocation of expenditure and the distribution of revenue: evidence from selected Arab countries. E/ESCWA/EDID/2017/Technical Paper.11. Beirut: ESCWA.
Khalid, A. M, and T. W. Guan (1999). Causality tests of budget and current account deficits: cross-country comparisons. Empirical Economics, vol. 24, pp. 389-402.
Kolovich, L., and S. Shibuya (2016). Middle East and Central Asia: a survey of gender budgeting efforts. Working Paper, WP/16/151. Washington, D.C.: IMF.
Kolstad, I., and T. Søreide (2009). Corruption in natural resource management: implications for policy makers. Resources Policy, vol. 34 (December), pp. 214-226.
Kontopoulos, Y., and R. Perotti (1999). Government fragmentation and fiscal policy outcomes: evidence from OECD countries. In Fiscal Institutions and Fiscal Performance, J. M. Poterba and J. von Hagen, eds. Chicago: The University of Chicago Press.
Lane, P. (2003). The cyclical behavior of fiscal policy: evidence from the OECD. Journal of Public Economics, vol. 87, pp. 2661–2675.
League of Arab States (2017). Arab Strategy for Housing and Sustainable Urban Development 2030. Available from https://unhabitat.org/wp-content/uploads/2017/05/Arab-Strategy-English.pdf.
Levine, R., and D. Renelt (1992). A sensitivity analysis of cross-country growth regressions. The American Economic Review, vol. 82, No. 4 (September), pp. 942–963.
Ley, E. (2009). Fiscal policy for growth. Poverty Reduction and Economic Management Network (PREM) Notes, No. 131 (April). Washington, D.C.: World Bank.
Lin, J. Y. (2012). New Structural Economics: A Framework of Rethinking Development and Policy. Washington D.C.: World Bank.
Lin, J. Y., and C. Monga (2010). Growth identification and facilitation: the role of the State in the dynamics of structural change. Policy Research Working Paper, No. 5313. Washington, D.C.: World Bank.
Lledó, V., and others (2017). Fiscal rules at a glance. Background Note. Washington, D.C.: IMF. Available from http://www.imf.org/external/datamapper/fiscalrules/Fiscal%20Rules%20at%20a%20Glance%20-%20Background%20Paper.pdf.
Loungani, P. (2017). The power of two: inclusive growth and the IMF. Intereconomics, vol. 52, No. 2 (March), pp.92-99.
Lustig, N., and S. Higgins (2013). Fiscal
incidence, fiscal mobility, and the poor: a new approach. ECINEQ Working Paper, No. 2012-265. Verona: Society for the Study of Economic Inequality.
Malik, A. (2016). The political economy of macroeconomic policy in Arab resource-rich economies. Working Paper, No. 1034. Giza: Economic Research Forum.
Matallah, S., and A. Matallah (2016). Oil rents and economic growth in oil-abundant MENA countries: governance is the Trump card to escape the resource trap. Available from https://www.dohainstitute.edu.qa/MEEA2016/Downloads/Siham%20Matallah_Final.pdf.
Mauro, P. (1998). Corruption and the composition of government expenditure. Journal of Public Economics, vol. 69, pp. 263–279.
McMillan, M. S., and D. Rodrik (2011). Globalization, structural change and productivity growth. Working Paper, WP/17143. Cambridge, MA: NBER.
Mittnik, S., and T. Neumann (2003). Time-series evidence on the nonlinearity hypothesis for public spending. Economic Inquiry, vol. 41, No. 4 (October), pp. 565-573.
Mohnen, P., and B. H. Hall (2013). Innovation and productivity: an update. Eurasian Business Review, vol. 3, No. 1, pp. 47-65.
Morocco, Ministry of Economy and Finance (2016). Projet de loi de finances pour l’année budgétaire 2016 : rapport économique et financier. Available from https://www.finances.gov.ma/Docs/DB/2016/ref_fr.pdf.
Morsy, H., A. Levy, and C. Sanchez (2015). Growing without changing: a tale of Egypt’s weak productivity growth. Working Paper, No. 940. Giza: Economic Research Forum.
Moyo, D. (2017). Global debt woes are building to a tidal wave. Financial Times, 29 May. Available from https://www.ft.com/content/3215e960-3faa-11e7-9d56-25f963e998b2.
Mundell, R. A. (1963). Capital mobility and stabilization policy under fixed and flexible exchange rates. The Canadian Journal of Economics and Political Science, vol. 29, No. 4 (November), pp. 475-485.
Nabli, M., J. Keller, and M. Veganzones (n.d.). Exchange rate management within the Middle East and North Africa region: the cost to manufacturing competitiveness. Mimeo.
Neaime, S. (2015). Twin deficits and the sustainability of public debt and exchange rate policies in Lebanon. Research in International Business and Finance, vol. 33, pp. 127–143.
Neumayer, E. (2004). Does the ‘resource curse’ hold for growth in genuine income as well? World Development, vol. 32, No. 10, pp. 1627–1640.
Nussbaum, M., and A. Sen, eds. (1993). The Quality of Life. Oxford: Oxford Clarendon Press.
Obstfeld, M. (1996). Models of currency crises with self-fulfilling features. European Economic
Review, vol. 40, pp. 1037-1047.Open Access Micro Data Initiative (2014).
Harmonized Household Income and Expenditure Surveys, Version 2.0 of Licensed Data Files. Amman and Giza: Jordanian Department of Statistics and Economic Research Forum. Accessed January 2015.
Organisation for Economic Co-operation and Development (2016). Social spending stays at historically high levels in many OECD Countries. Social Expenditure Update, October 2016. Available from http://www.oecd.org/els/soc/OECD2016-Social-Expenditure-Update.pdf.
__________ (2017). Financial and human resources invested in education. In Education at a Glance 2017: OECD indicators. Paris: OECD Publishing. Available from http://dx.doi.org/10.1787/eag-2017-en.
Organization of the Petroleum Exporting Countries (2017). OPEC Basket Price Database. Available from http://www.opec.org/opec_web/en/data_graphs/40.htm. Accessed July 2017.
Pack, H., and K. Saggi (2006). Is there a case for industrial policy? A critical survey. Oxford: Oxford University Press for the World Bank. Doi:10.1093/wbro/lkl001.
Panić, M. (2009). Post-conflict countries: aid effectiveness and permanent peace. Available from http://www.un.org/en/development/desa/policy/wess/wess_bg_papers/bp_wess2008_panic.pdf.
Person, T., and G. Tabellini (2004). Constitutions and economic policy. Journal of Economic Perspectives, vol. 18, No. 1, pp. 75-98.
Pesce, O. (2017). Economic competitiveness in the Arab region. Working Paper, E/ESCWA/EDID/2017/WP.2. Beirut: ESCWA. Available from https://www.unescwa.org/sites/www.unescwa.org/files/page_attachments/economic_competitiveness_in_the_arab_region_1.pdf.
Pritchett, L. (1996). Mind your P’s and Q’s: the cost of public investment is not the value of public capital. Policy Research Working Paper, No. 1660. Washington, D.C.: World Bank.
PwC (2015). Doing Business in the UAE: A Tax and Legal Guide. Dubai. Available from https://www.pwc.com/m1/en/tax/documents/doing-business-guides/doing-business-guide-uae.pdf.
Rajkumar, A. S., and V. Swaroop (2008). Public spending and outcomes: does governance matter? Journal of Development Economics, vol. 86, pp. 96–111.
Ranis, G., and F. Stewart (2005). Dynamic links between the economy and human development. United Nations Department of Economic and Social Affairs Working Paper, No. 8, ST/ESA/2005/DWP/8. New York: United Nations.
Reinhart, C. M. (2002). Default, currency crises, and sovereign credit ratings. The World Bank Economic Review, vol. 16, No. 2 (August), pp. 151–170.
129
Reinhart, C. M., and K. S. Rogoff (2010). Growth in a time of debt. American Economic Review: Papers & Proceedings 100, pp. 573–578.
Rodrik, D. (2004). Industrial policy for the twenty-first century. Paper prepared for the United Nations Industrial Development Organization. Available from https://www.sss.ias.edu/files/pdfs/Rodrik/Research/industrial-policy-twenty-first-century.pdf.
Rodrik, D., A. Subramanian, and F. Trebbi (2004). Institutions rule: the primacy of institutions over geography and integration in economic development. Journal of Economic Growth, vol. 9, No. 2, pp. 131–165.
Romer, P. M. (1990). Endogenous technological change. Journal of Political Economy, vol. 98, No. 5, pp. 71-102.
Roy, R. (2014). Room at the top: an overview of fiscal space, fiscal policy and inclusive growth in developing Asia. Working Paper, No. 2014-135. New Delhi: National Institute of Public Finance and Policy.
Roy, R., and J. Weeks (2004). Making fiscal policy work for the poor. How to implement pro-poor fiscal policies in developing countries. Synthesis Paper. New York: UNDP. Available from https://www.g24.org/wp-content/uploads/2016/01/Making-Fiscal-Policy-Work-for-the.pdf.
Sala-i-Martin, X., and E. V. Artadi (2003). Economic growth and investment in the Arab world. Economics Working Papers, No. 683. Barcelona: Department of Economics and Business, Universitat Pompeu Fabra. Available from https://ideas.repec.org/p/upf/upfgen/683.html.
Sarangi, N. (2015). Economic growth, employment and poverty in developing economies: a focus on Arab region. Working Paper, E/ESCWA/OES/2015/WP.4. Beirut: ESCWA.
__________ (2016). Domestic public resources in the Arab region: where do we stand? Working Paper, E/ESCWA/EDID/2017/WP.1. Beirut: ESCWA.
Sarangi, N., and J. von Bonin (2017). Fiscal policy on public social spending and human development in Arab countries. Working Paper, E/ESCWA/EDID/2017.WP.13. Beirut: ESCWA.
Sarangi, N., and L. El-Ahmadieh (2017). Fiscal policy response to debt in the Arab region. Working Paper, E/ESCWA/EDID/2017/WP.6. Beirut: ESCWA.
Sarangi, N., K. Abu-Ismail, and V. Gantner (2017). Fiscal policy and structural transformation in the Arab region: what are the pathways. Working Paper, E/ESCWA/EDID/2017/WP.7. Beirut: ESCWA.
Sarangi, N., N. R. Bhanumurthy, and K. Abu-Ismail (2015). Effectiveness of fiscal policy in Jordan: impact on growth, poverty and inequality. Working Paper, E/ESCWA/
EDID/2015/WP.8. Beirut: ESCWA.Saudi Arabian Monetary Agency (2016).
Fifty-second annual report 1437H. Riyadh. Available from http://www.sama.gov.sa/en-US/EconomicReports/AnnualReport/Fifty%20Second%20Annual%20Report.pdf.
Schiffbauer, M., and others (2015). Jobs or Privileges: Unleashing the Employment Potential of the Middle East and North Africa. MENA Development Report. Washington, D.C.: World Bank.
Schmidt-Hebbel, K. (2014). Chile’s fiscal policy rule. Presentation made at the Sixth Annual Meeting of OECD Parliamentary Budget Officials and Independent Fiscal Institutions. Jerusalem, 31 March-1 April.
Sdralevich, C., and others (2014). Subsidy Reform in the Middle East and North Africa: Recent Progress and Challenges Ahead. Washington D.C.: IMF.
Selim, H., and C. Zaki (2014). The institutional curse of natural resources in the Arab world. Working Paper, No. 890. Giza: Economic Research Forum.
Slimane, S. B., and M. B. Tahar (2010). Why is fiscal policy procyclical in MENA countries? International Journal of Economics and Finance, vol. 2, No. 15 (November).
Son, H., and N. Kakwani (2008). Global estimates of pro-poor growth. World Development, vol. 36, No. 6, pp. 1048-1066.
Stotsky, J. (2016). Gender budgeting: fiscal context and current outcomes. Working Paper, WP/16/149. Washington, D.C.: IMF.
Syrian Center for Policy Research (2015). Syria: Alienation and Violence - Impact of Syria Crisis Report 2014. Damascus. Available from http://www.unrwa.org/sites/default/files/alienation_and_violence_impact_of_the_syria_crisis_in_2014_eng.pdf.
Torgler, B. (2005). Tax morale and direct democracy. European Journal of Political Economy, vol. 21, pp. 525-531.
Tornell, A., and P. Lane (1999). Voracity and growth. American Economic Review, vol. 89, pp. 22–46.
United Kingdom, HM Government (2017). Industrial strategy: building a Britain fit for the future. Industrial Strategy White Paper. Available from https://www.gov.uk/government/uploads/system/uploads/attachment_data/file/664563/industrial-strategy-white-paper-web-ready-version.pdf.
United Nations (2015). Global Sustainable Development Report: 2015 Edition. New York.
United Nations, and League of Arab States (2013). The Arab Millennium Development Goals Report: Facing Challenges and Looking Beyond 2015. E/ESCWA/EDGD/2013/1. Beirut.
United Nations Development Programme (2010). Taxation. Gender Equality and Poverty Reduction Issues Brief, No. 01. New York.
__________ (2012). Arab Development Challenges Report 2011: Towards the Developmental State in the Arab Region. Cairo: UNDP Regional Centre for Arab States.
__________ (2016). Arab Human Development Report 2016: Youth and the Prospects for Human Development in a Changing Reality. New York.
United Nations, Economic and Social Commission for Western Asia (2012). Economic Policy in the ESCWA Region and Its Impact on Employment. E/ESCWA/SDD/2012/2. New York.
__________ (2013). Survey of Economic and Social Development in the Arab region 2012-2013. E/ESCWA/EDGD/2013/3. Beirut.
__________ (2014a). Arab Middle Class: Measurement and Role in Driving Change. E/ESCWA/EDGD/2014/2. Beirut.
__________ (2014b). Integrated Social Policy Report V: Towards a New Welfare Mix? Rethinking the Role of the State, the Market and Civil Society in the Provision of Social Protection and Social Services. E/ESCWA/SDD/2013/1. Beirut.
__________ (2014c). Tax policy in Arab countries. E/ESCWA/SDD/2014/Technical Paper.3. Beirut.
__________ (2015a). Arab Sustainable Development Report: First Edition, 2015. E/ESCWA/SDPD/2015/3. Beirut.
__________ (2015b). Fiscal challenges facing Arab countries in the establishment of an Arab customs union. E/ESCWA/EDGD/2015/IG.2/6. Beirut.
__________ (2016a). Arab Development Outlook: Vision 2030. E/ESCWA/EDID/2015/3. Beirut.
__________ (2016b). Survey of Economic and Social Developments in the Arab Region 2015-2016. E/ESCWA/EDID/2016/1. Beirut.
__________ (2017a). Arab financing for development scorecard: overall results. E/ESCWA/EDID/2017/IG.2/5(Part I).
__________ (2017b). External Trade Bulletin of the Arab Region: Twenty-Fifth Issue. E/ESCWA/SD/2017/2. Beirut.
__________ (2017c). National Accounts Studies of the Arab Region: Bulletin No. 35. E/ESCWA/SD/2017/4. Beirut.
__________ (2017d). Survey of Economic and Social Developments in the Arab Region 2016-2017. E/ESCWA/EDID/2017/1. Beirut.
United Nations, Economic and Social Commission for Western Asia, and Arab Industrial Development and Mining Organization (2017). Bulletin of Industrial Statistics for Arab Countries: Ninth Issue. E/ESCWA/SD/2017/1. Beirut: ESCWA.
United Nations, Economic and Social Commission for Western Asia, and others (2017). Arab Multidimensional Poverty Report. E/ESCWA/EDID/2017/2. Beirut: ESCWA.

130
United Nations, Economic and Social Commission for Western Asia, and University of St. Andrews (2016). Syria at War: Five Years On. E/ESCWA/EDID/2016/2. Beirut: ESCWA.
United Nations, Statistics Division (2016). National Accounts Main Aggregates Database. Available from https://unstats.un.org/unsd/snaama/Introduction.asp. Accessed July 2017.
__________ (2017). National Accounts Main Aggregates Database. Available from https://unstats.un.org/unsd/snaama/selbasicfast.asp. Accessed January 2018.
United Nations Population Fund, and United Nations Development Fund for Women (2006). Gender Responsive Budgeting and Women’s Reproductive Rights: A Resource Pack. Available from https://www.unfpa.org/sites/default/files/pub-pdf/gender_responsive_eng.pdf.
Van der Weide, R., C. Lakner, and E. Ianchovichina (2016). Underestimating inequality in Egypt: evidence from house prices. VOX, 11 August. Available from http://voxeu.org/article/egypt-not-equal-surveys-say.
Von Arnim, R., and others (2011). The ADCR 2011: structural retardation of Arab economies: symptoms and sources. Arab Development Challenges Report Background Paper, No. 3. Cairo: UNDP.
Woo, E., and others (2013). Distributional consequences of fiscal consolidation and the role of fiscal policy: what do the data say? Working Paper, WP/13/195. Washington, D.C.: IMF.
World Bank (2004). Unlocking the Employment Potential in the Middle East and North Africa: Toward a New Social Contract. MENA Development Report. Washington, D.C.
__________ (2015). The State of Social Safety Nets 2015. Washington, D.C.
__________ (2016). Worldwide Governance Indicators. Available from https://data.worldbank.org/data-catalog/worldwide-governance-indicators. Accessed July 2017.
__________ (2017a). World Bank International Debt Statistics. Available from https://data.worldbank.org/data-catalog/international-debt-statistics. Accessed July 2017.
__________ (2017b). World Development Indicators Database. Available from http://databank.worldbank.org/data/reports.aspx?source=world-development-indicators. Accessed July 2017.
Wyplosz, C. (2007). Debt sustainability assessment: the IMF approach and alternatives. HEI Working Paper, No. 03/2007. Geneva: Graduate Institute of International Studies.
Zafar, A. (2016). Fiscal policy and diversification in MENA. In Natural Resource Abundance, Growth and Diversification in the Middle East and North Africa: The Effects of Natural Resources and the Role of Policies, N. Diop, D. Marotta and J. Melo, eds. Washington, D.C.: World Bank.
Zein, S. (2017). Subsidy reform and environmental sustainability in the Arab region. Working Paper, E/ESCWA/SDPD/2017/Technical Paper.8. Beirut: ESCWA.

17-0
0711
Amid low oil prices and rising debts, the Arab region faces a challenging economic outlook. At the same time, development priorities related to decent work, poverty and social justice are more pressing than at any other time in the region’s recent history. Fiscal policy offers many of the tools to resolve these complex challenges. This report proposes several primary considerations. Fiscal policy reforms are essential and immediate considerations to move forward, including to achieve the Sustainable Development Goals. Real progress, on the scale that the 2030 Agenda for Sustainable Development demands, depends on economic structural transformation and broader economic governance reforms geared towards financing inclusive and sustainable development.